1
Government Guaranteed Small Business Loans and
Regional Growth
Yong Suk Lee a, * a Freeman Spogli Institute for International Studies, Stanford University, Stanford 94305, USA
November 5, 2017
Abstract
This paper examines the impact of government guaranteed small business loans on regional
growth. I construct a metro-level panel of the Small Business Administration’s guaranteed loans
and examine economic growth between 1993 and 2002, across 316 metro areas in the US. A
simple OLS regression finds a significant positive relationship between small business loans and
regional growth. However, first-difference and instrumental variable regressions that mitigate
endogeneity find no significant employment or income growth effects from small business loans.
At least from an efficiency perspective, there seems to be no net gains to the regional economy
from guaranteed small business loans.
Keywords: Small Business Loans, Guaranteed Loans, Entrepreneurship, Regional Growth
JEL Codes: L26, G18, K35, O18, R11
* Corresponding author at Freeman Spogli Institute for International Studies, Stanford University, 616 Serra Street, Email address: [email protected]
2
Executive Summary
Despite the prevalence of financial policies that support small businesses, there is surprisingly
little research that examines how such policies affect regional economic growth. One of the most
widely used policy in this regard is the guaranteed loan program, whereby the government
guarantees a portion of the loans that financial institutions lend to small businesses. Given the
considerable interest policy makers have in supporting small businesses and creating jobs, the
lack of academic research on this topic is unfortunate. Scholars have examined the regional
growth consequences of entrepreneurship and how finance policies affect new venture creation.
However, we know little of how financial policies that promote new venture creation affect
regional growth. This paper's main objective is to empirically examine whether government
guaranteed small business loans indeed promote regional employment and income growth in the
United States.
A main challenge in empirically assessing the impact of small business loans on regional
economic growth is the fact that entrepreneurs tend to start businesses when the region’s
economy is doing well. In other words, a positive relationship between the number of small
business loans and regional growth may be driven by the good economic prospects of that region,
and it may not necessarily imply that the small business loans are causing regional growth. This
study addresses this empirical challenge by incorporating different econometric strategies – OLS
regressions, first-difference regressions, and instrumental variable regressions.
I match the Small Business Administration (SBA) loans data to each Metropolitan Statistical
Area (MSA) by year to create a metro-year level panel. I merge in various regional economic
data to this panel, and examine how SBA guaranteed loans affect regional employment and
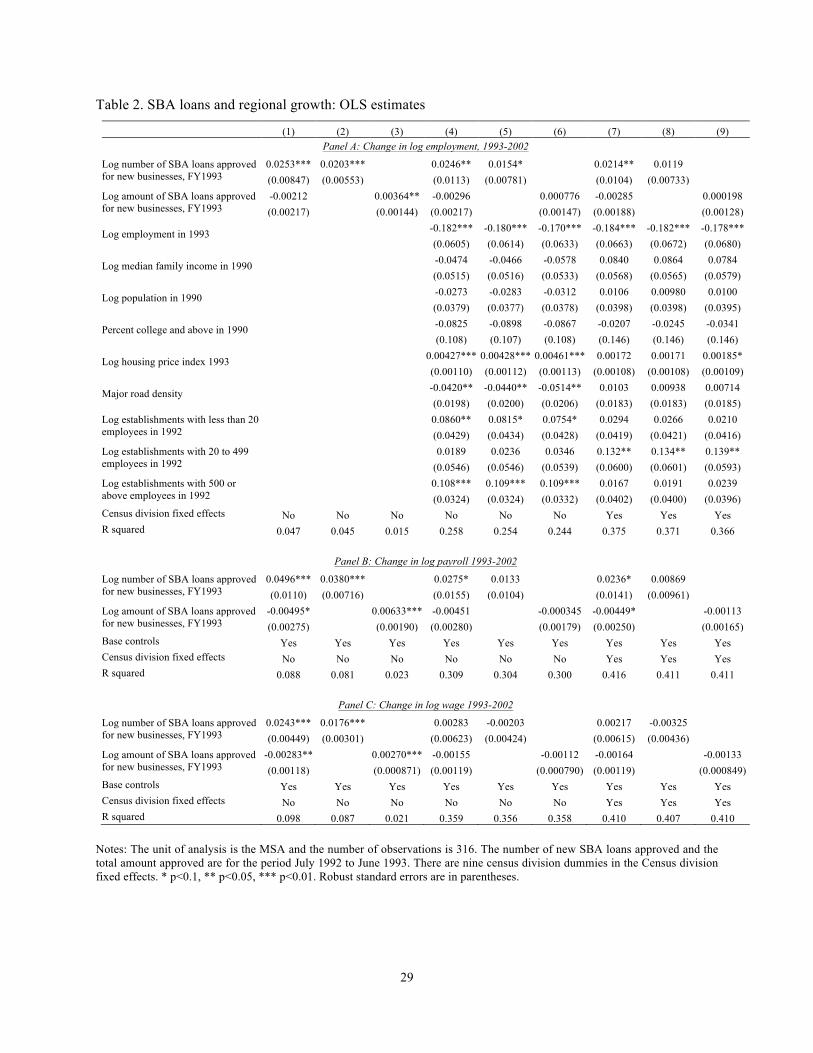
income growth between 1993 and 2002 across 316 metro areas. A simple regression indicates
that the number of SBA loans to new businesses significantly and positively affects employment
and income growth. I then examine OLS regressions that control for initial regional
characteristics and Census Division fixed effects, first-difference growth regressions that control
for metro level fixed characteristics, and instrumental variable regressions using a variety of
instrumental variables. Despite using multiple econometric specifications, the results are
surprisingly robust. In all specifications, I consistently find that the impact of SBA guaranteed
3
loans on regional employment and income growth is statistically indistinguishable from zero,
and if any tends towards a negative effect.
This paper offers several contributions to the literature. First of all, this is one of the few papers
that examine the impact of guaranteed small business loans on regional growth. Moreover, to
the best of my understanding, I believe this is the first paper that aims to estimate the causal
effects. The findings from this paper indicate that there may be no net efficiency gains from
government guaranteed small business loans, but these results do not speak to the general value
of SBA loans. The main objective of SBA loans is to support small businesses that have
difficulty getting loans through conventional means because of the lack of collateral, inequality
in the lending market, and asymmetric information. Researchers have found that other finance
methods or policies, such as venture capital or government programs that support technology
startups do promote regional growth. The literature that examines the economic growth effects of
entrepreneurship finance policy is relatively nascent. Future research on this topic, together with
findings from this paper and extant research, would help better inform the policy implications of
entrepreneurship finance policies.
4
1. Introduction
Guaranteed loan programs are widely used to support small businesses around the world
(Parker 2009, Beck et al. 2008, 2010a, Lelarge et al. 2010, Mullins and Toro 2017). In these
programs, governments encourage banks to lend to small businesses by guaranteeing a portion of
the principal in case the debtor defaults. Though the principal aim of guaranteed loan programs is
to support small business creation and growth, they could have an effect on regional growth. The
literature has documented the positive relationship between entrepreneurship and regional
growth (Fritsch 1997, Audretsch and Fritsch 2002, Fritsch and Mueller 2008, Glaeser et al. 2010,
2015, Lee 2017), and between guaranteed loans and entrepreneurship (Riding and Haines 2001,
Riding et al. 2007). However, there is surprisingly little research that examines whether a finance
policy that supports small businesses indeed promote regional growth. Entrepreneurship is
widely considered as an important source of job creation. Many governments have utilized
finance policies, such as the guaranteed loan programs, to help create new ventures in hopes of
adding jobs to the regional economy. However, a substantial number of new ventures actually do
not survive, and ex-ante it is not clear whether a finance policy that promotes start-ups would
create jobs on net. Given the considerable interest policy makers have in supporting small
businesses and creating jobs, it would be valuable to know whether a finance policy that supports
small businesses indeed promote regional growth. To this end, this paper examines whether
guaranteed loans approved by the Small Business Administration (SBA) promote regional
employment and income growth in the United States.
Guaranteed small business loans could impact regional growth through their effect on the
quality and quantity of new ventures. The loans could support the creation of high quality new
ventures that could not get funding from conventional banks. However, there could be negative
selection as well. Loan guarantees could encourage banks to finance more low quality ventures
in expectation of being bailed out by the government, and could attract entrepreneurs with lower
entrepreneurial ability. In terms of quantity, guaranteed loans could add new ventures to the
regional economy, or could replace or crowd out ventures that would have gotten loans through
conventional means. Conceptually, guaranteed loans can have both a positive and negative effect
on the quality and quantity of new ventures. Hence, the impact of guaranteed small business
loans on regional growth would ultimately depend on the net quality and quantity of new
ventures, and how those new ventures relate to factors relevant for regional growth, e.g.,
5
knowledge spillover, agglomeration effects, competition between new ventures and incumbents,
and pre-existing regional characteristics.
The transmission of knowledge has become an increasingly important source of
economic growth. Scholars have found that new ventures are better at exploiting knowledge and
entrepreneurs serve as the link that facilitates the spillover of knowledge within the regional
economy (Audretsch and Taylor Aldridge 2009, Acs et al. 2009, 2013a). New ventures
contribute to the agglomeration benefits of input sharing and improved matching between firms
and workers (Jacobs 1969, Carlino et al. 2007). Also, new firms compete with incumbents in the
region, and such competition could affect aggregate economic growth (Fritsch 2013). Finally, the
regional environment can influence how new ventures affect regional growth. The skill level of
the region’s workforce affects how firms utilize new knowledge and technology, and how
incumbents adapt to new entry and competition. The pre-existing industrial structure also affects
new venture creation and regional growth (Sternberg 2009). The net result from all these
different channels would determine how the new ventures created through SBA loans affect
regional growth. In this regard, identifying the net impact of SBA loans on regional growth
ultimately becomes an empirical exercise.
However, there is surprisingly little empirical research that causally examines this
question, and justifiably so - endogeneity hinders causal interpretation. This paper’s main
objective is to examine the aggregate impact of small business loans on regional employment
and income growth, while alleviating the endogeneity concerns that typically arise in such
analysis. Specifically, I match the SBA loans data to each Metropolitan Statistical Area (MSA)
by year and create an MSA-year level panel of new SBA loans. I then examine how the SBA
guaranteed loans affect regional employment and income growth between 1993 and 2002. A
standard OLS regression indicates that the number of new SBA loans significantly and positively
affects employment and income growth. However, if cities with higher growth potential have
more SBA loan applications and approvals, then the OLS estimates would overstate the true
impact of SBA loans on urban growth. To the contrary, if cities that were declining see higher
SBA loan applications and approvals, then the OLS estimates would be biased downwards.
Including variables that control for initial regional characteristics and Census Division fixed
effects substantially reduces the positive effect and the statistical significance of the coefficient
estimates. To further alleviate endogeneity, I examine the first-difference and instrumental
6
variable regressions and compare the results to the OLS estimates. The results indicate that the
impact of SBA guaranteed loans on regional employment, payroll, and wage growth are
statistically indistinguishable from zero, and if any tend towards a negative effect. Though fully
resolving endogeneity is difficult, comparing results from the different estimation methods shed
light on what the true impact might be, and this paper consistently find no evidence indicating
that government guaranteed small business loans have an effect on regional growth.
Prior research that examine the relationship between entrepreneurship and regional
growth generally find positive associations that vary depending on time, region, and firm size
(Audretsch and Fritsch 2002, Fritsch and Mueller 2008, Acs and Mueller 2008). Glaeser et al.
(2015) and Lee (2017) use quasi-experimental designs and find that entrepreneurship indeed has
a positive causal impact on regional employment and income growth. However, these papers
examine entrepreneurship in general, without focusing on the different types of financing
methods or finance policies that contribute to the creation of new ventures. Craig et al. (2007)
examine the impact of SBA loans on county growth in the United States and find statistically
significant effects that are positive but economically small in magnitude. However, they focus on
the short-term impact, i.e., the one-year after effect, of SBA loans on per capita income. I
examine regional growth over a longer time horizon and further tackle endogeneity by using
instrumental variable regressions. My paper contributes to the literature by conceptualizing how
a finance policy that aims to promote entrepreneurship and small businesses could influence
regional growth, and by empirically examining the causal impact of government guaranteed
small business loans on regional growth.
2. Small Business Loans and Regional Growth – a Theoretical Examination
2.1. New venture creation and regional growth
A relatively rich literature has examined new venture creation and net regional employment.
Fritsch (1997) initially finds a weak association between new firm formation and regional
employment growth in West Germany over a short period of time. However, Audretsch and
Fritsch (2002) and Fritsch and Mueller (2008) find that the regional growth effects from
entrepreneurship are not constant and vary over time and across regions. These results suggest
that pre-existing regional factors - e.g., incumbent firms, industrial structure, etc. - are important
to entrepreneurship's contribution to regional growth. Moreover, Acs and Mueller (2008) find
7
that the employment effects from new ventures differ by firm size. They find that start-ups with
greater than 20 and less than 500 employees are related to persistent employment growth.
Despite these findings, identifying the causal effect of entrepreneurship on regional growth
remains a challenging task. Forces that promote regional growth also promote local
entrepreneurship, and thus parsing out the causal relationship is difficult. If new venture creation
has no relevance for regional growth, small business loan policies that promote local
entrepreneurship would likely have little relevance for regional growth as well. Hence, knowing
whether or not entrepreneurship causally increases regional growth is fundamental to the
question of whether small business loan policies promote regional growth. Though still in its
nascent stage, recent research has made some progress using quasi-experimental designs, and we
now have some convincing evidence that show that entrepreneurship and the density of small
businesses indeed have a causal impact on regional growth (Glaeser et al. 2015, Lee 2017).
These quasi-experimental analyses confirm the positive impact of entrepreneurship on regional
growth, but speak little to the channels by which entrepreneurship generates regional growth.
The transmission of knowledge has become an increasingly important source of
economic growth and scholars have found that new ventures and entrepreneurs play an important
role in facilitating knowledge spillover. Both new ventures and incumbent firms innovate from
new knowledge spillovers, but incumbents are more likely to make incremental changes,
whereas new ventures are more likely to generate radical innovation (Acs et al. 2009, 2013a).
Also, Audretsch and Taylor Aldridge (2009) find that entrepreneurs serve as the link that
facilitates the spillover of knowledge in the regional economy. Moreover, knowledge spillover
tends to be local. The physical proximity helps facilitate the spread of knowledge among firms
and workers within the same region (Jaffe et al. 1993, Audretsch and Feldman 1996).
Relatedly, the density of the region also affects the relationship between entrepreneurship
and regional growth because of agglomeration benefits. There are benefits of agglomeration not
only through knowledge spillover, but also through input sharing and the improved matching
between firms and workers. The benefits of agglomeration are real and have been empirically
identified in both the service sector (Arzaghi and Henderson 2008), as well as the manufacturing
sector (Greenstone et al. 2010). Moreover, Rosenthal and Strange (2003) identify a direct
spillover effect of entrepreneurship. New firm births spurs additional entrepreneurship nearby,
and such effect decays with distance.
8
Entrepreneurship also induces competition between new ventures and incumbent firms.
The growth of incumbent firms induced by the competition from new ventures can be important
for regional development. The magnitude of such indirect effect depends not only on the firms
but also the industry and region. Aghion et al. (2009) find that the productivity increase of
incumbents from new entry is particularly larger in sectors closer to the technology frontier. The
indirect effect from competition does not necessarily lead to employment growth. As firms
become more productive they could actually reduce inputs and workers. Competition from new
ventures would result in regional employment growth when the improved productivity of firms
increases overall demand (Fritsch 2013).
Finally, entrepreneurship's impact on regional growth depends on the regional
environment. The wide regional variation in entrepreneurship has motivated researchers to
examine the underlying causes behind such variation and explore how the regional
entrepreneurial environment might influence the regional economy. Regional characteristics
influence not only people's decision to become entrepreneurs, but also the success and growth of
firms (Sternberg 2009). The pre-existing industrial structure and incumbent firms affect new
venture creation and regional growth (Fritsch and Mueller 2008). Moreover, local entrepreneurs
play an important role in the formation of industrial clusters in the first place (Feldman 2001).
The region's organizational culture (Saxenian 1994), occupational structure (Parker 2005), and
skill level (Glaeser and Saiz 2004) also contribute to the regional variation in entrepreneurship
and economic growth. The entrepreneurial ecosystem has also been examined as a framework for
regional development. Entrepreneurs and the supporting actors - such as the venture capitalists,
lawyers, and accountants - in the ecosystem play a critical role in further developing the
entrepreneurial ecosystem and regional growth (Stam 2015).
2.2 SBA loans, the supply of local ventures, and regional growth.
By guaranteeing a substantial portion of the loan, government loan guarantee programs
encourage financial institutions to lend to small businesses that are unable to get financing
through conventional methods. If the financial market were already efficient, government
intervention may help create low quality ventures that are more likely to fail. However, in
practice there is market failure in the small business loan market - commercial lenders may not
lend to potential entrepreneurs because they lack sufficient collateral, may not have sufficient
9
information to properly assess the feasibility of small ventures, or may discriminate against
minority entrepreneurs. Credit constraint continues to be one of the most significant barriers to
entrepreneurs and small businesses (Kerr and Nanda 2011, Berger and Udell 1995). The SBA
intervenes and guarantees loans to correct some of these market failures and support new
ventures that otherwise would have not received funding. The impact of SBA loans on regional
growth would depend on how SBA loans affect the supply of local ventures and how those new
ventures relate to the channels described in the previous sections, i.e., knowledge spillover,
agglomeration effects, the competition with incumbents, and regional characteristics.
More talented and skilled entrepreneurs would better exploit new knowledge to generate
radical innovations and generate positive externalities to the regional economy. They would
better take advantage of the agglomeration benefits and regional characteristics, and better spur
competition that could induce incumbents to innovate. Furthermore, high quality new ventures
can transform regions into entrepreneurial hubs by actively creating strong local networks and
attracting venture capital to the region (Feldman 2001). Bosma and Sternberg (2014) highlight
the importance of differentiating the types of entrepreneurs and show that some regions have
more entrepreneurs motivated by opportunities in the market. Hence, whether SBA loans
generate positive or negative selection in new ventures is critical to regional growth.
Theoretically, there could be both positive and negative selection into SBA backed
entrepreneurship. If the loan guarantees create moral hazard, banks may finance more low
quality ventures in expectation of being bailed out by the government. Also, loan guarantees
might attract entrepreneurs that are not only credit constrained but have lower entrepreneurial
ability. These would be instances of negative selection induced by SBA loans. On the other hand,
if high ability entrepreneurs are the ones shun from conventional lending due to the lack of
collateral, SBA guaranteed loans could generate positive selection. The complexity and the
bureaucracy associated with the SBA loan application process itself could generate positive
selection of entrepreneurs who have the organizational skills to better manage a business. The
evidence on whether there is negative or positive selection is mixed, with some of the earlier
research finding higher default rate among SBA loans (Mandel 1992), and more recent evidence
finding no difference in default rate between government guaranteed loans and conventional
business loans (KPMG 1999). Again these are more correlational results, rather than causal, and
10
it is likely that the specifics of the loan guarantee scheme, e.g., guarantee fraction, interest rate
differential, etc., would affect the results.
In addition to the quality of new ventures, the net quantity of new ventures would affect
the degree to which knowledge spillover, incumbent competition effects, and agglomeration
benefits generate regional growth. Thus, it is important to identify whether the SBA loans
actually create 'additional' firms in the regional economy. If SBA loans crowd out commercial
lending, there would be little additionality. Entrepreneurs who get funding through the SBA loan
program may have been able to get funding even in the absence of government guaranteed loans.
Empirically estimating the counterfactual of whether banks would have underwritten a loan to
the same venture or whether entrepreneurs would have pursued entrepreneurship in the absence
of SBA guaranteed loans is quite difficult. The evidence from the literature is limited and not
causal, but tend to find that guaranteed loans are related to additional ventures in the economy
(Riding and Haines 2001, Riding et al. 2007). Though I focus on two aspects of loan guarantee
schemes relevant for regional growth, i.e., selection and additionality, there are other aspects of
loan guarantee schemes that the literature examines. Parker (2009) presents an overarching
perspective on this, as well as other finance policies aimed at promoting entrepreneurship.
In sum, the impact of SBA loans on regional growth depends on the net quantity and
quality of new ventures. A net increase in the number of high quality ventures would spur
knowledge spillover and agglomeration effects. On the other hand, negative selection of
entrepreneurs and no net increase in the number of new ventures could have a negative or no
effect on regional growth. Theoretically, the effects could go either way and vary based on
regional characteristics. The net result from all the different channels would determine how the
new ventures created through SBA loans affect regional growth. In this regard, identifying the
impact of SBA loans on regional growth ultimately becomes an empirical exercise.
3. Data and empirical framework
3.1 Data
For the empirical analysis, I construct a panel of SBA loans with the Metropolitan
Statistical Area (MSA) as the regional unit of analysis for the years 1993 and 2002. An MSA in
the United States consists of one or more counties that contain an urbanized area with at least
50,000 people and the adjacent counties that have close economic ties to the major urbanized
11
area. MSAs typically center around one large city, but some MSAs contain more than one large
city. MSAs are not legal administrative regions but are used for statistical purposes by
government agencies to capture all the major urban areas in the United States. The census
boundaries of MSAs can change after each census cycle. I use this ten-year period to maintain
consistent regional boundaries within the same census cycle.
There are a variety of loan guarantee schemes (LGSs) around the world. Though the
specifics differ, LGSs typically guarantee funding to new ventures unable to get conventional
loans from banks. The LGS lender is in charge of nominating the venture and requests approval
by the government. Once approved, the government underwrites a portion of the loan. The
maximum guarantee amount varies by country - ranging from 50 to 65% in France, 70-85% in
the UK, and up to 85% in Canada. In the United States, the SBA underwrites up to 85% of the
loan. The SBA’s main form of guaranteed lending is the Small Business Loan, also known as the
7(a) loan program.1 Commercial lenders structure Small Business Loans according to the SBA’s
guidelines, and borrowers pay additional loan premiums and arrangement fees that can be
substantial. Parker (2009) presents more detailed information on the different LGSs. I construct
the SBA loans data by aggregating the universe of SBA approved loans to the MSA level. The
individual SBA loans data contains a rich set of variables including the loan amount, loan date,
business location, lender, and whether the loan was to a new business or existing business.2 I use
this information to identify the loans that were given out to new small businesses and map each
loan to a metro area and a year. I then aggregate the count and approval amount to generate the
MSA level variables. There are some miscodes and missing information in the data, particularly
pertaining to the business location. I first match the loan data to the census geographic
definitions based on the place name and Zip Code when available. The loans were then matched
to a county and then linked to an MSA.3 The number of SBA loans and the approved amount for
1993 are the aggregate values for all loans approved during the fiscal year, i.e., July 1992 - June
1993. As Table 1 indicates, the average number of SBA loans approved to new businesses with
less than 20 employees in 1993 was 11.7, but the spread is quite wide with a minimum value of 0 1 There also is the Certified Development Company Loan, also known as the 504 Loan Program. The Certified Development Company (CDC) loan provides financing for fixed assets, such as, land, buildings, or machines, through a certified development company. The CDC is only available to existing small businesses that plan to expand its business and cannot be used to start a new business and hence is not subject of interest in this study. 2 This data was purchased from Coleman Publishing. 3 Some of the loan data had missing reports and miscodes. In the end I was able to match 93% of the data to a county, which were in turn matched to MSAs.
12
and a maximum of 130. The average amount of SBA loans approved at the metropolitan level in
1993 was about $1,823,000.
[INSERT TABLE 1 HERE]
The outcome variables used to examine regional growth are the change in total
employment, total payroll, and average wage of the MSA between 1993 and 2002 in log terms.
The total employment and payroll data, which includes all forms of compensations, including
salaries, wages, benefits, and bonuses, come from the Statistics of U.S. Businesses (SUSB)
Annual data set. Average wage in the MSA was constructed as total payroll divided by total
employment. As Table 1 indicates, employment grew by 17.7 percent, total payroll by 29.5
percent, and wage by 10 percent over the 10-year period. Again there is substantial variation in
regional growth with some MSAs experiencing negative growth over the same period.
The regressions include control variables that capture the regional characteristics of the
MSAs. I include initial employment, population, median family income, and percent college
educated and above using data collected from the Census. Initial employment and population are
included to control for the initial economic condition and the size of the MSA. The median
family income and percent college and above are included to control for the average skill level
and human capital of the MSA. I capture the cost of living and the housing market condition of
each MSA by controlling for the cost of housing using the Federal Housing Finance Agency’s
House Price Index (HPI). The HPI measures single-family house prices based on the average
price change in repeat sales or refinancing of the same property. Transportation infrastructure has
been found to have a significant effect on urban growth (Duranton and Turner 2012). I proxy for
the level of infrastructure using a road density measure from Burchfield et al. (2006). The major
road density measure is defined as the length (meters) of major roads, i.e., the various interstate
and state highways, divided by the metro area in hectares. The number of incumbents could
affect how new ventures impact regional growth through competition effects. I control for the
initial number of establishments in each MSA based on size, i.e., establishments with 19 or less
employees, 20-499 employees, and 500 employees or above. Though these control variables
would capture a large part of the initial regional characteristics, I additional include the nine
Census Divisions fixed effects. There are 329 MSAs in the 1993 to 2002 census data. I drop
13
Anchorage, Honolulu, and MSAs that have missing information and eventually end up with a
balanced panel of 316 MSAs.4
3.2. Empirical framework
In examining the impact of SBA loans on regional growth, I use a standard growth
regression framework, which has widely been used to examine economic growth across
countries or regions (Levine and Renelt 1992, Mankiw et al. 1992, Glaeser et al. 1992,
Henderson et al. 1995). In practice, I run the following regression:
∆ ln𝑌!,!""#!!""! = 𝛽 ln 𝑒!,!""# + 𝑋! ∙ 𝛾 + 𝛿! + 𝜀! (1)
for Metropolitan Statistical Areas (MSAs) in the United States between the years 1993 and 2002.
∆ ln𝑌!,!""#!!""! is the change in the natural logarithm of employment, payroll, or wage between
1993 and 2002 for region i. ln 𝑒!,!""# is the natural logarithm of government guaranteed small
business loans to new businesses in 1993, either measured as the number of loans or total dollar
amount. 𝑋! is the set of initial control variables, which include log employment in 1993, log
median family income in 1990, log population in 1990, percent college educated and above in
1990, the log housing price index in 1993, major road density, and the log number of
establishments by size categories in 1993. 𝛿! represents the census division fixed effects.
The estimates of 𝛽 from OLS regressions of equation (1) will likely be biased. Regions
with more growth potentials could see higher levels of entrepreneurial activity in general, and
more government guaranteed small business loans. This would render the estimate of 𝛽 upward
biased in equation (1). On the other hand, if struggling regions see higher levels of government
guaranteed small business loans, then the estimate of 𝛽 would be biased downward. Such
endogeneity hampers the causal interpretation of the impact of SBA loans on regional growth in
an OLS regression. Though controlling for initial regional characteristics would capture some of
the omitted variables, there will likely be unobserved regional growth factors that are still
unaccounted for. Finding plausibly exogenous variation in SBA loans across regions is
challenging. The approach I use in this paper is to present results from first-difference
4 MSAs not included in the sample are Anchorage, AK, Honolulu, HI, Cumberland, MD-WV, Enid, OK, Flagstaff, UT-AZ, Grand Junction, CO, Hattiesburg, MS, Jamestown, NY, Johnstown, PA, Jonesboro, AR, Missoula, MT, Pocatello, ID, Steubenville-Weirton, OH-WV.
14
regressions and instrumental variable regressions, which would likely mitigate the endogeneity
problem, and compare the results to that from standard OLS regressions. Moreover, in estimating
the instrumental variables regressions, I use a variety of instrumental variables to examine the
robustness of the results.
4. The impact of government-guaranteed small business loans on urban economic growth
4.1. OLS Results
Table 2 reports the OLS results. Estimation is based on equation (1), and Panel A
presents results for employment, Panel B for payroll, and Panel C for wages. Columns (1) to (3)
only include the SBA loan variables, columns (4) to (6) add the variables that control for initial
regional characteristics, and columns (7) to (9) additionally include the nine census division
fixed effects. Panel A column (1) indicates that more loans approved to new businesses results in
significantly higher employment growth. A 10 percent increase in market entrepreneurship is
associated with about 2.5% higher employment after 10 years. However, the approved dollar
amount has no significant impact on employment. When I separate out the number of SBA loans
and the total amount of SBA loans in columns (2) and (3) both estimates are positive and
significant. However, there are a host of regional factors that could be related to the number and
amount of SBA loans in the MSA. Once I include the control variables, the coefficient estimate
on the number of SBA loans in column (5) becomes smaller but is still statistically significant,
barely missing the 5 percent level. However, in column (6) the estimate on the total amount of
SBA loans becomes substantially smaller and is no longer statistically meaningful. Getting more
small businesses started seems to be more important than giving out large loans for regional
growth. Similarly, Samila and Sorenson (2011) find that the number of firms receiving venture
capital matter for regional growth but not the total amount.
[INSERT TABLE 2 HERE]
The coefficient estimates on the control variables also present interesting patterns. The
estimate on initial employment is negative, implying that, all else equal, regions that start with a
lower number of jobs tend to add more jobs. A higher housing price index, which is related to the
demand for jobs in the region, is positively associated with growth. The number of small
15
establishments and the number of large establishments are also positively related to growth.
However, the density of major roads is negatively related to growth. Relatively more roads could
facilitate the distribution of goods and people, but more major roads also suggest that the region
is relatively more built up to begin with, which could limit growth opportunities.
Once I include the census division fixed effects in columns (7) to (9). The census division
fixed effects captures some of the unobserved regional characteristics. Once these are controlled
for the impact of SBA loans on regional growth becomes smaller. The coefficient estimate on
the number of SBA loans in column (8) decreases to 0.119 and is no longer significant. The
decrease in the coefficient estimate on the total amount of SBA loans in column (9) is substantial
and the estimate is indistinguishable from zero.
The annual payroll results in Panel B are statistically weaker in general, and the negative
effects of total loan amount are more pronounced compared to the employment results. Panel C
indicates that SBA loans, neither the number of loans or total amount, are not associated with
any wage growth. Overall, Table 2 suggests that more SBA loans are generally related with
regional growth, but if we take into the regional characteristics into account the relationship
becomes weaker. Despite the various control variables and the fixed effects, endogeneity besets
causal interpretation in Table 2.
4.2. First-difference results
To alleviate some of the endogeneity concerns from the OLS regressions, I present first-
difference estimates in Table 3 based on the following regression:
∆ ln𝑌!,!""#!!""! − ∆ ln𝑌!,!""#!!""# = 𝛽∆ ln 𝑒!,!""#!!""# + ∆𝑋!,!""#!!""# ∙ 𝛾 + 𝜀!,!""#!!""#. (2)
This specification essentially takes the difference between two 5-year OLS growth
equations similar to equation (1). The first differencing deals with unobserved MSA fixed effects,
such as static metropolitan area growth potentials. In many cases, the coefficient estimates are
considerably smaller in magnitude than the OLS estimates. All the employment and payroll
results indicate that SBA loans in either numbers or total amount have no significant effect on
regional growth. The result in column (8) indicates that the number of loans may increase
regional wage growth, but the effect is not significant at the 5 percent level. There is little
evidence in Table 3 that supports any significant regional growth effects from guaranteed small
business loans. One thing to note is that first differencing a dynamic framework introduces the
16
potential for endogeneity through correlated error terms. More importantly, there could still be
unobserved time varying MSA level growth potential that is correlated with entrepreneurship in
the regression. Hence, I further investigate the impact of SBA loans on regional growth using
instrumental variables.
[INSERT TABLE 3 HERE]
4.3 Instrumental variable strategy and the 2SLS results
The first-difference regression can control for unobserved MSA level characteristics that
are constant. But if there are unobserved MSA level characteristics that vary over time and are
correlated with SBA loans, the estimates from Table 3 would be biased. To further alleviate
endogeneity, I examine 2SLS regression results using a variety of instrumental variables –years
since interstate banking deregulation, the number of SBA lenders in 1985, and employment in
mining and agriculture. As stated before, claiming exogeneity in regional growth regressions is
difficult. The approach I take in this paper is to use different instrumental variables that could
potentially generate plausibly exogenous variation in the number of SBA guaranteed loans, and
then examine whether the results are consistent across the different specifications. The
identifying assumption for inference is that the instrumental variables are unrelated to the
unobserved regional growth factor between 1993 and 2002, conditional on the variables that
control for the regional characteristics. As before, I include the control variables and the nine
Census Division fixed effects. By focusing on the within Census Division variation, I control for
a substantial part of the unobserved growth environment across different regions of the U.S.
I first examine the impact SBA loans on regional growth using years since interstate
banking deregulation as the instrumental variable. Banks in the U.S. were severely restricted in
their ability to branch across state borders during most of the 20th century. Such restrictions were
based on the concern that large concentrated banks would help the wealthy and larger firms, at
the cost of the poor and small (Beck et al. 2010b). Only in recent decades did states start to
permit banks to open new branches out of state, i.e., interstate branching. By 1994 all restrictions
were lifted with the passage of the Riegle-Neal Interstate Banking and Branching Efficiency Act.
Appendix Table 1 lists the years each state deregulated interstate banking. I use years since
interstate banking deregulation in 1993, i.e., 1993 minus the year of deregulation, as my main
17
instrumental variable. For MSAs that overlap with multiple states, I use the average years across
the overlapping states. The main intuition behind this instrumental variable is that MSAs that
deregulated interstate branching earlier would see more opportunities for commercial lending in
1993. Hence, entrepreneurs in regions that deregulated earlier would likely have more options
for commercial lending and this in turn could reduce the need to go through the bureaucracy of
the SBA to get government guaranteed loans. Table 4 Panel A Column (1) confirms this
relationship. The longer it has been since deregulation the lower is the number of SBA loans
approved to new small businesses in 1993. A Hausman test of endogeneity returns a p-value of
0.07, which indicates that the number of SBA loans is likely to be endogenous in the regression.
The exclusion restriction hinges on the assumption that the timing of interstate banking
deregulation was more or less idiosyncratic and unrelated to unobserved regional growth
between 1993 and 2002, conditional on the control variables. Beck et al. (2010) find that the
timing of interstate banking deregulation was unrelated to state economic conditions. Moreover,
once the regional characteristics and the Census Division fixed effects are controlled for, the
timing would more likely be exogenous. Column (1) Panels B through D present the results from
the second stage of the 2SLS regression. The coefficient estimates are now all negative which
contrasts from the generally positive estimates from the OLS and first-difference regressions.
However, none of the estimates are statistically significantly different from zero.
[INSERT TABLE 4 HERE]
In column (2), I use a different instrumental variable, i.e., the number of financial
institutions that provided SBA guaranteed loans in the MSA in 1985. Historically having a
higher number of SBA lenders in the region, conditional on population and the number of
establishments, would likely imply a stronger relationship between regional banks and local
businesses and entrepreneurs. Small regional banks are the main providers of SBA guaranteed
loans and the literature has found that small businesses rely more on relationship lending from
these regional banks (Cole 1998, Scott 2004). Regions with more banks that have SBA lending
experience would likely have greater collective knowledge of SBA loans. Hence, regions that
historically had more SBA guaranteed loan providers may have approved a larger number of
SBA small business loans in 1993. The exclusion restriction requires that the number of SBA
18
lenders in 1985 is related to regional growth between 1993 and 2002 only through its
relationship with the number of SBA loans in 1993, conditional on the control variables. It seems
likely that the initial control variables that capture the region's economy and the Census Division
fixed effects would capture most of the variation in SBA lenders in 1985. To statistically
examine the validity of the two instrumental variables, I later conduct a test of overidentifying
restrictions, i.e., the Hansen J-test.
Column (2) of Panel A indeed indicates a very strong positive relationship between the
number of SBA lenders in 1985 and the number of SBA loans in 1993. The second stage results
in Panels B, C, and D all indicate that SBA loans reduce regional employment, payroll, and wage
growth, but again the estimates are not statistically significant. The first stage F-statistic is much
stronger when we use this instrument at 29.7, but the p-value from the Hausman test of
endogeneity is larger at about 0.39. In column (3), I include both variables as the instrumental
variable, and conduct the Hansen J-test. First of all, the first stage regression in Panel A indicates
that the coefficient estimates in column (3) are similar to the respective estimates from columns
(1) and (2). The first stage F-statistic remains quite strong at 17.6. The second stage results in
Panels B through D are again all negative and not statistically different from zero. Moreover, the
p-values from the Hansen J-test are not statistically significant. That is, the instrumental
variables are not significantly related to the error term from the second stage regression, which
indicates that the instrumental variable estimates are likely well identified.
Despite the two main instrumental variables - years since interstate banking deregulation
and the number of SBA loan providers in the MSA - are quite different and have opposite effects
in the first-stage regression, the 2SLS estimates are qualitatively similar. Furthermore, the
consistency of the second stage results across columns (1) to (3) supports the null effect of SBA
loans on regional growth. The all around negative estimates potentially suggest a negative impact
of SBA loans on regional growth. However, such claim warrants caution as none of the
coefficient estimates are statistically significant at conventional levels.
Lastly, I use two other instrumental variables to examine the robustness of the 2SLS
estimates. I include initial employment in mining in column (4), and additionally include initial
employment in agriculture in column (5). Glaeser et al. (2015) hypothesize and show that large
resource-intensive activities like mining crowd out entrepreneurial activity. Resource-intensive
activities generally are carried out by large firms and create less incentive and training for
19
workers to venture out and start new businesses. This could result in lower demand for and
supply of SBA guaranteed loans in regions dominated by resource-intensive industries like
mining and agriculture. I find that is indeed the case in columns (4) and (5) of Panel A.
Employments in mining and agriculture are negatively and significantly related to the number of
SBA loans. The second stage results are quite stable, with all estimates negative and again
statistically not different from zero. The Hansen J-tests all suggest that the 2SLS estimates are
likely well identified.
Overall Table 4 indicates that despite using totally different instrumental variables, the
impact of SBA guaranteed loans on regional employment, payroll, and wage growth is
statistically indistinguishable from zero, and if any tends towards a negative effect. The null
results from the OLS regressions with the full set of control variables, the first-difference
regression, and now the various 2SLS regressions, present strong evidence that indicates that
government guaranteed small business loans have no significant impact on regional economic
growth.
4.4 Robustness tests
I also perform a variety of robustness tests by estimating specifications that additional
control for state minimum wage, Right-to-work status, past populations, or the region’s industrial
composition. I also examine results excluding rust belt states. The 2SLS results that use all four
instrumental variables are presented in Table 5. The results are similar to that from Table 4
column (5) and quite stable across the different specifications.
[INSERT TABLE 5 HERE]
One thing to note is that the OLS estimates in Table 2 column (8) are greater, i.e., more
positive, compared to the corresponding 2SLS estimates. This indicates that the OLS estimates
were upward biased. Regions with higher growth potential saw more SBA loan approvals. But
once unobserved growth potential is controlled for, SBA loans have no significant impact on
regional growth.
20
5. Discussion
This paper examines whether SBA guaranteed small business loans generate regional
growth in the United States. Though the literature has found regional growth effects from
entrepreneurship in general, I find no evidence of regional growth from new ventures created
through SBA guaranteed loans. Identifying the impact of SBA loans on regional growth is
challenging because of the endogeneity of SBA loans. For instance, regions with more growth
potential could see higher levels of entrepreneurial activity, and in turn more government
guaranteed small business loans.
A simple regression of regional growth on the number of SBA loans returns a significant
positive relationship. However, including the full set of control variables decreases the effect of
SBA loans on regional growth and renders the estimates no longer statistically significant. A
first-difference regression, which controls for unobserved MSA specific effects, returns
coefficient estimates that are small in magnitude and statistically indistinguishable from zero.
Finally, I present results from a variety of 2SLS regressions using years since interstate banking
deregulation, the number of SBA lenders in 1985, and employment in mining and agriculture as
instrumental variables. Despite using very different instruments, the impact of SBA guaranteed
loans on regional employment, payroll, and wage growth is statistically indistinguishable from
zero, and if any tend towards a negative effect. The null results from the OLS regressions with
the full set of control variables, the first-difference regressions, and the various 2SLS regressions,
present strong evidence that indicates that government guaranteed small business loans have no
significant impact on regional economic growth.
5.1 Implications
While the empirical results of this paper find no net efficiency gains from government
guaranteed small business loans, I note that the SBA loans do not explicitly aim to promote
regional growth. In this regard, the empirical results of this paper do not assess the general value
of SBA loans. There indeed is evidence of discrimination in small business lending and SBA
loans may be suitable to address such inequality. Blanchflower et al. (2003) find that black
entrepreneurs are twice as likely to be denied credit compared to white entrepreneurs. Gender
inequality in Silicon Valley start-ups has become a social issue in recent years. Understanding
the ramifications of inequality in entrepreneurship in relation to this paper’s finding would
21
enable a richer assessment of the government’s role in small business lending. I also note that the
empirical results here are at the regional level and the same results may not necessarily transfer
to a study that examines the impact of SBA loans on individual firm growth. Moreover, there
may be heterogeneity across regions, i.e., certain regions may see positive impacts while certain
regions do not.
As Acs et al. (2013b) and Lerner (2012) point out the policy world has looked to
entrepreneurship as a way to stimulate economic growth. Facilitating financing for small
businesses is one of the main policy tools used to promote entrepreneurship. This paper’s finding
that government guaranteed small business loans have no effect on promoting regional growth
may seem discouraging, but may further stimulate the discussions surrounding ineffective
entrepreneurship policies (Shane 2009). Some of the research that have examined public efforts
to spur entrepreneurship have often found weak or spotty results (Lerner 1999, Lerner 2002,
Brander et al. 2015). But at the same time, researchers have found that venture capital or
programs that support technology startups do promote regional growth (Samila and Sorenson
2011, Hsu 2006). A guaranteed loan scheme that incentivizes high-risk technology ventures may
be more effective in promoting regional growth than a guaranteed loan scheme that does not
differentiate the types of small businesses. Hurst and Pugsley (2011) find that many small
business owners become entrepreneurs for the flexible lifestyle and do not desire to grow their
businesses. Recently, there has been much debate on how new technologies, such as artificial
intelligence could influence economic growth. A loan guarantee scheme that provides
preferential loan conditions, such as a higher guarantee amount and/or lower interest rate to new
ventures in artificial intelligence, bioengineering, etc. may better create opportunities for regional
growth in the near future.
5.2 Limitations and future research
The empirical results of this paper cannot reject the null hypothesis that SBA loans have
no effect on regional growth. This may be because the true effect is zero. However, there is
always the possibility that the estimates are not precise enough. In order to reduce the likelihood
of the latter being the explanation, I have examined the results from OLS regressions, first-
difference regressions, and instrumental variable regressions. The consistency of the estimates
across the different specifications, as well as the consistently negative but insignificant 2SLS
22
estimates suggest that the results are unlikely driven simply by weak statistical power. An ideal
way to increase power and reduce the probability of incorrectly accepting the null hypothesis,
when there actually is an effect, would be to increase the sample size. The analysis in this paper
is based on a fixed number of MSAs. Though MSAs contain the majority of the U.S. population,
there are many areas not covered by MSAs. SBA loan policies may have differential effects
between urban and rural areas. Future research that utilizes the full geographic extent of the US
would be valuable both contextually and statistically.
Another limitation of this study is that it lumps all industries together. This is primarily
because of data constraints and the difficulty of constructing a balanced region-industry level
SBA loan panel. However, the impact of SBA loans on regional growth could differ by industry.
To better design entrepreneurship and guaranteed loan policies, it would be valuable to identify
which types of new ventures drive economic growth. The high technology firms could be driving
economic growth or the various small businesses, from retail to the services, could be doing their
share in promoting growth. Finally, coming up with a quasi-experimental design that could
generate plausibly exogenous variation in the different types of entrepreneurship or
entrepreneurship policy is challenging. However, future research that continues to tackle
endogeneity would contribute substantially to our understanding of entrepreneurship’s role in
regional growth and help tailor policies to such end.
Acknowledgements
I thank Simon Parker, two anonymous referees, David Love, Junfu Zhang, Hirofumi
Uchida, Leo Feler, Nathaniel Baum-Snow, Kenneth Chay, and seminar and workshop
participants at Stanford University, Brown University, Johns Hopkins University, Williams
College, the Korea Development Institute, Rimini Conference in Economics and Finance, the
American Real Estate and Urban Economics Annual Meetings, and the Urban Economics
Association Annual Meeting for comments.
23
References
Acs, Zoltan J., and Pamela Mueller. 2008. “Employment Effects of Business Dynamics: Mice,
Gazelles, and Elephans.” Small Business Economics, 30(1), 85–100.
Acs, Zoltan J., David B. Audretsch, B. Pontus, and B. Carlsson. 2009. “The knowledge
spillover theory of entrepreneurship.” Small Business Economics, 32(1), 15–30.
Acs, Zoltan J., David B. Audretsch, and E.E. Lehmann. 2013a. “The knowledge spillover
theory of entrepreneurship.” Small Business Economics, 41(4): 757-774.
Acs, Zoltan J., David B. Audretsch, and Robert J. Strom. 2013b. Entrepreneurship, Growth,
and Public Policy. Kauffman Foundation.
Aghion, Philippe and Peter Howitt. (1992). “A Model of Growth Through Creative
Destruction”, Econometrica, 60, 323-35
Aghion, Philippe, Richard Blundell, Rachel Griffith, Peter Howitt, and Susanne Prantl, 2009.
"The Effects of Entry on Incumbent Innovation and Productivity," The Review of Economics
and Statistics, MIT Press, vol. 91(1), pages 20-32
Arzaghi, M and J. Vernon Henderson. 2008. “Networking Off Madison Avenue.”
Review of Economic Studies, 75 (4), 1011-1038
Audretsch, David and Maryann P. Feldman. 1996. “R&D spillovers and the geography of
innovation and production.” American Economic Review, 86(3): 630-640.
Audretsch, David and Michael Fritsch. 2002. “Growth Regimes over Time and Space”
Regional Studies, 36: 113-24.
Audretsch, David and T. Taylor Aldridge. 2009. Knowledge spillovers, entrepreneurship and
regional development. In: Capello, R., Nijkamp, P. (eds.), Handbook of Regional Growth and
Development Theories. Cheltenham, Northampton: Elgar. 201-210
Beck, Thorsten, A. Demirguc-Kunt, M.-P. Soledad. 2008. "Bank Financing for SMEs around
the World: Drivers, Obstacles, Business Models and Lending Practices." World Bank Policy
Research Working Paper No. 4785.
Beck, Thorsten, L.F. Klapper, J.C. Mendoza. 2010a. The typology of partial credit guarantee
funds around the world.” Journal of Financial Stability, 6, 10–25.
Beck, Thorsten, Ross Levine, and Alexey Levkov. 2010b. “Big Bad Banks? The Winners and
Losers from Bank Deregulation in the United States.” Journal of Finance, 45(5), 1637-1667.
Berger, Allen N. and Gregory F. Udell. 1995. “Relationship Lending and Lines of Credit in
24
Small Firm Finance” The Journal of Business Vol. 68, No. 3, pp. 351-381.
Blanchflower, David G., Phillip B Levine, and David J. Zimmerman. 2003. “Discrimination
in the Small-Business Credit Market.” Review of Economics and Statistics, 85(1): 930-943.
Bosma N.S. and R. Sternberg. 2014. “Entrepreneurship as an urban event? Empirical evidence
from European cities.” Regional Studies, 48(6), 1016-1033.
Brander, James A., Qianqian Du, and Thomas Hellmann. 2015. “The Effects of Government-
Sponsored Venture Capital: International Evidence.” Review of Finance, 19(2): 571-618.
Carlino, G., S. Chatterjee, and R. Hunt. 2007. "Urban density and the rate of invention."
Journal of Urban Economics, 61: 389–419.
Cole, R., 1998. “The importance of relationships to the availability of credit.” Journal of
Banking and Finance, 22, pp. 959-977.
Craig, Ben R., William E. Jackson III, and James B. Thomson. 2007. “Small Firm Finance,
Credit Rationing, and the Impact of SBA-Guaranteed Lending on Local Economic Growth”,
Journal of Small Business Management, 45(1), pp. 116-132.
Duranton, Gilles, and Matthew Turner. 2011. "The Fundamental Law of Road Congestion:
Evidence from US Cities," American Economic Review, 101(6): 2616-52
Feldman, Maryann P. 2001. “The Entrepreneurial Event Revisited: Firm Formation in a
Regional Context.” Industrial and Corporate Change 10: 861-891.
Fritsch, Michael. 1997. "New Firms and Regional Employment Change." Small Business
Economics, 9: 437-448.
Fritsch, Michael and Pamela Mueller. 2008. "The Effect of New Business Formation on
Regional Development Over Time: The Case of Germany." Small Business Economics, 27: 245-
260.
Fritsch, Michael. 2013. "New Business Formation and Regional Development: A Survey and
Assessment of the Evidence", Foundations and Trends in Entrepreneurship: Vol. 9: No. 3, pp
249-364.
Glaeser, Edward L. Hedi D. Kallal, Jose A. Scheinkman, Andrei Shleifer. 1992. “Growth in
Cities” Journal of Political Economy 100:1126-1152.
Glaeser, Edward L. and Albert Saiz. 2004. “The Rise of the Skilled City." Brookings-Wharton
Papers on Urban Affairs 5: 47-94.
Glaeser, Edward L., W. Kerr, and G. Ponzetto. 2010. "Clusters of entrepreneurship." Journal
25
of Urban Economics 67(1): 150–168.
Glaeser, Edward L., Sari Pekkala Kerr, and William R. Kerr. 2015. “Entrepreneurship and
Urban Growth: An Empirical Assessment with Historical Mines.” The Review of Economics and
Statistics, 97(2): 498-520.
Greenstone, Michael, Richard Hornbeck, and Enrico Moretti. 2010. “Identifying
Agglomeration Spillovers: Evidence from Winners and Losers of Large Plant Openings”.
Journal of Political Economy 118 (3): 536-598.
Henderson, Vernon, Ari Kuncoro, and Matt Turner. 1995. “Industrial Development in Cities.”
Journal of Political Economy, 103(5), 1067-1090.
Hsu, David. 2006. “Venture Capitalists and Cooperative Start-up Commercialization Strategy.”
Management Science, 52(2): 204-219.
Hurst, Erik, and Benjamin Pugsley. 2011. “What do Small Businesses Do?” Brookings Paper
on Economic Activity, Vol 43(2), 73-142.
Jacobs, Jane. 1969. The Economy of Cities, Random House.
Jaffe, Adam B., Manuel Trajtenberg, and Rebecca Henderson. 1993. “Geographic
Localization of Knowledge Spillovers as Evidence by Patent Citations.” Quarterly Journal of
Economics, 108(3): 577-598.
Kerr, William R., and Ramana Nanda. 2011. "Financing Constraints and Entrepreneurship."
In Handbook of Research on Innovation and Entrepreneurship, edited by David Audretsch,
Oliver Falck, and Stephan Heblich, 88–103. Cheltenham, U.K.: Edward Elgar Publishing.
KPMG. 1999. An Evaluation of the Small Firms Loan Guarantee Scheme, DTI, London,
HMSO.
Lee, Yong Suk. 2017. “Entrepreneurship, Small Businesses, and Economic Growth in Cities.”
Journal of Economic Geography, 17(2): 311–343.
Lelarge, C., D. Sraer, D. Thesmar. 2010. Entrepreneurship and credit constraints: Evidence
from a French loan guarantee program. In: International Differences in Entrepreneurship,
University of Chicago Press, pp. 243–273.
Lerner, Josh. 1999. “The Government as Venture Capitalist: The Long-Run Effects of the
SBIR Program.” Journal of Business, 72: 285-318.
Lerner, Josh. 2002. “When Bureaucrats Meet Entrepreneurs: The Design of Successful
‘Public Venture Capital’ Programs.” Economic Journal, 112(477): 73-84.
26
Lerner, Josh. 2012. Boulevard of Broken Dreams: Why Public Efforts to Boost
Entrepreneurship and Venture Capital Have Failed and What to Do About it. Princeton:
Princeton University Press.
Levine, Ross and David Renelt. 1992. "A Sensitivity Analysis of Cross-Country Growth
Regressions." American Economic Review, 82(4): 942-963.
Mandel, A. S. 1992. "Small Business, Banks, and SBA Loan Guarantees: Comment." Small
Business Economics, 4: 169-170.
Mankiw, N. Gregory, David Romer, and David N. Weil. 1992. "A Contribution to the
Empirics of Economic Growth." Quarterly Journal of Economics, 107(2): 407–437.
Mullins, William and Patricio Toro. 2017. "Credit Guarantees and New Bank Relationships".
unpublished.
Parker, Simon C. 2005. “Explaining Regional Variations in Entrepreneurship as Multiple
Occupational Equilibria.” Journal of Regional Science, 45: 829–850.
Parker, Simon C. 2009. The Economics of Entrepreneurship. Cambridge, UK: Cambridge
University Press.
Riding, A. L. and G. Haines Jr. 2001. "Loan Guarantees: Costs of Default and Benefits to
Small Firms." Journal of Business Venturing, 16: 595-612.
Riding, A. L., J. Madill and G. Haines Jr. 2007. "Incrementality of SME Loan Guarantees."
Guarantees: Costs of Default and Benefits to Small Firms." Small Business Economics, 29(1-2):
47-61.
Rosenthal, Stuart S. and William C. Strange, 2003. "Geography, Industrial Organization, and
Agglomeration." The Review of Economics and Statistics, 85(2): 377-393.
Samila, Sampsa and Olav Sorenson. 2011. "Venture Capital, Entrepreneurship, and Economic
Growth." The Review of Economics and Statistics, 93(1): 338-349
Saxenian, Annalee. 1994. Regional Advantage: Culture and Competition in Silicon Valley
and Route 128. Cambridge, MA: Harvard University Press.
Scott, J.A. 2004. “Small business and value of community financial institutions.” Journal of
Financial Services Research, 25: 207-230.
Shane, Scott. 2009. “Why encouraging more people to become entrepreneurs is bad public
policy.” Small Business Economics 33: 141-149.
Stam, Erik. 2015. “Entrepreneurial Ecosystems and Regional Policy: A Sympathetic Critique.”
27
European Planning Studies 23(9): 1759- 1769.
Sternberg, Rolf. 2009. Regional Dimensions of Entrepreneurship. Boston: Now Publishers,
Foundations and Trends in Entrepreneurship, vol. 5, Issue 4.
28
Table 1. Summary Statistics
Variable Mean Std. Dev. Min Max Obs Number of SBA loans approved to new businesses with less than 20 employees, 1993 11.7 16.44 0 130 316
Amount of SBA loans approved($1,000) to new businesses with less than 20 employees, 1993 1823 2981 0 30500 316
Change in log employment, 1993-2002 0.16 0.10 -0.26 0.55 316
Change in log payroll, 1993-2002 0.26 0.14 -0.17 0.75 316
Change in log wage, 1993-2002 0.10 0.06 -0.08 0.31 316
Employment, 1993 252130 439654 20957 3495130 316
Median family income in 1990 34810 6668 17619 69403 316
Population in 1990 618795 1043664 36936 8875317 316
Housing price index 1993 96.35 6.27 80.49 115.53 316
Percent college and above in 1990 18.79 6.31 9.7 44 316
Major road density 0.90 0.36 0.05 1.77 316
Establishments with less than 20 employees in 1992 9951 17118 930 153444 316
Establishments with 20 to 499 employees in 1992 2342 3792 251 31957 316
Establishments with 500 or above employees in 1992 1961 3090 142 22290 316
Years since interstate banking deregulation from 1993 6.74 2.06 0 15 316
Number of SBA lender per 1000 people in 1985 0.013 0.015 0.000 0.144 316
Employment in mining in 1993 599 1506 0 15850 314
Employment in agriculture in 1993 1288 2309 0 16360 314
29
Table 2. SBA loans and regional growth: OLS estimates
(1) (2) (3) (4) (5) (6) (7) (8) (9) Panel A: Change in log employment, 1993-2002
Log number of SBA loans approved for new businesses, FY1993
0.0253*** 0.0203*** 0.0246** 0.0154* 0.0214** 0.0119 (0.00847) (0.00553) (0.0113) (0.00781) (0.0104) (0.00733)
Log amount of SBA loans approved for new businesses, FY1993
-0.00212 0.00364** -0.00296 0.000776 -0.00285 0.000198 (0.00217) (0.00144) (0.00217) (0.00147) (0.00188) (0.00128)
Log employment in 1993 -0.182*** -0.180*** -0.170*** -0.184*** -0.182*** -0.178*** (0.0605) (0.0614) (0.0633) (0.0663) (0.0672) (0.0680)
Log median family income in 1990 -0.0474 -0.0466 -0.0578 0.0840 0.0864 0.0784 (0.0515) (0.0516) (0.0533) (0.0568) (0.0565) (0.0579)
Log population in 1990 -0.0273 -0.0283 -0.0312 0.0106 0.00980 0.0100 (0.0379) (0.0377) (0.0378) (0.0398) (0.0398) (0.0395)
Percent college and above in 1990 -0.0825 -0.0898 -0.0867 -0.0207 -0.0245 -0.0341 (0.108) (0.107) (0.108) (0.146) (0.146) (0.146)
Log housing price index 1993 0.00427*** 0.00428*** 0.00461*** 0.00172 0.00171 0.00185* (0.00110) (0.00112) (0.00113) (0.00108) (0.00108) (0.00109)
Major road density -0.0420** -0.0440** -0.0514** 0.0103 0.00938 0.00714 (0.0198) (0.0200) (0.0206) (0.0183) (0.0183) (0.0185)
Log establishments with less than 20 employees in 1992
0.0860** 0.0815* 0.0754* 0.0294 0.0266 0.0210 (0.0429) (0.0434) (0.0428) (0.0419) (0.0421) (0.0416)
Log establishments with 20 to 499 employees in 1992
0.0189 0.0236 0.0346 0.132** 0.134** 0.139** (0.0546) (0.0546) (0.0539) (0.0600) (0.0601) (0.0593)
Log establishments with 500 or above employees in 1992
0.108*** 0.109*** 0.109*** 0.0167 0.0191 0.0239 (0.0324) (0.0324) (0.0332) (0.0402) (0.0400) (0.0396)
Census division fixed effects No No No No No No Yes Yes Yes R squared 0.047 0.045 0.015 0.258 0.254 0.244 0.375 0.371 0.366
Panel B: Change in log payroll 1993-2002
Log number of SBA loans approved for new businesses, FY1993
0.0496*** 0.0380*** 0.0275* 0.0133 0.0236* 0.00869 (0.0110) (0.00716) (0.0155) (0.0104) (0.0141) (0.00961)
Log amount of SBA loans approved for new businesses, FY1993
-0.00495* 0.00633*** -0.00451 -0.000345 -0.00449* -0.00113 (0.00275) (0.00190) (0.00280) (0.00179) (0.00250) (0.00165)
Base controls Yes Yes Yes Yes Yes Yes Yes Yes Yes Census division fixed effects No No No No No No Yes Yes Yes R squared 0.088 0.081 0.023 0.309 0.304 0.300 0.416 0.411 0.411
Panel C: Change in log wage 1993-2002
Log number of SBA loans approved for new businesses, FY1993
0.0243*** 0.0176*** 0.00283 -0.00203 0.00217 -0.00325 (0.00449) (0.00301) (0.00623) (0.00424) (0.00615) (0.00436)
Log amount of SBA loans approved for new businesses, FY1993
-0.00283** 0.00270*** -0.00155 -0.00112 -0.00164 -0.00133 (0.00118) (0.000871) (0.00119) (0.000790) (0.00119) (0.000849)
Base controls Yes Yes Yes Yes Yes Yes Yes Yes Yes Census division fixed effects No No No No No No Yes Yes Yes R squared 0.098 0.087 0.021 0.359 0.356 0.358 0.410 0.407 0.410
Notes: The unit of analysis is the MSA and the number of observations is 316. The number of new SBA loans approved and the total amount approved are for the period July 1992 to June 1993. There are nine census division dummies in the Census division fixed effects. * p<0.1, ** p<0.05, *** p<0.01. Robust standard errors are in parentheses.
30
Table 3. SBA loans and regional growth: first-difference estimates
(1) (2) (3) (4) (5) (6) (7) (8) (9)
Change in 5 year employment growth,
(1997 to 2002 growth) - (1993 to 1998 growth)
Change in 5 year payroll growth,
(1997 to 2002 growth) - (1993 to 1998 growth)
Change in 5 year wage growth,
(1997 to 2002 growth) - (1993 to 1998 growth)
ΔLog number of SBA loans approved for new businesses, 1993-97
0.00490 0.00334 0.00890 0.00872 0.00400 0.00538*
(0.00514) (0.00453) (0.00726) (0.00618) (0.00377) (0.00314)
ΔLog amount of SBA loans approved for new businesses, 1993-97
-0.000630 -0.00001 -0.00007 0.00105 0.000557 0.00106
(0.00103) (0.000923) (0.00132) (0.00114) (0.000800) (0.000668)
Base controls Y Y Y Y Y Y Y Y Y R squared 0.577 0.576 0.576 0.585 0.585 0.582 0.568 0.567 0.566
Notes: The unit of analysis is the MSA and the number of observations is 316. The number of new SBA loans approved and the total amount approved are for the period July 1992 to June 1993. Base controls include the change in log employment, payroll, population, house price index, establishments by the three size categories, the 1990 percent college educated and log median family income, and major road density. * p<0.1, ** p<0.05, *** p<0.01. Robust standard errors are in parentheses.
31
Table 4. SBA loans and regional growth: 2SLS Estimates
(1) (2) (3) (4) (5)
Panel A - 1st Stage: Dependent variable: Log number of SBA loans approved to new small businesses in 1993
Log years since banking deregulation -0.294** -0.233* -0.227* -0.235* (0.130) (0.124) (0.124) (0.123)
Log number of SBA lender in 1985 0.360*** 0.349*** 0.377*** 0.380*** (0.0661) (0.0660) (0.0646) (0.0636)
Log employment in mining in 1993 -0.0275** -0.0249** (0.0124) (0.0122)
Log employment in agriculture in 1993 -0.0328** (0.0133)
R squared 0.667 0.691 0.694 0.704 0.709
Panel B - 2SLS : Dependent variable: Change in log employment, 1993-2002 Log number of SBA loans approved to new small businesses, 1993
-0.126 -0.00757 -0.0225 -0.0150 -0.0193 (0.0921) (0.0248) (0.0253) (0.0215) (0.0205)
Hansen J-statistic p-value 0.13 0.23 0.30
Panel C - 2SLS : Dependent variable: Change in log payroll, 1993-2002 Log number of SBA loans approved to new small businesses, 1993
-0.155 -0.0259 -0.0421 -0.0281 -0.0259 (0.115) (0.0325) (0.0329) (0.0280) (0.0271)
Hansen J-statistic p-value 0.19 0.22 0.39
Panel D - 2SLS : Dependent variable: Change in log wage, 1993-2002 Log number of SBA loans approved to new small businesses, 1993
-0.0289 -0.0183 -0.0197 -0.0132 -0.00653 (0.0350) (0.0165) (0.0155) (0.0129) (0.0122)
Hansen J-statistic p-value 0.77 0.38 0.18
Instrumental variables: Years since deregulation
SBA lender density
SBA lender density,
years since deregulation
SBA lender density,
years since deregulation,
mining employment
SBA lender density,
years since deregulation,
mining employment, agriculture employment
1st stage F-statistic 5.15 29.67 17.59 14.54 11.63 Base controls Y Y Y Y Y Census division fixed effects Y Y Y Y Y
Notes: Panel A presents the first stage of the 2SLS regression and Panels B to D present the 2SLS estimates. The unit of analysis is the MSA and the number of observations is 316 for columns (1) to (3) and 314 for columns (4) and (5). The number of new SBA loans approved is for the period July 1992 to June 1993. Base controls are initial employment, median family income, population, percent college degree and above, the house price index, the number of initial establishments by the three size categories, and major road density. The Kleibergen-Paap rk Wald F statistics are reported as the 1st stage F-statistics. * p<0.1, ** p<0.05, *** p<0.01. Robust standard errors are in parentheses.
32
Table 5. Robustness tests
(1) (2) (3)
1993 to 2002 change in
log employment log payroll log wage
Panel A: Control for minimum wage
Log small business births in 1992-93 -0.0178 -0.0233 -0.00551
(0.0208) (0.0274) (0.0122) 1st stage F-statistic = 11.6
Panel B: Control for Right-to-work
Log small business births in 1992-93 -0.0157 -0.0221 -0.00643
(0.0195) (0.0259) (0.0119) 1st stage F-statistic= 12.57
Panel C: Control for past population
Log small business births in 1992-93 -0.0193 -0.0256 -0.00630
(0.0203) (0.0267) (0.0121) 1st stage F-statistic= 11.63
Panel D: Control for industry composition
Log small business births in 1992-93 -0.0192 -0.0254 -0.00621
(0.0208) (0.0270) (0.0120) 1st stage F-statistic= 11.48
Panel E: Exclude rust belt states
Log small business births in 1992-93 -0.0263 -0.0305 -0.00414
(0.0261) (0.0335) (0.0135) 1st stage F-statistic= 8.45
Base controls Y Y Y
Census division fixed effects Y Y Y Notes: Results are from the 2SLS regressions that include all four instrumental variables in column (5) of Table 4. The unit of analysis is the MSA and the number of observations is 314. The number of new SBA loans approved is for the period July 1992 to June 1993. Base controls include initial employment, median family income, population, percent college degree and above, the house price index, the number of initial establishments by the three size categories, and major road density The Kleibergen-Paap rk Wald F statistics are reported as the 1st stage F-statistics. * p<0.1, ** p<0.05, *** p<0.01. Robust standard errors are in parentheses.
33
Appendix Table 1. Year of interstate banking deregulation by state
State Year of interstate banking deregulation State Year of interstate banking
deregulation AK 1987 MT 1993 AL 1982 NC 1990 AR 1986 ND 1985 AZ 1989 NE 1987 CA 1987 NH 1986 CO 1988 NJ 1989 CT 1983 NM 1982 DE 1988 NV 1985 DC 1985 NY 1991 FL 1985 OH 1985 GA 1985 OK 1987 HI 1995 OR 1986 IA 1985 PA 1986 ID 1986 RI 1984 IL 1986 SC 1986 IN 1991 SD 1988 KS 1992 TN 1985 KY 1984 TX 1987 LA 1987 UT 1984 MA 1978 VA 1988 MD 1985 VT 1985 ME 1983 WA 1987 MI 1986 WI 1988 MN 1986 WV 1987 MO 1988 WY 1987 MS 1986
Note: Year of interstate branching collected from the St. Louis Federal Reserve publications at www.stlouisfed.org/publications.