34
MINISTRY OF FINANCE & DEVELOPMENT PLANNING FEBRUARY 2015 GOVERNMENT OF LIBERIA ANNUAL FISCAL OUTTURN REPORT FOR FISCAL YEAR 2013/2014 JULY 1, 2013 – JUNE 30, 2014

MINISTRY OF FINANCE & DEVELOPMENT PLANNING
FEBRUARY 2015
GOVERNMENT OF LIBERIA
ANNUAL FISCAL OUTTURN REPORT FOR FISCAL YEAR 2013/2014
JULY 1, 2013 – JUNE 30, 2014

FY2013/14 Annual Fiscal Outturn Report I Ministry of Finance & Development Planning
2
1
1
Given the Ministry was previously Ministry of Finance during the enactment of the Act, the Act refers to the Minister of Finance, not the
Minister of Finance and Development Planning
This document is prepared in accordance with Section 36.4 of the Public Financial Management (PFM) Act on Reporting, which requires that the Minister of Finance and Development Planning1 provides a report to the President, the National Legislature and the general public outlining the budget execution and the revenue collections.
“The Minister shall produce a consolidated quarterly report comparing budget execution and revenue collections to the estimates contained in the National Budget. This report shall be available to the President, the Legislature and the general public within forty-five (45) days of the end of the quarter” – Government of Liberia, Public Financial Management Act (2009).
Section 13.4 requires that this document outlines any use of the Contingency Fund.
“The use of funds out of the Contingency Fund shall be reported by the Minister in the next quarterly outturn covering the month(s) in which the expenditure occurred.”
Section 26.2 requires that cumulative budget reallocations be reported.
“Cumulative budget reallocations shall be reported in the quarterly fiscal outturn prepared by the Minister.”
“Fiscal data should be reported on a gross basis, distinguishing revenue, expenditure, and financing, with expenditure classified by economic, functional, and administrative category” – IMF Code of Good Practice on Fiscal Transparency.

FY2013/14 Annual Fiscal Outturn Report I Ministry of Finance & Development Planning
3
TABLE OF CONTENTS
ABBREVIATIONS ............................................................................................................................................. 4
DEFINITIONS .................................................................................................................................................. 6
EXECUTIVE SUMMARY ................................................................................................................................... 7
SECTION 1: MACROECONOMIC DEVELOPMENTS.......................................................................................... 9
SECTION 2: BUDGET FY2013/2014 .............................................................................................................. 10
MTEF PROJECTS ........................................................................................................................................... 11
MTEF PHASES .............................................................................................................................................. 13
FISCAL RULES ............................................................................................................................................... 13
MTEF BUDGET SECTORS .............................................................................................................................. 13
APPROPRIATIONS FOR FY2013/14 ............................................................................................................... 14
SECTION 3: ANNUAL PERFORMANCE AND DEVELOPMENTS ....................................................................... 20
GOVERNMENT FINANCIAL STATISTICS (GFS) ............................................................................................... 20
FLOW OF FUNDS ......................................................................................................................................... 21
REVENUE ..................................................................................................................................................... 24
FINANCING .................................................................................................................................................. 25
DONOR SUPPORT ........................................................................................................................................ 27
BUDGETARY TRANSFERS ............................................................................................................................. 29
ALLOTMENTS ............................................................................................................................................... 31
COMMITMENTS .......................................................................................................................................... 31
BUDGET EXECUTION ................................................................................................................................... 32
SECTION 4: PROJECTIONS AND CHALLENGES .............................................................................................. 34

FY2013/14 Annual Fiscal Outturn Report I Ministry of Finance & Development Planning
4
LIST OF TABLES
Table 1: Original Budgetary Appropriation (FY2013/14) in Millions USD .................................................... 15
Table 2: Revised FY2012/13 and Revised FY2013/14 National Budgets ...................................................... 16
Table 3: GFS Table, July 1, 2013 – June 30, 2014 (US$ millions) ................................................................... 20
Table 4: Annual Flow of Funds (July 1, 2013 - June 30, 2014) ....................................................................... 22
Table 5: Annual Revenue Performance for FY2013/14 ............................................................................... 24
Table 6: Treasury Bills issued (millions of L$) .............................................................................................. 26
Table 7: External Loan Disbursement Profile for FY2013/14 ....................................................................... 27
Table 8: Aid Disbursement by Type for FY2013/14 ..................................................................................... 28
Table 9: Budget Support Aid Disbursement by Agencies for FY2013/14 ..................................................... 28
Table 10: Aid Disbursement by Countries and Agencies for FY2013/14...................................................... 28
Table 11: Annual Budgetary Transfer for FY2013/14 .................................................................................. 30
Table 12: Annual Allotment per Sector and Economic classification for FY2013/14 ................................... 31
Table 13: Annual Commitment for FY2013/14 ............................................................................................ 32
Table 14: Annual Budget Execution for FY2013/14 ..................................................................................... 32
LIST OF FIGURES
Figure 1: Sectoral Distribution of the Agenda for Transformation Funding ................................................ 12
Figure 2: Comparative Analysis of Budgetary Appropriations by Sector for FY2012/13 and FY2013/14 .... 18

FY2013/14 Annual Fiscal Outturn Report I Ministry of Finance & Development Planning
5
ABBREVIATIONS
AfT Agenda for Transformation ASYCUDA Automated System for Customs Data BFP Budget Framework Paper DMU Debt Management Unit DoB Department of Budget GDP Gross Domestic Product GoL Government of Liberia GST Goods and Services Tax LPO Local Purchase Order M&As Ministries and Agencies MFDP Ministry of Finance and Development Planning MT Metric Tons MTEF Medium Term Expenditure Framework PRS-II Poverty Reduction Strategy II PSIP Public Sector Investment Plan

FY2013/14 Annual Fiscal Outturn Report I Ministry of Finance & Development Planning
6
DEFINITIONS
Allotment An authorization issued to an implementing M&A to incur obligations for specified amounts contained in a legislative appropriation.
Appropriation An authorization made by law or legislative enactment directing payment out of government funds under specified conditions or for specific purposes.
Cash Checks cashed or other payments from the consolidated account.
Cash Surplus / Deficit : Revenue minus Expenditure minus net Acquisition of Assets (capital expenditure).
Commitment Payment request processed through appropriation, allotment, and stamped with pledge of disbursement.
Net Cash from operating activities Revenue minus Expenditure (not including Capital).

FY2013/14 Annual Fiscal Outturn Report I Ministry of Finance & Development Planning
7
EXECUTIVE SUMMARY
The Liberian economy performed well in 2013 as compared to 2012, as evidenced by respective real gross domestic product (GDP) growth rates of 8.7 percent and 8.3 percent; although some domestic demand weaknesses may emerge, as demonstrated by weaker than expected revenue receipts. The growth in 2013 was driven mainly by increased activities in the mining sector, which was expected to have continued in the medium-term, in the absence of the current public health crisis, particularly with the continuous exportation of iron ore by China Union and the anticipated commencement of phase II of Arcelor Mittal’s operation, which is now delayed due to the Ebola Virus Disease (EVD) epidemic.
Over the course of 2014, the country’s real GDP is expected to decline from an earlier projection of 5.9 percent to 2.5 percent. This is due to the decelerating mining activities; decreasing activities in the productive sector; and a fall in domestic demand of the economy, occasioned by the ongoing EVD crisis.
Liberia continues to experience a relatively stable inflation rate despite the sharp depreciation of the Liberian dollar. At end-June 2014, the country’s annual headline inflation rate increased to 11.7 percent, up from 7.0 percent at end-June 2013.
Domestic food inflation at end-June 2014 stood at 6.7 percent, down from 10.5 percent at end-June 2013; while imported food inflation amounted to 11.6 percent as at end-June 2014, compared to 11.7 percent at end-June 2013.
The country’s core inflation rate (excluding food and transportation) at end-June 2014 stood at 13.0 percent, up from 3.0 percent at end-June 2013.
Over the course of 2014, inflation is projected to remain in double digits, unlike the 7.6 percent experienced in 2013. This is due to the depreciation of the Liberian dollar, which in turn is attributed to the country’s widening trade deficit.
Liberia’s current account balance (including official grants) as a percentage of GDP over the course of 2013 stood at a deficit of 34.7 percent, compared to 28.0 percent for 2012. Over the course of 2014, the current account is expected to further worsen to a deficit of 46.5 percent.
Owing to the widening trade deficit, the country’s gross official reserves in months of import coverage, which stood at 2.8 for 2013, is now projected to decline slightly to 2.6 in 2014.
Over the course of FY2013-14, the nominal exchange rate (period average) between the US dollar and the Liberian dollar came under significant pressure and depreciated by 15.8 percent, as at end-June 2014. However, the Government has instituted a number of measures to counteract the depreciation pressure. These include enhancing Liberian dollar revenues collection and working closely with the Central Bank of Liberia (CBL) to ensure that there exist prudent levels of Liberian dollar liquidity in the economy through the conduct of the regular foreign exchange auction and the issuance of monthly Treasury Bills (T-bills) and CBL bills.
For the administration of the affairs of the State for FY2013/14, the National Legislature

FY2013/14 Annual Fiscal Outturn Report I Ministry of Finance & Development Planning
8
approved a National Budget in the amount of US$582.9 million, compared to an approved amount of US$672.1 million for FY2012/13.
The approved resource envelope comprised projections of about US$434.0 million in tax revenue, US$87.9 million in non-tax revenue, US$51.2 million in grants, and US$10.0 million in on-budget borrowing. Contingent revenue and cash carry forward were zero, reflecting the conservative nature of the revenue forecast, and accounting in part for the resource envelope that fell below the approved budget for FY2012/13.
Off-budget borrowing was expected to account for an additional US$139.9 million in FY2013/14. This includes disbursements of a number of World Bank International Development Association (IDA) loan agreements, which were already in place and subject to ratification by the National Legislature; disbursement of funds under a financing agreement signed with the European Investment Bank (EIB) for the development of the Mt. Coffee hydroelectric dam; the Kuwaiti loan for port rehabilitation; and the African Development Bank (AfDB) and International Fund for Agricultural Development (IFAD) loans related to the small tree crops revitalization program.
As at end-June 2014, the actual core revenue (excluding domestic borrowing under the T-bill program) collected for FY2013/14 amounted to US$506.9 million, representing 86.95 percent of the approved resource envelope; while grand total revenue (inclusive of borrowings) amounted to US$517.2 million. Of the realized core revenue, tax revenues account for 78.1 percent, while non-tax revenues and grants account for 14.7 percent and 7.2 percent, respectively. Of the realized grand total revenue, tax revenues account for 75.7 percent, while non-tax revenues, grants and borrowings respectively accounted for 14.3 percent, 7.0 percent and 3.0 percent. The actual core revenue collected during the period represented a revenue shortfall of US$66.0 million with respect to the original revenue projection of US$572.9 million (excluding US$10.0 million borrowing).
Actual tax revenue for the period was US$395.9 million, which is US$37.9 million below the original projected amount of US$433.8 million, but US$22.9 million above the revised year-end projection of US$373.0 million. The underperformance of the original projections was due largely to the low performance of the income, goods and services, and international trade tax lines. The latter were driven mainly by weaker-than-expected domestic demand which resulted in less consumption of goods and services, including duty-paid imports. The income tax line has been affected particularly by low tax collection on non-residents’ incomes, likely reflecting less foreign business activity.
Actual non-tax revenue for the period under review amounted to US$74.6 million; this is US$13.3 million below the originally projected year-end amount of US$87.9 million, but US$5.1 million above the revised year-end projection of US$69.5 million. The non-tax revenue shortfalls resulted from poor forestry royalties/rents, and from the slightly weak performance of administrative fees. Property income related to minerals also performed worse than expected; with a deficit of US$5.5 million; followed by administrative fees, with a deficit of US$4.9 million; and fines, penalties and forfeits, with a deficit of US$2.9 million, among others.
On-budget support grant realized from foreign governments and international organizations was US$36.4 million, US$14.8 million less than the original year-end projection of US$51.2 million,

FY2013/14 Annual Fiscal Outturn Report I Ministry of Finance & Development Planning
9
and also US$7.2 million less than the revised year-end projection of US$43.6 million. Grants received from foreign governments and from international organizations amounted to US$25.8 million and US$10.6 million respectively, representing 70.9 percent and 29.1 percent respectively of the total grant outturn;
Execution of FY2013/14 approved National Budget faced challenges related to the late passage of the budget and the activation of the 1/12th rule during the first quarter. However, execution remained strong withUS$518.6 million (89.0 percent of appropriations) of the US$582.9 million national budget allotted, while Government expenditure on commitment basis was US$530.6 million. By economic classifications, capital expenditure, compensation of employees, use of goods and services, grants and social benefits saw particularly high execution rates, respectively representing about 518 percent, 98 percent, 104 percent, 90.6 percent and 100 percent of disbursement of their adjusted annual appropriations;
Total public debt, comprising both external and domestic debt for the period under review, increased by US$67.61 million, from US$580.59 million on July 1, 2013 to US$648.20 million at June 30, 2014, thus representing an increase of 11.65 percent; of the total debt, external debt accounts for US$354.65 million (54.7 percent) while domestic debt accounts for US$293.55 million (45.3 percent). This increase is due to disbursements of the EIB loan, the World Bank International Development Association (IDA), IMF credits, EcoBank HFO loan as well as interest payment on T-bills issuances and exchange rate adjustments;
Total debt service (interest payments to the Central Bank of Liberia, GoL's subscription to the World Bank Group and redemption of T-bills) during the period under review amounted to US$30.86 million compared to US$47.54 million at end June 2013, representing a 35.08 percent decrease of previous year payment;
Of the total debt service, domestic debt service as at June 30, 2014 amounted to US$23.40 million (of which principal repayment amounted to US$19.87 million while interest payment amounted to US$3.53 million) compared to US$40.45 million as at June 30, 2013 (of which principal repayment amounted to US$37.05 million while interest payment amounted to US$3.4 million).
The total external debt service as at June 30, 2014 amounted to US$7.46 million (of which principal repayment amounted to US$5.58 million while interest payment amounted to US$1.88 million) compared to US$7.09 million for the same period in 2013 (of which principal repayment amounted to US$5.39 million while interest payment amounted to US$1.69 million).
SECTION 1: MACRO ECONOMIC DEVELOPMENTS Liberia's economic performance in 2013 continued to register a strong and sustained growth as compared to 2012, but with a dim outlook for 2014. Over the course of 2013, Liberia’s Gross Domestic Product (GDP) grew at 8.7 percent, up from 8.3 percent in 2012, while growth for 2014 is projected at 5.9 percent; but due to the EVD epidemic, which has paralyzed most economic activities, the growth has been revised to 2.5 percent.
The growth in 2013 was driven mainly by the expansion of activities within the mining sector,

FY2013/14 Annual Fiscal Outturn Report I Ministry of Finance & Development Planning
10
which has contributed to an increase in activities within the construction and services sectors. The mining sector accounted for 10 percent of GDP; agriculture and forestry accounted for 35 percent; the services sector contributed 42 percent; and the industrial and manufacturing sector contributed 13 percent to the GDP.
Liberia continues to experience a relatively stable inflation rate, despite the sharp depreciation of the Liberian dollar. At end-June 2014, the country’s annual headline inflation rate increased to 11.7 percent, up from 7 percent at end-June 2013. The country’s core inflation rate (excluding food and transportation) at end-June 2014 stood at 13 percent, up from 3 percent at end-June 2013.
Domestic food inflation at end-June 2014 stood at 6.7 percent, down from 10.5 percent, at end-June 2013. Imported food inflation, on the other hand, amounted to 11.6 percent as at end-June 2014, as compared to 11.7 percent at end-June 2013;
With respect to the country’s economic transactions with the rest of the world, for the period under review, Liberia’s current account balance (including official grants) as a percentage of GDP amounted to a deficit of 34.7 percent, as compared to a deficit of 28.0 percent for 2012. The country’s current account is projected to deteriorate further in 2014 to a deficit of 46.5 percent, and then improve strongly based on the 2015 and 2016 projection registering a deficit of 35.4 percent and 21.5 percent of GDP for 2015 and 2016, respectively.
Over the course of FY2013-14, the nominal exchange rate (end-of-period average) between the US dollar and the Liberian dollar came under great pressure and depreciated by 15.8 percent as at end-June 2014. The depreciation pressures can be attributed in part to structural features of the Liberian economy, including the worsening current account deficit.
However, the Government has instituted a number of measures to counteract the depreciation pressures, including enhancing Liberian dollar revenues collection, and is working closely with the Central Bank of Liberia to ensure that there exist prudent levels of Liberian dollar liquidity in the economy, through the conduct of regular foreign exchange auctions and the issuance of monthly T-bills and CBL bills.
SECTION 2: BUDGET FY2013/2014
The Government of Liberia is committed to a strong, transparent and efficient budgetary process. Fiscal Year 2013/14 marked the second year of the use of the Medium Term Expenditure Framework (MTEF) budgeting process. The MTEF covers a period of three fiscal years (FY2012/2013 up to FY2014/2015), and contains a three-year revenue outlook and expenditure plan, which is revised at the end of every fiscal year.
The revision process allows resources to be reallocated based on priorities that are aligned with the country’s national development goals and objectives, as set out in the Agenda for Transformation (AfT). This makes the budget more predictable, the coverage more comprehensive, and the use of resources more transparent for the achievement of measurable

FY2013/14 Annual Fiscal Outturn Report I Ministry of Finance & Development Planning
11
results.
PUBLIC SECTOR INVESTMENT PROGRAM The MTEF budget is the manifestation of the GOL’s vision for achieving economic growth and development, focusing on people, products and processes. These constitute the key drivers of investment in critically needed infrastructures and programs, which are necessary to ensure that the economic recovery continues to create jobs and improve social and economic welfare in Liberia. These investments are in two categories:
A. National High Level Projects: These are national priorities that have been identified as critical to achieving the goals and objectives of the AfT:
Priority 1: Ports, Energy, Transport and Technology (PETT Projects) – specifically, the rehabilitation of the Mount Coffee Hydroelectric Dam, the West African Power Pool (WAPP), the development and maintenance of major roads, and the installation of the fiber optic back bone in Liberia.
Priority 2: Youth empowerment – to create jobs through gainful employment; Priority 3: Capacity Development – in line with the National Capacity Development
Strategy;
Priority 4: Reconciliation Fund – to promote national unity among Liberians;
Priority 5: Health – to support the programs of the Ministry of Health;
Priority 6: Education – to enhance education levels and develop human resource capacity;
Priority 7: United Nations Mission in Liberia (UNMIL) drawdown – to ensure that national security is strengthened;
Priority 8: Water Sanitation and Hygiene (WASH) – supporting access to clean water and sanitation facilities;
Priority 9: Agriculture – promoting agricultural rehabilitation for smallholder farmers and rural entrepreneurs; and
Priority 10: Economic enhancement fund – providing support for foreign direct investment and activities that promote economic growth and poverty reduction.
B. Sector Level Investment Projects: M&As’ activities programmed at the sector level, which must align with the AfT and meet its specific objectives, in order to:
Maintain financial stability and sustainability;
Promote equitable access to infrastructure and basic services;
Improve the standard of living for all Liberians; and
Facilitate economic development and inclusive growth.
Sector-level projects are selected based on socioeconomic returns, such as their impact on job

FY2013/14 Annual Fiscal Outturn Report I Ministry of Finance & Development Planning
12
creation and revenue generation; their contribution to public goods; their contribution to sector goals, consistent with the AfT; and the geographical distribution of projects.
Figure 1: Sectoral Distribution of the Agenda for Transformation Funding

13
STAGES OF THE MTEF BUDGET PROCESS
The implementation of the MTEF has led to fundamental changes in the budgeting process and structure, with the introduction of the following phases:
The Strategic Phase – occurs early in the budget preparation process, when high level decisions are made linking resources to priorities in line with resource availability. Ideally priorities are based on the AfT; and
The Operational Phase – where M&As prepare detailed budget estimates, in line with ceilings.
FISCAL RULES The fiscal rules governing the current MTEF budget were initially set out in the Budget Framework Paper of FY2012/2013 and confirmed again for FY2013/14.
The borrowing related fiscal rules are designed to ensure fiscal sustainability and that debt vulnerabilities do not undermine economic development. These rules require that:
All borrowing is undertaken for the purposes of investment, consistent with the Public Sector Investment Plan (PSIP);
Total debt stock does not exceed 60 percent of the previous calendar year’s GDP, as contained in the Public Financial Management (PFM) Regulations; and
Prior to undertaking new borrowing, a Debt Sustainability Analysis (DSA) is conducted and presented to the Debt Management Committee (DMC), to ensure that debt rules are not breached;
The expenditure related fiscal rules are designed to ensure that government expenditure has a strong positive impact on the economy and empowers Liberian businesses. These rules include the following:
Expenditure in the national budget on capital should constitute 25%, of which at least 10 percent should be expenditure on the energy sector;
Expenditures in the national budget on personnel costs will not exceed 34 percent;
Liberian owned businesses should absorb at least 25 percent of GOL spending on Goods and Services;
Capable local manufacturers should absorb at least 25 percent of GOL spending on furniture;
Transfers from M&As’ investment appropriations in a given year, to recurrent budget lines, will not exceed 5 percent; and
Administrative overheads will not exceed 15 percent of appropriations for capital projects.
MTEF BUDGET SECTORS

14
A key objective of we MTEF is to align the budget with development plans. To ensure this alignment at the sector level, sectors in the budget were mapped to pillars and sub-pillars in the Agenda for Transformation, resulting in eleven (11) budget sectors. Sectors are composed of Ministries and Agencies (M&As) that carry out similar functions. Each M&A is structured to manage a range of policy areas through its administrative departments, which design and manage projects. The MTEF budget therefore, is divided into the following sectors:
Municipal Government Public Administration Transparency & Accountability Security and the Rule of Law Health Social Development Services
Education Energy and Environment Agriculture Infrastructure and Basic Services Industry and Commerce
APPROPRIATIONS FOR FY2013/14
The Executive Branch of Government submitted a draft budget of US$553,262,000.00 to the National Legislature for approval for fiscal year 2013/2014. However, the amount was increased by US$29,669,413.00 (5.09 percent); therefore, a resource envelope of US$582.9 million was approved for FY2013/2014, compared to an approved budget of US$672.1 for FY2012/2013 and a final outturn of about US$554.0 million.
Although higher than the FY2012/13 outturn, the approved FY2013/14 budget fell below the previous year’s approved national budget. The lower FY2013/2014 resource envelope was due to a conservative revenue forecast, which assumed zero (risky) contingent revenue, zero carry forward (of revenue) from the previous fiscal year, and a projection of only US$10 million of on-budget borrowings for the period.
The intent of restructuring the GOL resource envelope was to manage the expectations of Ministries and Agencies, in light of the removal of revenue streams that are at a high risk of non-performance. The revenue performance during FY2012/13 highlights the importance of realistic projections: during the year, the projection for borrowing and contingent revenue was revised downwards, and final outturns were below the original budget projections, which in turn affected the spending of M&As.
The eleven sectors introduced in the FY2012/13 budget were maintained. However, upon approval, the budget was revised to capture adjustments made by the National Legislature on the revenue and expenditure sides.
Table 1 shows the breakdown of appropriations in the original FY2013/14 National Budget, both by sector and by economic classification, compared to aggregate appropriation by economic classification for the FY2012/13 budget.

15
Table 1: Original Budgetary Appropriation (FY2013/14) in Millions USD
Source: FY2012/13 and Revised FY2013/14 National Budgets
Analysis
FY1
3/1
4
Compensation of employees
Use of goods and
services
Capital Spending
Interest Subsidies Grants Social
benefits Unspecified/
PSIP Total
% share
FY12/13 ∆ (%)
Agriculture 3.2 3.1 0.0 - - 0.4 - 1.5 8.2 1.4 2.2 -35.3
Education 41.6 5.5 0.4 - - 22.0 - 6.8 76.2 13.1 11.6 12.6
Energy and Environment 5.2 3.2 0.1 - - 21.3 - 3.1 32.9 5.6 9.7 -41.6
Health 23.8 6.8 0.0 - - 38.3 - 0.0 68.9 11.8 10.5 12.7
Industry and Commerce 6.9 11.2 0.3 - - 1.9 - 0.7 20.9 3.6 5.2 -31.5 Infrastructure and Basic Services
6.1 3.7 4.9 - - 3.4 - 11.9 30.0 5.1 11.6 -55.8
Municipal Government 9.2 2.1 - - - 18.4 - 2.2 31.9 5.5 4.9 11.5
Public Administration 61.6 69.2 0.4 - - 34.3 1.3 19.7 186.4 32.0 26.3 21.5 Security and Rule of Law 48.4 21.0 1.0 - - 6.6 - 6.0 83.1 14.2 12.1 18.0
Social Development Services
2.1 3.1 0.0 - - 17.6 - 1.3 24.0 4.1 3.0 39.4
Transparency and Accountability
12.5 3.8 0.0 - - 4.1 - 0.1 20.5 3.5 3.0 18.2
Total 220.5 132.7 7.1 - - 168.2 1.3 53.2 582.9 100.0 100.0 0.0
FY
12
/13
Total 194.1 131.1 6.1 - - 103.3 1.5 236.0 672.1
FY13/14 (% of Appropriation) 37.8% 22.8% 1.2% 0.0% 0.0% 28.9% 0.2% 9.1% 100%
FY12/13 (% of Appropriation) 28.9% 19.5% 0.9% 0.0% 0.0% 15.4% 0.2% 35.1% 100%
∆ (%) 13.6% 1.2% 15.7% 62.9% -13.3% -77.5% -13.3%

16
However, following the passage of the National Budget, a revision process was undertaken to align the National Budget with the development priorities contained in the AfT. The proceeding analyses are based on the revised FY2013/2014 budget as contained in Table 2.
Table 2: Revised FY2012/13 and Revised FY2013/14 National Budgets
Compensation of
employees Use of goods and services
Capital Spending
Interest Subsidies Grants Social
benefits PSIP Total
% share
FY12/13 ∆ (%)
FY1
3/1
4
Agriculture 3.1 3.1 0.1 - - 0.1 - 0.5 7.0 1.2 2.2 -44.1
Education 39.8 7.0 0.3 - - 25.3 - 0.7 73.1 12.5 11.6 8.0
Energy and Environment 5.1 3.6 0.4 - - 1.2 - 18.5 28.8 4.9 9.7 -48.9
Health 19.8 7.2 0.3 - - 28.0 - 11.0 66.2 11.4 10.5 8.3
Industry and Commerce 5.8 11.3 0.1 - - 2.2 - 1.1 20.4 3.5 5.2 -33.0
Infrastructure and Basic Services
5.8 4.3 0.6 - - 2.0 - 21.1 33.8 5.8 11.6 -50.1
Municipal Government 9.2 2.7 0.1 - - 18.0 - 1.2 31.2 5.3 4.9 8.8
Public Administration 61.9 64.8 1.4 19.6 - 38.3 1.1 11.5 198.6 34.1 26.3 29.4
Security and Rule of Law 44.3 29.9 1.6 - - 2.5 - 5.2 83.5 14.3 12.1 18.6
Social Development Services 2.1 2.2 0.0 - - 4.0 - 4.2 12.4 2.1 3.0 -27.7
Transparency and Accountability
13.3 14.5 0.0 - - 0.0 - 0.0 27.8 4.8 3.0 60.4
Total - FY2013/14 210.1 150.6 4.8 19.6 - 121.7 1.1 75.1 582.9 100.0 100.0 0.0
FY1
2/1
3
Total- FY 2012/13 194.1 131.1 6.1 - - 103.3 1.5 236.0 672.1
FY13/14 (% of Appropriation) 36.0% 25.8% 0.8% 3.4% 0.0% 20.9% 0.2% 12.9% 100%
FY12/13 (% of Appropriation) 28.9% 19.5% 0.9% 0.0% 0.0% 15.4% 0.2% 35.1% 100%
∆ (%) 8.2% 14.9% -21.4%
17.8% -28.4% -68.2% -13.3%
Source: FY2012/13 and Revised FY2013/14 National Budgets

17
The projected GOL wage bill for FY2013/2014 accounted for 36.0 percent of the budget, compared to about 28.9 percent of the FY2012/2013 budget—reflecting an increase of 8.2 percent. However, an effort to automate the GOL Civil Servant Payroll by the issuance of biometric identification cards is ongoing; this is expected to aid the process to clean up the GOL payroll, and further reduce the GOL’s personnel costs.
Based on the quarterly PFM report, the coming online of the Integrated Financial Management Information System (IFMIS) and the Civil Service Management (CSM) Module to capture all Liberian Dollar salary payments, led to the removal of two thousand (2,000) individuals (assumed to be ghost employees) from the payroll, as at end March 2014. The report further revealed that an additional one thousand two hundred (1,200) employees were also deleted from the payroll because they were receiving salaries under the names of employees found off the payroll. It is, therefore, anticipated that a reduction in personnel costs will, over time, free up resources that can be invested in capital projects with high rates of return to the economy.
For the period under review, appropriation for capital expenditure in FY2013/14 (excluding PSIP-related capital expenditure) amounted to US$4.8 million (0.8 percent of total budgetary appropriation), compared to US$6.1 million (0.9 percent of appropriation) for FY2012/2013.
Appropriations for the use of goods and services accounted for 25.8 percent of the revised FY2013/2014 national budget, compared to 19.5 percent of the FY2012/2013 budget, indicating an increase of 14.9 percent above the previous year’s appropriation.
Appropriations for the provision of grants to spending agencies accounted for 20.9 percent of the revised FY2013/2014 budget, an increase of 17.8 percent above the previous fiscal year’s budget.
Based on economic classification, appropriations for PSIP constituted about 12.9 percent of the revised budget, compared to 35.1 percent of the FY2012/2013 budget, representing a decrease of 68.2 percent. Appropriation for social benefit showed a decline of about 28.4 percent between FY2012/2013 and FY2013/2014.
Figure 2 provides a comparative analysis of budgetary appropriations for FY2012/13 and FY2013/14. Of the eleven sectors contained in the national budget, appropriations for Public Administration for FY2013/14 accounted for 34.1 percent compared to 26.3 percent of the previous fiscal year budget, representing an increase of about 29.4 percent.

18
Figure 2: Comparative Analysis of Budgetary Appropriations by Sector for FY2012/13 and FY2013/14
Source: FY2012/13 and Revised FY2013/14 National Budget
Appropriation for Security and the Rule of Law for FY2013/14 accounted for 14.3 percent, as compared to 12.1 percent of the previous fiscal year’s budget, representing an increase of about 18.6 percent.
Appropriation for Infrastructure and Basic Services for FY2013/14 accounted for 5.8 percent, as compared to 11.6 percent of the previous fiscal year’s budget; a decrease of about 50.1 percent.
Appropriation for Education for FY2013/14 accounted for 12.5 percent compared to 11.6 percent of the previous fiscal year’s budget; an increase of about 8 percent.
Appropriation for Health for FY2013/14 accounted for 11.4 percent, as compared to 10.5 percent of the previous fiscal year’s budget; an increase of about 8.3 percent.
Appropriation for Agriculture for FY2013/14 accounted for 1.2 percent, as compared to 2.2 percent of the previous fiscal year’s budget; a decrease of about 44.1 percent.
Appropriation for Energy and Environment for FY2013/14 accounted for 4.9 percent| as compared to 9.7 percent of the previous fiscal year’s budget; a decrease of about 48.9 percent.
Appropriation for Industry and Commerce for FY2013/14 accounted for 3.5 percent; as compared to 5.2 percent of the previous fiscal year budget; a decrease of about 33.0 percent.
Appropriation for Municipal Government for FY2013/14 accounted for 5.3 percent, as compared to 4.9 percent of the previous fiscal year’s budget; an increase of about 8.8 percent.
Appropriation for Social Development Services for FY2013/14 accounted for 2.1 percent, as compared to 3.0 percent of the previous fiscal year’s budget; a decrease of about 27.7 percent.

19
Appropriation for Transparency and Accountability for FY2013/14 accounted for 4.8 percent, as compared to 3.0 percent of the previous fiscal year’s budget; an increase of about 60.4 percent.
20
SECTION 3: ANNUAL PERFORMANCE AND DEVELOPMENTS The main objective of this section is to provide information on the status of revenue collection and budget execution from the passage of the National Budget covering the period July 1, 2013 up to June 30, 2014.
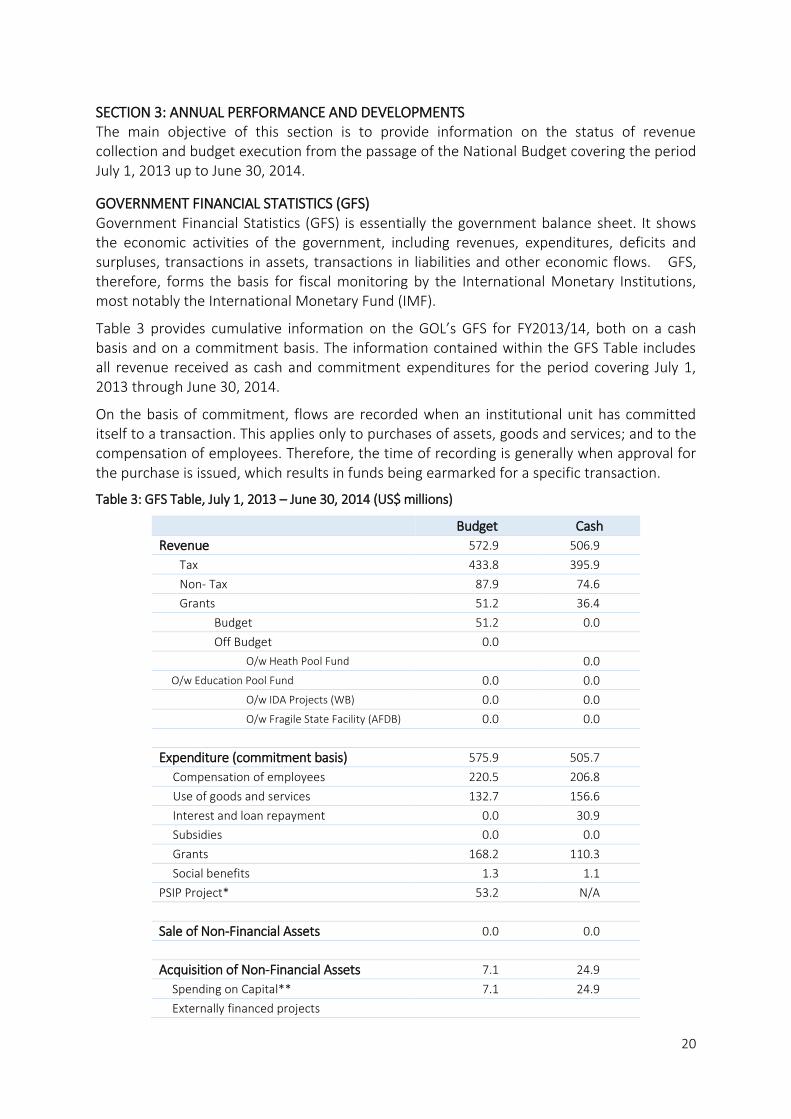
GOVERNMENT FINANCIAL STATISTICS (GFS) Government Financial Statistics (GFS) is essentially the government balance sheet. It shows the economic activities of the government, including revenues, expenditures, deficits and surpluses, transactions in assets, transactions in liabilities and other economic flows. GFS, therefore, forms the basis for fiscal monitoring by the International Monetary Institutions, most notably the International Monetary Fund (IMF).
Table 3 provides cumulative information on the GOL’s GFS for FY2013/14, both on a cash basis and on a commitment basis. The information contained within the GFS Table includes all revenue received as cash and commitment expenditures for the period covering July 1, 2013 through June 30, 2014.
On the basis of commitment, flows are recorded when an institutional unit has committed itself to a transaction. This applies only to purchases of assets, goods and services; and to the compensation of employees. Therefore, the time of recording is generally when approval for the purchase is issued, which results in funds being earmarked for a specific transaction.
Table 3: GFS Table, July 1, 2013 – June 30, 2014 (US$ millions)
Budget Cash
Revenue 572.9 506.9
Tax 433.8 395.9
Non- Tax 87.9 74.6
Grants 51.2 36.4
Budget 51.2 0.0
Off Budget 0.0
O/w Heath Pool Fund
0.0
O/w Education Pool Fund 0.0 0.0
O/w IDA Projects (WB) 0.0 0.0
O/w Fragile State Facility (AFDB) 0.0 0.0
Expenditure (commitment basis) 575.9 505.7
Compensation of employees 220.5 206.8
Use of goods and services 132.7 156.6
Interest and loan repayment 0.0 30.9
Subsidies 0.0 0.0
Grants 168.2 110.3
Social benefits 1.3 1.1
PSIP Project* 53.2 N/A
Sale of Non-Financial Assets 0.0 0.0
Acquisition of Non-Financial Assets 7.1 24.9
Spending on Capital** 7.1 24.9
Externally financed projects

21
O/w IDA Capital 0.0 0.0
O/w IFAD 0.0 0.0
O/w EIB 0.0 0.0
Net Cash from operating activities -2.9 1.1
Cash Surplus/Deficit -10.0 -23.8
Financing 10.0 -13.5
Accounts Cash to (-)/from (+) 0.0 -10.3
Amortization 0.0 0.0
Domestic Borrowing 0.0 0.0
Foreign Borrowing 10.0 10.3
O/w IDA Capital 10.0 0.0
O/w IFAD 0.0 0.0
O/w EIB 0.0 0.0
Source: Departments of the Ministry of Finance & Development Planning
*PSIP projects is not strictly a GFS expenditure classification, but is used here as some appropriations are not classified until the point of execution.
**Similarly, some capital spending is not classified until the point of execution and therefore appears low here.
An analysis of Table 3 revealed that revenue collected during the period under review (excluding borrowing) amounted to US$506.9 million, of which US$505.7 million was committed towards recurrent expenditures and debt service.
For the period under consideration, a total of US$24.9 million was committed towards capital expenditures. With a total borrowing of US$10.35 million and total realized non-borrowing revenue of US$506.9 million, total government receipt for the period amounted to US$517.2 million against a total expenditure outlay of US$530.6 million, resulting in a deficit of US$13.45 million
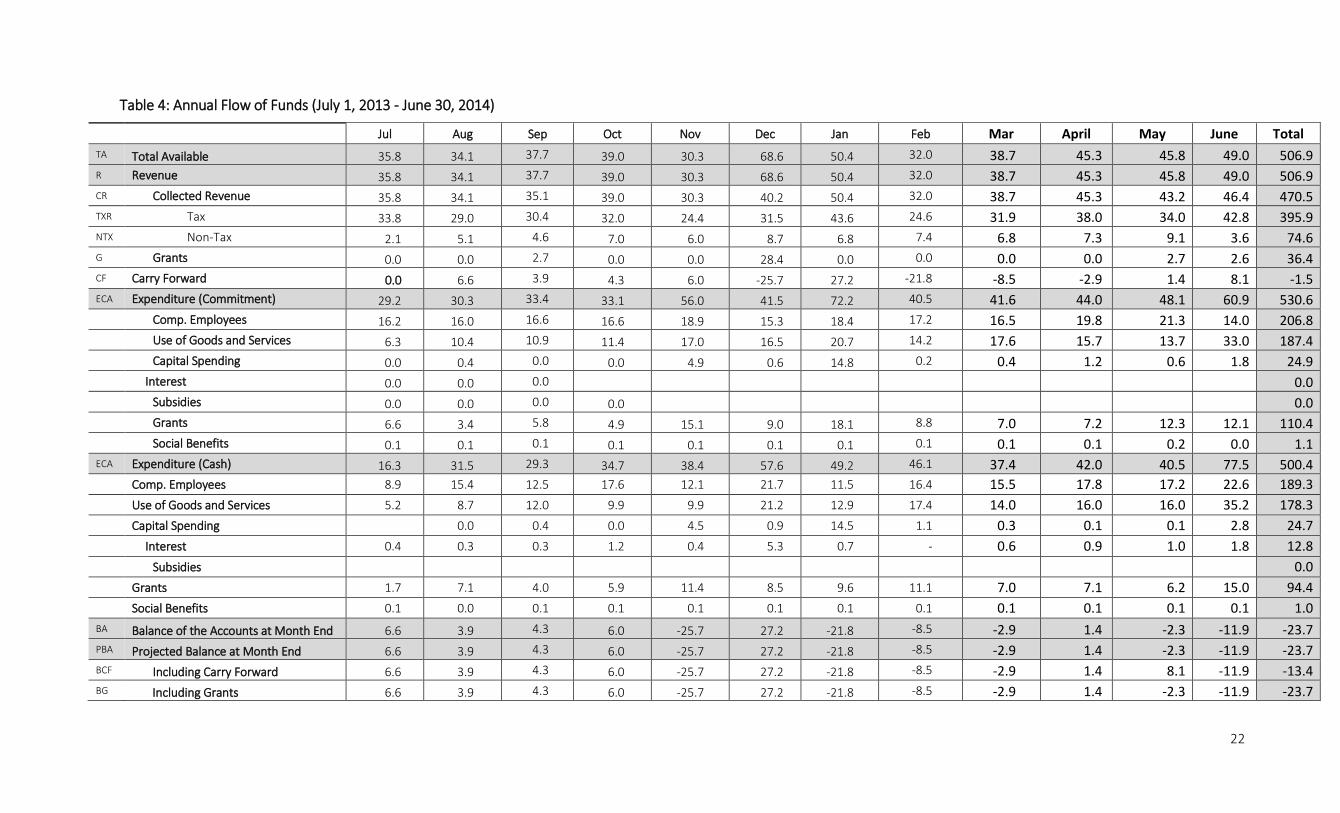
FLOW OF FUNDS In analyzing public finances, it is important to understand the flow of financial resources. A flow is the change in a stock at specific time intervals. The Flow of Funds table describes financial flows within the public sector; that is, how revenues finance expenditures. Table 4 shows the Flow-of-Funds, on a cash basis (i.e. changes in amounts in the government’s consolidated account), for the public sector from July 1, 2013 – June 30, 2014.
22
Table 4: Annual Flow of Funds (July 1, 2013 - June 30, 2014)
Jul Aug Sep Oct Nov Dec Jan Feb Mar April May June Total
TA Total Available 35.8 34.1 37.7 39.0 30.3 68.6 50.4 32.0 38.7 45.3 45.8 49.0 506.9 R Revenue 35.8 34.1 37.7 39.0 30.3 68.6 50.4 32.0 38.7 45.3 45.8 49.0 506.9
CR Collected Revenue 35.8 34.1 35.1 39.0 30.3 40.2 50.4 32.0 38.7 45.3 43.2 46.4 470.5 TXR Tax 33.8 29.0 30.4 32.0 24.4 31.5 43.6 24.6 31.9 38.0 34.0 42.8 395.9
NTX Non-Tax 2.1 5.1 4.6 7.0 6.0 8.7 6.8 7.4 6.8 7.3 9.1 3.6 74.6
G Grants 0.0 0.0 2.7 0.0 0.0 28.4 0.0 0.0 0.0 0.0 2.7 2.6 36.4 CF Carry Forward 0.0 6.6 3.9 4.3 6.0 -25.7 27.2 -21.8 -8.5 -2.9 1.4 8.1 -1.5 ECA Expenditure (Commitment) 29.2 30.3 33.4 33.1 56.0 41.5 72.2 40.5 41.6 44.0 48.1 60.9 530.6
Comp. Employees 16.2 16.0 16.6 16.6 18.9 15.3 18.4 17.2 16.5 19.8 21.3 14.0 206.8
Use of Goods and Services 6.3 10.4 10.9 11.4 17.0 16.5 20.7 14.2 17.6 15.7 13.7 33.0 187.4 Capital Spending 0.0 0.4 0.0 0.0 4.9 0.6 14.8 0.2 0.4 1.2 0.6 1.8 24.9
Interest 0.0 0.0 0.0 0.0 Subsidies 0.0 0.0 0.0 0.0 0.0
Grants 6.6 3.4 5.8 4.9 15.1 9.0 18.1 8.8 7.0 7.2 12.3 12.1 110.4 Social Benefits 0.1 0.1 0.1 0.1 0.1 0.1 0.1 0.1 0.1 0.1 0.2 0.0 1.1
ECA Expenditure (Cash) 16.3 31.5 29.3 34.7 38.4 57.6 49.2 46.1 37.4 42.0 40.5 77.5 500.4
Comp. Employees 8.9 15.4 12.5 17.6 12.1 21.7 11.5 16.4 15.5 17.8 17.2 22.6 189.3
Use of Goods and Services 5.2 8.7 12.0 9.9 9.9 21.2 12.9 17.4 14.0 16.0 16.0 35.2 178.3
Capital Spending
0.0 0.4 0.0 4.5 0.9 14.5 1.1 0.3 0.1 0.1 2.8 24.7
Interest 0.4 0.3 0.3 1.2 0.4 5.3 0.7 - 0.6 0.9 1.0 1.8 12.8
Subsidies
0.0
Grants 1.7 7.1 4.0 5.9 11.4 8.5 9.6 11.1 7.0 7.1 6.2 15.0 94.4
Social Benefits 0.1 0.0 0.1 0.1 0.1 0.1 0.1 0.1 0.1 0.1 0.1 0.1 1.0
BA Balance of the Accounts at Month End 6.6 3.9 4.3 6.0 -25.7 27.2 -21.8 -8.5 -2.9 1.4 -2.3 -11.9 -23.7 PBA Projected Balance at Month End 6.6 3.9 4.3 6.0 -25.7 27.2 -21.8 -8.5 -2.9 1.4 -2.3 -11.9 -23.7
BCF Including Carry Forward 6.6 3.9 4.3 6.0 -25.7 27.2 -21.8 -8.5 -2.9 1.4 8.1 -11.9 -13.4 BG Including Grants 6.6 3.9 4.3 6.0 -25.7 27.2 -21.8 -8.5 -2.9 1.4 -2.3 -11.9 -23.7

23
BWG Excluding Grants 6.6 3.9 1.7 6.0 -25.7 -1.3 -21.8 -8.5 -2.9 1.4 -4.9 -14.5 -60.1 Financing 0.0 0.0 0.0 0.0 -25.7 0.0 -21.8 -8.5 -2.9 0.0 -2.3 -11.9 -23.7
FR Required 0.0 0.0 0.0 0.0 -25.7 0.0 -21.8 -8.5 -2.9 0.0 -2.3 -11.9 -23.7 FI Amortization FI Identified 0.0 0.0 0.0 0.0 0.0 0.0 0.0 0.0 0.0 0.0 10.3 0.0 10.3
Account 0.0 0.0 0.0 0.0 0.0 0.0 0.0 0.0 0.0 0.0 0.0 0.0 0.0
Commercial 0.0 0.0 0.0 0.0 0.0 0.0 0.0 0.0 0.0 0.0 0.0 0.0 0.0
Concessional 0.0 0.0 0.0 0.0 0.0 0.0 0.0 0.0 0.0 0.0 10.3 0.0 10.3
T-Bills 0.0 0.0 0.0 0.0 0.0 0.0 0.0 0.0 0.0 0.0 0.0 0.0 0.0
CBL 0.0 0.0 0.0 0.0 0.0 0.0 0.0 0.0 0.0 0.0 0.0 0.0 0.0
Source: Departments of the Ministry of Finance & Development Planning
24
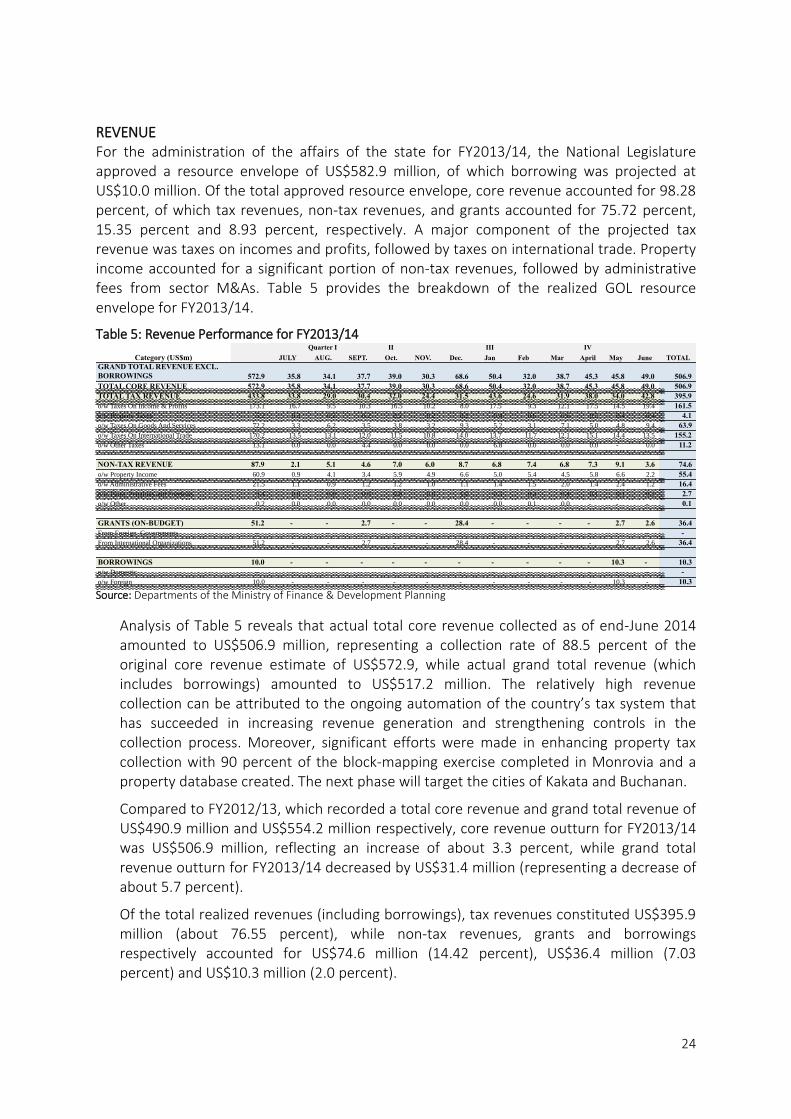
REVENUE For the administration of the affairs of the state for FY2013/14, the National Legislature approved a resource envelope of US$582.9 million, of which borrowing was projected at US$10.0 million. Of the total approved resource envelope, core revenue accounted for 98.28 percent, of which tax revenues, non-tax revenues, and grants accounted for 75.72 percent, 15.35 percent and 8.93 percent, respectively. A major component of the projected tax revenue was taxes on incomes and profits, followed by taxes on international trade. Property income accounted for a significant portion of non-tax revenues, followed by administrative fees from sector M&As. Table 5 provides the breakdown of the realized GOL resource envelope for FY2013/14.
Table 5: Revenue Performance for FY2013/14
Source: Departments of the Ministry of Finance & Development Planning
Analysis of Table 5 reveals that actual total core revenue collected as of end-June 2014 amounted to US$506.9 million, representing a collection rate of 88.5 percent of the original core revenue estimate of US$572.9, while actual grand total revenue (which includes borrowings) amounted to US$517.2 million. The relatively high revenue collection can be attributed to the ongoing automation of the country’s tax system that has succeeded in increasing revenue generation and strengthening controls in the collection process. Moreover, significant efforts were made in enhancing property tax collection with 90 percent of the block-mapping exercise completed in Monrovia and a property database created. The next phase will target the cities of Kakata and Buchanan.
Compared to FY2012/13, which recorded a total core revenue and grand total revenue of US$490.9 million and US$554.2 million respectively, core revenue outturn for FY2013/14 was US$506.9 million, reflecting an increase of about 3.3 percent, while grand total revenue outturn for FY2013/14 decreased by US$31.4 million (representing a decrease of about 5.7 percent).
Of the total realized revenues (including borrowings), tax revenues constituted US$395.9 million (about 76.55 percent), while non-tax revenues, grants and borrowings respectively accounted for US$74.6 million (14.42 percent), US$36.4 million (7.03 percent) and US$10.3 million (2.0 percent).
Quarter I
Quarter
II
Quarter
III
Quarter
IV
JULY AUG. SEPT. Oct. NOV. Dec. Jan Feb Mar April May June TOTAL
GRAND TOTAL REVENUE EXCL.
BORROWINGS 572.9 35.8 34.1 37.7 39.0 30.3 68.6 50.4 32.0 38.7 45.3 45.8 49.0 506.9
TOTAL CORE REVENUE 572.9 35.8 34.1 37.7 39.0 30.3 68.6 50.4 32.0 38.7 45.3 45.8 49.0 506.9
TOTAL TAX REVENUE 433.8 33.8 29.0 30.4 32.0 24.4 31.5 43.6 24.6 31.9 38.0 34.0 42.8 395.9
o/w Taxes On Income & Profits 173.1 16.7 9.5 10.3 16.5 10.2 8.0 17.5 9.3 12.1 17.5 14.5 19.4 161.5
o/w Property Taxes 5.2 0.3 0.2 0.2 0.2 0.2 0.2 0.4 0.6 0.6 0.5 0.4 0.4 4.1
o/w Taxes On Goods And Services 72.2 3.3 6.2 3.5 3.8 3.2 9.3 5.2 3.1 7.1 5.0 4.8 9.4 63.9
o/w Taxes On International Trade 170.2 13.5 13.1 12.0 11.5 10.8 14.0 13.7 11.7 12.1 15.1 14.4 13.5 155.2
o/w Other Taxes 13.1 0.0 0.0 4.4 0.0 0.0 0.0 6.8 0.0 0.0 0.0 - 0.0 11.2
NON-TAX REVENUE 87.9 2.1 5.1 4.6 7.0 6.0 8.7 6.8 7.4 6.8 7.3 9.1 3.6 74.6
o/w Property Income 60.9 0.9 4.1 3.4 5.9 4.9 6.6 5.0 5.4 4.5 5.8 6.6 2.2 55.4
o/w Administrative Fees 21.5 1.1 0.9 1.2 1.2 1.0 1.1 1.4 1.5 2.0 1.4 2.4 1.2 16.4
o/w Fines, Penalties and Forefeits 5.4 0.0 0.0 0.0 0.0 0.0 1.0 0.3 0.4 0.4 0.1 0.1 0.2 2.7
o/w Other 0.2 0.0 0.0 0.0 0.0 0.0 0.0 0.0 0.1 0.0 - - - 0.1
GRANTS (ON-BUDGET) 51.2 - - 2.7 - - 28.4 - - - - 2.7 2.6 36.4
From Foreign Governments - - - - - - - - - - - - - -
From International Organizations 51.2 - - 2.7 - - 28.4 - - - - 2.7 2.6 36.4
BORROWINGS 10.0 - - - - - - - - - - 10.3 - 10.3
o/w Domestic - - - - - - - - - - - -
o/w Foreign 10.0 - - - - - - - - - - 10.3 - 10.3
Category (US$m)

25
Owing to the adverse effects of shocks over the course of FY2013/2014, actual revenues collected fell below the projected amount. Preliminary revenue projections up to the end of the fiscal year amounted to US$572.9 million (excluding borrowing of US$10.0 million); however, the actual revenue collected during the period under review amounted to US$506.9 million, representing a revenue shortfall of US$66.1 million. Total tax revenues collected during the reporting period amounted to US$395.9 million – 8.7 percent lower than the entire fiscal year projected amount of US$433.8 million. The actual non-tax revenue of US$74.6 million was 15.2 percent lower than the projected amount of US$87.9 million. Actual revenue collected from grants (on budget) during the period under review amounted to US$36.4 million, compared to an end-of-period projection of US$51.2 million, representing a shortfall of 28.9 percent.
The total tax revenue shortfall of US$37.9 million has been concentrated around the taxes on income and profits, which accounted for US$11.62 million (30.6 percent of tax revenue shortfall); goods and services tax accounted for US$8.29 million or 21.9 percent of the shortfall; while international trade tax lines accounted for US$15.04 million or 39.7 percent of the shortfall. The latter two are thought to have been driven by a weaker-than-expected domestic demand, which resulted into less goods and services consumption, including consumption of duty-paid imports.
Taxes on income and profit, especially withholding taxes on non-residents, were over projected, based on the good performance of the previous fiscal year (FY2012/13), which was due mainly to non-recurrent investment activities in the telecommunications and mining sectors.
Maritime revenue declined by US$1.2 million from the projected amount of US$22.6 million to US$21.4 million; motor vehicle taxes were also over projected by US$2.6 million above the initial projection of US$5.87 million targeted in the draft budget submitted to the Legislature.
Taxes on international trade suffered due to the loss of US$163.0 million (20 percent) of projected revenue in customs duties exemptions, largely on capital equipment imported by mining and agriculture concessions, and road contractors.
For the reporting period, non-tax revenues experienced a shortfall of US$13.38 million, due to lower-than-expected realization of property income (especially rents from the forestry sector by US$5.51 million, representing 41.2 percent of the shortfalls). Realization of the projected revenue was hindered by infrastructure challenges such as bad roads and poor equipment at the Greenville port, and administrative bottlenecks that resulted in a US$4.89 million (36.6 percent) shortfall in administrative fees. Moreover, fines, penalties and forfeits experienced a shortfall of US$2.91 million (21.7 percent of the total non-tax revenue shortfall).
During the reporting period, actual on-budget support from foreign governments and organizations amounted to US$36.4 million, US$14.79 million or 28.9 percent less than the annual projection of US$51.2 million. The full amount realized was contributed as support from international organizations.
FINANCING The approved budget included US$10 million of on-budget borrowing from the World Bank IDA. As at end-June, 2014, an "on-budget" IDA credit of US$10.3 was disbursed. In
26
addition, the government continued the issuance of Treasury bills, while a number of "off-budget" credits related to the financing of specific projects were disbursed during the period under review.
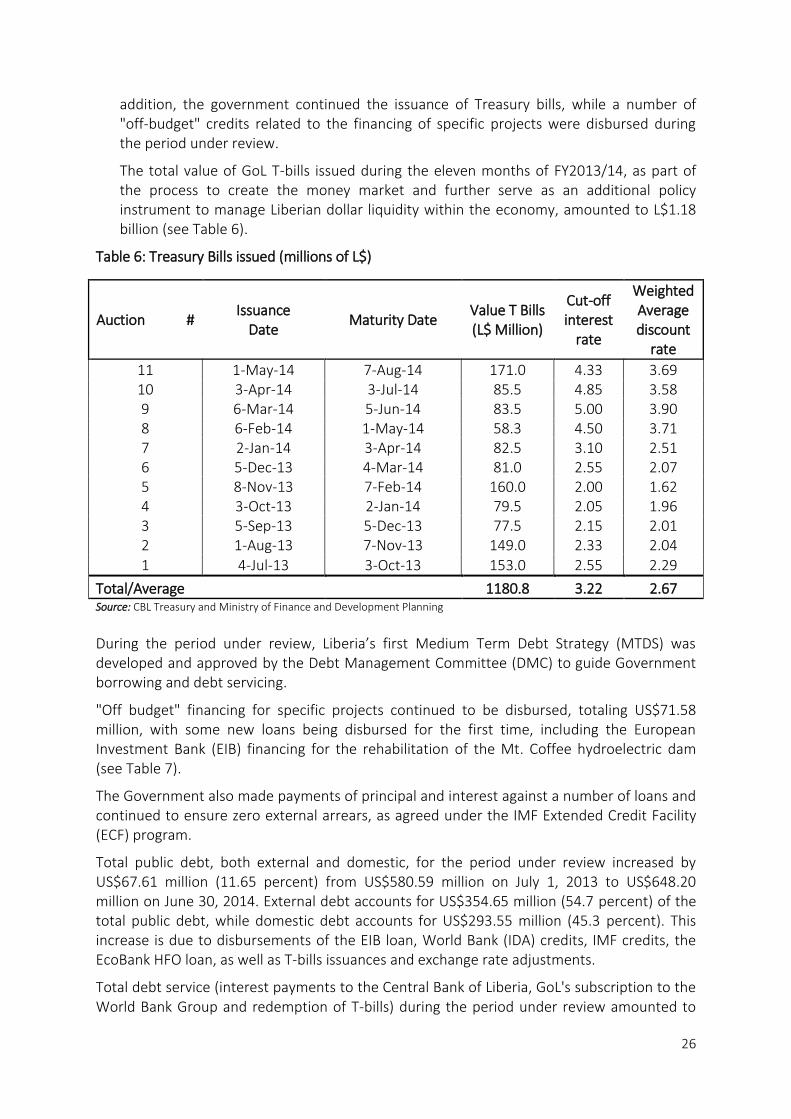
The total value of GoL T-bills issued during the eleven months of FY2013/14, as part of the process to create the money market and further serve as an additional policy instrument to manage Liberian dollar liquidity within the economy, amounted to L$1.18 billion (see Table 6).
Table 6: Treasury Bills issued (millions of L$)
Auction # Issuance
Date Maturity Date
Value T Bills (L$ Million)
Cut-off interest
rate
Weighted Average discount
rate
11 1-May-14 7-Aug-14 171.0 4.33 3.69 10 3-Apr-14 3-Jul-14 85.5 4.85 3.58 9 6-Mar-14 5-Jun-14 83.5 5.00 3.90 8 6-Feb-14 1-May-14 58.3 4.50 3.71 7 2-Jan-14 3-Apr-14 82.5 3.10 2.51 6 5-Dec-13 4-Mar-14 81.0 2.55 2.07 5 8-Nov-13 7-Feb-14 160.0 2.00 1.62 4 3-Oct-13 2-Jan-14 79.5 2.05 1.96 3 5-Sep-13 5-Dec-13 77.5 2.15 2.01 2 1-Aug-13 7-Nov-13 149.0 2.33 2.04
1 4-Jul-13 3-Oct-13 153.0 2.55 2.29
Total/Average 1180.8 3.22 2.67 Source: CBL Treasury and Ministry of Finance and Development Planning
During the period under review, Liberia’s first Medium Term Debt Strategy (MTDS) was developed and approved by the Debt Management Committee (DMC) to guide Government borrowing and debt servicing.
"Off budget" financing for specific projects continued to be disbursed, totaling US$71.58 million, with some new loans being disbursed for the first time, including the European Investment Bank (EIB) financing for the rehabilitation of the Mt. Coffee hydroelectric dam (see Table 7).
The Government also made payments of principal and interest against a number of loans and continued to ensure zero external arrears, as agreed under the IMF Extended Credit Facility (ECF) program.
Total public debt, both external and domestic, for the period under review increased by US$67.61 million (11.65 percent) from US$580.59 million on July 1, 2013 to US$648.20 million on June 30, 2014. External debt accounts for US$354.65 million (54.7 percent) of the total public debt, while domestic debt accounts for US$293.55 million (45.3 percent). This increase is due to disbursements of the EIB loan, World Bank (IDA) credits, IMF credits, the EcoBank HFO loan, as well as T-bills issuances and exchange rate adjustments.
Total debt service (interest payments to the Central Bank of Liberia, GoL's subscription to the World Bank Group and redemption of T-bills) during the period under review amounted to

27
US$30.86 million, compared to US$47.54 million for end June 2013. This represents a decrease of 35.08 percent compared to FY2012/2013 debt service.
Of the total debt service, domestic debt service as of June 30, 2014 amounted to US$23.40 million (of which principal repayment amounted to US$19.87 million, while interest payment amounted to US$3.53 million), compared to US$40.45 million as at June 30, 2013 (of which principal repayment amounted to US$37.05 million while interest payment amounted to US$3.4 million).
However, total external debt service as at June 30, 2014 amounted to US$7.40 million (of which principal repayment amounted to US$5.58 million while interest payment amounted to US$1.88 million), compared to US$7.09 million as at June 30, 2013 (of which principal repayment amounted to US$5.39 million while interest payment amounted to US$1.69 million).
Table 7: External Loan Disbursement Profile for FY2013/14
Creditor Q1 Q2 Q3 Q4 Total
Int’l Monetary Fund (IMF) 11.17 11.37 -0- -0- 22.54
European Investment Bank (EIB) -0- 11.25 -0- -0- 11.25
IFAD 2.3 -0- 2.75 0.89 5.94
World Bank: 11.15 4.99 2.1 13.61 31.85
IDA 48550 0.17 0.22 0.33 0.28 1
IDA 48420 1.09 0.06 0.08 0.69 1.92
IDA 49070 0.93 1.1 0.4 0.42 2.85
IDA 49080 0.39 0.77 0.62 0.35 2.13
IDA 49500 3.45 0.62 -0- -0- 4.07
IDA 48830 0.95 0.77 0.1 0.93 2.75
IDA 50260 3.17 -0- -0- -0- 3.17
IDA50550 -0- 1.45 0.57 -0- 2.02
IDA 51010 1 -0- -0- 0.37 1.37
IDA 52770 -0- -0- -0- 10.35 10.35
IDA 52520 -0- -0- -0- 0.22 0.22
Total disbursements 24.62 27.61 4.85 14.5 71.58 Source: Ministry of Finance and Development Planning
DONOR SUPPORT The Budget Framework Paper for FY2013/14 projected donor grant disbursements of US$785.33 million for FY2013/14 (see Table 8). This included US$57.87 million of "on-budget" and US727.35 million of "off-budget" supports.
The total donor aid for FY2013/14 was projected at US$785.22 million. However, about US$455.1 million (56.7 percent of projection) was realized. Of the realized amount, 54.6 percent of projected project aid was disbursed; than constitutes about 83.4 percent of total disbursement, followed by budget support (13.47 percent), trust fund (3.70 percent) and pool fund (1.88 percent).

28
Table 8: Aid Disbursement by Type for FY2013/14
Source: Ministry of Finance and Development Planning
Table 9 shows actual disbursement to the National Budget by donor agencies. Of the total amount of US$57.87 million pledged as budget support from donor agencies, about US$33.45 million (based on available data) was disbursed. Of the disbursed amount, the EU accounts for 39.5 percent, followed by the African Development Bank (AfDB) with 36.8 percent.
As at end-June, the European Union provided 46.9 percent of its total projected aid, which represents 39.5 percent of the total disbursement; and _USAID disbursed 49.7 percent of its total projected aid, representing 23.7 percent total aid projection for the period. Disbursement by the African Development Bank constituted more than 100 percent of its total annual commitment. The projected International Development Association (IDA) aid of US$1.5 million was not realized during the reporting period.
Table 9: Budget Support Aid Disbursement by Agencies for FY2013/14
Donor Agency-Budget Support Annual
Projections Actual
Disbursements
Rate of Disbursement to Projection
(%)
Rate of Disbursement by Agency (%)
African Development Bank 12.24 12.32 100.6 382.5
European Union 28.16 13.20 46.9 409.8 International Development Association 1.50 0.0 0.0 0.0
USAID 15.97 7.93 49.7 246.1
Grand Total 57.87 33.45 57.8 1038.4 Source: Ministry of Finance and Development Planning
Table 10 shows off-budget support by donor agency for FY2013/14. Actual projection for the period was about US$727.3 million, of which US$411.6 million (based on available data) was disbursed, representing 56.6 percent of the annual projection.
Table 10: Aid Disbursement by Countries and Agencies for FY2013/14
Donor Agency-Grant
Annual Projections
(US$ million)
Actual Disbursements (US$ million)
Rate of Disbursemen
t to Projection
(%)
Rate of Disbursement by Agency
(%)
African Development Bank 42.8 10.2 23.9 6.8

29
Denmark 0.0 0.0 0.0 0.0 Department For International Development 20.6 14.7 71.3 9.7
European Investment Bank 16.9 24.8 146.7 16.5
European Union 33.6 36.4 108.3 24.2
France 1.2 1.2 96.6 0.8
Germany 47.4 24.9 52.5 16.5
GIZ 0.2 0.3 123.5 0.2
Global Fund 27.9 11.4 40.8 7.6
IFAD 0.0 0.0 0.0 0.0 International Development Association 166.0 35.1 21.2 23.3
Ireland 7.6 7.6 99.9 5.0
Japan 19.1 28.8 150.7 19.1
Kuwait 0.0 0.0 0.0 0.0
Norway 57.8 9.6 16.6 6.4
Sweden 29.8 39.2 131.2 26.0
United Nations Children Fund 30.0 12.0 40.0 8.0
UNHCR 0.7 0.0 0.0 0.0
United Nations Peace Building 5.9 16.0 270.5 10.6
United Nations Population Fund 2.2 0.9 40.4 0.6
USAID 171.9 137.6 80.1 91.4
World Food Program 43.4 0.0 0.0 0.0
World Health Organization 2.3 1.0 44.8 0.7
Grand Total 727.3 411.6 56.6 273.4 Source: Ministry of Finance and Development Planning
Of the donor agencies, USAID made the highest contribution amounting to 33.4 percent of total disbursement. Others include Sweden (9.5 percent), EU (8.8 percent) and International Development Association (8.5 percent), among others.
Based on the rate of disbursement to projection, the United Nations Peace Building Office contributed 270.5 percent, followed by Japan (150.7 percent), the European Investment Bank (146.7 percent), Sweden (131.3 percent), GIZ (123.5 percent), the European Union (108.3 percent), Ireland (99.9 percent), France (96.6 percent) and USAID (80.1 percent), among others.
BUDGETARY TRANSFERS During the course of the fiscal year, there were changes in the GOL’s spending priorities, which resulted into budgetary transfers, as described in Table 11.

30
Table 11: Annual Budgetary Transfer for FY2013/14
Source: Ministry of Finance and Development Planning
These transfers can be attributed in part to the reclassification of appropriations amounting to US$53.2 million, which were originally classified as unspecified (PSIP), due to projects that were not fully developed prior to budget approval.
In relation to this, initial capital expenditure appropriations were lower than actually spent, as much of it was captured under PSIP spending. As expenditure on capital took place, the relevant transfers were made from the unspecified line to the capital spending economic classification (which includes PSIP components).
For the reporting period, compensation of employees was originally projected at US$220.5 million, but was later revised to US$210.1 million. This reduction can be partly attributed to the payroll clean-up exercise that resulted in the identification and deletion of ghost and fraudulent workers from the payroll in April 2014.
In the original FY2013/2014 budget, US$132.7 million was appropriated for the use of goods and services. However, an additional US$56.8 million was transferred, with a portion of the transfers used to fund interest expenditures and social benefits during the budget execution process.
Of the eleven (11) sectors of the National Budget, Public Administration received an additional appropriation of US$12.2 million. This is due to the fact that a significant amount of the GOL priority projects and expenditure activities are been executed by M&A’s within this sector. A significant portion of these transfers was used to fund the provision of goods and services and the allocation of grants.
Transparency and Accountability received an additional appropriation of US$7.3 million to fund the provision of goods and services and compensate employees within this sector.
In light of the GOL’s commitment to enhance the quality of the country’s infrastructure and basic social services, an additional US$3.8 million appropriation was made to the sector in order to fund additional capital spending.
The gradual scaling down of UNMIL’s activities in Liberia places additional pressure on the GOL to continue providing services previously provided by UNMIL. In an effort to strengthen security and the rule of law in the country, an additional appropriation of about US$0.5
Compensation
of employees
Use of goods
and services
Capital
Spending Interest Subsidies Grants
Social
benefits PSIP Projects Total
Agriculture (43,728) 571,030 98,500 - - (225,512) - (1,509,800) (1,109,510)
Education (1,778,276) 2,233,066 (50,640) - - 3,230,379 - (6,750,000) (3,115,471)
Energy and Environment (111,523) 2,871,742 278,018 - - (4,044,834) - (3,129,166) (4,135,763)
Health (4,004,599) 405,088 263,000 - - 671,998 - - (2,664,512)
Industry and Commerce (1,069,263) 831,729 179,814 - - 249,612 - (650,000) (458,108)
Infrastructure and Basic Services (301,893) 1,702,080 15,741,163 - - (1,326,590) - (11,944,826) 3,869,934
Municipal Government (25,868) 1,773,194 50,000 - - (367,847) - (2,204,000) (774,521)
Public Administration 335,272 19,173,527 1,063,844 - - 11,467,402 (225,821) (19,655,497) 12,158,728
Security and Rule of Law (3,464,624) 12,716,584 1,273,005 - - (4,074,592) 13,500 (5,986,224) 477,649
Social Development Services 37,716 3,112,763 12,748 - - (13,472,482) - (1,252,690) (11,561,945)
Transparency and Accountability 809,827 10,672,843 26,750 - - (4,065,000) - (120,900) 7,323,520
Total-FY13/14 (9,616,960) 56,063,648 18,936,202 - - (11,957,465) (212,321) (53,203,103) 10,000
Total-FY12/13 20,503,719 76,811,024 65,282,825 - - 29,973,031 (109,000) (192,461,599) (0)

31
million was made to the sector. This was used to fund the training of additional security personnel and provide them with the necessary logistics.
ALLOTMENTS Fiscal Year 2013/14 marked a continuation of the implementation of the multi-year budget. Of the total US$582.9 appropriated during the period, total allotments amounted to US$518.6 million. Table 12 provides a breakdown of the GOL allotment by sector and economic classification for FY2013/14, as compared to FY2012/2013.
Table 12: Annual Allotment per Sector and Economic classification for FY2013/14
Source: Ministry of Finance and Development Planning
An analysis of Table 12 reveals that compensation to employees accounted for about 40 percent of the total fiscal year allotment; while the use of goods and services, capital spending, grants and social benefits, respectively, accounted for 34.3 percent, 4.8 percent, 20.5 percent and 0.20 percent. The low allotment for capital spending can be attributed to delays in the passage of the budget.
Allotments for the Public Administration sector accounted for 33.2 percent of the total fiscal year allotment, followed by Security and the Rule of Law at 15.5 percent; Education at 13.8 percent; Health at 10.7 percent; Infrastructure and basic social services at 6.3 percent; and Municipal Government and Transparency & Accountability at 5.3 percent each, among others.
COMMITMENTS Table 13 provides information on commitments. During the course of FY2013/14, US$530.4 million was issued out as commitment to Ministries and Agencies.
Compensation of
employees
Use of goods
and servicesCapital
Spending* Interest Subsidies Grants
Social
benefits Total
Agriculture 3.1 2.4 0.1 - - 0.1 - 5.7
Education 39.7 7.4 0.3 - - 24.1 - 71.5
Energy and Environment 5.1 5.7 0.3 - - 3.2 - 14.3
Health 19.5 5.6 0.2 - - 30.3 - 55.6
Industry and Commerce 5.6 11.8 0.4 - - 2.2 - 20.0
Infrastructure and Basic Services 5.7 4.5 20.5 - - 2.0 - 32.7
Municipal Government 9.2 3.7 0.1 - - 14.4 - 27.3
Public Administration 59.8 85.8 1.2 - - 24.3 1.1 172.2
Security and Rule of Law 45.0 30.8 1.9 - - 2.5 0.0 80.2
Social Development Services 2.1 6.0 0.0 - - 3.6 - 11.8
Transparency and Accountability 13.1 14.2 0.0 - - 0.0 - 27.3
Total (FY13/14) 207.9 178.0 25.1 - - 106.5 1.1 518.6
Total (FY12/13) 210.4 194.5 68.0 - 1.2 120.1 1.2 595.4
* Capital spending (excluding PSIP) was appropriated at US$4.8 million. The US$25.1 allotment includes capital expenditure under PSIP.

32
Table 13: Annual Commitment for FY2013/14
Source: Ministry of Finance and Development Planning
For the period under review, commitment for compensation to employees accounted for about 39.0 percent of total commitments, followed by the use of goods and services (including interest and loan repayments) at 35.3 percent, and Public Administration at 32.29 percent. Grants accounted for 20.8 percent; Security and Rule of Law 14.63 percent; Education sector 13.29 percent; Health sector 10.41 percent; and capital spending 4.7 percent, while social benefits accounted for 0.2 percent.
BUDGET EXECUTION There was significant improvement in budget execution over the course of FY2013/2014. However, execution for programs under the PSIP, including energy, roads rehabilitation and others was delayed in quarter one, due to the late passage of the national budget.
Table 14 provides a summary of the budget execution split by economic classification. The adjusted column relates to appropriations at the end of the reporting period, after budgetary transfers, as made possible by the PFM Act, while Table 15 provides percentage execution based on the adjusted budget.
Table 14: Annual Budget Execution for FY2013/14
Of the total budgetary appropriation, 89 percent was allotted during the period under review. Of the total allotment, 102.3 percent was committed, while 100 percent of the
Compensation of
employees
Use of goods
and services Capital
Spending Interest Subsidies Grants
Social
benefits Total
Agriculture 3.1 2.4 0.1 - - 0.1 - 5.7
Education 39.7 7.2 0.2 - - 23.8 - 71.0
Energy and Environment 5.1 5.5 0.3 - - 3.2 - 14.0
Health 19.5 5.4 0.2 - - 30.0 - 55.1
Industry and Commerce 5.6 11.7 0.4 - - 2.2 - 20.0
Infrastructure and Basic Servi 5.7 4.4 20.5 - - 2.0 - 32.6
Municipal Government 9.1 3.6 0.1 - - 14.4 - 27.1
Public Administration 59.8 65.5 1.2 30.9 - 28.8 1.1 187.2
Security and Rule of Law 44.1 30.5 1.8 - - 2.5 0.0 78.9
Social Development Services 2.1 6.0 0.0 - - 3.6 - 11.7
Transparency and Accountabilit 13.1 14.2 0.0 - - 0.0 - 27.3
Total (FY13/14) 206.8 156.6 24.9 30.9 - 110.3 1.1 530.6
Total (FY12/13) 210.3 193.9 68.0 - - 120.1 1.2 593.5
Budget Adjusted Allotment Commitment Cash
Compensation of employees 220.5 210.1 207.9 206.8 206.8
Use of goods and services 132.7 150.6 178.0 156.6 156.6
Capital Spending 7.1 4.8 25.1 24.9 24.9
Interest 0.0 19.6 0.0 30.9 30.9
Subsidies 0.0 0.0 0.0 0.0 0.0
Grants 168.2 121.7 106.5 110.3 110.3
Social benefits 1.3 1.1 1.1 1.1 1.1
Unspecified/PSIP * 53.2 75.1 0.0 0.0 0.0
Total 582.9 582.9 518.6 530.6 530.6
Source: Departments of the Ministry of Finance & Development Planning
* PSIP appropriations under the adjusted budget were executed within the various economic classification and so are
not separately captured.
33
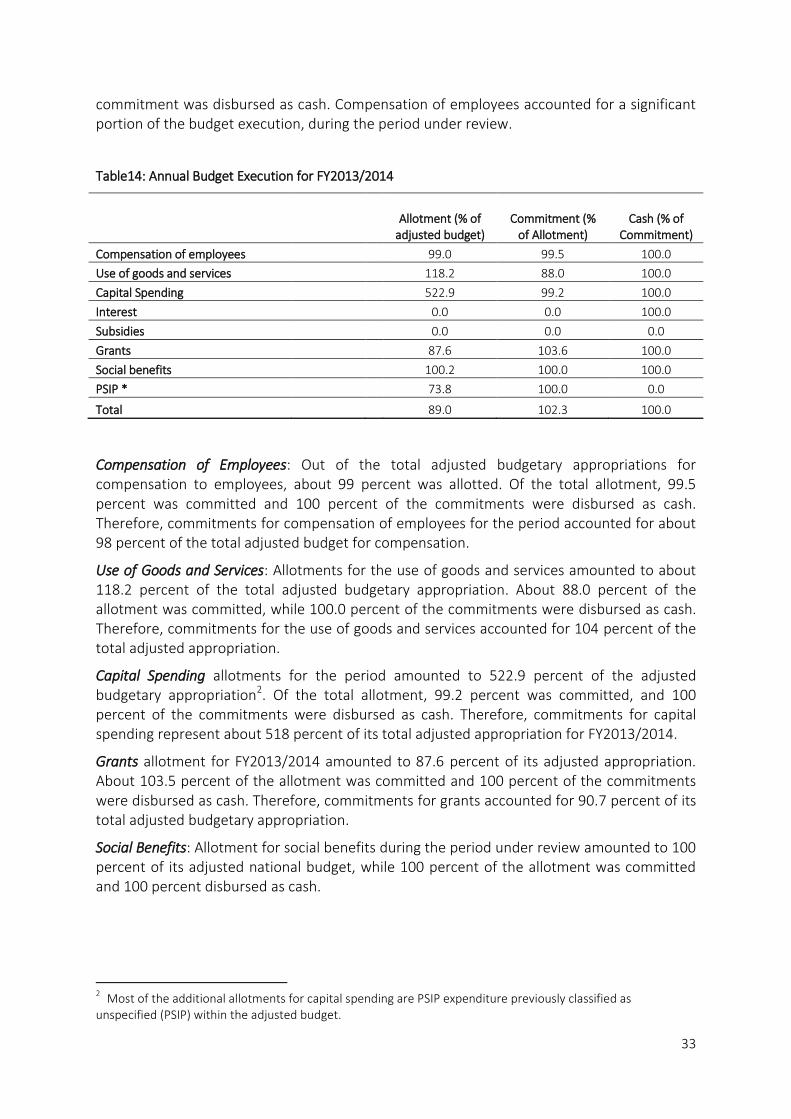
commitment was disbursed as cash. Compensation of employees accounted for a significant portion of the budget execution, during the period under review.
Table14: Annual Budget Execution for FY2013/2014
Allotment (% of
adjusted budget) Commitment (%
of Allotment) Cash (% of
Commitment)
Compensation of employees 99.0 99.5 100.0
Use of goods and services 118.2 88.0 100.0
Capital Spending 522.9 99.2 100.0
Interest 0.0 0.0 100.0
Subsidies 0.0 0.0 0.0
Grants 87.6 103.6 100.0
Social benefits 100.2 100.0 100.0
PSIP * 73.8 100.0 0.0
Total 89.0 102.3 100.0
Compensation of Employees: Out of the total adjusted budgetary appropriations for compensation to employees, about 99 percent was allotted. Of the total allotment, 99.5 percent was committed and 100 percent of the commitments were disbursed as cash. Therefore, commitments for compensation of employees for the period accounted for about 98 percent of the total adjusted budget for compensation.
Use of Goods and Services: Allotments for the use of goods and services amounted to about 118.2 percent of the total adjusted budgetary appropriation. About 88.0 percent of the allotment was committed, while 100.0 percent of the commitments were disbursed as cash. Therefore, commitments for the use of goods and services accounted for 104 percent of the total adjusted appropriation.
Capital Spending allotments for the period amounted to 522.9 percent of the adjusted budgetary appropriation2. Of the total allotment, 99.2 percent was committed, and 100 percent of the commitments were disbursed as cash. Therefore, commitments for capital spending represent about 518 percent of its total adjusted appropriation for FY2013/2014.
Grants allotment for FY2013/2014 amounted to 87.6 percent of its adjusted appropriation. About 103.5 percent of the allotment was committed and 100 percent of the commitments were disbursed as cash. Therefore, commitments for grants accounted for 90.7 percent of its total adjusted budgetary appropriation.
Social Benefits: Allotment for social benefits during the period under review amounted to 100 percent of its adjusted national budget, while 100 percent of the allotment was committed and 100 percent disbursed as cash.
2 Most of the additional allotments for capital spending are PSIP expenditure previously classified as
unspecified (PSIP) within the adjusted budget.

34
SECTION 4: PROJECTIONS AND CHALLENGES Cumulatively, execution of the FY2013/14 budget faced immediate challenges with its late passage, the activation of the 1/12th rule, and the lower-than-expected revenue receipts. Despite the challenges, execution continued strongly with government ensuring that disbursements for compensation to employees, expenditure on goods and services, and social benefits occurred on a timely basis.
During the fiscal year, it became apparent that the Ministry of Public Works (MPW) had committed to a number of road contractors without the necessary budgetary allocations. The Ministry of Finance worked with the MPW and the relevant Senate committee to investigate the matter and, where appropriate, made payments to vendors. The Government has taken action, including discussion with Ministers, commercial banks and vendors, to ensure that commitments outside of the budget process do not reoccur.
The Government continued prioritizing investment expenditure, particularly relating to energy (Mt. Coffee rehabilitation; and HFO plant construction, transmission and distribution), as reflected in the Agenda for Transformation and the approved budget, and will continue to focus on ensuring that critical investment takes place over the medium term.
The Budget for the Medium Term Expenditure Framework (MTEF) period FY2014/15 through to FY2016/17 has been submitted, with the latest economic data and revenue outturn, utilized to establish a credible final forecast that can support strong budget execution.
Given the continued weak global outlook and domestic economic challenges, including the Ebola Virus Disease epidemic, the Ministry of Finance and Development Planning is anticipating a very low level of growth in tax and non-tax revenue. This is expected to improve in the medium-term as the epidemic comes under control, concessions resume operations, and outputs begin to rise. Particularly, iron ore-related revenue would begin to rise in the medium term, as Arcelor Mittal implements Phase 2, China Union increases output and Western Cluster comes online. As infrastructure investments in energy, roads and bridges begin impacting the economy by reducing the cost of doing business and providing new opportunities for entrepreneurs, growth in the private sector will pick up and further spur the economy.


