GOVERNMENT OF THE REPUBLIC OF LIBERIA 2008 NATIONAL POPULATION AND HOUSING CENSUS: PRELIMINARY RESULTS LIBERIA INSTITUTE OF STATISTICS AND GEO-INFORMATION SERVICES (LISGIS) MONROVIA, LIBERIA JUNE 2008
Transcript
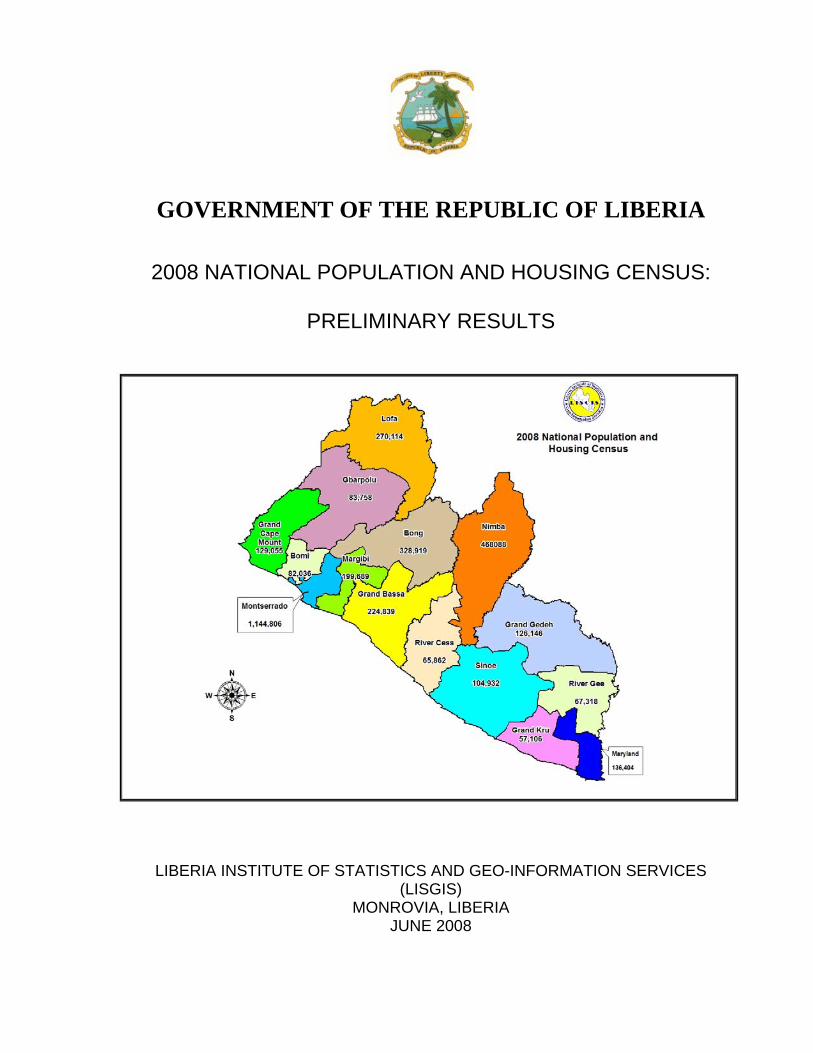
GOVERNMENT OF THE REPUBLIC OF LIBERIA
2008 NATIONAL POPULATION AND HOUSING CENSUS:
PRELIMINARY RESULTS
LIBERIA INSTITUTE OF STATISTICS AND GEO-INFORMATION SERVICES (LISGIS)
MONROVIA, LIBERIA JUNE 2008
ii
FOREWORD Post-war socio-economic planning and development of our nation is a pressing concern to my Government and its development partners. Such an onerous undertaking cannot be actualised with scanty, outdated and deficient databases. Realising this limitation, and in accordance with Article 39 of the 1986 Constitution of the Republic of Liberia, I approved, on May 31, 2007, “An Act Authorizing the Executive Branch of Government to Conduct the National Census of the Republic of Liberia”. The country currently finds itself at the crossroads of a major rehabilitation and reconstruction. Virtually every aspect of life has become an emergency and in resource allocation, crucial decisions have to be taken in a carefully planned and sequenced manner. The publication of the Preliminary Results of the 2008 National Population and Housing Census and its associated National Sampling Frame (NSF) are a key milestone in our quest towards rebuilding this country. Development planning, using the Poverty Reduction Strategy (PRS), decentralisation and other government initiatives, will now proceed into charted waters and Government’s scarce resources can be better targeted and utilized to produce expected dividends in priority sectors based on informed judgment. We note that the statistics are not final and that the Final Report of the 2008 Population and Housing Census will require quite sometime to be compiled. In the interim, I recommend that these provisional statistics be used in all development planning for and in the Republic of Liberia. Although Government contributed considerable resources to this project, the requirements were clearly beyond our capacity and it is with pleasure that we recognize the support of the United Nations Population Fund (UNFPA), whose timely and continuous intervention gave impetus to the execution of the exercise. We would also like to thank the United States Agency for International Development (USAID), United Nations Mission in Liberia (UNMIL) and United Nations Development Programme (UNDP) for being partners on this first phase of the project. Special gratitude go to the general public for their cooperation and Liberia Institute of Statistics and Geo-Information Services (LISGIS) for conducting the Census from 21st -30th March, 2008 and for releasing these results timely. ELLEN JOHNSON-SIRLEAF President of the Republic of Liberia OFFICE OF THE PRESIDENT THE EXECUTIVE MANSION MONROVIA, LIBERIA. 6th June, 2008
iii
ACKNOWLEDGEMENT Liberia now has a reasonable experience in holding censuses. The first census was conducted in 1962, followed by the 1974 Population and Housing Census. In 1984, the third census programme was executed. Unlike the censuses before it, the Final Report of the 1984 Population and Housing Census was never published. The manuscript and most of the data went missing during the civil war. According to United Nations prescriptions, Liberia should have held two censuses in 1994 and 2004 but the disruptions of civil order could not allow this to happen. The 2008 National Population and Housing Census, therefore, was conducted against the background of an almost complete lack of timely, accurate, sufficient and time series data for socio-economic, political and physical development planning. In the same vein, not all the required technical expertise for such an undertaking was available in-country. In addition, although Government of Liberia exhibited very high commitment of political will and put in considerable amounts of resources, the required levels of financial and other inputs could not have been provided given the overcrowding of demands from other equally important sectors of the economy. Notwithstanding, the census programme is adjudged to have been executed within acceptable limits of the highest international standards, using state-of-the-art technology and expertise at all stages of the census operations. The extra resources and other support have been coming from a plethora of organisations whose contributions and moral support are hereunder acknowledged. Given their mandate and comparative advantage in technical assistance appertaining to all aspects of population and related data, the United Nations Population Fund (UNFPA) contributed the most to this project through technical expertise for project setup, development of census publicity and advocacy plan, funding of study tours to Sierra Leone and Kenya, provision of three full-time international Resident Advisors and an Accountant, procurement of 11 4WD vehicles and eight motorcycles, cartographic equipment and training for the census mapping exercise, planning and execution of the pilot census, printing of main census instruments and other resources for census activities in 2008 (including an international Data Processing Expert). The Government and people of Liberia wish to put on record their gratitude for this fabulous and invaluable support without which the entire census programme may not have started in earnest. We are also grateful to the United States Agency for International Development (USAID) for the provision of some cartographic equipment, 20 double cabin pickup vehicles, some communication equipment (radio sets, etc.), pilot census activities and assistance with devising the edit rules. United Nations Mission in Liberia (UNMIL) supported with provision of satellite maps for urban areas, training of some GIS staff and maintenance of GIS equipment, movement of enumeration materials to the county (and some district) headquarters plus provision of security at LISGIS headquarters and in the counties for the entire operation. In addition, UNMIL Radio supported the publicity and advocacy programme and awareness creation activities. Also, we wish to mention the contribution of the United Nations Development Programme (UNDP) towards part-payment of the training allowances of enumerators. The conduct of the census programme so far has been extremely well received by development partners both national and international. At the moment, new donors have indicated interest in funding the remaining aspects of the census budget. The United Nations Children’s Fund (UNICEF) is funding the Post-Enumeration Survey which is ongoing. Grant resources from the World Bank/PARIS 21 are also funding the main data processing phase of
iv
the census programme. The African Development Bank (AfDB) has earmarked funds to support data analysis, publication and dissemination of the final data. On behalf of the Board of Directors of LISGIS and the Census Commission, I would like to extend my appreciation to the Government of Liberia and the development partners for providing the required resources for conducting this census. Furthermore, I extend my thanks to all local institutions that worked with LISGIS to implement the census program. Special appreciation for making the census a success go to the Census Commission, the Census Secretariat, all categories of census field staff, office staff and all respondents who provided the required information. Hon. Dr. Toga G. McIntosh Minister of Planning and Economic Affairs and Chairman of Census Commission
v
PREFACE
This success of the first post-war census was a result of dedicated effort of the Census Commission, the Development Partners, the Board of Directors, the Management and staff of the Liberia Institute of Statistics and Geo-Information Services (LISGIS) supported by United Nations Population Fund (UNFPA), the Ministry of Internal Affairs and its local authorities, a total of 11,618 field staff who were deployed throughout the country and the million of Liberians and Foreign Residents who responded. The 2008 Population and Housing Census is seen as the most plausible means to obtain recent information on the population of Liberia. As such, the Census Preliminary Results are being released for decision-makers and researchers to combine with results from the surveys LISGIS has recently conducted namely: 2007 Liberia Demographic and Health Survey (2007LDHS), the Core Welfare Indicators Questionnaire, the Poverty participatory Survey (PPS), the National Establishment Census (NEC), etc. in order to establish an invaluable database for socio-economic development planning. Hence, in view of the foregoing and in accordance with international norms, this Census Preliminary Report has been prepared. It contains the following: Foreword, Acknowledgement, Preface, Introduction, the Census Cartographic Work, the Provisional Results and Appendices. Please forward comments and queries to:
T. Edward Liberty Director-General Statistics House, Sinkor Tubman Boulevard P. O. Box 628 Monrovia, Liberia Phone: 231-651-9628/231-681-0276 Email: [email protected] Dr. T. Edward Liberty Director-General, Liberia Institute of Statistics and Geo-Information Service (LISGIS)
1
2008 LIBERIA NATIONAL POPULATION AND HOUSING CENSUS
1.0 Introduction 1.1 Background Demographic data, in addition to other socio-economic data, are needed for development planning. Demographic information includes indicators like birth rate, death rate, age composition, spatial distribution and migration patterns. These indicators are related to, and are affected by, socio-economic levels of the population like employment, occupation, education and health. In most countries, especially the developing ones, population censuses are the main sources of demographic statistics. In Liberia, other sources of statistics like vital registration, socio-economic sample surveys, administrative records and community or civil registration offer very limited demographic statistics mainly because they are not yet fully operational. In addition, the civil wars in the last two decades made the situation worse by destroying national data banks. The demographic statistics from the censuses of 1962, 1974 and 1984 and socio-economic surveys conducted prior to the civil wars are either extremely scanty or completely lost. Furthermore, most of the demographic statistics that survived the civil war are no longer relevant to the situation on the ground mainly because of massive population displacements. In this respect, the Government of Liberia considered the 2008 National Population and Housing Census (NPHC) a necessary prerequisite for assessing the socio-economic needs of its population and, hence, it attaches great importance to the determination of the current numbers and distribution of the population in pursuance of its program for national development. Therefore, the census organization provided for participation at all levels of Government, civil society and non-governmental organizations through the formation of committees, working in close collaboration with and under the direct supervision of authority from the Census Commission. 1.2 The 2008 Population and Housing Census The mapping exercise that preceded the census canvassed the whole country and drew all boundaries of the administrative hierarchy and geographically positioned the various localities. Hence, the 2008 Population and Housing Census (NPHC) will, to a certain extent, bridge the statistics gaps mentioned above by offering national and sub-national baseline statistics and updated demographic indicators. Globally, the methodology of census taking has been improving over the years and the 2008 NPHC portrays these improvements. However, there are two basic additions to this census; foremost, the shift from the de jure censuses of 1962, 1974 and 1984 to a de facto census in 2008 and, secondly, the inclusion of an Agricultural Module. The de jure census records usual residents of the household while the de facto one records persons who spent a reference night in the household. De facto censuses are easier to conduct and, hence, most countries adopt them. Liberia being a predominantly agricultural country, the ‘Agricultural Module’ was introduced with the aim of generating a sampling frame that will be used to design and implement agricultural surveys in the future. The enumeration started on the morning of 21st of March, 2008 and ended in the evening of 30th March, 2008. It was done by trained enumerators who administered a standard questionnaire to the household heads or any other knowledgeable household members. Arrangements were made to ensure that special categories of the population were enumerated; for example, street children who do not live in formal households, in-mates in hotels and transients at air and sea ports.
2
2 THE CENSUS CARTOGRAPHIC WORK 2.1 BACKGROUND In 2006 the Government of Liberia requested UNFPA’s support to formulate the road map for March 2008 Population and Housing Census. The implementation of the mapping component started in January 2007 and completed in March 2008. It was mainly funded by UNFPA with additional resources from USAID and executed by Liberia Institute of Statistics and Geo-Information Services (LISGIS). The census was carried out using an updated enumeration area (EA) geographic frame which was developed using modern technologies in GIS and Global Positioning System (GPS). The frame comprises of 7,023 enumeration areas which were demarcated within the clans/communities.
2.2 METHODOLOGY A total of 81 persons were recruited, trained and deployed to prepare the enumeration area (EA) maps for the entire country. They worked in five statistical zones and divided the whole country into EAs using 1:50,000/1:250000 topographical maps and satellite imageries. Each EA comprising 80 to 120 households was demarcated as far as possible following identifiable physical features on the ground. They were delineated within the clans (rural areas) or communities (urban areas). All EAs were assigned geographic codes that identified them uniquely in terms of their geographical location or the placement within the clans/communities, district and counties.
2.3 THE USE OF EA MAPS The EA Maps were used for planning, management and administration of the census, particularly for recruitment and deployment of field staff, and determination of transport and other logistical needs. The enumerators used the maps to locate their areas and plan the best route of travel in order to cover their area and to mark the location of houses for possible return visits, etc.
The updated census geographical frame can now be used for population data processing, analysis and dissemination of census and survey results by administrative units, enumeration areas and localities for efficient development planning. It can also be used as sampling frame for sample surveys and for the delimitation of electoral districts for presidential, parliamentary and local Government elections in Liberia.
3. The Provisional Results 3.1 Total Population Counts: 2008 National Population and Housing Census According to the provisional results of the 2008 Population and Housing Census of Liberia, the population was 3,489,072 on the night of 20th/21st March, 2008. This figure falls between the official population projection estimate of 3,238,000 and the population estimate of 3,511,618 calculated using the number of households generated from the geographic mapping exercise and relative household sizes of the respective counties in the pilot census. Also, the United Nations Development Program’s Human Development Report (UNDP’s HDR) 2007/2008 gives an estimated population of 3,442,000 for Liberia. If this UN HDR estimate is projected to 20th/21st March 2008 (census night) using the observed yearly increase, the population would be 3,598,087. This figure varies from the
preliminary census total by 109,015, or 3.1 percent. Given the population in 1984 as 2,101,628, there has been a rise of 1,387,444 people and this increasing trend has been seen since 1962 (Figure 1).
3
Figure 1: Population Change, 1962-2008
4000 3,489
3500
3000
2500 2,102
2000 1,503
1500 1,016
1000
500
0 1962 1974 1984 2008
Year
Population (thousands)
The average annual increase rose between 1974 and 1984 but had declined slightly by 2008 (Table 1). Further in the table, is shown that the growth rate, mean yearly percentage change and average annual increases were appreciably high and increasing in the seventies and eighties but the current situation shows a decreasing trend. Table 1: Population Trend, 1962 – 2008
Index 1962 1974 1984 2008
Population 1,016,443 1,503,368 2,101,628 3,489,072 Population change - 486,925 598,260 1,387,444 Average annual increase - 40,577 59,826 57,810 Percentage increase - 48 40 66 Annual rate of growth - 3.3 3.4 2.1
In comparison with other countries around the region, the population size of Liberia is relatively small. This notwithstanding, the yearly rate of growth of the nation at slightly over two percent is still on the high side. As can be demonstrated, Table 2 shows that similar post-conflict countries in Africa have lower rates of population growth. The rate in Liberia looks more like those for Sub-Saharan countries that have not been engaged in civil wars.
Table 2: Population, Density and Growth Rate of some Sub-saharan African Countries
Density (sq. m.)
Sources: *United Nations: World Population Policies 2005, Department of Economic Affairs, Population Division, ST/ESA/SER.A/254: New York, 2006 **Government of Sierra Leone, 2004 Population and Housing Census ***Government of Liberia, 2008 National Population and Housing Census
3.2 Population Doubling Time This statistic summarizes the way the population grows. It tells of the number of years that a given population is expected to double if it continues to grow at an observed annual rate. The total population of Liberia would double the 2008 figure in 34 years (i.e., by 2042) if the observed annual growth rate of 2.1 percent persists into the future. It can be said that this is a relatively short period of time within which the provision of all public goods and facilities should also double if only to maintain the current standard of living and service provision to the population.
3.3 Sex Composition The index for measuring the sex composition of the population is the sex ratio, defined as the number of males per 100 females. A sex ratio of 100 tells that there are about equal numbers of males and females. A ratio higher than 100 depicts an excess of males and less than 100 an excess of females in the population. The sex ratio should be close to 100 if a country has not experience wars or sex selective migration or both in the recent past. In 2008, 1,764,555 males and 1,724,517 females were enumerated in the census. In Table 3, it is shown that the calculation of the overall sex ratio gave a result of 102.3, virtually the same as that for 1984. At the county level, there is a general trend towards increasing sex ratios. The sex ratios were high for 11 out of 15 counties (including the five least peopled and all of the medium sized counties) and they were least in Lofa and Bong counties which recorded 93.0 and 97.0 respectively. The most significant increases in sex ratio occurred in Grand Cape Mount, Grand Gedeh, Grand Kru and Gbarpolu counties whilst the drop was most pronounced in Lofa, Grand Bassa and Montserrado.
3.4 Average Household Size The number of persons per household is an important index in planning for the population since most of the people can be found in such social arrangements. The mean household size declined from 6.2 in 1984 to 5.1 in 2008 (Table 4). This implies that at the household level, there are now fewer numbers of people living and eating together. The household size normally reduces in a situation of increasing urbanization and modernization, and as people become more educated and individualistic. 4
5
Table 3: Population and Sex Ratios County 2008 Population Sex Ratio Male Female 1984* 2008
*The populations used were those that were derived for the respective counties after accounting for boundary changes between 1984 and 2008 In specific terms, apart from Bong, Margibi and Nimba counties where the household size tended to remain the same, the rest of the counties were almost evenly split in terms of counties with rising household sizes and those that experienced a decline in the 1984-2008 inter-censal period. The national household size of 5.1 was exceeded in eight of the fifteen counties. The most dramatic fall in household sizes were in River Cess County while the reverse is true for Grand Gedeh, Maryland and River Gee.
3.5 Population Distribution The concept of “population distribution” relates the spread of the population to geographic subdivisions of the country. These may be clans, districts or counties. Population distribution can be illustrated using population totals or by relating these to the actual land area on which the people live.
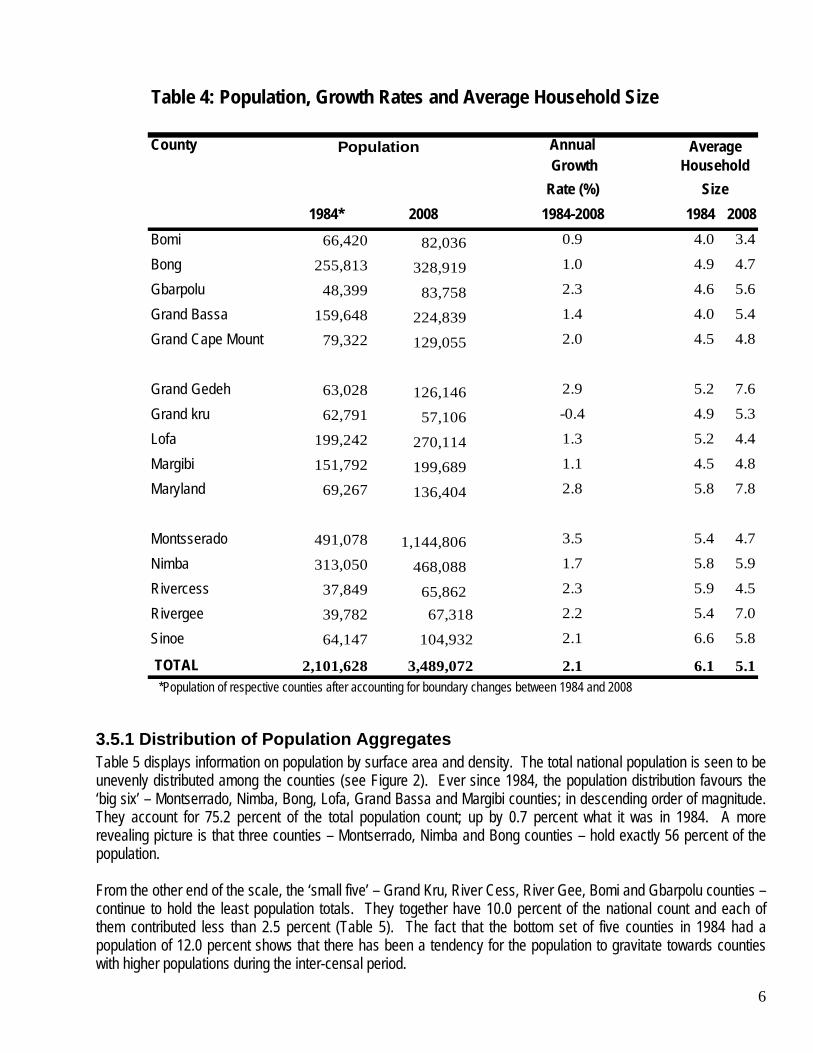
Table 4: Population, Growth Rates and Average Household Size
PopulationHousehold
*Population of respective counties after accounting for boundary changes between 1984 and 2008
3.5.1 Distribution of Population Aggregates Table 5 displays information on population by surface area and density. The total national population is seen to be unevenly distributed among the counties (see Figure 2). Ever since 1984, the population distribution favours the ‘big six’ – Montserrado, Nimba, Bong, Lofa, Grand Bassa and Margibi counties; in descending order of magnitude. They account for 75.2 percent of the total population count; up by 0.7 percent what it was in 1984. A more revealing picture is that three counties – Montserrado, Nimba and Bong counties – hold exactly 56 percent of the population. From the other end of the scale, the ‘small five’ – Grand Kru, River Cess, River Gee, Bomi and Gbarpolu counties – continue to hold the least population totals. They together have 10.0 percent of the national count and each of them contributed less than 2.5 percent (Table 5). The fact that the bottom set of five counties in 1984 had a population of 12.0 percent shows that there has been a tendency for the population to gravitate towards counties with higher populations during the inter-censal period.
6
3.5.2 Population Density “Population density” is a statistical measurement of the man-land relationship expressed in terms of number of persons per square kilometers or miles. In assuming a uniform distribution, population density gives the scatter of the population over the land area of a country, county, district or clan. In 2008, the population density of Liberia was 93 persons per square miles. This represents a 66 percent rise over the figure of 56 attained in 1984. Compared with some sub-Saharan nations, population density in Liberia is moderate by African standards (see Table 2) on page 6. The national density was exceeded only in the counties of Montserrado, Margibi, Maryland, Bomi, Nimba and Bong (Appendix 1). A bird’s eye view of the spread of the population reveals that a north-east south-west line drawn across Liberia from the bulge in Nimba County clearly divides the country roughly into a western populous and an eastern depopulated half as depicted in Figure 3. Statistically, the pattern of population concentration follows a four-way divide as enumerated below:
(a) Very densely populated – Montserrado County is the only qualifier in this category, being the most
densely packed in Liberia. The population density is over 1,500 persons per square mile and can be much higher in Monrovia and its environs. It has the highest total population (over 32 percent of the national population) and the least land and very small area (Appendix 1); both being indicators that enhance this situation. The city, Monrovia, is located here, with the plentiest of opportunities for employment, abundance of social amenities, administrative hub of the republic, the busiest seaport, better communication and transport connections, greatest endowed in terms of physical infrastructure and, also, the business capital.
Table 5: Population, Surface Area and Density (1984 and 2008)
COUNTY POPULATION DENSITY
*The populations used were those that were derived for the respective counties after accounting for boundary changes between 1984 and 2008
(b) Dense population concentrations – These can be found in the counties of Margibi, Mayland, Bomi and
Nimba with densities falling between 100-199 persons per square mile (Figure 3). With the exception of Nimba County, the others have relatively small landmasses with high population totals that condition the high densities. Other conditioning factors include better transport and communication facilities, fertile agricultural lands, local alluvial mining activities and presence of international mining and agricultural companies, and opportunities for trade with contiguous West African countries.
(c) Moderate population densities – The counties that hold moderate population concentrations (50-99
persons per square mile) generally have large land masses and high population totals. They include Bong, Lofa, Grand Bassa and Cape Mount. The advantages of local alluvial diamond and gold mining, being hosts to former mining and agricultural companies, fertile arable lands for farming, moderate transport and communication facilities, and local trade attract and hold populations in these counties.
(d) Sparse population areas – The rest of the country comprising Gbarpolu, Grand Gedeh, Grand Kru,
River Cess, River Gee and Sinoe counties are sparsely populated. They typically have densities between 22 and 38 persons per square mile. The disadvantages of difficult relief and poor communication and transport lines, heavy forest cover in parts of Grand Gedeh, Sinoe, River Gee and Gbarpolu, scanty other physical infrastructure and social amenities, and generally low employment opportunities are some of the reasons for the low population densities in these areas.
8
3.6 Population of Major Urban Areas In Liberia, a settlement is urban when its population is 2,000 and above. The major urban centres in the country, according to the preliminary data of the 2008 Population and Housing Census, are presented in two tables in the Appendices. Appendix 1 and Figure 4 display information on the county headquarters by sex. The total population in these areas is 231,127, representing 6.6 percent of the national. Buchanan in Grand Bassa County is the largest county headquarters and Cesstos City in River Cess County is the least. The table also shows that the county headquarters collectively have more females than males. In addition, according to the preliminary data of the 2008 National Population and Housing Census, the major urban centres in the country with 5,000 persons and above are given in Appendix 2. The information immediately reveals the vast difference between Monrovia and the rest of the urban areas. In comparison with the data in Appendix 1, Monrovia alone is more than four times greater than the combined population of all county headquarters. The fact that of the urban areas with 5,000 or more people only four are not county headquarters goes to tell that there is a strong correlation between administrative ascription, centrality and urbanization in Liberia. In terms of geographic spread, Figure 5 shows that the major urban settlements are unevenly spread across the country. Thirteen of the settlements are found in the western half of the country, leaving the eastern half with only five major urban centers. Nimba County has four of the 18 large urban complexes followed by Lofa with three. But for Margibi and Maryland having two apiece, the rest of the counties have either one or none.
9
10
11
12
APPENDICES
Appendix 1: Population of County Headquarters, 2008 County County Male Female Total Headquarters Bomi Tubmanburg 6,555 6,559 13,114Bong Gbarnga 16,080 17,966 34,046Gbarpolu Bopolu 1,547 1,361 2,908Grand Bassa Buchanan 16,984 17,286 34,270Grand Cape Mount Robertsport 1,994 1,939 3,933Grand Gedeh Zwedru 11,828 12,075 23,903Grand Kru Barclayville 1,380 1,353 2,733Lofa Voinjama 13,343 13,251 26,594Margibi Kakata 16,501 17,444 33,945Maryland Harper 9,082 8,755 17,837Montserrado Bensonville 2.087 2,002 4,089Nimba Sanniquellie 5,375 6,040 11,415River Cess Cesstos City 1,341 1,237 2,578River Gee Fish Town 1,656 1,672 3,328Sinoe Greenville 7,719 8,715 16,434Total - 113,472 117,655 231,127