Miami-Dade County government is comprised of 58 departments with more than 28,000 employees working to serve the needs of the County’s residents and businesses. The County provides countywide services for all residents such as emergency management, mass transit and elections. Municipal-type services such as police, parks, public works, and zoning are also provided by the County to the approximately 1.081 million residents living in the Unincorporated Municipal Service Area (UMSA). This section examines the consumption of fuel, electricity and water for all county operations, and the scope of county purchasing. It also examines airport and seaport operations and their importance as an economic engine for the local economy. This self-assessment identifies challenges, establishes a sustainability baseline, and will position county government to lead the community-wide sustainability planning effort. Government Operations
Transcript
Miami-Dade County government is comprised of 58 departments with more than 28,000 employees working to serve the needs of the County’s residents and businesses. The County provides countywide services for all residents such as emergency management, mass transit and elections. Municipal-type services such as police, parks, public works, and zoning are also provided by the County to the approximately 1.081 million residents living in the Unincorporated Municipal Service Area (UMSA).
This section examines the consumption of fuel, electricity and water for all county operations, and the scope of county purchasing. It also examines airport and seaport operations and their importance as an economic engine for the local economy. This self-assessment identifies challenges, establishes a sustainability baseline, and will position county government to lead the community-wide sustainability planning effort.
Government Operations
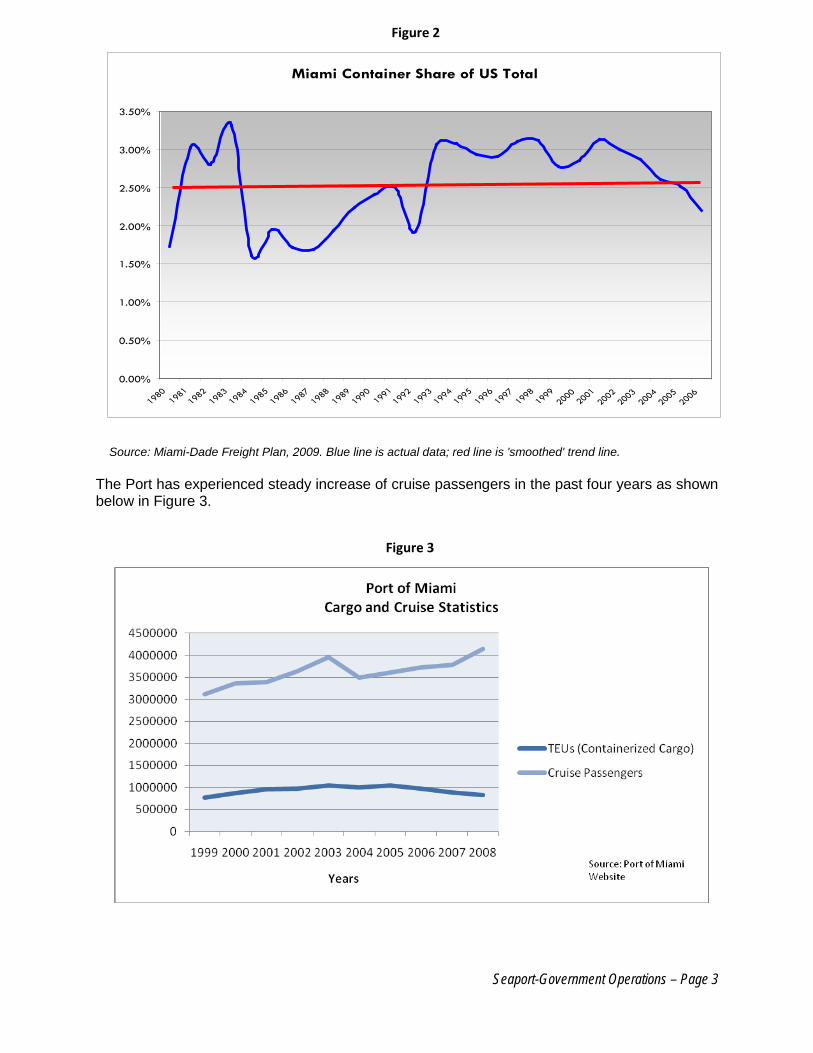
Government Operations Assessment Area Miami-Dade County government is comprised of 58 departments with more than 28,000 employees working to serve the needs of the County’s residents and businesses. The County provides countywide services for all Miami-Dade residents such as emergency management, mass transit and elections. Municipal-type services such as police, parks, public works, and zoning are also provided by the County to the approximately 1.081 million (or 43.8 percent) residents living in the Unincorporated Municipal Service Area (UMSA). If UMSA was declared a city, it would form the largest city in Florida and one of the largest in the nation. Providing services requires significant purchases of materials and services and access to reliable energy, both electricity and fuel, to support operations, equipment and vehicles. And, in the process of providing services to the community, government operations consume millions of gallons of fuel for a variety of purposes such as light duty passenger cars; heavy duty vehicles such as buses, fire trucks and garbage trucks; heavy duty equipment such as mowers, bulldozers, and bucket trucks; and pumps for water and sewer services and storm water control. In addition, the County owns or leases nearly 1,500 facilities with a combined floor area of over 48.2 million square feet. About 96 percent of these facilities are county-owned, and vary widely in size and function. This section examines the consumption of fuel, electricity and water for all county operations, and the scope of county purchasing. It also examines airport and seaport operations and their importance as an economic engine for the local economy. This self-assessment identifies challenges, establishes a sustainability baseline, and will position county government to lead the community-wide sustainability planning effort. The Miami-Dade Aviation Department’s (MDAD) mission is to cost effectively operate airport facilities that are safe, efficient, customer friendly, environmentally responsible and contribute to the economic growth of the community. MDAD must ensure the quick and safe transport of people and goods via multiple methods of transport: aircraft, truck, and passenger vehicles. The internal operations of the airport itself, from aircraft to ground support vehicles, as well as the operations of industrial tenants and companies that transport passengers and cargo, have a great potential for impacting the surrounding natural environment and resources. The Seaport Department provides service to cruise passengers, cargo shipping commerce, and other members of the maritime community. The Port operates as a tenant-landlord port with container terminals operated by several private terminal companies. Tenants and ancillary services that transport passengers and goods have a great potential for impacting the surrounding natural environment and resources. Moving people and goods efficiently naturally translates to environmental benefits through a reduction in the consumption of resources and emissions. The County is positioned to leverage its purchasing power to influence the market in both price and availability of environmentally-preferred products in the marketplace. “Green” or Environmentally Preferable Purchasing (EPP) includes the selection of products and services that have a lesser or reduced effect on human health and the environment when compared with competing products or services that serve the same purpose.
To date, much has already been accomplished. To facilitate the sustainable transformation of the County with respect to organizational culture, operations, infrastructure, and service delivery, the Office of Sustainability was created in 2007. The office assists departments and leads initiatives that enable the County to target and realize improved performance that simultaneously values economic, social and environmental impacts and opportunities. And, working together with the Office of Strategic Business Management, for the first time all departments are required to include sustainability efforts in their FY 2009-10 business plans and link them to their performance scorecard, as well as track their fuel and electricity consumption.
Our challenge is to continue providing these essential services and shift our business operations to a more sustainable, energy efficient and, in the long run, more economical model. This assessment, the first milestone in creating a community sustainability plan, is a huge step in the right direction towards achieving our energy and greenhouse gas reduction goals.
Electricity- Government Operations - Page 1
Electricity – Government Operations Assessment Area Miami-Dade County government operations account for approximately four percent of the total energy consumed community wide. In 2008 the County used approximately 1.18 billion kilowatt hours (kWh) in 2008 at a cost of $117 million dollars (at the time of this assessment, 2009 data had not been finalized). Initiatives to reduce energy consumption have been in place for years including the extensive program for the energy-efficiency retrofit of existing buildings as well as more recent initiatives like the Sustainable Buildings Ordinance in 2007. Even more recent is the new array of projects to be funded through several million dollars in federal energy-efficiency grant dollars designed to greatly improve centralized management of electricity consumption, improve energy efficiency of facilities and pilot the use of innovative and emerging energy efficiency and alternative/renewable energy technologies. Challenges implementing these existing programs remain as do opportunities to embark on new ones, due to the sheer demand and diversity of electricity consumption in county operations.
SUMMARY OF KEY SUSTAINABILITY CHALLENGES Main challenges identified through collaborative stakeholder analysis of assessment data & indicators
Meeting the goal of reducing electricity consumption in county operations by 20 percent by 2014. This would require an approximate three percent reduction per year versus a current growth trend of more than two percent per year.
Managing energy consumption in new energy intensive operations such as the High Level Disinfection (HLD) plant currently under construction. HLD is a precursor to the future reclaiming of wastewater.
Improving our understanding of how we use electricity and the efficiency of existing facilities and their systems without costly energy management systems.
Decreasing peak load demand. Peak load demand results in the use of less efficient and high polluting power generation fuels.
Maximizing the energy-efficiency of new and existing buildings by improving current capital planning, budgeting, design, construction and operations procedures.
Increasing the awareness and use of the energy performance contracting program as a critical tool in achieving energy and water reduction target reductions.
Securing financing of energy-efficiency and conservation improvements for both low-cost behavior-based and higher cost retrofit opportunities. This includes currently underutilized Federal tax credit incentives for retrofits, tax credit bonds and rebates and incentives available through our utility, as well as significantly increasing the use of performance-based contracting amongst County departments.
Securing financing for renewable energy projects/production. Making energy (both electricity and fuel consumption) an important performance issue for the entire Miami-Dade County enterprise including the development and implementation of an energy master plan.
ASSESSMENT DATA & INDICATORS Data and analysis to identify key challenges & establish a sustainability baseline
Addressing our energy management challenges will require a coordinated and performance-oriented effort across the enterprise. Figure 1 provides information on a current preliminary self assessment of Miami-Dade‟s energy management capabilities across a series of parameters.1
1 Source: Energy Management and Research Associates: www.emra.com
Electricity- Government Operations - Page 2
Some of these scores below are quite different than if they were reported a year or even six months ago due to the emerging energy management initiatives. Just like any other significant performance issue for an organization, effective and strategic planning for the use of energy requires an emphasis on policy, organizational coordination, behavior/cultural change, information management, marketing and investment.
Energy Demand/Consumption Electricity consumption (kWh) related to County government operations has seen an average annual increase of 2.35 percent since 2004 (Figure 2), and an associated 12.04 percent average annual increase in costs (Figure 3).
Figure 1: Self-Evaluation of MDC Energy Management Capabilities
Electricity- Government Operations - Page 3
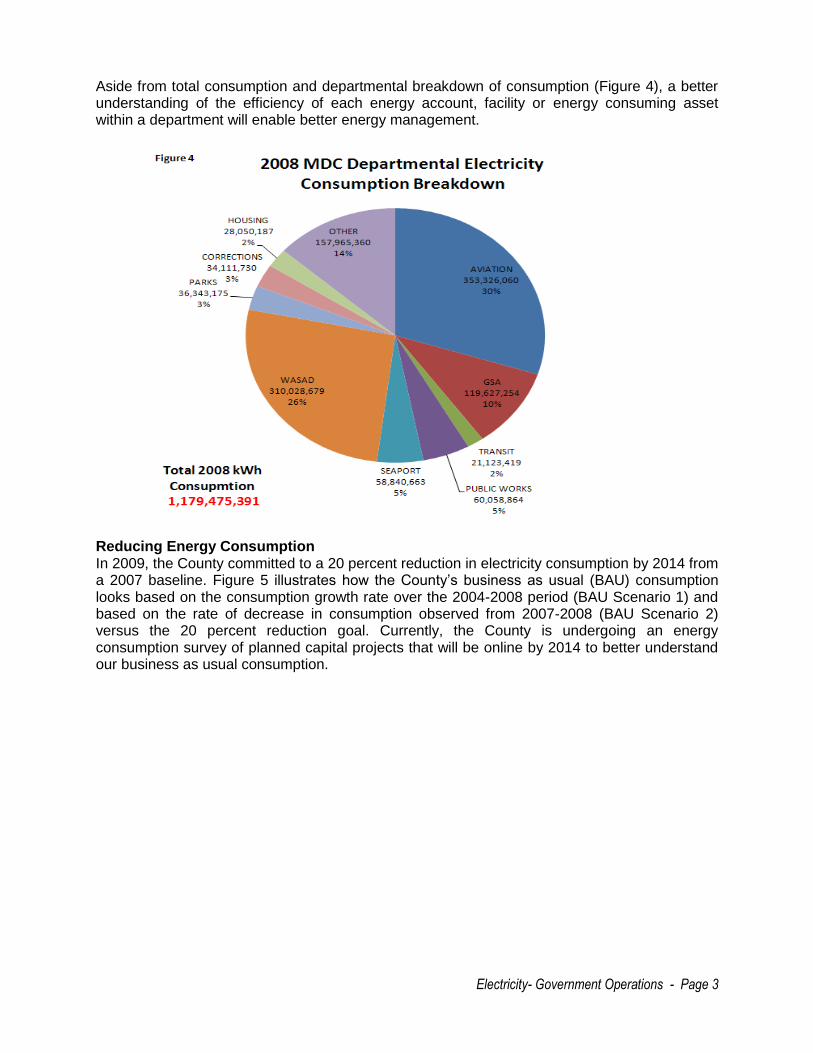
Aside from total consumption and departmental breakdown of consumption (Figure 4), a better understanding of the efficiency of each energy account, facility or energy consuming asset within a department will enable better energy management.
Reducing Energy Consumption In 2009, the County committed to a 20 percent reduction in electricity consumption by 2014 from a 2007 baseline. Figure 5 illustrates how the County‟s business as usual (BAU) consumption looks based on the consumption growth rate over the 2004-2008 period (BAU Scenario 1) and based on the rate of decrease in consumption observed from 2007-2008 (BAU Scenario 2) versus the 20 percent reduction goal. Currently, the County is undergoing an energy consumption survey of planned capital projects that will be online by 2014 to better understand our business as usual consumption.
Electricity- Government Operations - Page 4
EPA Energy Star Portfolio Manager The County is embarking on improved tracking of energy efficiency beginning with its use of the EPA Energy Star Portfolio Manager (PM) facility energy performance benchmarking tool to evaluate energy performance of facilities on an on-going basis. In an effort to improve the understanding of how energy-efficient many of the facilities the County owns and operates are, the County began benchmarking the energy performance of facilities in 2008 utilizing EPA Energy Star PM online software tool. PM provides a score for a facility which is relative to the performance of a similar building elsewhere in the US normalized for weather conditions. The score is derived from a combination of electricity consumption and space utilization data (e.g. number of occupants, square footage, number of computers, use type information, etc.). A score of 50, for example, equates to performance that is better than 50 percent of buildings of the same type - verify. Building with scores of greater than or equal to 75 can apply for certification. While 30+ General Services Administration (GSA) buildings are currently tracked through PM, seven are certifiable:
Facility As of 2nd Quarter
2009 Score
State Attorney Building 97
Gerstein Justice Building 91
Cooperative Extension Service 77
Metro Annex Building 77
Elections/311Building 75
Once a baseline score is established for a facility, building users together with building/facility managers can together implement an appropriate sequence of low-cost/no-cost behavior changes and facility improvements to improve the energy efficiency and potentially increase the PM score of the facility. Future indicators that this program will provide include (1) number of facilities tracked through PM and (2) change in Energy Star scores for facilities from year to year (choose a month within the year to compare scores from year to year). Performance Contracting on Existing Buildings On June 2, 1998, the Board adopted R-614-98, which authorized four contracts that effectively created the County‟s first energy conservation performance program. The County subsequently
Electricity- Government Operations - Page 5
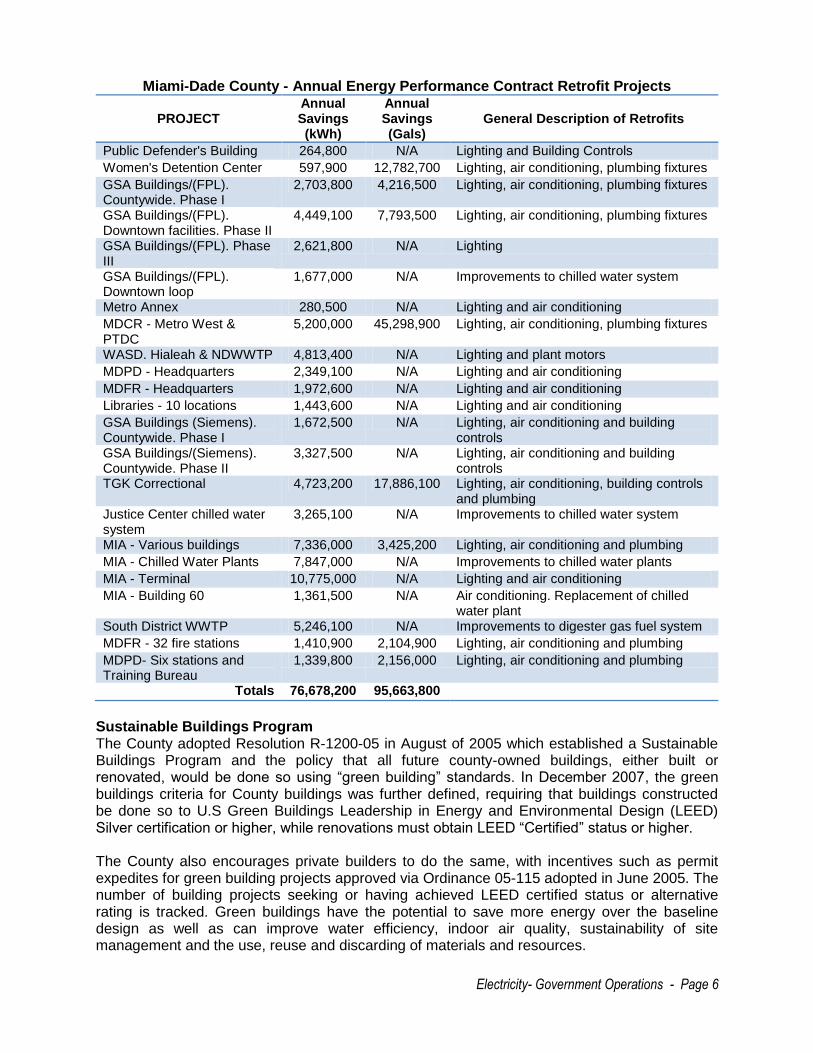
utilized the contracts approved under this resolution to perform over $50 million in energy conservation improvements in County facilities, the result of which has been to create a recurring reduction in consumption of nearly 76.7 million kilowatt hours of electricity and over 95.6 million gallons of water every year. Although that program expired in 2008, the County has utilized a State of Florida term contract to be able to continue and expand upon the energy performance contracting work done by the County. This has enabled the County to establish a new pool of vendors pre-qualified to provide Energy Performance Contracting services. The pool currently has 10 vendors, including the three employed by the County under the prior contracts. Among these 10 firms are several of the largest, most experienced firms in the industry. The larger size of the pool, together with the depth of experience on the part of individual firms, provides the County with increased competition and capacity to perform energy performance improvement projects. Energy performance contracting provides an invaluable tool for local, state, and federal government agencies to identify, finance and perform energy conservation improvements. Such programs generally offer three major advantages to other capital improvement options. First, projects are typically performed significantly faster than through traditional procurement methods, due to the use of pre-established contractor pools and a design/build project structure. Second, financing for such projects is typically provided via non-capital lease-purchase agreements. The projects qualify for tax-exempt municipal lease rates, which lowers the overall cost of financing. Governments incur no capital obligation and lease payments are contingent only upon annual budget appropriations. And third, the vendors assigned work – each of which is a highly qualified Energy Services Company (ESCO) – contractually guarantee that the equipment procured and installed will achieve the promised energy savings. Thus, each project is backed by a guarantee from an ESCO that project savings will be sufficient to cover the customer's debt service or lease payments. Should project savings (in energy and maintenance expense) fall short of the amount needed to cover the debt, the ESCO pays the difference. In order to achieve the greatest results, the program has generally focused on the largest accounts e.g. those consuming over 500,000 kilowatt hours (kWh) per year. With respect to the 2007 tally of accounts, a total of 331 of 3,708 or 8 percent of accounts consumed above this level and their collective consumption accounted for 83 percent of the County‟s total electricity consumption. Potential retrofit activities include energy efficient lighting systems and ballasts, high-efficiency chillers, more efficient water heating systems, building envelope improvements (insulation, storm windows and doors, etc.), low-water consumption toilets, higher efficiency electric motors and drives, replacement of process pumps (e.g. at water and sewer treatment plants), upgrading of heating, ventilation and air conditioning systems, automatic energy control systems, and renewable energy systems (solar, wind, biomass). The projects implemented to date are listed below, together with the reductions in electricity and water consumption for each project. As mentioned above, the annual reduction in electricity consumed totals 76,678,200 kilowatt hours, while the annual reduction in water use totals 95,663,800 gallons.2 Total electricity savings from these projects (calculated at 2009 utility rates) is $7.948 million per year.
2 Please see the Water sub-section of Government Operations for more information on water use
reduction initiatives for County facilities.
Electricity- Government Operations - Page 6
Miami-Dade County - Annual Energy Performance Contract Retrofit Projects
PROJECT Annual Savings (kWh)
Annual Savings (Gals)
General Description of Retrofits
Public Defender's Building 264,800 N/A Lighting and Building Controls
Women's Detention Center 597,900 12,782,700 Lighting, air conditioning, plumbing fixtures
GSA Buildings/(FPL). Countywide. Phase I
2,703,800 4,216,500 Lighting, air conditioning, plumbing fixtures
GSA Buildings/(FPL). Downtown facilities. Phase II
4,449,100 7,793,500 Lighting, air conditioning, plumbing fixtures
GSA Buildings/(FPL). Phase III
2,621,800 N/A Lighting
GSA Buildings/(FPL). Downtown loop
1,677,000 N/A Improvements to chilled water system
Metro Annex 280,500 N/A Lighting and air conditioning
MDCR - Metro West & PTDC
5,200,000 45,298,900 Lighting, air conditioning, plumbing fixtures
WASD. Hialeah & NDWWTP 4,813,400 N/A Lighting and plant motors
MDPD - Headquarters 2,349,100 N/A Lighting and air conditioning
MDFR - Headquarters 1,972,600 N/A Lighting and air conditioning
Libraries - 10 locations 1,443,600 N/A Lighting and air conditioning
GSA Buildings (Siemens). Countywide. Phase I
1,672,500 N/A Lighting, air conditioning and building controls
GSA Buildings/(Siemens). Countywide. Phase II
3,327,500 N/A Lighting, air conditioning and building controls
TGK Correctional 4,723,200 17,886,100 Lighting, air conditioning, building controls and plumbing
Justice Center chilled water system
3,265,100 N/A Improvements to chilled water system
MIA - Various buildings 7,336,000 3,425,200 Lighting, air conditioning and plumbing
MIA - Chilled Water Plants 7,847,000 N/A Improvements to chilled water plants
MIA - Terminal 10,775,000 N/A Lighting and air conditioning
MIA - Building 60 1,361,500 N/A Air conditioning. Replacement of chilled water plant
South District WWTP 5,246,100 N/A Improvements to digester gas fuel system
MDFR - 32 fire stations 1,410,900 2,104,900 Lighting, air conditioning and plumbing
MDPD- Six stations and Training Bureau
1,339,800 2,156,000 Lighting, air conditioning and plumbing
Totals 76,678,200 95,663,800
Sustainable Buildings Program The County adopted Resolution R-1200-05 in August of 2005 which established a Sustainable Buildings Program and the policy that all future county-owned buildings, either built or renovated, would be done so using “green building” standards. In December 2007, the green buildings criteria for County buildings was further defined, requiring that buildings constructed be done so to U.S Green Buildings Leadership in Energy and Environmental Design (LEED) Silver certification or higher, while renovations must obtain LEED “Certified” status or higher. The County also encourages private builders to do the same, with incentives such as permit expedites for green building projects approved via Ordinance 05-115 adopted in June 2005. The number of building projects seeking or having achieved LEED certified status or alternative rating is tracked. Green buildings have the potential to save more energy over the baseline design as well as can improve water efficiency, indoor air quality, sustainability of site management and the use, reuse and discarding of materials and resources.
Electricity- Government Operations - Page 7
The latest version of the US Green Building Council‟s LEED standard includes a requirement that certified projects submit their energy performance data over time. This is to ensure that actual consumption is meeting the intended design-based consumption. As such we can expect the green building design and construction process to be an important part of managing our energy growth for new capital construction and the renovation of existing facilities. The Sustainable Buildings Program Annual Report was released in January of 2010 and provided the latest update on all capital projects seeking green building certification or the integration of sustainable measures. Future indicators include tracking of the design determined energy consumption for each ordinance-qualifying building project and tracking of actual vs. planned energy consumption for completed buildings.
Improving Management & Measurement of Energy Use As the County further improves and integrates a culture of energy management across departments, tools, process and control strategies and behavior-based conservation programs will enable us to continuously maximize energy efficiency. Some areas where we can make significant improvements include centralized coordination of energy policy, making available and using real-time information on energy consumption. This would enable “continuous commissioning” of energy consuming mechanical, electrical and plumbing systems. Ultimately, energy performance would be linked organizational performance across lines of service delivery and operations management.
With respect to commissioning, or the periodic assessment of mechanical, electrical and/or plumbing systems such as air conditioning handling units to ensure they are continuing to operate to meet the needs of facilities while maximizing energy efficiency, we do practice a standard building commissioning of new buildings and the retro or re-commissioning of existing facilities. Wear and tear on mechanical equipment impacts electricity load and timely maintenance can increase both the life expectancy and efficiency of equipment. Similarly the use of facilities and equipment changes over time and requires mechanical systems to be adjusted. This assessment process has shown that we have a data gap which is the commissioning history of County facilities.
The Green Building movement is raising the standard for commissioning, encouraging “enhanced commissioning,” and new technology is making the idea of “continuous commissioning” a reality. Miami-Dade‟s Capital Improvement Department‟s Equitable Distribution Pool (EDP) has identified a pool of contractors that will enable capital departments to access commissioning services for our sustainable building projects. Through the Energy Efficiency and Conservation Block Grant (EECBG) Program the County is currently developing a strategy and pilot project to put in place the software, hardware and management/coordination capabilities to enable culture of “continuous commissioning.” This will result in timely predictive maintenance versus routine preventative maintenance as well as prompt end-users to conserve energy. Currently some real-time information is utilized for improved mechanical systems management through Building Management Systems equipment and software in place in various facilities in the County.
In relating energy use to our actual organization performance for the services we deliver and the efficiency of our operations, we can increase the use of Energy Use Indices (EUIs) which track energy consumption across various operating parameters. For example, the Miami-Dade Water and Sewer Department (WASD) has the ability to track BTUs required to produce a particular amount of treated water or wastewater. This EUI metric could provide important information for WASD‟s business model development over time with impacts on capital planning and conservation programs.
Electricity- Government Operations - Page 8
Energy Efficient & Alternative Energy Technologies The aggressive integration of energy efficient and alternative energy generation technologies will be required for the County to meet electricity reduction, climate change mitigation goals and improve resiliency of operations during natural disaster events that disable the electricity grid. Since the up-front capital costs are the most significant obstacle to implementing renewable energy projects, the County has to seek innovative ways of financing including (1) performance-based contracting to bundle long-term payback of renewable energy with the shorter-term payback associated with energy efficiency improvements, (2) Federal tax-credit bonds that enable a discounted interest rate on bonds utilized for clean and renewable energy projects and (3) power purchase agreements (contracts between the County and an energy provider to buy solar energy services, for example, over a fixed period of time). The „Existing Efforts‟ category of this section details several current efficiency and alternative energy projects.
Future indicators include (1) anticipated percent of grid-sourced electricity displaced through the use of energy-efficient and alternative energy technologies for new construction and retrofit projects and (2) measured kWh generated annually through the implementation of these technologies. EXISTING EFFORTS Consolidates current plans, goals, and initiatives related to the specific assessment area Comprehensive Development Master Plan How and where we build County buildings impact both our total energy consumption and how efficiently we use what we consume. The Comprehensive Development Master Plan (CDMP) addresses energy consumption. Land Use Element 10 (LU-10) of the CDMP states that energy efficient development shall be accomplished and LU-10C states that Miami-Dade County shall encourage energy conservation by adopting Florida Green Building Coalition, US Green Building Council Leadership in Energy and Environmental Design (LEED), or other acceptable commercial building standards for County-owned facilities. Existing Legislation State The Florida State Statute 255.2575 on Energy-efficient and Sustainable Buildings (2009) - All county, municipal, school district, water management district, state university, community college, and Florida state court buildings shall be constructed to meet the United States Green Building Council (USGBC) Leadership in Energy and Environmental Design (LEED) rating system, the Green Building Initiative's Green Globes rating system, the Florida Green Building Coalition standards, or a nationally recognized, high-performance green building rating system as approved by the Department of Management Services. Local The following list includes some of the Board‟s adopted legislation related to energy and government operations. A complete inventory of sustainability related legislation is provided as an appendix.
R-502-07: Energy Star Qualified Compact Fluorescent Lamps Resolution (2007) Requires the phased replacement of incandescent light bulbs in County-owned and County-operated buildings with Energy Star qualified compact fluorescent lamps (CFLs)
Electricity- Government Operations - Page 9
R-737-07: Establish system to buy, sell and trade renewable energy credits from Landfill Gas Project and future projects (2007)
R-740-08: Create Energy Performance Contracting Program in the amount of 40 million dollars for a period of 5 years (2008)
R-1244-08: Explore use of high frequency plasma electrodeless induction lamps in County buildings and facilities (2009)
R-1431-08: Miami-Dade’s Commitment through the Cool Counties (2009) Commits to region-wide goal of reducing greenhouse gas emissions by 80 percent by 2050, and a 2 percent reduction each year beginning in 2010.
R-228-09: Reduce County Electrical Energy Consumption (2009) Reduce electricity consumption from government operations by 20 percent over the 2007-2014 time period
R-746-09: LED City Partnership Pilot study of Light Emitting Diode (2009) Evaluate the potential for the County to join the LED City Partnership; indentify an appropriate project, funding sources, potential grants, and expected efficiency and carbon emission gains for a pilot study of LED outdoor lighting and provide recommendations to the Board.
Current Initiatives Energy Efficiency Conservation Block Grant The US DOE Energy Efficiency & Conservation Block Grant (EECBG) formula allocation in the amount of $12.5 million awarded to the County in September 2009 is currently spurring new activities addressed at the larger community. Federal grant dollars will go toward energy management and construction projects, citizen outreach and education, pilot programs and more. Funds from the grant will also help create local green jobs. The County‟s integrated Energy Efficiency Conservation Strategy includes the following projects:
Enterprise-wide and Facility-based Energy Management Systems Upgrade and Coordination
Development of Sustainable Capital Improvement Procedures and Guidelines
Methane Sequestration from Landfill and Digesters to Power Operations of Facilities
Energy-Efficient +Sustainable Buildings Evaluation of Building Codes & Permitting Processes
Urban Wind Energy Harvesting Demonstration and Pilot Project
Pilot Desktop Virtualization Project (Thin Clients)
Energy Efficient Lighting on "Green Roadway" Demonstration Project
Solar Power Systems Demonstration for Powering of Three County Park Buildings
Sustainable Technologies Demonstration Program
Electricity- Government Operations - Page 10
Existing energy efficiency and alternative energy technology projects include, but are not limited to:
LED Traffic Signal Head Conversion – Public Works Department Miami-Dade County completed its 12-inch (12”) Traffic Signal Head Light Emitting Diode (LED) Conversion Project in March 2009. During the 18 months prior to this date, 65,000 incandescent bulbs were converted to LED modules with a coverage of 3400 powered traffic control devices between Florida City and Broward County line. The conversion has reduced annual electricity consumption by 18,000 mWh and costs by roughly $1.8 million with an estimated payback of four years. The County is investigating the possibility of using remaining project funds to upgrade about 300 8-inch (8”) incandescent signal heads to 12-inch (12”) LED heads.
LED Pedestrian Crosswalk Signal Heads Conversion – Public Works Department The County is currently converting 10,300 pedestrian crosswalk neon signal heads to LED. So far 1,020 heads have been converted, representing an estimated annual reduction in electricity consumption of 44,676 kWh and cost of $4,468. This conversion will continue incrementally over a five-year period as existing neon heads fail.
Digester Gas Recovery and Co-generation – Water and Sewer Department The recovery of digester gas at both the County‟s South District and Central District Water Treatment Plants for the generation of electricity helps run the operations of both these treatment plants. Based on operational data over the 1997 to 2007 time period, the average annual kWh generated through this process is 8,463,586 kWh at the South District plant and 14,631,700 kWh at the Central District Plant. The annual average avoided electricity cost for each of these plants respectively is $491,858 and 793,362.
Solar Powered Infrastructure This has been identified as a data gap information on electricity generated from solar photovoltaic (PV) systems installed as part of County infrastructure including solar powered crosswalk signals and solar powered bus shelters.
COMMUNITY FEEDBACK Feedback & results gathered though the planning process or surveys No feedback is available at this time.
Fuel – Government Operations - Page 1
Fuel – Government Operations Assessment Area In the process of providing services to the community, government operations consume millions of gallons of fuel (see indicators below), producing hundreds of thousands of tons of greenhouse gases (GHG) and other air pollutants. Fuel is used for a variety of purposes such as light duty passenger cars; heavy duty vehicles such as buses, fire trucks and garbage trucks; heavy duty equipment such as mowers, bulldozers, and bucket trucks; and pumps for water and sewer services and storm water control. Each of these uses offers opportunities for fuel use and/or emissions reductions. Due to the high volume of use and variety of uses, an effective emissions reduction program will need to employ many different strategies. These set of strategies might include installing more efficient motors and engines, selecting equipment or fleet that can use a fuel type with lower net life-cycle emissions, or simply decreasing vehicle use through route optimization, video-conferencing, and telecommuting. Overall, the County is challenged with determining which combination of strategies it will utilize to achieve its commitment to reducing fuel-related emissions. While many of the County’s internal policies and actions provide an opportunity for fuel/emissions reductions, some also have the potential to increase fuel consumption. For example, take-home (24-hour) vehicle programs increase County fuel consumption. And the County fleet vehicle replacement policy (requiring replacements every 10 years or 100,000 miles), which was extended in line with manufacturer’s recommendations, results in the delay of the introduction of newer, more efficient vehicles. For obvious fiscal reasons, studies are conducted and policies are in place to serve other needs (minimizing costs during times of economic contraction). For example, in 2007 the County performed a light duty vehicle analysis (County Review of County Owned Light Vehicles). As a result of the analysis, the County now has a surplus of replacement vehicles while it continues to operate older less fuel-efficient vehicles with higher fuel consumption and emissions. The challenge is to conduct these reviews by balancing the short term necessity with long term effects.
In addition, County infrastructure, policies, and procedures greatly influence the fuel consumption of residents and businesses, described in more detail in the Energy and Climate Change sections of this Assessment Report.
SUMMARY OF KEY SUSTAINABILITY CHALLENGES Main challenges identified through collaborative stakeholder analysis of assessment data & indicators
• Reducing fuel consumption while still meeting needs of internal and external customers.
• Continuing reductions in fuel consumption to save money and also maintain a fuel efficient fleet.
• Recognizing that it is acceptable for the County to see an increase in fuel consumption and emissions resulting from an increase in ridership on public transportation.
• Keeping resources and attention focused on strategies and technologies that both increase fuel efficiency (miles per gallon or MPG) and reduce vehicle miles traveled (VMT) instead of simply displacing fossil fuels with alternative fuels.
• Reducing air pollutant and greenhouse gas emissions from older diesel-powered vehicles and equipment in the County fleet through retrofit, repower, or replacement projects.
Fuel – Government Operations - Page 2
• Making fuel choices based on net benefits, including life-cycle analysis to address the misconception that all alternative fuels are environmentally preferable.
• Introducing greener fuels in the face of associated infrastructure modifications and expenses.
• Establishing department specific fuel reduction targets as opposed to overall reduction targets - from broad fuel reduction policies to measurable implementation.
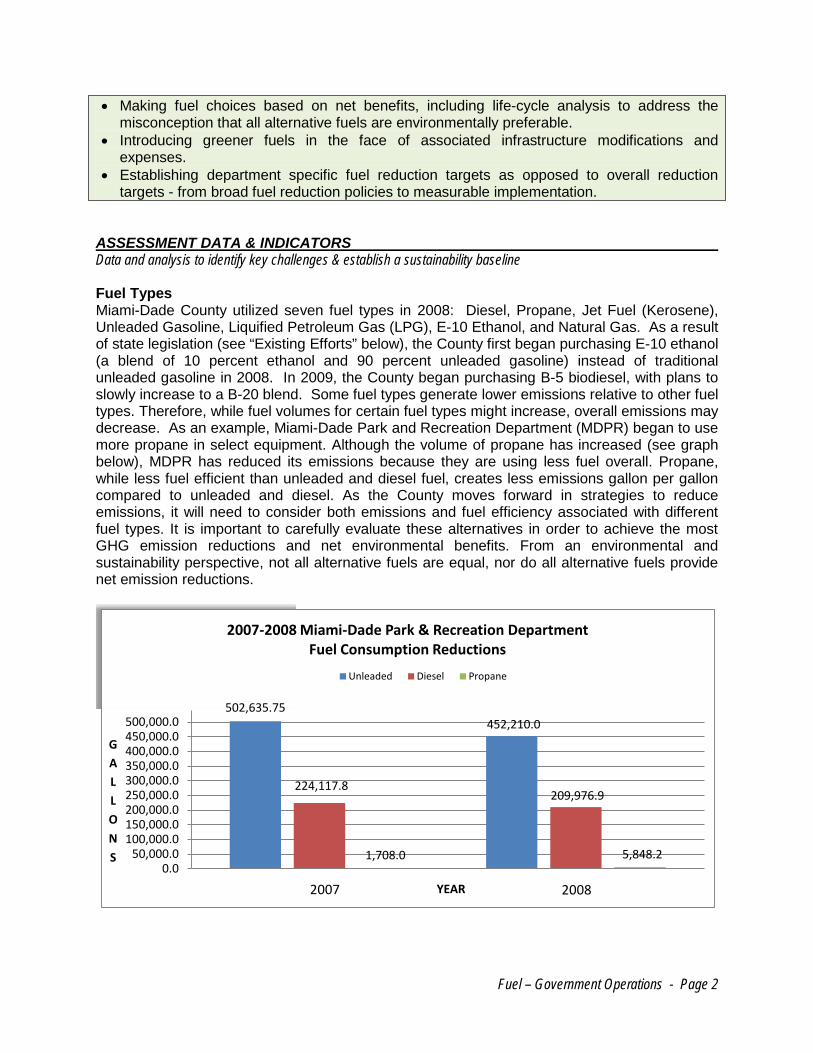
ASSESSMENT DATA & INDICATORS Data and analysis to identify key challenges & establish a sustainability baseline Fuel Types Miami-Dade County utilized seven fuel types in 2008: Diesel, Propane, Jet Fuel (Kerosene), Unleaded Gasoline, Liquified Petroleum Gas (LPG), E-10 Ethanol, and Natural Gas. As a result of state legislation (see “Existing Efforts” below), the County first began purchasing E-10 ethanol (a blend of 10 percent ethanol and 90 percent unleaded gasoline) instead of traditional unleaded gasoline in 2008. In 2009, the County began purchasing B-5 biodiesel, with plans to slowly increase to a B-20 blend. Some fuel types generate lower emissions relative to other fuel types. Therefore, while fuel volumes for certain fuel types might increase, overall emissions may decrease. As an example, Miami-Dade Park and Recreation Department (MDPR) began to use more propane in select equipment. Although the volume of propane has increased (see graph below), MDPR has reduced its emissions because they are using less fuel overall. Propane, while less fuel efficient than unleaded and diesel fuel, creates less emissions gallon per gallon compared to unleaded and diesel. As the County moves forward in strategies to reduce emissions, it will need to consider both emissions and fuel efficiency associated with different fuel types. It is important to carefully evaluate these alternatives in order to achieve the most GHG emission reductions and net environmental benefits. From an environmental and sustainability perspective, not all alternative fuels are equal, nor do all alternative fuels provide net emission reductions.
2007-2008 Miami-Dade Park & Recreation Department Fuel Consumption Reductions
Unleaded Diesel Propane
20082007
Fuel – Government Operations - Page 3
Fuel Consumption As a result of the County’s membership in the Chicago Climate Exchange (CCX), the County has been rigorously tracking fuel consumption over the past few years (see “Existing Efforts below for more details on CCX). Miami-Dade County fleet and operations consumed over seven million gallons of unleaded fuel and over 19.5 million gallons of diesel fuel in 2008. Overall, fuel consumption (for all fuel types combined) increased from the County’s baseline year of 2000 (as determined by CCX) to 2007, but decreased slightly from 2007 and 2008. Fuel consumption facts that might be of particular interest include:
• Unleaded fuel consumption fell by 12 percent from FY 2001-02 to FY 2007-08, excluding law enforcement vehicles.
• Based on 2008 data, the Miami-Dade Police Department (MDPD) owned 39 percent of the County’s light fleet vehicles and used 58 percent of the County’s total unleaded gasoline.
• Based on 2008 data, the County’s bus fleet, operated by Miami-Dade Transit (MDT), consumes the majority of diesel fuel in the County’s heavy fleet (12,294,947 gallons).
*based on provisional data The County provides a myriad of services to the community and many of these services are provided through the use of fuel-consuming County vehicles or equipment. For example fire rescue employees must use vehicles to attend to emergencies and fuel-powered water treatment equipment must be kept running to provide clean drinking water to the community. Because the County cannot simply eliminate or reduce certain services, it must strive to provide services in different or more efficient ways to reduce fuel consumption. One particular challenge is that an increase in emissions due to the expansion of public transportation (expansion of ridership as well as routes and/or trip frequency) will correspond with a reduction in countywide emissions generated by personal vehicles (i.e. getting more people out of their cars and riding buses and trains will decrease countywide emissions, but increase County operation emissions). A method to measure or directly correlate this trade-off does not currently exist. Increases in efficiency standards of just one mile per gallon for all cars and light trucks can cut fossil fuel consumption even more than alternative fuels efforts. Careful vehicle selection, route management, and other strategies such as changing driver behaviors can also bring about significant fuel reductions. Alternative fuels need to be examined carefully, as many are not necessarily greener when considering ecosystem destruction, competition with food resources, and net full life cycle emissions. Vehicle Efficiency - Age One way to achieve fuel and emission reductions is to increase the fuel efficiency of the County’s fleet vehicles. Older vehicles, generally speaking, are more inefficient while other County-owned vehicles may be newer, but do not have top fuel efficiency ratings respective to other commercially available vehicles in their same class. As seen by the graph below, data
Fuel – Government Operations - Page 4
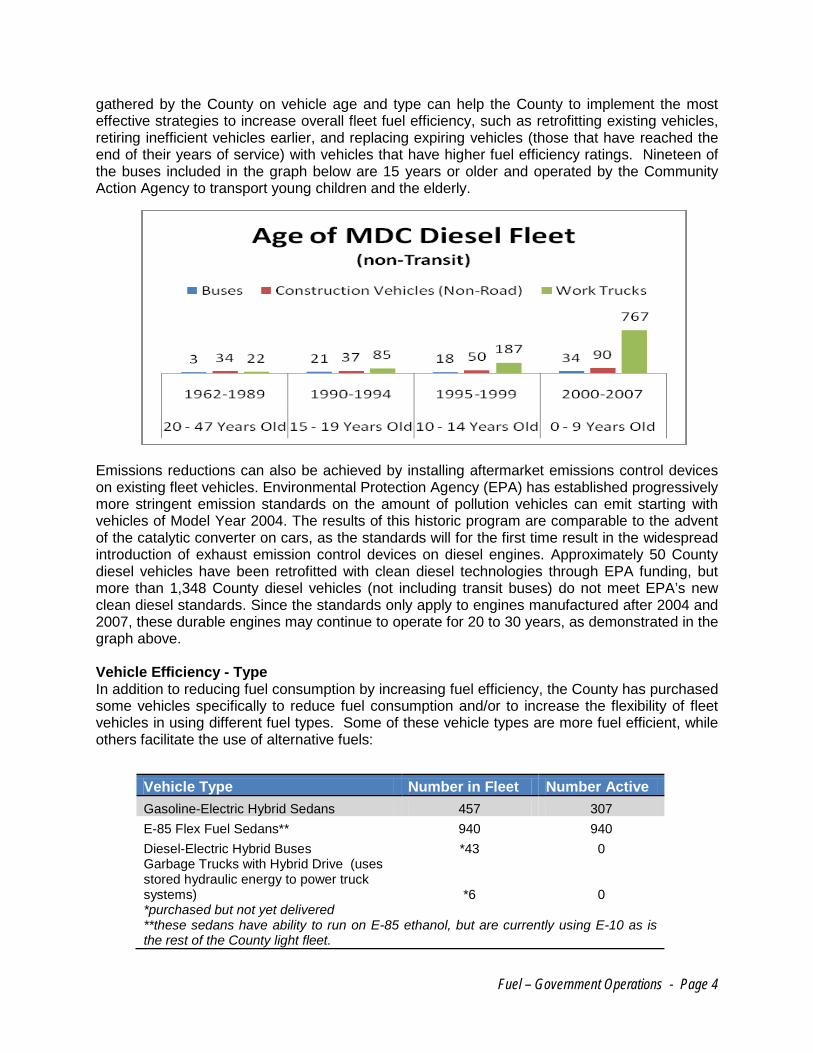
gathered by the County on vehicle age and type can help the County to implement the most effective strategies to increase overall fleet fuel efficiency, such as retrofitting existing vehicles, retiring inefficient vehicles earlier, and replacing expiring vehicles (those that have reached the end of their years of service) with vehicles that have higher fuel efficiency ratings. Nineteen of the buses included in the graph below are 15 years or older and operated by the Community Action Agency to transport young children and the elderly.
Emissions reductions can also be achieved by installing aftermarket emissions control devices on existing fleet vehicles. Environmental Protection Agency (EPA) has established progressively more stringent emission standards on the amount of pollution vehicles can emit starting with vehicles of Model Year 2004. The results of this historic program are comparable to the advent of the catalytic converter on cars, as the standards will for the first time result in the widespread introduction of exhaust emission control devices on diesel engines. Approximately 50 County diesel vehicles have been retrofitted with clean diesel technologies through EPA funding, but more than 1,348 County diesel vehicles (not including transit buses) do not meet EPA’s new clean diesel standards. Since the standards only apply to engines manufactured after 2004 and 2007, these durable engines may continue to operate for 20 to 30 years, as demonstrated in the graph above. Vehicle Efficiency - Type In addition to reducing fuel consumption by increasing fuel efficiency, the County has purchased some vehicles specifically to reduce fuel consumption and/or to increase the flexibility of fleet vehicles in using different fuel types. Some of these vehicle types are more fuel efficient, while others facilitate the use of alternative fuels:
Vehicle Type Number in Fleet Number Active
Gasoline-Electric Hybrid Sedans 457 307
E-85 Flex Fuel Sedans** 940 940
Diesel-Electric Hybrid Buses *43 0 Garbage Trucks with Hybrid Drive (uses stored hydraulic energy to power truck systems) *6 0 *purchased but not yet delivered **these sedans have ability to run on E-85 ethanol, but are currently using E-10 as is the rest of the County light fleet.
Fuel – Government Operations - Page 5
Greenhouse Gas Emissions In 2008, 32 percent of County government greenhouse gas (GHG) emissions were generated by fuel consumption, while 68 percent were from electricity use (see below graph).
As shown in the graph below, emissions reported in 2008 were lower than those reported in 2007, but still did not meet the County’s targets as established by its membership in the Chicago Climate Exchange (more details below under “Existing Efforts”).
Fuel – Government Operations - Page 6
Analyzing the source of emissions (see graph below) can help the County understand where fuel consumption efforts should be focused.
* Remaining Sources represents the 26 sources that each contributed less than 1% of the total emissions. Other Emissions In addition to GHG emissions, fuel combustion contributes to the release of other pollutants. For example, exhaust from diesel engines contains pollutants that contribute to:
• Lung cancer in humans and aggravated existing respiratory and cardiac diseases
• Global Climate Change
• the formation of ground level ozone (As noted in the Air Quality portion (5.a.) of this Report’s Environment Section, the County is likely to be designated as non-attainment for ozone in the near future.)
Therefore, increasing fuel efficiency of the County fleet has additional health and environmental benefits. EXISTING EFFORTS Consolidates current plans, goals, and initiatives related to the specific assessment area The expansion of public transportation and improved operational efficiencies all contribute to a net reduction of emissions from fuel consumption. Specific fuel-related goals and objectives are outlined below.
Fuel – Government Operations - Page 7
Chicago Climate Exchange Reflecting its leadership on climate change, the Board of County Commissioners authorized (Resolution No. R-757-07) the County to join the Chicago Climate Exchange (CCX) on June 26, 2007. CCX is a voluntary, but legally binding, market-based cap and trade program that requires members like Miami-Dade County to quantify, report, and reduce their greenhouse gas (GHG) emissions. Miami-Dade is one of the few governments in the United States that has made a contractual commitment to reduce its emissions related to fuel use in operations. Because emission reports are audited by a 3rd party independent contractor, Financial Industry Regulatory Authority (FINRA), CCX membership compels accountability among its members. While the County had been actively pursuing emission reductions in past decades, the legally binding and accountable nature of its CCX membership brought the County’s commitment to a higher level. In addition to creating protocols for rigorous fuel data collection and reporting, the County’s membership in CCX has also afforded the County with the opportunity to gain cutting edge experience in an active cap and trade carbon market system. As a member of CCX, the County has agreed to yearly fuel-related emissions reduction targets that lead to a six percent reduction below baseline 2000 calendar year levels by 2010 (roughly 15,000 metric tons CO2). The County has been obligated to purchase Carbon Financial Instruments (CFIs) for each year that it has not met reduction targets. The County’s CCX membership and experience with the carbon market is particularly timely considering proposed federal cap and trade legislation. (See “Legislation” below for more details.) 2035 Long Range Transportation Plan The Miami-Dade County Long Range Transportation Plan (LRTP) to the Year 2035 is a primary activity in the County's transportation planning process to meet federal and state requirements for an update of the Transportation Plan every five years. Federal law requires that the LRTP address minimum of a 20-year planning horizon. The LRTP ensures the proper management and efficient operations of transportation systems within the County as well as complements regional planning initiatives. The process, managed by the Metropolitan Planning Organization (MPO), requires analysis of current economic trends, an examination of socioeconomic conditions in planning areas, and the preparation of a final transportation vision for the Miami Urbanized Area. The LRTP includes the following:
• Goal 5: Protect and Preserve the Environment and Quality of Life and Promote Energy Conservation
o Objective 5.1: Minimize and mitigate air and water quality impacts of transportation facilities, services, and operations
o Objective 5.1: Reduce fossil fuels use o Objective 5.7: Promote the use of alternative vehicle technologies
Transit Development Plan, Major Update (TDP), FY2010 – FY2019 The TDP is a strategic development and operational guide for public transportation used by Miami-Dade Transit (MDT) for the next 10 year planning horizon. The Draft TDP includes an update of existing services, demographic and travel characteristics overview, a summary of local transit policies within the region, the development of proposed transit enhancements, and the preparation of a 10-year implementation plan that provides guidance for future MDT planning.
• Objective 5.2: Reduce fossil fuels consumption through the consideration of alternative fuel vehicle technology
o Measure: Number of gallons of bio-diesel fuel consumed. o Measure: Ratio of bio-diesel to standard clean diesel fuel consumed. o Measure: Number of hybrid technology buses in MDT fleet. o Measure: Average miles per gallon of bus fleet.
Fuel – Government Operations - Page 8
Existing Legislation Legislative initiatives at the federal, state, and local level regulate fuel standards.
Federal
• The American Clean Energy and Security Act of 2009 (ACES), known commonly as the Waxman-Markey Bill, proposes to establish a mandatory cap-and-trade program for greenhouse gas emissions nationwide. The program requires emissions reductions of 17% below 2005 levels by 2050 and would also require 20% of electricity to be produced from renewable resources. The bill was approved by the House of Representatives in 2009, but has yet to clear the full U.S. Senate. Additional proposed legislation related to emissions regulation is discussed under the Climate Change and Air Quality portions of this Assessment Report.
• The United States Energy Independence and Security Act (EISA) of 2007 required that renewable fuels result in lifetime greenhouse gas emissions reductions when compared to traditional fuels. The EPA was charged with creating a national Renewable Fuel Standard (RFS) program to enforce the EISA. The Renewable Fuel Standard specifies volume standards for cellulosic biofuel, biomass-based diesel, advanced biofuel, and total renewable fuel that must be used in transportation fuel each year. The revised statutory requirements also include new definitions and criteria for both renewable fuels and the feedstocks used to produce them, including new GHG thresholds for renewable fuels. The regulatory requirements for RFS will apply to domestic and foreign producers and importers of renewable fuel. EPA is expected to release the RFS final rule by November 30, 2009 setting the applicable standards for 2010.
• Proposed legislation related to emissions regulation and cap and trade are discussed under the Air Quality portion of this Assessment Report.
• EPA’s new National Clean Diesel Standards affect diesel engines manufactured from 2007 and on, and will result in particulate (PM) and nitrous oxide (NOx) emission levels that are 90 percent and 95 percent below today’s levels, respectively. The standards will for the first time result in the widespread introduction of exhaust emission control devices on diesel engines.
State
• In 2008, the State of Florida passed a bill specifying that, all gasoline sold or offered for sale in the state must contain 10 percent ethanol by volume (E10) by December 31, 2010 with exceptions provided. (Florida House Bill 7135, 2008).
• In addition, the state passed an anti-idling bill effective December 18, 2008 specifying that operators of heavy duty diesel engine motor vehicles are prohibited from idling more than five consecutive minutes with exceptions provided. (State of Florida, Rule 62-285.420 Florida Administrative Code)
Local There have been many local resolutions that directly or indirectly relate to fuel consumption. Following is a non-comprehensive list of resolutions with abbreviated descriptions illustrating the history and variety of legislation that has been adopted.
• Resolution R-1379-77: Established the requirement for life cycle analysis and costing procedures for certain commodities including all types of passenger vehicles, multi passenger vehicles (excluding buses), and specialized vehicles
Fuel – Government Operations - Page 9
• Resolution R-378-01: Directed County to implement a program to enhance the utilization of alternative fuel in County
• Resolution R-330-03: Authorized County to purchase hybrid vehicles
• Resolution R-969-03: Directed County to develop and implement a plan to reduce gasoline consumption by 20 percent over a five year period and to increase fuel efficiency of the County fleet
• Resolution R-1296-04: Directed County to report on the feasibility and advisability of purchasing biodiesel for County fleet buses
• Resolution R-936-05: Directed County to evaluate potential cost savings of using “flex-fuel / gasohol” or other alternative fuel sources for County fleet
• Resolution R-559-06: Supporting development of commercially available plug-in hybrid electric vehicles and partnerships to facilitate
• Resolution R-324-07: County to obtain membership in the Chicago Climate Exchange (CCX)
• Resolution R-461-07: Directed County to assess the feasibility of local biofuels production
• Resolution R-673-08: Directed County to explore the use of ethanol in County gas stations and public/private partnerships to utilize ethanol
• Resolution R-926-08: Required County fleet vehicles to be turned off when unattended with exceptions specified
• Resolution R-1372-08: Directed County to analyze the feasibility and advisability of using vehicles fueled by compressed natural gas
• Resolution R-83-09: Directed County to develop a plan for modifying diesel-powered fleet vehicles to allow use of biodiesel or vegetable oil
• Resolution R-86-08: Authorized contractual agreement for a report analyzing the feasibility of using biodiesel in MDT buses.
• Resolution R-996-09: Directed County procurement procedures for fuel saving products to require a comprehensive report from US EPA along with other criteria
Initiatives In addition to the Chicago Climate Exchange Initiative discussed above, R-969-03 directed County staff to develop and implement a plan to reduce unleaded gasoline consumption by 20 percent over a five-year period (by 2008) and to increase fuel efficiency of the County fleet. While the time period referenced in the resolution has ended, the Board directed staff to use the March 18, 2009 findings resulting from the initiative to continue reducing gasoline consumption.
Fuel – Government Operations - Page 10
In addition to overall County government goals and initiatives related to fuel consumption, many individual departments have their own goals and initiatives to reduce fuel consumption. For example, the Public Works, Park and Recreation, and the Aviation departments have all set their own internal fuel reduction goals. Below is an abbreviated list of department-level fuel related initiatives that target internal fuel consumption:
Department Fuel/Emissions
Reduction Initiative Brief Description
Enterprise Technology Services
Promotion of Internal Video Conferencing Capability
Provide departments with information on internal video conferencing capability and encourage use.
General Services Administration
Fuel-Efficient Vehicle Acquisition
Guide departments in acquisition of hybrids or fuel efficient cars
Park and Recreation
Improve Supply Delivery and Management
Purchase larger quantities of supplies, combine delivery and pickup of supplies and recyclables, and limit the number of special deliveries to reduce VMT.
Transit Kill-Switch Installation Automatic engine shutoff mechanism installed on all transit buses to reduce prolonged idling.
Transit Biweekly Tire Checks Tires on buses checked to ensure proper inflation and better fuel efficiency
Water and Sewer Department
Solar Equipment Upgrades
Purchase of solar powered Movement of Traffic (MOT) equipment instead of traditional fuel powered equivalent.
Multiple Departments
Clean Diesel Retrofits To date, approximately 50 county diesel vehicles have been retrofitted with clean diesel technologies through EPA National Clean Diesel Campaign (NCDC) funding.
Departments are also moving forward with initiatives that help with community-wide emissions. These initiatives are addressed in the Energy and Climate Change sections of this Assessment Report. COMMUNITY FEEDBACK Feedback & results gathered though the planning process or surveys No community feedback is available at this time.
Water – Government Operations - Page 1
Water – Government Operations Assessment Area Miami-Dade County consumes approximately 6.5 million gallons of water a day to carry out its operations. Most County facilities are located within the Miami-Dade Water and Sewer Department’s (WASD) service area. Those County facilities not within WASD’s service area are serviced by 13 municipal utilities located within the Miami-Dade. All consumption at County facilities is of potable water, since there is a limited amount of recycled water available for use. Improving water efficiency in government operations is an overarching challenge because of the sheer number of facilities and the diversity of operations, as well as the perceived cost of the conversion. Despite this, the County has addressed this issue for years as a part of the energy efficiency performance contracting program. Most recently, the Board of County Commissioners adopted Resolution 468-06 mandating the development of a comprehensive and community wide water conversation plan for the County and a directive for County facilities to lead by example. The County’s plan will include water use reduction goals and initiatives with timelines for meeting goals. Additionally, water conservation is being incorporated as a vital component of department action plans.
SUMMARY OF KEY SUSTAINABILITY CHALLENGES Main challenges identified through collaborative stakeholder analysis of assessment data & indicators
• Implementing recommendations from water use audits conducted at 36 county facilities given the current budgetary constraints.
• Implementing new systems to better track and identify water use in county operations. The current system needs additional analysis and reporting capabilities to provide more detailed information for planning purposes. Additional technology such as Advance Meter Infrastructure would provide benefits in the areas of consumption tracking and water loss.
• Developing a process for the identification of current irrigation practices for all county owned green spaces as part of developing best management practices for the irrigation of public green spaces including medians.
ASSESSMENT DATA & INDICATORS Data and analysis to identify key challenges & establish a sustainability baseline
Total Water Consumption at Government Facilities County facilities vary widely in size and function; some are serviced by WASD and others by municipalities. Many facilities were built at a time when water conservation was not a concern, therefore include less-efficient infrastructure. The graph below shows that the County uses approximately 6.5 million gallons daily (MGD). Water Conservation Audits The County facilities water conservation plan outlines a step-by-step process to help individual departments in the design and implementation of a successful water conservation program for county owned facilities. It also presents the various options for financing the conversion to water efficient operations. Water use audits have been conducted at 36 County facilities, and a comprehensive plan is being developed to complete all audits and implement recommendations. A preliminary
Water – Government Operations - Page 2
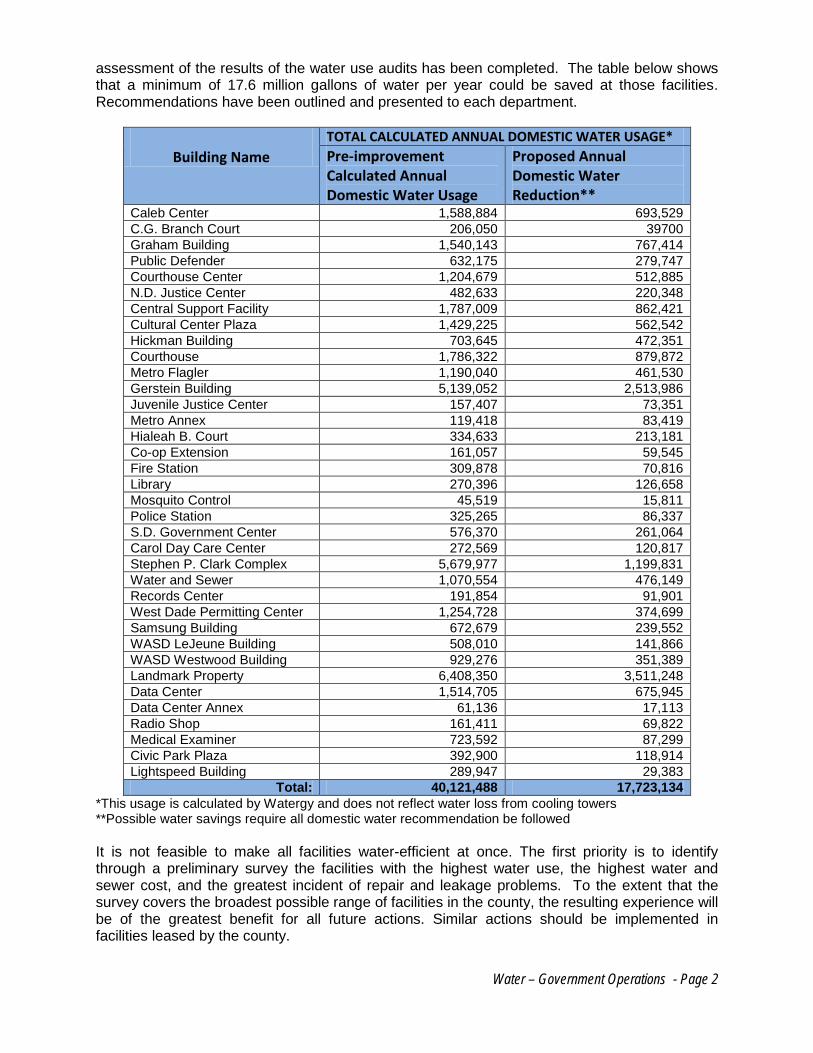
assessment of the results of the water use audits has been completed. The table below shows that a minimum of 17.6 million gallons of water per year could be saved at those facilities. Recommendations have been outlined and presented to each department.
Building Name
TOTAL CALCULATED ANNUAL DOMESTIC WATER USAGE* Pre-improvement Calculated Annual Domestic Water Usage
Proposed Annual Domestic Water Reduction**
Caleb Center 1,588,884 693,529
C.G. Branch Court 206,050 39700
Graham Building 1,540,143 767,414
Public Defender 632,175 279,747
Courthouse Center 1,204,679 512,885
N.D. Justice Center 482,633 220,348
Central Support Facility 1,787,009 862,421
Cultural Center Plaza 1,429,225 562,542
Hickman Building 703,645 472,351
Courthouse 1,786,322 879,872
Metro Flagler 1,190,040 461,530
Gerstein Building 5,139,052 2,513,986
Juvenile Justice Center 157,407 73,351
Metro Annex 119,418 83,419
Hialeah B. Court 334,633 213,181
Co-op Extension 161,057 59,545
Fire Station 309,878 70,816
Library 270,396 126,658
Mosquito Control 45,519 15,811
Police Station 325,265 86,337
S.D. Government Center 576,370 261,064
Carol Day Care Center 272,569 120,817
Stephen P. Clark Complex 5,679,977 1,199,831
Water and Sewer 1,070,554 476,149
Records Center 191,854 91,901
West Dade Permitting Center 1,254,728 374,699
Samsung Building 672,679 239,552
WASD LeJeune Building 508,010 141,866
WASD Westwood Building 929,276 351,389
Landmark Property 6,408,350 3,511,248
Data Center 1,514,705 675,945
Data Center Annex 61,136 17,113
Radio Shop 161,411 69,822
Medical Examiner 723,592 87,299
Civic Park Plaza 392,900 118,914
Lightspeed Building 289,947 29,383
Total: 40,121,488 17,723,134
*This usage is calculated by Watergy and does not reflect water loss from cooling towers **Possible water savings require all domestic water recommendation be followed
It is not feasible to make all facilities water-efficient at once. The first priority is to identify through a preliminary survey the facilities with the highest water use, the highest water and sewer cost, and the greatest incident of repair and leakage problems. To the extent that the survey covers the broadest possible range of facilities in the county, the resulting experience will be of the greatest benefit for all future actions. Similar actions should be implemented in facilities leased by the county.
Water – Government Operations - Page 3
Reduction at County Departments A number of departments have implemented water conservation initiatives. In 2008, the Miami-Dade Park and Recreation Department achieved savings of over $2 million. The chart below shows the total reductions in consumption for the 10 parks included in this initiative.
EXISTING EFFORTS Consolidates current plans, goals, and initiatives related to the specific assessment area Miami –Dade Water Use Efficiency Plan In April 2006, the Board of County Commissioners adopted Resolution R-468-06, which approved the County’s Water Use Efficiency Five-Year Plan that is goal based, accountable and measures water conservation efforts. Keystone to the plan is the implementation of the best management practices which enables the County to quantify its water savings. One of the components of the plan is the audit and retrofits of County facilities. COMMUNITY FEEDBACK Feedback & results gathered though the planning process or surveys Community feedback related to water is provided in the Water Area of this assessment and includes results from the following surveys:
• 2006 WASD Customer Satisfaction Survey
• Water Use Efficiency Survey
• Miami-Dade County Resident Satisfaction Survey
108,441 122,758
83,593
0.0020,000.0040,000.0060,000.0080,000.00
100,000.00120,000.00140,000.00
CONSUM /CCF 2006
CONSUMP /CCF 2007
CONSUMP / CCF 2008
Total Consumption For the selected Parks
Total Consumption For the selected Parks
Procurement-Government Operations - Page 1
Procurement - Government Operations Assessment Area Miami-Dade County makes significant purchases of materials and services. As of September 2009, the County had 1,145 active multi-year contracts with a maximum available contact capacity valued at $4,904,894,211.73. (This is not the amount appropriated per year, this is only the maximum available contract capacity. Yearly appropriations are made through the County’s budget process). The County is positioned to leverage its purchasing power to influence the market in both price and availability of environmentally-preferred products in the marketplace. “Green” or Environmentally Preferable Purchasing (EPP) includes the selection of products and services that have a lesser or reduced effect on human health and the environment when compared with competing products or services that serve the same purpose. The Resources Conservation Committee (RCC) (formerly the Recycling Management Committee) was created in 1992 to establish a procurement policy for Metropolitan Dade County favoring waste-reduction and implementing a program to purchase commodities containing recycled or recyclable content. This Committee has historically been charged with facilitating and tracking the efforts of the County in recycling, recycled-content purchasing and EPP activities. Currently, the purchasing system allows departments to “opt-in” to green purchasing, depending on their commitment to buying green products. Continued leadership requiring green purchasing is needed to further expand these efforts. While legislation has been passed that broadly supports environmentally preferable purchasing, establishing targets would facilitate a shift from policy to implementation.
SUMMARY OF KEY SUSTAINABILITY CHALLENGES Main challenges identified through collaborative stakeholder analysis of assessment data & indicators
• Achieving a shift in institutional culture to facilitate green purchasing.
• Assessing goods and services to ensure sustainability through use of third party certification and full life-cycle assessment of products. Proper assessment will help address “myths” about green purchasing and concerns with potential increased upfront costs.
• Training and equipping procurement staff and departmental liaisons with tools for green purchasing – a relatively new arena for county employees
• Establishing an electronic tracking system that can quickly provide detailed reports regarding specific commodities and quantities purchased. This is a fundamental institutional challenge facing Miami-Dade County government for furthering green purchasing efforts.
• Developing additional indicators that can be used to assess the effectiveness of the County’s “Buy Green” guidelines.
• Strengthening the “Buy Green guidelines to switch from voluntary to mandatory green purchasing.
Procurement-Government Operations - Page 2
ASSESSMENT DATA & INDICATORS Data and analysis to identify key challenges & establish a sustainability baseline
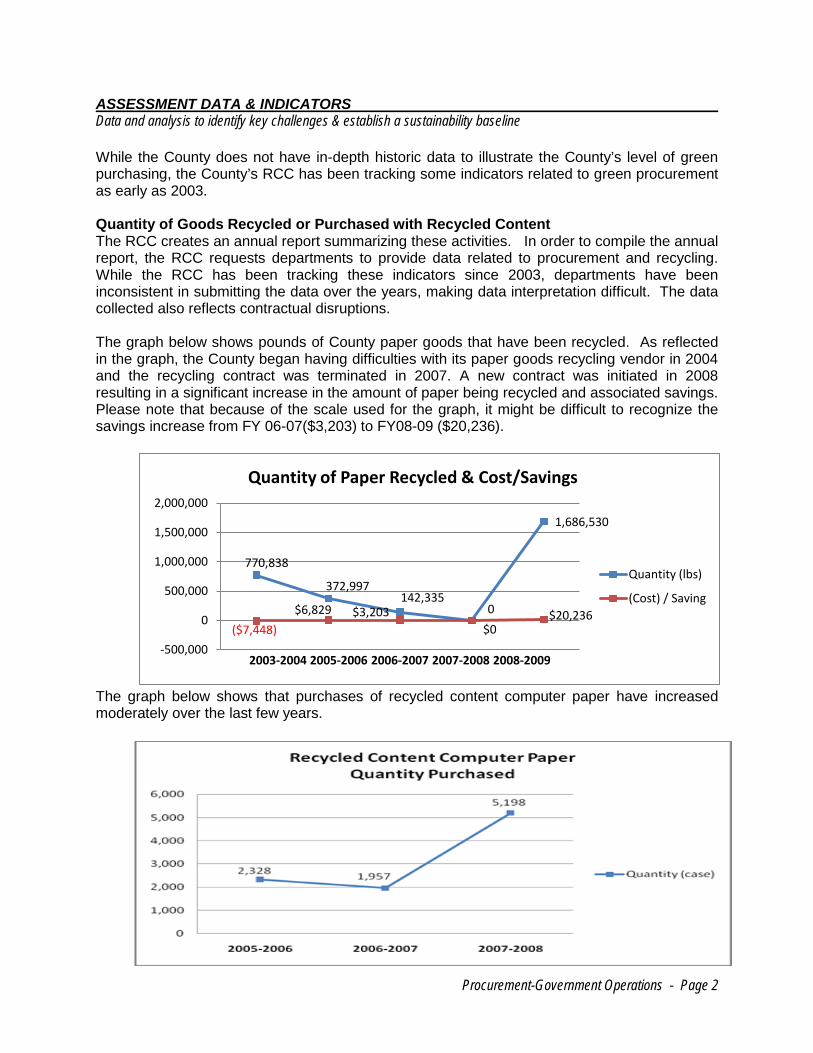
While the County does not have in-depth historic data to illustrate the County’s level of green purchasing, the County’s RCC has been tracking some indicators related to green procurement as early as 2003. Quantity of Goods Recycled or Purchased with Recycled Content The RCC creates an annual report summarizing these activities. In order to compile the annual report, the RCC requests departments to provide data related to procurement and recycling. While the RCC has been tracking these indicators since 2003, departments have been inconsistent in submitting the data over the years, making data interpretation difficult. The data collected also reflects contractual disruptions. The graph below shows pounds of County paper goods that have been recycled. As reflected in the graph, the County began having difficulties with its paper goods recycling vendor in 2004 and the recycling contract was terminated in 2007. A new contract was initiated in 2008 resulting in a significant increase in the amount of paper being recycled and associated savings. Please note that because of the scale used for the graph, it might be difficult to recognize the savings increase from FY 06-07($3,203) to FY08-09 ($20,236).
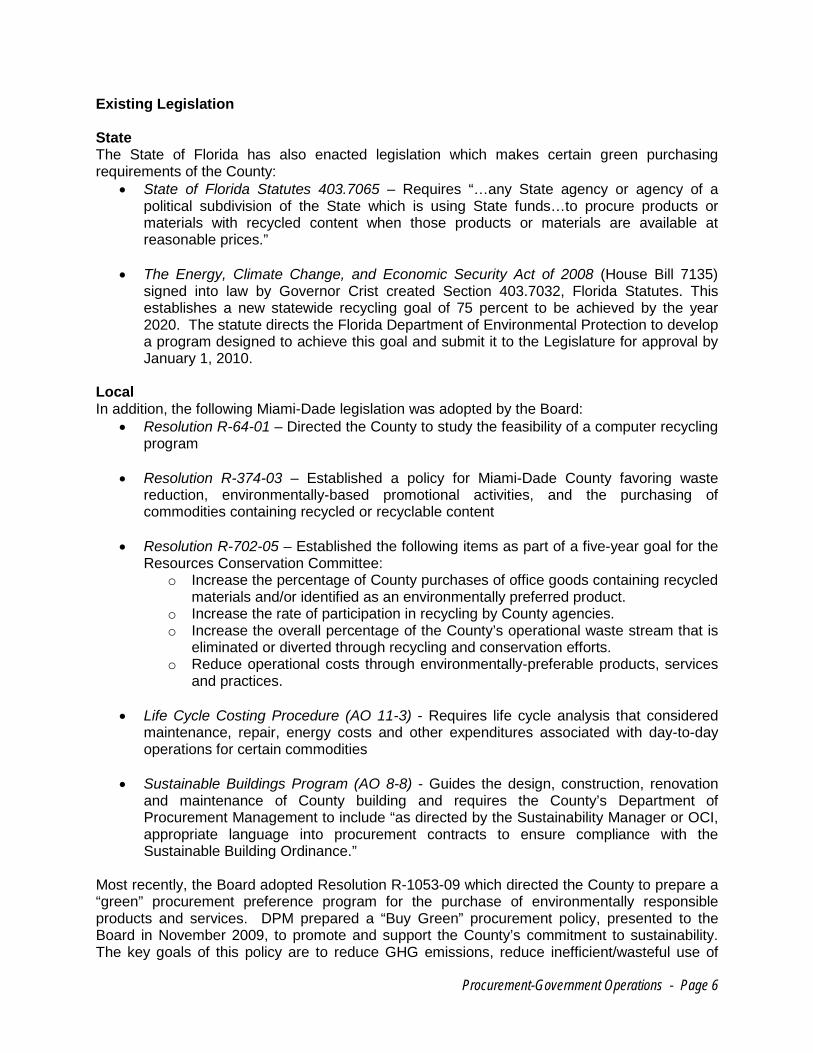
The graph below shows that purchases of recycled content computer paper have increased moderately over the last few years.
770,838
372,997142,335
0
1,686,530
($7,448)
$6,829 $3,203 $0
$20,236
-500,000
0
500,000
1,000,000
1,500,000
2,000,000
2003-2004 2005-2006 2006-2007 2007-2008 2008-2009
Quantity of Paper Recycled & Cost/Savings
Quantity (lbs)
(Cost) / Saving
Procurement-Government Operations - Page 3
In addition to these existing indicators, the County’s Department of Procurement Management (DPM) has recently developed a “Buy Green” supplement to its procurement guidelines, as well as new indicators to help the County track progress in the area of green procurement. In summary, the newly developed indicators are:
• Number of DPM Contracts Issued with Environmentally-Preferred options and criteria and their associated award values
• Number of enrolled vendors reporting that they offer certified green products through Green commodity codes
• Number of contracts awarded using Life Cycle Costing analysis. Contracts including EPP Criteria or Options DPM has identified 30 current contracts, or solicitations underway, that include environmentally-preferred criteria or options. Staff is currently tracking these contracts manually. Automation of key identifiers for green products and services to assist with tracking and reporting of these contracts is underway.
Current DPM "Green" Solicitations
Contract No. Title Department Award Date
Contract Value
730-000-09-1 Telephony Equipment and Services (Energy Star) ETSD 12/16/2008 $7,000,000
250-000-09-1 IT Hardware (Energy Star) ETSD 1/5/2009 $14,000,000
IB7832-3/11-2 Collection & Recycling of Used Oil Filters Various 12/4/2008 $19,282
1/19/9065 Resilient Hard Surface Flooring Various 7/31/2009 $2,378,000
RFP 695 Developing Poinciana Industrial Center GSA
Revenue Generating
RFP 630 Water Theme Park P&R
Revenue Generating
Total $811,331,282
Green Commodity Codes Developed by the National Institute of Governmental Purchasing (NIGP), the County uses the NICP Commodity/Services Code as its coding structure for standardizing purchasing, bringing order and consistency for efficiency and economy. The NIGP Code is used primarily to classify products and services procured by state and local governments. To date, 26 “Green” codes have been incorporated into DPM’s automated purchasing system, ranging from certified janitorial supplies to alternative fuels. Based on these commodity codes, staff will be able to report the number of contracts issued under these codes as well as the award values. Additionally, staff is in the process of developing the capability for determining the number of vendors who use the Green commodity codes to update their vendor profiles.
DPM Green Commodity Codes (as of September 15, 2009)
Code Description
405-02 Alternative Fuels (Not Otherwise Classified)
486-22 Cleaner, Sewer, Septic Tank, and Waste Pipe, Acid and Caustic Types (Incl. Drain Openers), Environmentally Certified Products
486-25 Cleaner, Tile and Grout, Environmentally Certified Products
486-26 Cleaner, Toilet Bowl, Granular and Liquid, Environmentally Certified Products
486-30 Deodorant Blocks, All Types, Environmentally Certified Products
486-37 Detergent-Disinfectant (Washroom Type), Liquid and Aerosol (See Class 435 for Health Care and 505 for Laundry Type), Environmentally Certified Products
486-54 Floor Polishes and Waxes, Floor Sealer, and Dust Mop Treating Compound, Environmentally Certified Products
486-60 Insecticides and Repellents, Household, Environmentally Certified Products
486-86 Soap, Hand; Bar, Liquid, and Powdered, Environmentally Certified Products
631-33 Lacquer and Shellac, Clear and Colored, Environmentally Certified Products
631-45 Paint and Varnish Removers (Includes Painted Graffiti Removers) (See 485-16 for Other Types of Graffiti Removers)
631-56 Paint, House and Trim, Environmentally Certified Products
631-82 Sealers and Primers, Paint, Environmentally Certified Products
631-84 Stains and Varnishes, Environmentally Certified Products
641-60 Plastic and Styrofoam Products: Cups, Forks, Plastic Coated Dishes, Plastic Food Wrap, Cooking Bags, Sandwich Bags, etc.
Third Party Certification Often, procurement of goods and services is decentralized within the County, and performed by department procurement liaisons. Analyses that compare net benefits and full life-cycle costs are complex and department procurement liaisons might not have the expertise needed to conduct such assessments and comparisons. One way to ensure procurement of more sustainable goods is to ensure that they are third party certified by a reputable organization. However, purchasing third party certified goods often increases the base price of these goods. In addition, while third party certification can help ensure procurement of sustainable goods, these types of certification programs are not available for all commodities.
EXISTING EFFORTS Consolidates current plans, goals, and initiatives related to the specific assessment area
Comprehensive Development Master Plan The County is making it a priority to leverage its purchasing power to influence the market in both price and availability of environmentally-preferred products in the marketplace. In the Comprehensive Development Master Plan (CDMP) states, in part, that "...the County shall provide for the reduction of per capita production of solid waste by encouraging the use of waste reduction technologies and recyclable packaging materials..." and that "...the County shall promote the establishment and expansion of markets for products and materials created from recycled wastes through cooperative State and Federal efforts, County purchasing policies, and by encouraging the purchase of such products by County vendors, clients, and citizens..."
Recycled Content of Paper Goods
VS.
No certification Certified
Procurement-Government Operations - Page 6
Existing Legislation State The State of Florida has also enacted legislation which makes certain green purchasing requirements of the County:
• State of Florida Statutes 403.7065 – Requires “…any State agency or agency of a political subdivision of the State which is using State funds…to procure products or materials with recycled content when those products or materials are available at reasonable prices.”
• The Energy, Climate Change, and Economic Security Act of 2008 (House Bill 7135) signed into law by Governor Crist created Section 403.7032, Florida Statutes. This establishes a new statewide recycling goal of 75 percent to be achieved by the year 2020. The statute directs the Florida Department of Environmental Protection to develop a program designed to achieve this goal and submit it to the Legislature for approval by January 1, 2010.
Local In addition, the following Miami-Dade legislation was adopted by the Board:
• Resolution R-64-01 – Directed the County to study the feasibility of a computer recycling program
• Resolution R-374-03 – Established a policy for Miami-Dade County favoring waste reduction, environmentally-based promotional activities, and the purchasing of commodities containing recycled or recyclable content
• Resolution R-702-05 – Established the following items as part of a five-year goal for the Resources Conservation Committee:
o Increase the percentage of County purchases of office goods containing recycled materials and/or identified as an environmentally preferred product.
o Increase the rate of participation in recycling by County agencies. o Increase the overall percentage of the County’s operational waste stream that is
eliminated or diverted through recycling and conservation efforts. o Reduce operational costs through environmentally-preferable products, services
and practices.
• Life Cycle Costing Procedure (AO 11-3) - Requires life cycle analysis that considered maintenance, repair, energy costs and other expenditures associated with day-to-day operations for certain commodities
• Sustainable Buildings Program (AO 8-8) - Guides the design, construction, renovation and maintenance of County building and requires the County’s Department of Procurement Management to include “as directed by the Sustainability Manager or OCI, appropriate language into procurement contracts to ensure compliance with the Sustainable Building Ordinance.”
Most recently, the Board adopted Resolution R-1053-09 which directed the County to prepare a “green” procurement preference program for the purchase of environmentally responsible products and services. DPM prepared a “Buy Green” procurement policy, presented to the Board in November 2009, to promote and support the County’s commitment to sustainability. The key goals of this policy are to reduce GHG emissions, reduce inefficient/wasteful use of
resources such as electricity, fuel, paper, and water and decrease use of hazardous materials to improve community and environmental health Other Initiatives In addition to overall County government goals and initiatives related to greener procurement, individual departments have established their own initiatives. For example, the Department of Environmental Resources Management (DERM) led the way several years ago in switching to digital cameras. A brief non-inclusive list of recent or ongoing initiatives can be found below.
Department Initiative Brief Description
General Services Administration
Online Procurement Catalog - Green Upgrade
Revised On-line GSA ordering catalog to flag products with recycled content so that department reps can easily identify for purchasing
Library Purchase of Recycled Content Paper
Purchasing paper with higher recycled content by using savings realized through reductions in overall quantity of paper purchased.
Multiple Departments
Printer Cartridge Recycling Program
All departments collect and recycle their printer/toner cartridges
Multiple Departments
Scrap Metal and other Recycling
All departments collect and recycle their scrap metal and other commodities.
COMMUNITY FEEDBACK Feedback & results gathered though the planning process or surveys
No relevant feedback was available.
Airports-Government Operations – Page 1
Airports - Government Operations Assessment Area Miami-Dade Aviation Department (MDAD) currently operates five airports in Miami-Dade County: Miami International Airport (MIA), Opa-locka Executive Airport (OPF), Kendall-Tamiami Executive Airport (TMB), Homestead General Aviation Airport (X51), and Dade-Collier Training and Transition Airport (TNT). The mission of the Aviation Department is to cost effectively operate airport facilities that are safe, efficient, customer friendly, environmentally responsible and contribute to the economic growth of the community. The Aviation Department must ensure the quick and safe transport of people and goods via multiple methods of transport: aircraft, truck, and passenger vehicles. The internal operations of the airport itself, from aircraft to ground support vehicles, as well as the operations of industrial tenants and companies that transport passengers and cargo, have a great potential for impacting the surrounding natural environment and resources.
ASSESSMENT DATA & INDICATORS Data and analysis to identify key challenges & establish a sustainability baseline Economic Indicators The annual economic impact of the MDAD system of airports is over $26.7 billion. The largest of the five airports is MIA, which handled 34.7 million passengers and 2.0 million tons of air cargo in 2008. MIA ranks first in the nation for international freight and 3rd in the nation for international passengers, and 3rd in the nation for total freight and cargo. It is also one of the top 10 airports internationally in terms of handling total freight. MIA and related aviation industries contribute 282,043 jobs directly and indirectly to the local economy. That equates to one out of 4.1 jobs in the County. Below are some graphs illustrating economic indicators associated with Miami-Dade’s airport system, related to both cargo and passenger flights.
SUMMARY OF KEY SUSTAINABILITY CHALLENGES Main challenges identified through collaborative stakeholder analysis of assessment data & indicators
• Maintaining MIA as one of the community’s top economic engines, especially in light of competition with other regional airports
• Maximizing the efficient movement of freight and passengers by minimizing traffic congestion at points of access to the airports and from major trip generators and destinations such as the Port of Miami
• Improving the capacity and efficiency of aircraft mobility in and out of the airports • Minimizing passenger and commercial vehicle idling time while on airport property,
including time to travel to parking areas and pick-up and drop-off areas • Addressing existing groundwater contamination and preventing additional
contamination, in particular the continual inherent risk of jet-fuel spills • Reducing fuel consumption and associated emissions from auxiliary plane power
equipment and other airport fleet and equipment • Identifying and implementing opportunities for reducing electricity and water
consumption and maximizing conservation and efficiency in operations • Obtaining funding for improvements with sustainability benefits
Miami International Airport Cargo (Historic and Forecasted)
0.0
0.5
1.0
1.5
2.0
2.5
Mill
ions
of T
ons
Domestic Cargo Total
International Total
(Source: Graph from Miami-Dade Freight Plan, 2009)
Economic Impacts of the Miami-Dade County System of Airports YPE OF IMPACTS TYPES OF IMPACT TOTAL IMPACTS JOBS 2006 2008
DIRECT 147,115 152,472 INDUCED 64,602 66,958 INDIRECT 60,659 62,613 TOTAL 272,376 282,043
PERSONAL INCOME (MILLIONS)
DIRECT $3,921.2 $4,066.3 RE-SPENDING/CONSUMPTION $4,258.8 $4,414.0 INDIRECT $1,620.4 $1,687.0 TOTAL $9,800.4 $10,167.3
BUSINESS REVENUE (MILLIONS) $25,560.1 $26,746.1 LOCAL PURCHASES (MILLIONS) $2,608.5 $2,717.0 STATE AND LOCAL TAXES (MILLIONS) $980.0 $1,016.8 FEDERAL AVIATIONSPECIFIC TAXES (MILLIONS) $638.4 $654.9
Airports-Government Operations – Page 3
Resource Consumption – Fuel Currently, the Aviation Department tracks fuel consumption only for internal operations such as vehicles used by County staff to travel within and between airports and equipment like generators. However, the majority of fuel being consumed in association with aviation activities is by private planes, trucks, and cars coming to and from the County’s five airports. (MIA alone has approximately 8,700 parking spaces for public use and 7,000 spaces for employees and cargo operators.) See “Existing Efforts” section below for details regarding activities that have helped reduced fuel consumption and associated emissions from external customers.
MDAD Internal Fuel Consumption in Fleet and Equipment
Diesel in Unleaded Gasoline in
Gallons Gallons
2000 178,579.58 241,369.00
2005 143,021.01 290,303.02
2007 263,355.00 235,146.50
2008 287,280.00 232,260.60
Airports-Government Operations – Page 4
Resource Consumption – Electricity Due to its large facilities, MIA consumes a substantial amount of energy, using approximately 300 million kilowatt-hours of electricity in a year. In 2007, the Aviation Department was the largest user of electricity (29 percent) of any County department. MDAD has pursued several electricity reduction opportunities over the last three years (see “Existing Efforts” below). While these electricity reduction initiatives have been very successful, they have been offset by the fact that MIA terminal space has grown by four million square feet during roughly the same period.
Resource Consumption - Water Water consumption is tracked by the Water and Sewer Department through master meters located at entrance points to MIA. Water use evaluations are being conducted and the recommendations will be used to develop a water use reduction plan by 2011.
MDAD Internal Water Consumption Million Gallons A Day (MGD) 2007 1.855774 2008 1.851389 2009 2.073859
Annual Fuel Spill Volume While all fuel spills at County airports are documented and addressed via Airside Spill Reports, this data is not currently being collected in an automated, accessible format that can be used to show trends or demonstrate comparisons from year to year. In the future, the Department of Environmental Resources Management (DERM) and MDAD will track the number of incidents
Airports-Government Operations – Page 5
and volume per each incident in an automated fashion for use as an indicator. This indicator will be used to help evaluate the efficacy of Best Management Practices and International Organization for Standardization (ISO) certification guidelines. New Violations and Compliance with Environmental Regulations A report entitled “Violations of Environmental Regulations at Government Facilities and Properties in Miami-Dade County, Florida” is compiled annually by DERM. This report reviews the environmental status of government sites within the County, including county, federal, state and municipal facilities. Only one new case was documented during the current reporting period for MDAD. In terms of assessing sustainability, the number of ‘new’ violations each year will be tracked as an indicator. Please refer to the “Compliance with Environmental Regulations” section at the end of the Government Operations section of the Assessment Report. Waste Reduction, Reuse and Recycling MDAD system of airports has a mature recycling program for the following categories, with associated average yearly volumes/quantities, as follows:
Although there is no current year data for quantity of cardboard recycled, this commodity will be specifically tracked in the future as an indicator of MDAD’s recycling and pollution prevention initiatives. Additional commodities will also be more closely tracked in the future to allow for year to year comparisons. Noise Reduction MDAD has taken a pro-active approach in addressing community concerns about aircraft noise. While the County’s system of airports is critical to Miami-Dade’s economy, associated aircraft noise can be disturbing and unpleasant. MDAD is continually challenged to reduce and alleviate aircraft noise, where possible, from both operations on the ground and in the air. MDAD and Federal Aviation Administration (FAA) work together to reduce aircraft-related noise in residential areas by developing operational policies and procedures designed to decrease noise impacts caused by approaching and departing aircraft. MDAD developed compatible land use plans for areas adjacent to all County operated airports. Additionally, MDAD works with airlines to encourage the use of new technology like Stage III aircraft and GPS Area Navigation (RNAV), which are designed to lessen the impact of aircraft noise on neighboring communities. MDAD receives and document noise complaints related to aircraft. MDAD utilizes a technology system called Aircraft Noise and Operations Monitoring System (ANOMS) to determine noise
Airports-Government Operations – Page 6
impact on residential areas and identify which aircraft generated the noise complaint. The system gathers and processes flight related data, showing flight paths and aircraft altitudes. The trend of complaints has declined over time since the program was implemented and will continue to be monitored (see graph below).
The latest aircraft arrival and departure procedural changes approved by the FAA include:
• Reduction of aircraft departures over residential neighborhoods at night • Reduction of dispersion of low altitude aircraft departure turns during west flow
operations • Reduction of dispersion of aircraft arrivals and departures east of the airport • Redirection of aircraft over non noise sensitive areas in the vicinity of the barrier islands
for both west flow arrivals and east flow departures at MIA • The FAA, in conjunction with MDAD, also assigns preferential use to MIA’s four runways
to minimize noise impacts on residential areas MDAD will continue to work with the FAA to develop procedures to reduce aircraft noise as well as continue to monitor and track complaints and associated flights. EXISTING EFFORTS Consolidates current plans, goals, and initiatives related to the specific assessment area Comprehensive Development Master Plan Miami-Dade County’s airports are included as a Sub-element in Comprehensive Development Master Plan (CDMP). MDAD will apply sustainable principles in the planning, design, construction, operation and maintenance for all MDAD operated airports, and follow the County’s Sustainable Buildings Program which promotes green design, construction and operation of buildings. The Transportation Element, Aviation Sub-element is to ensure the provision of an economic, integrated environment and community-sensitive, and balanced system of air transportation facilities and services to move passengers and cargo effectively and efficiently; accommodate and encourage all types of general aviation activity, including business, commercial, instructional, and personal activity; and enhance the economy and quality of life in the County and the region.
Airports-Government Operations – Page 7
Miami-Dade Freight Plan The Miami-Dade Freight Transportation Advisory Committee (FTAC), which is the industry’s advisory panel to the Metropolitan Planning Organization, establishes a Miami-Dade Freight Plan which is intended to support federal, state and countywide priorities as established in the Long Range Transportation Plan and the future vision for freight movement in the County. One of its primary goals is to promote regional goods movement that are socially and environmentally responsible. MDAD will continue to partner with the FTAC towards sustainable transportation practices. Goals that relate to the Airports are included below and other components of the Freight Plan are expanded on in the Transportation Section of this assessment report. Below are the broad goals and some policy objectives of the 2009 Freight Plan. Many of the over 40 projects identified in the Freight Plan are likely to positively impact Miami-Dade Airports through improved efficiency of the movement of goods.
• Goal 1: Support economic development by enhancing freight system connectivity. • Goal 2: Advance strategic freight initiatives that support job creation and retention to
enhance the region’s long-term competitive position. • Goal 3: Enhance freight transportation safety and convenience to ensure mobility and
access. • Goal 4: Provide the secure movement of international and domestic goods. • Goal 5: Address the varied freight improvement needs of area shippers, carriers and
distributors at both a regional and corridor level. • Goal 6: Improve multimodal access in order to enhance freight efficiency throughout the
County. • Goal 7: Promote methods for regional goods movement that are socially and
environmentally responsible. • Goal 8: Educate the public on the importance of freight transportation to the region as
well as the needs and issues of shippers, carriers, and other affected stakeholders. • Goal 9: Give greater priority and attention to freight in the regional planning process. • Goal 10: Make public investments that help minimize the cost and improve the reliability
of goods movement within the County. • Goal 11: Implement and maintain freight initiatives that provide long-term returns on
public investment. Transportation Initiatives To address transportation-related challenges, MDAD has undertaken the following initiatives:
• Fourth Runway - In 2003, MDAD constructed a fourth runway, thereby increasing MIA’s airfield capacity by 25 percent while reducing aircraft delays into and out of the airport. This helped reduce delays in other passenger transportation modes. Increased capacity also minimized aircraft holding above the airport, departure waiting times; and idling of passenger pickup vehicles, resulting in significant air emission reductions.
• Express Pay Lanes (Pay Pass) - Express Pay Lanes were opened at the MIA in October 2003 to allow users to pay parking fees with their credit cards. This has resulted in improved customer service and air emission reductions by significantly reducing wait time as well as reducing idling in pay queues. There was an average of 147,898 monthly parking transactions during FY 2002-03. Cashiers handled both cash and credit card transactions and each transaction took an estimated 1 to 1.5 minutes. During FY 2008-09, there was a reduced monthly average of 125,075 parking transactions with the new credit card system at unstaffed lanes, estimated to take 30 seconds per transaction.
Airports-Government Operations – Page 8
During December 2009, Master Card Pay Pass® was added to all 39 garage entry and exit lanes. Users of this system touch their credit cards to readers instead of inserting them into a devise, thus saving time, as well as the wear and tear on the machines. Transactions at staffed (with cashier) lane are currently estimated to average 45 seconds (with exceptions for transactions for disabled patrons and other special circumstances).
• Cell Phone Lot - A free park and wait area was opened in 2006 to allow customers to park and wait for the arrival of passengers without having to circle around the airport, thereby reducing traffic, idling and air emissions. It is estimated that the number of vehicles at the cell phone lot ranges from three to six at any given time in a 16-hour period. Usage has recently increased as a result of better directional signage and greater construction activities in surrounding areas. The average waiting time is estimated at 20 minutes. There is no signage at the lot recommending or requiring engines to be turned off.
• MIC-MIA - Currently, one of MDAD’s main capital initiatives is to construct the Miami
Intermodal Center (MIC) at MIA by 2012. The MIC will be an intermodal transportation center that links MIA to a new Rental Car Center (MIA-RCC) and the countywide transit system via a Metro Mover. It will provide connectivity between the transportation systems in the Palm Beaches, Fort Lauderdale, Miami, and the Florida Keys, as well as decongest the streets in and around the busy airport for the benefit of South Florida residents and visitors alike.
The MIA Mover, an automated people mover system, is being constructed in association with the MIC. The Mover has the capacity to transport more than 3,000 passengers per hour between MIA and the MIA-RCC. Once the MIA Mover and the MIA-RCC are in service, rental car shuttles and rental cars will disappear from the airport's arrival deck. More than a half-million shuttle bus trips to off-site rental car companies each year will be eliminated, reducing curbside traffic at the airport's lower level by 20 percent daily. Ultimately, this complex will significantly reduce air emissions and fuel consumption around the MIA area.
• NW 25th Street Viaduct - This joint project with the FDOT is intended to provide a
multilane freight corridor to avoid traffic congestion, facilitate traffic flow, especially truck movement, and enhance safety along this roadway in order to support the expansion of the West Cargo Area at MIA.
Other Initiatives
• International Organization for Standardization (ISO) Certification and Pollution Prevention - The ISO 14001 Certification Process is intended to provide organizations with Environmental Management Systems that comply with international standards to prevent pollution and protect the environment, while striving to achieve continuous improvement in their operations. One of MIA’s biggest challenges is to insure that internal departmental operations, as well as tenant and contractor operations, comply with regulations in order to minimize our environmental footprint. MDAD has received ISO 14001 certification for the following MIA sections/units: Fuel, Facility, Civil and Environmental Engineering, Facilities Maintenance, and Commodities Management. ISO has changed the mindset of employees and empowered them to control their environmental impact in both their workplace and at home. MDAD has a permanent commitment to live up to its environmental stewardship in its operations, and ISO’s continuous improvement requirement helps drive these efforts.
Airports-Government Operations – Page 9
In addition, internal audits using the MIA Environmental Management System are performed monthly by Internal EMS/Safety Auditors. They check all Maintenance shops, warehouse and offices for environmental compliance and safety violations
• Recycling - MDAD maintains an extensive recycling and reuse program which includes
items such as fluorescent lights, paper, cardboard, carpet, and lost and found items. MDAD is trying to expand their recycling efforts to the MIA terminal areas with three lines of recycling: paper, plastic and soda cans. The cardboard recycling program will be expanded this year to the Air Side Operations. In 2009, MIA set an internal cardboard recycling goal of 300 tons minimum per year.
personnel to consider the selection of Environmentally Preferable Products (EPP) when submitting purchasing requests and supports the green-purchasing guidelines developed by the County’s Department of Procurement Management. MDAD has accomplished the following related to its EPP.
o Purchase Forest Stewardship Council (certified) paper for all MDAD office needs o Discontinued purchase of Styrofoam cups o Janitorial contractors must abide by MDAD’s environmental policies and support
MDAD recycling programs o One of MIA’s janitorial contractors uses only Green Seal certified cleaning
products o MDAD purchased and installed about 80 Puradyn oil filtration/recycling systems
in their vehicular fleet and other motorized equipment units to help reduce oil consumption and used oil disposal, improve engines performance and extend engine life span, reduce the frequency of oil filters replacement, as well as reduce related emissions.
o Two hydraulic fluid filtration units were purchase for the loading bridges section to reduce consumption of hydraulic fluid and improve performance.
o Mineral Spirit type parts cleaners, which generate hazardous wastes, were replaced with water-based units, which recycle the solvents/degreasers and significantly reduce the generation of hazardous liquid wastes, as well as emissions. MDAD was then able to change its classification with the State of Florida from Large to Small Quantity Generator of Hazardous Waste.
• Stormwater and Groundwater Quality Initiatives - Since 1994, MDAD has actively
remediated billions of gallons of groundwater from the County’s primary source of drinking water, the Biscayne Aquifer; removed and/or replaced over 200 underground fuel tanks that could pose an environmental threat; and closely monitors and responds to any spill incidents to protect human health and the environment. All employees in MDAD’s ISO registered units undergo initial training on the essentials of ISO 14001 followed by annual refresher sessions, which include a review of MDAD’s Spill Pollution Control and Countermeasures (SPCC) Plan.
MDAD has implemented the following measures to ensure that stormwater discharges from MDAD facilities into canals under the jurisdiction of the County and the South Florida Water Management District (SFWMD) comply with the State of Florida Surface Water Standards:
o Stormwater Pollution Prevention Plans (SWPPP) for Stormwater Discharges Associated with Industrial and Construction Activities. These programs identify
Airports-Government Operations – Page 10
and implement the best management practices (BMP) associated with tenant and construction activities in order to prevent pollutants reaching the canals in the vicinity of MDAD facilities.
o The installation of Pollution Control Devices such as peripheral grate inlets, grit chambers, oil/water separators and outfall booms and skimmers as integral components of the drainage systems.
o A Stormwater Sampling and Monitoring Program to protect the quality of the stormwater discharges from MIA into SFWMD Canals have been implemented. Although monthly sampling is performed actual data was not readily available at the time of this report.
o Routine preventive maintenance of MDAD drainage ways.
• Electricity Reduction - MDAD has been aggressively pursuing opportunities to reduce energy consumption and related costs, such as re-lamping and retrofitting lighting throughout the terminal and installation of a Thermal Energy Storage System that produces ice during the off-peak consumption period to cool the air during the peak demand period. The estimated savings associated with these measures for 2009 are equivalent to 6,000 tons of CO2 per year.
• Air Emissions - In order to reduce CO2 emissions from aircraft operations, MIA has
been replacing the diesel powered Ground Support Equipment (GSE) that provide AC and power for aircraft at Concourse H with fixed Ground Power Units (GPU) as alternatives to the Auxiliary Power Unit (APU) and GSEs. The GPU supplies the aircraft with power and pre-conditioned air from airport facilities and, therefore, the CO2 emission is far less than the APU and diesel GSE. These represent an estimated reduction of 131,400 gallons of diesel per year.
• VOC Air Emissions Reduction Master Plan - This plan was developed to facilitate the
reduction of air emissions by 10 percent from sources operated by MDAD and improve ambient air quality, especially at MIA over a ten year period (2000-2010). Pollution prevention and recycling programs, new procurement policies concerning paints, solvents and diesel fuel, improved spill prevention and reduced fuel losses, discontinuing waste incineration and the removal of two incinerators were among some of the actions undertaken to reach a 15.1 percent reduction (7.2 tons per year) of volatile organic compounds (VOCs) by 2005.
• Tenant Environmental Compliance Auditing and Assistance Program - MDAD provides tenants with guidance and assistance to achieve environmental compliance, waste minimization, pollution prevention (P2), and improved environmental management. MDAD, in conjunction with the County’s Department of Solid Waste Management is in the process of informing airport tenants about County requirements to recycle a minimum of three items. This initiative should increase recycling levels from the tenants.
• Soils Reuse - MDAD negotiated with contractors working on FDOT road projects the
reuse of more than 350,000 cubic yards of marginally contaminated soils, which otherwise would have been incinerated or transported to landfills. This protocol not only saved the County over $9 million in transportation and disposal costs; but also resulted in significant reductions in fuel consumption and greenhouse gas (GHG) emissions, when quarry soils were replaced with soils nearby those FDOT projects.
Airports-Government Operations – Page 11
• Manatee Protection - MDAD has installed screens and barriers to prevent manatees, an endangered species, from entering MDAD drainage ways, where they often get trapped in the structures and suffocate to death.
• Canopy Coverage - Department data suggests the number of trees (canopy cover) at
MIA is higher than the standard canopy in Miami-Dade. For example, there are more than 10,000 trees at MIA providing a 45 percent canopy cover on non-airside properties, compared to a County average canopy of 12 to 18 percent. (Additional information about tree canopy is in the Environment Assessment area.)
• Environmental Education - MIA public website www.miami-airport.com and intranet
site offers information for employees, tenants, consultants, contractors and the community on its environmental management system and a variety of environmental compliance issues. Recently MDAD produced a report, available through the website, which summarizes all of MIA’s Environmental Achievements. In order to increase the environmental awareness of their employees, MDAD has developed an internal green newsletter “Working Green at MIA” to inform them about strategies, tips and procedures to improve their environmental footprint at work and elsewhere. G.W. Carver Middle School Honors Biology Class in collaboration with Dream in Green actively participated in MDAD environmental activities. These students researched MDAD’s environmental foot print and presented proposals to further improve MDAD’s airport environment. Future school projects will be encouraged and supported by MDAD.
COMMUNITY FEEDBACK Feedback & results gathered though the planning process or surveys In 2009, a customer satisfaction survey was conducted by an external consultant (Unison) at MIA. The survey included more than 3,000 airport customers (including departing and international arriving passengers and greeters) and showed improved scores compared to 2008. In order to continue those improvements, the MDAD is partnering with the Greater Miami Convention and Visitors Bureau and the Miami Beach Visitor and Convention Authority to provide mandatory customer service training to all 30,000-plus employees who work at MIA.
Airports-Government Operations – Page 12
Miami-Dade County Resident Satisfaction Survey 2008 See the Transportation Area of this report for community feedback on services at MIA.
Seaport-Government Operations – Page 1
Seaport - Government Operations Assessment Area The Port of Miami (POM) is among America’s busiest ports, recognized throughout the world with the dual distinction of being the number one port for cruise passengers and number one for containerized cargo in the State of Florida (12th in the nation). More than four million cruise passengers traveled through the Port of Miami last year and the Port handled approximately 7.5 million tons and over 800,000 Twenty-Foot Equivalent Units (TEUs) of cargo last year. This commerce operation contributes approximately $17 billion annually to the South Florida economy and helps provide direct and indirect employment of 176,000 jobs. Part of the Port’s success may be attributed to its geographic location, which places it at the crossroads of major global shipping lanes as well as its close proximity to the popular cruise destinations. The Seaport Department’s core mission is to provide service to cruise passengers, cargo shipping commerce, and other members of the maritime community. The Port operates as a tenant-landlord port with container terminals operated by several private terminal companies. Tenants and ancillary services that transport passengers and goods have a great potential for impacting the surrounding natural environment and resources. Moving people and goods efficiently naturally translates to environmental benefits through a reduction in the consumption of resources and emissions. The following are the key challenges as they relate to sustainable seaport design and operations:
SUMMARY OF KEY SUSTAINABILITY CHALLENGES Main challenges identified through collaborative stakeholder analysis of assessment data & indicators
• Maintaining the POM as the community’s second largest economic engine considering economic challenges, competition from neighboring ports, climate change impacts (in particular sea level rise), and the high cost of port security.
• Maximizing the efficient movement of freight and passengers to and from major trip generators and destinations such as Miami International Airport by minimizing vehicular traffic congestion on downtown streets (currently the only point of access to the port). Reducing vehicular traffic will improve regional air quality and enhance transportation safety.
• Maximizing the efficient movement of freight through POM security gates and cargo yards.
• Minimizing passenger and commercial vehicle idling time while on port property, including time to travel to parking and pick-up and drop-off areas.
• Reducing internal and tenant fuel consumption and associated emissions from auxiliary power equipment for port operations.
• Identifying and implementing opportunities for reducing internal and tenant energy and water consumption and maximizing energy efficiency in operations
• Factoring sustainability into long term planning decisions (such as channel/basin expansions) in order to balance the need for cargo ship capacity and safety while minimizing impacts to seagrass beds and coral reefs.
• Working with cruise ship industry to best utilize existing berthing slips to both accommodate business while avoiding or minimizing impacts to marine resources.
• Obtaining grant or other funding to implement projects with high sustainability benefits.
Seaport-Government Operations – Page 2
ASSESSMENT DATA & INDICATORS Data and analysis to identify key challenges & establish a sustainability baseline
Processing Time Maintaining efficient and secure flow of trucks to and from the Port’s cargo terminal facilities is essential to its viability. Tracking processing time allows the Port to evaluate whether it is operating efficiently and whether initiatives to increase processing efficiency are working. Figure 1 is a snapshot of average security gate processing times in November 2009. Increased efficiency also helps minimize emissions by reducing truck idling time.
(Source: Miami-Dade Seaport Department)
Cargo and Cruise Statistics Both cruise passenger numbers and Twenty-Foot Equivalent Units (TEUs) are used to assess level of commercial activity at ports and can therefore be used as indicators. With the Port’s cargo sector primarily focusing on containerized cargo, the Port processed approximately 7.5 million tons of cargo in 2008. The industry standard for cargo is measured in TEUs. It is expected that TEUs will rise an average of 1 to 2.5 percent annually by 2035 based on the recent trends and waterborne cargo forecasts from the U.S. Department of Transportation’s (DOT) Freight Analysis Framework (Miami-Dade Freight Plan, 2009). Figure 2 shows the Miami container share of the U.S. total.
Figure 1
Seaport-Government Operations – Page 3
Miami Container Share of US Total
0.00%
0.50%
1.00%
1.50%
2.00%
2.50%
3.00%
3.50%
1980
1981
1982
1983
1984
1985
1986
1987
1988
1989
1990
1991
1992
1993
1994
1995
1996
1997
1998
1999
2000
2001
2002
2003
2004
2005
2006
Source: Miami-Dade Freight Plan, 2009. Blue line is actual data; red line is 'smoothed' trend line. The Port has experienced steady increase of cruise passengers in the past four years as shown below in Figure 3.
Figure 2
Figure 3
Seaport-Government Operations – Page 4
Electricity Consumption The Seaport Department ranks sixth highest (5.27 percent) for electricity consumption among all County departments, with annual consumption for 2007 at 65,357,532 kWh (Figure 4). This high electricity consumption is related to the fact that the POM is open 24 hours a day, seven days a week for both cargo and cruise operations. Typically cruise operations are concentrated Thursday through Mondays, while cargo operations are underway around the clock (24 hours).
Figure 4
Seaport-Government Operations – Page 5
Water Consumption The port expansion is reflected in its water use, with the addition of terminals D and E at the close of 2007. A water use audit will be performed in 2010 to establish per passenger consumption and identify retrofit needs. Figure 5 illustrates water use consumption.
Environmental Monitoring Improving access and maneuverability for passenger and cargo ships has shaped the Port since the early 1900s. Historically, there was little documentation or regulation nationwide of activities that had the potential to impact marine resources and therefore there is no accurate way of assessing the extent of past cumulative impacts to these resources. In the 1960s, the Port moved from the downtown Miami mainland to its current location as an island in Biscayne Bay. The base of this new island was reused dredged spoil from the Government Cut dredging projects. In 1970, the National Environmental Policy Act (NEPA) was signed into law and in 1972 the Clean Water Act (CWA) was adopted, requiring the identification and evaluation of impacts to natural resources and a public comment process. In particular, NEPA requires that environmental impact statements (EIS) be prepared to identify environmental impacts and mitigation activities for major federal actions having a significant effect on the environment. All dredging projects in federal waters are regulated by the United States Army Corps of Engineers (USACE). POM expansion projects that are managed and paid for (sponsored) by the Miami-Dade Seaport Department directly are also governed by local environmental regulations. Although POM expansion projects that are managed and paid for (sponsored) by the USCE are exempt from these local environmental regulations, the County comprehensively reviews these projects and provides recommendations for minimizing impacts and providing mitigation. Following federal guidelines, past expansion projects performed studies to evaluate different alternatives, associated costs, benefits, and environmental impacts per NEPA and CWA policies. Table 1 below summarizes the harbor improvements for two such projects and the associated mitigation projects completed to offset their associated environmental impacts.
Creation of approximately 16 acres of offshore artificial reef
Mangrove restoration at Biscayne Bay canals
Mangrove restoration at Oleta River State park – 42.5 acres
Source: Miami-Dade County Seaport Department Mitigation Reimbursement Study Updated April 1998 Because different entities have managed POM expansion projects, environmental impacts and associated mitigation have been documented and tracked using different methodologies. To better address this lack of data, for both planned projects and projects already completed, historical records should be searched and the data provided at a later date according to Table 2 (below). Data should also be tracked in a similar and consistent manner for future (planned) expansion projects.
Example Activity A – hypothetical island expansion
Seagrass (direct and indirect impacts)
TBD TBD TBD TBD
High relief coral TBD TBD TBD TBD
Low relief coral TBD TBD TBD TBD
Example Activity B – hypothetical deepening of channel
Seagrass (direct and indirect impacts)
TBD TBD TBD TBD
Seaport-Government Operations – Page 7
High relief coral TBD TBD TBD TBD
Low relief coral TBD TBD TBD TBD
Example Activity C – hypothetical widening of turning basin
Seagrass (direct and indirect impacts)
TBD TBD TBD TBD
High relief coral TBD TBD TBD TBD
Low relief coral TBD TBD TBD TBD
Turbidity Turbidity is a scientific way of measuring a water body’s "muddiness" or “cloudiness.” Typically, the cloudier the water, the greater its turbidity. Turbidity is greatly affected by weather events, but can also be increased by human activities such as wastewater discharges, fisheries trawling, boat propeller wash, and re-suspension of sediments caused by dredging. Turbidity is an important indicator because it can disrupt the natural environment and hinder the growth of plants and animals. For this reason, dredging permits typically require turbidity management plans with frequent turbidity monitoring. New Violations and Compliance with Environmental Regulations A report entitled “Violations of Environmental Regulations at Government Facilities and Properties in Miami-Dade County, Florida” is compiled annually by DERM. This report reviews the environmental status of government sites within the County, including county, federal, state and municipal facilities. No new cases were documented during the current reporting period for POM. In terms of assessing sustainability, the number of ‘new’ violations each year will be tracked as an indicator. Please refer to the “Compliance with Environmental Regulations” document the “Government Operations” section of the Assessment Report.
EXISTING EFFORTS Consolidates current plans, goals, and initiatives related to the specific assessment area
Comprehensive Development Master Plan
The Seaport Department is included as a sub-element in the Comprehensive Development
Master Plan (CDMP). Specific POM goals in the CDMP include:
• The Port of Miami shall endeavor to retain its position as the top-ranking cruise port of the world while expanding its share of the cruise market, and continue to expand its role as one of the leading container ports in the nation.
• In carrying out its day-to-day operations and its long-term expansion program, the Port of Miami shall minimize any detrimental effects on the environment, the community, and supporting infrastructure and shall continue to coordinate its operation and expansion activities with federal, state, and regional agencies, other County departments, neighboring municipalities, and surrounding communities as appropriate.
Specific POM objectives in the CDMP include:
• Objective PM-4 - The Port shall promote sound environmental practices in its day-to-day operations and long-term maintenance and expansion plans, consistent with the unique role and responsibilities of deep-water port facilities.
o PM-4A. The Port shall periodically review its environmental practices in response to new information and community issues.
o PM-4B. The Port shall maintain or obtain, as appropriate, environmental agency approvals for existing and proposed port expansion activities, including extension of existing permits as necessary and preparation of new master expansion
Seaport-Government Operations – Page 8
permits to address longer range expansion plans. The Port shall ensure that required mitigation, including, but not limited to, creation of artificial reefs and habitat restoration and enhancement activities in Biscayne Bay, is implemented. The capital projects proposed in this plan element constitute the development program to be undertaken by the Port, with full acknowledgement that each project may proceed only after required environmental and community evaluations are conducted, regulatory and CDMP conformity are determined, and regulatory approvals are obtained.
o PM-4C. By 2006, the Port shall explore the feasibility of mitigation banking as a long-range option for natural resource planning. The feasibility study should address the beneficial use of suitable dredged materials, the value of integrated ecosystems including submerged habitats, shoreline habitats, and upland areas for mitigation, and ways to integrate public access, as well as recreational and educational opportunities into mitigation areas.
o PM-4D. By 2006, the Port shall develop a Dredged Materials Management Plan which addresses long-term needs for spoil disposal and beneficial use of dredged material.
• Objective PM-5 - The Port shall maintain its policy of cooperation with all levels of government and the community in the resolution of environmental issues.
o PM-5A. The Port shall encourage its users to comply with applicable existing policies designed to minimize particulate emissions from ships in port.
o PM-5B. The Port shall continue to ensure that the disposal of any spoil not used as fill in its land area is conducted in accordance with permits.
o PM-5C. The Port shall stabilize all its remaining unconsolidated shorelines and minimize the turbidity associated with maintenance dredging.
• Objective PM-6 - The Port shall coordinate off-island expansion activities with affected communities.
o PM-6A. The Port shall conduct the following analysis relative to off-island expansion activities as part of an integrated planning and public participation process: impact analysis on surface transportation linkages, environmental resources, adjacent land uses, and water, wastewater and solid waste facilities.
o PM-6B. The Port shall integrate expansion activities into the physical, social and economic fabric of the surrounding communities.
o PM-6C. The Port shall provide public access to the waterfront when appropriate and not in conflict with safety and operation practices. Expansion into parkland shall be consistent with Policy PM-1A.
• Objective PM-8 - The Port shall coordinate port expansion activities to achieve appropriate land uses, joint uses and joint-venture partnerships.
o PM-8A. The Port shall work with other agencies and the private sector to maximize the economic benefits to be derived from expanded port operations.
o PM-8B. The Port shall consider other uses including, but not limited to, commercial, recreational, cultural, hospitality and residential uses accessible to port users, county visitors and residents, in its on- and off-island port developments, so long as these uses are compatible with the primary port use.
o PM-8C. The Port shall consider multi-use options for all new facilities, including dual purpose parking garages and mixed-use development.
• Objective PM-9 - The Port shall coordinate landside and waterside transportation issues with pertinent federal, state, county (including adjacent counties) and City agencies to ensure that the Port's requirements are consistent with the abilities of the agencies to provide the services needed to support these activities.
o PM-9A. Miami-Dade County shall continue to work in partnership with the City of Miami, the Metropolitan Planning Organization (MPO), the Florida Department of Transportation (FDOT), and other affected entities to implement the Miami
Seaport-Government Operations – Page 9
Downtown Transportation Master Plan through interagency agreements, amendments to the MPO’s Long Range Transportation Plan and Transportation Improvement Program and similar plans and programs of other responsible entities to incorporate recommended provisions, as appropriate.
o PM-9B. In addition to the Miami Downtown Transportation Plan to be conducted pursuant to policy PM-9A, the Port shall work with other agencies to develop a comprehensive analysis of its transportation requirements for the next 20 years to meet additional projected cruise passenger and cargo transport needs. For cruise transportation needs, the focus will be on more efficient links between port facilities and the airport, and between port facilities and local excursion destinations. For cargo operations, the focus will be on better links between intermodal centers and port facilities, more efficient access between port facilities and the interstate system, and better connections between port facilities and industrial centers.
o PM-9C. The Port shall work with all applicable agencies to implement the direct port/interstate transportation link and intermodal facilities required to meet the needs of the port and the community.
o PM-9E. Recognizing that the federal government has merged the tri-county South Florida region into one Metropolitan Statistical Area (MSA) and the state has authorized the creation of the South Florida Regional Transportation Authority (SFRTA), the Port will collaborate with partners who seek synergistic solutions to the region’s multimodal transportation constraints. Collaborative activities reflecting the growing importance of regional transportation planning are expected to include implementation of inclusive plans and studies such as the Statewide Intermodal System Plan, Phase III of the Florida Multimodal Trade Corridor Assessment series, and the Intermodal Connectivity in the Atlantic Commerce Corridor Assessment. The port will also support designation of the Atlantic Commerce Corridor as a federal Corridor of National Significance or any similar designation that will help attract critical capital improvement funding to the region.
o PM-9F. The Port shall assist in implementing the recommendations issued pursuant to policies.
o PM-9A and PM-9B that will provide improvements to the County's roadway and transit networks that are important to the movement of port-related freight, and cruise passengers.
o PM-9H. The Port shall work with the City of Miami, other County agencies and the Florida Department of Transportation to identify and improve the key problem intersections and improve access to and from the Port.
• Objective PM-10 - The Port shall work with County departments and utility providers to ensure that necessary capacity is available to support existing and proposed uses in advance of need.
o PM-10A. The Port shall implement best management practices, monitoring programs and other measures to improve stormwater quality per its National Pollutant Discharge Elimination System Stormwater Pollution Prevention Plan, dated November 2000.
o PM-10B. The Port shall complete a Stormwater Management Master Plan by 2006 which shall: identify existing stormwater infrastructure conditions and any potential need for infrastructure improvements that may be required to meet NPDES and State of Florida water quality standards; and, include a schedule for stormwater improvements that may be required. The Port shall propose amendments to the Capital Improvements Element to implement improvements, either through planned development and redevelopment activities or through retrofitting of existing areas.
Seaport-Government Operations – Page 10
o PM-10C. By 2006, the Port shall complete construction projects arising from the Consent Agreement with DERM pertaining to extension of sanitary sewer lines into the western half of the Port island facility and elimination of septic tank systems in the same area.
o PM-10D. The Port shall continue to assess the capacity of water lines to determine if additional capacity or water pressure is needed to accommodate future development. The Seaport Department shall schedule necessary improvements to the water system in the Capital Improvements Element.
Miami-Dade Freight Plan The Miami-Dade Freight Transportation Advisory Committee establishes a Miami-Dade Freight
Plan which is intended to support federal, state and countywide priorities as established in the
LRTP and the future vision for freight movement in Miami-Dade County.
The Port is primarily served by trucks which must navigate through downtown Miami. The Freight Plan has a goal of promoting regional goods movement that are socially and environmentally responsible. The Plan was developed under the guidance of the Miami-Dade MPO Freight Transportation Advisory Committee (FTAC) which is the industry’s advisory panel to the MPO that advises the MPO Board on freight movement and truck traffic needs. Those goals and project recommendations that relate to the Seaport are included below. Components of the Plan are expanded on in the Transportation Section of this Assessment Report. POM works with Freight Plan partners to towards sustainable transportation practices. While many of the over 40 projects identified in the 2009 Freight Plan are likely to positively impact the POM through improved efficiency of the movement of goods, listed below are the port-specific project recommendations. Priority one recommendations are forwarded for inclusion in the Long Range Transportation Plan.
The goals of 2009 Freight Plan include:
• Goal 1: Support economic development by enhancing freight system connectivity.
• Goal 2: Advance strategic freight initiatives that support job creation and retention to enhance the region’s long-term competitive position.
• Goal 3: Enhance freight transportation safety and convenience to ensure mobility and access.
• Goal 4: Provide the secure movement of international and domestic goods.
• Goal 5: Address the varied freight improvement needs of area shippers, carriers and distributors at both a regional and corridor level.
• Goal 6: Improve multimodal access in order to enhance freight efficiency throughout the County.
• Goal 7: Promote methods for regional goods movement that are socially and environmentally responsible.
• Goal 8: Educate the public on the importance of freight transportation to the region as well as the needs and issues of shippers, carriers, and other affected stakeholders.
• Goal 9: Give greater priority and attention to freight in the regional planning process.
• Goal 10: Make public investments that help minimize the cost and improve the reliability of goods movement within the County.
• Goal 11: Implement and maintain freight initiatives that provide long-term returns on public investment.
Seaport-Government Operations – Page 11
Examples of policy objectives associated with these goals include:
• Determine a location(s) for truck parking and staging locations closer to origins/destinations to allow drivers to avoid peak traffic periods and comply with Federal Driver Hours of Service regulations.
• Evaluate the feasibility of “24/7” operations at key freight origins and destinations as a potential freight congestion management strategy.
• Identify and evaluate the feasibility and benefit-cost of low-cost congestion management improvements such as improved traffic signal timing.
• Identify intersections with heavy truck traffic that do not meet present design standards. Advance priority intersection improvements in line with updated intersection design standards.
• Implement the Truck Route System for Miami-Dade as a foundation or backbone for defining a Miami-Dade County Core Freight System (all modes) and integrate with current planning and programming activity.
• Implement low cost ITS improvements that provide information to freight carriers that allow them sufficient time to react to changing traffic conditions.
• Periodically review the state of the system in terms of pavement quality and other maintenance related measures that are important to carriers.
Freight Plan Seaport-Related Project Recommendations*
Priority Project Details
1 Downtown/Port Access
-Construct I-95 NB Slip Ramp on NW 6th St.
-Implement NE/NW 5th/6
th Sts./Port Blvd. improvements for
access between POM and I-95 slip ramp.
-Improve intersections to accommodate truck movements in
existing NW 1st/Miami Ave./NE/NW 5
th/6
th St corridor
1
SR 836/I-395/MacArthur
Cswy. (NW 137 Ave. to
Proposed Port of Miami
Tunnel)
-Elevated express lanes
-Implementation of E-W Rail Line to reduce passenger traffic
-836-112 interconnector implementation (part of MIC
project)
1
Port of Miami Infrastructure
(Including all access roads
in/through downtown Miami)
-Expand shipping/freight industry hours of operations
-Port Tunnel
-Expand SB left-turn lane on Biscayne Boulevard for trucks
entering the POM
1 Truck Parking Improvement
-Provide a location in the area of Okeechobee and the
HEFT for long-term truck parking and staging. Area should
provide the amenities necessary for drivers to serve Miami-
Dade County while meeting their Federal Hours of Service
requirements.
-Develop truck staging area near NW 36th Street and NW
37th Ave for the Port of Miami River.
1 Short Sea Shipping Pilot
Project
Conduct a Pilot Project of short sea shipping to evaluate if
containers could be transported effectively from the POM to
the Port of Miami River using shallow draft vessels to relieve
congestion at the POM and reduce truck traffic.
2 Port of Miami Operations
PierPass Feasibility Study to examine the impact of
implementing congestion mitigation incentives for off-peak
operations.
Seaport-Government Operations – Page 12
2 Freight Rail Maintenance
and Repair
Projects associated with line and structure maintenance,
including bridge rehabilitation, track and tie replacement,
resurfacing, and repairs to signs and signals. Repair FEC
Bascule rail bridge into the Port of Miami.
2 Port of Miami Dredging
Phase III
Complete site preparatory work for dredging project include
the strengthening of the South Channel Cargo Wharf
bulkhead, purchase two new Post-Panamax cranes, and
deepen channel to 50'/52'
3
Port of Miami-Cargo Yard
Freight Accessibility
Program
Site work, access road, paving and drainage, utility work,
demolition of existing Shed G in R.O.W. and relocation to a
new Warehouse (to be constructed) east of Shed E as part
of the freight accessibility program.
3 Port of Miami-Bulkhead
Restoration/Repair
-Create a new Bulkhead (wharf 155-160) to protect and
restore a dilapidated cargo area and maintain existing
freight accessibility through: site work, infrastructure
improvement, paving and drainage.
-Safety project to rehabilitate the bulkhead wall system and
pavement of the South Cargo Wharf from approximately
berths 165 to 177. Project includes: waterway infrastructure
improvement, site work
3
Port of Miami-Seaboard
Marine Cargo Yard
Improvements
Part of the agreement with Seaboard to improve the yard
and to support their existing terminal operations at the port.
Work to be done in 5 phases including apron and pavement
enhancements and drainage improvements in this area.
Apron work includes site preparation including excavation,
placement of subgrade and lime rock base, and resurfacing
to accommodate heavy crane loads.
3
Port of Miami-
Environmental
improvements and
Equipment Protection
-Electrification of all gantry cranes for more sustainable
operations. Project will increase freight movement efficiency
and help reduce noise levels and air pollution. Project also
includes cargo yard preparation for the arrival of two new
Post-Panamax cranes to increase cargo throughput.
-Installation of new canopies at the cargo gates to prevent
equipment weathering.
(Source: *Graph modified from Miami-Dade Freight Plan, 2009)
Seaport-Government Operations – Page 13
Fuel Reduction Initiatives The Port has embarked on a Gantry Crane Electrification initiative to help reduce fuel consumption. The Port completed Phase 1 of this initiative in 2007 by electrifying five of its nine Gantry cranes. Electrification results in a fuel reduction per crane estimated at 60,000 gallons of diesel per year along with an estimated fuel saving cost of $71,900 per year per crane. In addition, the Port will realize emissions reduction benefits as a result of this initiative as per the graph below. The Port is in the process of implementing Phase 2 of the gantry crane electrification program and is expected to finish by 2011.
Electricity Reduction Initiatives To reduce electricity consumption, the Seaport has initiated an energy reduction program. In addition to programming the Thermal Energy Storage System to produce ice during the off-peak night consumption period to cool the air during the peak demand period at Cruise Terminals F and G, the Port has installed Energy Star rated chillers and HVAC equipment throughout its facilities. The Port also installed building management systems on all of its terminals and major buildings to help control heating and cooling within its buildings. Water Reduction Initiatives The water consumption will be evaluated as part of the county’s water use reduction initiative. A water use audit will be conducted in 2010 to identify water use and retrofit needs. An implementation plan will be included in the water use audit evaluation report.
Processing Time Initiatives In 2007, the POM installed a new state of the art cargo and security gate complex which includes 10 inbound and six outbound lanes for the efficient and secure flow of trucks to and from the Port’s cargo terminal facilities. The new cargo gate has decreased the security processing time through its electronic “FastPass” processing system in half – to an average of ninety seconds for inbound trucks. See graph above under “indicators” for a snapshot of average security gate processing times in November 2009. To ensure efficiency, this “FastPass” Gate Security System includes a “Lane Watcher” program which alerts the security supervisor if the processing time takes three minutes or more. This allows the supervisor to determine if the delays are security or technology (IT) related. If it is IT related, the officer will notify IT staff immediately to investigate and commence repairs, if necessary. Prior to the installation of this security system, trucks were processed manually and processing times were double that of today. Although emissions reduction benefits have not been estimated for the new roads and security gate improvements, the visible decrease of idling vehicles and trucks is noticeable. These changes have allowed the Port to both operate more efficiently and minimize emissions through a reduction of idling time.
Projected Emissions Reductions through Electrification of Gantry Cranes (tons per year)
Pollutant Unit NOx PM HC CO CO2
Emissions Reductions for 5 Cranes (Phase 1 completed)
111.1 6.54 9.29 41.0 1,990
Total Emissions Reductions for 9 Cranes (4 additional cranes) (Phase 2 pending)
200.0 11.72 3.72 73.8 3,582
Seaport-Government Operations – Page 14
Future & On-going Initiatives One of the Seaport’s main capital initiatives, in partnership with FDOT and the City of Miami is the Public Private Partnership (PPP) with the Miami Access Team to construct a tunnel from Watson Island to the Port to create direct interstate access for Port traffic. With the Port’s only access through the City’s central business district and associated downtown streets, this tunnel will provide pedestrian/bicyclist safety benefits to our community by separating port traffic from the urbanized City, decrease the average ingress and egress travel times by 40 percent, and assist in the reduction of diesel usage and emissions to decrease the region’s overall carbon footprint. With freight transportation costs averaging $1 per minute, the mobility benefits of the Port Tunnel result in significant travel cost savings and sustainability. Other future and on-going initiatives include:
• Incorporating POM objectives into the 2010 CDMP update to apply sustainable principles in the planning, design, construction, operation and maintenance of our facilities, and follow the County’s Sustainable Buildings Program which promotes LEED green design, construction and operation of buildings.
• Continuing to reduce energy consumption by retrofitting buildings with energy efficient products such as motion sensor lighting, CRFL lighting, energy Star rated chillers and HVAC equipment. The Port will create and incorporate a “Green Building Committee” into the Capital Development process to ensure that applicable projects are designed to reduce electricity, fuel and water consumption.
• Implement water use consumption reduction practices by retrofitting bathroom and kitchen fixtures with water efficient technologies such as motion sensor faucets, WaterSense rated fixtures and incorporate Florida Friendly principles for landscape irrigated areas.
• Performing a study to determine the feasibility of providing an energy farm, via solar panels on all applicable County-owned facilities at the Port. This system would utilize sustainable measures to create electricity to supply the local power grid to run the Port and potentially sell excess electricity to the utility company.
• Exploring alongside our cargo and cruise tenants the potential use of cold ironing as a means to provide electric power to the ships berthed to enable the vessels to turn off their diesel engines. This initiative has the potential to minimize diesel usage and emissions for the community.
• Creating a Sustainable Committee as part of its Capital Project Development Process. This committee is responsible for overseeing green initiatives during each capital project for construction or major renovation of Port buildings.
• The Port’s Procurement Division is promoting the purchase of environmentally preferable products and has commenced tracking of such purchases to show an increase of the Port’s green purchasing power.
• The Port’s maintenance division continues to promote energy efficiencies through the installation of energy efficient light bulbs, sensor-controlled switches, and low-water usage plumbing fixtures during its operational and maintenance activities.
• The Port continues to offer best management storm water training not only to Seaport staff, but to customers and tenants.
Seaport-Government Operations – Page 15
COMMUNITY FEEDBACK Feedback & results gathered though the planning process or surveys
Cruise Passenger Satisfaction The Port performed a cruise passenger survey between the years 2002 and 2003 to capture both on and off cruise season. Some results are summarized below:
Question Rating
Mostly likely to cruise again from the Port of Miami 90%
Curbside Staff was helpful and friendly (fair to excellent rating) 97.2%
Able to board the bus easily (fair to excellent rating) 96.7%
The terminals were comfortable 98.2%
Miami-Dade County Resident Satisfaction Survey 2008 See the Transportation Area of this report for community feedback on services at the POM.
Compliance with Environmental Regulations – 1
Compliance with Environmental Regulations Assessment Area An annual report entitled “Violations of Environmental Regulations at Government Facilities and Properties in Miami-Dade County, Florida” was created by the Department of Environmental Resources Management (DERM) on recommendation of the Dade County Grand Jury during its 1993 Fall Term. This report is known as the “Government Report,” and since its inception in October 1994, this and subsequent Government Reports have reviewed the environmental status of government sites within Miami-Dade County, including county, federal, state and municipal government facilities. An update of the Government Report was recently conducted and reviews the status of environmental cases for the time period of April 2nd, 2008, through March 31st, 2009.
Table 1 summarizes the status of all cases at County facilities listed by Department. In terms of assessing sustainable practices, the list of ‘new’ cases compiled each year (Table 2) will be used as an indicator and reviewed each year.
Miami-Dade Public Works 1 0 0 1 0 Miami-Dade Transit 6 3 1 1 1 Miami-Dade Water & Sewer 7 4 0 0 3 Community Health of South Dade
2 0 0 2 0
North County Neighborhood Service Center
1 1 0 0 0
Miami-Dade Fire Rescue 4 1 0 3 0 Seaport/Port of Miami 6 2 0 0 4 Miami-Dade County Corrections
1 0 0 1 0
Jackson Memorial Hospital 1 0 0 0 1 MDC Totals 160 80 5 19 56
Compliance with Environmental Regulations – Page 2
Table 2 - New Cases from April 2, 2008 – March 31, 2009
Miami-Dade County Department
Facility Violation Type Status
General Services Administration (GSA)
GSA Property/Former Community Crusade Against Drugs site NW 37th Av & NW 183rd St (HWR-109)
Contamination in groundwater
Assessment report is past due for this violation documented in 1994. DERM requirements for this violation have not been met in a satisfactory or timely manner. GSA cites lack of funds for assessment/remediation as the cause for non-compliance.
General Services Administration (GSA)
Community of Landmark 20600 NW 47th Av (PSO-620)
Section 24-42.2, violation of operating requirements for sanitary sewer collection and transmission systems
Site activities are progressing satisfactorily.
Aviation Department
Aerotecnic OPF, 3901 NW 145 St. (IW5-16916)
Failure to obtain operating permit
UCVN issued 03/05/09 for unpermitted activities related to aircraft painting. Affidavit of Non-compliance filed on 06/18/09. Notice of Intended Court Action issued 10/23/09.
Parks & Recreation Department
Amelia Earhart 200 W 74 Pl. (HWR-554)
Metals and petroleum contamination from former military use of the site discovered during construction activities.
Environmental assessment and remediation is being conducted by the United States Army Corps of Engineers under the Formerly Used Defense Site program. Site investigation is ongoing and status of work conducted is due within 60 days.
Transit Department
NE Bus Maintenance 360 NE 185 St. (UT-0288) (IW-412)
Section 24-42.4, Petroleum and non-petroleum discharges to the sanitary sewer.
Discharge to sanitary sewers from steam bay o/w separator not in compliance. Although MDT instituted DERM required Action Plan to correct discharge violations, current sampling results indicate that violations continue to occur. Follow-up action by the Department is underway.
Source: “Violations of Environmental Regulations at Government Facilities and Properties in Miami-Dade County, Florida”, Department of Environmental Resources Management (DERM)