GPU Acceleration of the Generalized Interpolation Material Point Method Wei-Fan Chiang, Michael DeLisi, Todd Hummel, Tyler Prete, Kevin Tew, Mary Hall, Phil Wallstedt, and James Guilkey Sponsored in part by NSF awards CSR-0615412 and OCI-0749360 and by hardware donations from NVIDIA Corporation.
Transcript
GPU Acceleration of the Generalized Interpolation
Material Point Method
Wei-Fan Chiang, Michael DeLisi, Todd Hummel, Tyler Prete, Kevin Tew, Mary Hall,
Phil Wallstedt, and James Guilkey
Sponsored in part by NSF awards CSR-0615412 and OCI-0749360 and by hardware donations from NVIDIA Corporation.
Outline
• What is Material Point Method and Generalized Interpolation Material Point Method?
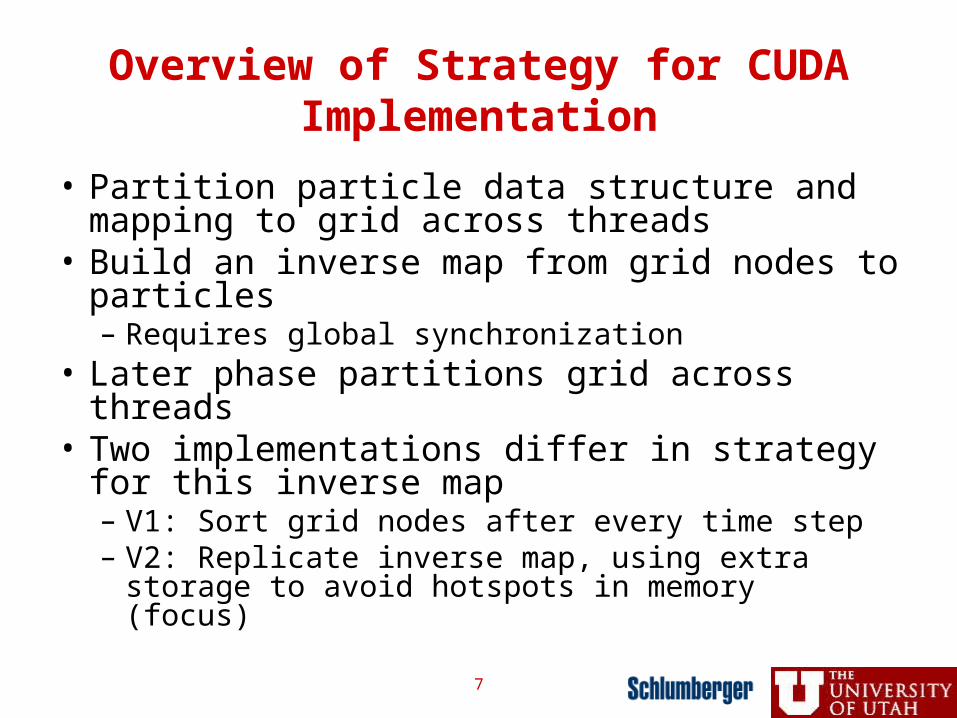
• Suitability for GPU Acceleration• Implementation Challenges
– Inverse mapping from grids to particles (global synchronization)
– I/O in sequential implementation • Experimental Results• Looking to the future:
– Programming Tools and Auto-tuning
2
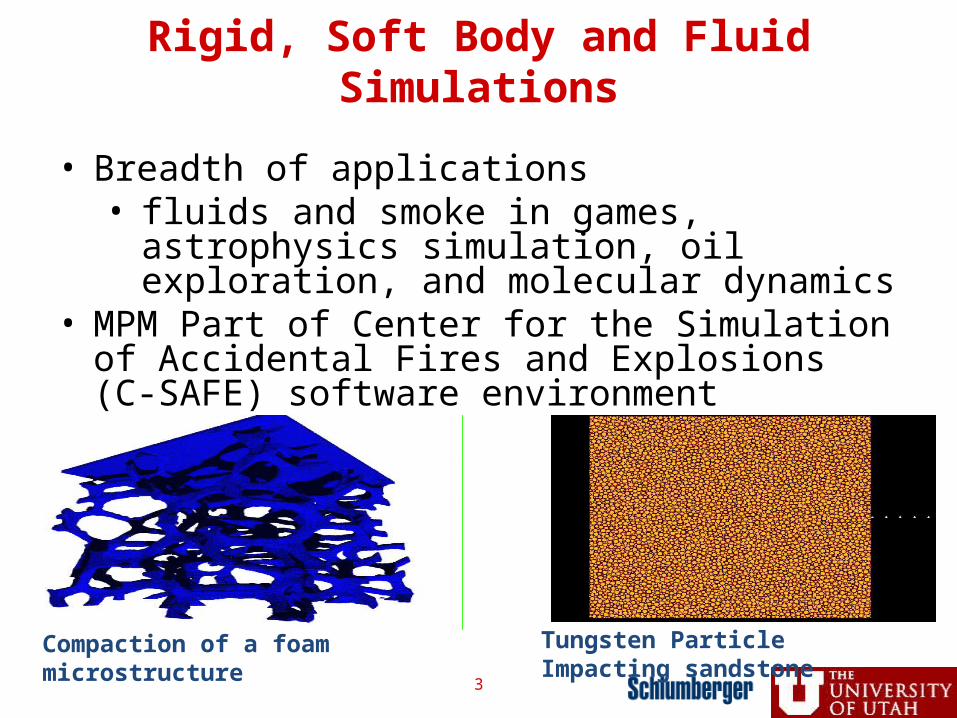
Rigid, Soft Body and Fluid Simulations
Tungsten Particle Impacting sandstoneCompaction of a foam microstructure
• Breadth of applications• fluids and smoke in games, astrophysics simulation,
oil exploration, and molecular dynamics• MPM Part of Center for the Simulation of
Accidental Fires and Explosions (C-SAFE) software environment
3
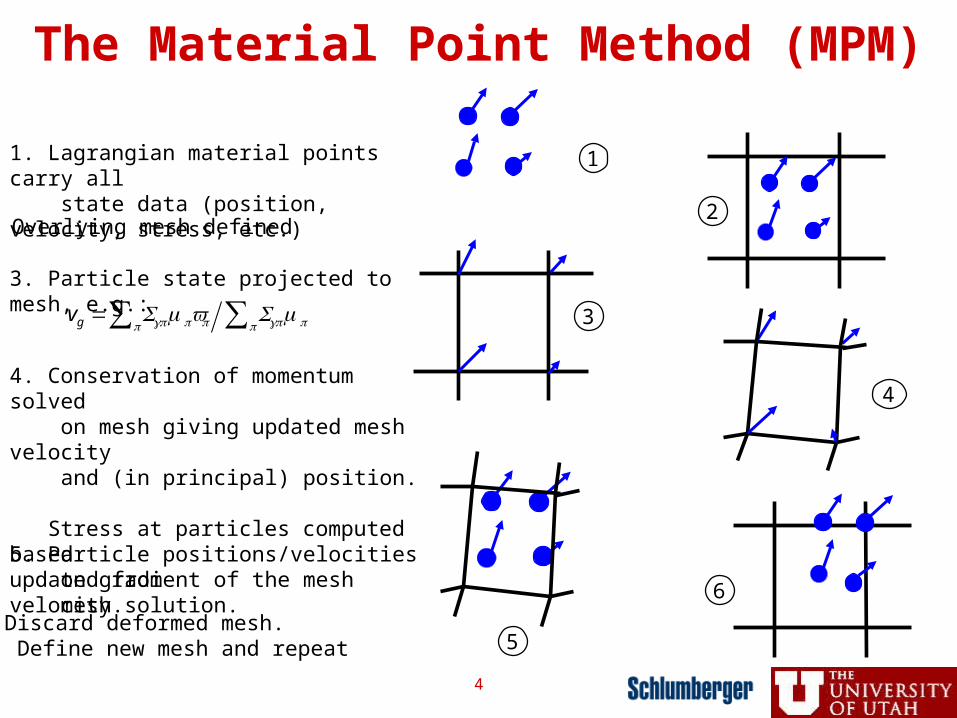
2. Overlying mesh defined
1. Lagrangian material points carry all state data (position, velocity, stress, etc.)
5. Particle positions/velocities updated from mesh solution.
6. Discard deformed mesh. Define new mesh and repeat
1
2
3
4
5
The Material Point Method (MPM)
3. Particle state projected to mesh, e.g.:
4. Conservation of momentum solved on mesh giving updated mesh velocity and (in principal) position.
Stress at particles computed based on gradient of the mesh velocity.
6
vg = Sgpmpvpp∑ Sgpmpp∑
4
Approach
• Start with sequential library implementation of MPM and GIMP– And descriptions of parallel OpenMP and
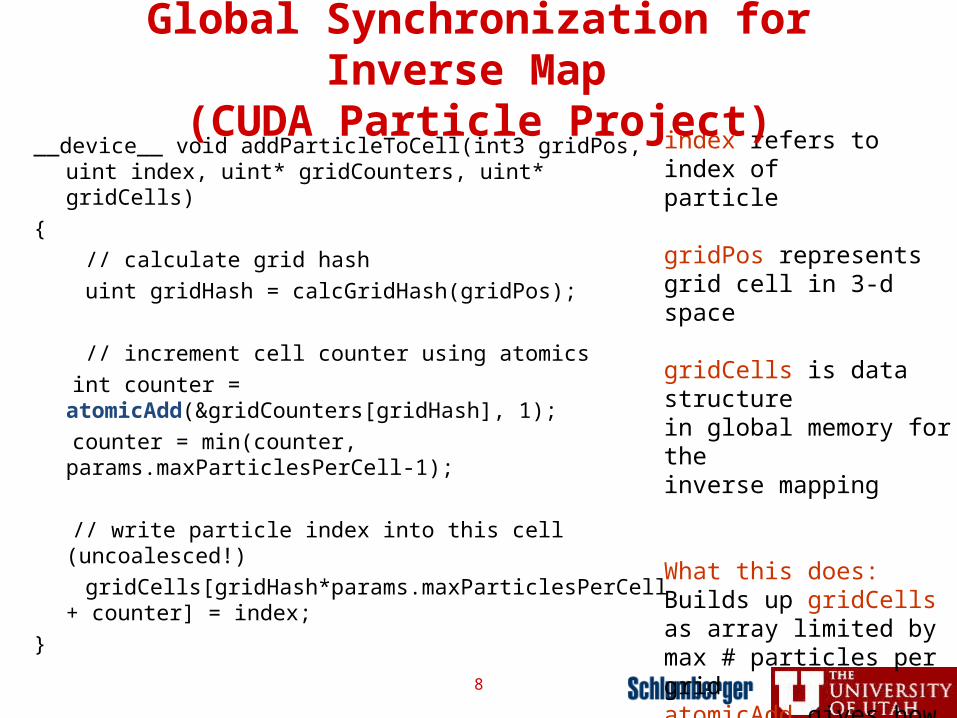
params.maxParticlesPerCell-1); // write particle index into this cell (uncoalesced!) gridCells[gridHash*params.maxParticlesPerCell +
counter] = index;}
index refers to index ofparticle
gridPos representsgrid cell in 3-d space
gridCells is data structure in global memory for theinverse mapping
What this does:Builds up gridCells as array limited by max # particles per grid atomicAdd gives how many particles have already been added to this cell
Global Synchronization for Inverse Map
(CUDA Particle Project)
8
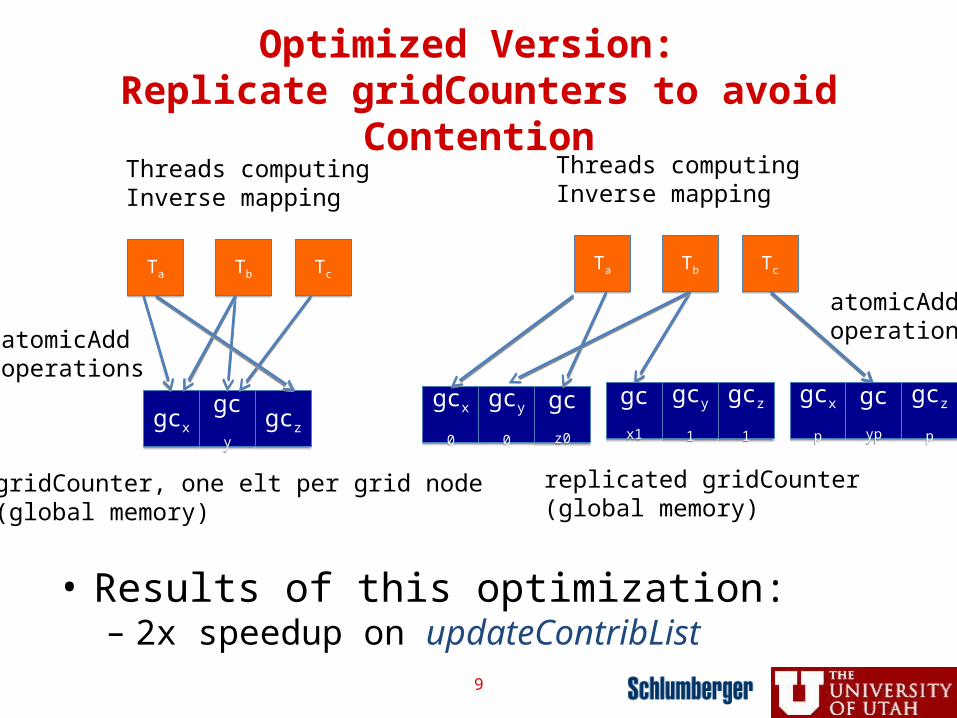
Optimized Version: Replicate gridCounters to avoid
Contention
• Results of this optimization: – 2x speedup on updateContribList
• Global memory coalescing– gridHash and gridCounters organization– Use of float2 and float4 data types– CUDA Visual Profiler pinpointed these!
• Maintain data on GPU across time steps • Fuse multiple functions from sequential
code into single, coarser grained GPU kernel
• Replace divides by multiples of inverse and cache
10
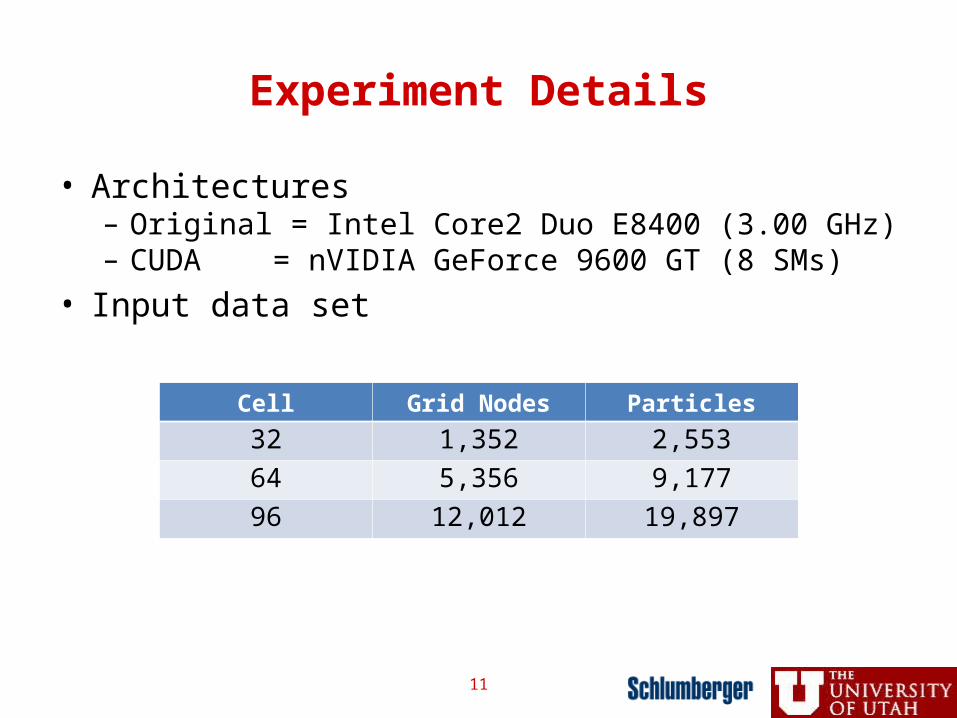
Experiment Details
• Architectures– Original = Intel Core2 Duo E8400 (3.00 GHz) – CUDA = nVIDIA GeForce 9600 GT (8 SMs)
• Input data set
Cell Grid Nodes Particles
32 1,352 2,55364 5,356 9,17796 12,012 19,897
11
Results on Key Computations
• All results use 128 threads• Speedups of 12.5x and 6.6x, respectively,
over sequential implementation
12
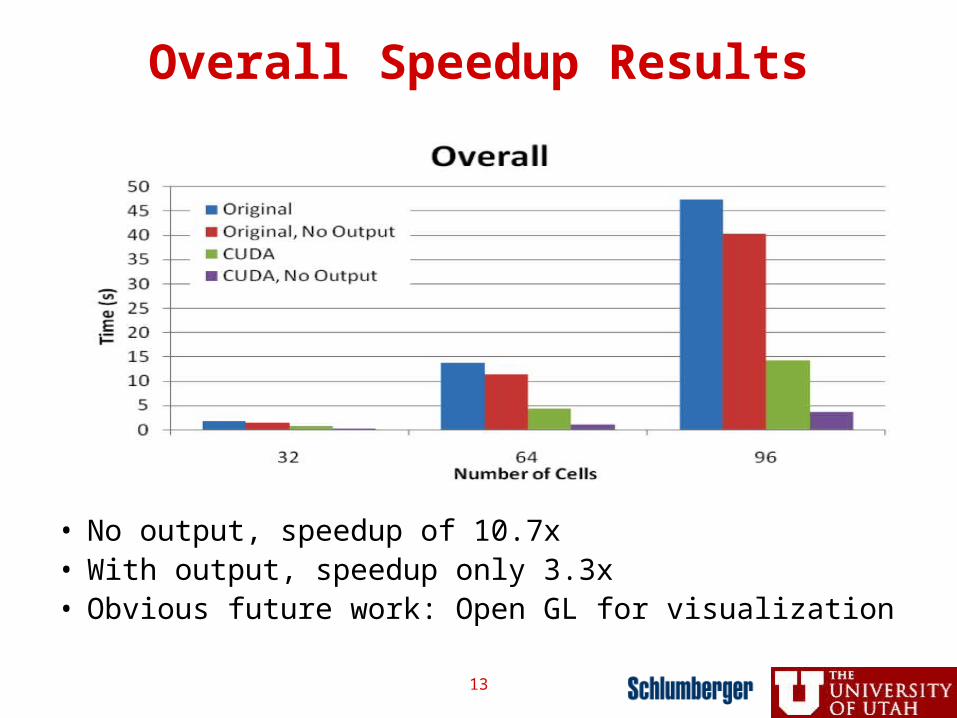
Overall Speedup Results
• No output, speedup of 10.7x• With output, speedup only 3.3x• Obvious future work: Open GL for visualization
13
Shifting Gears: Programmability and Auto-tuning
• Midterm extra credit question:– “If you could invest in tool research for
GPUs, in what areas would you like to see progress?”
• Tools– Assistance with partitioning across
threads/blocks – Assistance with selecting numbers of
threads/blocks– Assistance with calculating indexing
relative to thread/block partitioning
14
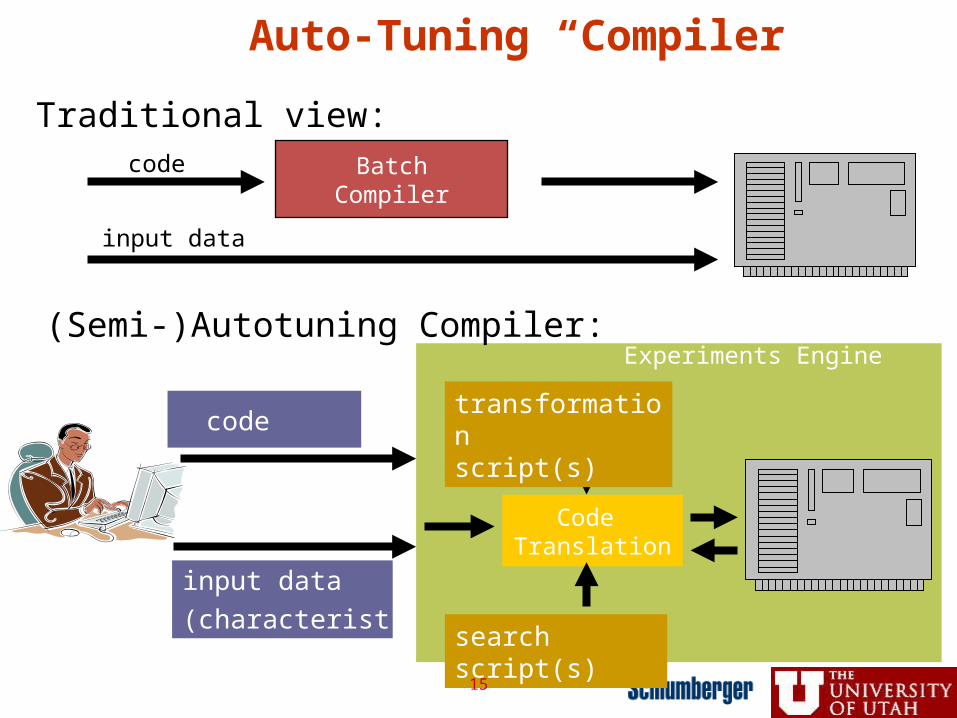
Auto-Tuning “Compiler”
BatchCompiler
code
input data
Traditional view:
Code Translation
code
input data
(characteristics)
(Semi-)Autotuning Compiler:
search script(s)
transformationscript(s)
Experiments Engine
15
Current Research Activity
• Automatically generate CUDA from sequential code and transformation script, with CUDAize(loop,TI,TJ,kernnm)
• Advantages of auto-tuning– Tradeoffs between large number of threads to hide
latency and smaller number to increase reuse of data in registers
– Detect ordering sensitivities that impact coalescing, bank conflicts, etc.
– Evaluate alternative memory hierarchy optimizations
• Addresses challenges from earlier slide– Correct code generation, including indexing– Auto-tuning to select best thread/block partitioning– Memory hierarchy optimizations and data movement
16
Summary
• Three areas of improvement for MPM/GIMP– Used single precision, which may not
always be sufficiently precise– Wanted more threads but constrained by
register limits– OpenGL visualization of results
• Newer GPUs and straightforward extensions ameliorate these challenges