51
Gradation Analysis of Cold Feed And Extracted Bituminous Mix Samples Final Report for MLR-88-2 June 1988 Highway Division Iowa Department of Transportation
Gradation Analysis of Cold Feed And
Extracted Bituminous Mix Samples
Final Report for
MLR-88-2
June 1988
Highway Division
----~ti& Iowa Department -------~i of Transportation

GRADATION ANALYSIS OF COLD FEED AND
EXTRACTED BITUMINOUS MIX SAMPLES
Final Report for Project MLR-88-2
By John F. Adam
Physical Tests Engineer
Iowa Department of Transportation Highway Division
Office of Materials Ames, Iowa 50010
June 1988
TABLE OF CONTENTS
Page
Abstract.. .. .. . . . . . . . .. . .. .. .. .. .. . . .. .. .. . .. . . .. .. .. . .. . . . .. .. .. .. .. . .. .. . .. 1
Introduction. . .. .. . .. . .. .. .. . .. .. .. .. .. .. .. .. .. .. .. .. . . .. . . . .. .. .. . .. . .. .. . .. .. 2
Problem Statement................................... 2
Procedure and Scope................................. 3
Results. .. .. .. .. . .. . .. . .. .. . . .. .. .. .. . .. .. .. .. .. .. . .. . .. .. .. .. .. .. .. .. .. .. .. .. .. . .. .. .. 8
Conclusions............................................................................ 15
Appendix A - Example of Lotus Database Format Used .. 17 Appendix B - Materials Instructional Memorandum ..... 21
510 and 511 Appendix C - Example of Effects on Aggregate ....••• 38
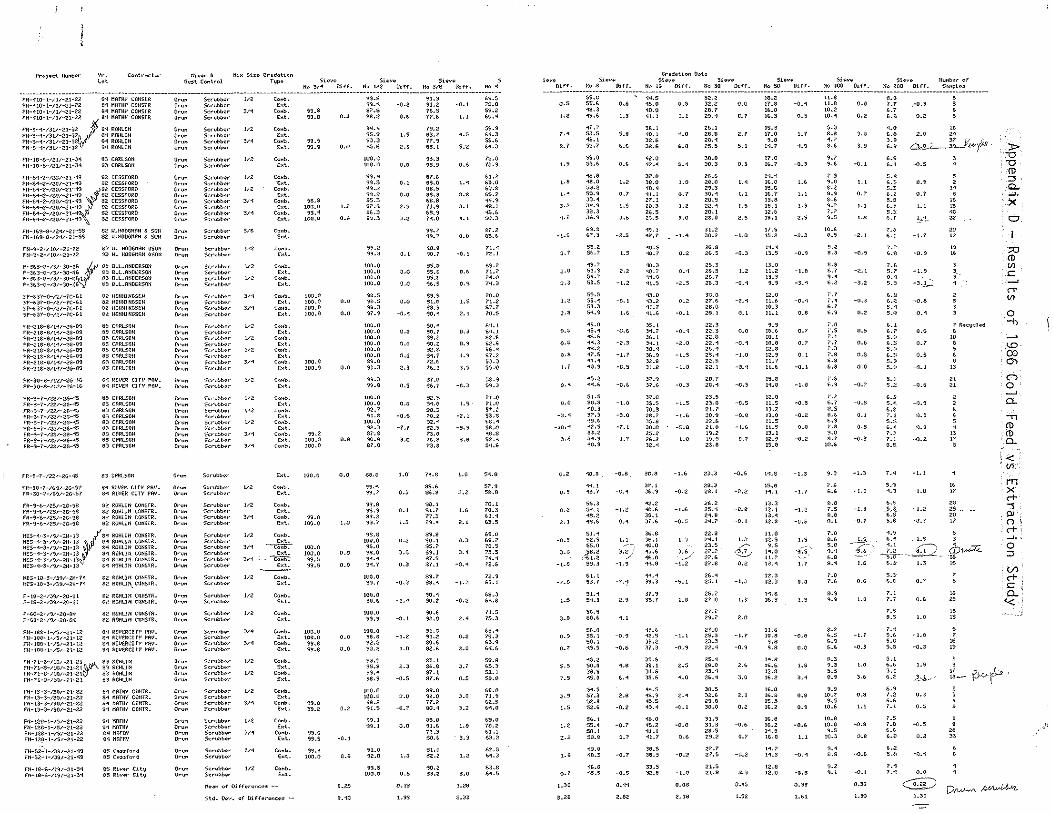
Degradation on Mix Properties Appendix D - Results of 1986 Cold Feed vs ......••.•. 46
Extraction Study
DISCLAIMER
The contents of this report reflect the views of the authors and do not necessarily reflect the official views of the Iowa Department of Transportation. This report does not constitute a standard, specification or regulation.

PAGE 1
ABSTRACT
Since 1987, the Iowa Department of Transportation has based control
of hot asphalt concrete mixes on cold feed gradations.
This report presents results of comparisons between cold feed gra
dations and gradations of aggregate from the same material after it
has been processed through the plant and laydown machine. Results
are categorized based on mix type, plant type, and method of dust
control, in an effort to quantify and identify the factors contrib
uting to those changes.
Results of the report are:
1. From the 390 sample comparisons made, aggregate degradation due
to asphalt plant processing was demonstrated by an average in
crease of +0.7% passing the #200 sieve and an average increase
in surface area of +1.8 sq. ft. per pound of aggregate.
2. Categories with Type A Mix or Recycling as a sorting criteria
generally produced greater degradation than categories contain
ing Type B Mixes and/or plants with scrubbers.
3. None of the averages calculated for the categories should be
considered unacceptably high, however, it is information that
should be considered when making mix changes in the field, se
lecting asphalt contents for borderline mix designs, or when
evaluating potential mix gradation specification or design cri
teria changes.

PAGE 2
INTRODUCTION
Prior to 1987, bituminous mix gradation control was based entirely
on extraction gradation results. Beginning with the 1987 con
struction season, control of asphalt concrete mixes was based on
the gradation of cold feed samples in an effort to reduce, if not
eliminate, the number of methylene chloride vacuum extractions per
formed in the District Materials Laboratories. New gradation lim
its established for cold feed sampling were based on a project
records study in which extracted gradations were compared with cold
feed gradations to determine the average difference in percent
passing for each sieve size. The primary benefit derived from im
plementing the exclusive use of cold feed control would be the
elimination of the labor intensive methylene chloride extraction
procedure which requires the use of large quantities of an expen
sive and hazardous chlorinated solvent.
PROBLEM STATEMENT
The aggregate gradation of a bituminous mix is one of the most
critical components in determining mix design and construction
characteristics such as % voids, % VMA, density, stability,
workability, and recommended asphalt content. Thus, gradation con
trol is essential for assuring that specified gradation require
ments are satisfied, and the resulting mix meets or exceeds the
design criteria. A detrimental limitation of cold feed gradation
control is that cold feeds are used to evaluate mix gradation,
while all other tests, such as density and stability, are performed
on mix that has been processed through the asphalt plant. Grada-

PAGE 3
tion changes, specifically aggregate degradation due to plant proc
essing and handling, must be anticipated and evaluated so mix
design criteria and, consequently, pavement quality, is not compro
mised.
The primary objective of this study is to determine how processing
through the asphalt plant affects aggregate gradation of a
bituminous mix. Within this primary objective, the study will also
examine how other factors, such as plant type, pollution control,
or mix type, may be related to any gradation changes that may be
identified. Results of the study will be useful in verifying gra
dation limits established in 1987, and in providing data on which
new cold feed gradation limits and filler-bitumen ratios can be
founded.
PROCEDURE AND SCOPE
All samples used in this study were obtained from projects con
structed during the 1987 construction season. For purposes of this
study, District Materials personnel were requested to deliver, to
the Central Materials Lab, a series of box samples for each mix de
sign used on a project in their district. Information requested to
be provided with each sample included the following:
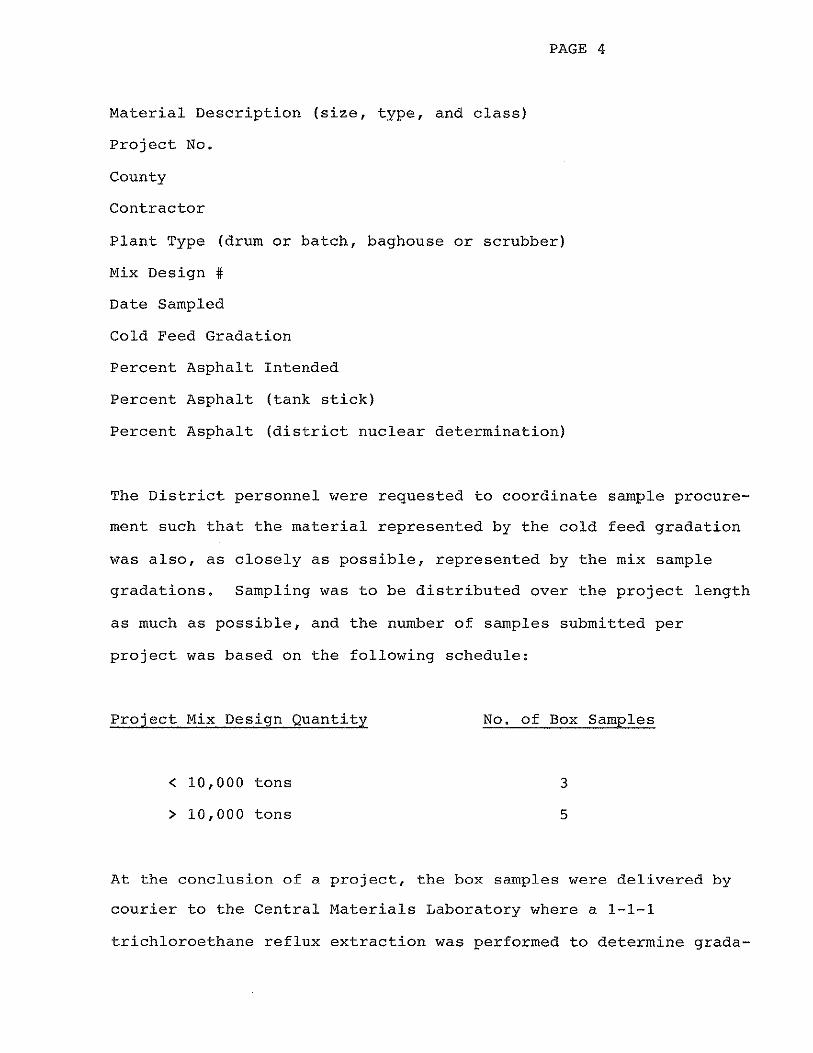
Material Description (size, type, and class)
Project No.
County
Contractor
PAGE 4
Plant Type (drum or batch, baghouse or scrubber)
Mix Design #
Date Sampled
Cold Feed Gradation
Percent Asphalt Intended
Percent Asphalt (tank stick)
Percent Asphalt (district nuclear determination)
The District personnel were requested to coordinate sample procure
ment such that the material represented by the cold feed gradation
was also, as closely as possible, represented by the mix sample
gradations. Sampling was to be distributed over the project length
as much as possible, and the number of samples submitted per
project was based on the following schedule:
Project Mix Design Quantity
< 10,000 tons
> 10,000 tons
No. of Box Samples
3
5
At the conclusion of a project, the box samples were delivered by
courier to the Central Materials Laboratory where a 1-1-1
trichloroethane reflux extraction was performed to determine grada-
PAGE 5
tion and asphalt content. A nuclear asphalt content determination
was also made on those samples for which a nuclear calibration was
available.
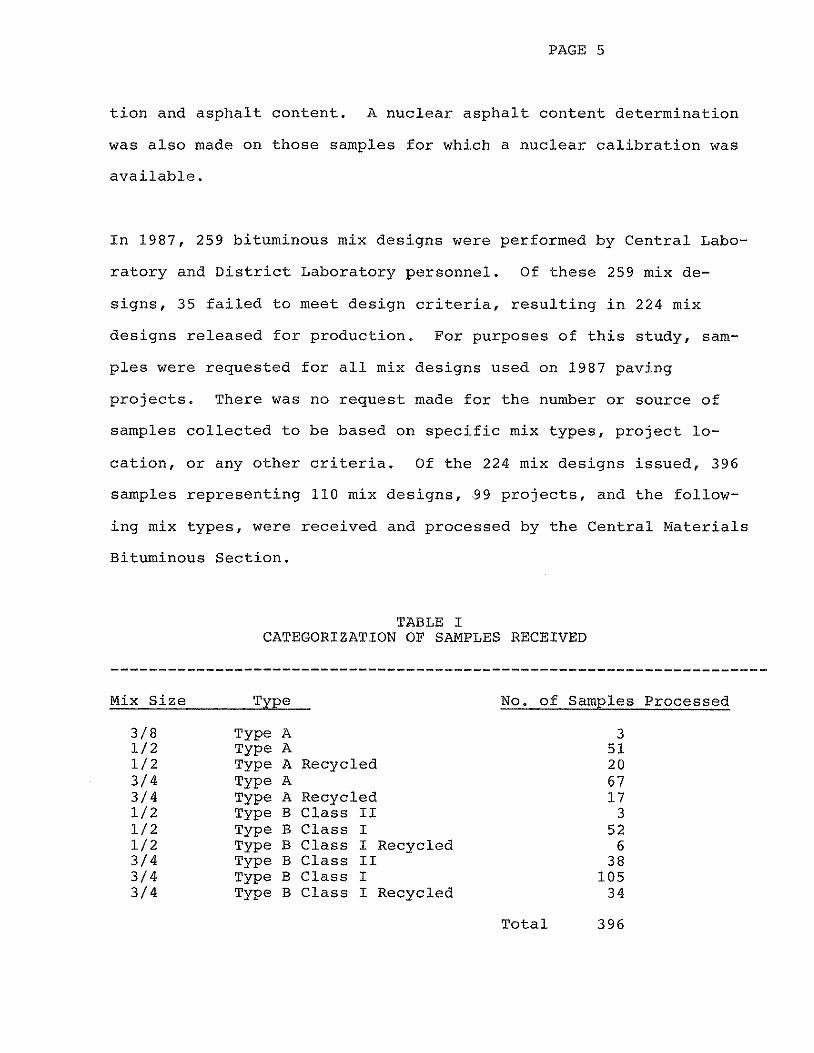
In 1987, 259 bituminous mix designs were performed by Central Labo-
ratory and District Laboratory personnel. Of these 259 mix de-
signs, 35 failed to meet design criteria, resulting in 224 mix
designs released for production. For purposes of this study, sam-
ples were requested for all mix designs used on 1987 paving
projects. There was no request made for the number or source of
samples collected to be based on specific mix types, project lo-
cation, or any other criteria. Of the 224 mix designs issued, 396
samples representing 110 mix designs, 99 projects, and the follow-
ing mix types, were received and processed by the Central Materials
Bituminous Section.
TABLE I CATEGORIZATION OF SAMPLES RECEIVED
---------------------------------------------------------------------Mix Size Type No. of Samples Processed
3/8 Type A 3 1/2 Type A 51 1/2 Type A Recycled 20 3/4 Type A 67 3/4 Type A Recycled 17 1/2 Type B Class II 3 1/2 Type B Class I 52 1/2 Type B Class I Recycled 6 3/4 Type B Class II 38 3/4 Type B Class I 105 3/4 Type B Class I Recycled 34
Total 396

PAGE 6
The samples were received and stored in the Central Lab throughout
the summer and fall of 1987, and processed from November 1987
through January 1988. Reflux extraction gradation and asphalt con
tent from test results were determined and reported. Information
from the test reports was stored in a Lotus 123 Version I database,
and sorted according to various factors suspected of causing or in
fluencing gradation changes in the bituminous mix. Thirty-five
categories were established based on mix type, plant type, and
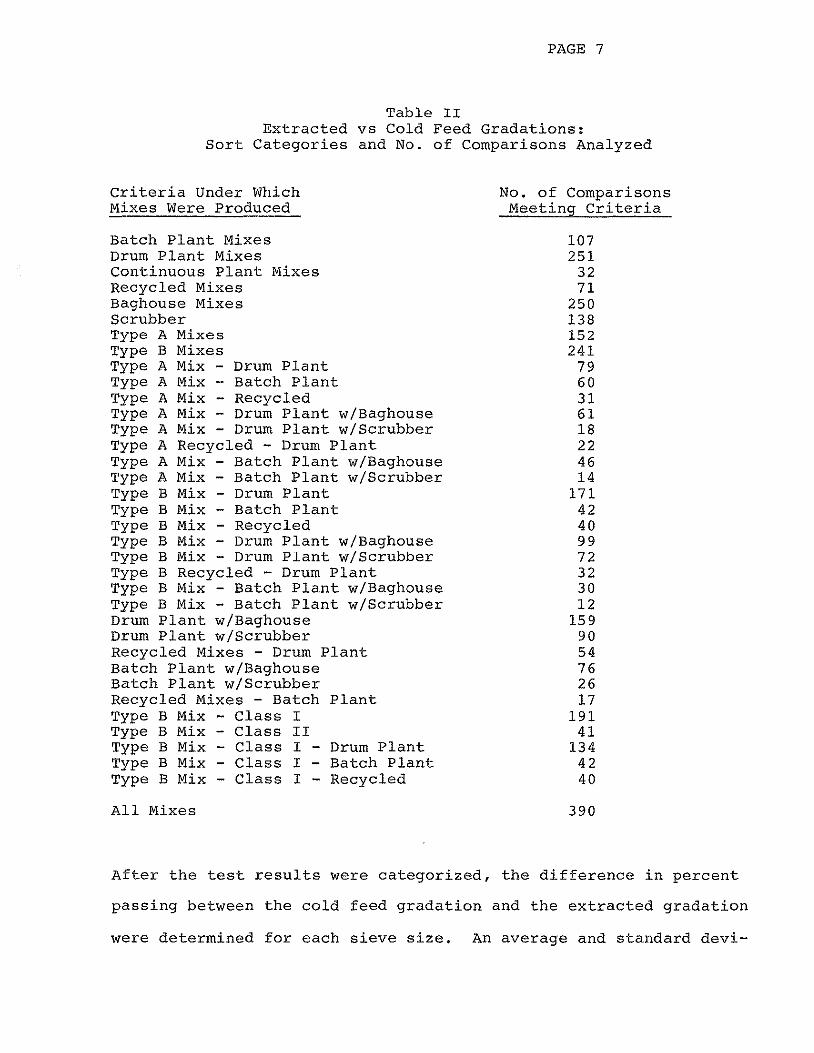
plant pollution control (Table II). The number of sample compar
isons in each category varied from 12 to 251. A printed example of
format and content of data found in each category can be seen in
Appendix A. This example illustrates the data from 81 comparisons
that fall within the category "Batch Plants with Baghouse". The
data from all 35 categories is too massive for presentation in this
report, however, it does remain stored on floppy disks should the
information later need to be retrieved. Several samples did not
have complete cold feed gradations reported and, therefore, were
not included in the final results. Many samples fell within more
than one category. For instance, a Type A mix might also fall
within the Batch Plant category, the Recycled category, or any one
of a number of other categories.
PAGE 7
Table II Extracted
Sort Categories vs Cold Feed Gradations: and No. of Comparisons Analyzed
Criteria Under Which Mixes Were Produced
Batch Plant Mixes Drum Plant Mixes Continuous Plant Mixes Recycled Mixes Baghouse Mixes Scrubber Type A Mixes Type B Mixes Type A Mix - Drum Plant Type A Mix - Batch Plant Type A Mix - Recycled Type A Mix - Drum Plant w/Baghouse Type A Mix - Drum Plant w/Scrubber Type A Recycled - Drum Plant Type A Mix - Batch Plant w/Baghouse Type A Mix - Batch Plant w/Scrubber Type B Mix - Drum Plant Type B Mix - Batch Plant Type B Mix - Recycled Type B Mix - Drum Plant w/Baghouse Type B Mix - Drum Plant w/Scrubber Type B Recycled - Drum Plant Type B Mix - Batch Plant w/Baghouse Type B Mix - Batch Plant w/Scrubber Drum Plant w/Baghouse Drum Plant w/Scrubber Recycled Mixes - Drum Plant Batch Plant w/Baghouse Batch Plant w/Scrubber Recycled Mixes - Batch Plant Type B Mix - Class I Type B Mix - Class II Type B Mix - Class I - Drum Plant Type B Mix - Class I - Batch Plant Type B Mix - Class I - Recycled
All Mixes
No. of Comparisons Meeting Criteria
107 251
32 71
250 138 152 241
79 60 31 61 18 22 46 14
171 42 40 99 72 32 30 12
159 90 54 76 26 17
191 41
134 42 40
390
After the test results were categorized, the difference in percent
passing between the cold feed gradation and the extracted gradation
were determined for each sieve size. An average and standard devi-

PAGE 8
ation of the percent passing differences associated with each sieve
size were calculated for each category and reported in Table III.
Also calculated was the surface area per pound of aggregate for
each cold feed and extracted gradation. The change in surface area
was determined for each set of samples, and again, averages and
standard deviations calculated for each of the thirty-five catego
ries. Calculations were done according to the chart "Determination
of Surface Area", page 4 of Materials I.M. 511 (Appendix B).
RESULTS
Three hundred ninety gradation comparisons were performed during
the course of this study. As expected, aggregate degradation oc
curred as indicated by an increase in percent passing on all sieve
sizes. Referring to Table III, it is observed that the degradation
pattern, which is generally consistent through the range of all
categories, is well represented by the average for all mixes, which
demonstrates a minor change of +.1 on the #3/4", an increase in the
range of 1.0% to 1.6% passing for the 1/2" through #8 sieves, a
sharp drop to .3% increase on the #16, and the increases for the
#30 through #200 leveling out at about .7% passing.
The ranking of the thirty-five categories by amount of degradation
based on increase in surface area is shown in Table IV. The in
creases range from +3.2 sq. ft./lb. for "Type A Mix-Batch Plant
with Baghouse", to -0. 7 sq. ft. /lb. for "Type A Mix-Batch Plant
with Scrubber. The increase in minus #200 and the number of com
parisons made in each category are also shown. The effect on the
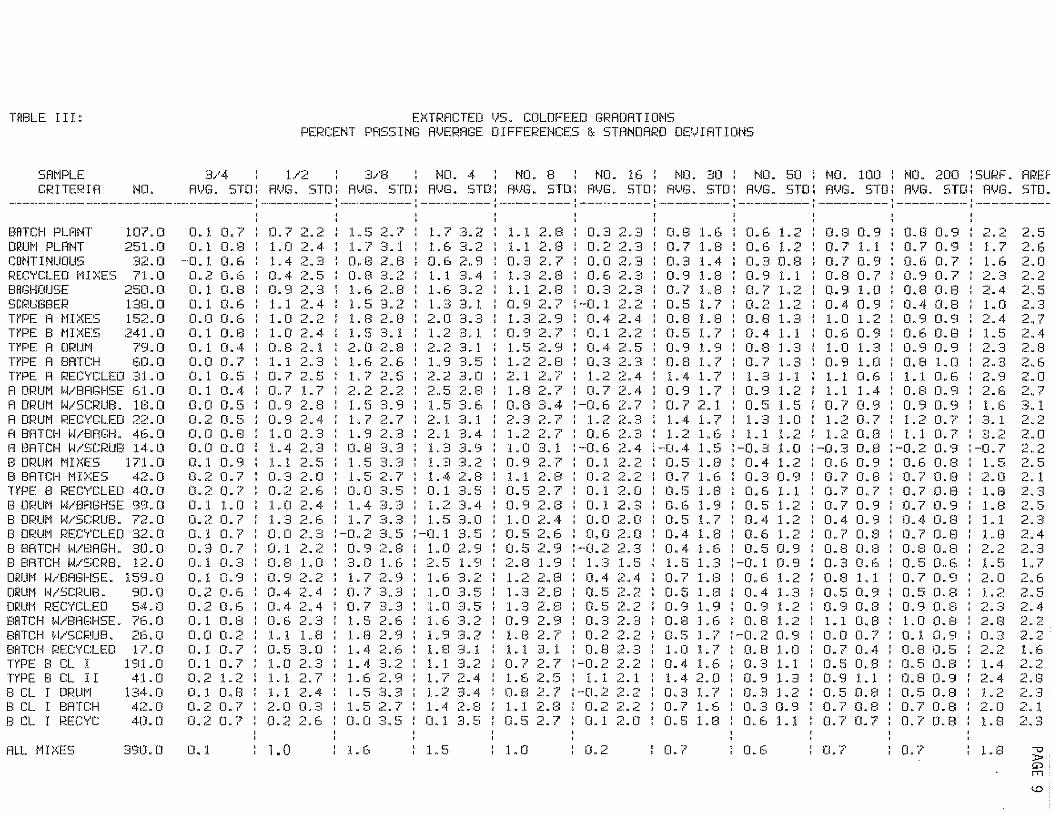
TABLE I II:
SAMPLE CRITERIA 1·;0.
D<:TRFJCTEO \IS. COLDFEED GRADAT ][1~6 PERCENT PF!SSING l=it!ERFlGE OIFFEJ!ENCES & STFlNDARD DE','IATIONS
3/4 1.12 : 3/EI : NO. 4 : NO. 8 : NO. 16 : NO. 30 : NO. 50 : NO. 100 : NO. 200 : SURF. AREf AVG. STD : At..'G. STD : A<..'G. STD : F1 1-)G. STD : A<.!G. STD : l'l\JG. STD : AVG. STD: Al,,IG. STD : AVG. STD: AVG. STD : A<,IG. STD.
------·-----·-----·--··------------------ ~ ---------- '. ---------- '. --------- < ---------: ---·-------: -----------: ---·--------: -----------: ----- -----: ·-------·-----
BATCH PLANT 107. 0 DRUM PLFlt·H 251 • 0 CONTINUOUS 32. 0 RECY'CLED M D~ES 71. 0 BAGHOIJSE 250. 0 SCRUB8Ef;• 13B. 0 HPE A MD(ES 152.0 HPE B M!l;ES 241. 0 HPE A DRUM 79. 0 HPE A BATCH 60. 0 HPE A REC'y'C:LEO 31 . 0 Fl ORUM fl/BFIGHSE 6 l . 0 Ft rnwM 1;/SC:RIJB" 18. 0 A DRUM REC'r'CLED 2;.<. o A BATCH H/BAGH. 46. 0 A BATCH fl/SCRUB 14. 0 B IJRIJM MrnE:S 171. 0 B BATCH MI :x:ES 42. Cl HPE B REC"t'CLED 40. 0 B DRUM H/BFIGHSE 9'.3. 0 B DRUM fl/SCRUB. 1;?. 0 B DRUM REC"!'CLED 32. D B BATCH l,f/BAGH.. 3D. Cl B BATCH l·V~;CRB. 1 ;, • Cl ORUM 1;/BAGHSE. 159. D DRUM >J/SCRLIB. 90. 0 DRUM RECYCL.ED 54. 0 BATCH kUBAc:HSE. 76. 0 BATCH l·J/SCPUB. 26. D BflTCH RECVCLED ! ? . 0 HPE 8 CL I 191.0 T'!PE 8 CL I I 41. D El CL I ORUM 134. 0 El CL I BATCH 4;?. 0 E: CL I REC'r'C 40. 0
ALL MD<ES 390.0
D. l. 0. 7 D. l 0.8
-0. l 0.6 0 .. 2 0.6 D.1 0.8 0.1 0.6 0.0 0.6 0.1 0.8 0.1 0.4 0.0 I). 7 0 .. 1 0.5 0.1 0.4 0.0 0.5 0.2 0.5 0.0 0.8 0.0 0.0 0.1 0.9 IJ.2 0.7 o.~~ 0*1 0.1 l.D 0.2 0.7 O.l 0 .. 7 0.3 0.7 IJ. l 0.3 0.1 D.'3 0.2 0.6 0.2 0.6 0.1 O.EI 0.0 0.2 Cl. l Cl. 7 0.1 0.7 0 .. 2 1.2 0.1 0.8 0 .. 2 0.7 0 .. 2 0.7
0.1
0.7 2.2 LO 2.4 l. 4 2 .. 3 0.4 2.5 0.9 2.3 1. l. 2.4 1" 0 2. 2 1.0 2.4 0. 8 2.1 l. 1 2. 3 0. 7 2 .. 5 0 .. 7 1. 7 0. '3 2.8 0.9 2.4 LO 2.3 l. 4 2. 3 :I.. 1 2.5 0.3 2.0 0 .. 2 2.6 l. 0 2. 4 1.3 2.6 0 .. 0 2.3 0.1 2.2 Cl.El 1.0 0.9 0.4 0.4 Cl. 6 l. 1 0 .. 5 1.0 1. 1 1. 1
2 .. 2 2.4 2.4 ") " ..::.. ~·
1..8 3.0 2 ·o .J
2 .. 7 2.4
2.0 0.3 0.2 2.6
1. 0
1. 5 2. 7 1. 7 0.8 0.8 l. 6 1. 5 1. 8 1" 5 2.0 l. 6
3. 1 2.8 3.2 2.8 -, ") ·::i .. C::.
2.8 :::: • 1 2.8 ~2 .. 6
!.. 7 2. 5 2.2 2 .. 2 1 .. 5 3. 9 1. 7 2. 7 1" 9 2. 3 0.8 3 .. 3 1 .. 5 3 .. 3 1 .. 5 2. 7 0.0 3.5 1. 4 3. 3
1.7 3.2 l. 6 3. 2 0.6 2.9 1. ! 3. 4 1" 6 3. 2 1. 3 3. l 2.0 3.3 1"2 3. 1 2 .. 2 3. 1 1.9 3.5 2.2 3.0 2 .. 5 2.8 !. 5 3. 6 2.1 3.1 2.1 3.4 1 .. 3 3.9 1 H 3 3. 2 1. 4 2. 8 0.1 3.5 1.2 3.4
1.7 3.3 : 1.5 3.0 -0.2 3.5 :-0.1 3.5 0.9 2.E! : 1.0 2.9 3.0 1.6 1 H 7 2 .. 9 o. 7 3 .. 3 0.7 3 .. 3 1. 5 2. 6 !.El 2.'3 1.4 2.6 1.4 :3.2 1.6 2.9 1. 5 3. 3 l. 5 2. 7 O.CI 3.5
1. 6
2.5 1 .. 9 1.6 LO 1.0 1.6 1.9
3.2 3 .. 5 3.5 '" ., c>. ~
3 .. 2 1" 8 3. 1 1.. 1 3. 2 1. 7 2. 4 1. 2 3. 4 1.4 2.13 0.1 3.5
1.5
1" l 2. 8 1. 1 2. 8 0.3 2.7 1" 3 2 .. 8 1. 1 2. 8 0.9 2 .. 7 1. 3 2 .. 9 CL 9 2. 7 1.5 2.9 1~2 2 .. 8 2.1 2.7 1" 8 2 .. ? 0.8 3 .. 4 2.3 1.2 1.0 0.9 1.1
2 .. 7 2.7 3. 1 •:;) ";;' ~.'
2.8 o.~5 2 .. ? 0.9 2.8 1. 0 2.4 0.5 2.6 0.5 2.'3 2.8 1.9 1 .. 2 2 .. 8 1.3 ·o o
.:::.. 0
1. 3 2 .. 8 0.9 2.9 1.8 2.? 1. l 3. 1 0.72 .. ~7 1. 6 2 .. 5 0.8 2.7 1.1 2.B 0.5 2.?
LO
0. 3 0.2 0. [I Cl. 6 0.3
:-0.1 0.4 I). 1 0.4 0.3 1.2 0.7
:-0.6 : 1. 2 : 0. 6
...... ·::< ~" .J
2.3 --1 ., .:.. .. .::'.i
? ~· t- • .;J
? -:::i ·-· ~· ··::i ? ~--2.4 2.2 2 .. 5 ··;:i ...... "'-• ~?
2.4 :2.4 2.7 ') ~, .:;.. • .:i ., ~ (.::.ft .:s
:-0.6 ;~.4 0 .. 1 ;2.2 0.2 2.2 0.1 2.0 0. 1 ~2.3
0.0 2.0 0.0 2.0
:-0 .. 2 2.3 1.3 1.5 0.4 2.4 0.5 2.2 0.5 2.2 0.3 2.3 0.2 2.2 0.8 2.3
:-0.2 2.2 : 1.1 2.1 :-0.;2 2.2
0.2 2.2 0.1 2.0
0.2
0.8 1.6 0.6 1.2 0.7 1.8 0.6 1.2 0.3 1.4 0.3 0.8 0.9 1.8 0.9 1.1 0.7 1.8 0.7 1.2 0.5 1.7 0.2 1.2 0.8 1.8 O.EI 1.3 0.5 1.7 : 0.4 1.1 0.9 1.9 : 0.8 1.3 0.8 1.7 : 0.7 1.3 1.4 1.7: 1.3 1.1 0.9 1.7 : 0.9 1.2 D.7 2.1 : D.5 1.5 1.4 1 .. 7 : 1.3 1.0 1.2 1.6 : 1.1 1.2
:-o.4 1.5 :-D.3 1.0 0.5 1.8 : 0.4 1.2 0.7 1.6 : Cl.3 0.9 0.5 1.8 : D.6 1.1 0.6 1.9 : 0.5 1.2 0.5 1.7 : 0.4 1.2 0.4 1.8 : 0.6 1.2 0.4 1.6 : 0.5 0.9 1.5 1.3 :-0.1 0.9 0.7 1.8 0.6 1.2 0.5 1 .. 8 : 0.4 1.3 0.9 1.9 : 0.9 1.2 0.8 1.6 : 0.8 1.2 0.5 l.? :-0.2 0.9 1.0 1.7 : 0.8 1.0 0.4 1.6 : 0.3 1.1 1.4 2.0 : 0.9 1.3 0.3 1.7 : 0.3 1.2 0.7 1.6 : 0.3 0.9 0.5 1.8 : 0.6 1.1
0.7 0.6
0.8 0.9 o. 7 1. 1 CL 7 0.'3 0.8 o. '3 0.4 1. 0 0.6
0 7 . ' 1.0 D. 9 1. 2 0.9
1.0 1.3 0.9 1.0 1.1 0. 6 1.1 1.4 0.7 0.3 1.2 0. 7 1.2 0.8
:-o.3 o .. B 0 .. 6 0.9 0.7 0.8 0.7 0.7 0. 7 0 .. 9 0.4 0.9 O.? 0.8 O.B 0.8 D.3 0.6 O.Ell.l 0.5 0.9 D.9 O.EI 1 .. 1 0.:3 0.0 O.? 0.7 0.4 0 .. 5 0.8 o. 9 1. l 0.5 0.8 0 .. 7 0.8 0 .. 7 0.7
0- ~ . '
0.8 0.9 : 2.2 0.7 0 .. 9: 1.7 0.6 IJ.7 : 1.6 0.9 0.7 : 2.3 0.8 0.8 : 2.4 0.4 0.8 : 1.0 0.9 0.9 : 2.4 0.6 0.8 : 1.5 0.9 0.9 : 2.3 0 .. 8 1.0 : 2 .. 3 1.1 0.6 : 2.9 0.8 0 .. 9 : 2.G 0.9 0.'3 : 1.6 1.2 0.7 : 3.1 1.1 0.7 : 3.2
:-0.2 0.9 :-IJ .. 7 0.6 0 .. 8 : 1~5
0.7 0.8 : 2.0 0.7' 0.8 : 1.8 Cl.? 0.9 : 1.8 0.4 0.8 : 1.1 0 .. 7 0.8 : 1.8 0.8 0.8 : 2.2 0.5 0.6 : 1.5 0.7 0.9 : 2.0 0.5 D.8 : 1.2 0.9 0.8 : 2 .. 3 1.0 0 .. 8 : 2.B 0. J. 0. 9 o. 3 0.8 0 .. 5 2.2 0.5 0.8 1.4 Cl.El 0.9 2.4 0.5 0.8 1.2 0.7' 0.8 2.0 0.7 0.8 1.B
Cl.? 1 ,-, .o
2.5 2.6 2. IJ 2.2 2.5 2 .. 3 2 .. 7 2.4 2.8 2 .. 6 2.0 2 .. 7 3 .. 1 2.2 2.0 2.2 2 .. 5 2. 1 ·-1 .-,
"'. " 2 .. 5 2.3 2.4 ~ ~ .:::: •• ::i
1" 7 2 .. 6 2.5 2.4 ') ., ~- c:. 2.2 1. 6 ., ~
.::.. " .::::.
2.8 ., . ., "'. " 2. l ·o ~ "'. "'
"O )»
"' rr1
<!)

TABLE IV: CATEGORY RANKING BY SURFACE AREA & MINUS 11200 INCREASE
RANK- SIZE OF SURFACE AREA MINUS II 200 ING CATEGORY CATEGORY INCREASE INCREASE
---- ---------------------------- ----------- ------------ ------------1 A MIX-BATCH PLANT W/BAGHOUSE 46.0 3 .. 2 l. 1 2 A MIX-RECYCLED ORUM PLANT 22.0 3.1 1.2 3 A MIX-RECYCLED 31.0 2.9 1.1 4 BATCH PLANT W/BAGHOUSE 76.0 2.B 1.0 5 A MIX-ORUM PLANT W/BAGHOUSE 61.0 2.6 0.8 6 PLANTS WITH BAGHOUSE 250.0 2.4 0.8 7 TYPE A MIXES 152.0 2.4 0.9 8 TYPE B CLASS II MIXES 41.0 2.4 O.B 9 ALL RECYCLED MIXES 71.0 2.3 0.9
10 TYPE A MIX-ORUM PLANT 79.0 2.3 0.9 11 TYPE A MIX-BATCH PLANT 60.0 2 .. 3 O.B 12 RECYCLED MIX-ORUM PLANT 54.0 2 .. 3 0.9 13 BATCH PLANT MIXES 107.0 2.2 0.8 14 TYPE B MIX-BATCH PLANT/BAGHSE 30.0 2.2 0.8 15 REC~'CLEO MIX-BATCH PLANT 17.0 2 .. 2 0.8 16 TYPE B MIX-BATCH PLANT 42.0 2.0 0.7 17 ORUM PLANTS W/BAGHOUSE 159.0 2.0 0.7 18 TYPE B CL I MIX-BATCH PLANT 42.0 2.0 0.7 19 TYPE B RECYCLED MIXES 40.D 1 .. 8 0.7 20 TYPE B MIX-ORUM PLANT W/BAGHSE 99.0 1.8 0.7 21 TYPE B RECYCLED MIX-ORUM PLANT 32.0 1.8 0.7 22 TYPE B CL I RECYCLED MIX 40.0 1.8 0.7 23 ORUM PLANT MIXES 251.0 l. 7 0.7 24 CONTINUOUS PLANT MIXES 32 .. 0 1.6 0.6 25 TYPE A MIX-ORUM PLANT l~r·scRUB. 18.0 1.6 0.9 26 TYPE B MIXES 241.0 1.5 0.6 " ;r,.
27 TYPE B MIX-ORUM PLANT 171.0 1.5 0.6 G) rn
28 TYPE B MIX-BATCH PLANT W/SCRB. 12.0 1.5 0.5 29 TYPE B CL I MIXES 191.0 1.4 0.5 0
30 ORUM PLANTS W/SCRUBBER 90.0 1 .. 2 0.5 31 TYPE B CL I MIX-ORUM PLANTS 134.0 1 .. 2 0.5 32 TYPE B MIX-ORUM PLANT W/SCRUB. 72.0 1.1 0.4 33 PLANTS WITH SCRUBBER 138.0 1.0 0.4 34 BATCH PLANTS WITH SCRUBBER 26.0 0.3 0.1 35 TYPE A MIX-BATCH PLNAT W/SCRB. 14.0 -0.7 -0.2

PAGE 11
minus #200 material is shown because this portion of the gradation
has more effect on mix properties, particularly aggregate surface
area, than any other. As seen from the table, the minus #200 in
creases correlate closely with the surface area increases, with the
exception of "Type A Mix-Drum Plant with Scrubber", which had an
increase of 0.9% minus #200 but an increase of only 1.6 sq. ft./lb.
surface area.
From Table IV, Type A mix categories have consistently higher de
gradation than Type B mixes, as demonstrated by 7 of the top 12
categories having Type A Mix as one of the sorting criteria. Cor
respondingly, categories with B Mix as a sort criteria rank toward
the bottom of the list. The average increase in surface area for
all Type A Mixes (152) was 2.4 sq. ft./lb. while all Type B Mixes
(241) increased by only 1.5 sq. ft./lb.
All mixes produced by plants with baghouses (250) increased surface
area by 2.4 sq. ft./lb. and minus #200 by 0.8%. Mixes produced by
plants with scrubbers (138) were near the bottom of the rankings
with a surface area increase of 1.0 sq. ft./lb. and only a 0.4% in
crease in material passing the #200 sieve. Batch plant and drum
plant mixes had surface area increases of 2.2 and 1.7 sq. ft./lb.
respectively, and minus #200 increases of 0.8% and 0.7%. Recycled
mixes ranked ninth highest of all 35 categories with a 2.4 sq.
ft./lb. surface area increase.

PAGE 12
To examine the significance of the reported gradation changes, an
example is presented in Appendix C in which actual project, mix de
sign, cold feed, and extraction data is reproduced, and calcu
lations are performed to determine the effect of aggregate
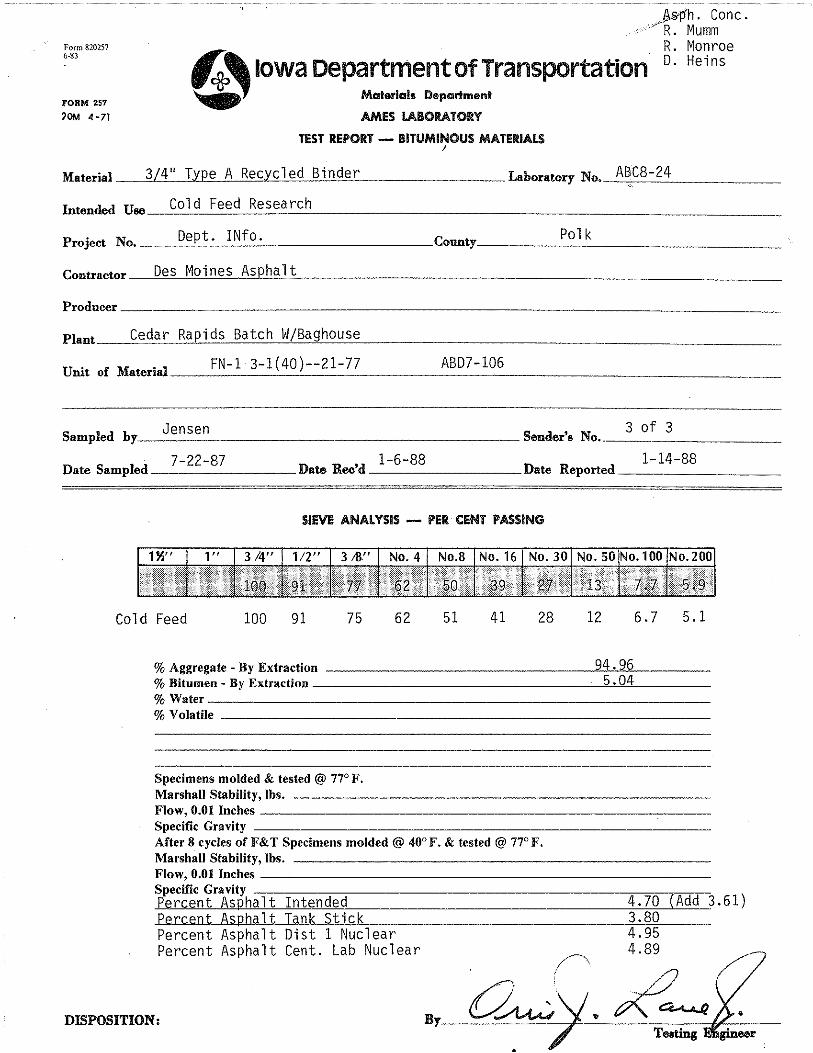
breakdown on film thickness and filler bitumen ratio. A sample
from Polk Co. FN-613-1(40)--21-77, 3/4" Type A Recycled Binder was
selected for illustration because its increases of 0.8% minus #200
and 1.84 sq. ft./lb. approximate the averages of 0.7% and 1.8 sq.
ft./lb. obtained for all 390 comparisons. As demonstrated by the
calculations, the effective asphalt content for this mix is 4.20%.
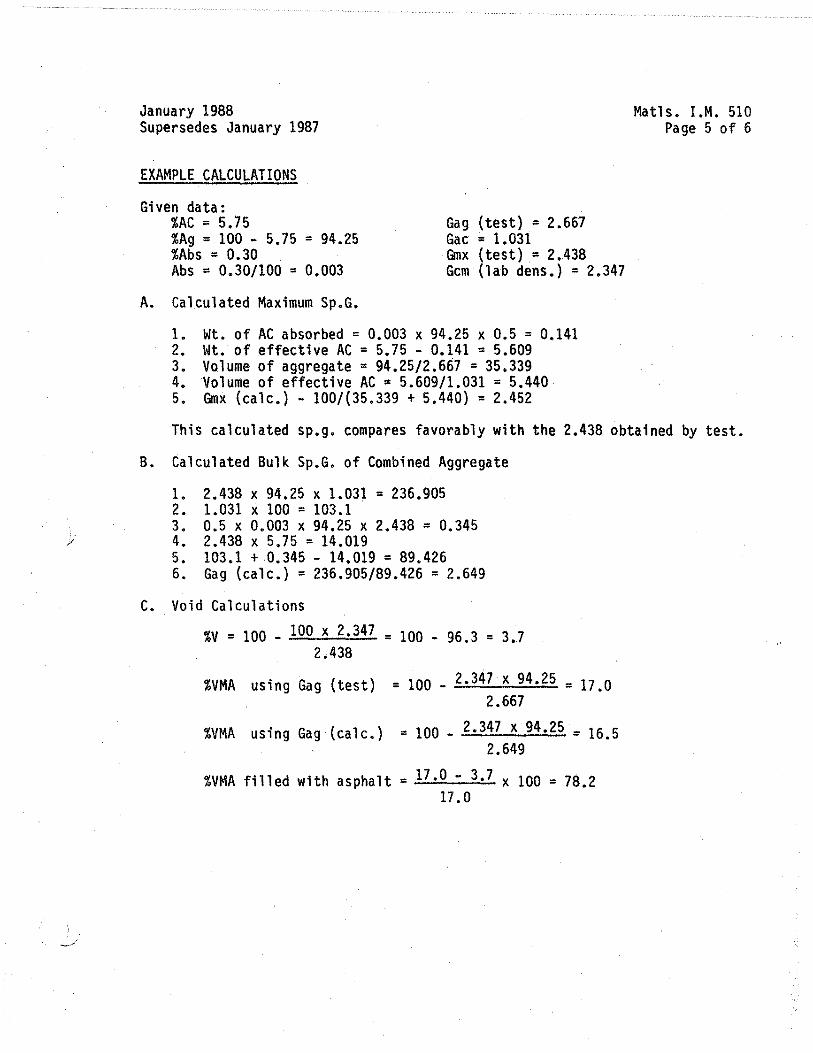
Calculations were performed according to I.M. 510, "Method of De
sign of Asphalt Concrete Mixes", found in Appendix B. This
produces a Bitumen Index of 0.001486 for the cold feed and 0.001395
for the extracted sample, which further results in film thicknesses
of 7.24 microns and 6.79 microns for the cold feed and extracted
sample respectively, representing a film thickness decrease of 0.45
microns due to aggregate degradation. Noting that the intended as
phalt content was unchanged on this project, the filler bitumen ra
tio can be expected to increase from 1.09 to 1.26 due to
degradation. Since the values in this example were close to the
averages for all samples in the study, changes in film thickness
and filler bitumen ratio will naturally become more extreme as ex
aminations are made of the categories exhibiting the greatest minus
#200 and surface area increase. Although the effect of degradation
on mix characteristics such as lab density and % voids in the min
eral aggregate (%VMA) cannot be directly calculated in an example
such as this, one would normally expect an increase in the minus

PAGE 13
#200 to contribute to a lower % VMA, higher lab density, and lower
% voids, as the fine particles fill in the voids. The degree to
which this occurs depends on the composition and specifications of
each individual job mix, and can be accurately determined only
through physically testing the material for these properties, an
exercise beyond the scope of this study.
A comparison is made in Table V of the data accumulated in 1986
versus the data representing this study. In general, the data from
this study demonstrates a greater amount of degradation than the
earlier study for the three categories shown. The 1987 reported
increase in minus #200, in particular, is approximately greater
than the 1986 increase by a factor of 2. A copy of the 1986 cold
feed vs extraction data used in Table V can be found in Appendix D.
When making this comparison, it should be noted that in the 1986
study, no particular effort was made to assure that samples for ex
traction also represented the cold feed sample. In the current
study, however, a direct effort was made to trace the cold feed ma
terial through the asphalt plant and laydown machine prior to re
trieving a box sample for extraction gradation analysis. Through
this procedure, gradation differences between cold feed and ex
traction can be primarily attributed to processing and handling,
and differences due to sampling error are minimized.

TABLE V:
SIEVE SIZE
3 ... "4 u
1 .... ·2 u
3,lB 0
# 4 # 8 # 16 # 30 # 50 # 100 # 200
ASPHALT MIX AGGREGATE OEGRAORTION OUE TO PROCESSING: COMPARISON OF 1986 ~1S. 1987 RESULTS
CHANGE IN PERCENT PASSING
ORUM/SCRUBBER ORLIM/BAGHOUSE BATCH PL. /BAGHOLISE
1986 1987 1986 1987 1986 1987
0 .. 3 0 ., -~ 0.,2 0.1 o.o 0.1
0.2 0.4 0.4 0.9 0.6 0.6 1 .. 3 0 .. 7 0.9 1 .. 7 1. 9 1.5 1.3 1.0 0 .. 7 1.6 1.8 1.6 0.4 1~3 -0.3 1 .. 2 0.9 0.9 0.1 0.5 0.0 0.4 -0.8 0~3
0.5 0.5 0.5 0 .. 7 0.6 0.8 0 .. 3 0.4 0.4 0.6 -0.l 0~8 0 ., . "' 0.5 0.4 0.8 0 .. 3 1. 1 0 .. 2 0.5 0.4 0.7 0.6 1.0
" )>
"' rrl
""
PAGE .15
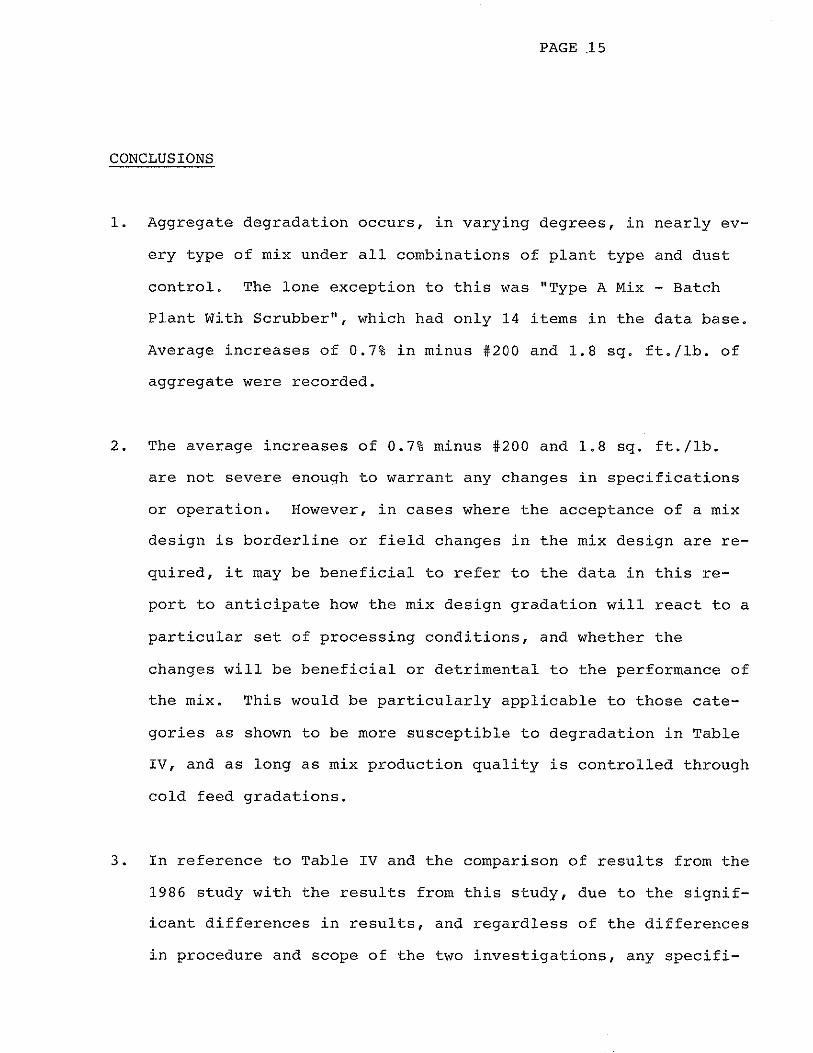
CONCLUSIONS
1. Aggregate degradation occurs, in varying degrees, in nearly ev
ery type of mix under all combinations of plant type and dust
control. The lone exception to this was "Type A Mix - Batch
Plant With Scrubber", which had only 14 items in the data base.
Average increases of 0.7% in minus #200 and 1.8 sq. ft./lb. of
aggregate were recorded.
2. The average increases of 0.7% minus #200 and 1.8 sq. ft./lb.
are not severe enough to warrant any changes in specifications
or operation. However, in cases where the acceptance of a mix
design is borderline or field changes in the mix design are re
quired, it may be beneficial to refer to the data in this re
port to anticipate how the mix design gradation will react to a
particular set of processing conditions, and whether the
changes will be beneficial or detrimental to the performance of
the mix. This would be particularly applicable to those cate
gories as shown to be more susceptible to degradation in Table
IV, and as long as mix production quality is controlled through
cold feed gradations.
3. In reference to Table IV and the comparison of results from the
1986 study with the results from this study, due to the signif
icant differences in results, and regardless of the differences
in procedure and scope of the two investigations, any specifi-

PAGE 16
cation changes in gradation limits or filler bitumen ratios
based on the 1986 study should be reviewed to determine if they
are valid, and it should be considered if further changes are
now warranted in light of the data presented in this report.

PAGE 17
Appendix A Example of Lotus Database Format Used

rn d 9
Appendix A Example of Lotus Database; Format Used
;t. ~ ~ :: &l b'l ..; N ,,.; ..; r-'. vi
t;Ji$~*~Ji 25~~;-z~;;i;
re~~~~& rn~~*g*
Ntn\tH\•<'-N -..io:iviWviW
-:~-:~":": "';;m::;m~
mmmmmm mmmmmm
. . ' . . "' - - ..- 0 ' ' ~~~~~~~~~~ if:::;)~~~if::N~t!ll'S
(!) M O o::> o d 9 d ...: d
U'l"10">'1i<ll'1)(')-fll<II ..,,; ...; ,,j in,,.;,,;,,.; vi,,;.,;
MNto"l-"1-..-NOf'.l'-..,j,_:,.i..,),,j.,j.;,,O_,j..D
mmmmmmmmmm
8R~r.;.¢s
gj\B~ri~~ " ro o ..: d d
.,-"'"'"U?M m .. ~ m..;,,.;..;
m<1>4')Vt</M ..; ,,; ..; ,,.; .; vi
::::~::::::::::::
0 0 0
d d ...:
mmml)'.)rom
ff>llll~ ~ ;4g;i~
~~~9> 999? gggg
~~~§ ':'71':' ¥'~f~ e;e;~e;
~~~; ~~i~
\flR)Jl~
Xlfi~~
" ' ..: N
rn d N
0 0
J'.0-['.['..
'f'(f"l''f ~· -,,,..,., 9999 333.S
§~~@ ~':,'7'}' rJ&&& '1'' e:e;~e:
~~~~
~~~~
$~~SR:::
re~~g~~ " 0 • d d d
d ci d
\llO-NV>N ,..,:w,..:mr-:m
0 0 0
d ...: ..:
0 0 0
N N d
0 0 0
N d c;i
0 0 0
,,.; ..: d
0 0 0
' ...: d
~;;'~1?l3~
xi~i-'i~;i~
""""11),...0'<t
,,;...;.;.,;"'.,;
WO'lllN-111 ..,;..:,,.;.,:..,;,._:
0 0
d d d
0 0 0
1 d ci
0 0 0
i d -;
i ,,; i
0 0 0
i ,n ...:
reffi~~iila;
~re~l!l~~ ro rn • d d d
0\(1)_,.._\I)
..; vi in,,;,,.:,,.:
0
d d d
0'.J)"1'tl'lWID
...;..,;.,o,,;;.;i:;m
0 0 0
d ..: d
0 0 0
7 N ,,.;
- d ,,.;
0 0 0
d d d
'° '° ""'"" "' ,!..~f.,!..,!..l
$&~&&&
~'f.:8~$$ ~retBg~,,;
ro • • d ..: ..:
"'"""--"" ..; ,,) .; .,; vi..,;
NOOVl\O<'l w..:..,;r-:...;m
0 0
ci N N
0 C! 0
d "' ..:
d d d
8l!2fs'l%~\G \rj~~};j;i~
9 9 d
1\1.-\1)-('.0
,,;,,;,,;,,;..;,n
. 9 9 ci
"-"'"l\f)<TI ,,;,,;,,;.,.:,,;,,;
d ..: N
lll w, (#; w, Yi\~
~ ~ J
0 0 0
d d 7
0
0 d ci
9>9>9~99> ('J)(l)(1'l1'QO
;;;;77 igg;,pg~!fl~
<llO 0,..,11'1,...V'V ..;,.:. tfi,,).,;.,;..,,,,.;
,;
0 0 0
M 7 ..;
0 0 0
N i N
d d d

rz:~l!l;:;lfog
iiii~~~~ -
0 N
N
N
N
'"'.<'!"!"!"'.'"'. "'"""'"""'!)')
N
• N
N
N
"1
\00
N-1
0
.,,;m...:.,;o.:.,;
0 0
0 N
,,j
,.,,;
!!! ,t,t,t
~~~
!'.!;(€(5;::
~ro~g
..: N
~~t;::g,g~
~~~~~~
"'"""'"""'" ..;,,.;..;,,.;,..;..;
m.;-<
:f<N
r ... m
,,.;..,.;,;.,,;..;!fi
o m
ro
7 ci
ci
\ll\llNIO
N!\l
NN
NN
NN
0 0
0 ni
..: ..:
' '
mg~lR~lil
Ri?iR\~~~
-m
d
? d
m-N
-<
l'N
wr-:.,,;..,.;m,,,;
9'f9
~~~
*:g&;:-.g~re
IBxLii:lzjffi
..: ,..;
..:
":~~r;";°l W~\OO"Il<n
WO
ON
ID ...
... "'"
' "1
"' ...
~~;ti~~~
0(\H
J)\()0
-
,,.;,,.;..;,,.;..;,,.;
ITT m
N
ci ..:
-lll\0
0\1
\ht
..,;..,.;in..,;,,.;,,,;
%%%%!! 'i''i'?
?9
?
!?;&;gJgl~0
§~~§~§
__ ....... _ .... $$$$$$ itititit~E "'""o"'
"""" ... "' ~~reg
N
ro ci
d
t50'illlSl~~ 0.~:4~~~
ci ...:
ci
N
ITT
d ..:
d
o«
J1
'-om
ro
,,;,,,;,,.;,.,:.,;,,.;
==~===
0 0
d ~i
i
0 ,.,,; ci
7 0
ci d
d
.................... 'f '1' '}' 9 '}' 9 ::!::!::::!! ~~~~~~
~~::!Rl{l;::<,;
~~~i;tg
..: ci
...:
mm
mr-..-o
,;,..;..;..;..;.,;,
0-..0
0\U
lO\
,,.;.,;,,.;,,.;t00.: 0
-0
N
~~~SSS $~~$$$ a: c:: a: re if if
~g'l::fi~~~ ~gjt<lfj~gj ro
ci ...:
d
" •
ro d
..: d
C\()..,.0
\0'1
"
,..:,.,:,;,m.,;r-.:
0 0
ci N
...:
N
N
N
0 0
0
-; d
d
""~"~"
es~eee 'f 'f"'f 1
1"'f
'f 'f 'f 'f 'f 'f if if t:: E
it if
;i;)lli-ef:jO\~
hi1ii~l4~~
m
N
N
...: 9
ci
r-..oo
mm
.,;m
,,.;,,;,,.;<J)
ci ci
d
0 0
0
ci -
7
0 0
0
N
' r,"
0 0
..: N
,,;
' '
~~f~tp~ ~77799 &; 1:; 8 &; g: t!l
~~~~~~ ffffff (!'.if'.if'.if'.G:if
\f!~j!;;;J9;ll
~iiiii~IB~ N
<
<
d
..: ..:
'°m
'°N
'1"0
..;..;..;,,;..;...,.;
m
ci N
N
\l)(l\{'l') ... 0
-,..:,..:,..:(1'ii(o\
0 0
..; ,,.;
,..;
0 0
0
10 N
d
::!\fl~ig~g
~~~~reiil ro
N
0
ci d
d
tf/00"•\0[~[ ...
WW
..0,..: ..0,..:
N
N
-
' '
0 0
0 .,:;
d d
0 0
0
J, 7
ci
0 0
d d
d
~~~~~~ ''''''
f~~~~~ ififitif:G
:ff:

COLO FEED VS. EXTt<ACT;:'.O GRAOAT!ON STUDY - i98? BATCH PLANTS IHTH BAGHOUSE --------------------------------------------------------------------------------------·--------------------------------------·---------------------------------------------------------------------------------------------------------------HIX : PROJECT- CONTRACTOR ; MATERIAL TYPE'. : PLfiNT DUST SAMPLE : GAAOATION SIEVE Sf8.!E SlE\/E SlEl.!E i SIEVE : SIEVE ; S!EV£ : SIEVE .' SIEVE ,' SIEVE : SURF'.
OESIGN NO.: NUttBER :SIZE :TYPE :Cl : R : TYPE : CONTRL : DATE : SAMPLE :11 3/4 OffF. ;# 1/2 Offf. :11 3/8 O!Ff'.: 11 4 OIFF.: II 0 OiFF. :11 16 O!Ff'. :# 30 OIFF. :#SO OrFF. :11 100 O!FF. !# 200 Otr:F.: AREA OJFF.;
""'""""'""''"""'"'""'""'""'"'="""'"'"'"""""'""""="'"'"""'""""'"""""""""''"'"""""""'"""""""'""""""'"'"''""""""'""'"""""""""'""'"""""""""""'"'"'="===="""""'""""""'"'"""""""'"="""""""'"""""'"'::""""""""'"""""'"'"''"""""'""""'''"""""""""'""""""""":::""'"'"""""""""""'""°'""'""""""""'"'""""""""""""""""""""'"""'""""'""""' t807-9 Fl1-94(ll) FT. OOOGE ASPHALT 3/4 8 l BATCH 8AGHOUSE 09-22-87 COLOFEED 100 92 81 61 48 37 25 14 B.6 6.3 31.04 !807--9 Ftt-94(1D FT. OOOGE ASPHALT 3/4 B ! BATCH BRGHOUSE 09-22-87 E:XTRRCT!CN JOO O.O 92 0.0 SO -1.0 61 0.0 47 -LO 35 -2.0 25 0.0 13 -LO 8.7 0.1 6.6 0.3 3LOO 0.04 1B07-9 Ftt-94\11) FT. OOOGE ASPHALT 3/4 8 I BATCH 8RGHOUSE 09-24-87 CCLOFEEO JOO 92 77 60 47 37 24 12 6.S 4.7 26.42 1807-9 FH-94(UJ FT. OOOGE ASPHALT 3/4 8 t $flTCH SRGHOUSE 09-24-67 ~XTRACHON 100 Q.O 91 -\.0 77 Q.O 59 -!.O -IS -2-0 34 -S-0 24 Q.O ;2 Q.O 7.9 1.4 6.0 l.3 ;19.00 2.SS lBOi-9 FH-94<ll) FT. OOOGE ASPHALT 3/4 8 I BATCH BAGtlOUSE 09-25-87 COLOFEEO 99 92 SO 61 48 38 25 12 7.5 S.4 2$.42 1807-9 FM-94<!1) FT. OOOGE ASPHALT 3/4 8 ! BATCH 8AGHOUSE 09-25-87 €XTRRCTlCN 100 1.0 95 3.0 79 -1.0 59 -2.0 46 -2.0 35 -3.0 24 -LO 12 0.0 8.2 0.7 6.3 0.9 29.70 t.36 1807-9 Ft1-94{l 1) FT. OOOGE FESPHALT 3/4 a I 8ATCH 8AGHOUSE 09-29-87 CCLOFEEO 100 92 Bl 64 51 40 26 12 6. a 5. 0 27. 84 !807-9 FM-94<l1J FT. GOOGE ASP!-!RLT 3/4 8 t 8ATCH SRGHtlUSE 09-29-87 EXTRf!CHON 100 O.O 90 -2.0 81 0.0 64 0.0 50 -LO 37 -3.0 25 -1.0 12 0.0 7.6 0.8 5.9 0.9 29.34 !.SO !807-9 FM-94(11} FT. OOOGE !1SPHRLT 3/4 B I BATCH BAGHOUSE 10-01-87 COLOFEEO 100 93 80 65 51 39 26 11 6.4 4.6 26.60 1807-9 FM-94(11) FT. OOOGE ASPHALT 3/4 8 l BATCH SAGHOllSE 10-01-67 EXTRACTION 100 0.0 93 0.0 64 4.0 67 2.0 S2 t.0 39 0.0 27 LO 13 2.0 9.3 1.9 6.3 1.7 31.20 4.68
NO. OF SAMPLES $1.0 81.C Bl.0 $1.0 82.0 76.C 81.0 76.0 76.0 8LO 76.0 RVG. OIFF. 0.11 0.63 i.46 l.60 0.88 0.29 0.83 0.84 l.06 0.98 2.78 STO. OEV. 0.8 2.3 2.6 :3.2 2.8 2.3 1.6 l.2 0.8 0.8 2.2
~ _/

PAGE 21
Appendix B Materials Instructional Memorandum 510 and 511

~-..1owa Department of Transportation ~"9 APPENDIX B
January 1988 Supersedes January 1987
Highway Division Matl s. I.M. 510 Page 1 of 6
OFFICE OF MATERIALS-INSTRUCTIONAL MEMORANDUM
METHOD OF DESIGN OF ASPHALTIC CONCRETE MIXES
GENERAL
The design of asphaltic concrete mixes involves determining an economical blend of aggregates that provides a combined .gradation within the limits of the specifications and a determination of the percent asphalt to mix with the aggregate blend. Trial mixes prepared with different asphalt contents are tested for mix properties and the results analyzed to select the asphalt content that is judged to be most satisfactory for the intended use of the mix.
RAW MATERIALS
The aggregate sources, proposed aggregate blend proportions, and the source of asphalt are selected by the contractor. This information is submitted to the District Materials Engineer on Form 955 for approval. Material source approval, gradations, crushed particle amount and type, asphalt grade, and other specific requirements are checked prior to submitting materials and Form 955 to the laboratory.
TRIAL MIXES
A. Preparation of Aggregates
Aggregates must be air dried to a surface dried condition prior to further preparation. The individual aggregates are combined in the proportions proposed on the Form 955 in accordance with Test Method Iowa 504. About 100 lbs. of this combined aggregate is required for the design work. 130 ~(--lbs. of this combined aggregate is required if the asphalt nuclear gauge is to be calibrated to the mix.
B. Asphalt Cement
The asphalt cement used for trial mixes shall be of the same grade as indicated on the Form 955 and shall also be from the same source when possible.
c. Selecting Trial Asphalt Contents
Three trial mixes of different asphalt contents are made to assure close bracketing of the final recommended design asphalt content. Two trial mixes may be adequate for this purpose if recent results have been obtained with aggregate of the same or slightly adjusted composition.

Matl s. I.M. 510 Page 2 of 6
January 1988 Supersedes January 1987 ......... .,
The trial mix asphalt contents are best guess estimations that are one ;:! percent apart. They may be based on past experience, analysis of the aggregate gradation, calculated surface area of the aggregate, or trial and error.
The gradation plotted on the 0.45 power gradation chart indicates the void space available for asphalt. Gradations that closely follow the maximum density line indicate low void space~
The surface area of the aggregate is related to the film thickness of asphalt obtained by a given asphalt content. A higher surface area will almost always require a higher asphalt content.
D. Mix Preparation
Preparation of trial mixes is in accordance with Test Method Iowa 504.
E. Nuclear Calibration
The asphalt nuclear gauge is calibrated to the mix in accordance with I.M. 335.
TESTING RAW MATERIALS
Test procedures for the asphalt and combined aggregate are as follows:
Test Specific Gravity of Asphalt* Bulk Sp.G. of Combined Aggregate Water Absorption of Combined Aggregate
Cent. Lab Test No. 617 203 203
J.M. No. 369
308**
*The sp.g. of the asphalt may be obtained from certifying documents or a lab test report. **Procedure "C"
TESTING TRIAL MIXES
Test procedures for A.C. mixes are as follows:
Maximum Specific Gravity* Compacting Marshall Specimens Density of Compacted Mixes (Lab Density) Marshall Stability and Flow
Cent. Lab Test No. 507 502 503 506
J.M. No. 340 or 363
325 321
*The Rice sp.g. procedure, Test Method Iowa 507 or J.M. 340, is the referee method. The high pressure air meter procedure, I.M. 363, should only be used if results have previously been shown to correlate with Rice results.) (
(
(

January 1988 Supersedes January 1987
Matls. I.M. 510 Page 3 of 6
Four Marshall specimens are made from each trial. mix. An extra specimen of the first mix compacted is usually made to determine the amount of mix necessary to produce the proper specimen thickness. The four specimens of each A.C. content are checked for lab density and on the following day (after the required cooling period) the three specimens with the closest densities are tested for stability and flow.
If a District Lab is not equipped for Marshall Stability, the selected three specimens are shipped to the Central Lab for testing. The specimens must be fully identified and packaged to prevent damage.
DESIGN CALCULATIONS
A. Calculation Basis and Nomenclature
The derivation of the formulas used for calculations is based on an assumed 100 grams of mix so that mix percentages are numerically equal to weights. Following is a list of nomenclature symbols used and their definitions:
%AC = % of asphalt cement in the trial mix %Ag = % of combined aggregate in the trial mix = 100 - %AC %Abs = % water absorption of the combined aggregate Abs = fraction of water absorption of the combined aggregate =
%Abs/100. This quantity is always used in the calculations rather than %Abs. ·
Gag = bulk specific gravity of the combined aggregate. This quantity may be by test or by calculation.
Gae = specific gravity of the asphalt Gmx = maximum specific gravity of trial mix by test. This quantity
may be referred to as the solid sp.g. or solid density. A calculated max. sp.g. should be designated as Gmx (calc.).
Gem = density of compacted mix or lab density %V = calculated % air voids in the compacted mix %VMA = calculated % voids in the mineral aggregate
B. Calculated Maximum Specific Gravity
A theoretical maximum specific gravity may be calculated when the bulk sp.g. and water absorption of the aggregate is known. This calculated maximum specific gravity is used to check the results determined by test and is not intended for calculating other design quantities. A Rice specific gravity should not be considered suspect unless the calculated specific gravity differs by more than 0.030. Calculate the maximum sp.g. using the following steps and report the results to three decimal places.
1. Wt. of AC absorbed = 0.5 x Abs x %Ag 2. Wt. of effective AC =%AC - line 1 3. Volume of Aggregate = %Ag/Gag
· 4. Volume of effective AC = line 2/Gac 5. Gmx (calc.) = 100/(line 3 +line 4)

January 19.88 Matl s. I .M. 510 Page 4 of 6 Supersedes January 1987 .~
C. Calculated Bulk Specific Gravity of the Combined Aggregate
The bulk sp.g, .of the qimbined 11,ggreg11te (Gag) may be calculated from the maximum specific gravity of the mix determined by test. It is calculated '(lith the follqwing line steps arid repqrted to three decimal places:
1. (lmx x %Ag x Gae 2. Gae x 100 3. 0.5 x Abs x %Ag x Gmx 4, Gmx x %AC 5. line 2 + line 3 - line 4 6. Gag (calc.) = line l/line 5
D. Void Calculations
Quantities used to calculate vpid re5µlts sh.all be determined by test except Gag(calc;.) may be used to calc;µlaj;e %VMA, The following formulas are used to calculate the indic;ated quantities that are reported to one decimal pl11ce. · · .
%V, air voids in the compacted llii x = loo ~ lO~m~ Gem
%VMA, voids in the aggregate "' ioo ~ Gem x %Ag . . G ag
%VMA fi 11 ed with asoha 1 t = .%VMA .~ %V x 100 . . . %VMI\
E. Filler/Bitumen .Ratio
Calculate the ratio as follows and rep()rt j;o tWO <!ecimal places:
Filler/!litumen Ratip "'%Passinl.#200 . . %AC
' '
F. Asphalt Film Thickness
Calculations of asphalt film thickness are described in I.M. 511. It is reported to two decimal pl<1ces, ·· ·
(
(
/
January 1988 Supersedes January 1987
EXAMPLE CALCULATIONS
Given data: %AC = 5.75 %Ag = 100 - 5.75 = 94.25 %Abs = 0.30 Abs = 0.30/100 = 0.003
A. Calculated Maximum Sp.G.
Gag (test) = 2.667 Gae = 1.031 Gmx (test) = 2.438 Gem (lab dens.) = 2.347
1. Wt. of AC absorbed = 0.003 x 94.25 x 0.5 = 0.141 2. Wt. of effective AC= 5.75 - 0.141 = 5.609 3. Volume of aggregate = 94.25/2.667 = 35.339 4. Volume of effective AC = 5.609/1.031 = 5.440 5. Gmx (calc.) - 100/(35.339 + 5.440) = 2.452
Matls. I.M. 510 Page 5 of 6
This calculated sp.g. compares favorably with the 2.438 obtained by test.
B. Calculated Bulk Sp.G. of Combined Aggregate
1. 2.438 x 94.25 x 1.031 = 236.905 2. 1.031 x 100 = 103.1 . 3. 0.5 x 0.003 x 94.25 x 2.438 = 0.345 4. 2.438 x 5.75 = 14.019 5. 103.1 + 0.345 - 14.019 = 89.426 6. Gag (calc.) = 236.905/89.426 = 2.649
C. Void Calculations
%V = 100 - lOO x 2·347 = 100 - 96.3 = 3.7 2.438
%VMA using Gag (test) = 100 - 2•347 x 94. 25 = 17.0 2.667
%VMA using Gag (calc.) = 100 - 2.347 x 94.25 = 16.5 2.649
%VMA filled with asphalt= 17 •0 - 3•7 x 100 = 78.2 17. 0

Matl s. I.M. 510 Page 6 of 6
EVALUATING RESULTS
January 1988 Supersedes January 1987
The test data and calculated results are compared to the criteria given in the appropriate table shown in I.M. 511 corresponding to the type and use of the mix. An asphalt content is selected that will produce a percent air voids in the compacted mix that is near or slightly above the minimum void values in Table F of I.M. 511 for the course and traffic count involved with the intended use of. the miX. Interpolation may be necessary.
REPORTING RESULTS
The test and calculated results along with the % asphalt recommended to start the project is reported on Form 820956. Distribution of the report:
District Engineer Resident or County Engineer Bituminous Engineer (R. Monroe) Asphalt Construction Engineer (J. Smythe) Asphalt Mix Engineer (D. Heins) Contractor Bituminous Lab (W. Oppedal) Asphalt Mix Design file
(
( \

f;,"1A.1owa Department of Transportation ,.,.., APPENDIX B
January 19B8 Highway Division Matls. I.M. 511 Supersedes January 1987 · Page 1 of 10
OFFICE Of MATERIALS-INSTRUCTIONAL MEMORANDUM
CONTROL OF ASPHALTIC CONCRETE MIXTURES
A. Genera 1 The job mix formulas are established on the basis of the results of tests performed on samples obtained during the initial stages of material production. Since these samples may not be truly representative of the material produced, and since materials do change with time and through handling, the plant produced mixtures may not develop test characteristics that meet design criteria. Therefore, each mixture shall be reevaluated after paving operations have begun. Because material and mixture characteristics may change at any time, they must be monitored continuously throughout the course of the work. The reevaluation procedures outlined herein are to be carefully followed so that all mix characteristics will conform with the appropriate requirements contained in tables A, B, C, D, E and F.
B. Job Mix Formula Definition The specifications define the job mix formula as the percentage passing each specified sieve (target gradation), and the percentage of each material including asphalt, (aggregate and asphalt proportions). The original job mix formula and subsequent adjustments are set after consultati.on with the contractor on the basis of gradation, stability, skid resistance, film thickness, asphalt and void analysis. Design criteria for setting the original formula and subsequent adjustments are provided by the attached tables for the various mix types and service requirements.
C Sampling and Testing The initial plant calibrations will, in virtually all cases, be based on the formula established by the Central Laboratory. Samples of the combined aggregate and plant produced mixture should be obtained and analyzed as soon as the operations of the plant stabilize. The first samples can normally be obtained after the plant has operated an hour or so. Sampling and testing should be performed promptly so that production and proportion changes, if required, can be effected before large quantities of mix are produced. If adjustments are made in the proportions, the entire procedure must be repeated.
Laboratory density per I.M. 325 shall be furnished to each project as set out in the sampling and testing guides contained in I.M. 204.
For interstate and high traffic urban projects the 75 blow Marshall density values are to be used for density-void control as outlined in this Instructional Memorandum and for determining the density of compacted pavements as required by the specifications (high traffic urban situations shall be those exceeding 10,000 vehicles per day).
The 50 blow Marshall val.ues shall be used for all other projects. Sand Mix Surface Courses. (Pen. or Vise. Graded Binder, and Emulsion Residue Binder). Density-void control is to be based on the special one (1) inch Marshall specimens compacted with 75 blows on one (1) specimen face.

Matl s. I.M. 511 Page 2 of 10
D. Job Mix Formula Chan~
1. Changes in Mix Characteristics.
January 1988 Supersedes January 1987
As soon as the test data are available they should be compared with ranges of values found in the attached tables and with the original job mix data. In the event that the plant produced mixtures do not exhibit test characteristics which fall within the ranges found in the tables, the District Materials Engineer will order appropriate changes in the Job Mix Formula.
The District_Materlals Engineer may order changes even though the test results are within the ra~L_given~viding that the quality of the mix w"i11 be improv_ed with respect to dura~ity or friction .eI.Qperties.
When changes are ordered for the foregoing reasons, the magnitude of the changes are to be limited such that adjusted mixtures will continue to exh·ibit test characteristics which fall within the ranges found in the tables. In each case, the properties of the aggregate and asphalt, projected traffic loadings and volumes, layer thickness, and service conditions shall be taken into account.
The tables contain two sets of design void ranges, one based on the Job Mix calculated solid specific gravity, and one based on the measured solid specific gravity using the procedure outlines in I.M. 340. Since the latter procedure utilizes tests on the actual plant mix rather than tests on preliminary aggregate samples, adjustments can be made on a rational basis. This approach should also be utilized when changes are noted in aggregate characteristics resulting from production adjustments or variation.
Each days percent of road density is determined daily comparing the densities of the road cores to the laboratory density of the first uncompacted mix bo)( sample taken for the day's production from which the cores were taken.
Variations in compacted laboratory density and/or measured solid specific gravity of more than 0.020 shall be investigated promptly since these tests reflect changes in asphalt content, and aggregate properties and gradation. In some cases variations may be attributed to segregation, thoroughness of mixing, sampling procedure, and changes in aggregate production.
( \
~.
( '
If the density var-iation for a given mix proportion exceeds + 0.020 t: ... from the average of the previous day's tests without apparent reason, the investigation shall include the testing of the back up samples for that particular day's run. The average density of all samples tested for that day shall be us€d in determining roadway density ( compliance. If no backup sample is available, the density 1
determination shall be averaged with the density of the previous day's run to determine density compliance.

\
January 1988 Supersedes January 1987
Mat ls. I.M. 511 Page 3 of 10
If the second day's density variation for any particular mix exceeds ± 0.020 from the first day's test without apparent reason, then the backup samples shall be tested for the first day also, and averaged for each day.
2. Proportion Changes
The contractor must occasionally adjust aggregate proportions in order to consistently comply with the job mix formula target gradation tolerances and to correct for calibration errors. Proportion changes of 10 percent or less, for each material, may be approved without delaying operations for qualifying tests. Adjustments or interchanges exceeding 10 percent shall be evaluated before they are approved. Changes will be subject to the crushed particle and sand limitations, and mix design criteria.
3. Aggregate Changes
(a) The addition of new materials to job mix formula may be approved without central laboratory tests providing the materials are produced from geologically comparable sources, do not constitute more than 15 percent of the aggregate, meet quality requirements, and produce mixes that meet design criteria and specifications.
(b) When aggregates are introduced from sources that are not geologically comparable or otherwise differ significantly, complete laboratory testing is required.
4. Target Gradation Changes
Unusual aggregate gradation variation or degradation may cause the contractor to request that a new job mix formula target gradation be set using materials already on hand. Target gradation changes shall not be considered or approved until options under 2 and 3 above have been evaluated.
Resetting the target may also involve proportion interchanges and the introduction of a new aggregate. New target gradations together with proportion changes may be approved for future production when all design criteria and specifications limitations can be satisfied. Except for stability and A.C. film thickness, mixture characteristics can be predicted from tests on previous production; changes that may adversely affect stability should not be approved without central laboratory consultation. Compliance with film thickness criteria shall be determined by the following procedure:
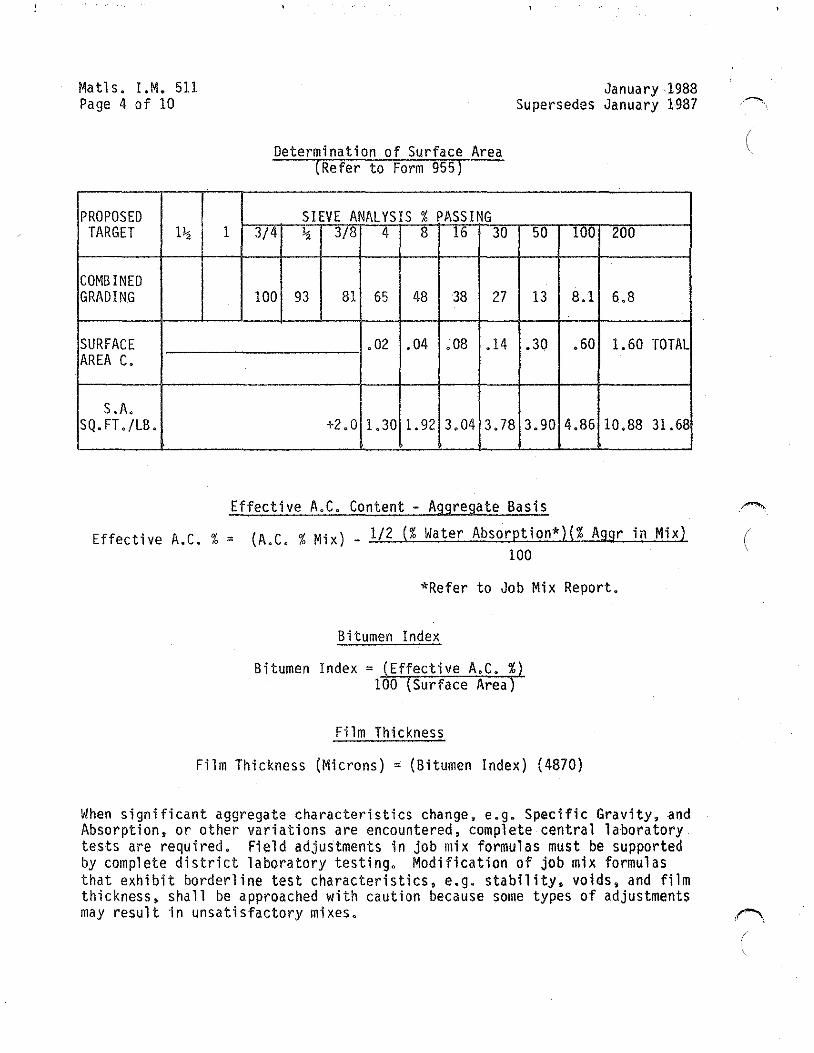
Matl s. I.M. 511 Page 4 of 10
PROPOSED TARGET l~
COMBINED GRADING
SURFACE AREA C.
S.A. SQ. FT./LB.
1
Determination of Surface Area (Refer to Form 955)
SIEVE ANALYSIS % PASSING 3/4 l:i 3/8 4 8 16 30
100 93 81 65 48 38 27
.02 .04 .08 .14
+2.0 1.30 1. 92 3.04 3.78
January 1988 Supersedes January 1987
50 100 200
13 8.1 6.8
.30 .60 1.60 TOTAL
3.90 4.86 10.88 31.68
(
Effective A.C. Content - Aggregate Basis ,.-.,,
Effective A.C. % = (A.C. % Mix) _ 1/2 (%Water Absorption*}(% Aggr in Mix) ( 100
*Refer to Job Mix Report.
Bitumen Index
Bitumen Index = Effective A.C. % 100 Surface Area
Film Thickness
Film Thickness (Microns) = (Bitumen Index) (4870)
When significant aggregate characteristics change, e.g. Specific Gravity, and Absorption, or other variations are encountered, complete central laboratory tests are required. Field adjustments in job mix formulas must be supported by complete district laboratory testing. Modification of job mix formulas that exhibit borderline test characteristics, e.g. stability, voids, and film thickness, shall be approached with caution because some types of adjustments may result in unsatisfactory mixes. ,r--.,
(

\. /
,,
January 1988 Mat1s. I .M. 511 Supersedes January 1987 Page 5 of 10
TYPE A ASPHALTIC CONCRETE LEVELING, BINDER, AND SURFACE COURSES
TABLE A
Test Value Guides for Plant Produced Mixtures Mix Size l"Mix 3/4" Mix 1/2" Mix 3/8" Mix
Mix Compacted in Laboratory Average Values %Lab Air Voids (Min)
(Max) 6 (1) (2) (Calculated) Per I .M. 510
ILab Air Voids (Min} (Max) 6
(1) (2) (Rice) Per I.M. 510
%Voids in Mineral Aggr.(50 blow) 14 VMA (Min) (1) (75 blow) 13
A.C. Film Thickness 7.0M (Min) (3)
A.C. Film Thickness 6.5M (Min) (4)
Marshall Stability (lbs. ) 1750 (Min)
Filler/Bitumen (5) Ratio (Max) Cold feed 1.20
Extraction (7) 1.30 Mix Compacted
See Table 6
See Table 6
14.5 13.5
7.0M
6.5M
1750
1.20 1.30
on Roadway
F
F
6
6
15 14
7 .OM
6.5M
1750
1.20 1.30
As Specified
6
6
15.5 14.5
7.0M
6.5M
1750
1.20 1.30
%Lab Density (Min) %Voids (Min-Max) (1) (2) avg. (6)
4-8 4-8 4-8 4-8
(1) Except when otherwise specified, mix proportions should be adjusted to exhibit test values in the ranges given. When conflicts develop, void criteria based on Rice Procedure shall govern (50 blow and 75 blow marshall mix design).
(2) Extreme caution should be exercised when mixtures exhibited average values near the lower limits and ADT exceeds 3000 VPD. (See Table F)
(3) Applies to wearing courses only, refer to job mix report for data. M=Microns)
(4) Applies to binder courses only, refer to job mix report for data. (M=Microns)
(5) Filler bitumen is the ratio of material passing the 200 mesh screen divided by percent of asphalt in the mix.
(6) Target lab voids prevail. Density may have to be increased to be within maximum field voids. General Specifications 2303~14 and Table "G. 11 If conflicts develop between lab and field voids, see Table F.
(7) Only on projects where F/B is based on extractions.·
Matl s. I.M. 511 Page 6 of 10
January 1988 Supersedes January 1987
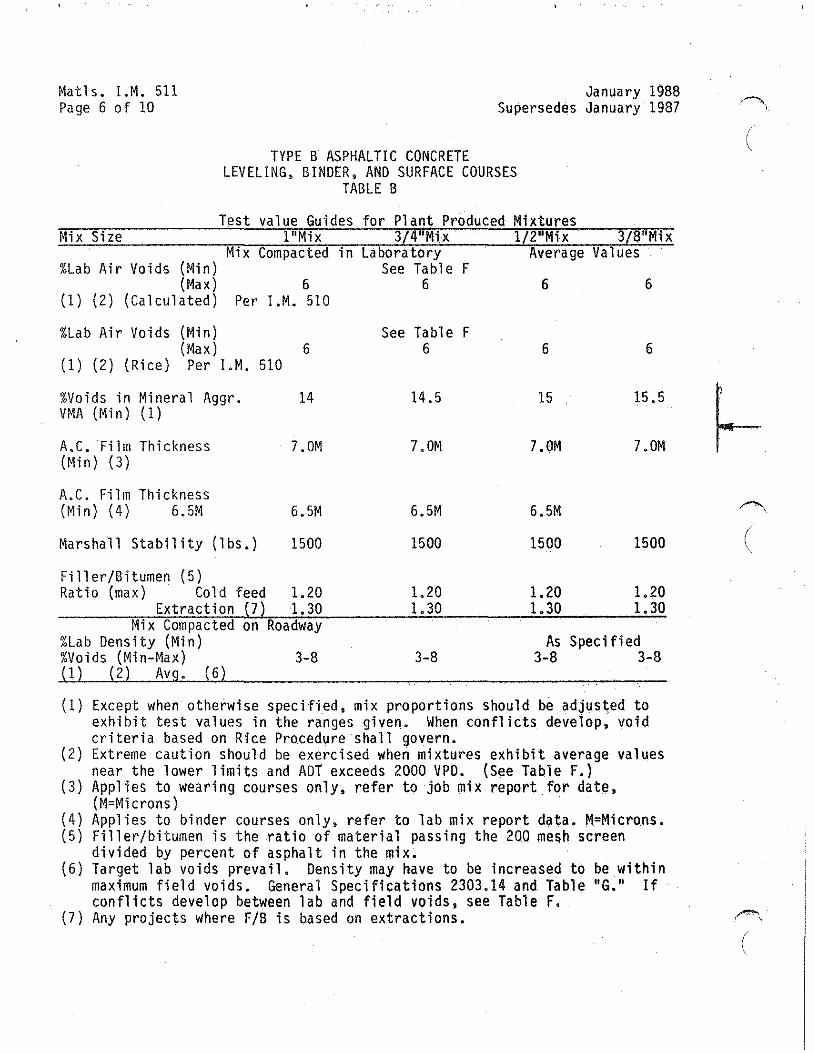
TYPE B ASPHALTIC CONCRETE LEVELING, BINDER, AND SURFACE COURSES
TABLE B
Test value Guides for Plant Produced Mixtures Mix Size l"Mix 3/4"Mix l/2"Mix 3/8"Mix
Mix Compacted in Laboratory Average Values %Lab Air Voids (Min)
(Max) 6 (1) (2) (Calculated) Per I.M. 510
%Lab Air Voids (Min) (Max) 6
(1) (2) (Rice) Per I.M. 510
%Voids in Mineral Aggr. 14 VMA (Min) (1)
A.C. Film Thickness 7. OM (Min) (3)
A.C. Film Thickness (Min) (4) 6.5M 6.5M
Marshall Stability (lbs.) 1500
Filler/Bitumen (5) Ratio (max) Cold feed 1.20
Extraction (7) 1.30 Mix Compacted on Roadway
See Table F 6
See Table F 6
14.5
7. OM
6.5M
1500
1.20 1.30
6 6
6 6
15 15. 5
7.0M 7.0M
6.5M
1500 1500
1.20 1.20 1.30 1.30
%Lab Density (Min) As Specified %Voids (Min-Max) 3-8 3-8 3-8 3-8 1 2 Av • 6
(1) Except when otherwise specified, mix proportions should be adjusted to exhibit test values in the ranges given. When conflicts develop, void criteria based on Rice Procedure shall govern.
(2) Extreme caution should be exercised when mixtures exhibit average valu.es near the lower limits and ADT exceeds 2000 VPD. (See Table F.)
(3) Applies to wearing courses only, refer to job mix report for date, (M=Microns)
(4) Applies to binder courses only, refer to lab mix report data. M=Microns. (5) Filler/bitumen is the ratio of material passing the 200 me&ll screen
divided by percent of asphalt in the mix. (6) Target lab voids prevail. Density may have to be increased to be within
maximum field voids. General Specifications 2303.14 and Table "G. 11 If conflicts develop between lab and field voids, see Table F.
(7) Any projects where F/B is based on extractions.
,.. ..... \
(
,....,.,._ ' "
( '

January 1988 Supersedes January 1987
TYPE B ASPHALTIC CONCRETE CLASS I AND II BASE COURSES
TABLE C
Test Value Guides for Plant Produced Mixtures
Mat1s. I.M. 511 Page 7 of 10
Cl ass of Mixture I II Mix Compacted in Laboratory Average Values
%Lab Air Voids (1) (2) (Min) See Table F (Max) 6 6
(Calculated) Per I.M. 510
%Lab Air Voids (1) (2) (Min) (Max)
(Rice) Per I.M. 510
%Voids in Miner Aggregate VMA (Min) (1)
A.C. Film Thickness (Min) (3)
A.C. Film Thickness (Min) (4)
Marshall Stability (Lbs.) (Min)
Filler/Bitumen Ratio (5) (Max.) Cold feed Extraction (7)
Mix Compacted on Roadway
See Table 6
14.5
7.0M
6.5M
1500
1.20 1. 30
%Lab Density (Min) As Specified %Voids Min-Max 1 2 Av • 6 3-8
F 6
14.5
7.0M
6.5M
1000
1.20 1.30
xcept when ot erwise specified, mix proportions shoul be a juste to exhibit test values in the ranges given. When conflicts develop, void criteria based on Rice Procedure should be given prime consideration.
(2) Extreme cautions should be exercised when mixtures exhibit average values near the lower limits and ADT exceeds 500 VPD (see Table F).
(3) Applies to wearing courses only, refer to job mix report for data. (M=Microns)
(4) Applies to lower courses only, refer to job mix report for data. (M=Microns)
(5) Filler bitumen is the ratio of material passing the 200 mesh screen divided by percent of asphalt in the mix.
(6) Target lab voids prevail. Density may have to be increased to be within maximum field voids. General Specifications 2303.14 and Table "G." If conflicts develop between lab and field voids, see Table F.
(7) Only on projects where F/B is based on extractions.

Matls. I.M. 511 Page 8 of 10
ASPHALT - SAND SURFACE COURSES Table D
January 1988 Supersede$ January 1987
Test Value Guides for Plant Produced Mixtures Mix compacted in laboratory Average Values
%Lab Air Voids (Min-Max) (l); (2) (Calculated) Per I.M. 510
%Lab Air Voids (Min-Max) (1) (2) (Rice) Per I.M. 510
Marshall Stability (lbs.) Min.
6.5 - 9.5
6.5 - 9.5
200
(1) Except when otherwise specified, mix proportions should be adjusted to exhibit test values in the ranges given. When conflicts develop, void criteria based on Rice Procedure shall govern.
(2) Extreme caution should be exercised when mixtures exhibited average values near the lower limits and ADT exceeds 2000 VPD.
ASPHALT TREATED BASE Table E
Test Value Guides for Plant Produced Mixtures Cl ass of Mixture (2) 1 2
Filler/Bitumen Ratio (1) (Max.) Cold Feed Extraction
A.C. Film Thickness (min.)
1,3 1.5
6,0M
1.3 1.5
6.0M
(1) The filler/bitumen ratio is the ratio of material passing the 200 mesh screen divided by percent of asphalt in the mix.
(2) Class I compaction max. field voids 8.0%
(
( '

\ ... __,,.
.. /
January 1988 Supersedes January 1987
Matls. I.M. 511 Page 9 of 10
Iowa Department of Transportation Office of Materials
Tab 1 e F
Laboratory voids shall be controlled on the basis of traffic volumes. The ·following minimums are specified for field control and shall prevail unless a conflict develops between laboratory voids, pavement voids and the specified density. If conflicts do develop, a test strip shall be constructed to determine whether or not the compactive effort required is within reason. Any relief granted in the laboratory voids will be subject to a review of the.test strip results and characteristics of the mix by the central office. The minimum voids. as determined by the laboratory job mix, will be targeted at 0.50% higher.
After October 1, except for Interstate mainline paving, the District Materials Engineer may adjust the minimum Laboratory Void Limit downward by as much as 0.25%. This authorization is contingent upon a thorough review of all mix characteristics and pl a cement and compaction efforts. Any such change shal 1 be documented and a copy of such documentation shall be copied to the Materials Engineer immediately.
Course Position
Surface Course Binder Course Base Course (Upper 1/2+} Base Course (Lower 1/2;!:)
Traffic Volumes 75 Blow 50 Blow Marshall
210,000 5000-lO,OOO 2000-5000 1000-2000 :!il:lOOO
3.5% 3.5% 3.5% 3.5%
3.5% 3.5% 3.5% 3.5%
DENSITY VOID GRAPH TABLE G
3.5% 3.0% 3.0% 3.0%
3.0% 3.0% 3.0% 3.0%
2.5% 2.53 2.5% 2.5%
The Density Void, Graph (Table G} can be used to demonstrate the relationship between laboratory voids, pavement voids and the required density. As an example, the minimum laboratory voids for a surface course with traffic volumes ranging from 2000-5000 VPD can be 3.5% (Table F). By referring to Table G., it can be shown what with laboratory voids of 3.5% at 100% density, it will be necessary to compact to a minimum of about 95.4% of laboratory density in order to assure a maximum of 8% pavement voids. Similarly, at 4.5% laboratory voids, the minimum density would be about 96.4%.

Matls.
I.M.
511 Page
10 of 10
103
102
101
100
99 >-I-
..... 9B
V1
:z: w
C
l
>-97
ex: 0 I-c(
ex: 0
96 co c(
-'
u.. 0
95 ~
w
u ex:
94 w
0
-
93
92 ---'---
.
91 L_
i i
January 1988 Sµpersedes
January 1987
Iowa
Departm
ent of Transportation
Office of M
ate
rials
DENSITY-VOIDS GRAPH
TABLE G
u ·~
u '+-
·~
'+-'+-
"' '+-
,_ <ti
I-
,_ I-
E
"'
u ·~
'+-'+-"' ,_ I-
0 1 2 3 4 V
1
Q
..... 0 >
5 ex: ..... c(
.... 6 7 8 9
10 '
:;:,----:j ..
90 LJ,_· -'-'---"- 1 --'-
--'-
---'-
11
--~
(
( \
c

PAGE 38
Appendix C Example of Effects on Aggregate Degradation
on Mix properties

APPENDIX C Effect of Average Aggregate
Degradation on Mix Properties
This sample experienced a gradation increase of +0.8 on the No. 200
sieve and an increase in surface area of 1.84 ft 2 • These numbers
approximate the averages calculated for all 390 sample comparisons.
This example demonstrates the effect of the average degradation on
several of the mix properties.
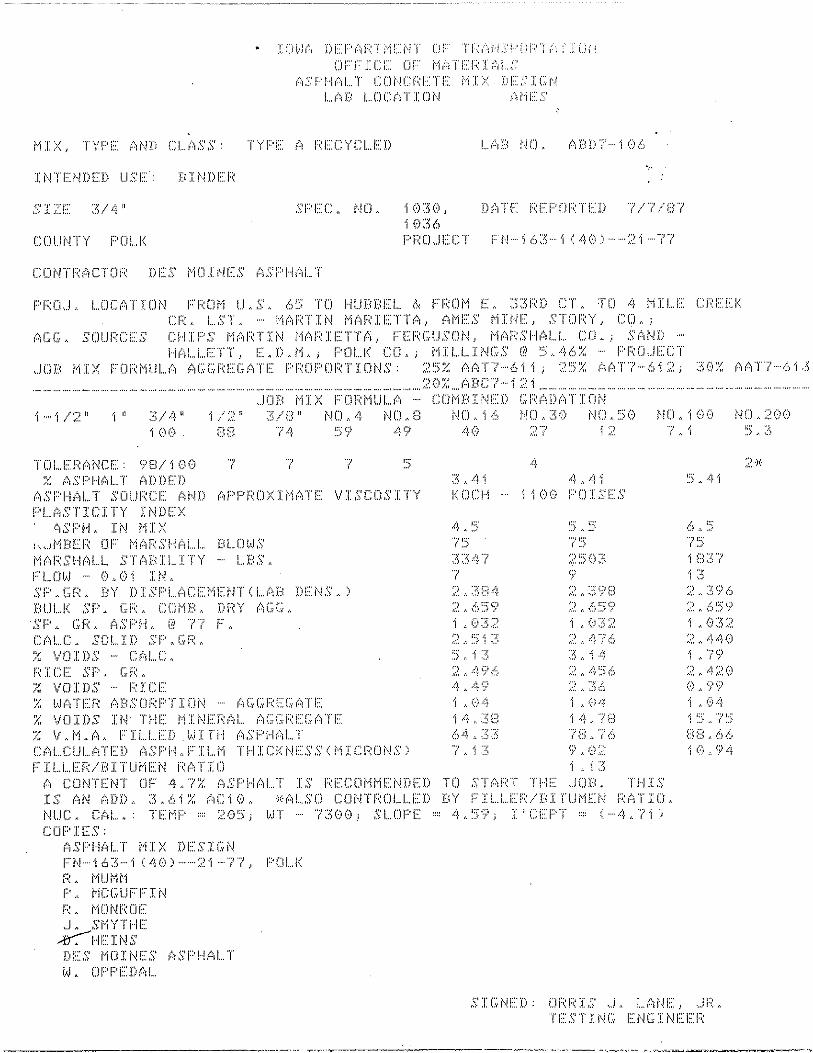
Example: Polk Co. FN-163-1(40)--21-77
3/4" Type A Recycled Binder
Mix Design #ABD7-106
Contractor - Des Moines Asphalt
Sample Date 7-22-87
Bulk Sp. Gr. Comb. Dry Agg. 2.661
A.C. content - 4.70% intended
Water Absorption - 1.04%

3/4" 1/2" 3/8" No. 4 No. 8 No. 16 No. 30 No. 50 No. 100 No. 200
SIEVE ANALYSIS - SURFACE AREA CALCULATION
Percent Passing Surface Area (sq.ft./lb.)
Cold Feed
100 91 75 62 51 41 28 12 6.7 5.1
Extraction
100 91 77 62 50 39 27 13
7.7 5.9
Diff.
0 0
2.0 0
-1. 0 -2.0 -1. 0 +l. 0 +1.0 +0. 8
Factor
+2.0
.02
.04
.OB
.14
.30
.60 1.60
Total Surf. Area (ft,2/lb)
Cold Feed
+2.0
1. 24 2.04 3.28 3.92 3.60 4.02 8.16
28.26 =====
Extr.
+2.0
1. 24 2.00 3.12 3.78 3.90 4.62 9.44
30.10 =====
Effective A.C. Content - Aggregate Basis
Diff.
0
0 -.04 -.16 -.14 +.30 +.60
+1. 28
1. 84 ----
Effective A.C.% = (A.C. % Mix) - 1/2 (%Water Absorption) (%Aggr. in Mix)
100
Effective A.C. % = 4.7 - 1/2 (1.04) (95.3) 4.20%
100
Bitumen Index
Bitumen Index= (Effective A.C.%)
100 (Surface Area)
Bitumen Index (Cold Feed) = 4.20 = 0.001486
100 (28.26)
Bitumen Index (Extraction Grad.) = 4.20 = 0.001395
100 (30.10)

Film Thickness
Film Thickness (microns) = (Bitumen Index) (4870)
Film Thickness (Cold Feed) = (. 001486) ( 4870) = 7. 24 microns Film Thickness (Extraction) = (.001395) (4870) = 6.79 microns
:~ Film Thickness decreases by 0.45 microns due to aggregate degradation. ============
Filler - Bitumen Ratio
Filler Bitumen (Cold Feed) = 5.1 = 1.09
Filler Bitumen (Extracted) = 5.9 = 1.26
IllTENDED USE·· f<INDEr•:
S'I?E:: 3/4 11
COU(ITY F''Ol...I<
I CJ(!.: (·1 D !::: r· (·1 r:~ ·-r· ('! L i'I ·r (,!I" Tr:: /"·1 (,l ,\' r' (,) F' ··~- /·: :·· I 1 _:; i' i
(Jr:·1::·rc:1::: ()f:· MA·1·1:::1:~:[A! ... S ASPHALT CONCRETE AIX DESIGN
l .. AD L .. O!:;A·r·:[ON AMi:~:s
si::·r::c:., ND., ·j 03(:), Dt1TE: F:EF>ui:::·rFD "l./"l/D7 i036 f>J~Cl.Jl:::1:;1· 1:~N-···163··-1 (40)····-··21·-77
F'F'.CJ ... J '· L.DC(·'1'T"IUN r·r:~c!···! u '· S.' ... (\ TO Hu:nBE!... t, FF:Uf'i F ,, :::~::.".)F\'.D c·r h :ru .-:'.} i'"iIL.C c:r:.:i:::EJ< CR. LST. MARTIN MARIETTA, AMES MINE, STORY, CO.;
AG(;h SOURCE~:s (~!··!:i:F>S MAJ~l"IN MAF~l:E'l"TA, FE::F~Gl.JSONJ MAF~Sl··!AL .. l .. (:;oh; SANI) !··IAl ... ! ... E~T'l', i~:Al)hMA; 1:>0!...!( C:!:la; M:[L.l_J:N(;S@ ~~S&46% f:·1:~(J .. JE~:C1·
.. Jl:lB MIX r~o1:~MLJl ... A A(;(;f~E~GA"l"I:~ 1:~r~CJPOl~'fIONS: 25% AA'f7····61i; 2~5% AA'T"'7-~6i2; 30% AA"J''7-·61,5 ........................................................ 20 ~-~; .... t·1 :f{C;"? ···· i :~~ ·i ...... _ .................. ~ ... .
.. JOB M:l:X F"Ol~Ml.JL .. A (~(JMBIN!~:I) G!:~ADA'I"ION
1 .... i/~:.~n i1: 3//411 1 ./ •"\ " :::) .. / p " ND /:. i') D fl ,::. •.::· •· ·' C• , ... , 7 ..:'{. ~::; n A (? '··' .;::1 .,. i 0 ()
··~ 7 ""/ t:~·
' ' ···' TOi ... ERANCE:: 98/100 ~-;: 1~".'1 S F' H 1~:·1 L. ·r (:i D 'O F D
ASPHALT SOURCE AND APPROXIMATE VISCOSITY F'l...t>1STIC~ITY INDEX
"1SF'H. IN MI:X: :· ...... 1!···JI{[F~'. OF l"'if'.:1F:SH(1i...L. BL.Oh.IS' MARSHAL .. L STABIL .. :!:·ry l ... BS& F:·1...CJk! O.,O·i IN., SF·.(;RA BY I):[S!~! ... ACEMEN1'(1 ... AB ])ENS~)
Bl.11._J( SP. (;!:~A (:(:lMBA DRY AGGA ·sr>. GR. ASF·~~& @ ·7·7 f" CALC. SOLID SP.GR. '.X; \/OIDS F•:ICE SP. CF•: •. :~{. 'v"CJID.S' F'.IC:E % WATER ABS!Jl~!~·r1:0N
% VClIDS l:N· 'fHE M:[NJ~RAl ... AGGF~i:::GA'l·E: % vAM.A. F:·l:L .. LE:n.w:1:·r·~·! ASP1··IAL .. ·1· CALCULATED ASPH.FILM THICKNESS<MICRONSl LILLER/BITUMEN RATIO
A l:;ON'fEN·r ClF 4.7% AS!:)~1Al .. ·r· IS l~E(;(JMMENDEI)
~~Al ... S(:) (:~CJNTRClLJ ... i:~D NUC. CAL.• TEMP 2051 WT 7300; SLOPE COF'IES •
ASPHALT MIX DESIGN r::·N ·-·163 .. ··i (4(·))········::.~'i ····77 .· PiJ!...l< I'-:. MUMM 1~·.. 1·--1CGUF·i::-1 H I'-:. MDNPDE ..1., Si'1YTHC ··----1··11··· ·1· '·J ,,, --11 " ..... l . '•'
DES MOINES ASPHALT
~·:~ ,, .4 i i<i::JCH
'i •'· (-) :::~ ::? ::? ·. ~:::: 4 :?;
.. ~, ;, ··x ! " l .... •
4 ... 4'i 'i '1 () () F !] l :~:.' F S'
'i ·' ()4
.;;_:. ·' {.;) :::.::
·j '· i 3 THIS
{ .. ,:"{ .. , "li)
6 ... ~5
:.?.4l.~0
0 ·' ')>:? ·j " (-) .-::1
SIGNE:D: Ol~!:~IS ~J,, L .. ANE, Jf~h
TESTING ENGINEER
--~------------ r"·-·•-···· ·r·r··..--------

• 1 C<~J~\ L•EP!ifff MH.n 1JF Tf({',N:O,:pQf('f AT JON Ill GH\,JAY DIV l'~' I ON
OFFICE OF NATERIALS PRQPl)f~TIONS & PRODUCl'ION LIMITS FOR AGGREGATES
F'RO.JECT NO. : r· i'.1· l e:.:;:--1 ( '10) .. · :? 1-- 17
F'RIJ,JECT LOCATION: :;:EJ.:: i"·1·:·c;f:·;.1:;:;<7:.,: ... (?=ye.le.el) T\'PE OF MIX: r, CLA~::c: OF MIX: COURSE: D l NDEc.f~ MIX SIZE: ::::/'!·"
TRAFFIC: 15100 A.D.T.
MATEfUAL !DENT li I. IN MIX PRODUCER & LOCATION ' ; -- ·- . -.. - ··- -·· ........ -- .. ·····-··--····-: : :~:! / '~· 11 c· ! .. :.'. .. L.i''1 :::: ·r : 1 i·-;r r -/ -·<::: ::::: i 1 :.::;;1..~·;~·~:L.E(~!\' L.f''f::::;r l lt'·'iT?· ... ·:~:::3:.:~ : ::;::Pi:·~ I :i l r··1 ·r "l -- ::::- :::;: :~-~ i t:~ i :::: : !''; i L. ~. _ T 1\11:::i :::; l i"''l "f / ..... :L ::;:: ::::
....... -··· .......... ,. -.. " -. --· --· --· .. --· •··· -··· ...... -- ..... -··· -" -- •.. -- .•... ""' ""' "'"' ............ -·- --· - .,.. --· •... --·· --· --- "'" -·· .... "'"' --· -··· "" ....... - ' ........... -·· " -...... - ... : 'TYPE AND SOURCE OF ASPHALT CEMENT: BITUMINOUS MATERIALS TAMA
CiRADATJON OF INDIVIDUAL AGGREGATE SAMPLES <Typical, Target, or- Average)
SIEVE ANALYSIS -% PASSING ' ' : MATERIAL : 1-1/2 1 3/4 1/2 3/8 4 8 16 30 50 1 OC> 2<)<) : l ·····-- ....•. J ..... "" -· "" ....... .. ··- .. - .... '"" .......... " .... '" ....... ···- ·-- ... ·-- ...... --................... ·-- ........ --- ·-- '"" .... '"" ...•.... , .•...• -- ........... ··- ·-- ·-· ··- ·-- .... '"" ..• ··- ·- -- ··- ··- .... -- -- ....... -- ··- : : ::;:/ 4 11 C:F:.:·. L.i ... !::::·r : l (J(l : J ()f) : 1 (l(i l ::;:·~i l "1 l l .:1.1;:. : :~:::.;: : :~·~ .. -:. l :·~~~:~ : l. :5 l l 1. : ::::. (): : :.~1/Ll 11 (:L.E::r:~!\I 1 .• r1·::; .. f' t :l()() : 1()() 11()() i (;.~:i l ::::() : 13. 0 ~ 1 ~ ~=i: i .. (l: f). ·~1: (>~ :::: r (l. :;:: l <) .. 6: ; :::;Pi~-.!!.) i J ()() t J. ()(l l :I. (11) l :J ()c) : l (l(J : ·~1·;:1 l •;)~~~ ! ·7 1S : 'l4 l ·~) ~ !:; : 1. ~ j. : {) ~ ::; : : (.'.~(:1~ !.,.1 ( L.i .... I l'-~13:3 j 1. (H) : :l (H) : 1 (H) I ·~~·:;:: l 'S~~:i l :~lC) : ~.~5 l !::;:~~ l :3'~7 l ~~~~-=~ l 1 '~/ l 15 :
PRELIMINARY JOB MIX FORMULA TARGET GRADATION
"ft]LEF~ANC:E : l 98/1001 7 l 7 l ·7 l :::=.; 1 : 'I· l ~-~ : C:OMB (1f=<A[1IN(i J (H) l 1.(H) ~ l.(H) l :~:::::: : ·;4 l ~5':;'1 : 4.•~i l LH) l ;~:7 : 1.~-~~ : ~7 ~ l. i ~5. ::,: ;
.................. , .................................................... ······-··-·-·•"• .................. -....... ,.'" ........ l """""'"·--- l ···- .. ·---··-: .. - .. -··---- l ·-··-··-···-: ___ ,,,, ... _ l ................. ; ·····--·-; SURFACE AREA c. TOTAL :o.0210.04l0.0810.14:0.30:oM60ll.bO: :3.A. :f:;G!. F"f./LB. ~~::::::: •. :~.:iJ +~~'..(iJ l .. :?l :;;~.<)! :~:;:.~-~'.l :;:,.-;: :3 •. "5l 4.,~"2l :;:::.,;:i:
PRODUCTION LIMITS FOP AGGREGATES APPROVED BY THE CONTRACTOR/PRODUCER
. "" ... -.... ·•· ... ; ..
·:-;/ lf. ll 1. / .. :~ii
.··,, /:;:.:I! ~,~4.
:--:,1,.:·1.: ;-, ·:·, ,.. '1. t: "/ U.5 i'°; '.! C f·: ;::·~. r· ;;: t· •::• :· (•ir:p 1 ./
1 •:;(; '· () 1 ()(J" ') ·::1:~.:. t) 1 ()0. (J ~::;; :;~ ,, (J ·~)Li. " 1:)
"/ (.~," () ~-Sl~(J
"i) "(J ~ (l
"i)
....
25.0% 30~!)% ::~: ./ ~l 'I i.:: L. i::~ (-; f\!
LMST SAND
' ' ' ' ' '
~-2(J. c)% A1-:r:
MI L.L l i~o::;; ........ -· : ...................................... ·-· ..... .... i ........ -- ........ --· .............. .
MIN ........... ....... .. .. .... .......... ..•. ' ' ' -........................ "'" ....................
' t \)(i \) i (:11.) r) 1 ()() (l 1 C)(i C) ' 1 ()() <) 1 l)() ~ () " . . ' .
•;:J:::: () ' (l(i ~ (l :!. (J<). () 1 ()c) . () 1.<)(l l) l C)(J (i , . ~s:-:-:. (i ?c),. i) 1()(i u C) 1 ()(j H i) ·~) :l . t) 1 ()() . c) ~:;·:~~; (i :~~:~5. t) l(J() (J 1. \)(.\. () ::;::::: !:) l ()() . ()
l . (l 1 :.~; {) 9·~~ !) 1 c)O . (l "/::~: u i) :3'/ (i () ~ () 6. c: :;q l) ·~;.-; . (:r 60 () "/() ()
(i "
(J 4J 1) i~() . () 4::: (l :.::::s (J V" I •.• :• . (J () . {) ···,
J''., ~ () () "
(J ... , .::. () l ::.: ~ (J l '? . l)
·~;;:":.i."~1 i..:.:, 'i~Ul'·!·1i::.:h,~:;;j f(!f" }_nfor·!T!.::.1.t·i1:ir·:a.1 pur·po~:.;E.•£, Of'1fy·" ! tit;• (:'.(:f";tr·;;;lt.ting k•:!:'.'; !·1·::- r·,:::!:ir·,_:~,:::.,,.::.,nt:::i.t l•:in'.:. •.\'.; to ~:~ct:ur·a.c:/ 1 1'?ith~~r· ,..;::::pr·(: .. ~;s{:·d •:ir· irr1p'! i(::•:i.1
v t~e c·or·!s·tr-ued to r·eli~ve t~1e c·:or~tpac:to~ fr'om the ~@SP•)nsit·ilj.ty
· g n •? d ____ @~--- ·-·--- .... --------.. -· Co11tractor/Pr0ducer
~:i gned -~. ~~L--~ ----t, is • -Ma~~-;::-:----
?l /9
p A 1:· '•' ,-, .j
l M r· .1
ENT OF TRAt···
-I I .
I ~ I HI ' I t--·i · I I
I I ! I I
I I I f I ------t- _/ I I I ' .... -'/ -/ I
l ------I
I ... v _ _,,..,.- I
I _,,,..-
I I ,,... /[ I ·' '
, '
I I .. i r/ I I ,/ l.-1 I ,. i ~ I -- I
:/' ~
! ' ··-·( ' ' ! -- I i i - .
,,_,Cl i!J!J SCI 30 1 .• 4
'=' l EVE , .. I ..,E, .. ··' .:J l ·:l
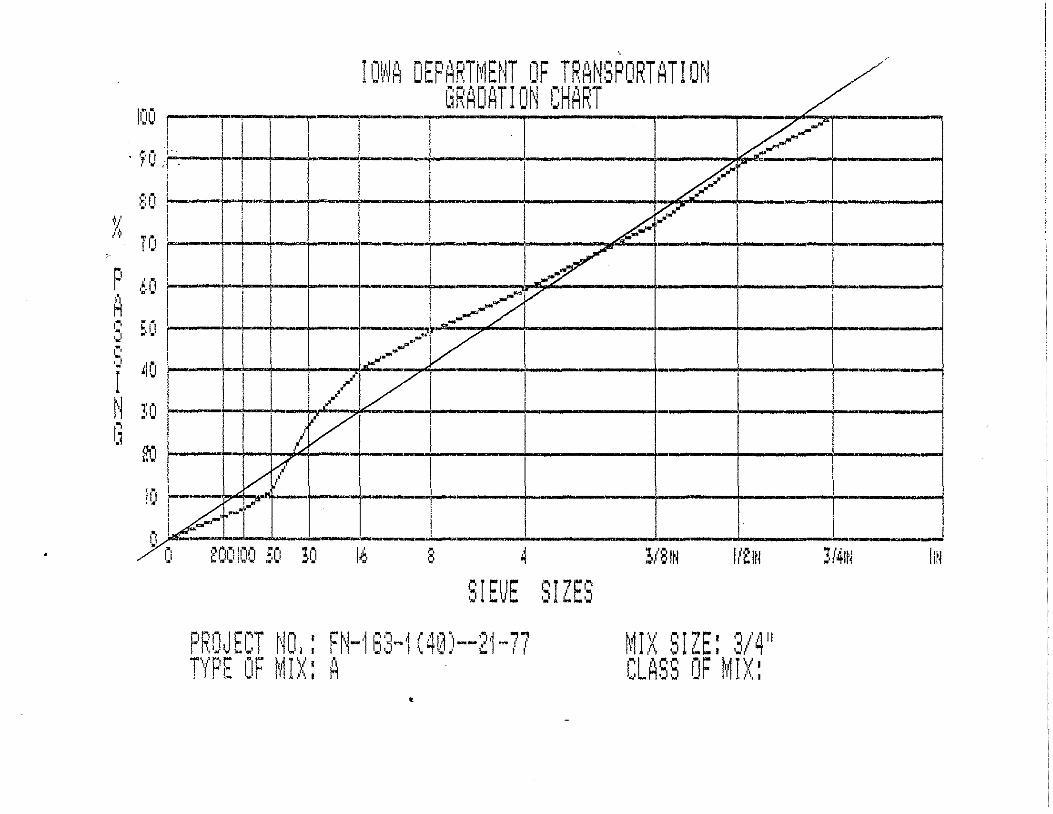
F'RO,J ECT 1"10 l : FN-·18:3-·1 ( 40)--2·1-77 T" .... F' r. II F h1
11 l Y • t\ ' I ,_ • I I I I i"I
•
-- ,.,.. -"'_,...
-~ -/ --
~--· I
~ . I
-I
.J:~/N lf~ltl
MIX S l ZE: 3/ 411
CLASS OF MIX:
I -
' I
,, f41t, liN
Form 820257 6-83
FORM 257
?OM 4 ·71
Material
Intended
6) Iowa Dep~~~;~;.,~:~ransportation AMES LABORATORY
TEST REPORT - BITUMINOUS MATERIALS I
f:l&fih. Cone. ··•·· R. Mumm
R. Monroe D. Heins
-"3"-/_,_4_"_T""y"'p-'e'-'-'A-'-"Re"'c""y-'c"'l""e""d-'B"-1"-·n'-'d=ec..r ________ Laboratory No._A_B~C_8-_2_4 ______ _
Cold Feed Research
Project No. ___ D~ep~t_._I_N_f_o_. _________ County _____ P_o l_k __________ _
Conltactor_~D=e=s~M=o~in~e=s'-'-A=s~p"-ha~l~t~---------------------------
Producer
Plant Cedar Rapids Batch W/Baghouse
Unit of Material __ F_N_-_1_3_-_1_( _40_)_-_-2_1_-_7_7 ____ A_B_D_7_-l_0_6 ____________ _
Sampled Jensen 3 of 3 .,, ________________________ Sender's No .. __________ _
7-22-87 1 6-88 1-14-88 Date Sampled ________ Date Ree'd _-___ · _____ Date Reported __________ _
SIEVE ANALYSIS - i'ER CENT PASSING
Cold Feed 100 91 75 62 51 41 28 12 6. 7 5.1
% Aggregate - By Extraction --------------~9"'4'-'.29,,,_6 ___ _ % Bitumen~ By Extraction ----------------'--"'-'-'L'.:L----% Water ___________________________ _
% Volatile----------------------------
Specimens molded & tested @ 77° F. Marshall Stability, lbs. Flow, 0.01 Inches------------------------Specific Gravity ------------------------After 8 cycles of F&T Specimens molded@ 40°F. & tested@ 77°F. Marshall Stability, lbs. Flow, 0.01 Inches ------------------------Specific Gravity -=----~~-------------------Percent Asphalt Intended 4.70 (Add 3.61) Percent Asphalt Tank Stick 3.80 Percent Asphalt Dist 1 Nuclear 4.95 Percent Asphalt Cent. Lab Nuclear /\ 4.89 /
DISPOSITION: By ~~---------cf,,L--

PAGE 46
Appendix D Results of 1986 Cold Feed vs Extraction Study
Appendix
D -R
esu
.lts o
f .1986 C
old F
eed
'l. ~1
"'... "''~"'"'"'"''"""
. ' '~~
~: '
O><><>-
"'"'"'"' <>'1"
;:~?;;! ~?M'A
\;i\;i
!s ,. §:.
t::t!Pl?~
l j
.... ' ... "'"'"'"'"'"'"'"'
-N
7 9
'7
"'"'"'"'"'"""""' ' ...
' ... '-"'''"""""'""'
""'"'"'"'"'"'"' . ..
''' .,
;!;~!::~:::~;;,:~
?
"'"'·""'"'"'-<> ' ..
' .. '.
;ilm~~lili:l~~
00
.. -"'"
""'"
' . '
' .....
:;;~l'!;:~;e;ti:;
..
N
'
"'"'"''" ... '"'""'' ...... '.
'4-'IJ!filf;li:J;i;~~
"!":~"!~~~,
N•
, ,
0..0
..QM
;~~~~*~~ ~* ~~ $~Z~
<rll>
NN
l'\"'I'\"
'
iiii~ii~
. . ?
0
"'"'"'"' iii~
.... """'"'"''~'"'"' ...... '
'
"'"'''"""'''"''"'
"'"'"'"""'''"""' ....... '
,_,_.._,,,,,..,.,,,,,,
"'"'"'"'"'"''""' ......
' . "'8SS~::l:::::::
,,,,.,,..,..,...,...,,_ . '
.' ....
~i:lf:li:l~\'.:i:l~
_,_.., .... .,.,,.. .. ,,, ~i:4i:<i~Pi;i
0.,. "
"" N
<ll .,.-
O'
OC~N<>li>"'"'"'"'
~i ci::i'.:5ci::i::icici:'.i
.. .,.. "'<> ... "
'''"''"
'''"''
~~ ~~~;?,~~~~~
"'"' ":"":"l";<>;""!"!'\
:;;:;; f;;i2;;J::Ji::lg:IJ~U
"'"'"""'"'"'"'"'"' ~~~~~~~?
l,1; . ''.'' ...
;;1/l?;';~1;;r,J;'l;?
"'"'"'"'.,."'"'"' "'"'"""'"""'"'""'
ii~~:i~ci~ ~~
. . . . ' . . . . ;::;;:t:;:;i~:Jl?tl~
.. """'"'"'"'"'"' "1
0f'lN
'FV
lOO
l<C
>
ggg;~~t~ie ~*
~t8~sicii'.!i~
"'"' "'"'""'<>"'"""'"'
~~ g~*i§~(;ig~ v
s E
xtractio
n
Stu
dy
o;c;·;.;~
"'"''"'"'
N
<
'i' 1
0
" ":'":":~
~~ ~:-;i;:i;:
i i ' '
~.:;~~''; ''!"':
··"'r' ..,,,.,
... ,,,,,., ,.:,,;,,;,,;
~1\;1 ~
.. ?
0
<>
-o"'o
"'
:<ill:?';!~; ~~ ~~
"'""'"''""' "'"'
""'"'"' $::::~R;!.:~
~:2 ~ie
::l~tii
,.,_,__,,_ ""'
~Q!~!l>S;\;; ~~
~$
?
~99~~~ 0~
0'1
J 9~ O®N~
~§~~~~ §~ §~ §~ §~*~
0 0
0 0
"'"
'"'"
' N
W
'l"'I" ,.:,.:,,;,,;
"'"'"'"' .<i~i.<i
N
'f'
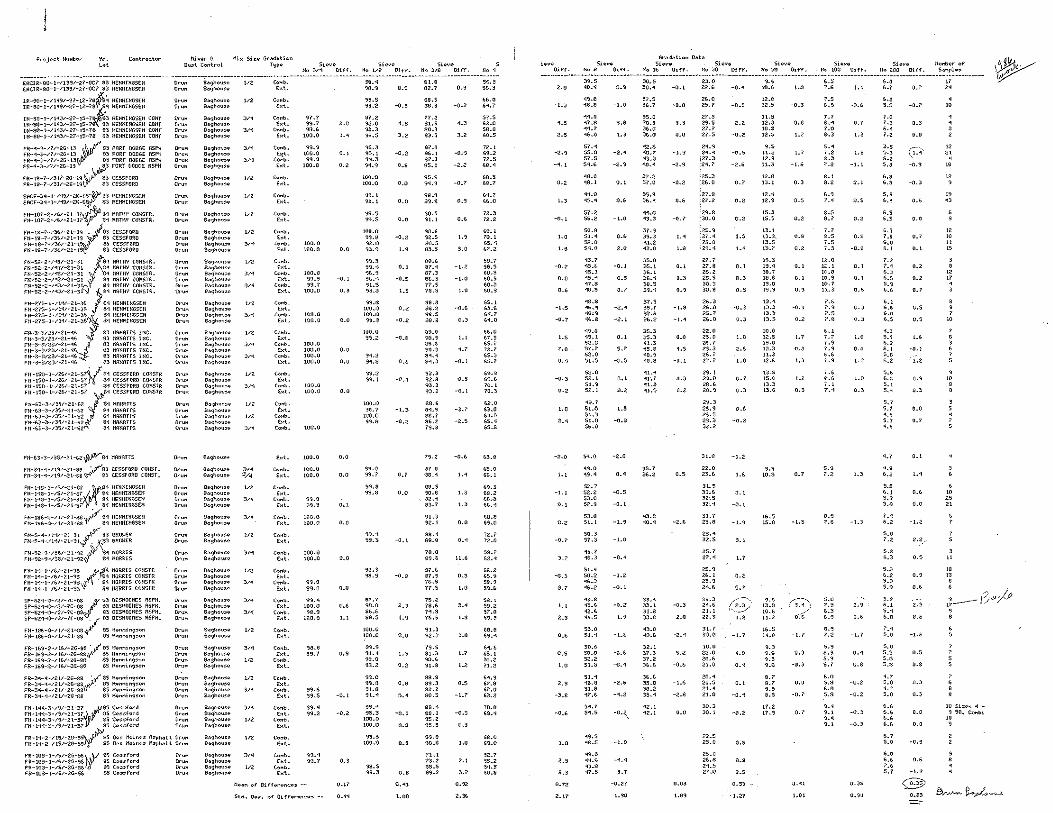
q"!";<! ~~
~~ ~*'~*
"'.. "'"'"'"'
i~ i~
~ciii~
NO
"'"' an~
g:g: s;;i;i*
.. ~~~i
~i ~*
o;o;<-;<-;q~ !'.:1'.:SS1'.:1'.:
"!>;qo;e;~
S'-'l:::::::::'-'l
0 ,,;
• 9
0
o--.-"',,. :'li'J(l():l~J:;
.......... .,., "''"
"'"
' o
.,Ot-<
H>
~~iii@ ~\!?#
~~l)l;,~;::
? c
0
.. N..,..
o-O
--'l"
N
''"'"
'"'"
'"'
"'"
'""'"
"',_
~$~$
3l3l ~£
~~ $2$~ ~m~S$$ ~~$~ ici0ci0~
""" "'"'~":
~i ~g:~~
0 ' "
"'""" .. "'" g:g:.,~;:;i
qo:"';q §g:~§
O<
::OO
>
<>
N
g:~§~
~g: 00
00
..
§§
§§§~
UHH _.,,,,,,. i~iIB
iiiir;!
0 • '
.... l)ll)l;j;i;l
"'"'"''" ,..,
~~ ~~r;)r;)
~~ ~r;)
~t 9 . 9
0 0
"1"
... "'"
'""
o-
"""' "'"'"'"'
~~ &i~cici
iti '#
#
..... "'"'"'"'
.. "'!~'1":
2.'.£ ~3l:t~
3l~ ~~
si& :g~si?;;
,,,.,,..,_ gig~~ oi*
i~
''""
00
ii §
§
.. ":":":":
reg; ~S;~t ( •. \.
,,; ·,,;
.,,,,_.., ~i~~
"'"'"'<> ~i
.;.,;.,;.,;.
"'"'"'"' ;:;g
:l~i~ 9
o.-"'"'"'"'
~;;:: gg~~
"'"
' V> .
. N
N
3l;[: .I0R
;: '""''""' ""''"'"'
)?.~;;;;;; gg
~~ ~~ii
"'"' "'"'"""
~~ ¢
tii .,...,.,.,, ~i~i
"'"'"'"' 0
0
f'-N"'O
>
:i,;;;;;~ ~;[:
3l;[: ~~;;;~
<!o;<;"; g:g:;:;
"'"'00 "'"'
~~~~ g:§


