1
Disc laimer: The contents of this presentation are the views of the author and do not necessarily represent an offic ial position of the European C ommission. © European Union, 2013
Determinants of quality of evidence:
What can lower the evidence? (I)
Jesús López Alcalde
Public Health Policy Support Unit
Institute for Health and Consumer Protection
(JRC-IHCP)
Joint Research Centre
The European Commission’s
in-house science service
2 GRADE Workshop – Ispra– 11-12 December 2013
GRADE Workshop: Agenda
9:00 - 10:15 Introduction. Guideline development process and the GRADE approach
10:15-11:00 Types of questions. Framing a question: PICO question. Exercise
11:00-11:15 Coffee
11:15-12:00 Choosing outcomes. Relative importance of outcomes. Exercise
12:00-12:45 Study designs. Exercise
12:45-13:30 Lunch
13:30-14:30 Search of the literature. Exercise
14:30-15:00 Determinants of quality of evidence: What can lower the evidence? (I)
15:00-15:15 Coffee
15:15-17:00 Determinants of quality of evidence: What can lower the evidence? (II) Exercise
9:00-11:15 Determinants of quality of evidence: What can lower the evidence? (III)Determinants of quality of evidence: What can upgrade evidence?
11:15-11:30 Coffee
11:30-13:00 Going from the evidence to the recommendation. Exercise
13:00-13:45 Lunch
13:45-16:00 Using the Guideline Development Tool (GDT) software. ExerciseFeedback and conclusions
Recommendation
Evidence synthesis
P
I
C
O
Outcome
Outcome
Outcome
Outcome
Critical
Important
Critical
NotSummary of findings &
estimate of effect for
each outcome
Grade overall
quality of evidence
across outcomes based on
lowest quality
of critical outcomes
Randomization raises
initial quality
RCTs: high
Observational: low
1. Risk of bias
2. Inconsistency
3. Indirectness
4. Imprecision
5. Publication biasGra
de d
own
Gra
de u
p 1. Large effect
2. Dose response
3. Opposing bias &
Confounders
Very low
Low
Moderate
High
Grade recommendations
(Evidence to Recommendation)
• For or against (direction) ↓↑• Strong or conditional/weak (strength)
By considering balance of consequences
(evidence to recommendations):
� Quality of evidence
� Balance benefits/harms
� Values and preferences (equity)
� Resource use (cost, feasibility)
� Acceptability
Formulate Recommendations (↓↑ | ⊕…)
“The panel recommends that ….should...”
“The panel suggests that ….should...”
“The panel suggests to not ...”
“The panel recommends to not...”
Transparency, clear, actionable
Guideline
Slide kindly offered by the GRADE Working Group
4 GRADE Workshop – Ispra– 11-12 December 2013
• Common misunderstandings
• GRADE considers two definitions of ‘‘quality of evidence’’ (QoE)
• GRADE specifies four levels for the quality of evidence of each outcome
across studies
• GRADE’s approach to rating the quality of evidence of each outcome
across studies
Outline
5 GRADE Workshop – Ispra– 11-12 December 2013
Evidence ≠ Expert opinion
Assesing the Quality of the Evidence ≠ Making a recommendation
Common misunderstandings:
6 GRADE Workshop – Ispra– 11-12 December 2013
• Their experience with patients
• Their understanding of biology and mechanism of the problem
• Their knowledge of preclinical and early clinical research
• Their knowledge of the results of clinical research (randomised clinical
trials and observational studies)
Expert opinion is not evidence
Opinion
Please, answer: What is the basis of the opinion of experts?
2
7 GRADE Workshop – Ispra– 11-12 December 2013
Opinion
Guideline developers should always:
• Engage experts to define the PICO question
• Engage the experts to interpret the evidence
• Uncover and make clear the evidence that underlies the experts’ opinions
• Rate the quality of that evidence
How to deal with expert opinion in guidelines:
Quality of that evidence
Evidence
Uncover
Assess
8 GRADE Workshop – Ispra– 11-12 December 2013
Example: Expert opinion is not evidence
JCE 64 (2011) 401-406
Expert opinion Components
Tight control of sugar in blood will reduce the long-term risk of developingkidney disease […]
‘‘I institute tight control on every patient - I believe
they all deserve the best possible treatment- so I
have a lot of experience with this.
I have many patients who have been with me for a decade, or even several decades, and who take their
medicine faithfully and have great blood sugars. These patients also have very few complications. On
the other hand, I have a lot of patients who have
terrible control and develop complications early on.
Also, there are a lot of studies showing that tightcontrol reduces the risk of complications.’’
Personal experience
Clinical research
9 GRADE Workshop – Ispra– 11-12 December 2013
Evidence ≠ Expert opinion
Assesing the Quality of the Evidence ≠ Making a recommendation
Common misunderstandings:
10 GRADE Workshop – Ispra– 11-12 December 2013
GRADE explicitly separates two steps:
• To assess the quality of the evidence
• To make a recommendation and grade its
strength
Quality of evidence ≠ Strength of recommendation
Recommendation
Quality of the evidence
JCE 64 (2011) 401-406
A particular quality of evidence does notnecessarily imply a particular strength ofrecommendation
Balance benefits/harms
Values and preferences
Resource use (cost)
Equity Feasibility
Acceptability
11 GRADE Workshop – Ispra– 11-12 December 2013 12 GRADE Workshop – Ispra– 11-12 December 2013
• Common misunderstandings
• GRADE considers two definitions of ‘‘quality of evidence’’ (QoE)
• GRADE specifies four levels for the quality of evidence
• GRADE’s approach to rating the quality of evidence for each outcome
across studies
Outline
3
13 GRADE Workshop – Ispra– 11-12 December 2013
GRADE considers two definitions of ‘‘quality of evidence’’ (QoE)
As part of a systematic review
As part of making a recommendation in guidelines
Our level of confidence that theestimate of the effect is…
… correct(close to the truth)
… adequate tosupport a particular recommendation
14 GRADE Workshop – Ispra– 11-12 December 2013
Systematic reviews seldom include processes required for makingrigorous recommendations:
• Authors of systematic reviews are, generally, not in a position to weigh the
trade-offs between the desirable and undesirable consequences of adhering to
a recommendation.
Relevant stakeholders included in are in a better position to make thesejudgments.
Reason for two different definitions of QoE in GRADE
15 GRADE Workshop – Ispra– 11-12 December 2013
• Common misunderstandings
• GRADE considers two definitions of ‘‘quality of evidence’’ (QoE)
• GRADE specifies four levels for the quality of evidence for eachoutcome across studies
• GRADE’s approach to rating the quality of evidence for each outcome
across studies
Outline
16 GRADE Workshop – Ispra– 11-12 December 2013
Level of evidence
Our level of confidence in the effect estimate
Explanation
High We have high confidenceThe true effect lies close to the
estimate of the effect
ModerateWe have moderateconfidence
The true effect is likely to be close to the estimate of the
effect, but there is a possibility
that it is substantially different
Low We have limited confidenceThe true effect may be substantially different from
the estimate of the effect
Very lowWe have very littleconfidence
The true effect is likely to be substantially different from
the estimate of effect
GRADE: 4 levels for the QoE for each outcome across studies
17 GRADE Workshop – Ispra– 11-12 December 2013
• Common misunderstandings
• GRADE considers two definitions of ‘‘quality of evidence’’ (QoE)
• GRADE specifies four levels for the quality of evidence for each outcome
across studies
• GRADE’s approach to rating the quality of evidence for eachoutcome across studies
Outline
Evidence synthesis
P
I
C
O
Outcome
Outcome
Outcome
Outcome
Critical
Important
Critical
Not
Randomization raises
initial quality
RCTs: high
Observational: low
1. Risk of bias
2. Inconsistency
3. Indirectness
4. Imprecision
5. Publication biasGra
de d
own
Gra
de u
p 1. Large effect
2. Dose response
3. Opposing bias &
Confounders
Very low
Low
Moderate
High
Slide modified from the GRADE Working Group
• GRADE’s approach to rating
• the quality of evidence for each outcome across studies
4
19 GRADE Workshop – Ispra– 11-12 December 2013
Example: Quality of the evidence for an outcome across studies
JCE 66 (2013) 151e157
Ann Surg Oncol 2007;14:1825e34.
20 GRADE Workshop – Ispra– 11-12 December 2013
GRADE: rating the QoE for each outcome across studies
Identify thestudy design
Randomisedtrials
Observationalstudies
Initial quality of a body of
evidence
High ++++
Low ++
Lower if Higher ifFinal quality of a body of
evidence
High ++++
Moderate +++
Low ++
Very low +
Risk of Bias:-1 Serious
-2 Very serious
Indirectness:-1 Serious
-2 Very serious
Inconsistency-1 Serious
-2 Very serious
Imprecision-1 Serious
-2 Very serious
Publication bias-1 Likely
-2 Very likely
Large effect+1 Large
+2 Very large
Dose response+1 Evidence of
a gradient
All plausible residual confounding:
+1 would reduce a
demonstrated effect+1 would suggest a
spurious effect if no effect was observed
21 GRADE Workshop – Ispra– 11-12 December 2013
Risk of bias
22 GRADE Workshop – Ispra– 11-12 December 2013
GRADE Workshop: Agenda
9:00 - 10:15 Introduction. Guideline development process and the GRADE approach
10:15-11:00 Types of questions. Framing a question: PICO question. Exercise
11:00-11:15 Coffee
11:15-12:00 Choosing outcomes. Relative importance of outcomes. Exercise
12:00-12:45 Study designs. Exercise
12:45-13:30 Lunch
13:30-14:30 Search of the literature. Exercise
14:30-15:00 Determinants of quality of evidence: What can lower the evidence? (I)
15:00-15:15 Coffee
15:15-17:00 Determinants of quality of evidence: What can lower the evidence? (II) Exercise
9:00-11:15 Determinants of quality of evidence: What can lower the evidence? (III)Determinants of quality of evidence: What can upgrade evidence?
11:15-11:30 Coffee
11:30-13:00 Going from the evidence to the recommendation. Exercise
13:00-13:45 Lunch
13:45-16:00 Using the Guideline Development Tool (GDT) software. ExerciseFeedback and conclusions
23 GRADE Workshop – Ispra– 11-12 December 2013
GRADE: rating the QoE for each outcome across studies
Identify thestudy design
Randomisedtrials
Observationalstudies
Initial quality of a body of
evidence
High ++++
Low ++
Lower if Higher ifFinal quality of a body of
evidence
High ++++
Moderate +++
Low ++
Very low +
Risk of Bias:-1 Serious
-2 Very serious
Indirectness:-1 Serious
-2 Very serious
Inconsistency-1 Serious
-2 Very serious
Imprecision-1 Serious
-2 Very serious
Publication bias-1 Likely
-2 Very likely
Large effect+1 Large
+2 Very large
Dose response+1 Evidence of
a gradient
All plausible residual confounding:
+1 would reduce a
demonstrated effect+1 would suggest a
spurious effect if no effect was observed
Outline• What is bias?
• Cochrane ‘Risk of bias’ tool for randomized controlled trials
• Assessing risk of bias: CHOC-ATT trial
• Exercise
5
In a study, what is bias?Systematic error or deviation from the truth in the results of a study
Outline• What is bias?
• Cochrane ‘Risk of bias’ tool for randomized controlled trials
• Assessing risk of bias: CHOC-ATT trial
• Exercise
7 evidence based factors to address:1. Random sequence generation
2. Allocation concealment
3. Blinding of participants and personnel
4. Blinding of outcome assessment
5. Incomplete outcome data
6. Selective reporting
7. Other bias
Consult the Cochrane Handbook
Cochrane ‘Risk of bias’ tool for randomized clinical trials
Review authors’ judgement:
Support for judgement
Risk of bias summary Risk of bias graph
6
Outline• What is bias?
• Cochrane ‘Risk of bias’ tool for randomized controlled trials
• Assessing risk of bias: CHOC-ATT trial
• Exercise
Feeling sleepy?
Attention lagging?
Maybe you
need…
Sle
ep
ing
kid
in N
SC
by
ro
flto
sh w
ww
.fli
ckr.
com
/ph
oto
s/2
11
31
32
7@
N0
0/2
10
07
63
00
9
Any questions?
Exercise
JRC xxxxx – © European Union, 2013Disc laimer: The contents of this presentation are the views of the author and do not necessarily represent an offic ial position of the European C ommission.
Sm
all
Ch
oco
late
Fo
un
tain
by
Ale
xan
de
r K
lin
k h
ttp
://c
om
mo
ns.
wik
ime
dia
.org
/wik
i/Fi
le:S
ma
ll_
Ch
oco
late
_Fo
un
tain
.JP
G
CHOC-ATT Trial
Does CHOColate improve ATTention and
reduce sleepiness during workshops?
35 GRADE Workshop – Ispra– 11-12 December 2013
JRC is planning the CHOC-ATT trial
Aim of the trial:
To find out if eating chocolate (which contains sugar and caffeine) can:
• improve attention during workshops; and
• reduce sleepiness during workshops
You will be recruited as participants in the trial
Scenario
36 GRADE Workshop – Ispra– 11-12 December 2013
Question 1: How to investigate whether chocolate has any effect?
Create 2 groups, one receiving chocolate and the other receiving nothing
Step 1: Generating an allocation sequence (I)
7
37 GRADE Workshop – Ispra– 11-12 December 2013
Question 2: How to divide the participants in the trial into two groups?
What do you think about the following methods:
Non-random:• Left side/right side of the room
Quasi-random:• Alternancy
Stratifying by known confounders:• Probably sleepy people balanced
between groups
Step 1: Generating an allocation sequence (II)
PROBLEM:
There may be some important
factors that are not balanced
between the groups, and might
affect the outcome of the trial.
Question 3:
How to generate two groups with all
the relevant factors that might
affect the outcome of the trial
balanced between the groups?
Random sequence
38 GRADE Workshop – Ispra– 11-12 December 2013
Everyone stands an equal chance of being in each group, which balances all
known and unknown confounders between two groups
Random sequence
Control group: Doing nothing
Intervention group
40 GRADE Workshop – Ispra– 11-12 December 2013
We need randomised clinical trials!!!
Put a RCT in your life!
http://www.randomiseme.org/
41 GRADE Workshop – Ispra– 11-12 December 2013
Question 4: How to generate a random sequence?
• Computer-generated sequence
• Random number table
• Drawing lots or numbers out of a hat
• Rolling dice
Step 1: Generating an allocation sequence (III)
42 GRADE Workshop – Ispra– 11-12 December 2013
Example: method to assign random numbers to the participants
Use an Excel spreadsheet
8
43 GRADE Workshop – Ispra– 11-12 December 2013
Important message
Follow the path dictated by chance!!!!
44 GRADE Workshop – Ispra– 11-12 December 2013
The randomisation schedule is now ready for use by recruiters in the trial.
I will stick the schedule to the wall in order to follow it.
Step 2: Allocation concealment
QUESTION 5: Consequences of having this list on the wall in the recruitment office?
ANSWER: It may affect the recruitment
QUESTION 6: How to overcome this problem?
ANSWER: Allocation concealment
Protect the random sequence (and thus prevent any interference or
manipulation of the sequence by the trial recruiter or participants)
45 GRADE Workshop – Ispra– 11-12 December 2013
Central randomisation serviceSuch as a pharmacy, a central office contacted by phone or email, or an
automated computer system.
Sequentially numbered, sealed, opaque envelopes or drug containers
Question 7: How allocation concealment might be achieved?
Question 8: Do you identify any problems with this method to conceal the allocation?
Sequentially numbered?
Sealed envelopes?
Opaque envelopes?
Let’s implement the sequence
Sources of biasRandom sequence generation
Allocation concealmentSelection
Performance
Detection
Attrition
Reporting
Target population
Allocation
Intervention group Control group
Outcome
assessment
Outcome
assessment
Publication of study outcomes
Selection bias: Systematic differences
between baseline characteristics of the
groups that are compared.
47 GRADE Workshop – Ispra– 11-12 December 2013
Please, open your envelopes. Who have number 1 (Chocolate)?
Please, eat the chocolate
Perfect, both the investigators and participants know which participants
received chocolate and which did not.
Step 4: Blinding
ANSWER:
Performance bias:Example: participants who did not receive chocolate might buy chocolate or
coffee to stay alert. This might genuinely affect the results of the trial.
Detection bias:Example: participants might be more likely to report negative outcomes if
they are unhappy because they did not receive any chocolate.
Question 9: Why this could be a problem?
Sources of bias
Selection
Performance
Detection
Attrition
Reporting
Target population
Allocation
Intervention group Control group
Outcome
assessment
Outcome
assessment
Publication of study outcomes
Systematic differences between both groups in the care that is provided, or
in exposure to factors other than the interventions of interest
Systematic differences between groups in how the outcome is evaluated
9
49 GRADE Workshop – Ispra– 11-12 December 2013
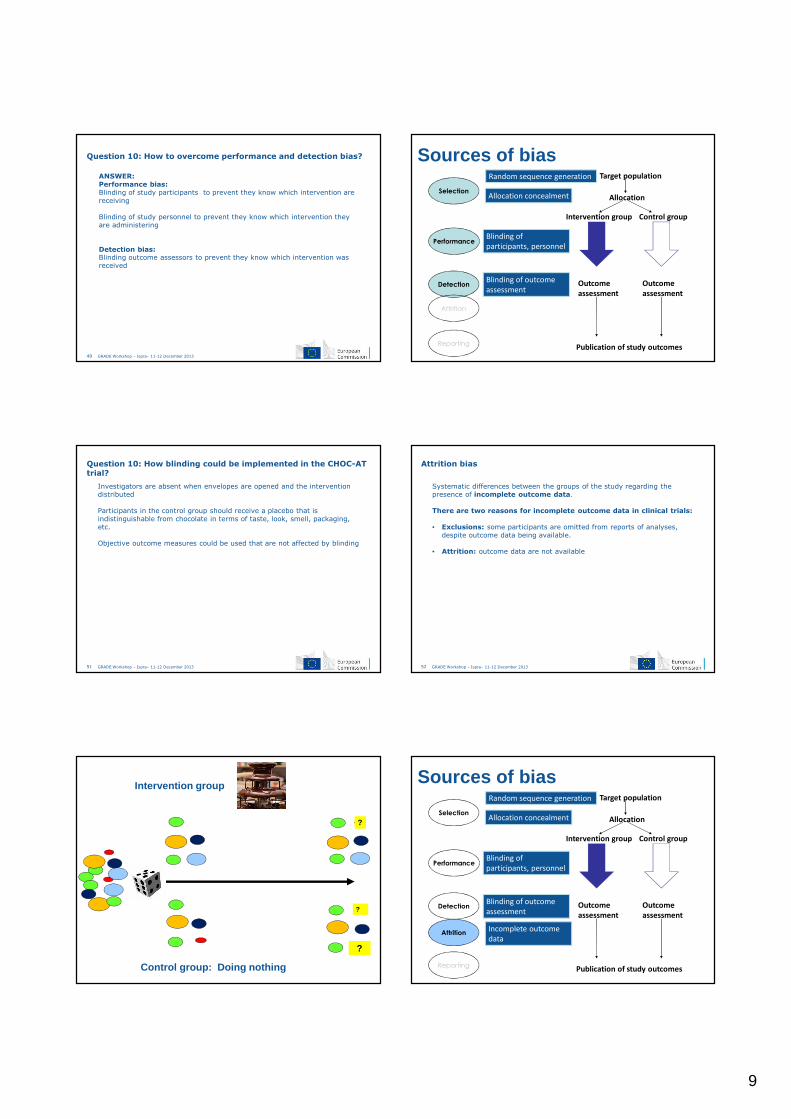
ANSWER: Performance bias: Blinding of study participants to prevent they know which intervention are
receiving
Blinding of study personnel to prevent they know which intervention they
are administering
Detection bias: Blinding outcome assessors to prevent they know which intervention was
received
Question 10: How to overcome performance and detection bias? Sources of biasRandom sequence generation
Allocation concealmentSelection
Performance
Detection
Attrition
Reporting
Target population
Allocation
Intervention group Control group
Outcome
assessment
Outcome
assessment
Publication of study outcomes
Blinding of
participants, personnel
Blinding of outcome
assessment
51 GRADE Workshop – Ispra– 11-12 December 2013
Investigators are absent when envelopes are opened and the intervention
distributed
Participants in the control group should receive a placebo that is
indistinguishable from chocolate in terms of taste, look, smell, packaging,
etc.
Objective outcome measures could be used that are not affected by blinding
Question 10: How blinding could be implemented in the CHOC-AT trial?
52 GRADE Workshop – Ispra– 11-12 December 2013
Systematic differences between the groups of the study regarding the
presence of incomplete outcome data.
There are two reasons for incomplete outcome data in clinical trials:
• Exclusions: some participants are omitted from reports of analyses,
despite outcome data being available.
• Attrition: outcome data are not available
Attrition bias
Control group: Doing nothing
Intervention group
?
?
?
Sources of biasRandom sequence generation
Allocation concealmentSelection
Performance
Detection
Attrition
Reporting
Target population
Allocation
Intervention group Control group
Outcome
assessment
Outcome
assessment
Publication of study outcomes
Blinding of
participants, personnel
Blinding of outcome
assessment
Incomplete outcome
data
10
55 GRADE Workshop – Ispra– 11-12 December 2013
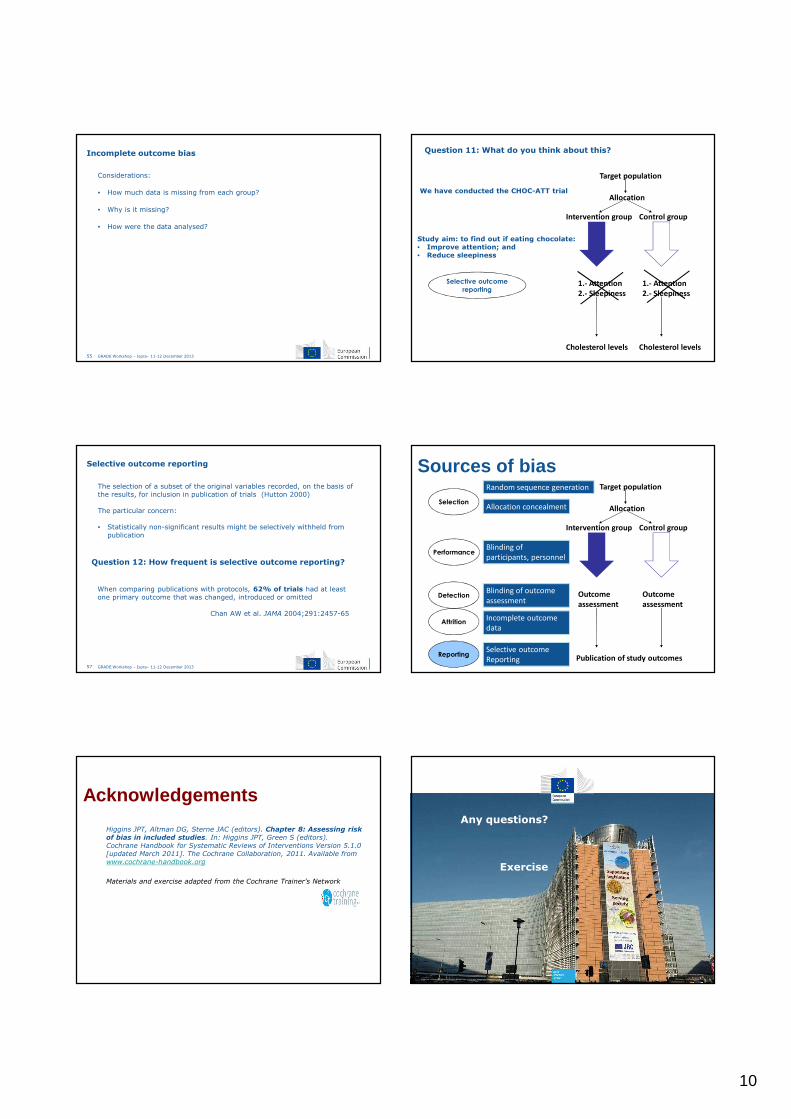
Considerations:
• How much data is missing from each group?
• Why is it missing?
• How were the data analysed?
Incomplete outcome bias
Selective outcome
reporting
Target population
Allocation
Intervention group Control group
1.- Attention
2.- Sleepiness
1.- Attention
2.- Sleepiness
Cholesterol levels
Question 11: What do you think about this?
We have conducted the CHOC-ATT trial
Study aim: to find out if eating chocolate:• Improve attention; and • Reduce sleepiness
Cholesterol levels
57 GRADE Workshop – Ispra– 11-12 December 2013
The selection of a subset of the original variables recorded, on the basis of
the results, for inclusion in publication of trials (Hutton 2000)
The particular concern:
• Statistically non-significant results might be selectively withheld from
publication
Selective outcome reporting
Question 12: How frequent is selective outcome reporting?
When comparing publications with protocols, 62% of trials had at least
one primary outcome that was changed, introduced or omitted
Chan AW et al. JAMA 2004;291:2457-65
Sources of biasRandom sequence generation
Allocation concealmentSelection
Performance
Detection
Attrition
Reporting
Target population
Allocation
Intervention group Control group
Outcome
assessment
Outcome
assessment
Publication of study outcomes
Blinding of
participants, personnel
Blinding of outcome
assessment
Incomplete outcome
data
Selective outcome
Reporting
Acknowledgements
• Higgins JPT, Altman DG, Sterne JAC (editors). Chapter 8: Assessing risk
of bias in included studies. In: Higgins JPT, Green S (editors).
Cochrane Handbook for Systematic Reviews of Interventions Version 5.1.0
[updated March 2011]. The Cochrane Collaboration, 2011. Available from
www.cochrane-handbook.org
• Materials and exercise adapted from the Cochrane Trainer's Network
Any questions?
Exercise
JRC xxxxx – © European Union, 2013Disc laimer: The contents of this presentation are the views of the author and do not necessarily represent an offic ial position of the European C ommission.
11
Disc laimer: The contents of this presentation are the views of the author and do not necessarily represent an offic ial position of the European C ommission. © European Union, 2013
What can lower the evidence? (II)
Indirectness
Jesús López Alcalde
Public Health Policy Support Unit
Institute for Health and Consumer Protection
(JRC-IHCP)
Joint Research Centre
The European Commission’s
in-house science service
62 GRADE Workshop – Ispra– 11-12 December 2013
What can modify the evidence?
Identify thestudy design
Randomisedtrials
Observationalstudies
Initial quality of a body of
evidence
High ++++
Low ++
Lower if Higher ifFinal quality of a body of
evidence
High ++++
Moderate +++
Low ++
Very low +
Risk of Bias:-1 Serious
-2 Very serious
Indirectness:-1 Serious
-2 Very serious
Inconsistency-1 Serious
-2 Very serious
Imprecision-1 Serious
-2 Very serious
Publication bias-1 Likely
-2 Very likely
Large effect+1 Large
+2 Very large
Dose response+1 Evidence of
a gradient
All plausible residual confounding:
+1 would reduce a
demonstrated effect+1 would suggest a
spurious effect if no effect was observed
63 GRADE Workshop – Ispra– 11-12 December 2013
1. Indirect comparison
2. Indirect population, intervention or outcome
There are two types of indirectness:
64 GRADE Workshop – Ispra– 11-12 December 2013
Indirect comparison
A BversusThe comparison we aim to answer:
The comparisons we find: A
B
versus C
Cversus
Statin A
Statin BversusThe comparison we aim to answer:
The comparisons we find: Statin A
Statin B
versus Placebo
Placeboversus
65 GRADE Workshop – Ispra– 11-12 December 2013
1. Indirect comparison
2. Indirect population, intervention or outcome
There are two types of indirectness:
66 GRADE Workshop – Ispra– 11-12 December 2013
The PICO question being addressed by the guideline panel is different from
the available evidence regarding the population, intervention, or an
outcome
Indirect population, intervention, or outcome
12
Randomized controlled trials: low external validity
Women
Pediatrics
Foto obtained from Wikimedia CommonsFoto obtained from my camera 68 GRADE Workshop – Ispra– 11-12 December 2013
Please, consider "everyday patients", not "ideal patients"
66% of everyday depresive patientswould be excluded from RCts
69 GRADE Workshop – Ispra– 11-12 December 2013
Considering the importance of a surrogate outcome:
1st: Rate the importance of the patient-importantoutcome for which the surrogate is a substitute
2nd: Rate down the quality of evidence forindirectness of outcome
70 GRADE Workshop – Ispra– 11-12 December 2013
Quality of evidence may decrease when:
• Substantial differences exist between the P, the I, or the O measured in
the studies and those under consideration in a guideline.
• Head-to-head comparisons are lacking.
Key points
Any questions?
Exercise
JRC xxxxx – © European Union, 2013Disc laimer: The contents of this presentation are the views of the author and do not necessarily represent an offic ial position of the European C ommission.