70


First published in 2013 by Math Materials Access Improvement for Seventh and Eighth Grades (MMAISE), Salt Lake City, USA. Copyright © 2013, MMAISE. Some rights reserved. This work is published under the Creative Commons Attribution License (“CC BY”) which is available online at http://creativecommons.org/licenses/by/3.0/ and provides permissions for the reusing, revising, remixing, and redistributing of this work. This work is an open educational resource (OER).

7WB1 - 1
©2014 University of Utah Middle School Math Project in partnership with the Utah State Office of Education. Licensed under Creative Commons, cc-by.
Table of Contents CHAPTER 1: PROBABILITY, PERCENT, RATIONAL NUMBER EQUIVALENCE (3-‐4 WEEKS) ...................................... 2
1.0 Anchor Problem: Percent Estimation Game ....................................................................................................................................... 5 SECTION 1.1: INVESTIGATE CHANCE PROCESSES. DEVELOP/USE PROBABILITY MODELS. ....................................................................... 6 1.1a Class Activity: Using Data to Make Predictions (Probability) ................................................................................................. 8 1.1a Homework: Probability Predictions .................................................................................................................................................. 12 1.1b Class Activity: Probability—Race to the Top ................................................................................................................................. 14 1.1b Homework: Probability ........................................................................................................................................................................... 16 1.1c Class Activity: Probability Continued and Fair Game? .............................................................................................................. 18 1.1c Homework: Probability Continued ..................................................................................................................................................... 20 1.1d Self-‐Assessment: Section 1.1 ................................................................................................................................................................. 22
SECTION 1.2: UNDERSTAND/APPLY EQUIVALENCE IN RATIONAL NUMBER FORMS. CONVERT BETWEEN FORMS (FRACTION, DECIMAL, PERCENT). ............................................................................................................................................................................................ 25 1.2a Class Activity: “10 × 10 Grids” & Conversion .................................................................................................................................. 26 1.2a Homework: Converting Between Fractions, Decimals, and Percents ................................................................................. 29 1.2b Class Activity: Using Tangrams to Understand Fractions and Decimals .......................................................................... 32 1.2b Homework: Equivalent Fractions ..................................................................................................................................................... 34 1.2c Class Activity: Rational Number Ordering and Estimation ..................................................................................................... 36 1.2c Homework: Rational Number Ordering and Estimation ......................................................................................................... 39 1.2d Class Activity: Probability, Fractions, and Percentage ............................................................................................................. 41 1.2d Homework: Probability, Fractions, and Percentage .................................................................................................................. 45 1.2e Class Activity: Applications with Models, Multi-‐Step Problems ............................................................................................. 47 1.2e Homework: Rational Numbers with Models, Multi-‐Step Problems ..................................................................................... 49 1.2f Self-‐Assessment: Section 1.2 ................................................................................................................................................................... 51
SECTION 1.3: SOLVE PERCENT PROBLEMS INCLUDING DISCOUNTS, INTEREST, TAXES, TIPS, AND PERCENT INCREASE OR DECREASE. ............................................................................................................................................................................................................... 54 1.3a Class Activity: Model Percent and Fraction Problems ............................................................................................................... 55 1.3a Homework: Model Percent and Fraction Problems ................................................................................................................... 56 1.3b Class Activity: Percent and Fraction Problems Transition to Numeric Expressions .................................................... 59 1.3b Homework: Percent and Fraction Problems Transition to Numeric Expressions ........................................................ 61 1.3c Class Activity: Create a Context for Each Model or Numeric Representation ................................................................. 63 1.3c Homework: Create a Context for Each Model or Numeric Representation ...................................................................... 64 1.3d Self-‐Assessment: Section 1.3 ................................................................................................................................................................. 66

7WB1 - 2
©2014 University of Utah Middle School Math Project in partnership with the Utah State Office of Education. Licensed under Creative Commons, cc-by.
Chapter 1: Probability, Percent, Rational Number Equivalence (3-4 weeks) UTAH CORE Standard(s) Number Sense:
1. Convert a rational number to a decimal using long division; know that the decimal form of a rational number terminates in 0s or eventually repeats. 7.NS.2d
2. Solve real-world and mathematical problems involving the four operations with rational numbers. 7.NS.3
Probability and Statistics:
1. Understand that the probability of a chance event is a number between 0 and 1 that expresses the likelihood of the event occurring. Larger numbers indicate greater likelihood. A probability near 0 indicates an unlikely event, a probability around ½ indicates an event that is neither unlikely nor likely, and a probability near 1 indicates a likely event. 7.SP.5
2. Approximate the probability of a chance event by collecting data on the chance process that produces it
and observing its long-run relative frequency, and predict the approximate relative frequency given the probability. For example, when rolling a number cube 600 times, predict that a 3 or 6 would be rolled roughly 200 times, but probably not exactly 200 times. 7.SP.6
Equations and Expressions: 1. Solve multi-step real-life and mathematical problems posed with positive and negative rational numbers in
any form (whole numbers, fractions, and decimals), using tools strategically. Apply properties of operations to calculate with numbers in any form; convert between forms as appropriate; and assess the reasonableness of answers using mental computation and estimation strategies. For example: If a woman making $25 an hour gets a 10% raise, she will make an additional 1/10 of her salary an hour, or $2.50, for a new salary of $27.50. If you want to place a towel bar 9 3/4 inches long in the center of a door that is 27 1/2 inches wide, you will need to place the bar about 9 inches from each edge; this estimate can be used as a check on the exact computation. 7.EE.3
Chapter 1 Summary: Chapter 1 begins with a brief introduction to probability as a means of reviewing and applying arithmetic with whole numbers and fractions. In addition to covering basic counting techniques and listing outcomes in a sample space, students distinguish theoretical probabilities from experimental approaches to estimate probabilities. One reason for starting the year with probability activities is to develop a culture of thinking about mathematics as a way to investigation real world situations. A second reason is that activities at the beginning of the year can help foster a classroom culture of discussion and collaboration. Throughout the chapter students are provided with opportunities to review and build fluency with fractions, percents, and decimals from previous grades. Students should understand that fractions, percents and decimals are all relative to a whole. Students will also compare and order fractions (both positive and negative.) This chapter concludes with a section specifically about solving percent and fraction problems, including those involving discounts, interest, taxes, tips, and percent increase or decrease.

7WB1 - 3
©2014 University of Utah Middle School Math Project in partnership with the Utah State Office of Education. Licensed under Creative Commons, cc-by.
VOCABULARY: chance, decimal, experimental probability, fraction, frequency, outcome, percent, probability, ratio, theoretical probability CONNECTIONS TO CONTENT: Prior Knowledge In previous coursework, students developed the concept of a ratio. Though students should be familiar with the idea of part:whole and part:part relationships, they have likely not completely solidified it yet. It is important to emphasize that in this chapter only part:whole relationships are discussed (probability is a part:whole relationship as are fractions, decimals and percents.) In Chapter 4 students will practice differentiating between part:part and part:whole relationships and then examine “odds” which are part:part relationships. Students have used all four operations (addition, subtraction, multiplication, and division) when working with fractions and decimals in prior grades. They should have used both number line and bar/tape models to represent fractions, percents, and decimals. In 6th grade students placed both positive and negative numbers on a number line, however they do not operate with negative numbers until 7th grade (this will take place in Chapter 2). Future Knowledge As students move through this chapter, they will begin by studying probability (this chapter is only an introduction to probability, students will work more with probability in Chapter 7). The concepts learned in 7th grade regarding chance processes as well as theoretical and experimental probabilities will be extended in later courses when students study conditional probability, compound events, evaluate outcomes of decisions, use probabilities to make fair decisions, etc. While studying probability students will continue their study of rational numbers. They will convert rational numbers to decimals and percents and will look at their placement on the number line. This lays the foundation for 8th grade where students study irrational numbers to complete the Real Number system. Another important concept that will be extended is the notion of “unit.” Throughout the year students will: a) clearly distinguish between kinds of units (e.g. linear, square or cubic) and b) consider units of quantities. For example a “unit” of consideration might be a distance of 5 miles as in walking 5 miles per hour. So, if they want to know how far one walks in 20 minutes, 1/3 of an hour, then one simply divides the 5 mile unit into 3 parts. Thus in 20 minutes one has walked 5/3 miles.

7WB1 - 4
©2014 University of Utah Middle School Math Project in partnership with the Utah State Office of Education. Licensed under Creative Commons, cc-by.
MATHEMATICAL PRACTICE STANDARDS (emphasized):
Make sense of problems and persevere in solving them
Students explain and demonstrate rational number operations by using symbols, models, words, and real life contexts. Students demonstrate perseverance while using a variety of strategies (number lines, manipulatives, drawings, etc.). Students make sense of probability situations by creating visual models to represent situations.
Reason abstractly and quantitatively
Students connect ideas of models to ideas of numbers. For example, students should reason that one can partition a whole into any number n equal pieces and then represent a portion of the whole as m/n. The number m/n can then be located on the real line.
Construct viable arguments and
critique the reasoning of
others
Students construct arguments using verbal or written explanations accompanied by expressions, equations, inequalities, or models. Students discuss rules for operations with rational numbers using appropriate terminology and tools/visuals. Students approximate probabilities, create probability models and explain reasoning for their approximations. They also question each other about the representations they create to represent probabilities.
Model with mathematics
Students model understanding of rational number operations using tools such as tiles, counters, visuals, tape/bar models, and number lines and connect these models to solve problems involving real-world situations. Students model problem situations symbolically, graphically, and contextually. Students use experiments or simulations to create probability models.
Attend to precision
Students should use appropriate terminology when referring to ratios, probability models, rational numbers, and equations. Students also use appropriate forms of a number to fit a context, e.g. one would not say $3/2, rather they would say $1.50.
Look for and make use of
structure
Students look for structure in rational numbers when they place them appropriately on the number line. Students should connect the structure of fractions, percents, and decimals to the idea of part:whole relationships to missing finding values (e.g. students should use structure, not algorithms, to solve problems). Students recognize that probability can be represented in tables, visual models, or as a rational number.
Use appropriate tools strategically
Students demonstrate their ability to select and use the most appropriate tool (paper/pencil, manipulatives, pictorial models, and calculators) while solving problems with rational numbers. Students might use physical objects or applets to generate probability.
Look for and express regularity
in repeated reasoning
Students use repeated reasoning to understand algorithms and make generalizations about patterns. They extend their thinking to include complex fractions and rational numbers. They create, explain, evaluate, and modify probability models to describe simple events.

7WB1 - 5
©2014 University of Utah Middle School Math Project in partnership with the Utah State Office of Education. Licensed under Creative Commons, cc-by.
1.0 Anchor Problem: Percent Estimation Game Below are two vertical lines on which you will make a guess for both a number and a percent. 2) You and five of your friends like to go to McDonalds once a week and get Happy Meals for the prize inside. McDonalds has just started a new “dinosaur toy” promotion for their Happy Meals with six different dinosaurs you can collect: Brachiosaurus, Brontosaurus, Diplodocus, Tyrannosaurus, Plesiosaurus, and Allosaurus. You each want to collect at least one of all six dinosaurs, but the prizes are randomly placed in Happy Meals, and there is no way to know which dinosaur you’re getting until you open the Happy Meal bag. How might you design a simulation experiment to find the likelihood (experimental probability) of getting all six toys after one, two, three, etc. weeks?
Estimate the numeric location of the point on the vertical line on the right.__________ Estimate its equivalent percent of 80 using the line on the left. _____________

7WB1 - 6
©2014 University of Utah Middle School Math Project in partnership with the Utah State Office of Education. Licensed under Creative Commons, cc-by.
Section 1.1: Investigate Chance Processes. Develop/Use Probability Models. Section Overview: This is students’ first formal introduction to probability. In this section students will study chance processes, which concern experiments or situations where they know which outcomes are possible, but they do not know precisely which outcome will occur at a given time. They will look at probabilities as part:whole ratios expressed as fractions, decimals, or percents. Probabilities will be determined by considering the results or outcomes of experiments. Students will learn that the set of all possible outcomes for an experiment is a sample space. They will recognize that the probability of any single event can be expressed in terms of impossible, unlikely, equally likely, likely, or certain or as a number between 0 and 1, inclusive. Students will focus on two concepts in probability of an event: experimental and theoretical. They will understand the commonalities and differences between experimental and theoretical probability in given situations. Concepts and Skills to be Mastered (from standards) 1. Understand and apply likelihood of a chance event as between 0 and 1. 2. Approximate probability by collecting data on a chance process (experimental probability). 3. Calculate theoretical probabilities on a chance process for simple events. 4. Given the probabilities (different scenarios in a chance process), predict the approximate frequencies for
those scenarios (if experimenting on a chance process). 5. Use appropriate fractions, decimals and percents to express the probabilities.

7WB1 - 7
©2014 University of Utah Middle School Math Project in partnership with the Utah State Office of Education. Licensed under Creative Commons, cc-by.
REVIEW FROM EARLIER GRADES:
1 = 1.0 = 100%
12= 0.5 = 50%
14= 0.25 = 25%
13= 0.33 = 33
13% 𝑜𝑟 33. 3%
15= 0.2 = 20%
110
= 0.1 = 10% 1. Use a bar model to represent 3/4 of a whole. 2. Use a bar model to represent 3/5 of a whole.
3. Use a bar model to represent 3/10 of a whole.
4. What do you notice about the fractions in #1-3?

7WB1 - 8
©2014 University of Utah Middle School Math Project in partnership with the Utah State Office of Education. Licensed under Creative Commons, cc-by.
1.1a Class Activity: Using Data to Make Predictions (Probability)
1. In your own words, what do you think these terms mean? “Experimental” probability: “Theoretical” probability: HOW MANY GREEN TILES ARE IN YOUR BAG? We will examine experimental and theoretical probability in this activity. You have been given a bag with a total of 12 tiles, some are green and the rest are blue. You will do the experiment described below 6, 12, 18, 24 and then 30 times to try to figure out how many green tiles are in your bag. DO NOT LOOK IN YOUR BAG! Each group has a different number of green tiles in their bag. Instructions: a) without looking in the bag, draw ONE tile record the color (G or B) in the table, b) put the tile back into the bag and shake it to mix up the tiles, c) repeat the indicated number of trials (notice that there are a – e experiments), d) based on each experiment guess how many GREEN tiles are in the bag. 2. a. Draw a marble/tile (without looking in the bag), record the color, replace it, mix them by shaking,
redraw, record, replace. Do this 6 times.
Based on your experiment, how many of the 6 draws were GREEN? ________ Based on these 6 draws, how many of the 12 marbles/tiles in the bag do you think are green? _____
b. Repeat the experiment in “a” but now do it 12 times.
Based on your experiment, how many of the 12 draws were GREEN? ________ Based on these 12 draws, how many of the 12 marbles/tiles in the bag do you think are green? _____
c. Repeat the experiment in “a” but now do it 18 times.
Based on your experiment, how many of the 18 draws were GREEN? ________ Based on these 18 draws, how many of the 12 marbles/tiles in the bag do you think are green? _____
d. Repeat the experiment in “a” but now do it 24 times.
Based on your experiment, how many of the 24 draws were GREEN? ________ Based on these 24 draws, how many of the 12 marbles/tiles in the bag do you think are green? _____
e. Repeat the experiment in “a” but now do it 30 times.
Based on your experiment, how many of the 30 draws were GREEN? ________ Based on these 30 draws, how many of the 12 marbles/tiles in the bag do you think are green? _____
Draw # 1 2 3 4 5 6 Color
Draw # Color
Draw # Color Draw # Color
Draw # Color
Draw # Color Draw # Color

7WB1 - 9
©2014 University of Utah Middle School Math Project in partnership with the Utah State Office of Education. Licensed under Creative Commons, cc-by.
Probability has standard notation. We write P(G) to means the probability of drawing a green tile. To write P(G) we need to know the “observed frequency” and the “total number of trials.” Probability is the ratio of the observed frequency to the total number of trials:
Note: probability is a part:whole relationship. Write your group’s P(G) as both a fraction and decimal for each of the experiments you did on the previous page. a. P(G) = __________ __________ b. P(G) = __________ __________ c. P(G) = __________ __________ d. P(G) = __________ __________ e. P(G) = __________ __________
3. Make a graph of your group’s samplings.
P(G) = observed frequencytotal number of trials
Sampling P(G)
Prob
abili
ty o
f Gre
en
Number of DRAWS

7WB1 - 10
©2014 University of Utah Middle School Math Project in partnership with the Utah State Office of Education. Licensed under Creative Commons, cc-by.
4. Explain what your graph shows about the probability of GREEN tiles. 5. Explain why your probability of GREEN tiles is a fraction (between 0 and 1).
6. How does knowing the probability of GREEN tiles help you know the probability of BLUE tiles?
7. Make a conjecture about how many GREEN tiles are in your bag if the bag contains 12 total tiles. 8. Count how many blue and green marbles/tiles are actually in your bag. Based on this information, what is
the “theoretical” probability of drawing a green tile from your bag?
9. How did your group’s “experimental” P(G) compare with the “theoretical” P(G)?
10. In your own words, what do you think: “Experimental” probability means?
“Theoretical” probability means?

7WB1 - 11
©2014 University of Utah Middle School Math Project in partnership with the Utah State Office of Education. Licensed under Creative Commons, cc-by.
11. Place the theoretical probability of drawing a green for each group in the class on the number line below.
12. Which groups are most and least likely to have an outcome of drawing a green out of the bag? Justify your answer.
As groups discuss:
13. Suppose you had a bag of 1000 blue and green tiles, how many times do you think you would need to draw
tiles to make an accurate prediction of the number of blue and green tiles are actually in the bag? Explain.
14. You’re a teacher in a 7th grade math class and you want to create an experiment for your class with red,
yellow and purple marbles in a bag. You want the theoretical probability of drawing a red marble to be ,
the theoretical probability of drawing a yellow to be and the theoretical probability of drawing a purple to
also be . If you want a total of 120 marbles in the bag:
a. How many red marbles should you put in the bag? __________ b. How many yellow marbles should you put in the bag? __________ c. How many purple marbles should you put in the bag? __________
Review exercises: 15. Without using a calculator, determine which fraction is larger. Justify your answer with an explanation and
model.
a. ___ b. ___ c. ____ d. ____
14
14
12
18
19
78
89
815
817
921
1322

7WB1 - 12
©2014 University of Utah Middle School Math Project in partnership with the Utah State Office of Education. Licensed under Creative Commons, cc-by.
1.1a Homework: Probability Predictions
1. You flipped a coin 50 times and got 23 heads. What is the experimental probability of getting a head? Write your answer as a fraction, decimal and percent.
2. If you flipped the coin 100 times, how many heads would you expect to get? Explain your answer.
3. A coin is tossed 20 times. It lands on heads 9 times. What is P(H) according to your experiment? Write your
answer as a fraction, decimal and percent.
4. You’re a teacher in a 7th grade math class and you want to create an experiment for your class with red, yellow and purple marbles in a bag. You want the theoretical probability of drawing a red marble to be !
!,
the theoretical probability of drawing a yellow to be !!, and the theoretical probability of drawing a purple to
also be !!. If you want a total of 1260 marbles in the bag:
a. How many red marbles are you going to put in the bag? Why?
b. How many yellow marbles are you going to put in the bag? Why?
c. How many purple marbles are you going to put in the bag? Why?’
4. Challenge: You’ve decided you want to make the marble experiment a little more difficult. You want to use 400 marbles and you want six different colors—blue, red, green, yellow, purple, and pink. You also do not want more than two colors to have the same probability. State the number of each color you are going to put in the bag and what the theoretical probability of drawing the color will be (answers will vary.) a. Blue: P(B)_______ and actual number of blue ___________
b. Red: P(R)________ and actual number of red ____________
c. Green: P(G)________ and actual number of green ____________
d. Yellow: P(Y)________ and actual number of yellow ___________
e. Purple: P(Purple)________ and actual number of purple _____________
f. Pink: P(Pink)__________ and actual number of pink _____________

7WB1 - 13
©2014 University of Utah Middle School Math Project in partnership with the Utah State Office of Education. Licensed under Creative Commons, cc-by.
Answer the following: 5. Without using a calculator, determine which fraction is bigger in each pair. Justify your answer with picture
and words.
a. or
b. or
6. Place the fractions on the number line below. 12 ,
35 ,
13 ,
25
7. Order the following fractions from least to greatest.
12 ,
35 ,
13 ,
25
Spiral Review 1. Use a bar model to represent ¾ of a whole.
2. Solve using bar model
13
12
37
35
12+37= ______

7WB1 - 14
©2014 University of Utah Middle School Math Project in partnership with the Utah State Office of Education. Licensed under Creative Commons, cc-by.
1.1b Class Activity: Probability—Race to the Top 1. For the horse race experiment you will need two dice. For each roll of the dice record the sum in the
appropriate column below by shading in the box. For example, a roll of 2,5 means you will shade one box in the 7 column, a roll of 1,4 means you will shade one box in the 5 column. Do this 30 times. BEFORE you start, predict which horse will win (2 through 12).
2 3 4 5 6 7 8 9 10 11 12 2. Which horse won (had the most rolls) in your group?______
3. List your group’s experimental probability for each outcome:
a. P(2)________ b. P(3)________ c. P(4)________ d. P(5)________
e. P(6)________ f. P(7)________ g. P(8)________ h. P(9)________
i. P(10)_______ j. P(11)_______ k. P(12)_______
4. List the horse that won for each of the groups in your class. Which horse won the most often?
5. Create a class histogram that combines the data from all of the groups’ histograms. What do you notice
about the histogram?
2 3 4 5 6 7 8 9 10 11 12

7WB1 - 15
©2014 University of Utah Middle School Math Project in partnership with the Utah State Office of Education. Licensed under Creative Commons, cc-by.
6. Which horse won the most often for all the groups? Why?
7. Do you think that this game is fair? Why or why not?
9. What are all the possible outcomes when you roll two dice? In your group, organize these possible outcomes on a chart of your choosing.
10. How many total outcomes did you get? Explain the system you used to get all those outcomes. 11. Use the above information to determine the probability for each outcome:
P(1)___________
P(2)__________
P(3)__________
P(4)___________
P(5)___________
P(6)____________
P(7)____________
P(8)___ ________
P(9)___ _________
P(10)____________
P(11)_____________
P(12)________ _____
12. How do you think the individual probabilities relate to the probabilities of the sums? For example,
P(1, 6) = but P(7) = , why is this true?
136
16

7WB1 - 16
©2014 University of Utah Middle School Math Project in partnership with the Utah State Office of Education. Licensed under Creative Commons, cc-by.
1.1b Homework: Probability Write all probabilities as a fraction, decimal and percent. 1. Find all the possible outcomes of flipping a coin (heads or tails) FOUR times. In other words, how many
different ways are there to get heads and/or tails in four flips? 2. Based on #1, what is the theoretical probability that you:
a. Get HEADS for all four flips?
b. Get HEADS at least once in four flips?
c. Get HEADS exactly three times in four flips?
3. Without using a calculator, determine which fraction is bigger in each pair. Justify your answer.
a. or
b. or
37
38
713
920

7WB1 - 17
©2014 University of Utah Middle School Math Project in partnership with the Utah State Office of Education. Licensed under Creative Commons, cc-by.
4. Place the fractions on the number line below. 65 ,
310 ,
15 ,
32
5. Order the following fractions from least to greatest.
65 ,
310 ,
15 ,
32
Spiral Review
1. Write !! as a percent.
2. What is the area of the following figure?
3. Write one fourth as a fraction, decimal, and percent.
4 in.
7 in.

7WB1 - 18
©2014 University of Utah Middle School Math Project in partnership with the Utah State Office of Education. Licensed under Creative Commons, cc-by.
1.1c Class Activity: Probability Continued and Fair Game? Use the data from problem 1 on Homework 1.1.b to answer the following:
1. What is the probability of getting exactly one HEAD on the first flip? ___________
2. What is the probability of getting one HEAD on the first and second flips? ____________
3. What is the probability of getting one HEAD on the first, second and third flips? ____________
4. What is the probability of getting one HEAD on all four flips? ____________
5. What pattern do you see emerging?
6. After two flips of the coin, what is the probability of getting at least one HEAD? ______
7. After three flips of the coin, what is the probability of getting at least one HEAD? ______
8. After four flips of the coin, what is the probability of getting at least one HEAD? ______
9. What do you notice about the probabilities in questions 6-8?
10. Explain why the numerator is always one less than the denominator when finding the probability for at least
one HEAD.

7WB1 - 19
©2014 University of Utah Middle School Math Project in partnership with the Utah State Office of Education. Licensed under Creative Commons, cc-by.
Fair Games: Games 1 and 2: Use two dice OR an electronic random number generator on a calculator (on the TI-73 go to Math, PRB, dice, enter, type in 2 for two dice, then hit enter to roll the dice.) Play the game in pairs. One person will be “even” the other will be “odd”. For the “Addition Game” the “even” person earns a point if the sum of the two dice is even and the “odd” person earns a point if the sum is odd. For the “Multiplication Game” the “even” person gets a point if the product of the dice is even and the “odd” person gets a point if the product is odd. Game 1: The Addition Game 1. Do you think the Addition Game will be fair—do “odd” and “even” have the same chance at winning?
Explain. 2. Play the game—36 rolls of the dice. Based on your data, what is the experimental probability of rolling an
odd sum? Probability of rolling an even sum? P(odd) = ________ P(even) = ________
3. Look back at the data you gathered from the probability experiment in 1.1b Class Activity (Race to the Top
game). What was the theoretical probability of rolling an odd sum or even sum from that data? P(odd) = ____________ P(even) = ____________
4. Do you think the addition game is a fair game? Explain.
Game 2: The Multiplication Game 1. Do you think the multiplication game will be fair—do “odd” and “even” have the same chance at winning?
Explain. 2. Play the game—36 rolls of the dice. Based on your data, what is the experimental probability of rolling an
odd product? Probability of rolling an even product? P(odd) = ________ P(even) = ________
3. How will the sample space for the multiplication game be the same and/or different from the addition game?
4. Find the theoretical probability of rolling an odd product and even product?
P(odd) = ____________ P(even) = ____________
5. Do you think the multiplication game is a fair game? Explain why or why not.

7WB1 - 20
©2014 University of Utah Middle School Math Project in partnership with the Utah State Office of Education. Licensed under Creative Commons, cc-by.
1.1c Homework: Probability Continued
Write all probabilities as fractions, decimals and percents. 1. Without using a calculator, for each pair, determine which fraction is bigger. Justify your answer.
a. or
b. or
c. or
d. or
2. A bag of marbles contains 3 red marbles, 5 blue marbles, and 2 yellow marbles.
a. What is P(red)?
b. What is P(blue)?
c. What is P(yellow)?
d. What is the most likely outcome when drawing a marble out of the bag? Explain.
e. What is the least likely outcome when drawing a marble out of the bag? Explain.
f. Have you been computing theoretical or experimental probabilities? Explain.
3. A spinner contains three letters of the alphabet.
a. How many outcomes are possible if the spinner is spun three times?
b. List all of the outcomes for spinning three times.
c. What is the probability of getting exactly one H in three spins?
19
110
89
910
59
511
512
514

7WB1 - 21
©2014 University of Utah Middle School Math Project in partnership with the Utah State Office of Education. Licensed under Creative Commons, cc-by.
d. What is the probability of getting two V’s on three spins?
e. What is the probability of getting three K’s on three spins?
f. What outcome(s) is/are most likely for three spins?
g. What is the probability of getting a constant in three spins?
4. Place the fractions on the number line below. 23 ,
310 ,
12 ,
32 ,
43
5. Order the following fractions from least to greatest. Spiral Review 1. Model 𝟓
𝟗
2. Use a number line to solve 24 – 7.
3. Simplify:
!!+ !
! Draw a model if necessary.
1 2 3 4 5 6 7 8 9 10 11 12 13 14 15 16 17 18 19 20 21 22 23 24 25 26 27 28 29 30 0
1 2 3 4 5 6 7 8 9 10 11 12 13 14 15 16 17 18 19 20 21 22 23 24 25 26 27 28 29 30 0

7WB1 - 22
©2014 University of Utah Middle School Math Project in partnership with the Utah State Office of Education. Licensed under Creative Commons, cc-by.
1.1d Self-Assessment: Section 1.1
Consider the following skills/concepts. Rate your comfort level with each skill/concept by checking the box that best describes your progress in mastering each skill/concept. Corresponding sample problems, referenced in brackets, can be found on the following page.
Skill/Concept Beginning Understanding
Developing Skill and
Understanding
Practical Skill and Understanding
Deep Understanding, Skill Mastery
1. Understand and apply likelihood of a chance event as between 0 and 1. [1a, 2a]
I’m not sure how to express a probability.
I know a probability is expressed as the relationship between possible outcomes and total outcomes, but I’m not sure how exactly to write that number.
I know that a probability is expressed as the quotient between possible outcomes and total outcomes, but I struggle with transitioning between fraction, decimal and percent forms.
I can easily express the probability of an event as a decimal, fraction, and percent.
2. Approximate probability by collecting data on a chance process (experimental probability).
I don’t understand how to collect and record data in a probability experiment.
I can collect data on a chance process, but I don’t know how to use that data to calculate experimental probability.
I can collect data on a chance process and calculate experimental probability using the data. However, I have a hard time explaining how the data relates to the theoretical probability of the event.
I can collect data on a chance process and calculate the experimental probability using the data. I can also explain how the experimental probability is different from theoretical probability.
3. Calculate theoretical probabilities on a chance process for simple events. [2a]
I don’t understand the difference between a theoretical probability and an experimental probability so I’m not sure how to find it.
I can calculate theoretical probabilities for simple events like those in Problem 2a. However, I have a hard time explaining how to find it or why a theoretical probability isn’t always the same as the experimental probability.
I can calculate theoretical probabilities for simple events like those in Problem 2a. However I sometimes struggle with either explaining how to find it and/or why an experimental probability may not have the same result as the theoretical probability.
I can calculate theoretical probabilities for simple events as in Problem 2a. I can easily explain why the process works and why a theoretical probability may not be the same as the experimental probability.
4. Given the theoretical probabilities of a chance event, predict the approximate frequencies for a given number of trials in an experiment of the event. [3a, 3b]
I don’t understand how a theoretical probability helps me predict the approximate frequencies of an experiment.
When given a theoretical probability, I know the process for predicting the frequency of a scenario such as Problem 3a on the following page, but sometimes I struggle.
When given a theoretical probability, I know the process for predicting the frequency of a scenario such as Problem 3a on the following page and can usually find an approximation for the frequencies.
When given a theoretical probability, I know and can explain the process for predicting the frequency of a scenario such as Problem 3a on the following page.
5. Use appropriate fractions, decimals and percents to express the probabilities. [1a, 2a]
Sometimes I can express probabilities as either a fraction, decimal, or percent, but not all three.
I can express probabilities as two of the following: fraction, decimal, or percent.
I can express probabilities as a fraction, decimal, and percent.
I can express and understand probabilities as a fraction, decimal, and percent. I can also explain when each is most appropriate.
7WB1 - 23
©2014 University of Utah Middle School Math Project in partnership with the Utah State Office of Education. Licensed under Creative Commons, cc-by.
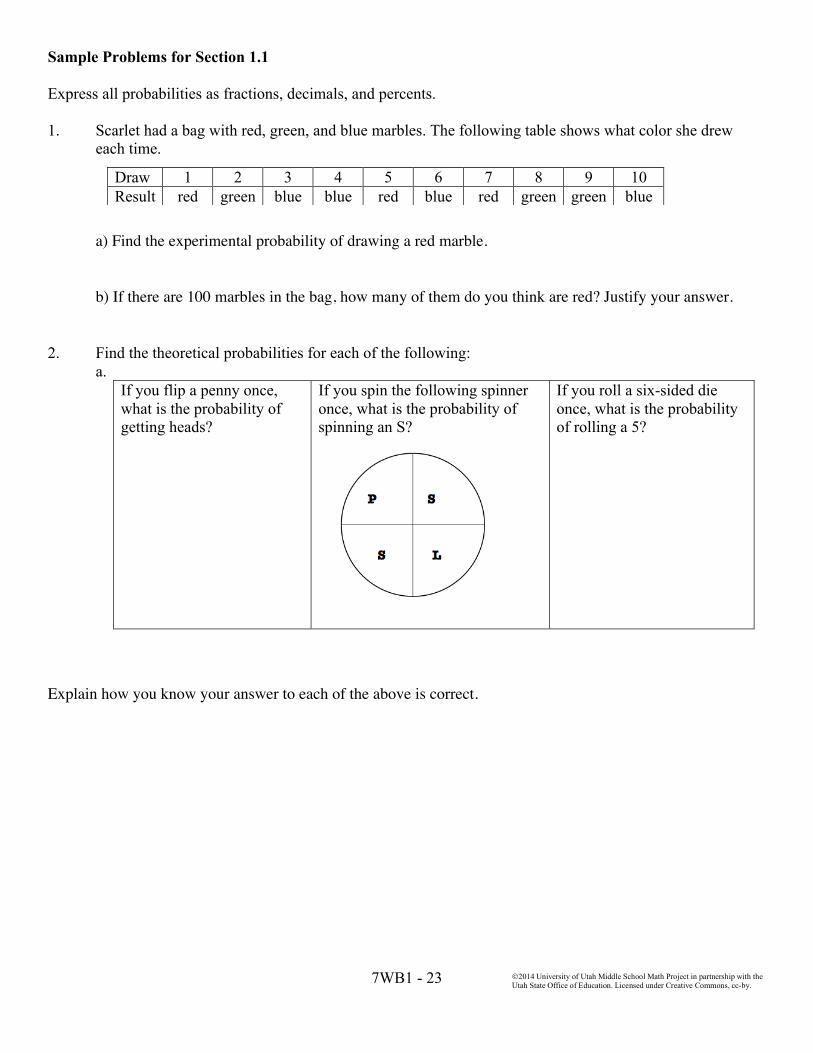
Sample Problems for Section 1.1 Express all probabilities as fractions, decimals, and percents. 1. Scarlet had a bag with red, green, and blue marbles. The following table shows what color she drew
each time.
a) Find the experimental probability of drawing a red marble.
b) If there are 100 marbles in the bag, how many of them do you think are red? Justify your answer. 2. Find the theoretical probabilities for each of the following:
a. If you flip a penny once, what is the probability of getting heads?
If you spin the following spinner once, what is the probability of spinning an S?
If you roll a six-sided die once, what is the probability of rolling a 5?
Explain how you know your answer to each of the above is correct.
Draw 1 2 3 4 5 6 7 8 9 10 Result red green blue blue red blue red green green blue

7WB1 - 24
©2014 University of Utah Middle School Math Project in partnership with the Utah State Office of Education. Licensed under Creative Commons, cc-by.
b. If you flip a penny three times, what is the probability of getting heads for all three flips?
If you spin the following spinner twice, what is the probability of spinning a P and an S in any order?
If you roll a six-sided die twice, what is the probability of rolling a 5 (on either roll)?
Explain how you know your answer to each of the above is correct.
3. Tommy has 30 marbles in a bag. If are blue, are red, and are yellow and he draws out a marble,
records the color, returns it to the bag and repeats the process 10 times, a) approximately how many times should he expect to draw a blue marble?
b) Suppose Tommy did the same experiment 1000 times, approximately how many times would Tommy expect to draw a blue marble? c) Which of the two approximations is likely to be the most accurate? Justify your answer.
12
13
16

7WB1 - 25
©2014 University of Utah Middle School Math Project in partnership with the Utah State Office of Education. Licensed under Creative Commons, cc-by.
Section 1.2: Understand/Apply Equivalence in Rational Number Forms. Convert Between Forms (Fraction, Decimal, Percent). Section Overview: In this section students solidify and practice rational number sense through the careful review of fractions, decimals and percents in this section. The two key objectives of this section are: a) students should be confidently able to articulate with words, models and symbols the relationship among equivalent fractions, decimals, and percents and b) students should understand and use models to find portions of different wholes. The concept of equivalent fractions naturally leads students to the issues of ordering and estimation. Students will represent order of fractions on the real number line. It is important that students develop estimation skills in conjunction with both ordering and operating on positive and negative rational numbers. Lastly, students look at percent as being a fraction with a denominator of 100. Percent and fraction contexts in this section should be approached intuitively with models. In section 1.3 students will begin to transition to writing numeric expressions. Concepts and Skills to be Mastered (from standards) 1. Express probability using appropriate fractions, decimals, and percents. 2. Express and convert between rational numbers in different forms. 3. Draw models to show equivalence among fractions and rational numbers. 4. Compare rational numbers in different forms. 5. Find the percent of a quantity using a model. 6. Solve problems with rational numbers using models.

7WB1 - 26
©2014 University of Utah Middle School Math Project in partnership with the Utah State Office of Education. Licensed under Creative Commons, cc-by.
1.2a Class Activity: “10 × 10 Grids” & Conversion
Write the equivalent values for the following parts of a candy bar.
The bar on the left is divided into two parts. 1 part = (fraction) = ____ (decimal) = _____(percent) 2 parts = ____(fraction) = _____(decimal) =_____(percent)
The bar on the left is divided into three parts.
1 part = (fraction) = ____ (decimal) = _____(percent) 2 parts = ____(fraction) = ____(decimal) =_____(percent)
The bar on the left is divided into four parts.
1 part = (fraction) = ____ (decimal) = _____(percent) 2 parts = ____(fraction) = ____(decimal) =_____(percent) 3 parts = ____(fraction) = ____(decimal) =_____(percent)
The bar on the left is divided into five parts.
1 part = (fraction) = ____ (decimal) = _____(percent) 3 parts = ____(fraction) = _____(decimal) =_____(percent)
The bar on the left is divided into ten parts.
3 parts = ____(fraction) = _____(decimal) =_____(percent) 8 parts = ____(fraction) = _____(decimal) =_____(percent)
The bar on the left is divided into six parts. 1 part = ____(fraction) = _____(decimal) =_____(percent) 2 parts = ____(fraction) = ____(decimal) =_____(percent) 4 parts = ____(fraction) = _____(decimal) =_____(percent
The bar on the left is divided into eight parts.
2 parts = ____(fraction) = _____(decimal) =_____(percent 7 parts = ____(fraction) = _____(decimal) =_____(percent

7WB1 - 27
©2014 University of Utah Middle School Math Project in partnership with the Utah State Office of Education. Licensed under Creative Commons, cc-by.
1. To the left is a 10 × 10 Grid. Why do you think it is called a 10 × 10 grid?
2. Use the grid to show the fraction . Explain why this model is correct.
3. What fraction is shown in this 10 × 10 grid? Explain
4. What is the decimal equivalent for this fraction?
5. What fraction is shown in this 10 × 10 grid?
6. What is the decimal equivalent for this fraction?
7. Shade the given decimal in each grid below: a. 0.27
b. 0.35
c. 0.4
d. 0.125
8. Write the fraction equivalent for each decimal in #7 (above), in simplest form, here.
a. __________ b. __________ c. _________ d. _____________
6100

7WB1 - 28
©2014 University of Utah Middle School Math Project in partnership with the Utah State Office of Education. Licensed under Creative Commons, cc-by.
9. Shade the fractional part of each grid. Then write the fraction as a decimal and a percent.
a.
decimal: ____________ percent: ____________
b.
decimal: ____________ percent: ____________
c.
decimal: ____________ percent: ____________
d.
decimal: ____________ percent: ____________
e.
decimal: ____________ percent: ____________
f.
decimal: ____________ percent: ____________
g.
decimal: ____________ percent: ____________
h.
decimal: ____________ percent: ____________
10. Use long division to show how you can convert each fraction to a decimal and then a percent. Then use
equivalent fractions to do the same.
a. b. c. d. e. f. g. h.
12
14
110
15
1100
18
13
19
12
14
110
15
1100
18
13
19
0.52 1.0

7WB1 - 29
©2014 University of Utah Middle School Math Project in partnership with the Utah State Office of Education. Licensed under Creative Commons, cc-by.
1.2a Homework: Converting Between Fractions, Decimals, and Percents
1. Fill in the boxes below to show how you can convert between fractions, decimals, and percentages.
Show how to use the steps you described above to complete the following problems. 2. Write 45% as a fraction.
3. Write as a decimal.
4. Write as a decimal.
5. Write 0.45 as a percent. 6. Write 1 as a percent.
35
19
How can you write a fraction as a decimal? .
How can you write a decimal as a percent?
How can you write a percent as a fraction?

7WB1 - 30
©2014 University of Utah Middle School Math Project in partnership with the Utah State Office of Education. Licensed under Creative Commons, cc-by.
Fill in each blank with the equivalent fraction, decimal or percent. Use bar notation for repeated decimals.
Fraction Decimal Percent 7.
8.
9. 0.42
10. 0.8
11. 32%
12.
13. 21%
14. 0.06
15. 7%
16.
17. 0.99
18. 80%
19.
20. 20%
21.
22. 1.5
23. 250 %
24. 3.0
25.
26.
610425
920
18
14
615
81123
Show your work over here!

7WB1 - 31
©2014 University of Utah Middle School Math Project in partnership with the Utah State Office of Education. Licensed under Creative Commons, cc-by.
Spiral Review
1. Order the following fractions from least to greatest.
12 ,
45 ,
13 ,
25
2. Write three-fourth as a fraction, decimal, and percent.
3. Place each fraction on the number line below 𝟔𝟓, 𝟑𝟏𝟎, 𝟏𝟓, 𝟑
𝟐
4. Without using a calculator, determine which fraction is bigger in the pair. Justify your answer.
or
37
38

7WB1 - 32
©2014 University of Utah Middle School Math Project in partnership with the Utah State Office of Education. Licensed under Creative Commons, cc-by.
1.2b Class Activity: Using Tangrams to Understand Fractions and Decimals
Below is a square created out of tangrams.
1. With a partner, take two different colored tangram sets and recreate the square shown above.
2. Using your different colored shapes, compare the small, medium, and large triangles to each other. How do
they compare in size? 3. Now look at the small square and parallelogram. What do you observe? 4. Complete each equation. Find as many solutions as possible. The first one is started for you.
a. one small square =
one small square = 2 small triangles one small square = of the large triangle
b. one large triangle=
12

7WB1 - 33
©2014 University of Utah Middle School Math Project in partnership with the Utah State Office of Education. Licensed under Creative Commons, cc-by.
c. one parallelogram =
d. one medium triangle =
5. Find the value of each shape relative to the entire square. Remember the square represents 1 whole. Record
your findings in the table below.
Name of Shape Fraction Decimal Percent
Large triangle Medium triangle
Small triangle
Small Square
Parallelogram
Reduce/simplify each fraction. Draw a model to show the equivalence between the original fraction and the reduced one:
6. 7.
8.
Find an equivalent fraction for each. Draw a model to show the equivalence between the original fraction and the new one.
9.
10. =
11.
Change each to a mixed number. Draw a bar model to show the equivalence between the original fraction and the new one.
12. 13. 14.
410
= 1218
= 412
=
1 ?3 9= 3
718?
4 ?5 25=
75= 25
3= 18
4=

7WB1 - 34
©2014 University of Utah Middle School Math Project in partnership with the Utah State Office of Education. Licensed under Creative Commons, cc-by.
1.2b Homework: Equivalent Fractions
1. Simplify each fraction. Draw a model for questions “a” and “b” to show equivalent fractions.
a.
b.
c.
d. e. f.
2. Write an equivalent fraction. Draw a bar model for questions “a” and “b” to show the equivalent fractions.
a.
b.
c.
d.
e.
f.
3. Change each fraction to a mixed number. Draw a bar model for questions “a” and “d”.
a.
b. c.
d. e. f.
46= 3
9= 10
18=
1421
= 921
= 735
=
12 6= 2
5 15= 2
3 15=
47 14= 5
8 24= 3
4 24=
103= 29
4= 25
9=
2512
= 207
= 195
=

7WB1 - 35
©2014 University of Utah Middle School Math Project in partnership with the Utah State Office of Education. Licensed under Creative Commons, cc-by.
Spiral Review 1. Write !
! as a decimal and percent.
2. Write this model in fraction form then simplify.
Use long division to show how you can convert this fraction to a decimal and then a percent
a) !!
b) !!
23

7WB1 - 36
©2014 University of Utah Middle School Math Project in partnership with the Utah State Office of Education. Licensed under Creative Commons, cc-by.
1.2c Class Activity: Rational Number Ordering and Estimation
1. Plot each fraction on the number line below.
a. b.
c. Compare the fractions using <, >, or =.
____ _____ _____ _____
d. What differences do you observe when comparing the fractions in part c?
e. How does the number line help you determine which number is larger?
2. Classify these fractions as close to 0, close to , or close to 1.
Close to 0
Close to
Close to 1
3. Order the fractions from least to greatest. Fractions: ______, ______, ______, ______, ______, ______, ______, ______, ______
1 1 3 2, , ,2 3 4 5
1 1 3 2, , ,2 3 4 5
− − − −
12
13
12
− 13
− 25
34
25
− 34
−
12
1 1 5 5 7 1 5 3 1, , , , , , , ,2 9 8 6 8 5 9 8 7
12

7WB1 - 37
©2014 University of Utah Middle School Math Project in partnership with the Utah State Office of Education. Licensed under Creative Commons, cc-by.
4. Classify these fractions as close to 0, close to , close to −1.
Close to 0
Close to
Close to
5. Order the above numbers from least to greatest.
Fractions: ______, ______, ______, ______, ______, ______, ______, ______
Now approximate their location on the number line below:
6. Approximate where each value is located on the number line below. State a “common” fraction and decimal you can use to help you find the approximate location for each. The first one is done for you.
a. 0.32 ≈ 0.333 ≈ !! b. 0.67 c. 0.76 d. 0.98
e. −0.24 f. 2.32 g. −3.38 h. 1.76
Plot each fraction on the number line. Fill in the blank using < , > , or = .
7. _____
8. ____
12
−
1 4 3 2 5 2 4 7, , , , , , ,2 28 5 7 14 11 5 9
− − − − − − − −
1-2
1−
3410
247
3410
− 247
−

7WB1 - 38
©2014 University of Utah Middle School Math Project in partnership with the Utah State Office of Education. Licensed under Creative Commons, cc-by.
Plot each fraction on the number line. Fill in the blank with < , > , or = . How do you know your answer is correct? Justify your answer.
9. 0.14
Justification:
10. −2.15 −2.13
Justification:
11. 0.15
Justification:
12. 2.6
Justification:
13. −0.3
Justification:
14. Is 0.74 to the left or right of ? Explain.
15. Is 1.26 to the left or right of ? Explain.
16. Give a fraction and decimal approximation of .
17. Give a fraction and decimal approximation of .
0.14
320
223
13
−
34
114
71102
923

7WB1 - 39
©2014 University of Utah Middle School Math Project in partnership with the Utah State Office of Education. Licensed under Creative Commons, cc-by.
1.2c Homework: Rational Number Ordering and Estimation
ESTIMATE each of the following. Justify your answer with either words or a model. Indicate if your estimate is larger or smaller than the exact answer. Fraction ≈ Decimal ≈ Percent Justification 1.
2.
3. 8999
4.
5.
Fill in the blank with < , > , or = . Justify each with a picture or number-line or explanation.
6. 1.2 Justification:
7. −1.2 Justification:
8. −2.34 Justification:
1121
1627
1317
523
4125
4125
−
4211
−

7WB1 - 40
©2014 University of Utah Middle School Math Project in partnership with the Utah State Office of Education. Licensed under Creative Commons, cc-by.
9. Justification:
10. Justification:
11. −3.94 Justification:
12. Order the following set of numbers from least to greatest:
13. Order the following set of numbers from least to greatest:
14. Plot each rational number on the number line. Write them in order from least to greatest:
Spiral Review Change each fraction to a mixed number. Draw a bar model for each. 1.
𝟕𝟑
2. !!!
3. Compare these two fractions: 𝟔
𝟏𝟐 𝟖
𝟏𝟒
511
0.45
546
10413
19320
−
1 34
, 1.73, 135
, 1.78
3 60.26, , 0.35,10 25
− − − −
38
, − 0.38, 37
, − 0.43

7WB1 - 41
©2014 University of Utah Middle School Math Project in partnership with the Utah State Office of Education. Licensed under Creative Commons, cc-by.
1.2d Class Activity: Probability, Fractions, and Percentage
1. A bag contains 100 marbles. The table below shows how many red, blue, green and yellow marbles are in the bag. Use that data to complete the table below. The first row is completed for you.
Color of Marble Probability of drawing the
colored marble
Ratio of colored marble to all
marbles
Percentage of colored marble
within all marbles
1. Red 16%
2. Blue
3. Green
4. Yellow
5. Orange
6. Red OR blue
7. Red, blue, green OR yellow
16 4100 25
= 16 4100 25
=
Color Number
of Marbles
Red 16 Blue 24
Green 45 Yellow 15

7WB1 - 42
©2014 University of Utah Middle School Math Project in partnership with the Utah State Office of Education. Licensed under Creative Commons, cc-by.
2. Suppose you want to create a bag with 300 red, blue, green and yellow marbles that has the same probability for drawing each color as #1 above. Find how many of each color you will need. Color Probability!Amount Percent!Amount Model
Red
or
16% = 16100
16 ∙ 3100 ∙ 3 =
48300
48 red marbles
Blue
Green
Yellow
Modeling to find the part, whole or percent
Example 1: Sally wants to compute 60% of 145. She knows that 60% = . This means that 145
should be divided into either100, 10 or 5 parts. Dividing 145 into 10 parts would mean 1.45 in each part, dividing into 10 parts would mean 14.5 in each part; dividing into 5 parts would mean 29 in each part. She decided to use 5:
Sixty percent of 145 is the same as 3/5 of 145; thus 60% of 145 is 29 + 29 + 29 or 87.
425
=425×1212
=48300
425
=16100
=3×163×100
=48300
60100
=610
=35

7WB1 - 43
©2014 University of Utah Middle School Math Project in partnership with the Utah State Office of Education. Licensed under Creative Commons, cc-by.
Example 2: What percent of 195 is 78? We know that 10% of 195 is 19.5. So one way to think about this is to divide 195 into ten parts:
Above we can see that two 10% portions make 39; thus four 10% portions make 78. So, 78 is 40% of 195. Example 3: 15% of what is 45? We know that percents are relationships of 100 and that if we can find 10%, we can compute anything fairly easily. If 45 is 15% of the whole, then 15 is 5% of the whole (15% divided into 3 is 5%, and 45 divided into 3 is 15.) That means that 5% of the whole is 15, so 10% is 30:
If each 10% portion is 30, than the whole is 30 × 10 or 300.

7WB1 - 44
©2014 University of Utah Middle School Math Project in partnership with the Utah State Office of Education. Licensed under Creative Commons, cc-by.
Use a model like the one shown previously to answer the following questions. 3. Find 60% of 180.
4. Find 40% of 80. 5. Find 25% of 324. 6. What percent of 80 is 60?
7. What percent of 120 is 48? 8. What percent of 95 is 19?
9. 12 is 10 percent of what number? 10. 45 is 15 percent of what number? 11. 30 is 25 percent of what number?

7WB1 - 45
©2014 University of Utah Middle School Math Project in partnership with the Utah State Office of Education. Licensed under Creative Commons, cc-by.
1.2d Homework: Probability, Fractions, and Percentage
Express each fraction as a percent.
1.
2.
3.
4.
Express each percent as a fraction in simplest form. 5. 60% =
6. 80% =
7. 75%
8. 10% =
9. 5% =
10. 25%
Solve each using a model and mental math. Show your work: 11. Find 80% of 150. 12. Find 40% of 40. 13. What percent of 30 is 15?
14. What percent of 240 is 60?
15. 40 is 8% of what number? 16. 60 is 30% of what number?
15=
910
=
320
=
25=

7WB1 - 46
©2014 University of Utah Middle School Math Project in partnership with the Utah State Office of Education. Licensed under Creative Commons, cc-by.
Use a model to ESTIMATE each. Indicate if your estimate is slightly higher or lower than the exact answer. 17. Estimate 74% of 24.
18. Makayla got a score of 77% on her English final. If there were 48 questions on the test, approximately how
many questions did she get right? 19. Milo can run 10 miles in 60 minutes. He needs to reduce his time by 18%, approximately how many
minutes does he have to take off his time? 20. The cycle store has a bike regularly priced at $660, Tom negotiated a 32 % discount. What fraction can you
use to estimate the money he saved? Approximately how much did he pay for the bike?
Spiral Review
1. Circle the number that’s greater: 0.17 0.107 Justification:
2. Circle the number that’s greater: 2.65 2.63 Justification:
3. Is 0.77 to the left or right of on a number line? Explain.
4. Write 32% as a decimal and fraction.
34

7WB1 - 47
©2014 University of Utah Middle School Math Project in partnership with the Utah State Office of Education. Licensed under Creative Commons, cc-by.
1.2e Class Activity: Applications with Models, Multi-Step Problems
Percent and fraction questions: Use a model to find the solutions.
1. 60 is 40% of what number?
2. There are 36 students in a math class. of the students take an art class after their math class, the rest take
a social studies class. How many students take art after math? 3. You get 80% correct on a history quiz with 150 questions. How many questions did you get correct?
4. Juan earned money for creating a webpage for a local business. He used of the money he earned for new
shoes and of the rest for music. He has $20 left. How much money did he earn for his work?
5. Lydia volunteers with an organization that helps older citizens take care of their yards. 75% of the
volunteers in the organization are 20-30 years old. Of the remaining portion, 75% are over 30 and 25% are under 20. If there are 15 people under 20, how many people are in the organization?
6. There are 360 7th grade students at Eisenhower Middle School. One-fourth of the students went to Clermont
Elementary. Of the rest, half went to Central Elementary and the others came from a variety of other elementary schools. How many students came from Central Elementary?
34
12
23

7WB1 - 48
©2014 University of Utah Middle School Math Project in partnership with the Utah State Office of Education. Licensed under Creative Commons, cc-by.
7. A snowboard at a local shop normally costs $450. Over Labor Day weekend, the snowboard is on sale for
50% off. Customers who make their purchase before 8:00 AM earn an additional 10% off of the sale price. If Mia buys the snowboard before 8:00 AM, how much will she pay?
8. A local business is reviewing their expenditures. They found that they spend of their income on payroll,
another goes back into the business to purchase inventory and pay for the facility, of the remainder goes
to paying off their original small business loan. If they have $100,000 left to reinvest in their company, what are their total expenditures?
9. At a Monument Valley High School, three fourths of the 7th grade students went to Salt Lake City on a field
trip. Half of the rest of the students went to Monticello for a different field trip. If there were 12 students that did not go on either trip, how many 7th grade students are there in all?
10. Camilla earned $160 over the summer. If she put 80% of her earnings into her savings account and spent 75% of the rest on a gift for her mother, how much money did she have left over?
11. Mila rode in a bike tour across Utah. On one particular day, 40% percent of her ride was uphill of the rest.
Of her ride 1/3 was down hill and 2/3 was flat. If the flat portion of her ride was 36 miles, how far did she ride that day?
12. Marco’s football team was 20 yards from the goal when they got possession of the football. At the end of
one play, they got half way to the goal. After the second play, they made half that distance closer to the goal. After the third play, they got half the remaining distance. How far were they from the goal line before the fourth play?
13
12
13
7WB1 - 49
©2014 University of Utah Middle School Math Project in partnership with the Utah State Office of Education. Licensed under Creative Commons, cc-by.
1.2e Homework: Rational Numbers with Models, Multi-Step Problems
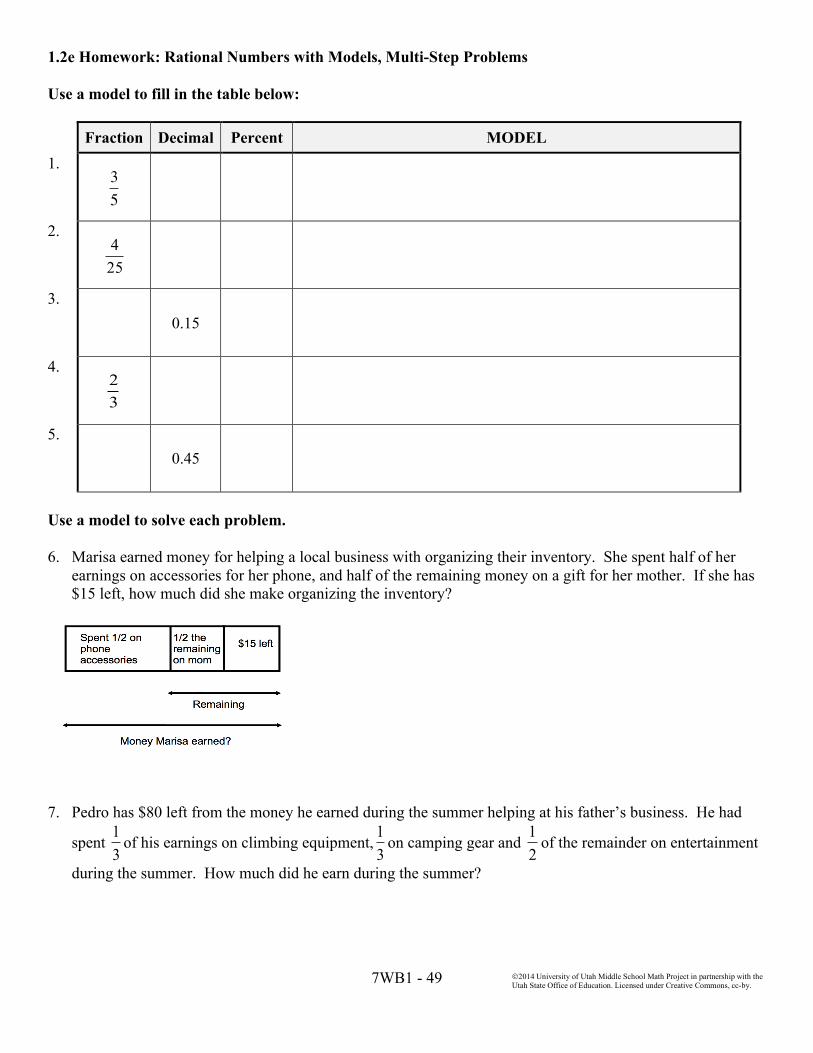
Use a model to fill in the table below: Fraction Decimal Percent MODEL 1.
2.
3. 0.15
4.
5. 0.45
Use a model to solve each problem. 6. Marisa earned money for helping a local business with organizing their inventory. She spent half of her
earnings on accessories for her phone, and half of the remaining money on a gift for her mother. If she has $15 left, how much did she make organizing the inventory?
7. Pedro has $80 left from the money he earned during the summer helping at his father’s business. He had
spent of his earnings on climbing equipment, on camping gear and of the remainder on entertainment
during the summer. How much did he earn during the summer?
35
425
23
13
13
12

7WB1 - 50
©2014 University of Utah Middle School Math Project in partnership with the Utah State Office of Education. Licensed under Creative Commons, cc-by.
8. Jose estimates that 50% of his income goes toward living expenses (rent, utilities and food). Of the rest,
50% goes to paying for his car and 25% to other expenses. If Jose has $300 left at the end of the month, how much does he earn?
9. Marco earned $360 helping his grandfather at his business. He spent of his earnings on a gift for his
mother and put of the rest into a savings account. How much does he have left over for fun?
10. Julia found a great pair of boots for $240, but that was more than she wanted to spend. A few months later
they were on sale for 40% off. She searched online and found a coupon for 25% off the sale price. How much will she pay for the boots?
11. Jose earned money over the summer working at his family’s store. He put three-fourths of the money he
earned in his savings account and spent half of the rest. If he as $120 left over, how much did her earn? 12. Jessi bought 18 gallons of paint to paint her house and garage. If she used 75% of the paint on the house and
half of the rest on the garage, how much paint did she have left over?
Spiral Review Express each fraction as a percent.
1. 3.
Express each percent as a fraction in simplest form. 3. 40% 4. 25%
14
23
15= 2
5=

7WB1 - 51
©2014 University of Utah Middle School Math Project in partnership with the Utah State Office of Education. Licensed under Creative Commons, cc-by.
1.2f Self-Assessment: Section 1.2
Consider the following skills/concepts. Rate your comfort level with each skill/concept by checking the box that best describes your progress in mastering each skill/concept. Corresponding sample problems, referenced in brackets, can be found on the following page.
Skill/Concept Beginning Understanding
Developing Skill and
Understanding
Practical Skill and
Understanding
Deep Understanding, Skill Mastery
1. Express probability using appropriate fractions, decimals, and percents. [1]
I sometimes can express probabilities as either a fraction, decimal, or percent, but not all three.
Most of the time I can express probabilities as two of the following: fraction, decimal, or percent.
I can express probabilities as a fraction, decimal, and percent.
I can express probabilities as a fraction, decimal, and percent. I can also justify the most appropriate form(s) of a number for a given context.
2. Express and convert between rational numbers in different forms. [2]
I struggle to convert between rational numbers in different forms and/or I’m not sure what a rational number is.
I can convert between rational numbers in two of the different forms: fraction, decimal, or percent.
I can convert between rational numbers in all three different forms (fraction, decimal, and percent).
I can convert between rational numbers in all three different forms. I can also explain when each may be more appropriate.
3. Draw models to show equivalence among fractions and rational numbers.
I struggle to draw models of rational numbers.
I can draw models of some, but not all forms of rational numbers: fractions, decimals, and percents.
I can draw models of all forms of rational numbers. I can use the models to show equivalence.
I can draw models of all forms of rational numbers. I can explain how the models show equivalence in different forms.
4. Compare rational numbers in different forms. [3]
I can order most sets of positive rational numbers like in #3 Set A on the following page. I have trouble with other forms
I can order most sets of positive and negative rational numbers if they are in the same form like in #3 Set A or B on the following page.
I can order sets of positive and negative rational numbers in two forms like in #3 Set A, B or C on the following page.
I can compare rational numbers in different forms such as #3 Sets A, B, C and D. I can also justify my comparison.
5. Find the percent of a quantity using a model. [4]
I can draw a model of a percent. I struggle to use that model to find percent of a quantity.
I can use a model to correctly find the percent of a quantity such as Problem 4b on the following page.
I can use a model to find an unknown quantity given a percent and can find the percent of a quantity such as Problem 4a and 4b.
I can use a model to find an unknown quantity given a percent and the percent of a quantity such as Problem 4a and 4b. I can explain how the model is related to the “mathematical” process for finding percents values.
6. Solve problems with rational numbers using models. [5]
I can draw a model of a rational number. I struggle to use that model to solve problems.
I can use a model to solve single-step problems with rational numbers such as Problem 5a or 5b on the following page.
I can use a model to solve one-step and multi-step problems with rational numbers such as Problem 5a – d on the following page.
I can use a model to solve one-step and multi-step problems with rational numbers such as Problem 5a – d. I can also explain how the model is related to the computational process.

7WB1 - 52
©2014 University of Utah Middle School Math Project in partnership with the Utah State Office of Education. Licensed under Creative Commons, cc-by.
Sample Problems for Section 1.2 1. Rufina has a bag of marbles. She has 30 striped marbles, 4 cat’s eye marbles and 10 solid color marbles.
Rufina draws one marble out of her bag. Express each of the following probabilities as a fraction, decimal and percent. a. P(striped)__________________________________________________
b. P(solid)____________________________________________________
2. Complete the following chart of equivalent rational numbers. 3. Order the numbers in each box from least to greatest. Set A Set B
Set C Set D
27, 0.24, 1
2, 0.8 2.54, 5
2, 2.7, 15
70.1, 10
99, 436, 0.66 −2.15, 17
7, 2.7, − 2.105 − 4
5, − 58, 0.4, 3
81.4, − 10
8, − 43,1.08
Fraction Decimal Percent
0.74
0.1325
81%
1.5%
1325
84300
12, 34, 49
5.15, 5.002, 4.7, 5.1 23, 310, 14, 49
− 12, 27, 12, − 89
−7.34, − 7.002, − 7.7, − 7.2 37, − 10
2, 43, − 98

7WB1 - 53
©2014 University of Utah Middle School Math Project in partnership with the Utah State Office of Education. Licensed under Creative Commons, cc-by.
4. Find each. a. 40% of what number is 50?
b. What is 85% of 420?
5.
a. Shauna wants to buy a sweater at the store. The sweater is normally $28, but today it is on sale for 15% off. How much is the sweater?
b.
In Mr. Garcia’s 7th Grade Math class, of the
students brought a pencil to class. If 6 people did not have pencils, how many students are in Mr. Garcia’s class?
c.
Uzumati has $80. He spends on
groceries. Then he spends 75% of what’s left on two new Blu-ray’s. How much money does he have left?
d. Ms. Wells surveyed her 205 students. She found that 80% of the students were wearing blue jeans. One student was wearing shorts. Of the
remaining students, were wearing skirts. How
many students were wearing skirts?
45
15
38

7WB1 - 54
©2014 University of Utah Middle School Math Project in partnership with the Utah State Office of Education. Licensed under Creative Commons, cc-by.
Section 1.3: Solve Percent Problems Including Discounts, Interest, Taxes, Tips, and Percent Increase or Decrease. Section Overview: In this section, students continue to solve contextual problems with fractions, decimals and percent but begin to transition from relying solely on models to writing numeric expressions. In future chapters, students will extend their understanding by writing equations and proportional equations using variables. Concepts and Skills to be Mastered (from standards) 1. Find a percent or fractional portion of a whole with or without a model. 2. Solve percent problems involving percent increase and decrease (including discounts, interest, taxes, tips,
etc.). 3. Develop numeric expressions from percent and fraction models.

7WB1 - 55
©2014 University of Utah Middle School Math Project in partnership with the Utah State Office of Education. Licensed under Creative Commons, cc-by.
1.3a Class Activity: Model Percent and Fraction Problems
Use a model to solve each of the following multi-step problems. Then write a number sentence that reflects your model and answer. 1. Larry has a piece of rope that’s 12 feet long.
a. He cuts off 25% of the rope off. How long is the rope now?
b. Joe has a rope that is 25% longer than Larry’s 12 foot long rope. How long is Joe’s rope?
2. Lydia invested $150. If Lydia earned 10% on her investment. How much money would she now have?
How much money would Lydia have if instead she lost 10% on her original investment?
3. A refrigerator costs $1200 wholesale. If the mark-up on the refrigerator is 20%, what is the new price?
4. Rico's resting heart rate is 50 beats per minute. His target exercise rate is 350% of his resting rate. What is his target rate?
5. A pair of boots was originally priced at $200. The store put them on sale for 25% off. A month later, the
boots were reduced an additional 50% off the previous sale price. What is the price now?
6. Marie went out for dinner with her friend. The dinner cost $24. Tax is 5% and Marcie wants to leave a
15% tip (she computed tip on the cost of dinner and tax.) How much will Marcie pay all together for dinner?

7WB1 - 56
©2014 University of Utah Middle School Math Project in partnership with the Utah State Office of Education. Licensed under Creative Commons, cc-by.
1.3a Homework: Model Percent and Fraction Problems
Use a model to answer each of the questions below. Then write a number sentence that reflects your model and answer. 1. Last year Cory harvested 42 tomatoes from his backyard garden. This year, his harvest increased by 1/3.
How many tomatoes did he harvest this year? 2. Jerry is taking care of a vacant lot in his neighborhood. There are approximately 64 thistle weeds in the lot.
He decided to try a homemade weed killer his grandmother suggested. Five weeks later, the thistles have decreased by 75%. Approximately how many thistles are in the vacant lot now?
3. Maria is learning to play golf. She has been working particularly hard on driving. Before lessons, her
drives average 240 yards. After her first lesson, her drives increase 25%. After her second lesson, they increase another 25%. How far are her average drives after two lessons?

7WB1 - 57
©2014 University of Utah Middle School Math Project in partnership with the Utah State Office of Education. Licensed under Creative Commons, cc-by.
4. Two stores have the same skateboard on sale. The original price of the skateboard is $200. At store AAA, it’s on sale for 30% off with a rewards coupon that allows the purchaser to take an additional 20% off the sale price at the time of purchase. At store BBB, the skateboard is on sale for 50% off. Will the price for the skateboard be the same at both stores? If not, which store has the better deal?
5. Two schools start with 1000 students. The first school’s enrollment increase 20% in 2012 and then
decreases 20% in 2013; the second school’s enrollment stays constant in both 2012 and 2013. Which school has the most students now?
Review questions. Write all probabilities as fractions, decimals and percentages. 6. Suppose you were to roll a fair 6-sided number cube once, then flip a coin. List all the possible outcomes.
7. What is the probability of getting a 2 and heads?
8. What is the probability that you would roll an even number and flip heads? 9. What is the probability that you would roll an even number or flip heads?

7WB1 - 58
©2014 University of Utah Middle School Math Project in partnership with the Utah State Office of Education. Licensed under Creative Commons, cc-by.
Spiral Review 1. What is 85% of 420? 2. Fill in the equivalent decimal and percent for this fraction:
3. Jana wants to buy a shirt at the store. The shirt is normally $24, but today it is on sale for 15% off. a. How much will she save? b. How much will Jana pay for the shirt?
4. Change this fraction to a mixed number. Draw a bar model.
𝟖𝟑
5. What is the greatest common factor of 12 and 18?
Fraction Decimal Percent 915

7WB1 - 59
©2014 University of Utah Middle School Math Project in partnership with the Utah State Office of Education. Licensed under Creative Commons, cc-by.
1.3b Class Activity: Percent and Fraction Problems Transition to Numeric Expressions
Part A: For each problem below, use a model to answer the question.
Context Model Fraction Change
Percent Change
Fractional Portion of
the original
Percent of the
original 1a. Li planted a 12 foot
tall tree in her yard. 10 years later it is 18 feet tall.
factor
increase of the original.
Grew by 50% of the original.
of the
original height
150% of the original height
2a. Pedro had $600 in his savings account. Five years later he has $800.
3a. It used to take Naya 10 minutes to walk to school. Now it takes her 8 minutes.
4a. Mario’s old car got 20 miles to the gallon. His new car gets 24 miles to the gallon.
5a. The Castro’s old dishwasher used 12 gallons of water per load. Their new dishwasher uses 8 gallons per load.
6a. A pair of running shoes was originally $75, they are on sale for $60.
7a. The pair of running shoes was originally $75, they are on sale for $50.
12
32
6
6
64
64
18
12
6
10
8
600
800

7WB1 - 60
©2014 University of Utah Middle School Math Project in partnership with the Utah State Office of Education. Licensed under Creative Commons, cc-by.
Part B: These are the same questions as above in Part A. Use the model you created for each problem to write a numeric expression to answer the question.
Context Fraction Change Expression Percent Change Expression 1b. Li planted a 12 foot
tall tree in her yard. 10 years later it is 18 feet tall.
12 1 + 1212
= 12 !!
= 18
12(1) + 12(.5) = 12(1.5)
= 18
2b. Pedro had $600 in his savings account. Five years later he has $800.
600( )+ 600
= 600
= 800
600 + 600
= 600
= 800 3b. It used to take Naya
10 minutes to walk to school. Now it takes her 8 minutes.
10 − 10
= 10
= 8
10 − 10
= 10
= 8 4b. Mario’s old car got
20 miles to the gallon. His new car gets 24 miles to the gallon.
5b. The Castro’s old dishwasher used 12 gallons of water per load. Their new dishwasher uses 8 gallons per load.
6b. A pair of running shoes was originally $75, they are on sale for $60.
7b. The pair of running shoes was originally $75, they are on sale for $50.

7WB1 - 61
©2014 University of Utah Middle School Math Project in partnership with the Utah State Office of Education. Licensed under Creative Commons, cc-by.
1.3b Homework: Percent and Fraction Problems Transition to Numeric Expressions
For each problem below, use a model to answer the question.
Context Model Fraction Change
Percent Change Fraction Percent
1. At the beginning of the year there were 32 students in Ms. Herrera’s class. There are now 36 students in her class.
2. At Lincoln Middle School 300 students participated in Science Fair in 2011. In 2012 400 students participated.
3. Celesta used to spend 90 minutes a day on the phone. She now spends 60 minutes a day.
4. During the school year, Jose worked 15 hours a week. During the summer he works 30 hours a week.
5. A local business used to spend $800 a month on employee rewards. They now spend $1000.

7WB1 - 62
©2014 University of Utah Middle School Math Project in partnership with the Utah State Office of Education. Licensed under Creative Commons, cc-by.
For each context, write a fraction change and percent change expression.
Context Fraction Change Expression Percent Change Expression
6. Tio’s mom used to drink 4 diet sodas a day. Now she drinks 1 a day.
7. In a small town in Utah, 40,000 homes used to have land-line phones. Now 35,000 homes have land-line phones.
8. A small business’s profits in 2011 were $120,000. In 2012 they were $150,000
9. Nina and her friend went to dinner. Their bill came to $40. Nina paid $60 to cover the bill, tax and tip.
10. A local business used to spend $800 a month on employee rewards. They now spend $1000.
Spiral Review
1. Alyssa's resting heart rate is 50 beats per minute. Her target exercise rate is 325% of her resting rate. What is her target rate? 2. Samantha has a bag of marbles. She has 21 striped marbles, 5 cat’s eye marbles and 10 solid color
marbles. Samantha draws one marble out of her bag. Express each of the following probabilities as a fraction, decimal and percent. a. P(striped)_________________________________
b. P(solid)___________________________________
3. Put in order from least to greatest:
4. Write !"
! as a mixed number. Draw a bar model as needed.
2.54, 52, 2.7, 15
7

7WB1 - 63
©2014 University of Utah Middle School Math Project in partnership with the Utah State Office of Education. Licensed under Creative Commons, cc-by.
1.3c Class Activity: Create a Context for Each Model or Numeric Representation
Context Model or numeric representation 1.
2. 300(1) – 300(1/5) = 240
3. 48(1) + 48(.25) = 48(1.25) = 60
4.
5. 60(1) + 60(1/3) = 60(4/3) = 80
6. 80(1) – 80(.25) = 80(.75) = 60

7WB1 - 64
©2014 University of Utah Middle School Math Project in partnership with the Utah State Office of Education. Licensed under Creative Commons, cc-by.
1.3c Homework: Create a Context for Each Model or Numeric Representation
Context Model or numeric representation 1.
2. 500(1) – 500(1/5) = 400
3. 60(1) + 60(.75) = 60(1.75) = 105
4.
5. 80(1) + 80(.40) = 80(1.40) = 112
6. 120(1) – 120(1/4) = 120(3/4) = 90

7WB1 - 65
©2014 University of Utah Middle School Math Project in partnership with the Utah State Office of Education. Licensed under Creative Commons, cc-by.
Spiral Review
1. The downtown bakery normally sells one dozen muffins for $12. Today, the muffins are 25% off.
a. What is the discount for one dozen muffins?
b. How much will two dozen muffins cost with the discount? 2. Find 25% of $500.00. 3. What is the greatest common factor of 30 and 75? 4. Matt earned $800 helping his grandfather at his business. If he spent 1/5 of his earnings on a gift for his mom, how much money did he have left over?
5. Write 3 as a fraction and percent:
3.0
Fraction Decimal Percent

7WB1 - 66
©2014 University of Utah Middle School Math Project in partnership with the Utah State Office of Education. Licensed under Creative Commons, cc-by.
1.3d Self-Assessment: Section 1.3
Consider the following skills/concepts. Rate your comfort level with each skill/concept by checking the box that best describes your progress in mastering each skill/concept. Corresponding sample problems, referenced in brackets, can be found on the following page.
Skill/Concept Beginning Understanding
Developing Skill and
Understanding
Practical Skill and
Understanding
Deep Understanding, Skill Mastery
1. Find a percent or fractional portion of a whole with or without a model. [1a, 1bi, 1ci]
I can sometimes find the percent or fractional portion of a whole.
I can find the percent or fractional portion of a whole with a calculator accurately.
I can find the percent or fractional portion of a whole with a calculator and with mental math strategies accurately.
I can find the percent or fractional portion of a whole with a calculator or with mental math strategies accurately. I can explain how a model and my strategy are related to the question and answer.
2. Solve percent problems involving percent increase and decrease (including discounts, interest, taxes, tips, etc.). [1b, 1c, 2]
I sometimes have a hard time getting started, but once I know what to do, I can do the problem.
I know how to find the percent of the whole, but I sometimes mess up on the next step.
I can solve percent problems involving percent increase and decrease.
I can solve percent problems involving percent increase and decrease accurately with either a model or numeric expression. I can also explain how the model and expression are related to the answer.
3. Develop numeric expressions from percent and fraction models. [3]
I don’t know how to write a numeric expression from percent and fraction models.
I can match a numeric expression to the correct percent or fraction model.
I can write a numeric expression from percent and fraction models.
I can write a numeric expression from percent and fraction models. I can also draw percent and fraction models from a numeric expression.

7WB1 - 67
©2014 University of Utah Middle School Math Project in partnership with the Utah State Office of Education. Licensed under Creative Commons, cc-by.
Sample Problems for Section 1.3 1. Solve each of the following problems with or without a model.
a. Ana has 75 necklaces. She sells of the necklaces. How many necklaces did she sell?
b. Bubba invested $760. If he earned 20% on his investment,
i. How much interest did he earn?
ii. How much money does he have now?
c. The bakery normally sells one dozen cupcakes for $24. Today, the cupcakes are 25% off.
i. What is the discount for one dozen cupcakes?
ii. If 5% tax is added to the total after the discount, how much will two dozen cupcakes cost?
2. Solve the following problems with or without a model.
a. Daniel left a $9 tip for the waiter at a restaurant. If the tip was 15% of the bill, how much was
the bill?
b. Ellie borrowed money from a company that charges 20% interest for loans. If she repaid them a total of $420, how much was her original loan?
c. Flo sold 14 cars last year. This year, she sold 35 cars. What was the percent change?
d. Gabrielle had $90 in her savings account last month. Now she has $63 in her account. What was the percent change?
13

7WB1 - 68
©2014 University of Utah Middle School Math Project in partnership with the Utah State Office of Education. Licensed under Creative Commons, cc-by.
3. a. Match the context with the correct model, and numeric expression.
C
onte
xt
1. Hans had $75 in his bank account. Two years later, he had $100.
2. Isi could do 75 sit-ups last year. Now she can only do 50 sit-ups.
3. Jenna’s family used 75 gallons of water per day last month. This month, her family used 125 gallons of water per day.
Mod
el
A.
B.
C.
Num
eric
Ex
pres
sion
X.
75( 1 )+ 75 1 3
Y.
Z.
Context 1, Model ________, Numeric Expression________ Context 2, Model________ ,Numeric Expression________ Context 3, Model________,Numeric Expression________
b. For Context 1: What percent of Hans' original amount of money does he have 2 years later? c. For Context 2: What is the percent change in the number of sit-ups Isi can do?
d. For Context 3: What is the percent change in the amount of water Jana’s family now uses compared to last month?
4. Write a context to match the following numeric expressions:
75(1)− 75 13
⎛⎝⎜
⎞⎠⎟ 75(1)+ 75 2
3⎛⎝⎜
⎞⎠⎟
24(1)+ 24 14
⎛⎝⎜
⎞⎠⎟
700(1)− 700 0.3( )


