34
2004 Oct 1 Grading of Yarn Appearance Using Image Analysis and Artificial Intelligence Technique Dariush Semnani
Oct 2004 1
Grading of Yarn Appearance Using Image Analysis and Artificial Intelligence Technique
Dariush Semnani

Oct 2004 2
HIGH LIGHT POITS
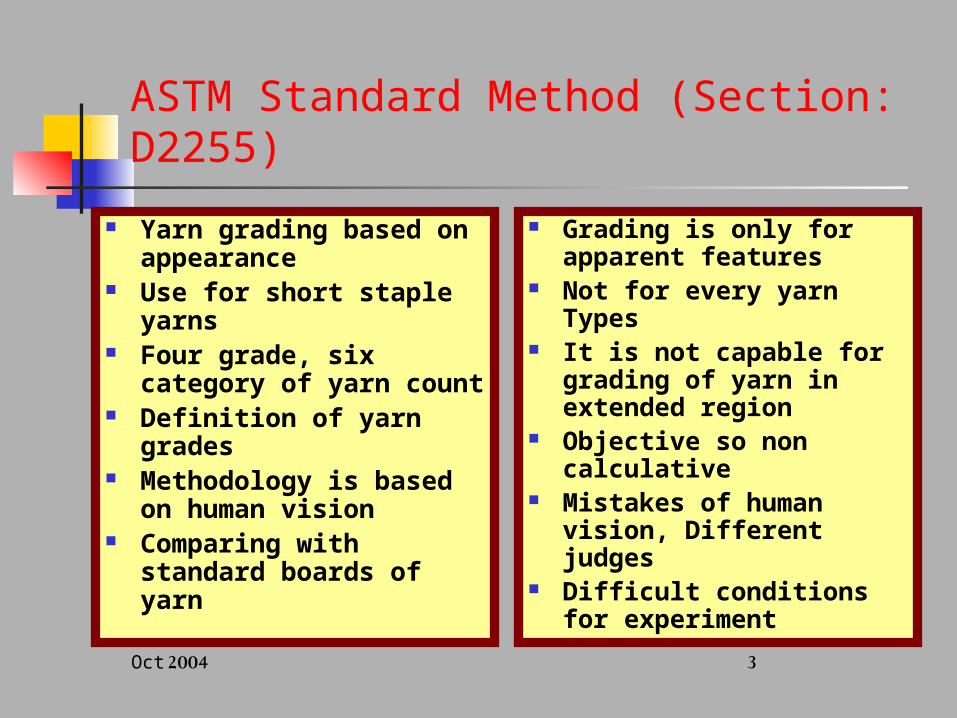
ASTM Standard Method (Section: D2255)
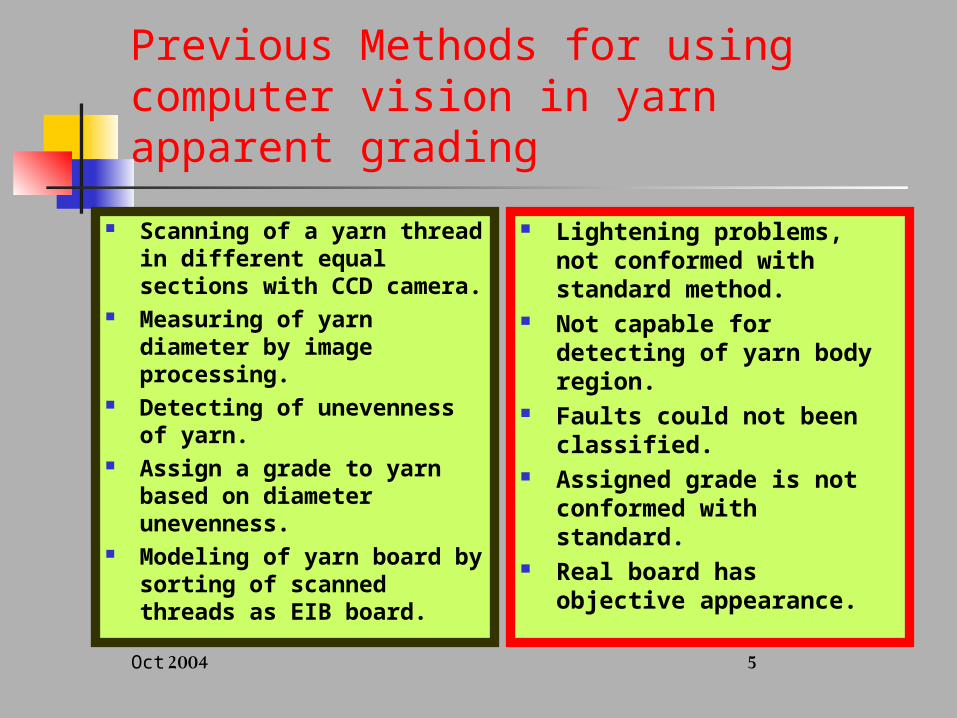
Previous Methods for using computer vision in yarn apparent grading
The aim of present research Methodology Results and discussion Conclusion
Oct 2004 3
ASTM Standard Method (Section: D2255)
Yarn grading based on appearance
Use for short staple yarns
Four grade, six category of yarn count
Definition of yarn grades
Methodology is based on human vision
Comparing with standard boards of yarn
Grading is only for apparent features
Not for every yarn Types
It is not capable for grading of yarn in extended region
Objective so non calculative
Mistakes of human vision, Different judges
Difficult conditions for experiment

Oct 2004 4
A Sample for Standard Boards
Cat.: 16-25 TEX
Grade A Grade B Grade C Grade D
Oct 2004 5
Previous Methods for using computer vision in yarn apparent grading
Scanning of a yarn thread in different equal sections with CCD camera.
Measuring of yarn diameter by image processing.
Detecting of unevenness of yarn.
Assign a grade to yarn based on diameter unevenness.
Modeling of yarn board by sorting of scanned threads as EIB board.
Lightening problems, not conformed with standard method.
Not capable for detecting of yarn body region.
Faults could not been classified.
Assigned grade is not conformed with standard.
Real board has objective appearance.
Oct 2004 6
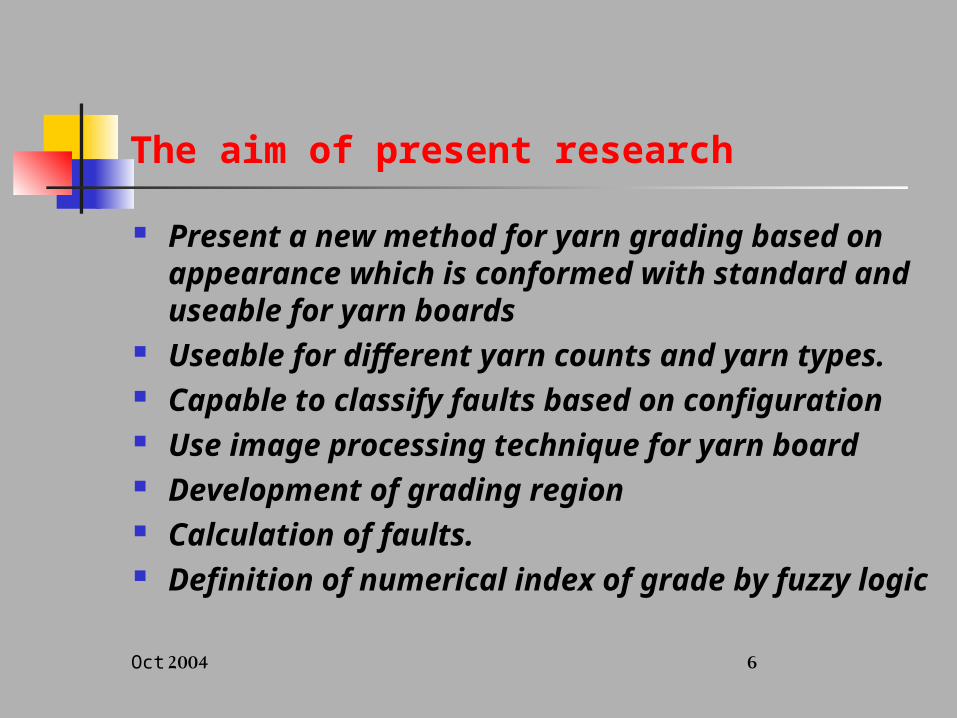
The aim of present research
Present a new method for yarn grading based on appearance which is conformed with standard and useable for yarn boards
Useable for different yarn counts and yarn types. Capable to classify faults based on configuration Use image processing technique for yarn board Development of grading region Calculation of faults. Definition of numerical index of grade by fuzzy
logic

Oct 2004 7
Methodology
Definition of apparent yarn feature based on various kinds of fault
Elimination of yarn body from picture of yarn table
Elimination of background from yarn core eliminated image
Counting and classification of faults Grading of yarn appearance based on fault
factors

Oct 2004 8
Definition of apparent yarn feature based on various kinds of fault
STANDARD DEFINITION:STANDARD DEFINITION: nep with thickness of less than three
times of yarn diameter. nep with thickness of more than three
times of yarn diameter. Foreign trashes. Fettling fibers with thickness of less
than three times of yarn diameter such as small bunch, slug, or slub.
Fettling fibers with thickness of more than three times of yarn diameter such as big bunch, slug, or slub.
Unevenness coating of yarn surface with shapes of fuzziness.
Free fibers on yarn surface. These fibers are named fuzz. The fuzz should not be confused with the cover.
SUMMERIZED DEFINITION:SUMMERIZED DEFINITION: Class I: Big and entangled faults
which are tightened fibers with uniform configuration.
Class II: Big faults with less area in comparison with first category (Class I).
Class III: Non uniform and extended faults with spread configuration.
Class IV: Small spread faults such as non uniform coating fibers and short tangled hairs.

Oct 2004 9
Definition of fault classes
All of the big tightened faults such as fettling fibers, tangled fibers, big neps, big melted spots and confused helical fibers are classified in class I. These faults have big tangled area.
Other similar faults with smaller are in comparison with class I are classified in class II.
Long spread fibers as small fuzz are classified in class III. These faults are spread in area.
Small spread coating fibers and different small faults are classified in class IV.

Oct 2004 10
A Sample for faults
Class IV
Class III
Class III
Class II
Class I
Class I

Oct 2004 11
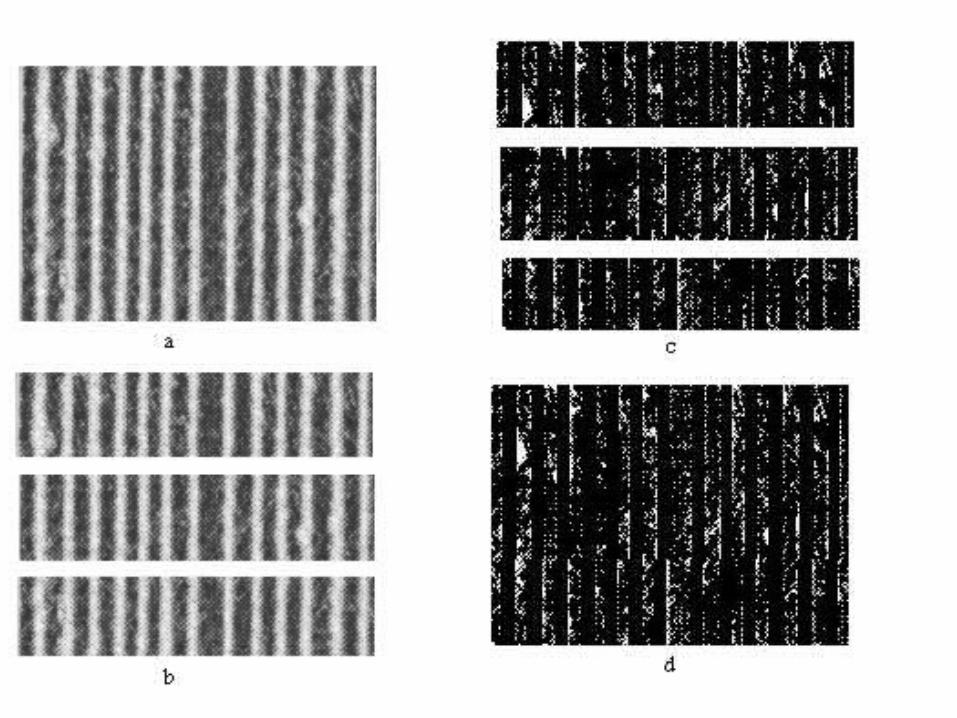
Elimination of yarn body from picture of yarn table
Scanning of board (300 DPI, Gray Scale 256, 10 by 9 inch)
More Resolution=More Processing Time & Less Res.=Less Accuracy
Converting image to binary mode (Level 110)
Elimination of yarns Cores

Oct 2004 12
Relation between original image and faults image
F=G+N
MM
i jifj /1 ,
TiIf
TjIfjif
jig
0
,
,
TjIf0
TjIfj,if
j,in

Oct 2004 13
x0
Why it is required to divide image to tapes
l0
l=100
tg
x α
00 N
N
d
d
000 l
l
d
d
x
x
00 N
N
l
l
Nl 4.12
5 degree
x=8
EX: 65 Tex

Oct 2004 14
Finding Threshold for detecting of thread coreCurve : Sorted vector of
columns means for whole tapes
a: Turning point
Th: Threshold for thread core
X : sorted vector of means
Intensity: 0-1
b
a
1
h
Th
c
X
.m
1ii2/X)1h(
hxX
hy
xX
hhy
1
)0(1 In nominal method, point (a) is located
where the difference between vector of line cb and sorted mean vector (curve) is
in minimum. The height of point (a) is desired threshold value (Th).
Oct 2004 15

Oct 2004 16
Elimination of background from yarn core eliminated image
A small threshold for detecting of black columns in every tape = 0.1
Procedure verifies every column with threshold for whole tapes.
After elimination of black columns length of tape is various among different tapes.
So the image of fault is a wide image with height of tape length and width of remained columns (not black).

Oct 2004 17
Counting and classification of faults
Convert Fault Image to blocks vector Finding optimum block size Estimation of optimum values for thresholds Classification of blocks by estimated thresholds

Oct 2004 18
Image Blocking
Tape length
Width= remained columns
Size: B by B
Width= remained columns x tape length / B2

Oct 2004 19
Finding Optimum Block Size Calculation of Variance of blocks means for different block size Optimum block size has Maximum variance of block means

Oct 2004 20
Estimation of Optimum Values for Threshold TFm= Threshold of blocks
means TFv= Threshold of blocks
variances TFm : for bigness of fault
in block TFv =for configuration of
fault in block
Thresholds are located in turning point of sorted vector of means and variances
Turning point is calculated by numerical second order differential of vectors
Tf
Sorted vector of means or deviations of blocks
Index of vector

Oct 2004 21
Classification of blocks by estimated thresholds
-Class I: Condition: fmi Tb 2.1. Big neps, slug or slubs, and other big tangled faults are classified in this class.
-Class II: Condition: fvifmifm TvbTbT &2.1. Entangled faults which are smaller than faults of class I is classified in this class.
-Class III: Condition: fvifmifm TvbTbT &2.1
. The faults which are spread in block is classified in this class.
Class IV: Any other blocks which are not classified in above classes. The spread small faults are located in this class
N1
N2
N3
N4

Oct 2004 22
The error of bad classification of faults between tow blocks
Error of the worst situation for the thinnest yarn = 0.036%
Error of the worst situation for the thickest yarn = 2.5% Region
between blocks
16 pixels
Oct 2004 23
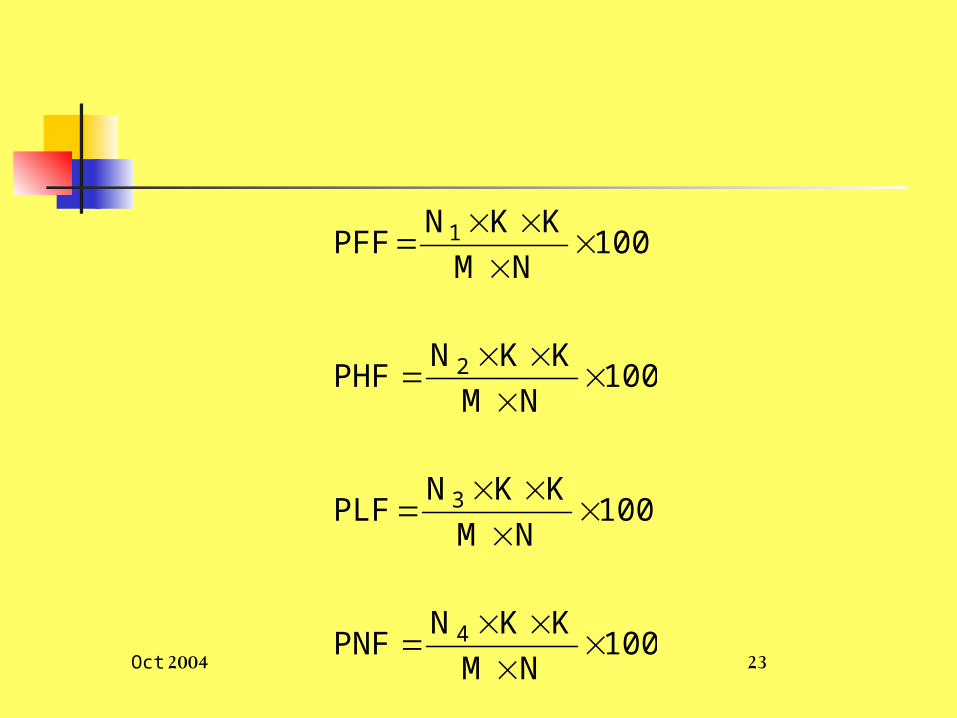
100NM
KKNPNF
100NM
KKNPLF
100NM
KKNPHF
100NM
KKNPFF
4
3
2
1

Oct 2004 24
Table 1: Suitable Tape and block size for core elimination of threads and classification of faults in images of standard boards
Block size(Pixels)
Length tapes(Pixels)
Yarn Count of board(Tex)
Region of yarn Count(Tex)
Category
16x163584-8I
20x2040128-12II
25x25501612-16III
30x30602016-25IV
45x45905025-50V
50x501006550-590VI

Oct 2004 25
Table 2: Threshold values for classification of fault blocks in images of standard boards
CategoryGradeTfmTfv
I
A0.320.16
B0.310.15
C0.280.16
D0.290.16
II
A0.350.18
B0.400.19
C0.300.16
D0.320.17
III
A0.250.13
B0.260.13
C0.300.17
D0.290.18
IV
A0.240.11
B0.200.14
C0.200.14
D0.200.15
V
A0.370.20
B0.210.15
C0.160.12
D0.160.13
VI
A0.180.13
B0.250.15
C0.200.15
D0.190.15

Oct 2004 26
Grading of yarn appearance based on fault factors
PNF
PLF
PHF
PFF
P
ID=P.W
],,[ 432,1 wwwwW

Oct 2004 27
Estimation of W (Classifier Ceriteria) from ANN 6 ANN for 6 classifier
regarding to 6 Categories
ANN : Perceptron with 2 layers
Fuzzy layer only in use
Training : 10000 epok with training rate 0.1
w1
w2
w3
w4
PFF
PHF
PLF
PNF
ID
Grade
Fuzzy Layer
Oct 2004 28
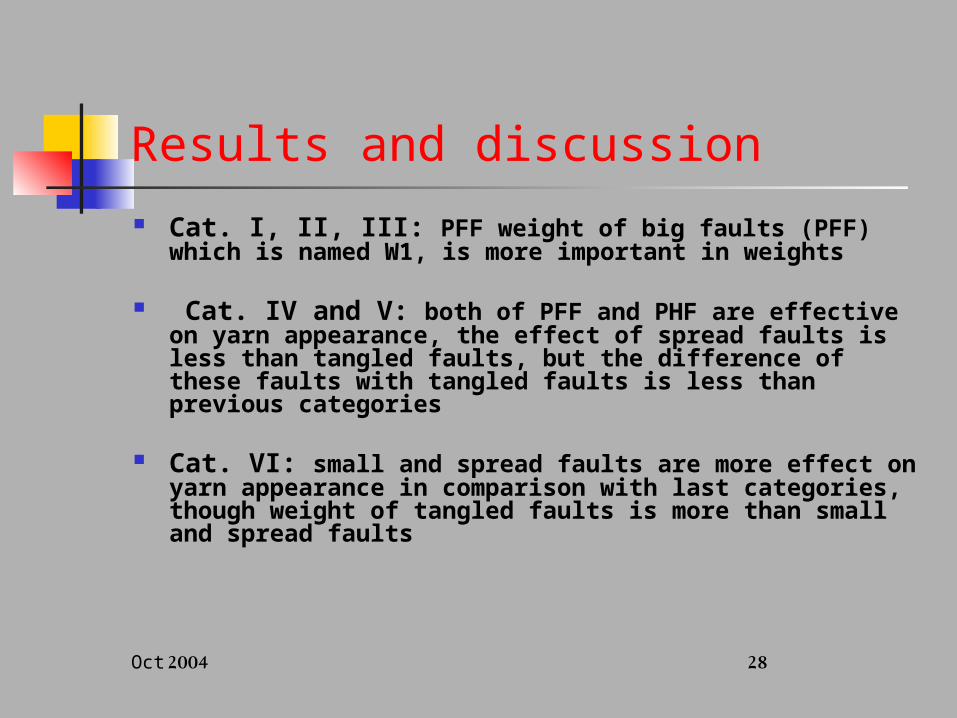
Results and discussion Cat. I, II, III: PFF weight of big faults (PFF) which is named W1, is
more important in weights
Cat. IV and V: both of PFF and PHF are effective on yarn appearance, the effect of spread faults is less than tangled faults, but the difference of these faults with tangled faults is less than previous categories
Cat. VI: small and spread faults are more effect on yarn appearance in comparison with last categories, though weight of tangled faults is more than small and spread faults
Oct 2004 29
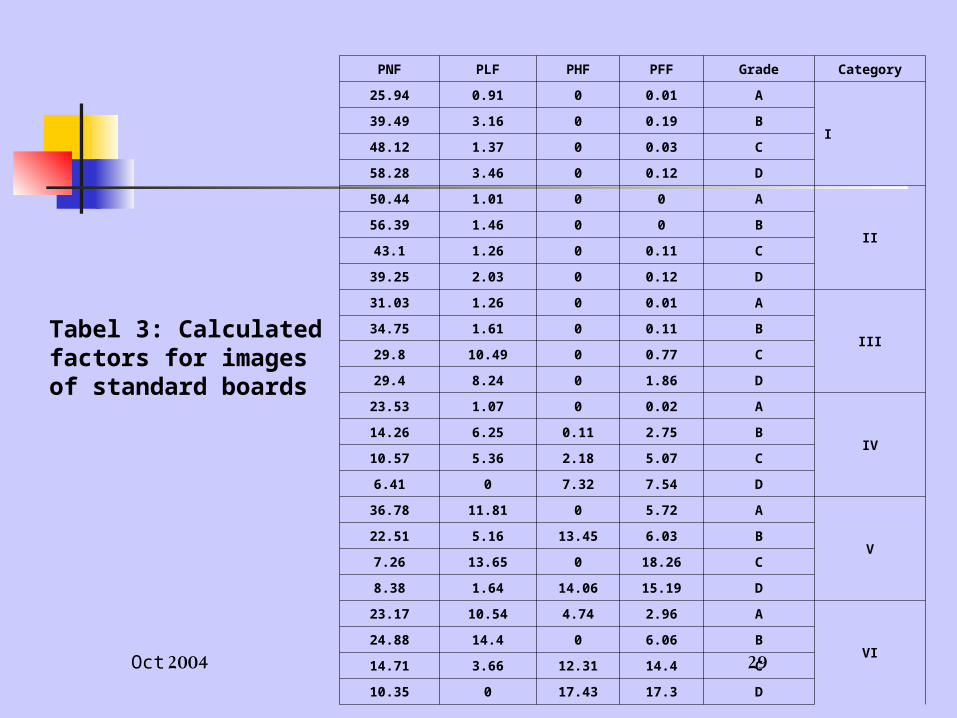
Tabel 3: Calculated factors for images of standard boards
CategoryGradePFFPHFPLFPNF
I
A0.0100.9125.94
B0.1903.1639.49
C0.0301.3748.12
D0.1203.4658.28
II
A001.0150.44
B001.4656.39
C0.1101.2643.1
D0.1202.0339.25
III
A0.0101.2631.03
B0.1101.6134.75
C0.77010.4929.8
D1.8608.2429.4
IV
A0.0201.0723.53
B2.750.116.2514.26
C5.072.185.3610.57
D7.547.3206.41
V
A5.72011.8136.78
B6.0313.455.1622.51
C18.26013.657.26
D15.1914.061.648.38
VI
A2.964.7410.5423.17
B6.06014.424.88
C14.412.313.6614.71
D17.317.43010.35

Oct 2004 30
Table 4: Region of grades indexes and indicator values
Grade of appearanceIndicator value
Region of apparent grade
A25Less & 20-40
B5040-60
C7060-80
D9080-100 & above
Oct 2004 31
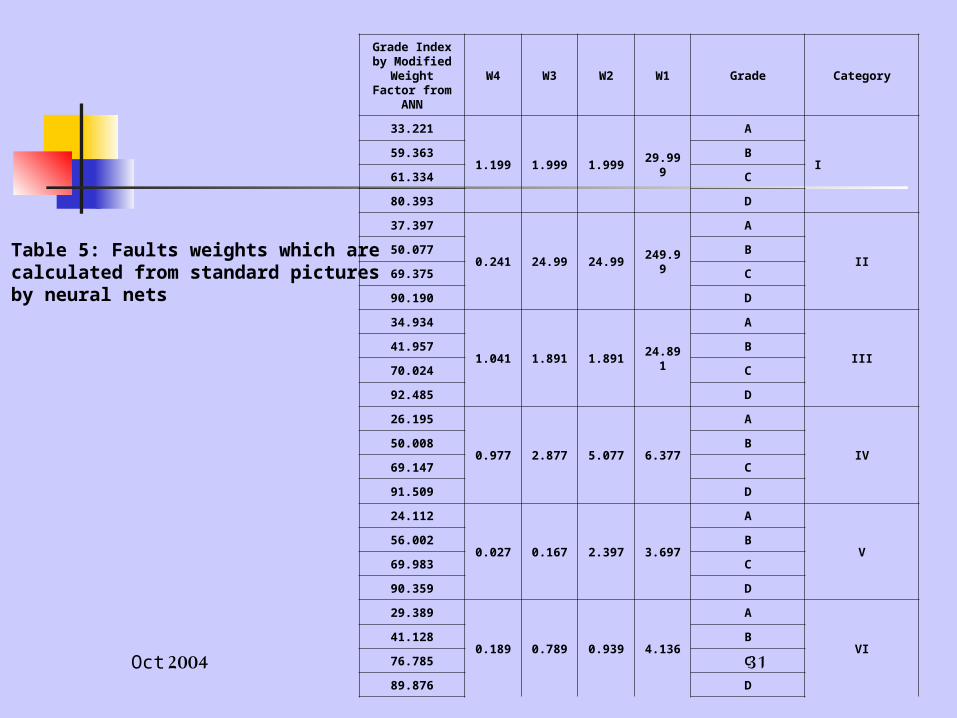
Table 5: Faults weights which are calculated from standard pictures by neural nets
CategoryGradeW1W2W3W4
Grade Index by Modified
Weight Factor from ANN
I
A
29.9991.9991.9991.199
33.221
B59.363
C61.334
D80.393
II
A
249.9924.9924.990.241
37.397
B50.077
C69.375
D90.190
III
A
24.8911.8911.8911.041
34.934
B41.957
C70.024
D92.485
IV
A
6.3775.0772.8770.977
26.195
B50.008
C69.147
D91.509
V
A
3.6972.3970.1670.027
24.112
B56.002
C69.983
D90.359
VI
A
4.1360.9390.7890.189
29.389
B41.128
C76.785
D89.876

Oct 2004 32
Table 6: Minimum error of training for neural nets
CategorySSEMinimum error
I322.64918.666
II154.11712.711
III169.53914.654
IV4.4321.923
V36.9423.995
VI144.02811.282

Oct 2004 33
Table 7: Recommended grades for grading of yarns based on appearance
Grade of yarn appearance based on ASTM grading
Developed gradesRegion of Index of degree
A
A+0-20
A20-30
A-30-40
BB+40-50
B50-60
CC+60-70
C70-80
D
D+80-90
D90-100
D-Above 100

Oct 2004 34
Detection and classification of faults from yarn board Measurement of faults by image analysis and box counting
method Grading of yarn appearance from measured faults by a classifier
criteria. Estimation of classifier criteria by using ANN. The error of grading is acceptable. The presented method is independent to faults nature and it works
based on their apparent parameters It is possible to develop this method for grading of other types of
yarn such as worsted, woolen, filament, high bulk and textured yarns
Conclusion


