37
January 2018 Graduate Student Enrolment Report 2017-18
January 2018
Graduate Student Enrolment Report 2017-18
1
Message from the Vice-Provost and Dean, Faculty of Graduate Studies and Research (FGSR)
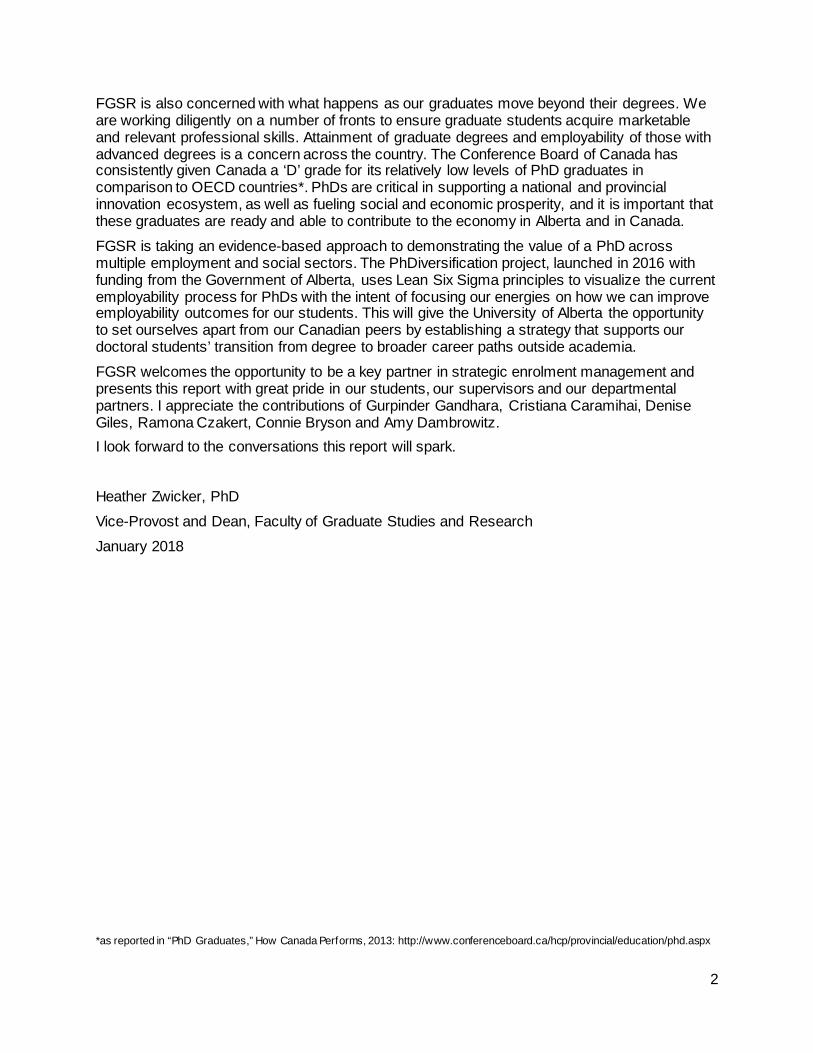
It is a pleasure to present the third annual report on graduate enrolment at the University of Alberta from the Faculty of Graduate Studies and Research (FGSR). This report provides a snapshot view of graduate education at the university and highlights the diversity of disciplines and specializations that we offer. Overall, total applications are up from 9,700 in 2016-17 to an estimated 14,500 in 2017-18, an increase of nearly 50%. While there is no question that interest in our graduate programs is growing, applicant numbers must be interpreted with caution. One important factor is the new graduate admissions system implemented in October 2017 as part of the Graduate Studies Management Solution (GSMS). The new system has eliminated the practice adopted by some departments of pre-screening applications. Because we now process more applicants within the shared system, there has been a marked increase in observable applications, particularly international applications, to certain departments. Another important insight is that the increase in total applications is primarily driven by a large increase in applications to course-based Master’s programs. The University of Alberta now has nearly 30% more course-based Master’s students than we had a decade ago. Of particular note, the Faculty of Engineering reopened enrolment to course-based Master of Engineering programs for Fall 2017, attracting nearly 2,000 applicants.
Eliminating applications that can be directly attributed to the migration to GSMS and the reopening of the Master of Engineering programs, overall applications for Fall 2017 were up by approximately 15%. Using the same method, international applications increased by 38%. This is in line with what our CALDO counterparts have been reporting for the same period. Looking ahead, we know that global conditions will continue to affect applicant behaviour and graduate enrolment. The current climate around immigration makes Canada an attractive option for many international graduate students. We’ve already had experience with this change in the geopolitical environment. Last March, FGSR waived graduate application fees for applicants from the seven countries affected by the US travel ban to support students whose plans were disrupted by a change in US visa policies in the middle of the application cycle. Similarly, Brexit might also make British graduate programs more expensive for, or inaccessible to, international students. Australia has tightened rules for temporary workers that may make the country less attractive to international students who plan to work in Australia after graduating. Local factors will also affect graduate applications and enrolments. One significant factor in students’ decisions about where to go for graduate school is funding packages. Minimum funding guarantees are under discussion at the University of Alberta as they are across the U15. In the fall of 2017, FGSR surveyed our primary graduate contacts and found that of the 64 PhD programs responding, 35 guarantee funding. This information is serving as a springboard for discussions on financial impact (overall impact may be small, but timing may be poor), recruitment (funding guarantees make a difference to students as they choose a place to study), and completion times (likely not a silver bullet, but consistent funding should impact some of the factors behind attrition).
2
FGSR is also concerned with what happens as our graduates move beyond their degrees. We are working diligently on a number of fronts to ensure graduate students acquire marketable and relevant professional skills. Attainment of graduate degrees and employability of those with advanced degrees is a concern across the country. The Conference Board of Canada has consistently given Canada a ‘D’ grade for its relatively low levels of PhD graduates in comparison to OECD countries*. PhDs are critical in supporting a national and provincial innovation ecosystem, as well as fueling social and economic prosperity, and it is important that these graduates are ready and able to contribute to the economy in Alberta and in Canada. FGSR is taking an evidence-based approach to demonstrating the value of a PhD across multiple employment and social sectors. The PhDiversification project, launched in 2016 with funding from the Government of Alberta, uses Lean Six Sigma principles to visualize the current employability process for PhDs with the intent of focusing our energies on how we can improve employability outcomes for our students. This will give the University of Alberta the opportunity to set ourselves apart from our Canadian peers by establishing a strategy that supports our doctoral students’ transition from degree to broader career paths outside academia. FGSR welcomes the opportunity to be a key partner in strategic enrolment management and presents this report with great pride in our students, our supervisors and our departmental partners. I appreciate the contributions of Gurpinder Gandhara, Cristiana Caramihai, Denise Giles, Ramona Czakert, Connie Bryson and Amy Dambrowitz. I look forward to the conversations this report will spark.
Heather Zwicker, PhD Vice-Provost and Dean, Faculty of Graduate Studies and Research
January 2018
*as reported in “PhD Graduates,” How Canada Performs, 2013: http://www.conferenceboard.ca/hcp/provincial/education/phd.aspx
3
Graduate Students at a Glance
2017-18 Graduate Enrolment Report - Table of Contents Message from the Vice-Provost and Dean, Faculty of Graduate Studies and Research (FGSR) 1 Graduate Students at a Glance ...................................................................................................... 3 2017-18 Graduate Enrolment Report - Table of Contents ............................................................. 4 Table and Figure Index ................................................................................................................... 5
1. Enrolment .................................................................................................................................... 6 1.1. Graduate Enrolment by Degree Type .............................................................................. 6
1.2. Faculty to Graduate Students Ratio ............................................................................... 12 1.3. Graduate/Undergraduate Enrolment Comparison ......................................................... 16
1.4. Graduate Students by Citizenship.................................................................................. 17 1.5. Sponsored Students ....................................................................................................... 19
1.6. Enrolment by Gender ..................................................................................................... 20 1.7. First Nations, Métis and Inuit Enrolment ........................................................................ 23
2. Applications and Admissions .................................................................................................... 24
2.1. Graduate Admissions ..................................................................................................... 24 2.2. Admissions Grade Point Average .................................................................................. 27
3. Convocation .............................................................................................................................. 29 3.1. Graduate Degrees Granted ............................................................................................ 29
3.2. Completion Times........................................................................................................... 30 3.3. Attrition and Completion Rates ...................................................................................... 32
4. Implications ............................................................................................................................... 36
5
Table and Figure Index
Figure 1.1 Graduate enrolment by degree type. 7 Figure 1.2. Trends in graduate enrolment by degree type. 7 Figure 1.3. Certificate programs, fall headcount by Faculty. 10 Figure 1.4. Fall term graduate enrolment by gender. 20 Figure 1.5. Doctoral enrolment by gender. 21 Figure 1.6. Thesis-based Master’s enrolment by gender. 22 Figure 1.7. Course-based Master’s enrolment by gender. 22 Figure 1.8. FNMI enrolment. 23 Figure 2.1. Total number of applications to graduate programs. 24 Figure 2.2. Domestic graduate admissions. 24 Figure 2.3. International graduate applications and admissions. 26 Figure 2.4. FMNI applications and admissions. 26 Figure 3.1. Convocants by degree. 29
Table 1.1 Graduate enrolment by degree type. 6 Table 1.2. Doctoral degree, fall headcount by Faculty. 8 Table 1.3. Master’s degree, fall headcount by Faculty. 9 Table 1.4. Certificate programs, fall headcount by Faculty. 10 Table 1.5. Other programs*, fall headcount by Faculty. 11 Table 1.6. Faculty to graduate students ratio, by Faculty. 12 Table 1.7. Faculty to doctoral students ratio, by Faculty. 13 Table 1.8. Faculty to thesis-based Master’s students ratio, by Faculty. 14 Table 1.9. Faculty to course-based Master’s students ratio, by Faculty. 15 Table 1.10. Undergraduate to graduate student ratio. 16 Table 1.11. Percentage of graduate students in total by Faculty. 16 Table 1.12. Graduate students by citizenship and Faculty. 17 Table 1.13. Top 15 source countries by student citizenship. 18 Table 1.14. Citizenship of sponsored graduate students. 19 Table 1.15. Fall term graduate enrolment by gender. 20 Table 1.16. FNMI enrolment by Faculty. 23 Table 2.1. Percentage of yearly applications, admissions and registrations in
the fall term. 25
Table 2.2. Doctoral average AGPA. 27 Table 2.3. Thesis-based Master’s average AGPA. 27 Table 2.4. Course-based Master’s average AGPA. 28 Table 3.1. Total convocants. 29 Table 3.2. Average completion time in years by degree type. 30 Table 3.3. Average completion times in years by citizenship. 31 Table 3.4. Attrition and completion rates by year. 32 Table 3.5. Doctoral attrition and completion rates. 33 Table 3.6. Thesis-based Master’s attrition and completion rates 34 Table 3.7. Course-based Master’s attrition and completion rates. 35
6
1. Enrolment This section presents enrolment numbers based on the standard December 1 headcounts, as reported to Statistics Canada and the Government of Alberta. Enrolment is a point-in-time snapshot and the December headcounts capture fall term registrations only. As a result, enrolment reported here does not reflect the total number of graduate students who have been on campus at various points during the year. Variation in graduate enrolment from one academic year to the next is due to three independent factors (new registrations, convocation, and attrition) and is best considered in reference to all three.
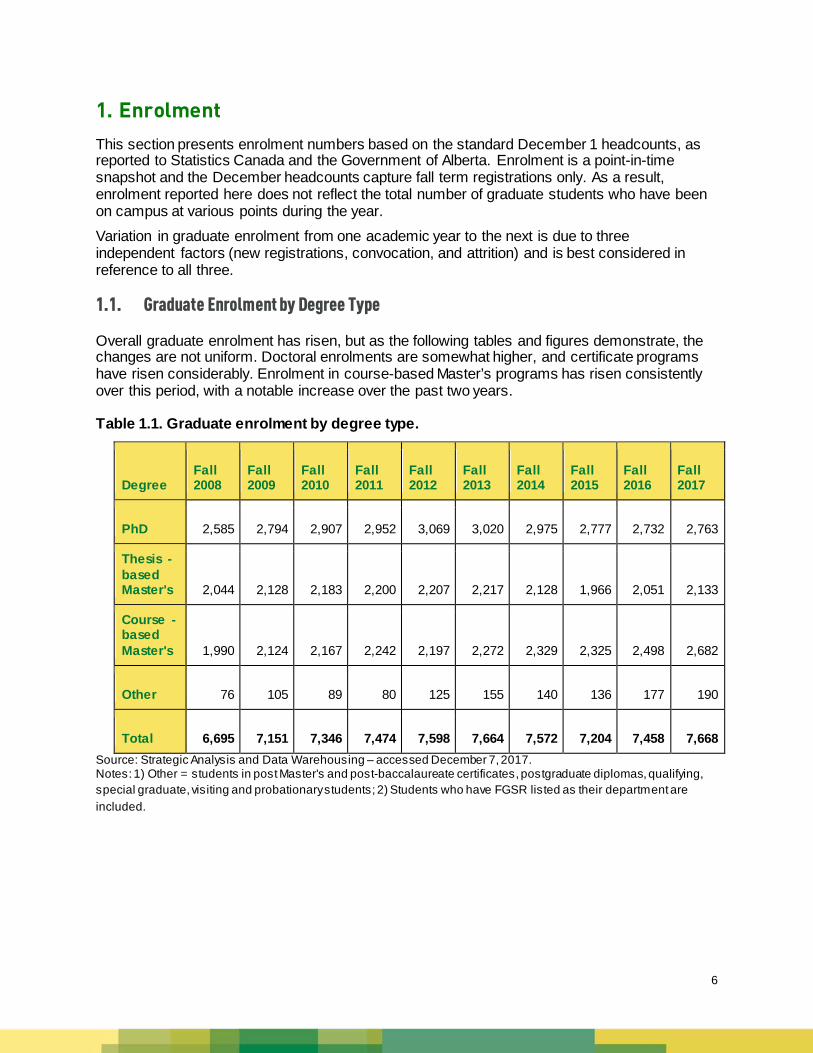
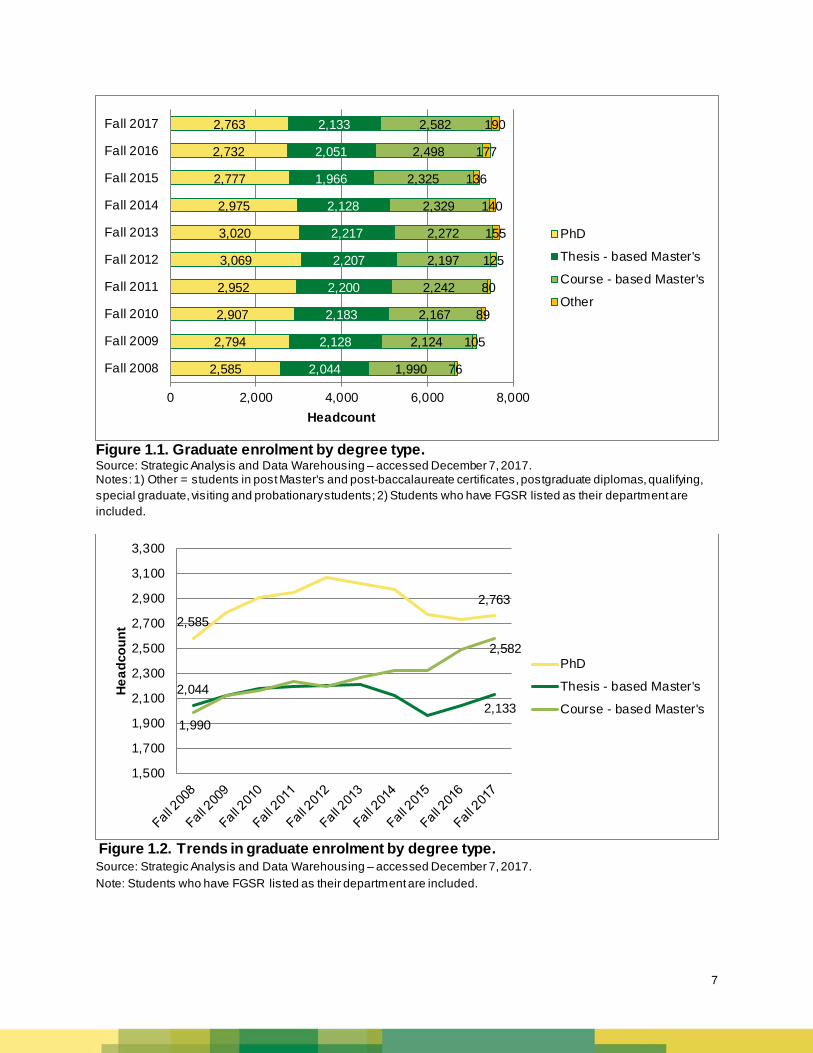
1.1. Graduate Enrolment by Degree Type Overall graduate enrolment has risen, but as the following tables and figures demonstrate, the changes are not uniform. Doctoral enrolments are somewhat higher, and certificate programs have risen considerably. Enrolment in course-based Master’s programs has risen consistently over this period, with a notable increase over the past two years. Table 1.1. Graduate enrolment by degree type.
Degree Fall 2008
Fall 2009
Fall 2010
Fall 2011
Fall 2012
Fall 2013
Fall 2014
Fall 2015
Fall 2016
Fall 2017
PhD 2,585 2,794 2,907 2,952 3,069 3,020 2,975 2,777 2,732 2,763
Thesis - based Master's 2,044 2,128 2,183 2,200 2,207 2,217 2,128 1,966 2,051 2,133
Course - based Master's 1,990 2,124 2,167 2,242 2,197 2,272 2,329 2,325 2,498 2,682
Other 76 105 89 80 125 155 140 136 177 190
Total 6,695 7,151 7,346 7,474 7,598 7,664 7,572 7,204 7,458 7,668 Source: Strategic Analysis and Data Warehousing – accessed December 7, 2017. Notes: 1) Other = students in post Master's and post-baccalaureate certificates, postgraduate diplomas, qualifying, special graduate, visiting and probationary students; 2) Students who have FGSR listed as their department are included.
7
Figure 1.1. Graduate enrolment by degree type. Source: Strategic Analysis and Data Warehousing – accessed December 7, 2017. Notes: 1) Other = students in post Master's and post-baccalaureate certificates, postgraduate diplomas, qualifying, special graduate, visiting and probationary students; 2) Students who have FGSR listed as their department are included.
Figure 1.2. Trends in graduate enrolment by degree type. Source: Strategic Analysis and Data Warehousing – accessed December 7, 2017. Note: Students who have FGSR listed as their department are included.
2,585
2,794
2,907
2,952
3,069
3,020
2,975
2,777
2,732
2,763
2,044
2,128
2,183
2,200
2,207
2,217
2,128
1,966
2,051
2,133
1,990
2,124
2,167
2,242
2,197
2,272
2,329
2,325
2,498
2,582
76
105
89
80
125
155
140
136
177
190
0 2,000 4,000 6,000 8,000
Fall 2008
Fall 2009
Fall 2010
Fall 2011
Fall 2012
Fall 2013
Fall 2014
Fall 2015
Fall 2016
Fall 2017
Headcount
PhD
Thesis - based Master's
Course - based Master's
Other
2,585
2,763
2,044 2,133
1,990
2,582
1,500
1,700
1,900
2,100
2,300
2,500
2,700
2,900
3,100
3,300
Head
coun
t
PhD
Thesis - based Master's
Course - based Master's

8
Fall term enrolment headcounts by Faculty are shown in Tables 1.2-1.5. We are particularly proud to welcome the five students registered in our innovative condensed PhD in Indigenous Studies, offered for the first time this fall in the Faculty of Native Studies. Reviewing the data by Faculty reveals that recent declines in PhD numbers are concentrated in Arts, Science, Business and Education (Table 1.2).
Table 1.2. Doctoral degree, fall headcount by Faculty. Faculty Fall 2013 Fall 2014 Fall 2015 Fall 2016 Fall 2017 ALES 235 237 230 221 220 Arts 478 452 413 412 394 Business 61 51 45 46 49 Education 291 295 257 246 255 Engineering 702 711 678 679 709 Extension Faculté Saint-Jean Faculty of Native Studies 5 Kinesiology, Sport, and Rec. 65 55 56 49 58 Law 8 7 7 8 7 Medicine and Dentistry 316 340 342 329 308 Nursing 65 68 64 68 66 Pharmacy 33 32 32 28 23 Public Health 42 45 50 47 57 Rehabilitation Medicine 38 36 37 35 45 Science 686 646 566 564 567 Total 3,020 2,975 2,777 2,732 2,763
Source: Strategic Analysis and Data Warehousing – accessed December 7, 2017.
9
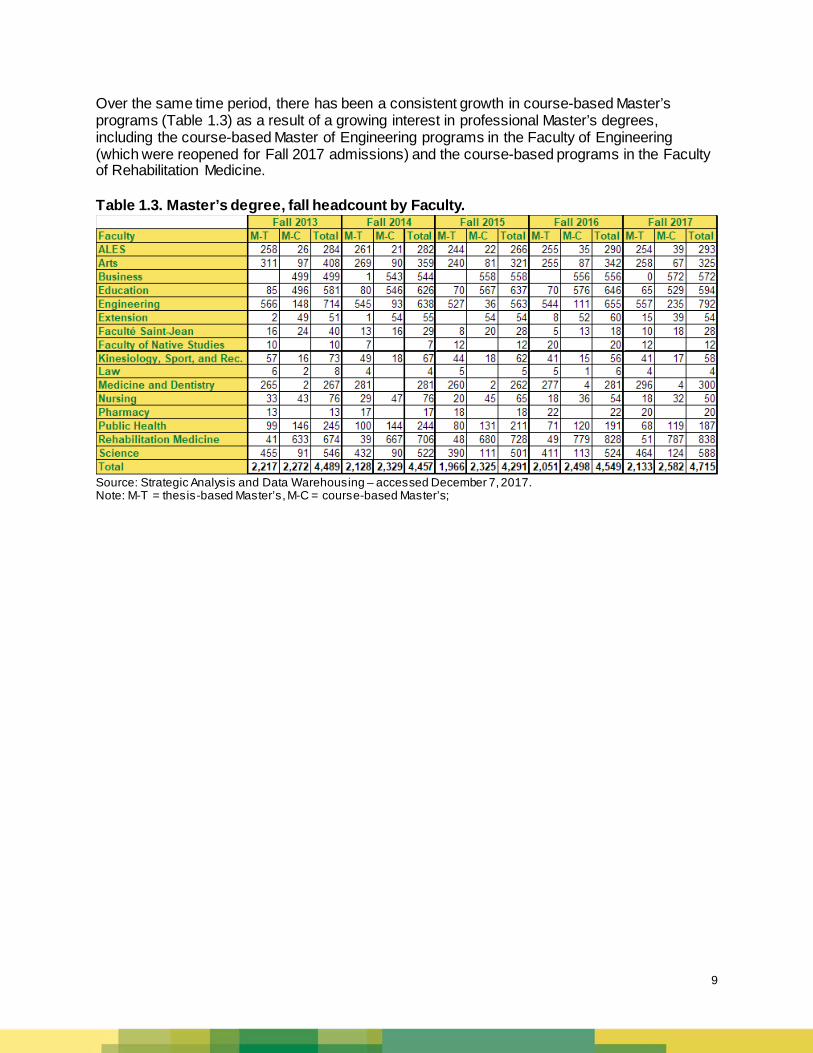
Over the same time period, there has been a consistent growth in course-based Master’s programs (Table 1.3) as a result of a growing interest in professional Master’s degrees, including the course-based Master of Engineering programs in the Faculty of Engineering (which were reopened for Fall 2017 admissions) and the course-based programs in the Faculty of Rehabilitation Medicine. Table 1.3. Master’s degree, fall headcount by Faculty.
Source: Strategic Analysis and Data Warehousing – accessed December 7, 2017. Note: M-T = thesis-based Master’s, M-C = course-based Master’s;
10
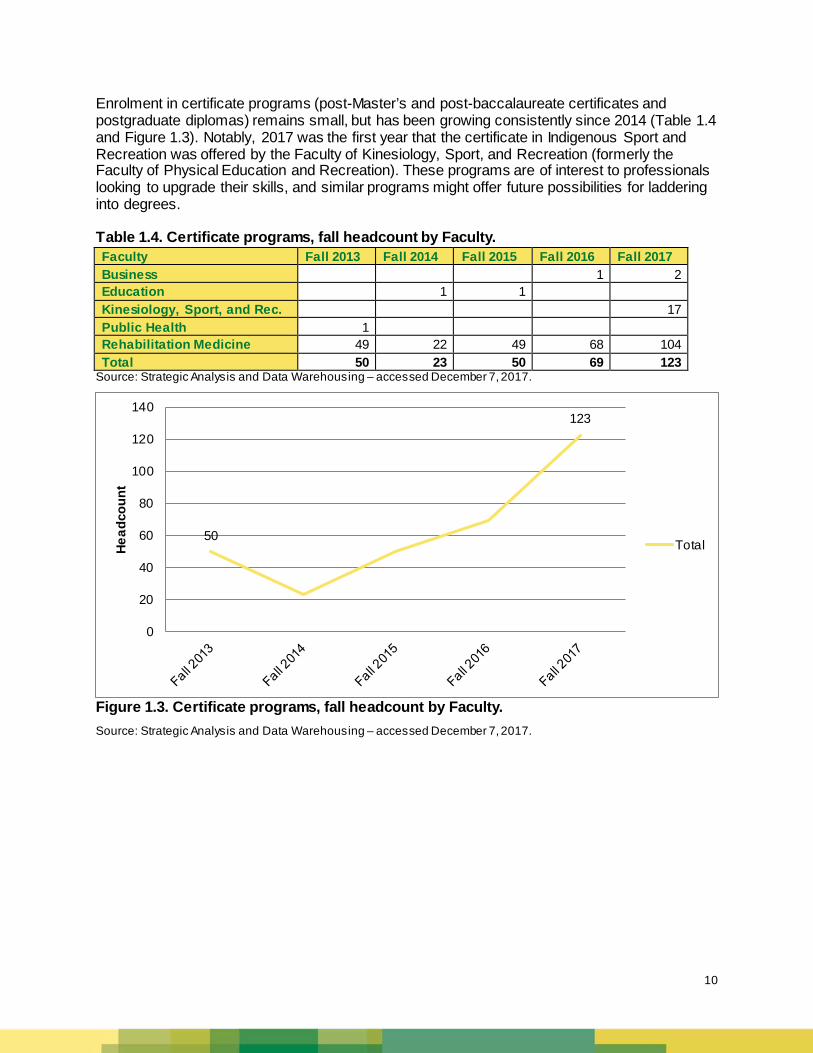
Enrolment in certificate programs (post-Master’s and post-baccalaureate certificates and postgraduate diplomas) remains small, but has been growing consistently since 2014 (Table 1.4 and Figure 1.3). Notably, 2017 was the first year that the certificate in Indigenous Sport and Recreation was offered by the Faculty of Kinesiology, Sport, and Recreation (formerly the Faculty of Physical Education and Recreation). These programs are of interest to professionals looking to upgrade their skills, and similar programs might offer future possibilities for laddering into degrees. Table 1.4. Certificate programs, fall headcount by Faculty. Faculty Fall 2013 Fall 2014 Fall 2015 Fall 2016 Fall 2017 Business 1 2 Education 1 1 Kinesiology, Sport, and Rec. 17 Public Health 1 Rehabilitation Medicine 49 22 49 68 104 Total 50 23 50 69 123
Source: Strategic Analysis and Data Warehousing – accessed December 7, 2017.
Figure 1.3. Certificate programs, fall headcount by Faculty. Source: Strategic Analysis and Data Warehousing – accessed December 7, 2017.
50
123
0
20
40
60
80
100
120
140
Head
coun
t
Total
11
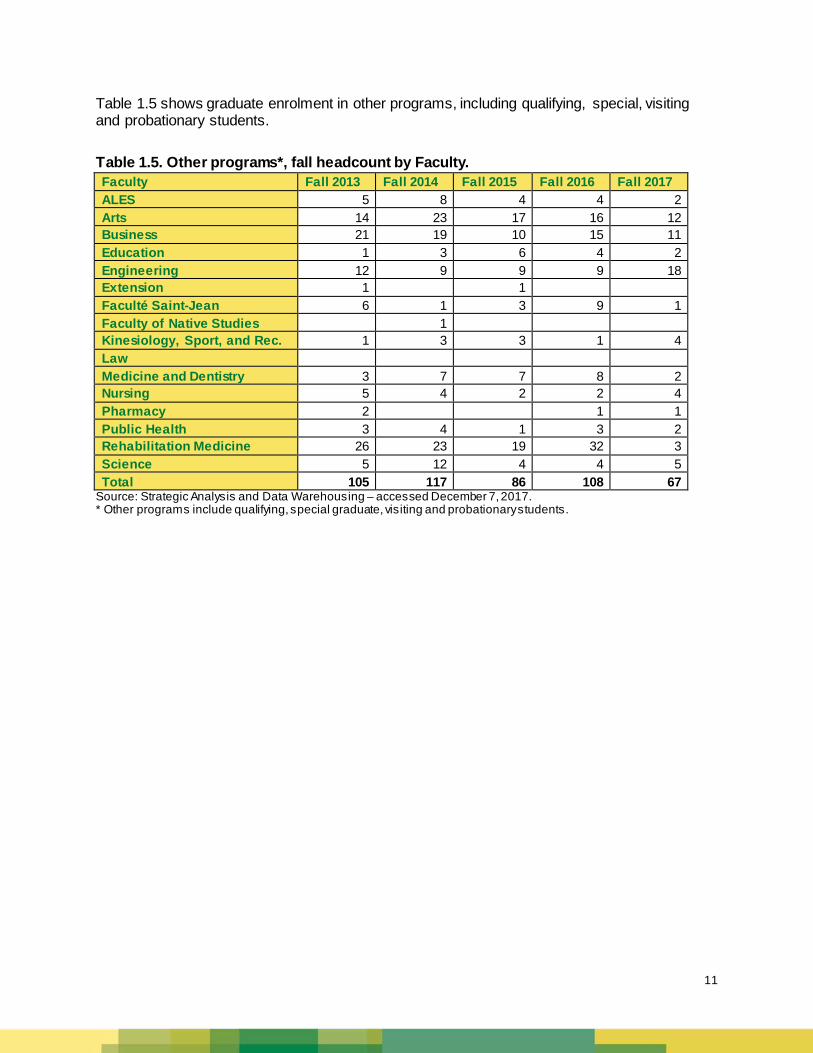
Table 1.5 shows graduate enrolment in other programs, including qualifying, special, visiting and probationary students. Table 1.5. Other programs*, fall headcount by Faculty. Faculty Fall 2013 Fall 2014 Fall 2015 Fall 2016 Fall 2017 ALES 5 8 4 4 2 Arts 14 23 17 16 12 Business 21 19 10 15 11 Education 1 3 6 4 2 Engineering 12 9 9 9 18 Extension 1 1 Faculté Saint-Jean 6 1 3 9 1 Faculty of Native Studies 1 Kinesiology, Sport, and Rec. 1 3 3 1 4 Law Medicine and Dentistry 3 7 7 8 2 Nursing 5 4 2 2 4 Pharmacy 2 1 1 Public Health 3 4 1 3 2 Rehabilitation Medicine 26 23 19 32 3 Science 5 12 4 4 5 Total 105 117 86 108 67
Source: Strategic Analysis and Data Warehousing – accessed December 7, 2017. * Other programs include qualifying, special graduate, visiting and probationary students.
12
1.2. Faculty to Graduate Students Ratio
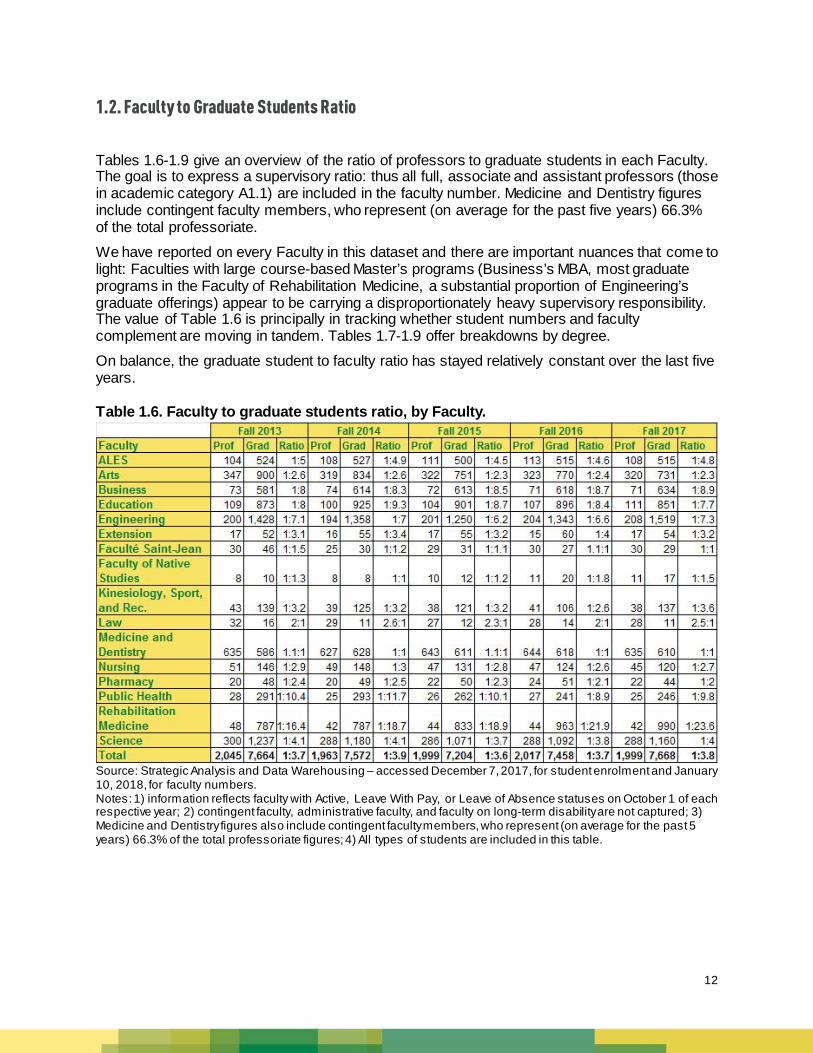
Tables 1.6-1.9 give an overview of the ratio of professors to graduate students in each Faculty. The goal is to express a supervisory ratio: thus all full, associate and assistant professors (those in academic category A1.1) are included in the faculty number. Medicine and Dentistry figures include contingent faculty members, who represent (on average for the past five years) 66.3% of the total professoriate. We have reported on every Faculty in this dataset and there are important nuances that come to light: Faculties with large course-based Master’s programs (Business’s MBA, most graduate programs in the Faculty of Rehabilitation Medicine, a substantial proportion of Engineering’s graduate offerings) appear to be carrying a disproportionately heavy supervisory responsibility. The value of Table 1.6 is principally in tracking whether student numbers and faculty complement are moving in tandem. Tables 1.7-1.9 offer breakdowns by degree. On balance, the graduate student to faculty ratio has stayed relatively constant over the last five years. Table 1.6. Faculty to graduate students ratio, by Faculty.
Source: Strategic Analysis and Data Warehousing – accessed December 7, 2017, for student enrolment and January 10, 2018, for faculty numbers. Notes: 1) information reflects faculty with Active, Leave With Pay, or Leave of Absence statuses on October 1 of each respective year; 2) contingent faculty, administrative faculty, and faculty on long-term disability are not captured; 3) Medicine and Dentistry figures also include contingent faculty members, who represent (on average for the past 5 years) 66.3% of the total professoriate figures; 4) All types of students are included in this table.
13
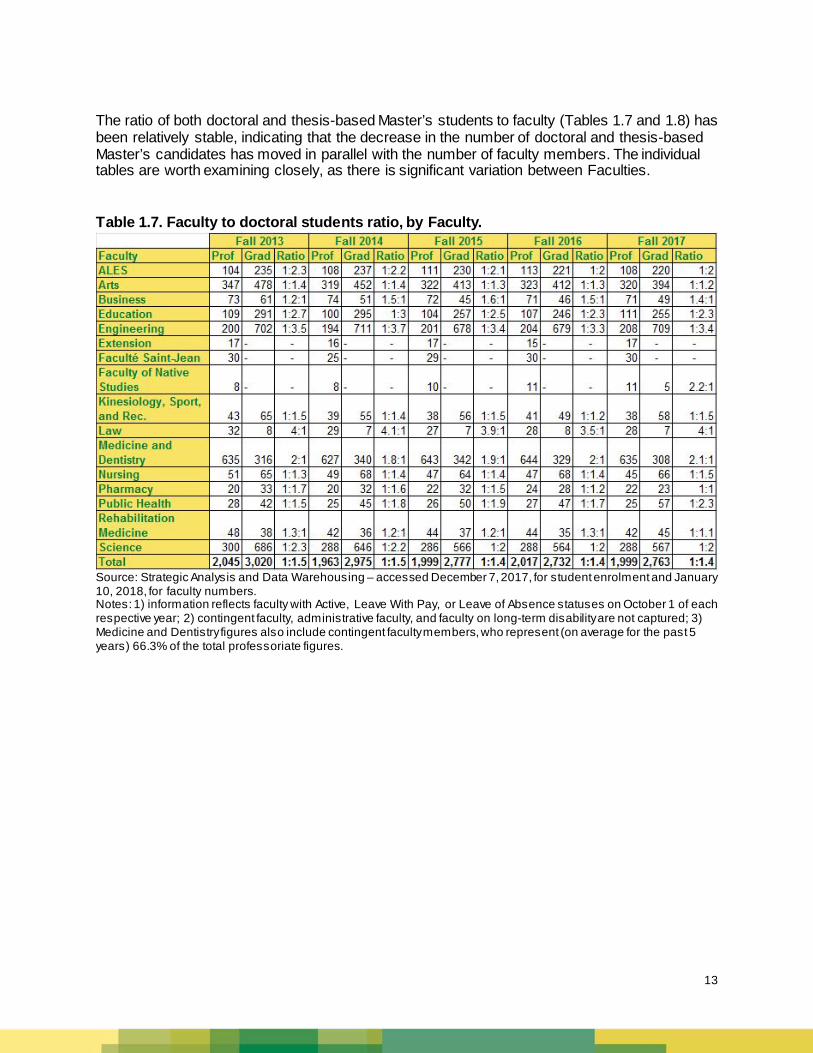
The ratio of both doctoral and thesis-based Master’s students to faculty (Tables 1.7 and 1.8) has been relatively stable, indicating that the decrease in the number of doctoral and thesis-based Master’s candidates has moved in parallel with the number of faculty members. The individual tables are worth examining closely, as there is significant variation between Faculties. Table 1.7. Faculty to doctoral students ratio, by Faculty.
Source: Strategic Analysis and Data Warehousing – accessed December 7, 2017, for student enrolment and January 10, 2018, for faculty numbers. Notes: 1) information reflects faculty with Active, Leave With Pay, or Leave of Absence statuses on October 1 of each respective year; 2) contingent faculty, administrative faculty, and faculty on long-term disability are not captured; 3) Medicine and Dentistry figures also include contingent faculty members, who represent (on average for the past 5 years) 66.3% of the total professoriate figures.
14
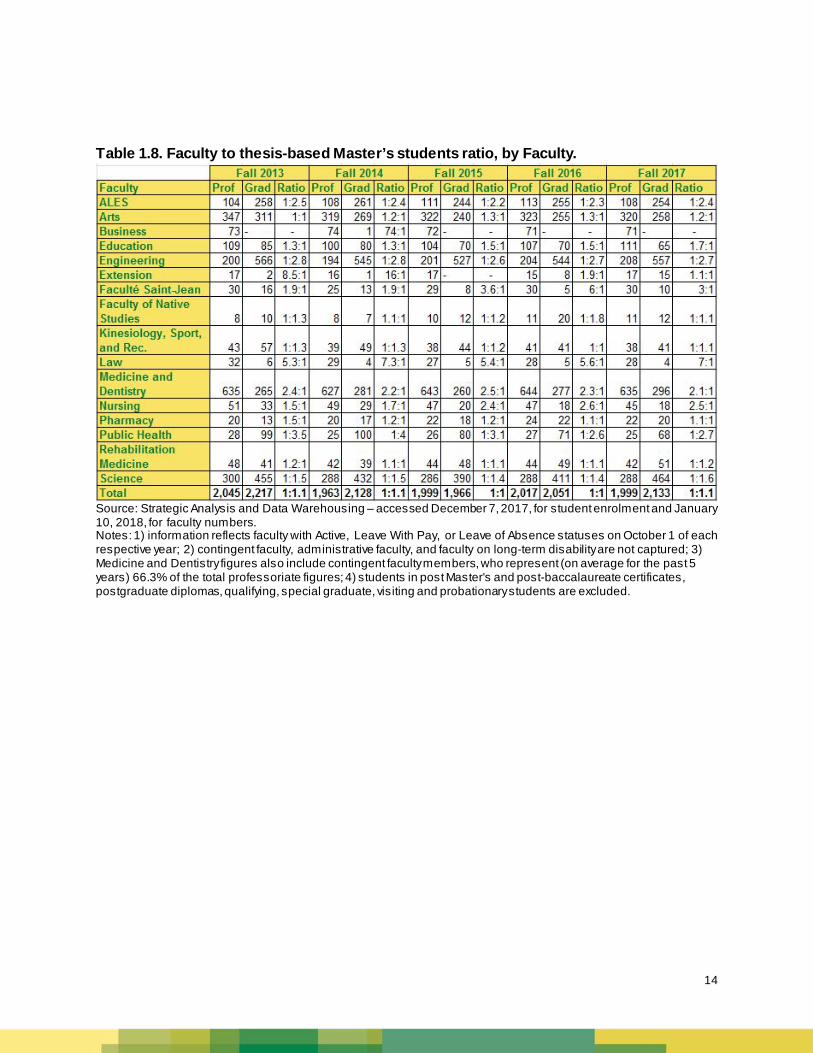
Table 1.8. Faculty to thesis-based Master’s students ratio, by Faculty.
Source: Strategic Analysis and Data Warehousing – accessed December 7, 2017, for student enrolment and January 10, 2018, for faculty numbers. Notes: 1) information reflects faculty with Active, Leave With Pay, or Leave of Absence statuses on October 1 of each respective year; 2) contingent faculty, administrative faculty, and faculty on long-term disability are not captured; 3) Medicine and Dentistry figures also include contingent faculty members, who represent (on average for the past 5 years) 66.3% of the total professoriate figures; 4) students in post Master's and post-baccalaureate certificates, postgraduate diplomas, qualifying, special graduate, visiting and probationary students are excluded.
15
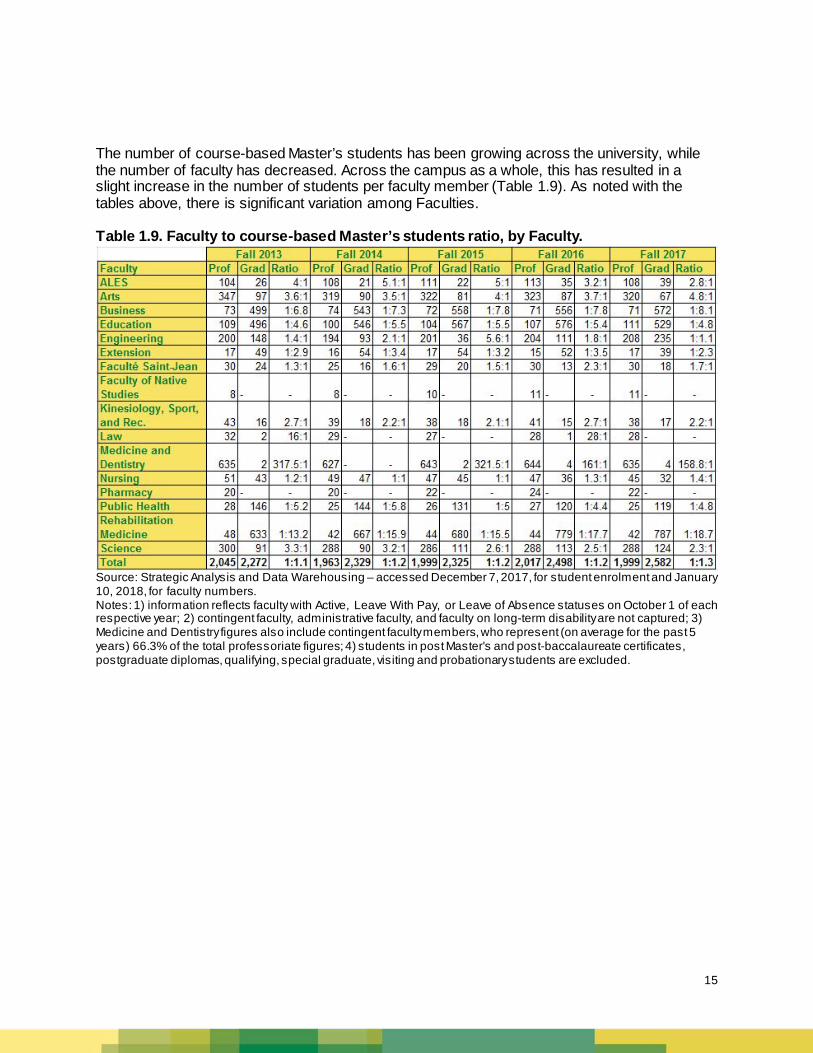
The number of course-based Master’s students has been growing across the university, while the number of faculty has decreased. Across the campus as a whole, this has resulted in a slight increase in the number of students per faculty member (Table 1.9). As noted with the tables above, there is significant variation among Faculties. Table 1.9. Faculty to course-based Master’s students ratio, by Faculty.
Source: Strategic Analysis and Data Warehousing – accessed December 7, 2017, for student enrolment and January 10, 2018, for faculty numbers. Notes: 1) information reflects faculty with Active, Leave With Pay, or Leave of Absence statuses on October 1 of each respective year; 2) contingent faculty, administrative faculty, and faculty on long-term disability are not captured; 3) Medicine and Dentistry figures also include contingent faculty members, who represent (on average for the past 5 years) 66.3% of the total professoriate figures; 4) students in post Master's and post-baccalaureate certificates, postgraduate diplomas, qualifying, special graduate, visiting and probationary students are excluded.
16
1.3. Graduate/Undergraduate Enrolment Comparison
Graduate students make up approximately 20% of the total student population at the University of Alberta. Table 1.10 demonstrates how graduate-intensive we are. Table 1.10. Undergraduate to graduate student ratio.
Source: Strategic Analysis and Data Warehousing – accessed December 7, 2017. Notes: 1) graduate students include all possible graduate degree types; 2) undergraduate students exclude career preparation (17 students in Fall 2014, 24 students in Fall 2015, 27 students in Fall 2016, 27 students in Fall 2017). Table 1.11 expresses how graduate-intensive individual Faculties are. While there is variation between units, the number of graduate students is also an indication of the capacity that these junior colleagues add to the university, supporting teaching and research across our campuses. Table 1.11. Percentage of graduate students in total by Faculty.
Source: Strategic Analysis and Data Warehousing – accessed December 7, 2017. Notes: 1) graduate students include all possible graduate degree types; 2) undergraduate students exclude career preparation (17 students in Fall 2014, 24 students in Fall 2015, 27 students in Fall 2016, 27 students in Fall 2017).
17
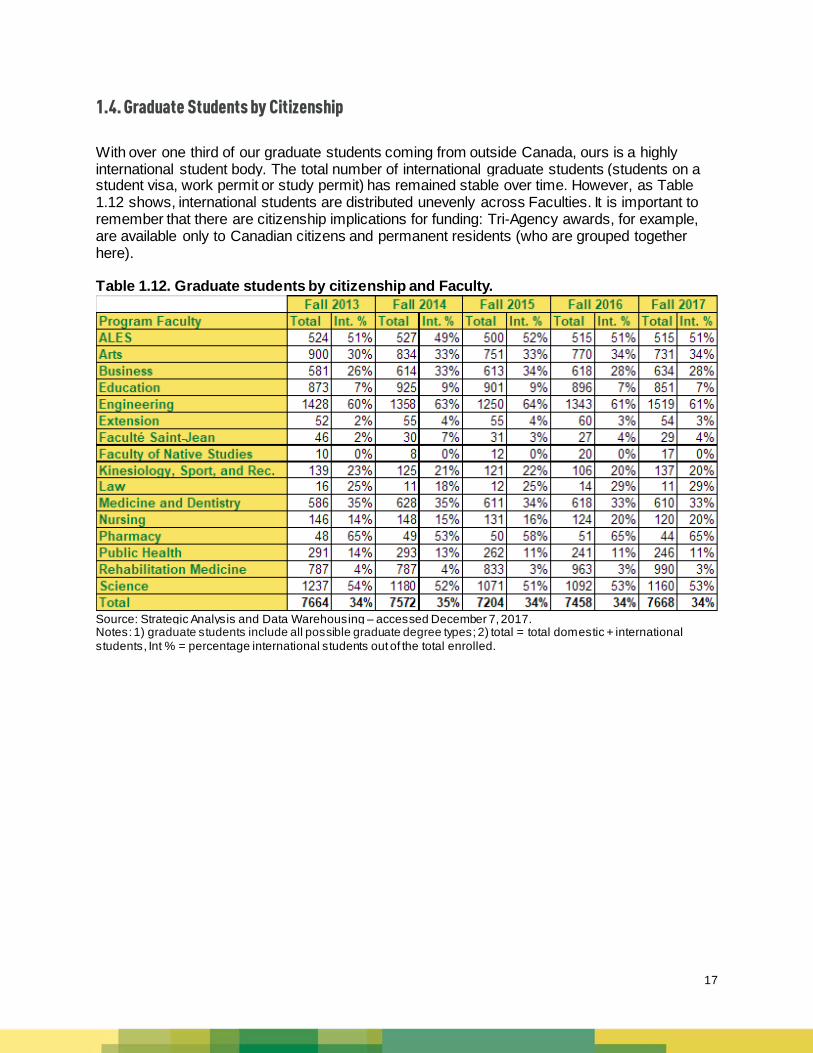
1.4. Graduate Students by Citizenship
With over one third of our graduate students coming from outside Canada, ours is a highly international student body. The total number of international graduate students (students on a student visa, work permit or study permit) has remained stable over time. However, as Table 1.12 shows, international students are distributed unevenly across Faculties. It is important to remember that there are citizenship implications for funding: Tri-Agency awards, for example, are available only to Canadian citizens and permanent residents (who are grouped together here). Table 1.12. Graduate students by citizenship and Faculty.
Source: Strategic Analysis and Data Warehousing – accessed December 7, 2017. Notes: 1) graduate students include all possible graduate degree types; 2) total = total domestic + international students, Int % = percentage international students out of the total enrolled.
18
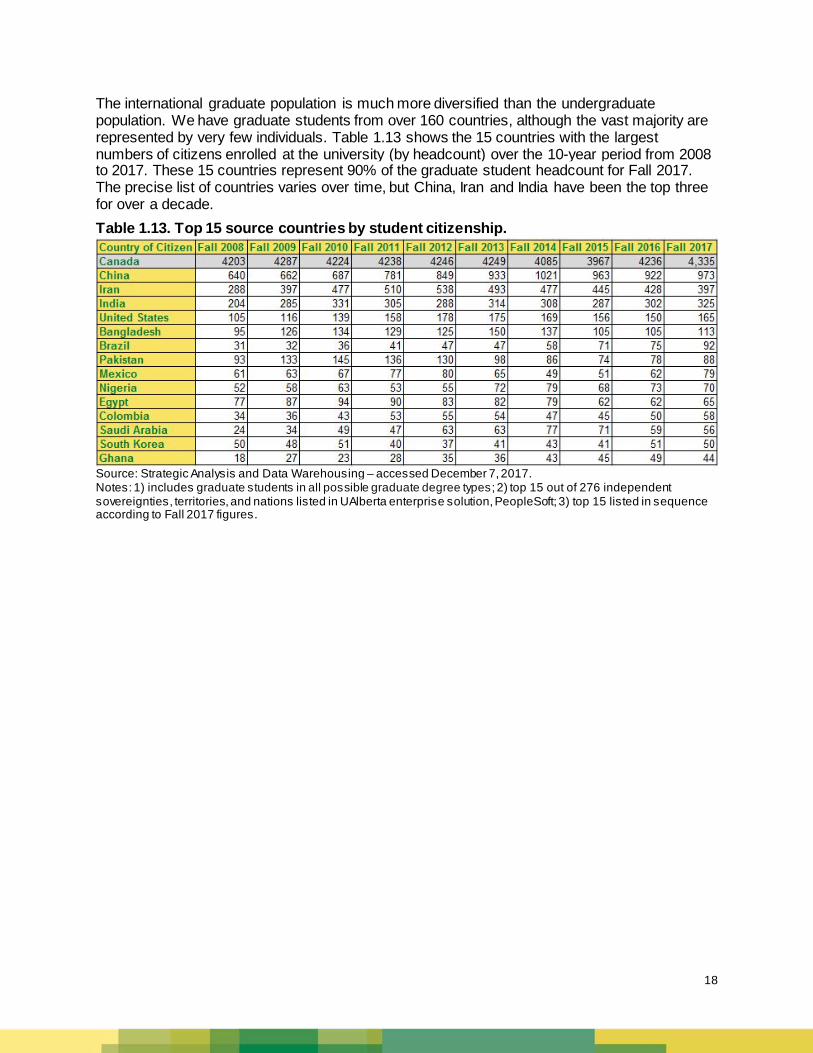
The international graduate population is much more diversified than the undergraduate population. We have graduate students from over 160 countries, although the vast majority are represented by very few individuals. Table 1.13 shows the 15 countries with the largest numbers of citizens enrolled at the university (by headcount) over the 10-year period from 2008 to 2017. These 15 countries represent 90% of the graduate student headcount for Fall 2017. The precise list of countries varies over time, but China, Iran and India have been the top three for over a decade. Table 1.13. Top 15 source countries by student citizenship.
Source: Strategic Analysis and Data Warehousing – accessed December 7, 2017. Notes: 1) includes graduate students in all possible graduate degree types; 2) top 15 out of 276 independent sovereignties, territories, and nations listed in UAlberta enterprise solution, PeopleSoft; 3) top 15 listed in sequence according to Fall 2017 figures.
19
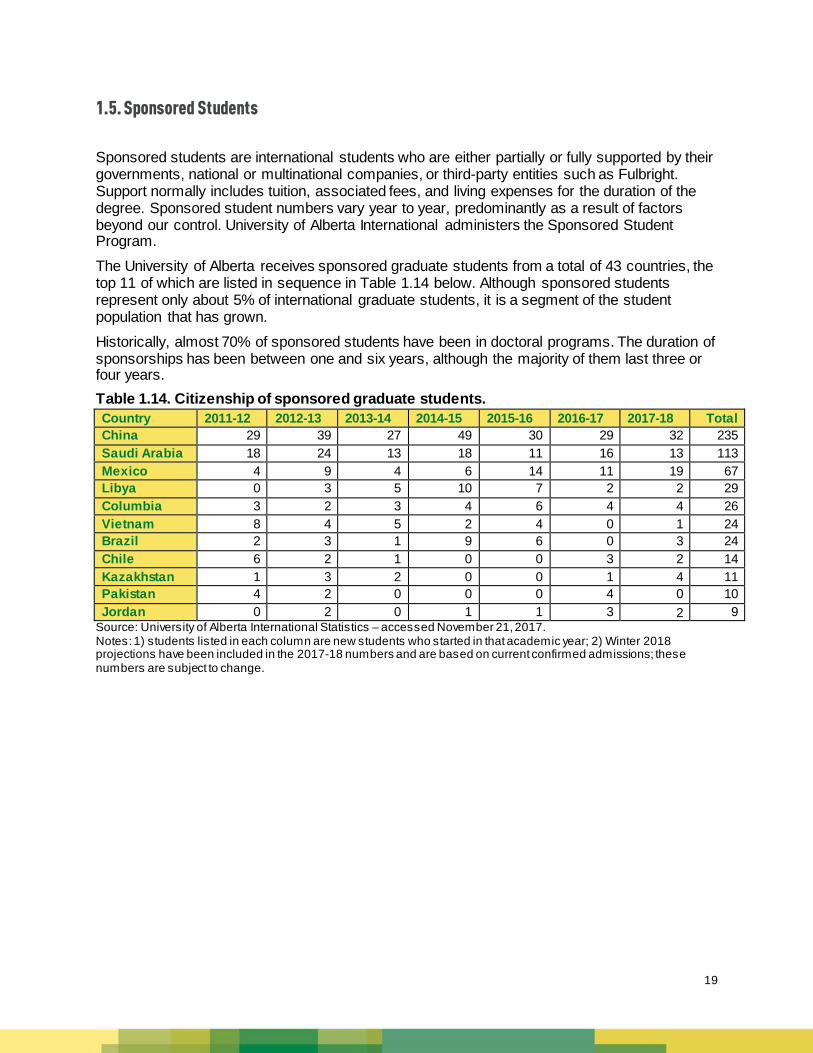
1.5. Sponsored Students
Sponsored students are international students who are either partially or fully supported by their governments, national or multinational companies, or third-party entities such as Fulbright. Support normally includes tuition, associated fees, and living expenses for the duration of the degree. Sponsored student numbers vary year to year, predominantly as a result of factors beyond our control. University of Alberta International administers the Sponsored Student Program. The University of Alberta receives sponsored graduate students from a total of 43 countries, the top 11 of which are listed in sequence in Table 1.14 below. Although sponsored students represent only about 5% of international graduate students, it is a segment of the student population that has grown. Historically, almost 70% of sponsored students have been in doctoral programs. The duration of sponsorships has been between one and six years, although the majority of them last three or four years. Table 1.14. Citizenship of sponsored graduate students. Country 2011-12 2012-13 2013-14 2014-15 2015-16 2016-17 2017-18 Total China 29 39 27 49 30 29 32 235 Saudi Arabia 18 24 13 18 11 16 13 113 Mexico 4 9 4 6 14 11 19 67 Libya 0 3 5 10 7 2 2 29 Columbia 3 2 3 4 6 4 4 26 Vietnam 8 4 5 2 4 0 1 24 Brazil 2 3 1 9 6 0 3 24 Chile 6 2 1 0 0 3 2 14 Kazakhstan 1 3 2 0 0 1 4 11 Pakistan 4 2 0 0 0 4 0 10 Jordan 0 2 0 1 1 3 2 9
Source: University of Alberta International Statistics – accessed November 21, 2017. Notes: 1) students listed in each column are new students who started in that academic year; 2) Winter 2018 projections have been included in the 2017-18 numbers and are based on current confirmed admissions; these numbers are subject to change.
20
1.6. Enrolment by Gender
Table 1.15 and Figure 1.4 show enrolment by gender for all graduate students including PhD, Master's, students in other categories, and students with a home department of FGSR. Overall, women continue to outnumber men in graduate studies. The new graduate admissions software allows applicants to self-identify as male or female, or to choose not to disclose. In 2017-2018, the first year of the software implementation, seven students did not declare a gender, as shown in Table 1.15. Over time, this change in practice will allow us to reflect our students’ gender diversity with more nuance. Table 1.15. Fall term graduate enrolment by gender.
Source: Strategic Analysis and Data Warehousing – accessed December 7, 2017.
Figure 1.4. Fall term graduate enrolment by gender. Source: Strategic Analysis and Data Warehousing – accessed December 7, 2017.
0
500
1000
1500
2000
2500
3000
3500
4000
Head
coun
t
Female
Male
21
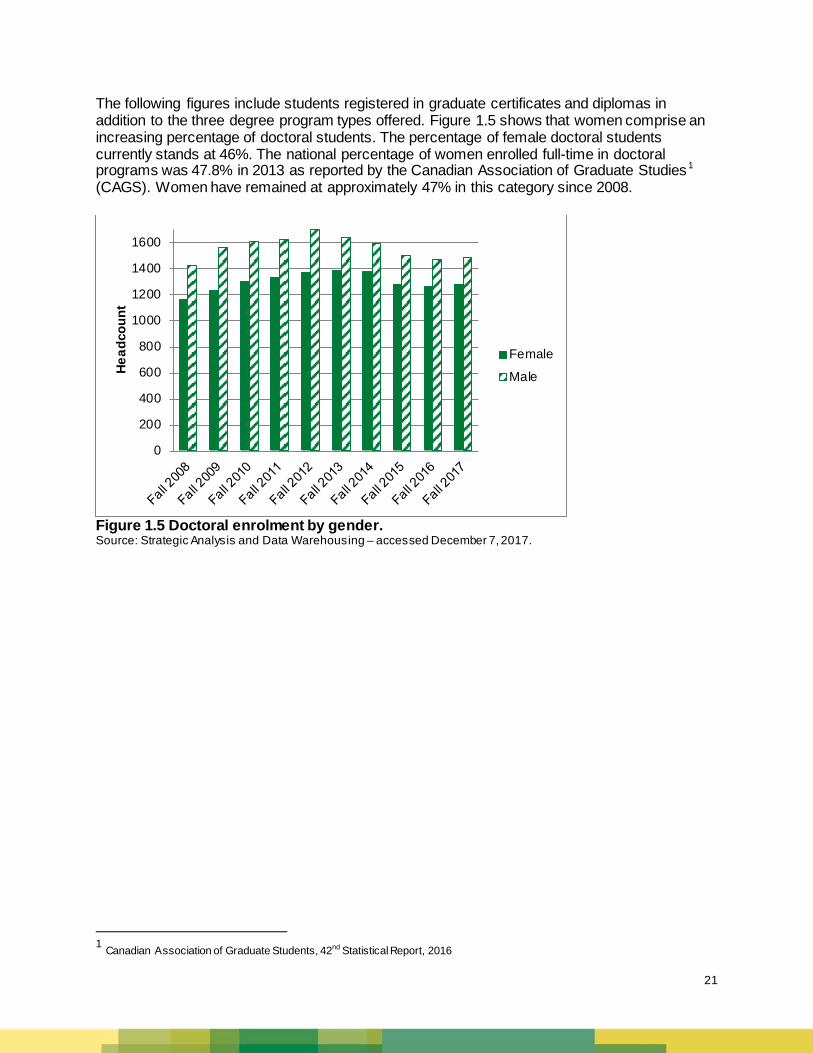
The following figures include students registered in graduate certificates and diplomas in addition to the three degree program types offered. Figure 1.5 shows that women comprise an increasing percentage of doctoral students. The percentage of female doctoral students currently stands at 46%. The national percentage of women enrolled full-time in doctoral programs was 47.8% in 2013 as reported by the Canadian Association of Graduate Studies1 (CAGS). Women have remained at approximately 47% in this category since 2008.
Figure 1.5 Doctoral enrolment by gender. Source: Strategic Analysis and Data Warehousing – accessed December 7, 2017.
1 Canadian Association of Graduate Students, 42nd Statistical Report, 2016
0
200
400
600
800
1000
1200
1400
1600
Head
coun
t
Female
Male
22
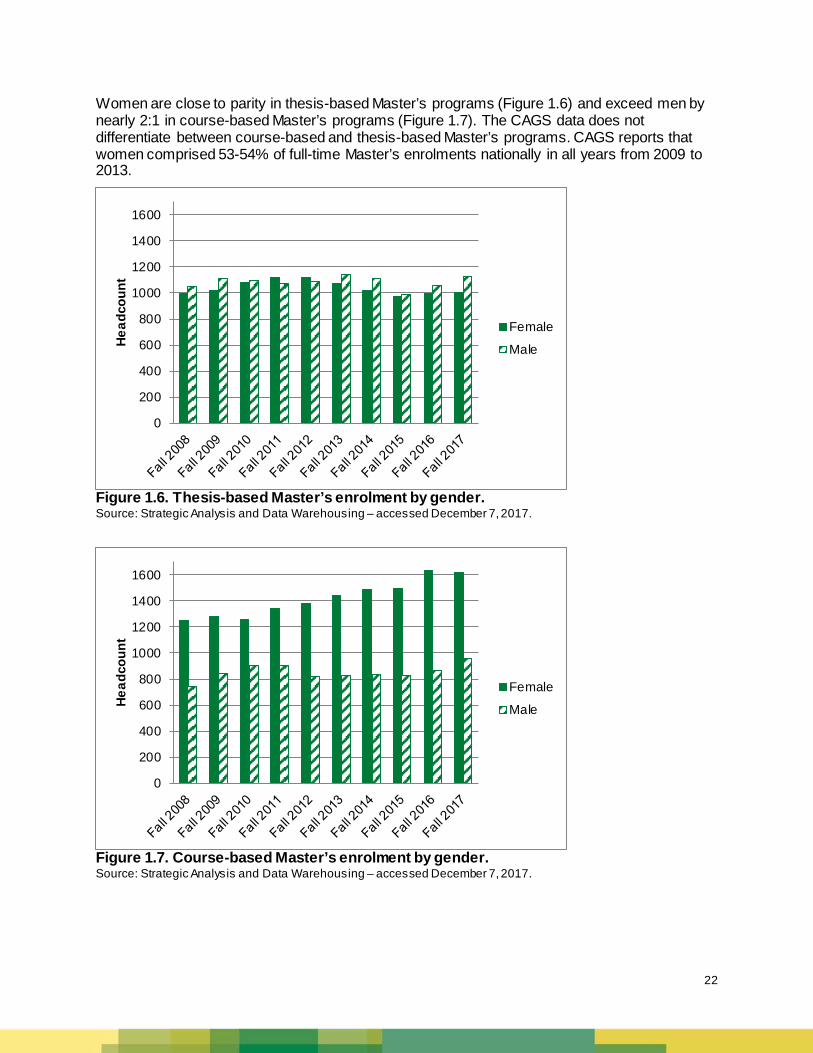
Women are close to parity in thesis-based Master’s programs (Figure 1.6) and exceed men by nearly 2:1 in course-based Master’s programs (Figure 1.7). The CAGS data does not differentiate between course-based and thesis-based Master’s programs. CAGS reports that women comprised 53-54% of full-time Master’s enrolments nationally in all years from 2009 to 2013.
Figure 1.6. Thesis-based Master’s enrolment by gender. Source: Strategic Analysis and Data Warehousing – accessed December 7, 2017.
Figure 1.7. Course-based Master’s enrolment by gender. Source: Strategic Analysis and Data Warehousing – accessed December 7, 2017.
0
200
400
600
800
1000
1200
1400
1600
Head
coun
t
Female
Male
0
200
400
600
800
1000
1200
1400
1600
Head
coun
t
Female
Male
23
1.7. First Nations, Métis and Inuit Enrolment
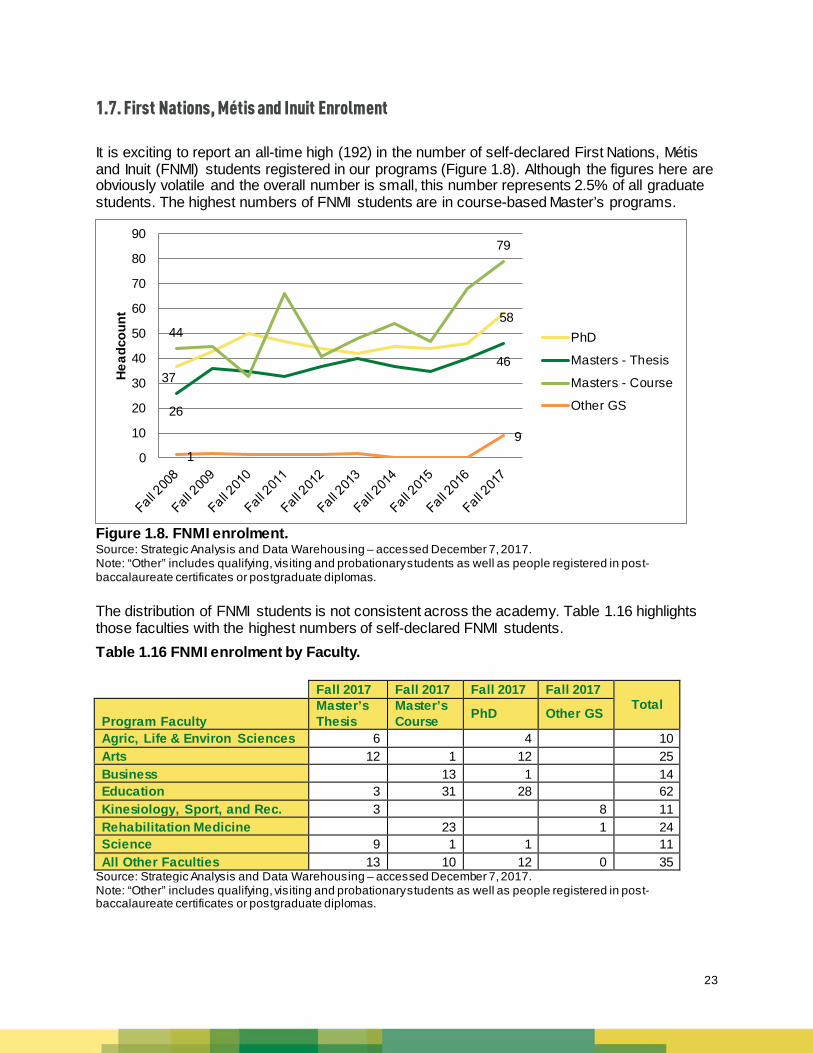
It is exciting to report an all-time high (192) in the number of self-declared First Nations, Métis and Inuit (FNMI) students registered in our programs (Figure 1.8). Although the figures here are obviously volatile and the overall number is small, this number represents 2.5% of all graduate students. The highest numbers of FNMI students are in course-based Master’s programs.
Figure 1.8. FNMI enrolment. Source: Strategic Analysis and Data Warehousing – accessed December 7, 2017. Note: “Other” includes qualifying, visiting and probationary students as well as people registered in post-baccalaureate certificates or postgraduate diplomas. The distribution of FNMI students is not consistent across the academy. Table 1.16 highlights those faculties with the highest numbers of self-declared FNMI students. Table 1.16 FNMI enrolment by Faculty.
Fall 2017 Fall 2017 Fall 2017 Fall 2017
Total Program Faculty
Master’s Thesis
Master’s Course PhD Other GS
Agric, Life & Environ Sciences 6 4 10 Arts 12 1 12 25 Business 13 1 14 Education 3 31 28 62 Kinesiology, Sport, and Rec. 3 8 11 Rehabilitation Medicine 23 1 24 Science 9 1 1 11 All Other Faculties 13 10 12 0 35
Source: Strategic Analysis and Data Warehousing – accessed December 7, 2017. Note: “Other” includes qualifying, visiting and probationary students as well as people registered in post-baccalaureate certificates or postgraduate diplomas.
37
58
26
46
44
79
1 9
0
10
20
30
40
50
60
70
80
90
Head
coun
t
PhD
Masters - Thesis
Masters - Course
Other GS
24
2. Applications and Admissions Graduate applications for 2017-18 reached an all-time high. As noted in the Dean’s message, an important factor behind the marked increase in the total number of applicants is the new graduate admissions system implemented as part of the Graduate Studies Management Solution (GSMS). Previously, some departments pre-screened applicants and did not send them on to the university admissions system if they were not qualified. Migration to the new system allows the university to better understand the true demand for our programs, a key measure for our quality assurance processes. All applications processed in the new system have been included in this analysis.
2.1. Graduate Admissions
Figure 2.1 shows the total number of applications for admission to graduate programs, the number of admissions offered and the number of subsequent registrations. This approach counts applications, not applicants: some applicants may have submitted multiple applications (though this is more likely at the undergraduate level). We continue to be competitive, admitting only about one third of the students who apply to our graduate programs. The yield rate (percentage of registrations resulting from offers of admission) moves in tandem with the rate of admission, which gives stability and predictability – factors that are especially important for funding projections.
Figure 2.1. Total number of applications to graduate programs. Source: Strategic Analysis and Data Warehousing – accessed December 8, 2017. *Academic year figures (Sept to Aug) for 2017-18 were estimated based on the average proportion of fall admissions to total admissions over the preceding three-year period.
8,156
14,436
3,361 3,806
2,579 2,677 0
2,000
4,000
6,000
8,000
10,000
12,000
14,000
16,000
Head
coun
t
Applications
Applicants Admitted
Applicants Registered
25
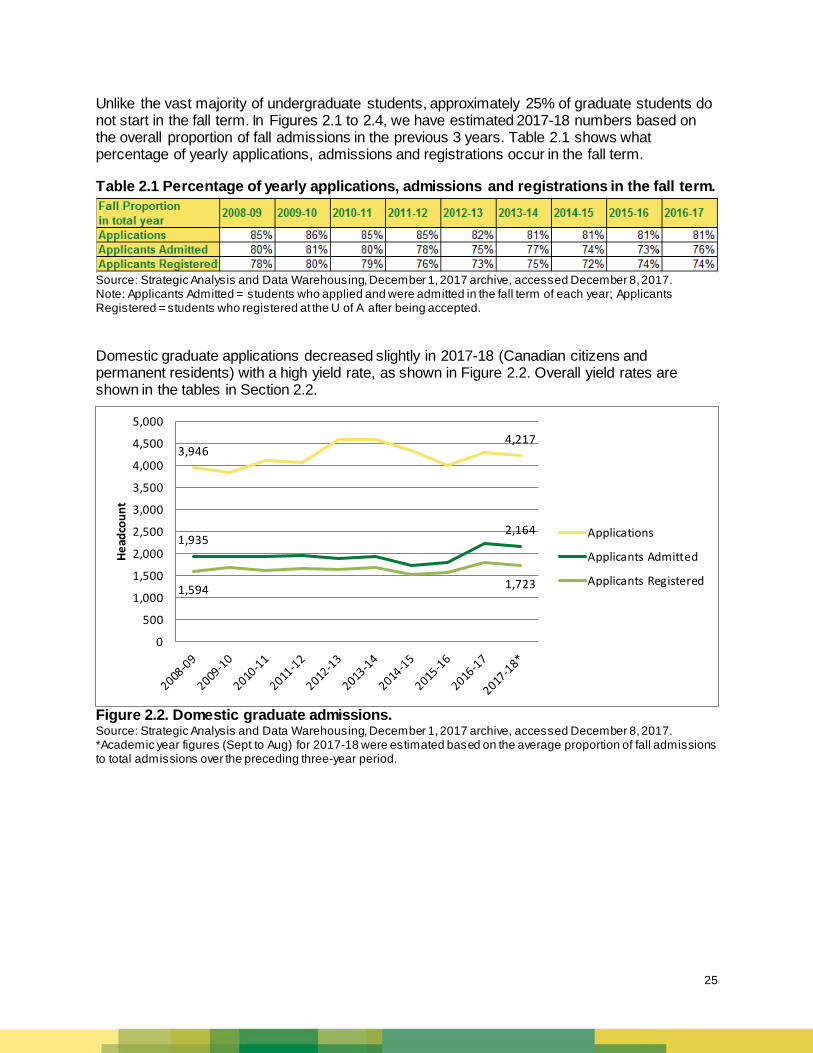
Unlike the vast majority of undergraduate students, approximately 25% of graduate students do not start in the fall term. In Figures 2.1 to 2.4, we have estimated 2017-18 numbers based on the overall proportion of fall admissions in the previous 3 years. Table 2.1 shows what percentage of yearly applications, admissions and registrations occur in the fall term. Table 2.1 Percentage of yearly applications, admissions and registrations in the fall term.
Source: Strategic Analysis and Data Warehousing, December 1, 2017 archive, accessed December 8, 2017. Note: Applicants Admitted = students who applied and were admitted in the fall term of each year; Applicants Registered = students who registered at the U of A after being accepted. Domestic graduate applications decreased slightly in 2017-18 (Canadian citizens and permanent residents) with a high yield rate, as shown in Figure 2.2. Overall yield rates are shown in the tables in Section 2.2.
Figure 2.2. Domestic graduate admissions. Source: Strategic Analysis and Data Warehousing, December 1, 2017 archive, accessed December 8, 2017. *Academic year figures (Sept to Aug) for 2017-18 were estimated based on the average proportion of fall admissions to total admissions over the preceding three-year period.
3,946 4,217
1,935 2,164
1,594 1,723
0
500
1,000
1,500
2,000
2,500
3,000
3,500
4,000
4,500
5,000
Head
coun
t
Applications
Applicants Admitted
Applicants Registered
26
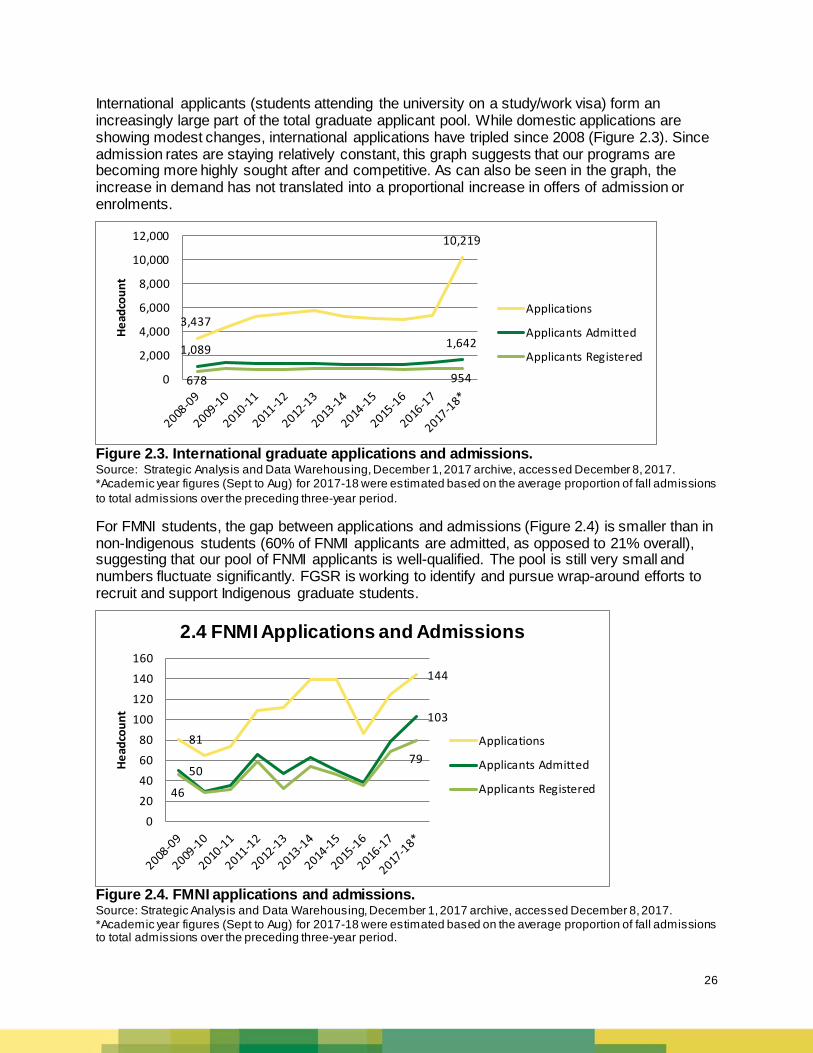
International applicants (students attending the university on a study/work visa) form an increasingly large part of the total graduate applicant pool. While domestic applications are showing modest changes, international applications have tripled since 2008 (Figure 2.3). Since admission rates are staying relatively constant, this graph suggests that our programs are becoming more highly sought after and competitive. As can also be seen in the graph, the increase in demand has not translated into a proportional increase in offers of admission or enrolments.
Figure 2.3. International graduate applications and admissions. Source: Strategic Analysis and Data Warehousing, December 1, 2017 archive, accessed December 8, 2017. *Academic year figures (Sept to Aug) for 2017-18 were estimated based on the average proportion of fall admissions to total admissions over the preceding three-year period.
For FMNI students, the gap between applications and admissions (Figure 2.4) is smaller than in non-Indigenous students (60% of FNMI applicants are admitted, as opposed to 21% overall), suggesting that our pool of FNMI applicants is well-qualified. The pool is still very small and numbers fluctuate significantly. FGSR is working to identify and pursue wrap-around efforts to recruit and support Indigenous graduate students.
Figure 2.4. FMNI applications and admissions. Source: Strategic Analysis and Data Warehousing, December 1, 2017 archive, accessed December 8, 2017. *Academic year figures (Sept to Aug) for 2017-18 were estimated based on the average proportion of fall admissions to total admissions over the preceding three-year period.
3,437
10,219
1,089 1,642
678 954 0
2,000
4,000
6,000
8,000
10,000
12,000
Head
coun
t
Applications
Applicants Admitted
Applicants Registered
81
144
50
103
46
79
020406080
100120140160
Head
coun
t
2.4 FNMI Applications and Admissions
Applications
Applicants Admitted
Applicants Registered
27
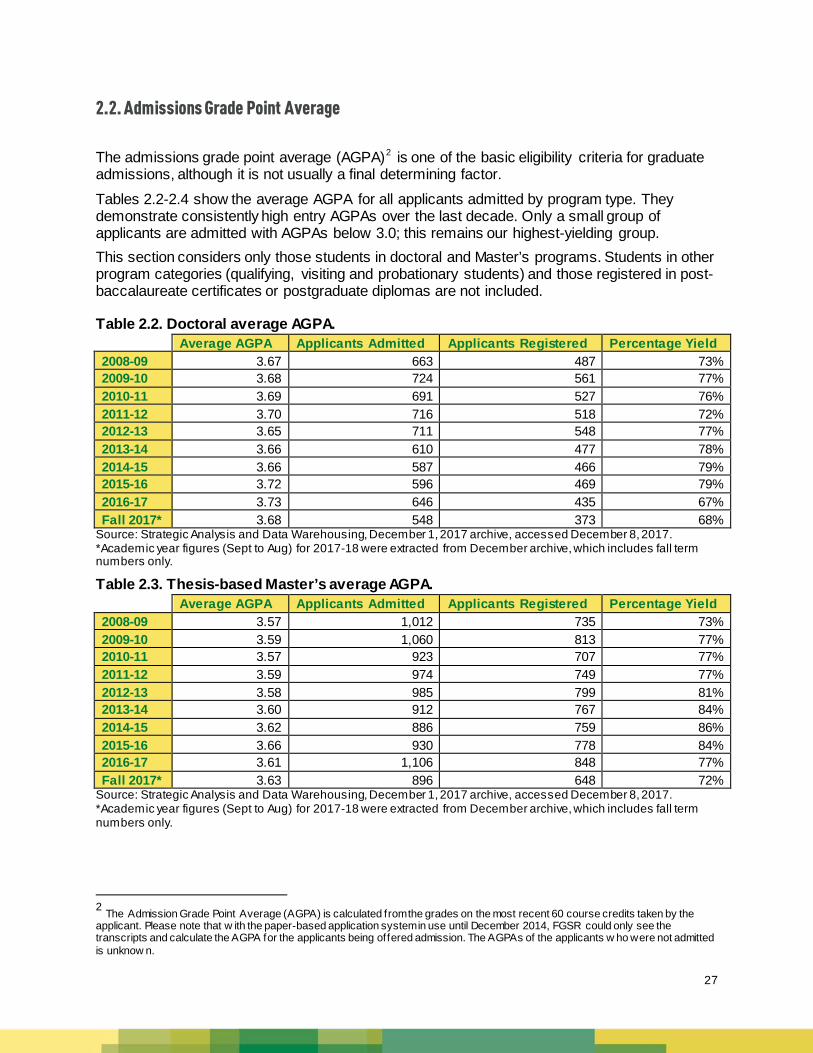
2.2. Admissions Grade Point Average
The admissions grade point average (AGPA)2 is one of the basic eligibility criteria for graduate admissions, although it is not usually a final determining factor. Tables 2.2-2.4 show the average AGPA for all applicants admitted by program type. They demonstrate consistently high entry AGPAs over the last decade. Only a small group of applicants are admitted with AGPAs below 3.0; this remains our highest-yielding group. This section considers only those students in doctoral and Master’s programs. Students in other program categories (qualifying, visiting and probationary students) and those registered in post-baccalaureate certificates or postgraduate diplomas are not included. Table 2.2. Doctoral average AGPA.
Average AGPA Applicants Admitted Applicants Registered Percentage Yield
2008-09 3.67 663 487 73% 2009-10 3.68 724 561 77% 2010-11 3.69 691 527 76% 2011-12 3.70 716 518 72% 2012-13 3.65 711 548 77% 2013-14 3.66 610 477 78% 2014-15 3.66 587 466 79% 2015-16 3.72 596 469 79% 2016-17 3.73 646 435 67% Fall 2017* 3.68 548 373 68%
Source: Strategic Analysis and Data Warehousing, December 1, 2017 archive, accessed December 8, 2017. *Academic year figures (Sept to Aug) for 2017-18 were extracted from December archive, which includes fall term numbers only. Table 2.3. Thesis-based Master’s average AGPA.
Average AGPA Applicants Admitted Applicants Registered Percentage Yield
2008-09 3.57 1,012 735 73% 2009-10 3.59 1,060 813 77% 2010-11 3.57 923 707 77% 2011-12 3.59 974 749 77% 2012-13 3.58 985 799 81% 2013-14 3.60 912 767 84% 2014-15 3.62 886 759 86% 2015-16 3.66 930 778 84% 2016-17 3.61 1,106 848 77% Fall 2017* 3.63 896 648 72%
Source: Strategic Analysis and Data Warehousing, December 1, 2017 archive, accessed December 8, 2017. *Academic year figures (Sept to Aug) for 2017-18 were extracted from December archive, which includes fall term numbers only.
2 The Admission Grade Point Average (AGPA) is calculated from the grades on the most recent 60 course credits taken by the applicant. Please note that w ith the paper-based application system in use until December 2014, FGSR could only see the transcripts and calculate the AGPA for the applicants being offered admission. The AGPAs of the applicants w ho were not admitted is unknow n.
28
Table 2.4. Course-based Master’s average AGPA.
Average AGPA Applicants Admitted Applicants Registered Percentage Yield
2008-09 3.46 1,161 892 77% 2009-10 3.51 1,366 1,040 76% 2010-11 3.53 1,430 1,053 74% 2011-12 3.49 1,425 1,129 79% 2012-13 3.49 1,235 981 79% 2013-14 3.49 1,403 1,136 81% 2014-15 3.53 1,247 991 79% 2015-16 3.56 1,263 1,002 79% 2016-17 3.51 1,637 1,182 72% Fall 2017* 3.56 1,216 806 66%
Source: Strategic Analysis and Data Warehousing, December 1, 2017 archive, accessed December 8, 2017. *Academic year figures (Sept to Aug) for 2017-18 were extracted from December archive, which includes fall term numbers only.
29
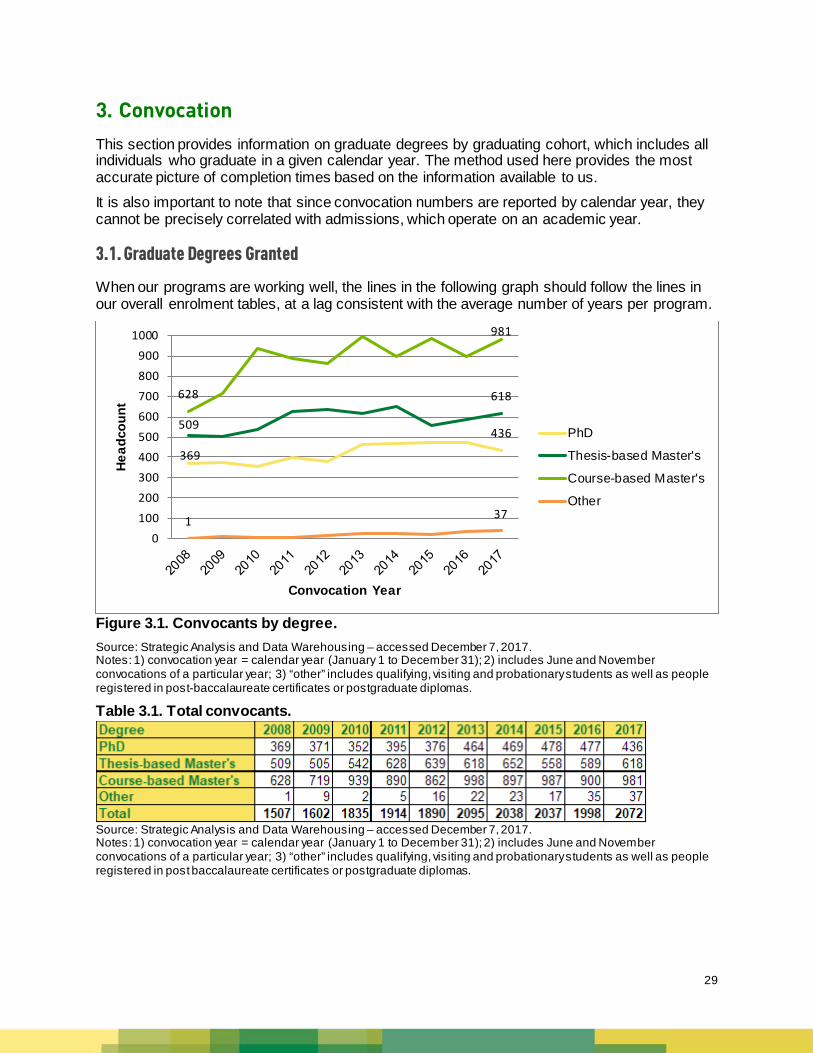
3. Convocation This section provides information on graduate degrees by graduating cohort, which includes all individuals who graduate in a given calendar year. The method used here provides the most accurate picture of completion times based on the information available to us. It is also important to note that since convocation numbers are reported by calendar year, they cannot be precisely correlated with admissions, which operate on an academic year.
3.1. Graduate Degrees Granted
When our programs are working well, the lines in the following graph should follow the lines in our overall enrolment tables, at a lag consistent with the average number of years per program.
Figure 3.1. Convocants by degree. Source: Strategic Analysis and Data Warehousing – accessed December 7, 2017. Notes: 1) convocation year = calendar year (January 1 to December 31); 2) includes June and November convocations of a particular year; 3) “other” includes qualifying, visiting and probationary students as well as people registered in post-baccalaureate certificates or postgraduate diplomas. Table 3.1. Total convocants.
Source: Strategic Analysis and Data Warehousing – accessed December 7, 2017. Notes: 1) convocation year = calendar year (January 1 to December 31); 2) includes June and November convocations of a particular year; 3) “other” includes qualifying, visiting and probationary students as well as people registered in post baccalaureate certificates or postgraduate diplomas.
369
436 509
618 628
981
1 37
0100200300400500600700800900
1000
Head
coun
t
Convocation Year
PhD
Thesis-based Master's
Course-based Master's
Other
30
3.2. Completion Times
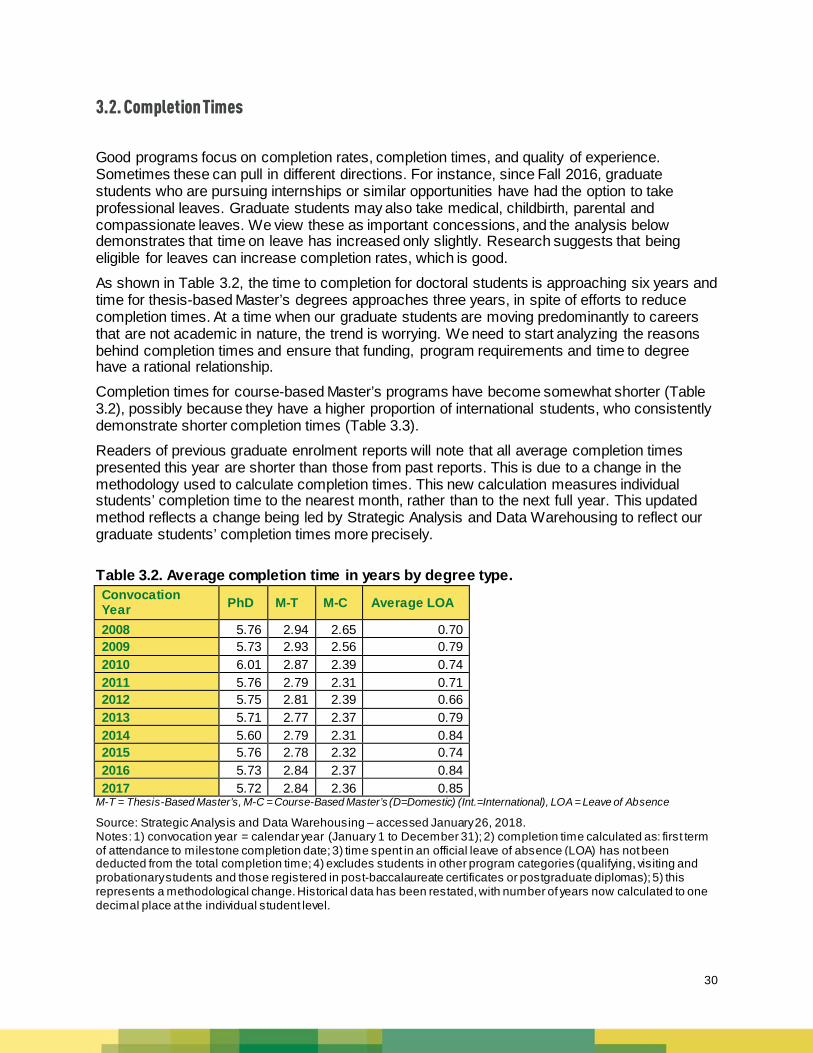
Good programs focus on completion rates, completion times, and quality of experience. Sometimes these can pull in different directions. For instance, since Fall 2016, graduate students who are pursuing internships or similar opportunities have had the option to take professional leaves. Graduate students may also take medical, childbirth, parental and compassionate leaves. We view these as important concessions, and the analysis below demonstrates that time on leave has increased only slightly. Research suggests that being eligible for leaves can increase completion rates, which is good. As shown in Table 3.2, the time to completion for doctoral students is approaching six years and time for thesis-based Master’s degrees approaches three years, in spite of efforts to reduce completion times. At a time when our graduate students are moving predominantly to careers that are not academic in nature, the trend is worrying. We need to start analyzing the reasons behind completion times and ensure that funding, program requirements and time to degree have a rational relationship. Completion times for course-based Master’s programs have become somewhat shorter (Table 3.2), possibly because they have a higher proportion of international students, who consistently demonstrate shorter completion times (Table 3.3).
Readers of previous graduate enrolment reports will note that all average completion times presented this year are shorter than those from past reports. This is due to a change in the methodology used to calculate completion times. This new calculation measures individual students’ completion time to the nearest month, rather than to the next full year. This updated method reflects a change being led by Strategic Analysis and Data Warehousing to reflect our graduate students’ completion times more precisely. Table 3.2. Average completion time in years by degree type. Convocation Year PhD M-T M-C Average LOA
2008 5.76 2.94 2.65 0.70 2009 5.73 2.93 2.56 0.79 2010 6.01 2.87 2.39 0.74 2011 5.76 2.79 2.31 0.71 2012 5.75 2.81 2.39 0.66 2013 5.71 2.77 2.37 0.79 2014 5.60 2.79 2.31 0.84 2015 5.76 2.78 2.32 0.74 2016 5.73 2.84 2.37 0.84 2017 5.72 2.84 2.36 0.85
M-T = Thesis-Based Master’s, M-C = Course-Based Master’s (D=Domestic) (Int.=International), LOA = Leave of Absence Source: Strategic Analysis and Data Warehousing – accessed January 26, 2018. Notes: 1) convocation year = calendar year (January 1 to December 31); 2) completion time calculated as: first term of attendance to milestone completion date; 3) time spent in an official leave of absence (LOA) has not been deducted from the total completion time; 4) excludes students in other program categories (qualifying, visiting and probationary students and those registered in post-baccalaureate certificates or postgraduate diplomas); 5) this represents a methodological change. Historical data has been restated, with number of years now calculated to one decimal place at the individual student level.
31
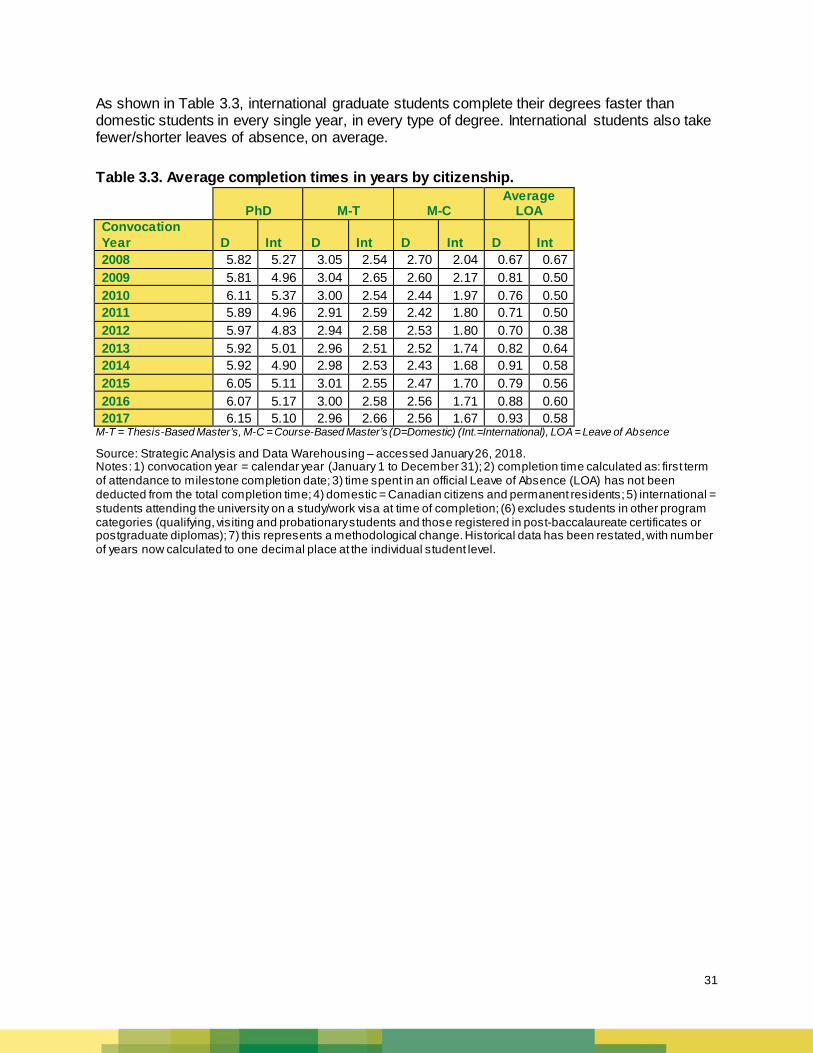
As shown in Table 3.3, international graduate students complete their degrees faster than domestic students in every single year, in every type of degree. International students also take fewer/shorter leaves of absence, on average. Table 3.3. Average completion times in years by citizenship.
PhD M-T M-C
Average LOA
Convocation Year D Int D Int D Int D Int 2008 5.82 5.27 3.05 2.54 2.70 2.04 0.67 0.67 2009 5.81 4.96 3.04 2.65 2.60 2.17 0.81 0.50 2010 6.11 5.37 3.00 2.54 2.44 1.97 0.76 0.50 2011 5.89 4.96 2.91 2.59 2.42 1.80 0.71 0.50 2012 5.97 4.83 2.94 2.58 2.53 1.80 0.70 0.38 2013 5.92 5.01 2.96 2.51 2.52 1.74 0.82 0.64 2014 5.92 4.90 2.98 2.53 2.43 1.68 0.91 0.58 2015 6.05 5.11 3.01 2.55 2.47 1.70 0.79 0.56 2016 6.07 5.17 3.00 2.58 2.56 1.71 0.88 0.60 2017 6.15 5.10 2.96 2.66 2.56 1.67 0.93 0.58
M-T = Thesis-Based Master’s, M-C = Course-Based Master’s (D=Domestic) (Int.=International), LOA = Leave of Absence Source: Strategic Analysis and Data Warehousing – accessed January 26, 2018. Notes: 1) convocation year = calendar year (January 1 to December 31); 2) completion time calculated as: first term of attendance to milestone completion date; 3) time spent in an official Leave of Absence (LOA) has not been deducted from the total completion time; 4) domestic = Canadian citizens and permanent residents; 5) international = students attending the university on a study/work visa at time of completion; (6) excludes students in other program categories (qualifying, visiting and probationary students and those registered in post-baccalaureate certificates or postgraduate diplomas); 7) this represents a methodological change. Historical data has been restated, with number of years now calculated to one decimal place at the individual student level.
32
3.3. Attrition and Completion Rates
To determine our completion and attrition rates, we first divide each cohort of graduate students starting in a given academic year into three groups: those who were still active as of the end of spring term; those who have convocated; and those who have left the university without any credential. Students currently recorded as active may either convocate or leave their program without a degree. Thus attrition rates become increasingly speculative as we move toward the present. In Table 3.4, we did not calculate attrition and completion rates for cohorts that fall within the average time to completion of a PhD (~6 years, or 2012-2013) and this masks the Master’s rates. The program-specific tables (Tables 3.5-3.7) break out this information more fully.
Table 3.4. Attrition and completion rates by year.
Applicants Registered Completed
Still Active
Program Not Completed
Attrition Rate
Completion Rate
1999-00 1,284 1,035 0 249 19% 81% 2000-01 1,351 1,143 0 208 15% 85% 2001-02 1,441 1,209 0 232 16% 84% 2002-03 1,630 1,379 0 251 15% 85% 2003-04 1,739 1,481 0 258 15% 85% 2004-05 1,654 1,403 2 249 15% 85% 2005-06 1,601 1,361 5 235 15% 85% 2006-07 1,825 1,539 10 276 15% 84% 2007-08 2,026 1,719 17 290 14% 85% 2008-09 2,085 1812 16 257 12% 87% 2009-10 2,367 2032 69 266 ~11% ~86% 2010-11 2222 1865 114 243 ~11% ~84% 2011-12 2337 1891 210 236 ~10% ~81% 2012-13 2275 1609 435 231 N/A N/A 2013-14 2331 1523 608 200 N/A N/A 2014-15 2171 1042 991 138 N/A N/A 2015-16 2200 451 1631 118 N/A N/A 2016-17 2458 38 2374 46 N/A N/A Fall 2017* 1882 0 1882 0 N/A N/A
Source: Extracted from PeopleSoft; internal script, accessed November 21, 2017. *Fall term data only. Notes: 1) figures are calculated taking into account the convocant's program at the time of admission; 2) excludes students in other program categories (qualifying, visiting and probationary students as well as people registered in post baccalaureate certificates or postgraduate diplomas).
33
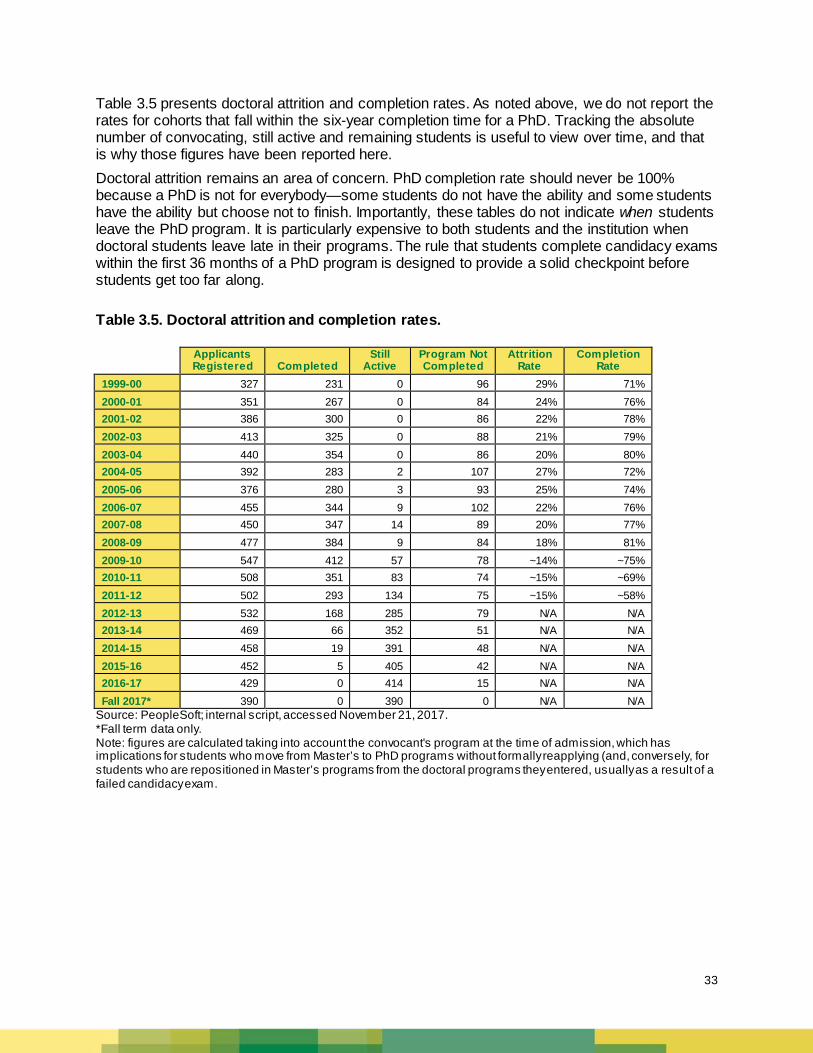
Table 3.5 presents doctoral attrition and completion rates. As noted above, we do not report the rates for cohorts that fall within the six-year completion time for a PhD. Tracking the absolute number of convocating, still active and remaining students is useful to view over time, and that is why those figures have been reported here. Doctoral attrition remains an area of concern. PhD completion rate should never be 100% because a PhD is not for everybody—some students do not have the ability and some students have the ability but choose not to finish. Importantly, these tables do not indicate when students leave the PhD program. It is particularly expensive to both students and the institution when doctoral students leave late in their programs. The rule that students complete candidacy exams within the first 36 months of a PhD program is designed to provide a solid checkpoint before students get too far along.
Table 3.5. Doctoral attrition and completion rates.
Applicants Registered Completed
Still Active
Program Not Completed
Attrition Rate
Completion Rate
1999-00 327 231 0 96 29% 71% 2000-01 351 267 0 84 24% 76% 2001-02 386 300 0 86 22% 78% 2002-03 413 325 0 88 21% 79% 2003-04 440 354 0 86 20% 80% 2004-05 392 283 2 107 27% 72% 2005-06 376 280 3 93 25% 74% 2006-07 455 344 9 102 22% 76% 2007-08 450 347 14 89 20% 77% 2008-09 477 384 9 84 18% 81% 2009-10 547 412 57 78 ~14% ~75% 2010-11 508 351 83 74 ~15% ~69% 2011-12 502 293 134 75 ~15% ~58% 2012-13 532 168 285 79 N/A N/A 2013-14 469 66 352 51 N/A N/A 2014-15 458 19 391 48 N/A N/A 2015-16 452 5 405 42 N/A N/A 2016-17 429 0 414 15 N/A N/A Fall 2017* 390 0 390 0 N/A N/A
Source: PeopleSoft; internal script, accessed November 21, 2017. *Fall term data only. Note: figures are calculated taking into account the convocant's program at the time of admission, which has implications for students who move from Master’s to PhD programs without formally reapplying (and, conversely, for students who are repositioned in Master’s programs from the doctoral programs they entered, usually as a result of a failed candidacy exam.
34
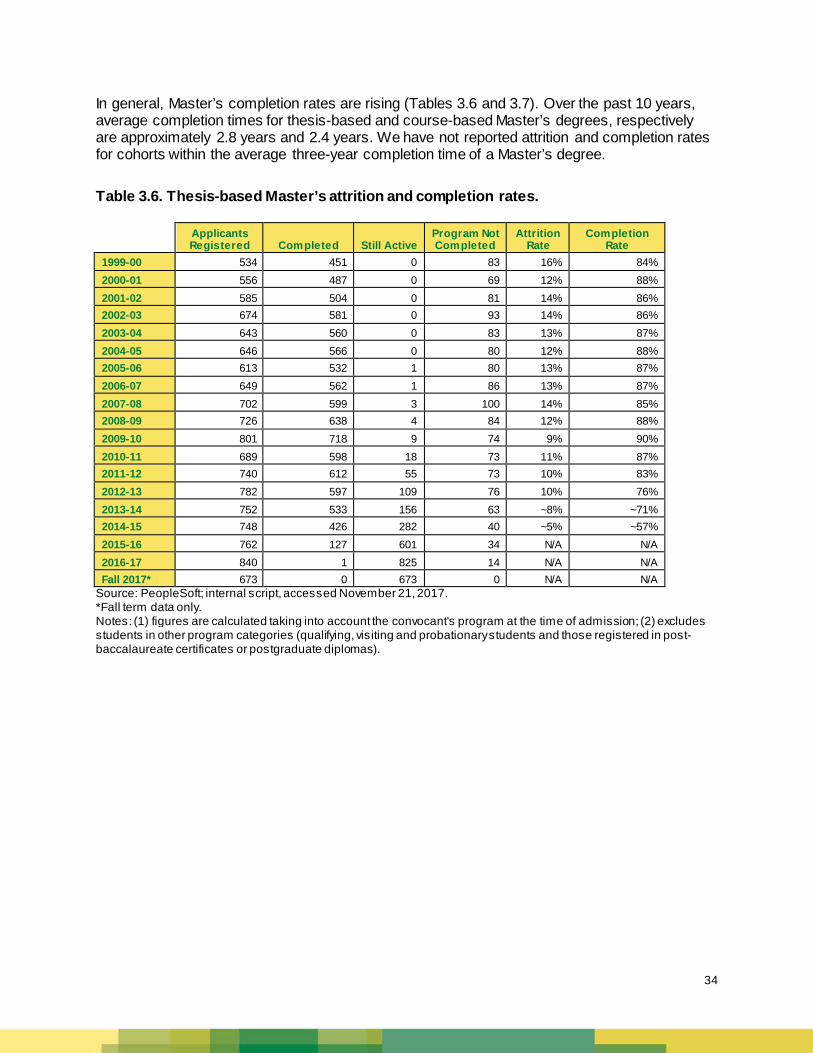
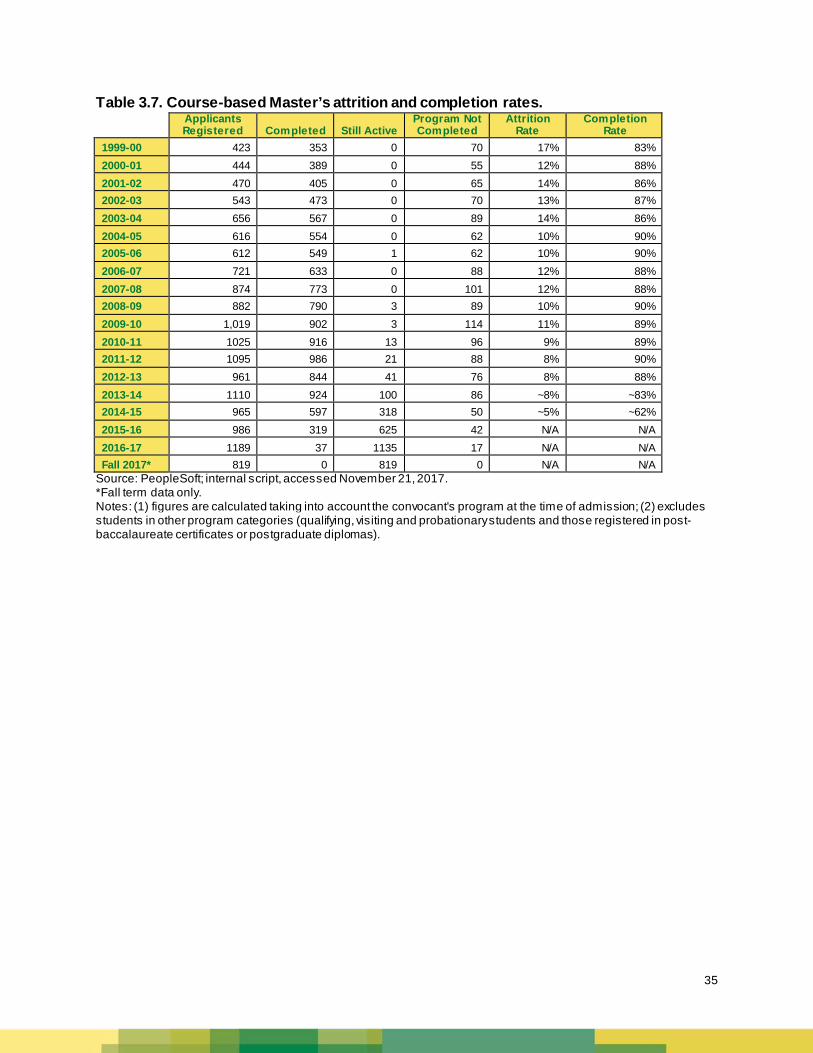
In general, Master’s completion rates are rising (Tables 3.6 and 3.7). Over the past 10 years, average completion times for thesis-based and course-based Master’s degrees, respectively are approximately 2.8 years and 2.4 years. We have not reported attrition and completion rates for cohorts within the average three-year completion time of a Master’s degree. Table 3.6. Thesis-based Master’s attrition and completion rates.
Applicants Registered Completed Still Active
Program Not Completed
Attrition Rate
Completion Rate
1999-00 534 451 0 83 16% 84% 2000-01 556 487 0 69 12% 88% 2001-02 585 504 0 81 14% 86% 2002-03 674 581 0 93 14% 86% 2003-04 643 560 0 83 13% 87% 2004-05 646 566 0 80 12% 88% 2005-06 613 532 1 80 13% 87% 2006-07 649 562 1 86 13% 87% 2007-08 702 599 3 100 14% 85% 2008-09 726 638 4 84 12% 88% 2009-10 801 718 9 74 9% 90% 2010-11 689 598 18 73 11% 87% 2011-12 740 612 55 73 10% 83% 2012-13 782 597 109 76 10% 76% 2013-14 752 533 156 63 ~8% ~71% 2014-15 748 426 282 40 ~5% ~57% 2015-16 762 127 601 34 N/A N/A 2016-17 840 1 825 14 N/A N/A Fall 2017* 673 0 673 0 N/A N/A
Source: PeopleSoft; internal script, accessed November 21, 2017. *Fall term data only. Notes: (1) figures are calculated taking into account the convocant's program at the time of admission; (2) excludes students in other program categories (qualifying, visiting and probationary students and those registered in post-baccalaureate certificates or postgraduate diplomas).
35
Table 3.7. Course-based Master’s attrition and completion rates.
Applicants Registered Completed Still Active
Program Not Completed
Attrition Rate
Completion Rate
1999-00 423 353 0 70 17% 83% 2000-01 444 389 0 55 12% 88% 2001-02 470 405 0 65 14% 86% 2002-03 543 473 0 70 13% 87% 2003-04 656 567 0 89 14% 86% 2004-05 616 554 0 62 10% 90% 2005-06 612 549 1 62 10% 90% 2006-07 721 633 0 88 12% 88% 2007-08 874 773 0 101 12% 88% 2008-09 882 790 3 89 10% 90% 2009-10 1,019 902 3 114 11% 89% 2010-11 1025 916 13 96 9% 89% 2011-12 1095 986 21 88 8% 90% 2012-13 961 844 41 76 8% 88% 2013-14 1110 924 100 86 ~8% ~83% 2014-15 965 597 318 50 ~5% ~62% 2015-16 986 319 625 42 N/A N/A 2016-17 1189 37 1135 17 N/A N/A Fall 2017* 819 0 819 0 N/A N/A
Source: PeopleSoft; internal script, accessed November 21, 2017. *Fall term data only. Notes: (1) figures are calculated taking into account the convocant's program at the time of admission; (2) excludes students in other program categories (qualifying, visiting and probationary students and those registered in post-baccalaureate certificates or postgraduate diplomas).
36
4. Implications Graduate education at the University of Alberta is in good shape. Demand for our programs is high, as evidenced by a marked increase in total applications. Enrolment in certificate programs has grown considerably. Our course-based Master’s programs are tapping into a market demand and proving very popular. Enrolment of Indigenous students is at an all-time high. As noted in the Dean’s message, applications from international students rose significantly from the previous year, almost 40%. Increasing international applications for graduate studies is a Canada-wide trend and reflects the rising tide of isolationism and exclusion in the United States and Europe. While we take delight in the good news about demand, to focus solely on enrolment numbers would discount important issues that affect the quality of graduate education. These include minimum funding guarantees for PhD students (FGSR is leading this discussion on campus) and offering programs and supports that open up a broad range of career pathways to graduate students. We continue to draw insights and learning from the PhDiversification project, now in its second year. It is developing a strategy that supports our doctoral students’ transition from degree to broader career paths outside academia. FGSR is also leading the conversation about learning outcomes, which have a positive effect on completion rates. Another area of interest is completion and attrition. These measures are indicators of the “health” of graduate programs, particularly student success and student experience. Graduate study is a significant commitment and failure to complete a degree or a lengthy completion time may indicate a negative experience. Of course not all students complete their degrees, and in some cases this is the most reasonable outcome for the student, either academically or personally. For perspective, we compared graduate student completion rates and times with our U15 peers. For Master’s programs, the University of Alberta completion rate (degree completion after five years) is 9% higher than the U15 average, and average completion time is one term longer. Similarly, for doctoral programs, our completion rate (degree completion after nine years) is 6% higher than the U15 average, with average completion times similar to the U15 average. While we are generally in line with our Canadian peers, our completion times (an average 6.3 years to complete a PhD by U15 calculation methods) remain concerning and we at FGSR believe that this issue merits further study. In the coming months, FGSR will study and report on completion times in an effort to bring more clarity to the issue. We will look for relationships between completion time and program, field of study, international vs domestic students, time to doctoral candidacy exam completion, and point of incompletion. We hope this information will be a catalyst for a university-wide discussion about completion times and what actions are appropriate to improve them. We can use this understanding to better support graduate students throughout their studies so they can successfully complete their degrees. Graduate education is a vital component of economic development and an investment in solutions for the future. It’s critical that we get it right, for Alberta and Canada. To this end, the Graduate Enrolment Report is designed as a resource, illuminating trends and providing insights into where we should focus efforts to support the critical thinkers and innovators who will be essential to Canada’s continued prosperity.


![STRICTLY OBSERVABLE LINEAR SYSETEMSmst.ufl.edu/pdf papers/Strictly observable systems.pdf · 2017. 5. 18. · strictly observable (HAMMER and . HEYMANN [1981b]). We note that a strictly](https://static.documents.pub/doc/80x56/614563f034130627ed50f1f3/strictly-observable-linear-papersstrictly-observable-systemspdf-2017-5-18.jpg)


