12
Grain sampling from field to buyer – understanding variation Summer 2004

Grain samplingfrom field
to buyer– understanding variation
Summer 2004
2
CO
NT
ENT
S &
INT
ROD
UC
TIO
N
Summer 2004
For the past two years, HGCA has conducteda ‘Grain Sampling and Analysis Project’(GSAP), thanks to substantial funding fromHM Treasury’s ‘Invest to Save Budget’.
The project aimed to understand samplingand analysis techniques across the industryand put forward ways of improving currentpractice. It is estimated that failure to meetmarket specifications could be costing theindustry some £2.5 million a year.
The project included a review of, andresearch into, sampling techniques andanalytical methods. There was also extensiveknowledge transfer with farmer meetings,show attendances and publications.
Our first publication was Grain sampling - afarmer’s guide which set definitive protocolsto help farmers sampling loads from the fieldand in store for quality.
A computer programme - ‘GrainPlan’ - toenable grain store management followed andwas launched at ‘Grain 2003’.
This booklet brings the project to a close bydealing with two key aspects of grainsampling and analysis: first, an understandingof the variation which explains why grainsampling is so complex; second, an overviewof how grain can be sampled and analysedeffectively, based on research conducted overthe past two years.
Overall, the GSAP project has addedconsiderably to the industry's understandingof how grain is sampled and analysed. It hasset new standards.
Professor Graham JellisDirector of Research & Development
ContentsSection Page
Variation in growing grain 3
Variation in harvested grain 4
Sampling – predicting average values 5
Variation from grower to buyer 6
The sampling & analysis process 8
Contacts and further reading 10
The Home-Grown Cereals Authority (HGCA) has provided
funding for the projects on which this guide is based but has not
conducted the research or written this guide.While the authors
have worked on the best information available to them, neither
HGCA nor the authors shall in any event be liable for any loss,
damage or injury howsoever suffered directly or indirectly in
relation to the guide or the research on which it is based.
Reference herein to trade names and proprietary products
without stating that they are protected does not imply they may be
regarded as unprotected and thus free for general use. No
endorsement of named products is intended, nor is any criticism
implied of other alternative, but unnamed products.
Introduction
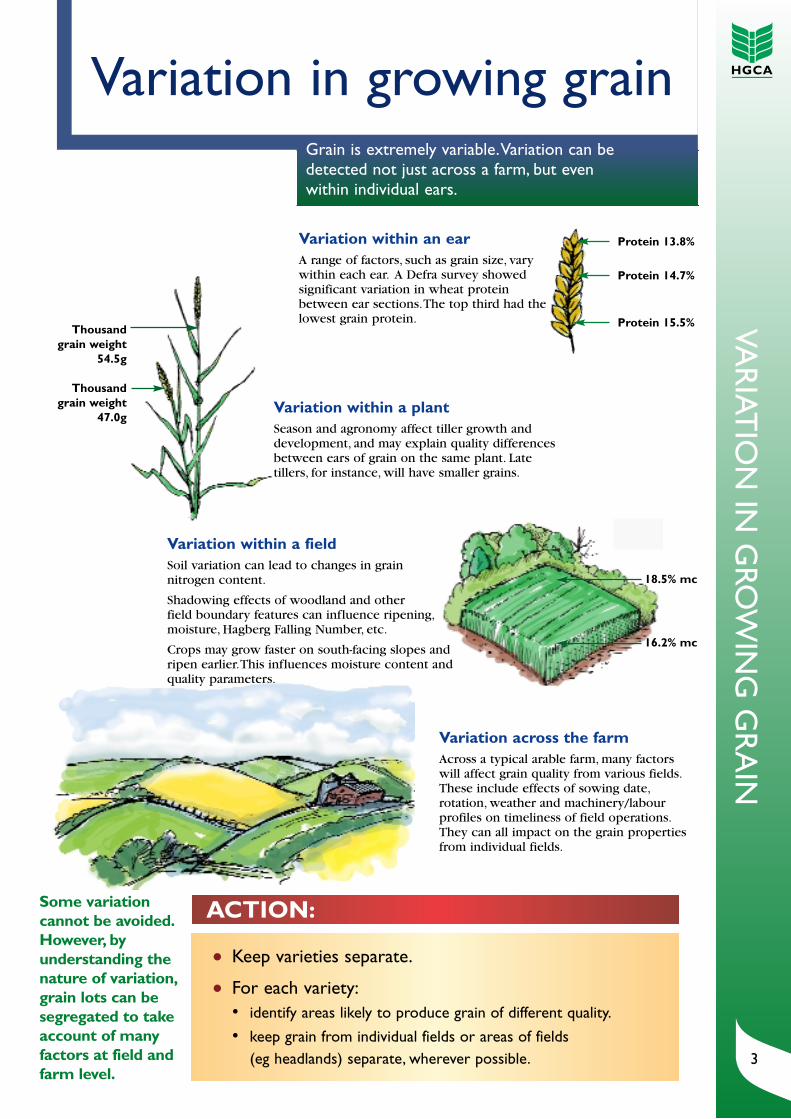
Variation within an earA range of factors, such as grain size, varywithin each ear. A Defra survey showedsignificant variation in wheat proteinbetween ear sections.The top third had thelowest grain protein.
3
VAR
IATIO
N IN
GRO
WIN
G G
RA
IN
Variation within a fieldSoil variation can lead to changes in grain nitrogen content.
Shadowing effects of woodland and other field boundary features can influence ripening,moisture, Hagberg Falling Number, etc.
Crops may grow faster on south-facing slopes andripen earlier.This influences moisture content andquality parameters.
Variation in growing grainGrain is extremely variable.Variation can bedetected not just across a farm, but evenwithin individual ears.
● Keep varieties separate.
● For each variety:• identify areas likely to produce grain of different quality.
• keep grain from individual fields or areas of fields (eg headlands) separate, wherever possible.
ACTION:
Variation across the farmAcross a typical arable farm, many factorswill affect grain quality from various fields.These include effects of sowing date,rotation, weather and machinery/labourprofiles on timeliness of field operations.They can all impact on the grain propertiesfrom individual fields.
Variation within a plantSeason and agronomy affect tiller growth anddevelopment, and may explain quality differencesbetween ears of grain on the same plant. Latetillers, for instance, will have smaller grains.
Protein 13.8%
Protein 14.7%
Protein 15.5%Thousand grain weight
54.5g
Thousand grain weight
47.0g
18.5% mc
16.2% mc
Some variationcannot be avoided.However, byunderstanding thenature of variation,grain lots can besegregated to takeaccount of manyfactors at field andfarm level.
0
5
10
15
20
25
30
11 am 9 pm
Mo
istu
re c
ont
ent
(%)
Time
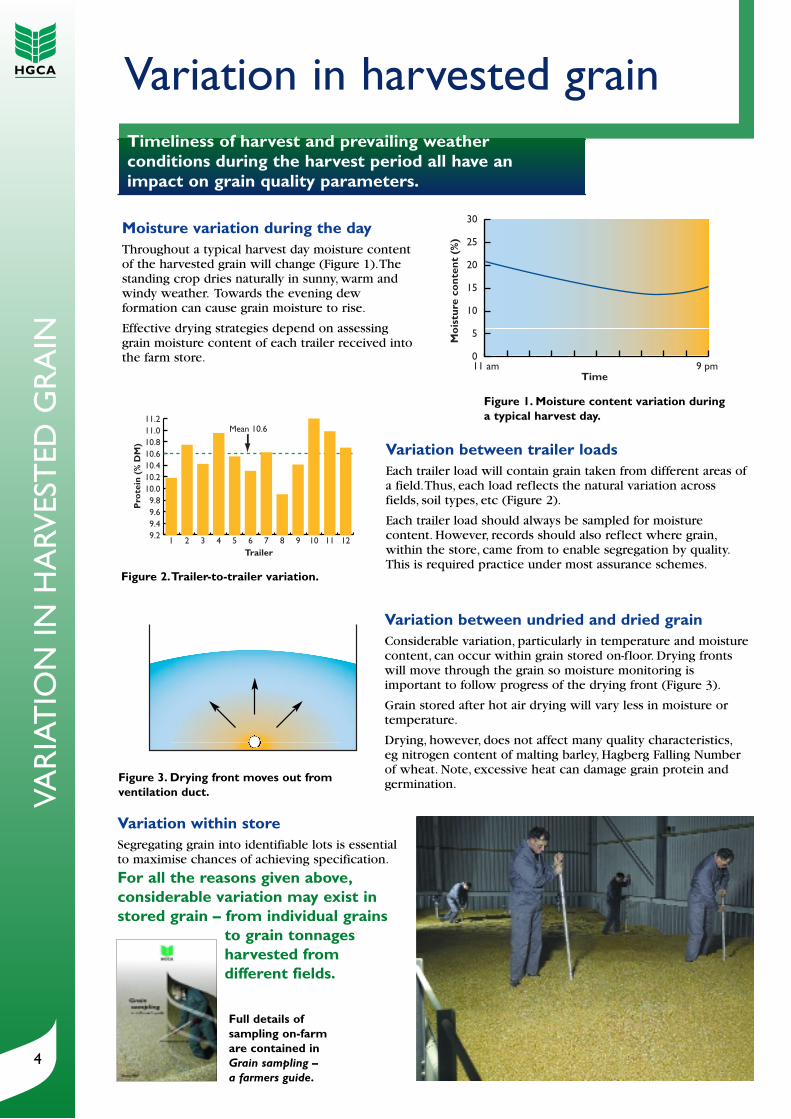
Figure 1. Moisture content variation duringa typical harvest day.
4
VAR
IAT
ION
IN H
ARV
EST
ED G
RA
INVariation in harvested grainTimeliness of harvest and prevailing weatherconditions during the harvest period all have animpact on grain quality parameters.
Trailer
Pro
tein
(%
DM
)
9.29.49.69.8
10.010.210.410.610.811.011.2
121110987654321
Mean 10.6
Figure 2.Trailer-to-trailer variation.
Figure 3. Drying front moves out fromventilation duct.
Moisture variation during the dayThroughout a typical harvest day moisture contentof the harvested grain will change (Figure 1).Thestanding crop dries naturally in sunny, warm andwindy weather. Towards the evening dewformation can cause grain moisture to rise.
Effective drying strategies depend on assessinggrain moisture content of each trailer received intothe farm store.
Variation within storeSegregating grain into identifiable lots is essentialto maximise chances of achieving specification.
For all the reasons given above,considerable variation may exist instored grain – from individual grains
to grain tonnagesharvested fromdifferent fields.
Variation between undried and dried grainConsiderable variation, particularly in temperature and moisturecontent, can occur within grain stored on-floor. Drying frontswill move through the grain so moisture monitoring isimportant to follow progress of the drying front (Figure 3).
Grain stored after hot air drying will vary less in moisture ortemperature.
Drying, however, does not affect many quality characteristics,eg nitrogen content of malting barley, Hagberg Falling Number of wheat. Note, excessive heat can damage grain protein andgermination.
Full details ofsampling on-farmare contained inGrain sampling –a farmers guide.
Variation between trailer loadsEach trailer load will contain grain taken from different areas ofa field.Thus, each load reflects the natural variation acrossfields, soil types, etc (Figure 2).
Each trailer load should always be sampled for moisturecontent. However, records should also reflect where grain,within the store, came from to enable segregation by quality.This is required practice under most assurance schemes.
Distribution – the theory Some grains within a lot exactly match the averagevalue for any characteristic, but many do not.
The distribution of the values for any parametermeasured can be described by a curve (Figure 4).However, it is totally impractical to analyse individualgrains.What is required is a way of assessing theaverage values of any lot of grain. Sampling sets out todo this.
Analysing a single sample from a grain lot could give aresult far from the average value.
As grain is traded on specific parameters, often withheavy penalties for not achieving specification, the aimof sampling is to take sufficient samples to reduce therisk of inaccuracy and improve the level of confidencefor buyer and seller.
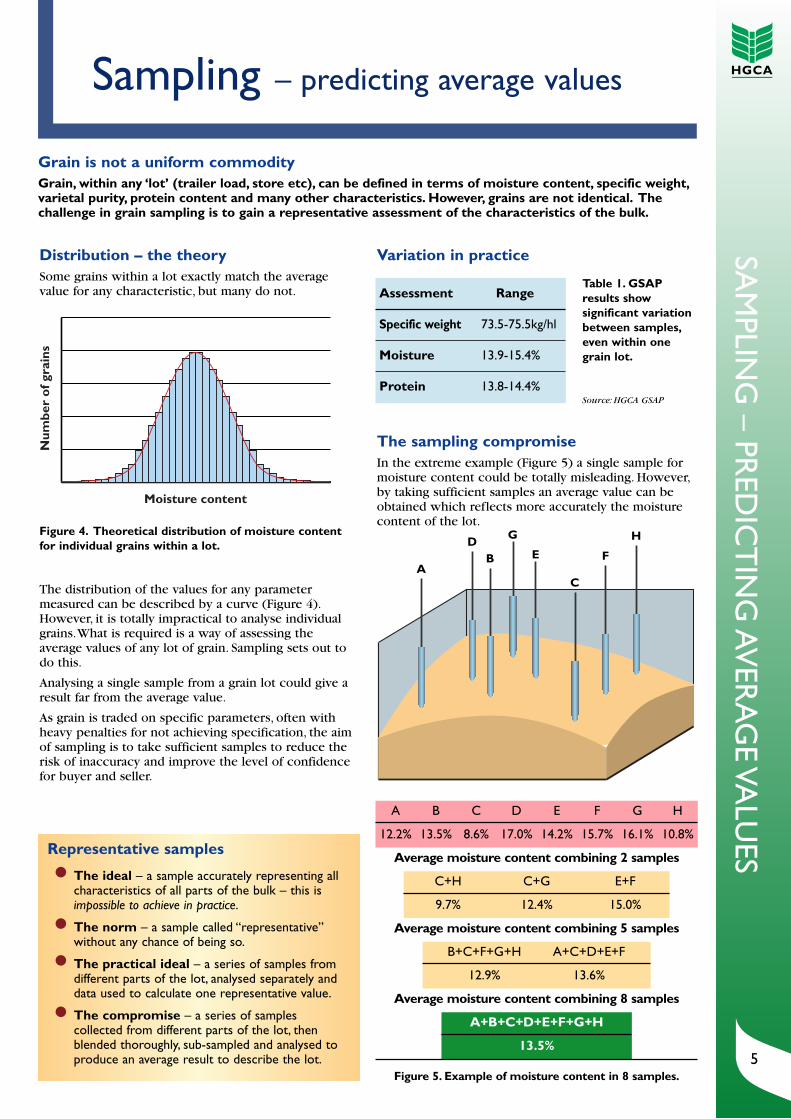
The sampling compromise In the extreme example (Figure 5) a single sample formoisture content could be totally misleading. However,by taking sufficient samples an average value can beobtained which reflects more accurately the moisturecontent of the lot.
Variation in practice
5
SAM
PLING
– PRED
ICT
ING
AV
ERA
GE VA
LUESRepresentative samples
● The ideal – a sample accurately representing allcharacteristics of all parts of the bulk – this isimpossible to achieve in practice.
● The norm – a sample called “representative”without any chance of being so.
● The practical ideal – a series of samples fromdifferent parts of the lot, analysed separately anddata used to calculate one representative value.
● The compromise – a series of samplescollected from different parts of the lot, thenblended thoroughly, sub-sampled and analysed toproduce an average result to describe the lot.
Grain is not a uniform commodityGrain, within any ‘lot’ (trailer load, store etc), can be defined in terms of moisture content, specific weight,varietal purity, protein content and many other characteristics. However, grains are not identical. Thechallenge in grain sampling is to gain a representative assessment of the characteristics of the bulk.
Sampling – predicting average values
AB
C
DE F
G H
A B C D E F G H
12.2% 13.5% 8.6% 17.0% 14.2% 15.7% 16.1% 10.8%
Average moisture content combining 2 samples
C+H C+G E+F
9.7% 12.4% 15.0%
Average moisture content combining 5 samples
B+C+F+G+H A+C+D+E+F
12.9% 13.6%
Average moisture content combining 8 samples
A+B+C+D+E+F+G+H
13.5%
Figure 5. Example of moisture content in 8 samples.
Moisture content
Num
ber
of g
rain
s
Figure 4. Theoretical distribution of moisture contentfor individual grains within a lot.
Assessment Range
Specific weight 73.5-75.5kg/hl
Moisture 13.9-15.4%
Protein 13.8-14.4%
Table 1. GSAPresults showsignificant variationbetween samples,even within onegrain lot.
Source: HGCA GSAP
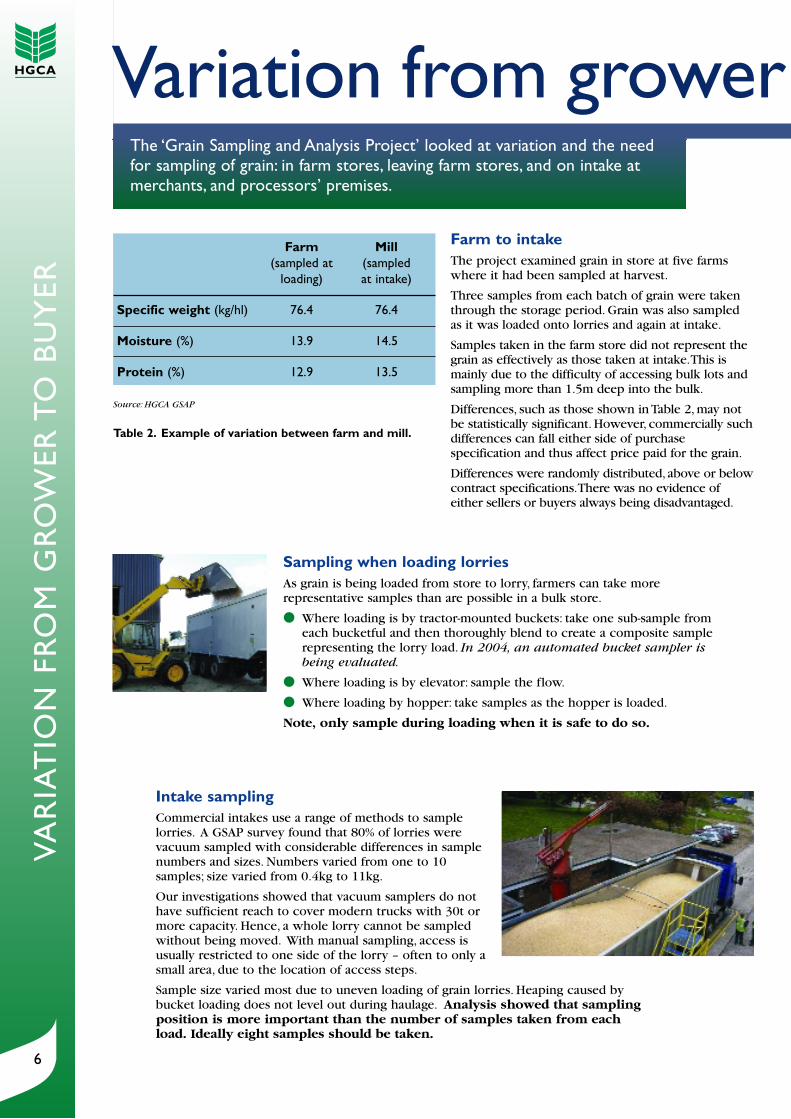
Intake samplingCommercial intakes use a range of methods to samplelorries. A GSAP survey found that 80% of lorries werevacuum sampled with considerable differences in samplenumbers and sizes. Numbers varied from one to 10samples; size varied from 0.4kg to 11kg.
Our investigations showed that vacuum samplers do nothave sufficient reach to cover modern trucks with 30t ormore capacity. Hence, a whole lorry cannot be sampledwithout being moved. With manual sampling, access isusually restricted to one side of the lorry – often to only asmall area, due to the location of access steps.
Sample size varied most due to uneven loading of grain lorries. Heaping caused bybucket loading does not level out during haulage. Analysis showed that samplingposition is more important than the number of samples taken from eachload. Ideally eight samples should be taken.
6
VAR
IAT
ION
FR
OM
GR
OW
ER T
O B
UY
ER
The ‘Grain Sampling and Analysis Project’ looked at variation and the needfor sampling of grain: in farm stores, leaving farm stores, and on intake atmerchants, and processors’ premises.
Variation from grower
Farm Mill(sampled at (sampled
loading) at intake)
Specific weight (kg/hl) 76.4 76.4
Moisture (%) 13.9 14.5
Protein (%) 12.9 13.5
Source: HGCA GSAP
Table 2. Example of variation between farm and mill.
Sampling when loading lorriesAs grain is being loaded from store to lorry, farmers can take morerepresentative samples than are possible in a bulk store.
● Where loading is by tractor-mounted buckets: take one sub-sample fromeach bucketful and then thoroughly blend to create a composite samplerepresenting the lorry load. In 2004, an automated bucket sampler isbeing evaluated.
● Where loading is by elevator: sample the flow.
● Where loading by hopper: take samples as the hopper is loaded.
Note, only sample during loading when it is safe to do so.
Farm to intakeThe project examined grain in store at five farmswhere it had been sampled at harvest.
Three samples from each batch of grain were takenthrough the storage period. Grain was also sampledas it was loaded onto lorries and again at intake.
Samples taken in the farm store did not represent thegrain as effectively as those taken at intake.This ismainly due to the difficulty of accessing bulk lots andsampling more than 1.5m deep into the bulk.
Differences, such as those shown in Table 2, may notbe statistically significant. However, commercially suchdifferences can fall either side of purchasespecification and thus affect price paid for the grain.
Differences were randomly distributed, above or belowcontract specifications.There was no evidence ofeither sellers or buyers always being disadvantaged.
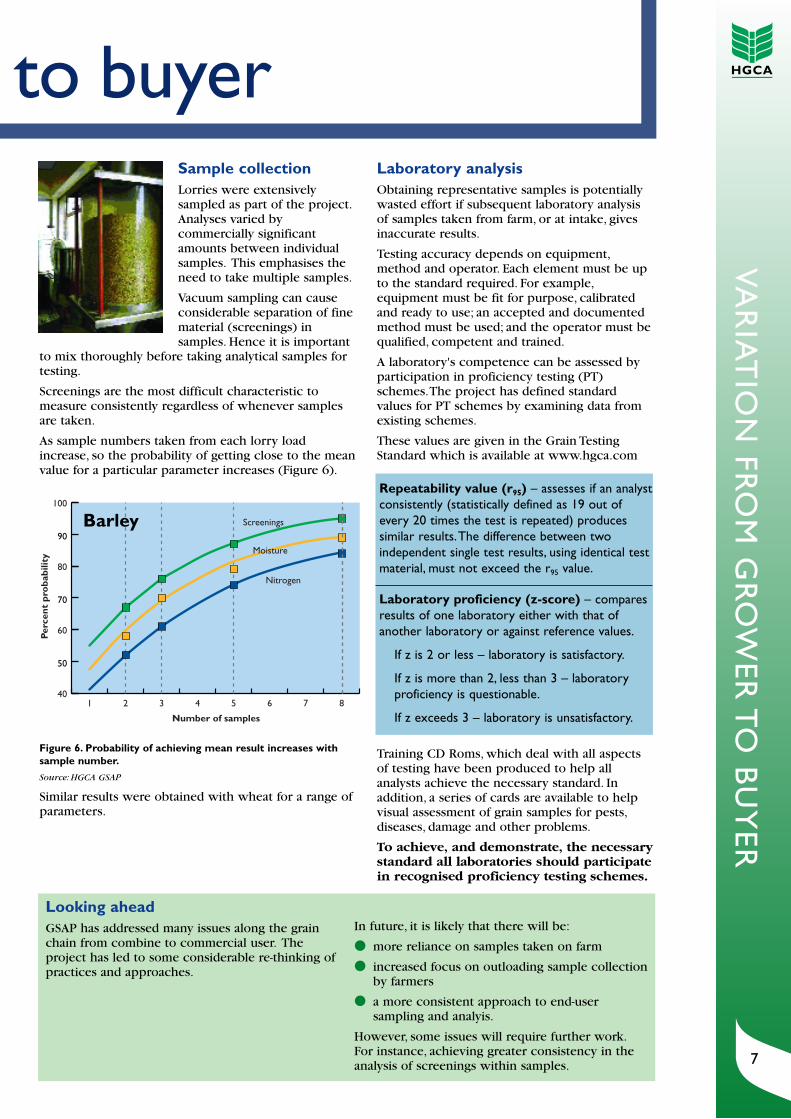
Sample collectionLorries were extensivelysampled as part of the project.Analyses varied bycommercially significantamounts between individualsamples. This emphasises theneed to take multiple samples.
Vacuum sampling can causeconsiderable separation of finematerial (screenings) insamples. Hence it is important
to mix thoroughly before taking analytical samples fortesting.
Screenings are the most difficult characteristic tomeasure consistently regardless of whenever samplesare taken.
As sample numbers taken from each lorry loadincrease, so the probability of getting close to the meanvalue for a particular parameter increases (Figure 6).
40
60
80
100
Screenings
Moisture
Nitrogen
87654321
50
70
90
Number of samples
Perc
ent
pro
babi
lity
Barley
7
VAR
IAT
ION
FRO
M G
RO
WER
TO
BU
YER
to buyerLaboratory analysisObtaining representative samples is potentiallywasted effort if subsequent laboratory analysisof samples taken from farm, or at intake, givesinaccurate results.
Testing accuracy depends on equipment,method and operator. Each element must be upto the standard required. For example,equipment must be fit for purpose, calibratedand ready to use; an accepted and documentedmethod must be used; and the operator must bequalified, competent and trained.
A laboratory's competence can be assessed byparticipation in proficiency testing (PT)schemes.The project has defined standardvalues for PT schemes by examining data fromexisting schemes.
These values are given in the Grain TestingStandard which is available at www.hgca.com
Training CD Roms, which deal with all aspectsof testing have been produced to help allanalysts achieve the necessary standard. Inaddition, a series of cards are available to helpvisual assessment of grain samples for pests,diseases, damage and other problems.
To achieve, and demonstrate, the necessarystandard all laboratories should participatein recognised proficiency testing schemes.
Looking aheadGSAP has addressed many issues along the grainchain from combine to commercial user. Theproject has led to some considerable re-thinking ofpractices and approaches.
In future, it is likely that there will be:
● more reliance on samples taken on farm
● increased focus on outloading sample collectionby farmers
● a more consistent approach to end-usersampling and analyis.
However, some issues will require further work.For instance, achieving greater consistency in theanalysis of screenings within samples.
Repeatability value (r95) – assesses if an analystconsistently (statistically defined as 19 out ofevery 20 times the test is repeated) producessimilar results.The difference between twoindependent single test results, using identical testmaterial, must not exceed the r95 value.
Laboratory proficiency (z-score) – comparesresults of one laboratory either with that ofanother laboratory or against reference values.
If z is 2 or less – laboratory is satisfactory.
If z is more than 2, less than 3 – laboratoryproficiency is questionable.
If z exceeds 3 – laboratory is unsatisfactory.
Figure 6. Probability of achieving mean result increases withsample number.
Source: HGCA GSAP
Similar results were obtained with wheat for a range ofparameters.
8
TH
E SA
MPL
ING
& A
NA
LYSI
S PR
OC
ESS
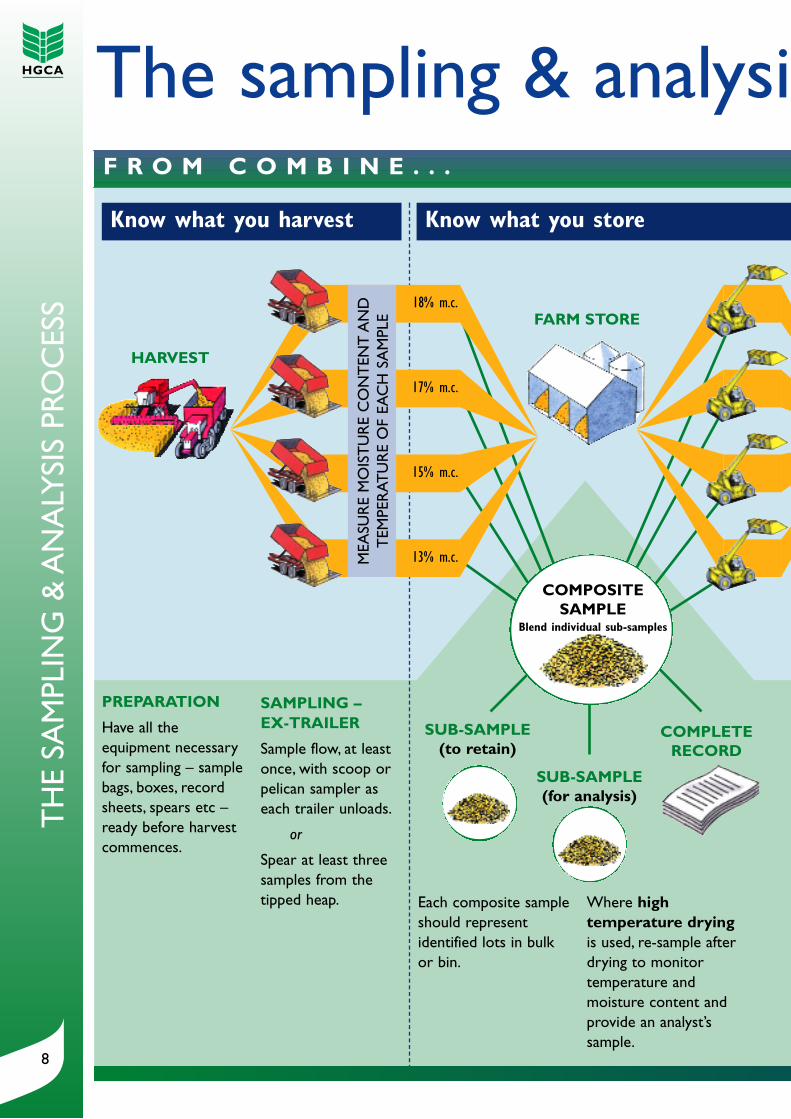
The sampling & analysiF R O M C O M B I N E . . .
SAMPLING – EX-TRAILER
Sample flow, at leastonce, with scoop orpelican sampler aseach trailer unloads.
or
Spear at least threesamples from thetipped heap.
SUB-SAMPLE(for analysis)
COMPLETERECORD
SUB-SAMPLE(to retain)
HARVEST
13% m.c.
15% m.c.
17% m.c.
18% m.c.
MEA
SUR
E M
OIS
TU
RE
CO
NT
ENT
AN
DT
EMPE
RAT
UR
E O
F EA
CH
SA
MPL
E FARM STORE
PREPARATION
Have all theequipment necessaryfor sampling – samplebags, boxes, recordsheets, spears etc –ready before harvestcommences.
COMPOSITE SAMPLE
Blend individual sub-samples
Know what you harvest Know what you store
Each composite sampleshould representidentified lots in bulkor bin.
Where hightemperature dryingis used, re-sample afterdrying to monitortemperature andmoisture content andprovide an analyst’ssample.
9
TH
E SAM
PLING
& A
NA
LYSIS PRO
CESS
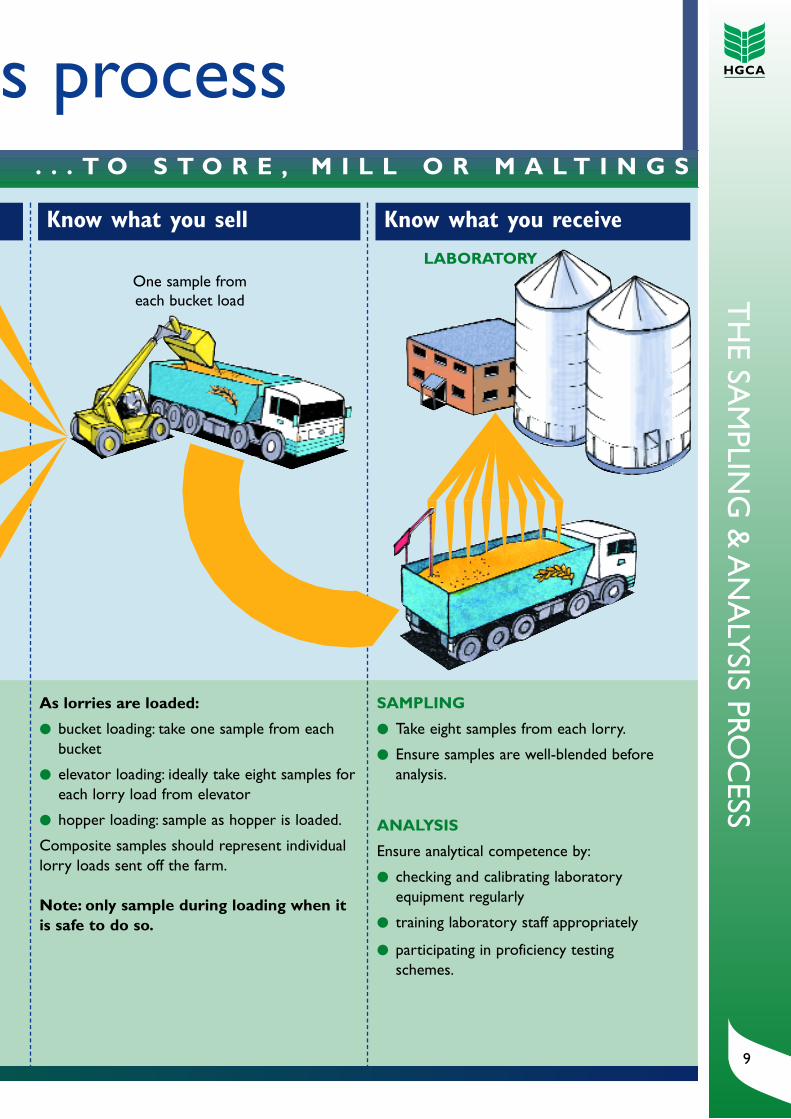
s process. . . T O S T O R E , M I L L O R M A L T I N G S
As lorries are loaded:
● bucket loading: take one sample from eachbucket
● elevator loading: ideally take eight samples foreach lorry load from elevator
● hopper loading: sample as hopper is loaded.
Composite samples should represent individuallorry loads sent off the farm.
Note: only sample during loading when itis safe to do so.
SAMPLING
● Take eight samples from each lorry.
● Ensure samples are well-blended beforeanalysis.
ANALYSIS
Ensure analytical competence by:
● checking and calibrating laboratoryequipment regularly
● training laboratory staff appropriately
● participating in proficiency testingschemes.
Know what you sell Know what you receive
One sample fromeach bucket load
LABORATORY
10
Contacts & further reading
Contacts
AIC – Agricultural IndustriesConfederationConfederation HouseEast of England ShowgroundPeterboroughPE2 6XETel: 01733 385230Fax: 01733 385270E-mail: [email protected]: www.agindustries.org.uk
ACCS – Assured CombinableCrops Schemec/o CMI Certification LtdThe Business ParkLong HanboroughOxford OX29 8LHTel: 01993 885610Fax: 01993 885611E-mail: [email protected]: www.assuredcrops.co.uk
BRi – Brewing ResearchInternationalLyttel HallNutfieldSurreyRH1 4HYTel: 01737 822272Fax: 01737 822747E-mail: [email protected]: www.brewingresearch.co.uk
CCFRA – Campden &Chorleywood Food ResearchAssociationChipping Campden Gloucestershire GL55 6LDTel: 01386 842000Fax: 01386 842100E-mail: [email protected]: www.campden.co.uk
CSL – Central Science LaboratorySand HuttonYork Y04 1LZTel: 01904 462000Fax: 01904 462111E-mail: [email protected]: www.csl.gov.uk
EFSIS-FABBL Farm AssuranceSchemePO Box 165Winterhill HouseMilton KeynesMK6 1PBTel: 01908 231642Fax: 01908 844355E-mail: [email protected]: www.fabbl.co.uk
FAC – Federation of AgriculturalCo-operatives(see NFU)
GAFTA – Grain and Feed TradeAssociationGafta House6 Chapel CourtChapel PlaceLondon EC2A 3DQTel: 020 7814 9666Fax: 020 7814 8383E-mail: [email protected] Website: www.gafta.com
Genesis QARyknield HouseAlrewasBurton on TrentDE13 7ABTel: 01283 791400Fax: 01283 791500E-mail: [email protected]: www.genesisqa.com
MAGB – Maltsters Association ofGreat Britain31b Castle GateNewark on TrentNottinghamshire NG24 1AZTel: 01636 700781Fax: 01636 701836E-mail: [email protected]:www.magb.org.uk
nabim – National Association ofBritish and Irish Millers 21 Arlington StreetLondonSW1A 1RN Tel: 020 7493 2521Fax: 020 7493 6785E-mail: [email protected]: www.nabim.org.uk
NFUAgriculture House164 Shaftesbury Avenue London WC2H 8HLTel: 020 7331 7200Fax: 020 7331 7313E-mail: [email protected]: www.nfu.org.uk
NFUS – NFU of ScotlandThe Rural CentreWest MainsInglistonNewbridgeMidlothian EH28 8LTTel: 0131 472 4000Fax: 0131 472 4010E-mail: [email protected]: www.nfus.org.uk
Rural Payments AgencyKings House33 Kings RoadReadingRG1 3BUTel: 0118 958 3626Fax: 0118 959 7736E-mail: [email protected]: www.rpa.gsi.gov.uk
SQC – Scottish Quality CerealsRoyal Highland Centre10th AvenueInglistonEdinburghEH28 8NFTel: 0131 335 6600Fax: 0131 335 6601E-mail: [email protected]: www.sfqc.co.uk
11
CO
NTA
CT
S & FU
RTH
ERR
EAD
ING
UFU – Ulster Farmers Union475 Antrim RoadBelfastBT15 3DATel: 028 9037 0222Fax: 028 9037 1231E-mail: [email protected]: www.ufuhq.com
Valid Analytical MeasurementLGCQueens RoadTeddingtonMiddlesexTW11 0LYTel: 0208 943 7393Fax: 0208 8943 2767E-mail: [email protected]: www.lcg.co.uk
Further reading
Grain sampling – a farmer’sguide, HGCA (2003) (free to HGCAlevy payers)
The grain storage guide, HGCA(1999) (revised 2003) free to HGCAlevy-payers, otherwise £25
Rodent control in agriculture – aguide, HGCA (2002) free to HGCAlevy-payers, otherwise £25
Moisture meter guidelines, HGCA(2000) free to HGCA levy-payers
Introductory guide to millingwheat, HGCA (2002) free to HGCAlevy-payers, otherwise £25
Introductory guide to maltingbarley, HGCA (2001) free to HGCAlevy-payers, otherwise £25
Topic Sheet No. 26 - Samplinggrain on-farm
Project Report 34.An assessmentof methods of sampling bulk grain
Project Report 79.An assessmentof practical methods for collectingsamples from lorry-loads of grain
Project Report 118.The collectionof samples of grain: an assessment ofcurrent methods and problems
Project Report 301. Developmentand validation of on-farm samplingprotocols for collection of marketing(quality) samples at harvest
Project Report 325. Developingand validating on-farm samplingprotocols: sampling in store andduring out-loading
Project Report 339. Grain samplingand assessment: sampling grain inlorries
CD Roms
Grain sampling – a farmer’sguide, HGCA (2003)
Barley grain analyst training,HGCA (2004)
Wheat grain analyst training,HGCA (2004)
GrainPlan v.1, HGCA (2004)
AcknowledgmentsThis guide is based on a project led by Dr Simon Hook,HGCA with sampling work performed by Dr Jonathan Knight,Imperial College and Robin Wilkin, consultant. Laboratorystandardisation was conducted by Nicky Lockey, BCA; GillianFisher, BRi; Susan Salmon, CCFRA; Bruce Johnson, GreencoreMalting Group; and Martin Albetini,Tini Tec.
HGCA is grateful to the many individuals who commented ondraft versions of this guide including: Dr Peter Dampney, ADAS;David Armitage, CSL; Jeremy Smith, GAFTA; Professor GrahamJellis and Dr Roger Williams, HGCA; Ivor Murrell, MAGB; AlanRidealgh, Muntons; Dr Ken Wildey,Technology for Growth; andDr Kevin McConway,The Open University.
It was edited by Dr Clive Edwards, HGCA and Geoff Dodgson,Chamberlain.
Design by Chamberlain.
The ‘Grain Sampling and Analysis Project’(GSAP) was co-funded by HM Treasury(Invest to Save Budget (ISB) project 270)through Defra Arable Crops Division andHGCA (project 2714).
For information on HGCA services:
Research & DevelopmentTel: 020 7520 3945Fax: 020 7520 3992E-mail: [email protected]
Crop MarketingTel: 020 7520 3972Fax: 020 7520 3918E-mail: [email protected]
CommunicationsTel: 020 7520 3926Fax: 020 7520 3958E-mail: [email protected]
To order publications:Tel: 020 7520 3920Fax: 020 7520 3931E-mail: [email protected]
Website: www.hgca.comHGCA, Caledonia House,223 Pentonville Road, London N1 9HY
£10 (free to HGCA levy payers)
© HGCA 2004


