Strictly as per the compliance and regulations of :
Volume 14 Issue 5 Version 1.0 Year 2014
Abstract- Grain size and depositional pattern of sediment from Okeluse area, Southwestern Nigeria have been carried to evaluate its textural parameters and statistical measures to depict the depositional pattern of sediments in the study area. A total of ten samples were collected for this study. The method of sampling adopted for this study is a spot sampling method. The samples were processed and sieved following international standards. Statistical parameters studied include. The graphic mean values (Mz) ranges from 1.333 - 2.267. The inclusive graphic skewness (sk1) of grain analysis data show that they are negatively skewed and implies that the sediments are strongly coarsely, coarsely and nearly symmetrical skewed. Sediments in OKL1, OKL2 and OKL10 are strongly coarsely skewed, while OKL3, OKL4, OKL5, OKL6, OKL8 and OKL9
are coarsely skewed. OKL7 is nearly symmetrical skewed. The sorting kurtosis of the sediments shows that they are either leptokurtic or very platykurtic. OKL3, OKL5 and OKL7 are very platykurtic, while OKL1, OKL2, OKL4, OKL6, OKL8, OKL9 and OKL10 are leptokurtic. The grain size distribution reveals that the transporting medium must have undergone series of rise and fall in its velocity. In the present study, all the ten samples analyzed shows the dominance of saltation and suspension domains of size-population.
Grain Size and Depositional Pattern of Sediment from Okeluse Area, Southwestern Nigeria
Oredein, O. S. σ , Adewumi A. J. σ & Odunsi, O. M. ρ
Abstract- Grain size and depositional pattern of sediment from Okeluse area, Southwestern Nigeria have been carried to evaluate its textural parameters and statistical measures to depict the depositional pattern of sediments in the study area. A total of ten samples were collected for this study. The method of sampling adopted for this study was spot sampling method. The samples were processed and sieved following international standards. Statistical parameters studied include. The graphic mean values (Mz) Range from 1.333 - 2.267. The inclusive graphic skewness (sk1) of grain analysis data show that they are negatively skewed and implies that the sediments are strongly coarsely, coarsely and nearly symmetrical skewed. Sediments in OKL1, OKL2 and OKL10 are strongly coarsely skewed, while OKL3, OKL4, OKL5, OKL6, OKL8 andOKL9 are coarsely skewed. OKL7 is nearly symmetrical skewed. The sorting (kurtosis) of the sediments shows that they are either leptokurtic or very platykurtic. OKL3, OKL5 and OKL7
are very platykurtic, while OKL1, OKL2, OKL4, OKL6, OKL8, OKL9 and OKL10 are leptokurtic. The grain size distribution reveals that the transporting medium must have undergone series of rise and fall in its velocity. In the present study, all the ten samples analyzed shows the dominance of saltation and suspension domains of size-population.Keywords: grain-size; deposition; sediment; okeluse.
I. Introduction
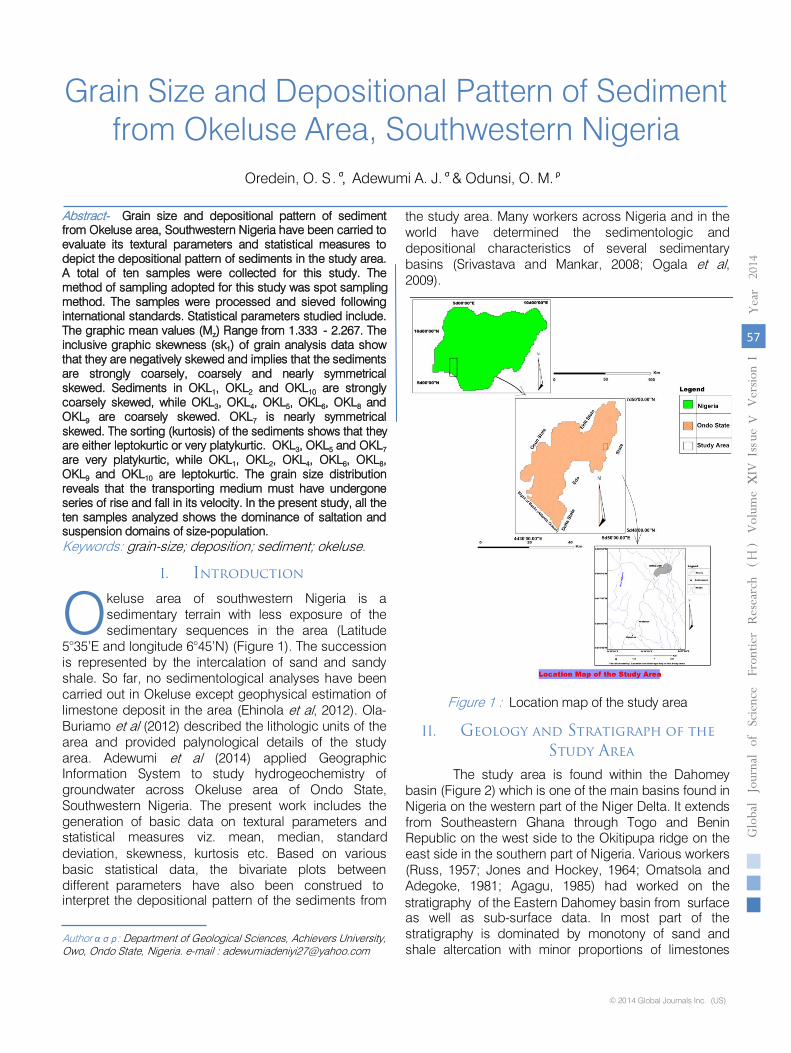
keluse area of southwestern Nigeria is a sedimentary terrain with less exposure of the sedimentary sequences in the area (Latitude
5°35’E and longitude 6°45’N) (Figure 1). The succession is represented by the intercalation of sand and sandy shale. So far, no sedimentological analyses have been carried out in Okeluse except geophysical estimation of limestone deposit in the area (Ehinola et al, 2012). Ola-Buriamo et al (2012) described the lithologic units of the area and provided palynological details of the study area. Adewumi et al (2014) applied Geographic Information System to study hydrogeochemistry of groundwater across Okeluse area of Ondo State, Southwestern Nigeria. The present work includes the generation of basic data on textural parameters and statistical measures viz. mean, median, standard deviation, skewness, kurtosis etc. Based on various basic statistical data, the bivariate plots between different parameters have also been construed to
Author α σ ρ: Department of Geological Sciences, Achievers University, Owo, Ondo State, Nigeria. e-mail : [email protected]
interpret the depositional pattern of the sediments from
the study area. Many workers across Nigeria and in the world have determined the sedimentologic and depositional characteristics of several sedimentary basins (Srivastava and Mankar, 2008; Ogala et al, 2009).
Figure 1 : Location map of the study area
II. Geology and Stratigraph of the Study Area
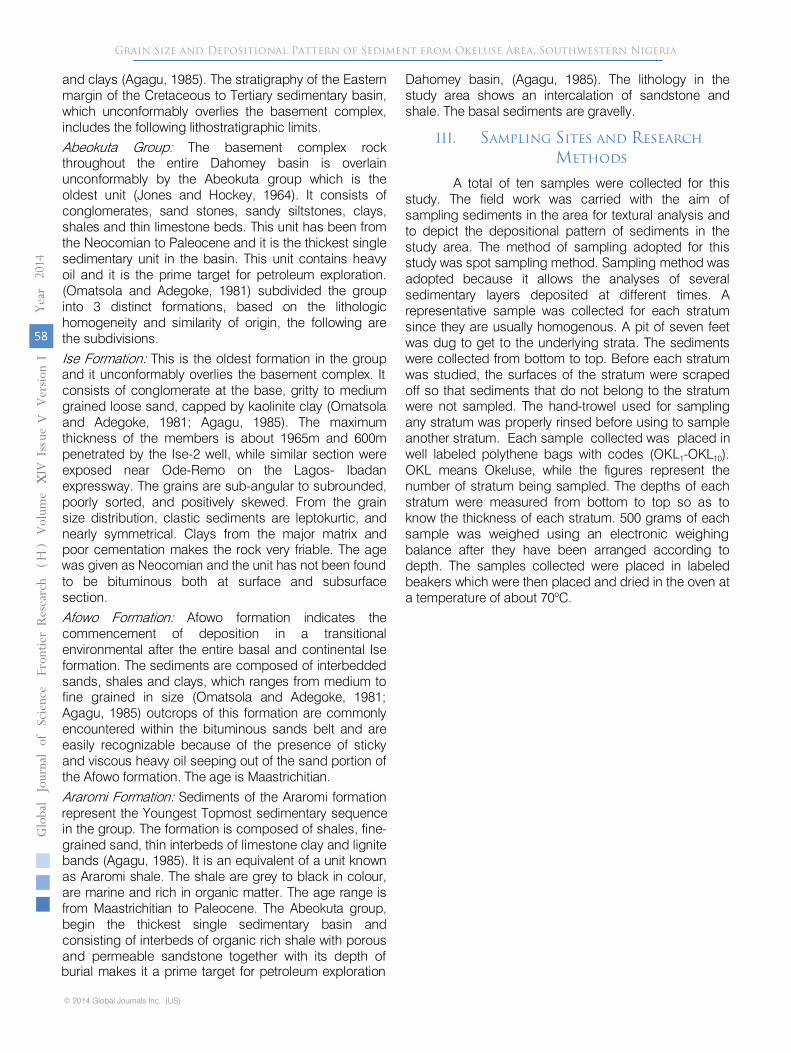
The study area is found within the Dahomey basin (Figure 2) which is one of the main basins found in Nigeria on the western part of the Niger Delta. It extends from Southeastern Ghana through Togo and Benin Republic on the west side to the Okitipupa ridge on the east side in the southern part of Nigeria. Various workers (Russ, 1957; Jones and Hockey, 1964; Omatsola and Adegoke, 1981; Agagu, 1985) had worked on the stratigraphy of the Eastern Dahomey basin from surface as well as sub-surface data. In most part of the stratigraphy is dominated by monotony of sand and shale altercation with minor proportions of limestones
O
Grain Size and Depositional Pattern of Sediment from Okeluse Area, Southwestern Nigeria
and clays (Agagu, 1985). The stratigraphy of the Eastern margin of the Cretaceous to Tertiary sedimentary basin, which unconformably overlies the basement complex, includes the following lithostratigraphic limits.
Abeokuta Group: The basement complex rock throughout the entire Dahomey basin is overlain unconformably by the Abeokuta group which is the oldest unit (Jones and Hockey, 1964). It consists of conglomerates, sand stones, sandy siltstones, clays, shales and thin limestone beds. This unit has been from the Neocomian to Paleocene and it is the thickest single sedimentary unit in the basin. This unit contains heavy oil and it is the prime target for petroleum exploration. (Omatsola and Adegoke, 1981) subdivided the group into 3 distinct formations, based on the lithologic homogeneity and similarity of origin, the following are the subdivisions.
Ise Formation: This is the oldest formation in the group and it unconformably overlies the basement complex. It consists of conglomerate at the base, gritty to medium grained loose sand, capped by kaolinite clay (Omatsola and Adegoke, 1981; Agagu, 1985). The maximum thickness of the members is about 1965m and 600m penetrated by the Ise-2 well, while similar section were exposed near Ode-Remo on the Lagos- Ibadan expressway. The grains are sub-angular to subrounded, poorly sorted, and positively skewed. From the grain size distribution, clastic sediments are leptokurtic, and nearly symmetrical. Clays from the major matrix and poor cementation makes the rock very friable. The age was given as Neocomian and the unit has not been found to be bituminous both at surface and subsurface section.
Afowo Formation: Afowo formation indicates the commencement of deposition in a transitional environmental after the entire basal and continental Ise formation. The sediments are composed of interbedded sands, shales and clays, which ranges from medium to fine grained in size (Omatsola and Adegoke, 1981; Agagu, 1985) outcrops of this formation are commonly encountered within the bituminous sands belt and are easily recognizable because of the presence of sticky and viscous heavy oil seeping out of the sand portion of the Afowo formation. The age is Maastrichitian.
Araromi Formation: Sediments of the Araromi formation represent the Youngest Topmost sedimentary sequence in the group. The formation is composed of shales, fine-grained sand, thin interbeds of limestone clay and lignite bands (Agagu, 1985). It is an equivalent of a unit known as Araromi shale. The shale are grey to black in colour, are marine and rich in organic matter. The age range is from Maastrichitian to Paleocene. The Abeokuta group, begin the thickest single sedimentary basin and consisting of interbeds of organic rich shale with porous and permeable sandstone together with its depth of burial makes it a prime target for petroleum exploration
Dahomey basin, (Agagu, 1985). The lithology in the study area shows an intercalation of sandstone and shale. The basal sediments are gravelly.
III. Sampling Sites and Research Methods
A total of ten samples were collected for this study. The field work was carried with the aim of sampling sediments in the area for textural analysis and to depict the depositional pattern of sediments in the study area. The method of sampling adopted for this study was spot sampling method. Sampling method was adopted because it allows the analyses of several sedimentary layers deposited at different times. A representative sample was collected for each stratum since they are usually homogenous. A pit of seven feet was dug to get to the underlying strata. The sediments were collected from bottom to top. Before each stratum was studied, the surfaces of the stratum were scraped off so that sediments that do not belong to the stratum were not sampled. The hand-trowel used for sampling any stratum was properly rinsed before using to sample another stratum. Each sample collected was placed in well labeled polythene bags with codes (OKL1-OKL10).OKL means Okeluse, while the figures represent the number of stratum being sampled. The depths of each stratum were measured from bottom to top so as to know the thickness of each stratum. 500 grams of each sample was weighed using an electronic weighing balance after they have been arranged according to depth. The samples collected were placed in labeled beakers which were then placed and dried in the oven at a temperature of about 70oC.
Grain Size and Depositional Pattern of Sediment from Okeluse Area, Southwestern Nigeria
Figure 2 : The geologic map of the study area (Geologic map of Nigeria, after Ogala; Geologic map of Ondo State, after Nigeria Geological Survey of Nigeria, 2012; Geologic map of the study area, modified after Ehinola et al.,)
a) Sieve AnalysisAfter the samples have been dried, sieve
analysis was carried out for each of the samples. Lumped samples were disintegrated so that the sieve analysis result can be authentic. Sieving technique is applied to separate the grains of various size-classes, as proposed by Ingram (1971) and used by Srivastava and Mankar (2008). Initially, 500 grams of sample was prepared by removing carbonate and organic matters by treating with 10% dilute hydrochloric acid and 6% hydrogen peroxide respectively. The samples completely free from carbonate and organic matter is subjected for sieve analysis. The sieve used was the Impact Laboratory test sieve (ISO 3310) with a shaker and an amplifier. The sieves were arranged in such a way that the one with the highest opening was placed at the top while the one with the smallest opening was placed at the bottom with the base pan the base. The
dried samples were placed at the top, covered up and placed on a shaker. The amplifier was used to operate the shaker at a medium frequency. The sieve analysis was carried for about twenty minutes while checking at intervals. After the sieve analyses have been completed, the sediment in each sieves were weighed and recorded. These procedures were carried out for each of the ten samples.
This basic data i.e. weight percentage frequency data is converted into cumulative weight percentage. The cumulative curves constructed on the basis of weight percentage data, served as basic tool for the generation of other statistical parameters (Table 2) as proposed by Folk (1980), Reinick and Singh (1980), Pettijohn (1984), Lindholmn (1987) and Sengupta (1996). The average values of various graphic measures in individual lithologies were calculated to depict of trend of sediment in the study area (Table 2).
Grain Size and Depositional Pattern of Sediment from Okeluse Area, Southwestern Nigeria
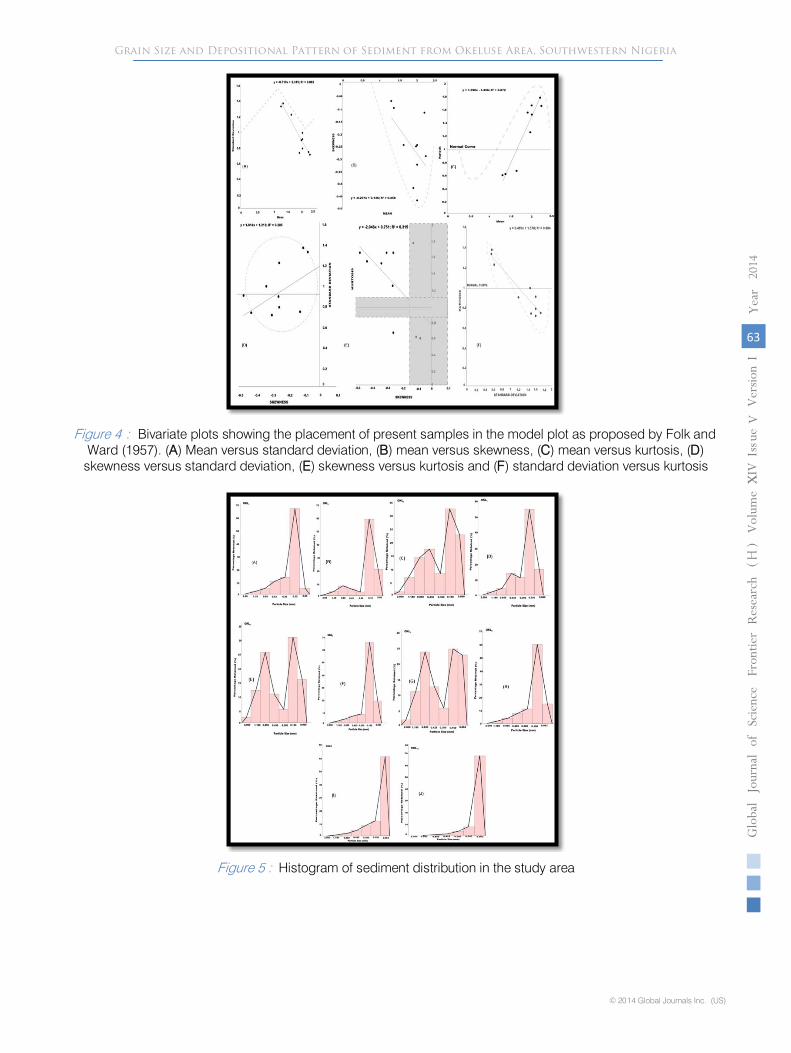
The comparative study of the histograms of retained fractions of sieve analysis i.e. weight percentage frequency curves (McBride, 1971) of entire samples show that the sediments are generally sand which range from fine to coarse sand. The cumulative weight percentage frequency curve is the representation of cumulative data of weight percentage on the vertical arithmetic ordinate ranging from one to hundred, whereas, φ value ranges from -1.00φ to 3.99φ. Most of the curves show almost similar trend, exhibiting a little sorting of grains and dominance of medium sand-size sediments (Figure 3).
c) Statistical Parametersi. Graphic Mean
According to Folk (1980), the best graphic measure for determining overall size of sediment is the Graphic Mean. The Graphic Mean (𝑀𝑀𝑧𝑧), is given by the
formula:𝑀𝑀𝑧𝑧 = (∅16 + ∅50 + ∅84)3� . This corresponds
very closely to the mean as computed by the method of moments, yet it is much easier to find. It is much superior to the median because it is based on three points and gives a better overall picture. The graphic mean values (Mz) were used for the classification of sediments in the study area as it describes the average grain size of the sediments. It ranges from 1.333 - 2.267. The lowest mean value is 1.333 which belongs to sample OKL7, while the peak value of 2.267 is associated with sample OKL9. The result of the mean as shown in table reveals that OKL1, OKL3, OKL5, and OKL7
are medium grained sediments whereas OKL2, OKL4, OKL6, OKL8, OKL9 and OKL10 are fine grained sediments. It is observed that there is an intercalation between the medium grained sediments and the fine grained sediments. The implication of this is that there is always a change in the transporting medium of the sediments. As explained earlier there is a cycle of low and high energy level in the area. This may possibly be attributed to the climatic nature of the area. During the dry season, the transporting medium which is river Ogbesse generally have low energy whereas during the raining season, it attains its maximum velocity depending on the amount of rainfall that falls the area.
ii.
Graphic Standard DeviationsThe Graphic Standard Deviation, (𝛿𝛿𝐺𝐺), is a good
measure of sorting and is computed as ∅84− ∅162� .
However, this takes in only the central two-thirds of the curve and a better measure is the Inclusive Graphic Standard Deviation, (𝛿𝛿1) which is given by the formula: 𝛿𝛿𝐼𝐼 = ∅84−∅16
4+ ∅95−∅5
6.6. This formula includes 90% of the
distribution and is the best overall measure of sorting, it
is simply the standard deviation computed from ∅16and∅84, and (2) the standard deviation as computed from ∅5 and ∅95 … since this interval (from 5 to 95%) embraces 3.30σ, the standard deviation is found as ∅95− ∅5
3.30. The two are simply averaged together. This
explains why the denominators are both multiplied by 2. Standard deviation of the study area is in the order 0.889, 0.975, 1.205, 0.880, 1.351, 0.730, 1.311, 0.774 and 0.699 for OKL1, OKL2, OKL3, OKL4, OKL5, OKL6, OKL7, OKL8, OKL9 and OKL10 respectively.
iii. Graphic SkewnessAccording to Folk, the graphic skewness covers
only the central 68% of the curve. Inasmuch as most skewness occurs in the “tails” of the curve, this is not sensitive enough measure. Therefore, a better statistic, one that includes 90% of the curve, is the Inclusive Graphic Skewness given by the formula:𝑆𝑆𝑆𝑆𝐼𝐼 =∅16+∅84−2∅50
2(∅84−∅16)+ ∅5+∅95−2∅50
2(∅95−∅5). The inclusive graphic
skewness (sk1) of grain analysis data (Table 2) show that they are negatively skewed. This implies that the sediments are strongly coarsely, coarsely and nearly symmetrical skewed. Sediments in OKL1, OKL2 and OKL10 are strongly coarsely skewed, while OKL3, OKL4, OKL5, OKL6, OKL8 and OKL9 are coarsely skewed. OKL7
is nearly symmetrical skewed.
iv. Graphic KurtosisThe graphic kurtosis (KG) is the peakedness of
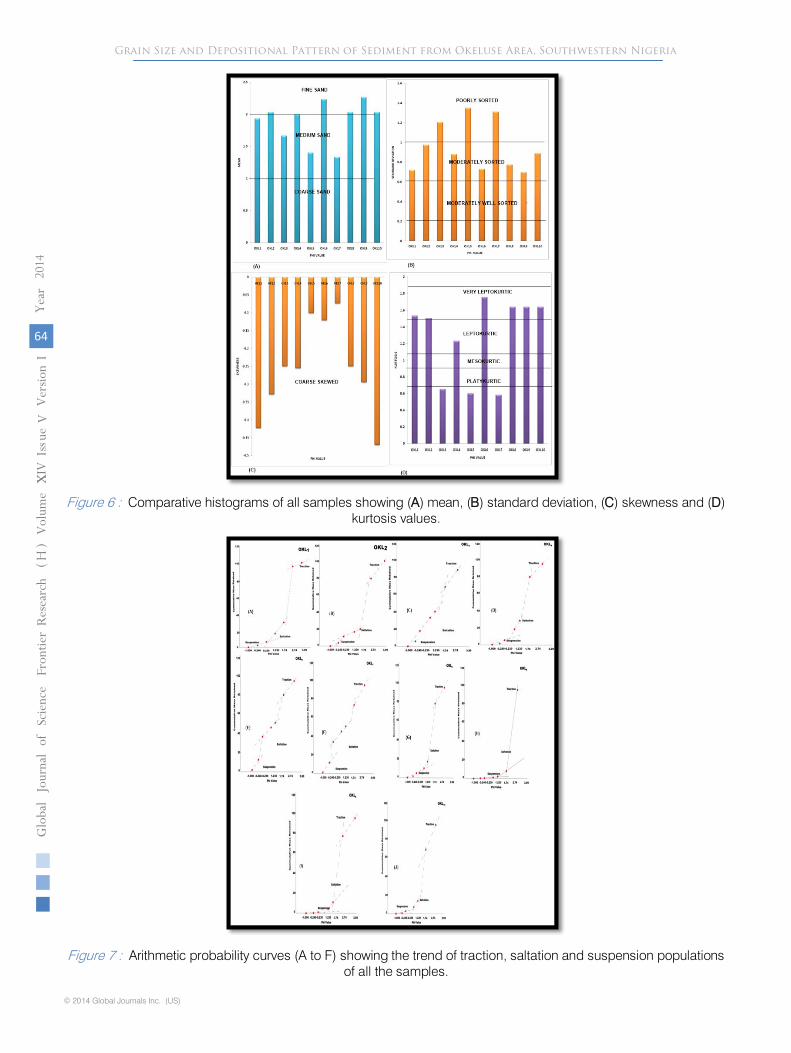
the distribution and measures the ratio between the sorting in the tails and central portion of the curve. If the tails are better sorted than the central portions, then it is termed as platykurtic, whereas leptokurtic, if the central portion is better sorted. The sorting kurtosis of the sediments (Table 2) shows that they are either leptokurtic or very platykurtic. OKL3, OKL5 and OKL7 are very platykurtic, while OKL1, OKL2, OKL4, OKL6, OKL8, OKL9 and OKL10 are leptokurtic (Figure 6).
d) Influence of Transporting Medium on Grain Size Distribution
From figure 4, it is observed that the sediments in the study area range from fine sand to coarse sand. This shows that the transporting agent must have undergone several stages of rise and fall. For fine sediments to be deposited in an environment, low energy of the transporting medium is required. However, for coarse grained sediments to be transported, a high transporting medium is required to transport the sediment from its initial state to its current state. Therefore it can be inferred from the aforementioned statement that the finer sand particles must have been transported when the transporting medium velocity was low, while the coarser sand must have been deposited when the energy of the transporting medium was high. The transporting medium must have undergone series of rise and fall in its velocity. In sediments with bimodal
Grain Size and Depositional Pattern of Sediment from Okeluse Area, Southwestern Nigeria
histogram (Figure 5), two flow regimes are suggested, while sediments with unimodal histogram, a single flow regime are suggested.
IV. Inter-Relationship of SizeParameters
The inter-relationship of specific size-parameters is significant to interpret various aspects of depositional environment, as the textural parameters of the sediments are often environmentally sensitive (Folk and Ward, 1957; Passega, 1957; Friedman, 1961, 1967; Moiola and Weiser, 1968; Visher, 1969; Srivastava and Mankar, 2009). Mean versus standard deviation plot of the present samples, shows the clustering of values near the extreme end of right limb of inverted V-shaped established trend of Folk and Ward (1957), denoting a smaller size range of the grains (Figure 4A). The same is confirmed by established sinusoidal curve of mean versus skewness as proposed by Folk and Ward (1957). The sinusoidal nature is because of proportionate admixture of two size-classes of the sediments i.e. fine sand and coarse sand. In general, the ideal fractions are nearly symmetrical but the mixing produces either positive or negative skewness depending upon the proportions of size-classes in the admixture. The present values mostly fall in the negative-skewed area of the graph. None is positively skewed (Figure 4B). It clearly indicates a unimodal nature of most sediment in the study area.
The relation between mean-size and kurtosis is complex and theoretical (Folk and Ward, 1957). The model plot of Folk and Ward (1957) denotes the mixing of two or more size-classes of sediments, which basically affect the sorting in peak and tails i.e. index of kurtosis. The scattering gives rise to an inverted ‘V’ trend. The plot of present values indicates a dominance of leptokurtic category followed by platykurtic in the size-class range of approximately 1.0-2.0φ i.e. medium sand (Figure 4C). It shows that the sediment-admixture is dominated by medium-sand and subordinate fine-sand. The varying proportions of fine sediments mixed with dominant sand mode makes the sorting worse, particularly in the tails; hence, there is a presence of platykurtic to leptokurtic. Similarly, the plot between skewness and standard deviation produce a scattered trend in the form of nearly circular ring (Folk and Ward, 1957). It may be due to two conditions i.e. either unimodal samples with good sorting or equal mixture of two modes. However, the present scattering shows clustering of grains in one sector (Figure 4D), which denotes the dominance of sand mode having subordinate silt. Because of the silt, the skewness value deviates into the negative sector.
The plot between standard deviation and kurtosis as proposed by Folk and Ward (1957) is again
governed by the proportions of two size-modes in the mixture. Worst sorting is found in the bimodal mixtures with equal amounts of two modes, and these also have lowest kurtosis (Folk and Ward, 1957). In the present graph, the scatters are little away from the pure sand region of the original curve of Folk and Ward (1957), showing presence of minor fine-grain content. Majority of the samples are leptokurtic and moderately sorted because of the dominance of medium sand-size sediments (Figure 4E). The plot between skewness versus kurtosis depends on two modes and follows a regular path as the mean-size changes (Folk and Ward, 1957). The present values dominantly fall in an area represented by nearly pure sand with >1 % gravel and <5% silt of the establish plot of Folk and Ward (1957) (Figure 4F).
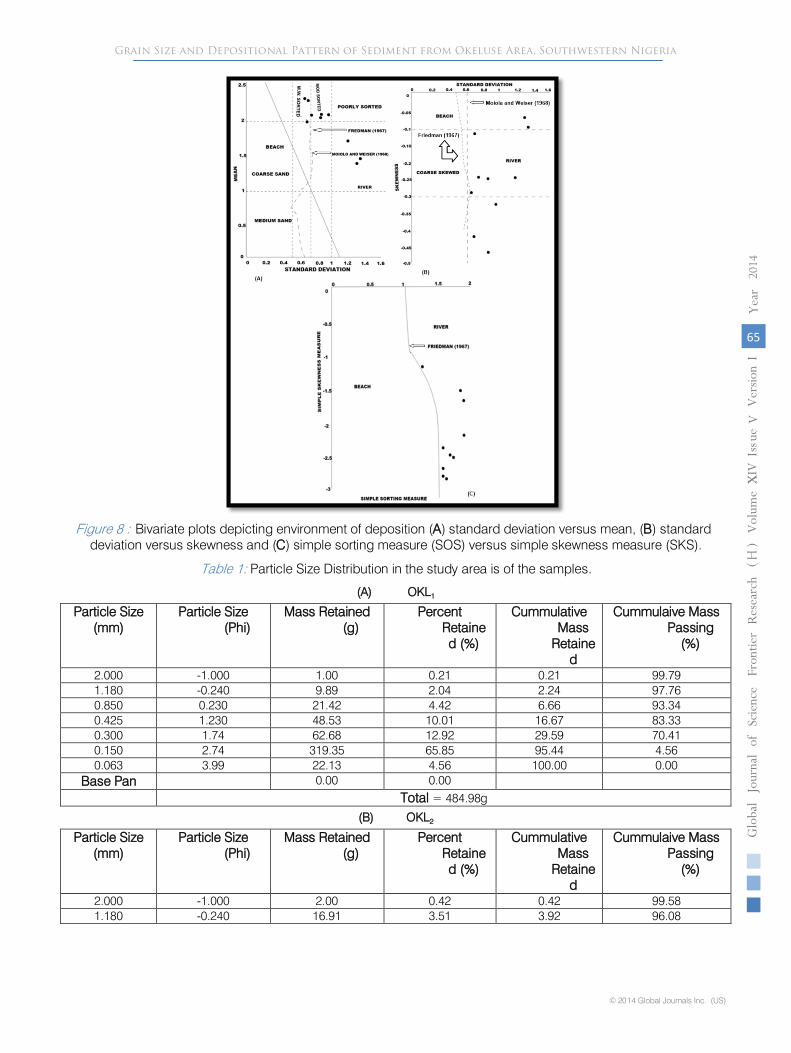
Certain plots which are considered significant for the interpretation of depositional environment (Friedman, 1961, 1967; Moiola and Weiser, 1968) have also been attempted. The plot between mean versus standard deviation is considered as an effective tool to differentiate between beach and river sands (Friedman, 1967; Moiola and Weiser, 1968). Accordingly, the present plot indicates that the sedimentation of Okeluse took place under river influence (Fig. 8A). Friedman (1967) and Moiola and Weiser (1968) considered the plot between standard deviation (horizontal axis) and skewness (vertical axis) is of great significance to differentiate between beach and river environments. The trends of present values are clearly indicative of river sedimentation (Figure 8B). Friedman (1967) established the relationship between simple sorting measure (SOS) = ½ (φ95 - φ5) and simple kurtosis measure (SKS) = (φ95 + φ5) - 2 φ50 and used it to differentiate between beach and river sediments (Srivastava and Mankar, 2008). The interrelationship plot (Figure 8C) shows the concentration of points in the river sector of the plot as proposed by Friedman (1967).
V. Log-Probability Curves
Log-probability curves proposed by Visher (1969) and used by is the representation of cumulative grain-size distribution on the probability (ordinate) paper, which is very useful to differentiate the sediments according to the mode of their transport i.e. traction, saltation and suspension.
In the present study, all the ten samples have been analyzed, which, in general, shows the dominance of saltation and suspension domains of size-population (Figure 7A - H). The traction between saltation and suspension is normally noticed near 2φ value. The suspension population may range up to 25%. The traction population represents minor quantity of poorly-sorted sediments, seldom exceeding 5%. The saltation population is comparatively more sorted than the fine-grained suspension population. Occasionally, the
Grain Size and Depositional Pattern of Sediment from Okeluse Area, Southwestern Nigeria
saltation population is divided into two sub-populations, truncating around 1.5φ value, which may be due to internal forces causing rolling or sliding (Visher, 1969).
The present plots are comparable with established trend for modern and ancient fluvial deposits as illustrated by Visher (1969), in which both saltation and suspension populations dominate.
VI. Discussion and Conclusions
Grain-size analysis of ten sediments representing 7m thick, fine to coarse grained sand of Okeluse, southwestern Nigeria collected through point sampling method have been carried out. The important conclusions drawn are as follows:
The frequency curves are dominantly indicative of fine to coarse-grained nature of the sand of the study area. The graphic mean value indicates the dominance of medium sand-size particles. The sediments, in general, show moderate sorting and are dominantly near-symmetrical to fine-skewed in nature. In majority of the cases, both peak and tails are negatively sorted giving rise to leptokurtic to paltykurtic condition. Various bivariate plots between mean, skewness, kurtosis and standard deviation are also interpreted following the
criteria as proposed by Folk and Ward (1957). Some of the plots are indicative of unimodal nature of sediments, in which, sand-size is the principle mode. Some of the plots show a bimodal nature of sediments which also indicate sand-size sediments Standard deviation versus mean and standard deviation versus skewness indicates a fluvial environment of deposition as proposed by Friedman (1967) and Moiola and Weiser (1968). The same is also an outcome of SOS versus SKS (Friedman, 1967). The sediments are mostly rolled and deposited by traction currents, however, a few samples showing suspension mode is because of more quantity of fine grained material. The log-probability curves are also suggestive of fluvial environment of deposition as proposed by Visher (1969).
VII. Acknowledgements
Figure 3 : Cumulative curves showing the trends of all the samples
The authors appreciate the management of Achievers University, Owo and the Dean of the College of Natural and Applied Sciences (CONAS) and the Head of Department of Geological Sciences Department of the same institution for providing an enabling environment to carry out this research work.
Figure 4 : Bivariate plots showing the placement of present samples in the model plot as proposed by Folk and Ward (1957). (A) Mean versus standard deviation, (B) mean versus skewness, (C) mean versus kurtosis, (D)
skewness versus standard deviation, (E) skewness versus kurtosis and (F) standard deviation versus kurtosis
Figure 5 : Histogram of sediment distribution in the study area
Bivariate plots depicting environment of deposition (A) standard deviation versus mean, (B) standard deviation versus skewness and (C) simple sorting measure (SOS) versus simple skewness measure (SKS).
Grain Size and Depositional Pattern of Sediment from Okeluse Area, Southwestern Nigeria
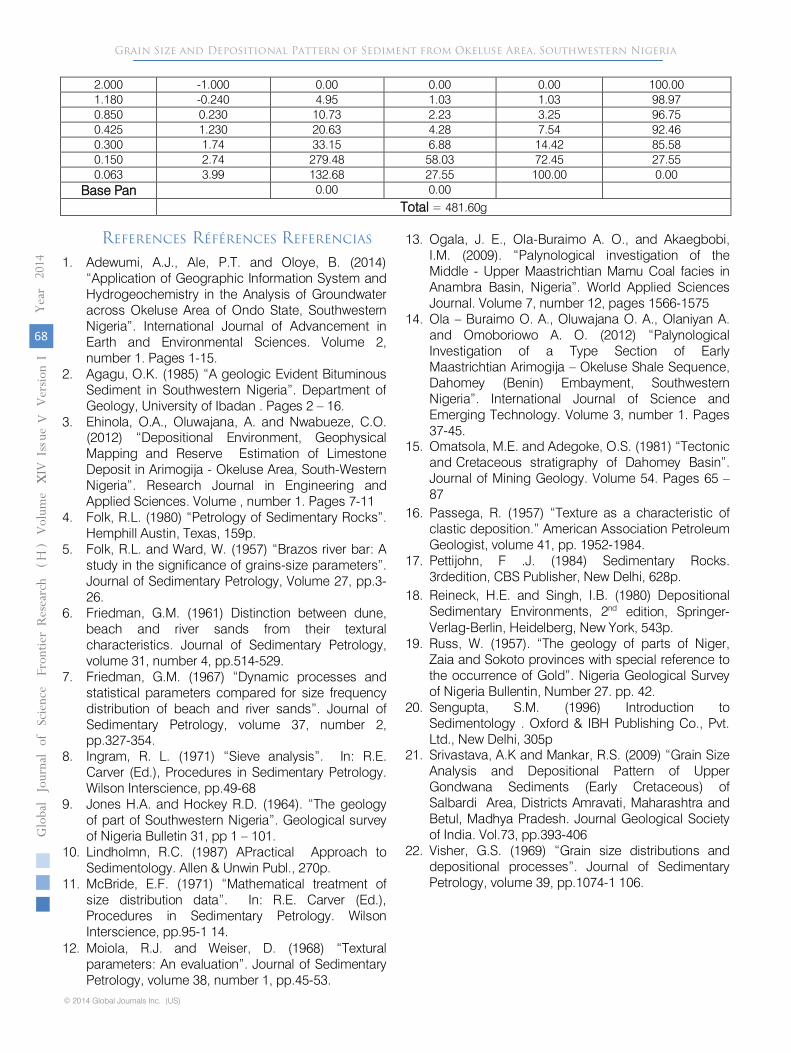
2.000 -1.000 0.00 0.00 0.00 100.00
1.180 -0.240 4.95 1.03 1.03 98.97
0.850 0.230 10.73 2.23 3.25 96.75
0.425 1.230 20.63 4.28 7.54 92.46
0.300 1.74 33.15 6.88 14.42 85.58
0.150 2.74 279.48 58.03 72.45 27.55
0.063 3.99 132.68 27.55 100.00 0.00
Base Pan 0.00 0.00 Total = 481.60g
References Références Referencias
1. Adewumi, A.J., Ale, P.T. and Oloye, B. (2014) “Application of Geographic Information System and Hydrogeochemistry in the Analysis of Groundwater across Okeluse Area of Ondo State, Southwestern Nigeria”. International Journal of Advancement in Earth and Environmental Sciences. Volume 2, number 1. Pages 1-15. 2. Agagu, O.K. (1985) “A geologic Evident Bituminous Sediment in Southwestern Nigeria”. Department of Geology, University of Ibadan . Pages 2 – 16. 3. Ehinola, O.A., Oluwajana, A. and Nwabueze, C.O. (2012) “Depositional Environment, Geophysical Mapping and Reserve Estimation of Limestone Deposit in Arimogija - Okeluse Area, South-Western Nigeria”. Research Journal in Engineering and Applied Sciences. Volume , number 1. Pages 7-11 4. Folk, R.L. (1980) “Petrology of Sedimentary Rocks”. Hemphill Austin, Texas, 159p. 5. Folk, R.L. and Ward, W. (1957) “Brazos river bar: A study in the significance of grains-size parameters”. Journal of Sedimentary Petrology, Volume 27, pp.3-26. 6. Friedman, G.M. (1961) Distinction between dune, beach and river sands from their textural characteristics. Journal of Sedimentary Petrology, volume 31, number 4, pp.514-529. 7. Friedman, G.M. (1967) “Dynamic processes and statistical parameters compared for size frequency distribution of beach and river sands”. Journal of Sedimentary Petrology, volume 37, number 2, pp.327-354. 8. Ingram, R. L. (1971) “Sieve analysis”. In: R.E. Carver (Ed.), Procedures in Sedimentary Petrology. Wilson Interscience, pp.49-68 9. Jones H.A. and Hockey R.D. (1964). “The geology of part of Southwestern Nigeria”. Geological survey of Nigeria Bulletin 31, pp 1 – 101. 10. Lindholmn, R.C. (1987) APractical Approach to Sedimentology. Allen & Unwin Publ., 270p. 11. McBride, E.F. (1971) “Mathematical treatment of size distribution data”. In: R.E. Carver (Ed.), Procedures in Sedimentary Petrology. Wilson Interscience, pp.95-1 14.
12. Moiola, R.J. and Weiser, D. (1968) “Textural parameters: An evaluation”. Journal of Sedimentary Petrology, volume 38, number 1, pp.45-53.
13. Ogala, J. E., Ola-Buraimo A. O., and Akaegbobi, I.M. (2009). “Palynological investigation of the Middle - Upper Maastrichtian Mamu Coal facies in Anambra Basin, Nigeria”. World Applied Sciences Journal. Volume 7, number 12, pages 1566-1575
14. Ola – Buraimo O. A., Oluwajana O. A., Olaniyan A. and Omoboriowo A. O. (2012) “Palynological Investigation of a Type Section of Early Maastrichtian Arimogija – Okeluse Shale Sequence, Dahomey (Benin) Embayment, Southwestern Nigeria”. International Journal of Science and Emerging Technology. Volume 3, number 1. Pages 37-45.
15. Omatsola, M.E. and Adegoke, O.S. (1981) “Tectonic and Cretaceous stratigraphy of Dahomey Basin”. Journal of Mining Geology. Volume 54. Pages 65 – 87
16. Passega, R. (1957) “Texture as a characteristic of clastic deposition.” American Association Petroleum Geologist, volume 41, pp. 1952-1984.
17. Pettijohn, F .J. (1984) Sedimentary Rocks. 3rdedition, CBS Publisher, New Delhi, 628p.
edition, Springer-Verlag-Berlin, Heidelberg, New York, 543p.
19. Russ, W. (1957). “The geology of parts of Niger, Zaia and Sokoto provinces with special reference to the occurrence of Gold”. Nigeria Geological Survey of Nigeria Bullentin, Number 27. pp. 42.
20. Sengupta, S.M. (1996) Introduction to Sedimentology . Oxford & IBH Publishing Co., Pvt. Ltd., New Delhi, 305p
21. Srivastava, A.K and Mankar, R.S. (2009) “Grain Size Analysis and Depositional Pattern of Upper Gondwana Sediments (Early Cretaceous) of Salbardi Area, Districts Amravati, Maharashtra and Betul, Madhya Pradesh. Journal Geological Society of India. Vol.73, pp.393-406
22. Visher, G.S. (1969) “Grain size distributions and depositional processes”. Journal of Sedimentary Petrology, volume 39, pp.1074-1 106.
Grain Size and Depositional Pattern of Sediment from Okeluse Area, Southwestern Nigeria