J ournal of S edimentary P etrology ,- V ol . 39, No. 3 1074-1106 F ig s . 1-21, S eptember , 1969 - . GRAIN SIZE DISTRIBUTIONS AND DEPOSITIONAL PROCESSES1 .GLENN S. VISHER University of Tulsa; Tulsa, Oklahoma - ABSTRACT Extensive textura! study, o.f both modern and ancient sands has provided the basis for a genetic inter pretation of sand texture. Analysis is based on recognizing sub-populations within individua!' 'log-normal grain size distributions. Each log-normal sub-population may be related to a different mode of sediment transport and deposition, thus providing a measure of their importance in the genesis of a sand unit. The three modes of transport reflected are: (1) suspension; (2) saltation; antf (3) surface creep or rolling. Each ofrthese is developed as a separate sub-population within a grain size distribution. The number, amount, size-range, mixing, and sorting of these populations vary systematically in relation to provenance, sedi mentary process, and. sedimentary dynamics.. The analysis of these parameters is the basis for determining the process-response characteristics of individual sand units. . ~ A .number of processes are uniquely reflected in log-probability curves of grain size distributions of sands and sandstones. These include: (1) current; (2) swash and backwash;'(3) wave; (4) tidal channel; (5) fallout from suspension; (6 ) turbidity current; and (7) aeolian dune. The combination of two or more of these processes also produce characteristic log-probability curve shapes. Ancient sands show some differences from their modern analogues, but these are usually minor. Log- probabilitÿ plots of ancient sands are directly comparable to those from modern sands. The principal limita tion of this study is in comparing Sands formed under comparable conditions and obtaining an independent determination of the processes of formation of ancient sands. introduction of sedimentary processes to textural responses. ■ Statement of Problem If these can be related to s.Pec‘fic depositional • _ , environments, then a powerful tool will be For many years sed.mentary petrographers available for interpreting .thé genesis of ancient have attempted to use gram size to determine ciastic deposits, sedimentary environments. A survey of the ex tensive literature on this Subject illustrates the Previous Work steady progress that has been made toward this The development -of a genetic approach to goal. Many excellent contributions have been ciastic textures has been a long and difficult one. made during the past twenty to thirty years, Many workers have provided information and each providing new approaches and insights forthered the development towards this goal; into the_ nature and significance of gram size conse uentlVj it is nearly impossible t0 trace the distributions. Only within the past few years, or¡ ¡n of many of the ideas. Specific concepts , however, have workers attempted to relate grain such M tbe log-normality of grain size distribu- size distributions to the depositional processes tion are very old> wkb extensive treatment- of responsible for their, formation This.approach th¡s conGépt by Krumbein ( 1937/ 193g). Specu- appears to be particularly fruitful, and it pro- iation concerning the reasons for this were dis vides the basis for the next step towards a truly -,cussed bv Krumbein (1938), but no satisfactori- genetic classification - of sedimentary textures, expiations were giveii. From that time to the One of the major problems m the analysis ot . present various approaches to granulometnc gram size, .distributions is _ that the same sedi- anaIysis have been proposed. Those significant rnentary processes occur within a number of en- to the understanding of processes are sttmma- vironments and the consequent_ textural re- Hzed, so that the development of the essential sponse is similar. Now that there are many;. jdeas relating sedimentarv processes to textural physical criteria available to identify specific reSponses can be traced, depositional environments, the textural studies ' do not need to stand alone, but can provide a Developments During 1940’s separate line of-evidence to aid in interpreting _Work by Pettijohm (1949) indicated that a clastic deposits of unknown origin. - _ number of modes existed in grain size distribu- In summary, the problem lays in the relation - (-¡onSj and that deficiencies occurred in the ‘ Manuscript received October 10, 1968; revised coarse sand-fine granule size and in the coarse May 2, 1969. ' ' silt size. These modes and deficiencies were at-, ¿GRAIN SIZE DISTRIBUTIONS IhJZSi 1075 tributed to provenance and to the hydraulics of stream transport, but little environmental sig nificance was placed on the observations. No general hypothesis was developed to explain why the same modes should appear both in flu vial and marÿie sediments. One o.f thè most significant of the early pa pers on texture was by Doeglas (1946): He concluded that grain size distribtitions follow an arithmetic probability law. Two major contribu tions by Doeglas were that (1) grain size dis tributions are mixtures of two or more compo nent .distributions or populations, and that ( 2 ) these distributions were produced by varying transport conditions. From his analyses he de veloped an empirical classification of curve shapes and related types of curves to specific sedimentary environments. There were several problems in this type of analysis: ( 1 ) a sedi mentation balance was used for textural analy sis which did not provide sufficiently accurate or reproducible results; ( 2 ) cumulative distribu tions were plotted on arithmetic probability paper, which tended to minimize the fine grained tail and strongly accentuated the course fraction; (3) the mixing and truncation of component-distributions was not observed; (4) curve shapes were not related to specific deposi tional-processes. Regardless of these limitations Doeglas’ con- ' tribution was noUsufficiently recognized by sedi- mentologists, and this rather fruitful approach to the recognition of sedimentary environments was not widely adopted in this country. . One of the most significant papers relating sedimentation dynamics to texture was pub lished by Inman (1949). He, recognized thbt there are three fundamental modes of transport, surface creep, saltation, and suspension (Inman, 1949, p. 55), and-he utilized the existing knowl edge concerning fluid mechanics to analyze the modes of transport of sedimentary particles, Much of the work in this area had been devel oped by Gilbert (1914), Shields (1936), Rubey (1938), Bagnold (1941), and Kalinske (1943). Many other workers aided in the development of these concepts, but the above writers related fluid mechanics directly to the problems of sedi ment transport_and deposition. Preliminary conclusions concerning sorting, skewness, and mean size were derived by Inman (1949) . He did not, however, relate these pa rameters to the total.grain size,distributions or to the presence of individual populations, as had been suggested earlier by Doeglas. Inman’s work formed the basis for the emphasis during the 1950’s and 1960’s on statistical measures of the grain sizq distribution and on the continued mathematical- study of sediment transport and fluid mechanics. Developments During 1950’s . Studies by Einstein (1950), Einstein and Barbarasso (1952), and Einstein and Chien (1953) involyed the relation of sediment trans port to stream characteristics. These papèrs, however, dealt with predicting the volume of sediment transport rather than with deposition. Papers by Bagnold (1954, 1956) dealt specifi cally with the transport mechanics of sediments, and these papers provided the theoretical basis for the interpretation of the textures of sedi ments. Papers by Chien (1956), Sundborg (1956), Vanoni and Brooks (1957), and Brooks (1958) discussed: in detail the relations of stream mechanics and sediment transport. This work in fluid mechanics was not applied specifi cally to textures of the deposited sediments. Shapes of grain size distribution curves of sedi ments from both modern and ancient environ ments were described by SindoWski (1958). He referenced' the pioneer studies by Doeglas (1946),, but deviated from that work in that he used log-probability plots of the grain, size in- . formation. Sindowski (1958, p. 239-240) em pirically classified size distribution curves ac cording to seven different depositional types : (1) relict, (2) strand, (3) tidal flat, (4) shelf, (5) tidal inlet, (. 6 ) minor tidal channel, and (7) fluvial. Many examples are provided in his paper from more than 5000 analyzed samples. Sindowski’s work, which generally has been overlooked in this country, provides the first careful study of the relation of sediment textures from known depositional environments to the shapes of grain size curves. It allows the envi ronmental identification of many types of sands Mrom their textures. Sindowski, however, did not try to relate the shapes of the grain size curves to transport and depositional processes that formed them. This step could not be made without close study of the fluid mechanics of sediment transport and deposition, as was devel oped by Bagnold (1956) and other workers. The first step in the correlation of curve shapes with processes was published by A. Tohn Moss (1962, 1963). . ) Developments During the I960's The two papers, by Moss represent a major , contribution toward an understanding of the re- lation of grain size distributions to depositional processes. Moss used shape and size of grains to distinguish subpopulations produced by the three means of sediment transport described by Inman (1949) and Bagnold (1956): (1) sur-
Transcript
J o u r n a l o f S e d i m e n t a r y P e t r o l o g y ,- V o l . 39, No. 3 1074-1106F i g s . 1-21, S e p t e m b e r , 1969 - .
GRAIN SIZE DISTRIBUTIONS AND DEPOSITIONAL PROCESSES1
.G L E N N S. V IS H E R University of T ulsa; Tulsa, Oklahoma
- A B ST R A C TExtensive textura! study, o.f both modern and ancient sands has provided the basis for a genetic inter
pretation of sand texture. Analysis is based on recognizing sub-populations within individua!' 'log-normal grain size distributions. Each log-normal sub-population may be related to a different mode of sediment transport and deposition, thus providing a measure o f their importance in the genesis of a sand unit. The three modes o f transport reflected a re : (1) suspension; (2 ) saltation; an tf (3 ) surface creep or rolling. Each ofrthese is developed as a separate sub-population within a grain size distribution. The number, amount, size-range, mixing, and sorting of these populations vary systematically in relation to provenance, sedimentary process, and. sedimentary dynamics.. The analysis of these param eters is the basis for determining the process-response characteristics of individual sand units. . ~
A .number of processes are uniquely reflected in log-probability curves o f grain size distributions of sands and sandstones. These include: (1 ) current; (2 ) swash and b ack w ash ;'(3 ) wave; (4) tidal channel; (5) fallout from suspension; (6 ) turbidity current; and (7) aeolian dune. The combination of two or more o f these processes also produce characteristic log-probability curve shapes.
Ancient sands show some differences from their modern analogues, but these are usually minor. Log- probabilitÿ plots o f ancient sands are directly comparable to those from modern sands. The principal limitation of this study is in comparing Sands formed under comparable conditions and obtaining an independent determination o f the processes o f formation of ancient sands.
i n t r o d u c t i o n o f se d im e n ta ry p rocesses to te x tu ra l responses.■ Statement of Problem If these can be related to s.Pec‘fic depositional
• _ , environments, then a powerful tool will beFor many years sed.mentary petrographers available for interpreting .thé genesis of ancient
have attempted to use gram size to determine ciastic deposits,sedimentary environments. A survey of the extensive literature on this Subject illustrates the Previous Worksteady progress that has been made toward this The development - of a genetic approach togoal. Many excellent contributions have been ciastic textures has been a long and difficult one.made during the past twenty to thirty years, Many workers have provided information andeach providing new approaches and insights forthered the development towards this goal;into the_ nature and significance of gram size conse uentlVj it is nearly impossible t0 trace thedistributions. Only within the past few years, or¡ ¡n of many of the ideas. Specific concepts
, however, have workers attempted to relate grain such M tbe log-normality of grain size distribu-size distributions to the depositional processes tion are very old> wkb extensive treatment- ofresponsible for their, formation This.approach th¡s conGépt by Krumbein ( 1937/ 193g). Specu-appears to be particularly fruitful, and it pro- iation concerning the reasons for this were disvides the basis for the next step towards a tru ly -,cussed bv Krumbein (1938), but no satisfactori-genetic classification - of sedimentary textures, ex p ia tio n s were giveii. From that time to theOne of the major problems m the analysis ot . present various approaches to granulometnc gram size, .distributions is _ that the same sedi- anaIysis have been proposed. Those significantrnentary processes occur within a number of en- to the understanding of processes are sttmma-vironments and the consequent_ textural re- Hzed, so that the development of the essentialsponse is similar. Now that there are many;. jdeas relating sedimentarv processes to texturalphysical criteria available to identify specific reSponses can be traced,depositional environments, the textural studies
' do n o t need to s ta n d alone, bu t can p rov ide a Developments During 1940’sse p a ra te line o f-ev id en c e to a id in in te rp re tin g _W o rk by P e t t i jo h m (1 9 4 9 ) in d ica ted th a t aclastic deposits o f unk n o w n orig in . - _ num ber o f m odes ex is ted in g ra in size d istribu -
In sum m ary, th e problem lays in th e re la tio n - (-¡onSj and th a t deficiencies o ccu rred in the
‘ Manuscript received October 10, 1968; revised coarse sand-fine granule size and in the coarseMay 2, 1969. ' ' silt size. These modes and deficiencies were a t- ,
¿GRAIN S I Z E D I S T R I B U T I O N S I h J Z S i 1075
tributed to provenance and to the hydraulics of stream transport, but little environmental significance was placed on the observations. No general hypothesis was developed to explain why the same modes should appear both in fluvial and marÿie sediments.
One o.f thè most significant of the early papers on texture was by Doeglas (1946): He concluded that grain size distribtitions follow an arithmetic probability law. Two major contributions by Doeglas were that (1) grain size distributions are mixtures of two or more component .distributions or populations, and that (2 ) these distributions were produced by varying transport conditions. From his analyses he developed an empirical classification of curve shapes and related types of curves to specific sedimentary environments. There were several problems in this type of analysis: ( 1) a sedimentation balance was used for textural analysis which did not provide sufficiently accurate or reproducible results; (2 ) cumulative distributions were plotted on arithmetic probability paper, which tended to minimize the fine grained tail and strongly accentuated the course fraction; (3) the mixing and truncation of component-distributions was not observed; (4) curve shapes were not related to specific depositional-processes.
Regardless of these limitations Doeglas’ con- ' tribution was noUsufficiently recognized by sedi- mentologists, and this rather fruitful approach to the recognition of sedimentary environments was not widely adopted in this country. .
One of the most significant papers relating sedimentation dynamics to texture was published by Inman (1949). He, recognized thbt there are three fundamental modes of transport, surface creep, saltation, and suspension (Inman, 1949, p. 55), and-he utilized the existing knowledge concerning fluid mechanics to analyze the modes of transport of sedimentary particles, Much of the work in this area had been developed by Gilbert (1914), Shields (1936), Rubey(1938), Bagnold (1941), and Kalinske (1943). Many other workers aided in the development of these concepts, but the above writers related fluid mechanics directly to the problems of sediment transport_and deposition.
Preliminary conclusions concerning sorting, skewness, and mean size were derived by Inman (1949) . He did not, however, relate these parameters to the total.grain size,distributions or to the presence of individual populations, as had been suggested earlier by Doeglas. Inman’s work formed the basis for the emphasis during the 1950’s and 1960’s on statistical measures of the grain sizq distribution and on the continued
mathematical- study of sediment transport and fluid mechanics.
Developments During 1950’s .Studies by Einstein (1950), Einstein and
Barbarasso (1952), and Einstein and Chien (1953) involyed the relation of sediment transport to stream characteristics. These papèrs, however, dealt with predicting the volume of sediment transport rather than with deposition. Papers by Bagnold (1954, 1956) dealt specifically with the transport mechanics of sediments, and these papers provided the theoretical basis for the interpretation of the textures of sediments. Papers by Chien (1956), Sundborg (1956), Vanoni and Brooks (1957), and Brooks (1958) discussed: in detail the relations of stream mechanics and sediment transport. This work in fluid mechanics was not applied specifically to textures of the deposited sediments. Shapes of grain size distribution curves of sediments from both modern and ancient environments were described by SindoWski (1958). He referenced' the pioneer studies by Doeglas (1946),, but deviated from that work in that he used log-probability plots of the grain, size in- . formation. Sindowski (1958, p. 239-240) empirically classified size distribution curves according to seven different depositional types : (1) relict, (2) strand, (3) tidal flat, (4) shelf, (5) tidal inlet, (.6 ) minor tidal channel, and (7) fluvial. Many examples are provided in his paper from more than 5000 analyzed samples. Sindowski’s work, which generally has been overlooked in this country, provides the first careful study of the relation of sediment textures from known depositional environments to the shapes of grain size curves. It allows the environmental identification of many types of sands
Mrom their textures. Sindowski, however, did not try to relate the shapes of the grain size curves to transport and depositional processes that formed them. This step could not be made without close study of the fluid mechanics of sediment transport and deposition, as was developed by Bagnold (1956) and other workers. The first step in the correlation of curve shapes with processes was published by A. Tohn Moss (1962, 1963). .
) Developments During the I960'sThe two papers, by Moss represent a major ,
contribution toward an understanding of the re- lation of grain size distributions to depositional processes. Moss used shape and size of grains to distinguish subpopulations produced by the three means of sediment transport described by Inman (1949) and Bagnold (1956): (1) sur-
1076 G L E N N S. V I S H E R
face creep, (2) saltation, and (3) suspension. He found that these three populations could be intermixed in the same sample. He discussed at length the transportation of clastic particles and mechanisms of entrapment of particles at the sedimentary interface. Moss also provided insight into the roll of shape and size in sediment lamination and mixing, and into the mechanisms by which fine or coarse-grained tails are incorporated into size distribution curves of sediments deposited from a traction carpet of sal- tating sand grains. His data illustrated the subdivision of three sub-populations, and showed that the position of truncation, sorting, and mean size of these populations were different in different samples. The most exactingly selected particles are the ones transported and deposited from the dense traction carpet of saltating grains. Breaks or truncations occur between the population of particles finer or coarser grained than those found in the saltation population or fraction. The fine particles transported in suspension usually have an upper size range of
! about .07 to .1 mm, but may be coarser. This, size provides an indication of velocity of free
' current clear of the-bed (Moss, 1963, p. 340).The coarser grained particles appear to be
transported into position at the depositional interface by sliding or rolling. This necessitates transport over a bed of low grain roughness; consequently, these particles are always coarser than those transported by saltation. The upper size limit of saltation depends on the nature of the current and on the characteristics of the bed (Moss, 1963,. p. 306).
Work on truncation points illustrated by log- probability plots was presented by Fuller (1961). He suggested that the break between saltation and rolling populations in many in - . stances occurred near 2 phi, or the point of junction between the Impact-and Stokes laws of particle settling (Fuller, 1961, p. 260). Spencer (1963, p. 190) suggested from analysis of data presented by Krumbein and Aberdeen (1937) that: ( 1 ) all clastic sediments are mixtures of three or less . log-normally, distributed populations;,and (2 ) sorting is. a measure of the mixing of these populations. Intermixture of these populations caused the variation - in mean and sorting values present within the group of related samples from Barataría Bay, Louisiana.
Different populations in log-probability plots were shown by Visher ( 1965a) in a study of fluvial sedimentation units in Oklahoma. This study using a factor analysis approach suggested that flow regime may control the range, of grain size of the saltation and suspension populations and the approximate position of
truncation between the two populations.Kiovan (1966) applied a factor analysis to the
same data studied by Spencer (1963). He found that the degree of mixing of the two fundamen- .tal populations was environmentally sensitive. The environments separated by Kiovan ( 1966, p. 123) primarily reflected sedimentary process and included: ( 1) surf energy dominant; (2 ) current energy dominant; and (3) gravitational energy dominant. This -illustrated the close asso-
- ciation of process to the mixing of suspension and saltation populations in Barataría Bay.
Other lines of textural evidence for environmental identification have’been pursued during the last ten years ; the most significant are the studies by Folk and Ward (1957), Mason and Folk (1958), Harris (1959), and Friedman (1961, 1967). These authors have used the statistical measures of mean, standard deviation, skewness, and kurtosis to separate beach, dune, aeoliân flat,, and fluvial environments. This approach has been moderately successful in modern environments but less successful in interpreting the genesis of ancient sediments. Work by Passega and others (1957; 1967) has led to the development of C/M plots. By using a number of samples it is possible to distinguish suspension, traction, graded suspension, and other sedimentary processes. Analysis of many samples by use of C/M plots when combined with other methods of textural analysis should add additional insight into the genesis of individual sand units.
RELATION OF SEDIMENT TRANSPORT TO , GRAIN SIZE DISTRIBUTIONS
The three modes, of sediment transport, suspension, saltation, and surface creep, have been studied in some detail from a theoretical and mathematical viewpoint. Some data are available on the grain size ranges attributable to individual modes of transport.
Transport by SuspensionTrue suspension caused by turbulence where
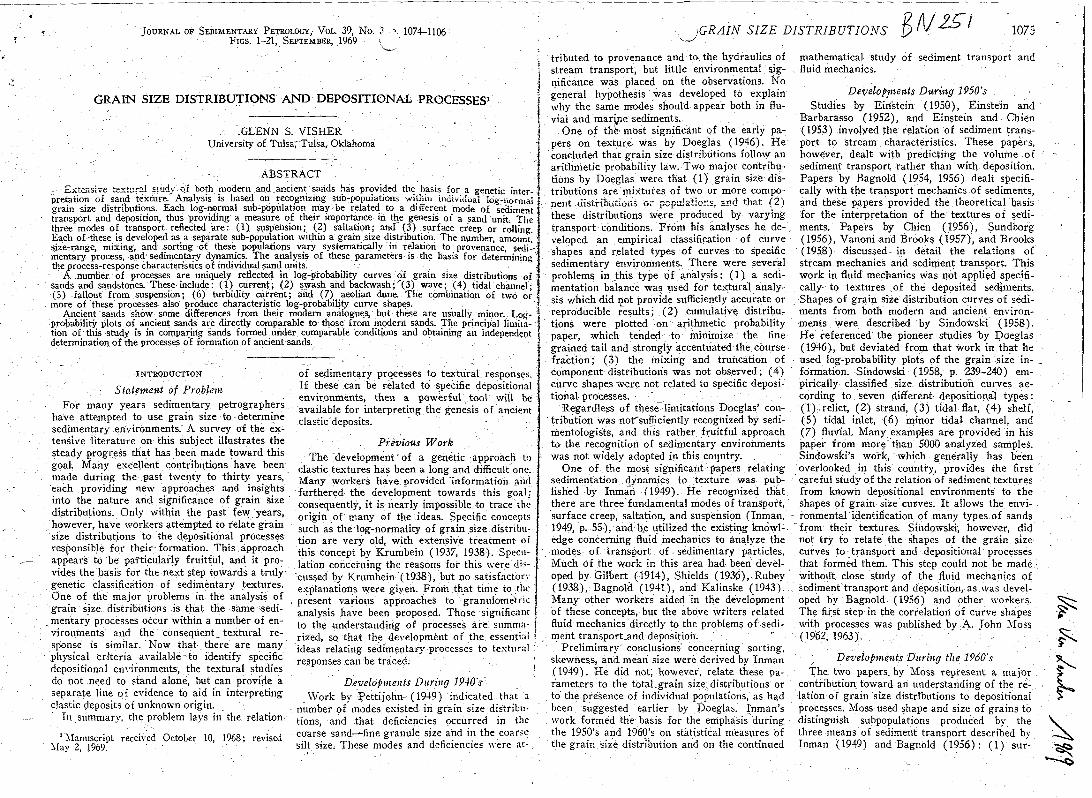
there is no vertical change in grain size occurs in the very fine grained sand range, typically less than .1 mm (Lane, 1938). Other studies suggest a size of .0375 mm (U. S. Waterways Ex- périment Station, 1939). The true value miist depend upon the intensity of the turbulence and possibly could be coarser than .1 mm. The problem is complicated by the interchange of suspension and bedload transport in cértain grain sizes. As shown in figure 1, this results in a graded suspension, with coarser suspension sediments increasing in concentration toward the
J R A I N S I Z E D I S T R I B U T I O N S 1077
2.0 FEET ABOVE BOTTOM
i :
Phi S c a le
m m . S ca le
F ig . 1.—Mississippi River sediment samples, U.S. Waterways Experiment Station. The strong size gradation within 2 ft of the river bed is illustrated.
bed (U. S. Waterways Experiment Station, 1939).2
The size of a sediment particle that may be heid in suspension is dependent upon turbulence; consequently, the break or truncation point between suspension and bedload transport may be highly variable and reflect physical con-. dirions at the time of deposition. In true suspension no variation in concentration of sediments exists from the surface to the depositional interface. Therefore,'some of this material is available for deposition with coarser material at the sediment-water interface. A graded suspension increases in grain size downward towards the bed, allowing an interchange with the bedload. Mixing between these two populations is common in a sedimentary deposit. Most sedimentary laminae contain some of the .1 mm and smaller size fraction, which is directly deposited from the suspension mode of transport. This size material was easily recognized as a separate population in log-probability plots of some Recent sediments (Visher, 1967a, 1967b).
* The term graded suspension has been used by a number of writers, but with little consistency. It is used here to indicate coarse materials (> .1 mm) which are.part of the suspension or “clay” population.
Saltation TransportVery little information is available on the
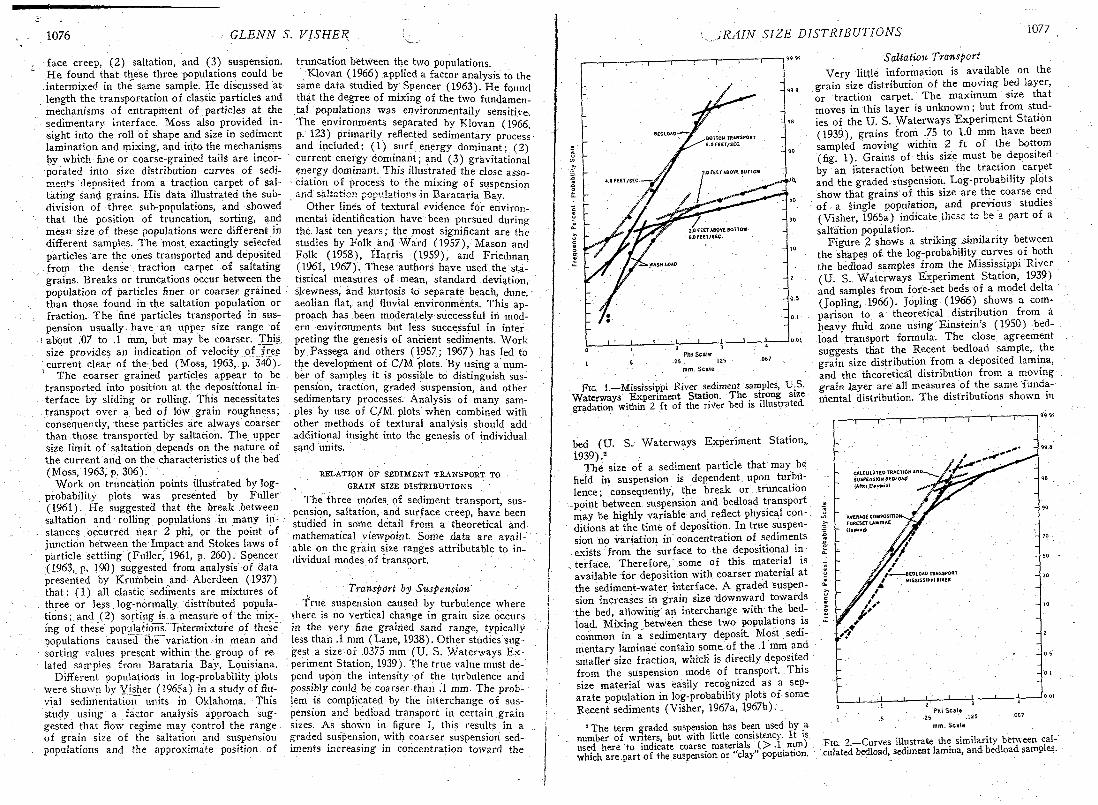
grain size distribution of the moving bed layer, or traction carpet. The maximum size that moves in this layer is unknown; but from studies of the U. S. Waterways Experiment Station(1939), grains from .75 to 1.0 mm have been sampled moving within 2 ft of the bottom (fig. 1). Grains of this size must be deposited by an interaction between the traction carpet and the graded suspension. Log-probability plots show that grains of this size are the coarse end of a single population, and previous studies (Visher, 1965a) indicate these to be a part of a saltation population.
Figure 2 .shows a striking similarity between the shapes of- the log-probability curves of both the bedload samples from the Mississippi River (U. S.. Waterways Experiment Station, 1939) and samples from fore-set beds of a model delta (Jopling, 1966). Jopling (1966) shows a comparison to a theoretical distribution from a heavy fluid zone using Einstein’s ( ¿950) bedload transport formula. The close agreement suggests that the Recent bedload sample, the grain size distribution from a deposited lamina, and the theoretical distribution from a moving grain layer are all measures of the same fundamental distribution. The distributions shown in
Û.
«
3aV
Phi S ca le
m m . S ca le
F i g 2 —Curves illustrate the similarity between calculated bedload, sediment lamina, and bedload samples.
ÍO 78 G L E N N S. V I S H E R
figure 2 all contain two or three populations and are similar to log-probability plots of fluvial deposits described by Visher (1965a).
There appears to be a similar size distribution in the moving bed layer or traction carpet and in the resulting depositional laminae. This provides the opportunity to reconstruct from the grain size distribution the physical forces producing a lamina. More study of the conditions responsible for the development and characteristics of the traction carpet are needed, but from preliminary data the concentration and velocity of- the traction carpet appears to be directly interpretable. The upper flow regime produces a different shaped log-probability plot than does lower flow regime conditions (Visher, 1965a).
Surface Creep TransportMost grain size distributions show a coarse
grained population with a different mean and degree oí sorting than the other two populations. Certain fluvial deposits,i however, do not
show this population, and the saltation population includes the coarsest material in the distribution. The reason for this is unknown, but probably it is related to removal of part of the coarsest fractions and to the strong shear at the depositional interface in deposits formed bv continuous currents.
; ANALYSIS OF GÄAIN SIZE CURyES
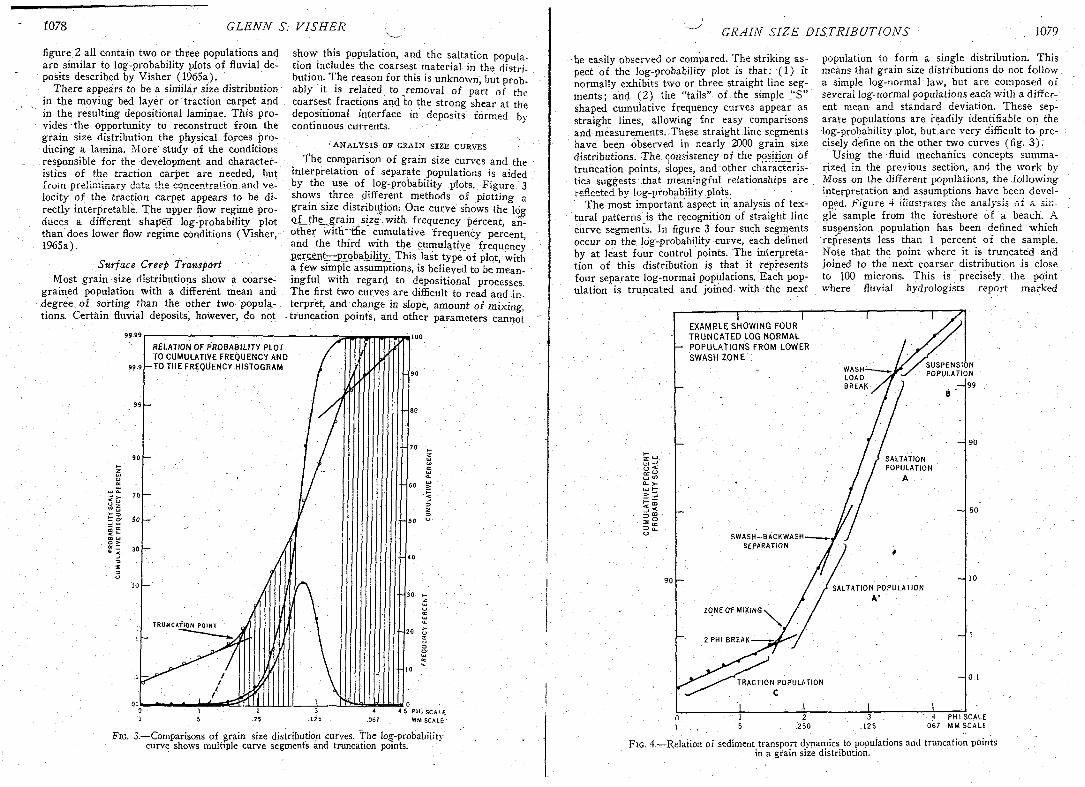
The comparison of grain size curves and the interpretation of separate populations is aided by the use of log-probability plots. Figure- 3 shows three different methods of plotting a grain size distributioti: One curve shows the log SÍ_the_,grain size,with, frequency percent, another with'tfie cumulative frequency percent, and the third with the cumulative frequency percent—probability. This íast type of plot, with ; a few simple assumptions, is believed to be meaningful with regard to depositional processes. The first two curves are difficult to read and -interpret, and change in slope, amount of mixing, truncation points, and other parameters cannot
9 9 .99
RELATION OF PROBABILITY PLOT TO CUMULATIVE FREQUENCY AND
- T O THE FREQUENCY HISTOGRAM
9980
zCJce
i\> 3£• o-» ÏCD Ui O >
£ §
70
T RU N CA TIO N PO IN T
- i — - t in i n ^ i .m u iu o0 1 - 2 3 4 4 5 PHI SCALE1 .5 -25 -125 • .057 MM SCALE
F ig. 3.—Comparisons o f grain size distribution curves. The log-probabilityThe loidistribution curves. i£f-- grain .. ____ _curve shows multiple curve segments and truncation points.
size ' o '
G R A I N S I Z E D I S T R I B U T I O N S 1079
be easily observed or compared. The striking aspect of the log-probability plot is that: ( 1) it normally exhibits two or three straight line segments; and (2) the "tails” of the simple “S” shaped cumulative frequency curves appear as straight lines, allowing for easy comparisons and measurements. :These straight line segments have been observed in nearly 2000 grain size distributions. The consistency of- the position of truncation points, slopes, and other characteristics suggests that meaningful relationships are reflected by log-probability plots.
The most important aspect in analysis of textural patterns is the recognition of straight line curve segments. In figure 3 four such segments occur on the log-probability curve, each defined by at least four control points. The interpretation of this distribution is that it represents four separate log-normal populations. Each population is truncated and joined with the next
population to form a single distribution. This means that grain size distributions do not follow a simple log-normal law, but are composed of several log-normal populations each with a different mean and standard deviation. These separate populations are readily identifiable on the log-probability plot, buFare very difficult to precisely define on the other two curves (fig. 3).
Using the - fluid mechanics concepts summarized in the previous section, and the work by Moss on the different populations, the -following interpretation and assumptions have been developed. Figure 4 iiiustrates the analysis of a single sample from the foreshore of a beach. A suspension population has been defined which represents less than 1 percent of the sample. Note that the point where it is truncated ánd joined to the next coarser distribution is close to 100 microns. This is precisely the point where fluvial hydrologists report marked
EXAMPLE S H O W IN G F O U R T R U N C A T E D LOG N O R M A L P O P U L A T I O N S FRO M LOWER SW ASH Z O N E
V SUSPENSION POPULATION
-^99WASH .LOAD BREAK >
90
z «■**.u i ~i o O uj V) Û. >-.u i h“
SALTATIONPOPULATION
50
SW ASH-BACKW ASHSEPARATION
SALTATION POPULATION
ZONEOF MIXING
2 PHI BREAK
TRACTION POPULATION
4 PHI SCALE .0 6 7 MM SCALE.1255 .250
F ig. 4.—Relation of sediment transport dynamics to populations and truncation points in a grain size distribution.
' 1080 G L E N N S. F I S H E R
changes in the size distribution of the wash load or material transported dominantly in suspension (Lane, 1938).
The grain size distribution curve (fig. 4) shows two very well sorted saltation populations which differ only slightly as to mean-size and sorting. The high degree of sorting of these two populations suggests very , exactingly selected grains that logically would be deposited from the moving grain layer or traction carpet of saltat- ing grains. This particular sample is from the foreshore of a beach where swash, and backwash represent two differing transport condi-. tions and presumably produce two separate saltation populations in opposite flow directions: Such a result emphasizes that small changes in current velocity can modify a single detrital population.
The truncation of the saltation populations occurs near 2 phi, or 250 microns. This break has been attributed by some workers as the junction between the Stokes and Impact Law formulae (Fuller, 1961). This might be interpreted as the size where inertial forces cause rolling or sliding of particles rather than saltation. The coarser straight line segment represents traction load or surface creep.
Inasmuch as the evidence suggests that grain size distributions are in reality mixtures of one or more log-normal “populations,” an analysis of the number, degree of mixing, size range, percentage, and degree of sorting of each population should characterize a grain size distribution. If it is assumed that each transportation processif surface , creep, saltation, and suspension) is reflected in a separate log-normal population within a single grain size distribution, the proportion of each population should be related to the relative importance of the corresponding process in the formation of the whole distribution. In addition, the sorting, size range, degree of mixing, and the points of truncation of these populations can provide insight into provenance, currents, waves, and rates of deposition.
An analysis of more than 1500 samples has shown that these parameters vary in a predictable and systematic manner, and that they have significance in terms of transport and deposition.
CHARACTERISTIC CURVE SHAPES FROM MODERN ENVIRONMENTS
Sampling ProceduresSamples collected from known depositional.
environments were analyzed in light of the considerations outlined above. Sampled areas included a wide range of environments, physical conditions, and provenance areas. The samples were collected to provide factual information on
the association of spL .c sedimentary environments with certain types of grain size distributions. More than 500 samples from modern marine environments were collected to determine whether there was a genetic association of curve shapes with environment or depositional processes. At each sample locality information was obtained on the physical aspects of the depositional environment, including tidal information, wave conditions, provenance, and geomorphology of the depositional site. Special emphasis was placed on sampling many different geographic areas, and presumably differing provenances and physical conditions. In every instance effort was made to collect samples representative of conditions at the time of the sampling. Most samples were from the uppermost bedding unit, and rarely did a sample extend more than a few céntimeters below the depositional interface.
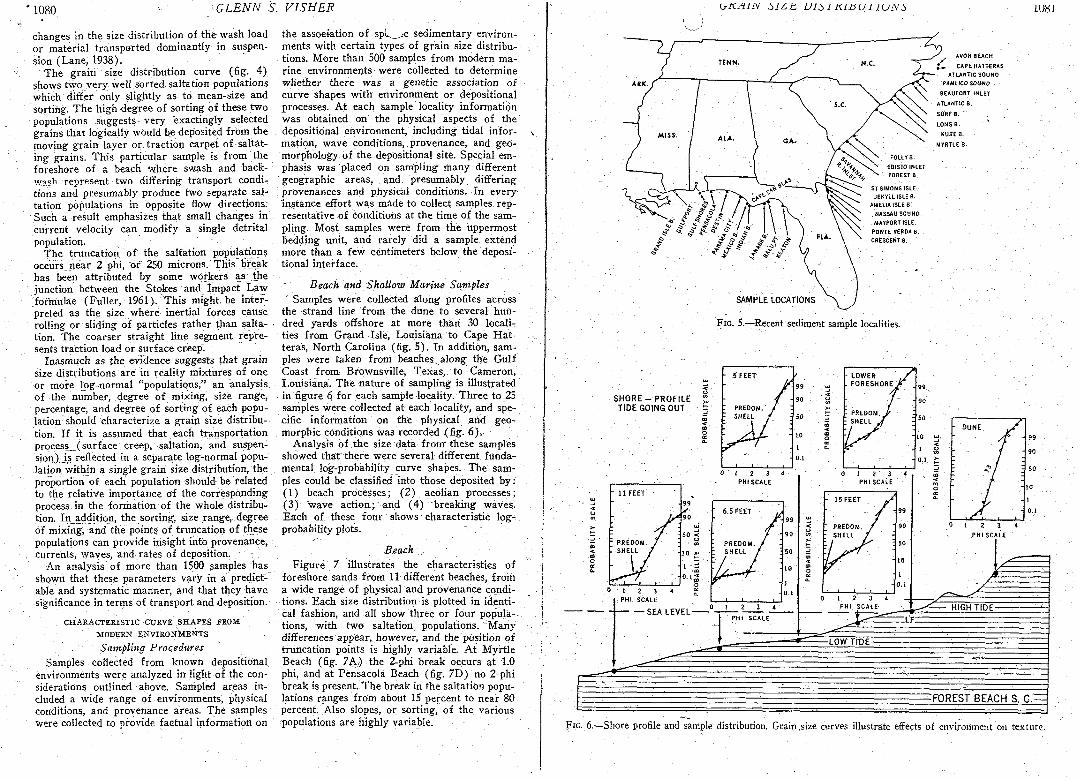
Beach and Shallow Marine SamplesSamples were collected along profiles across
the strand line from the dune to several hundred yards offshore at more than 30 localities from Grand Isle, Louisiana to Cape Hat- teras, North Carolina (fig. 5). In addition, samples were taken from beaches along the Gulf Coast from Brownsville, Texas, to Cameron, Louisiana. The nature of sampling is illustrated
• in figure 6 for each sample locality. Three to 25 samples were collected at each locality, and specific information on the physical and geo- morphic conditions was recorded (fig. 6 ),
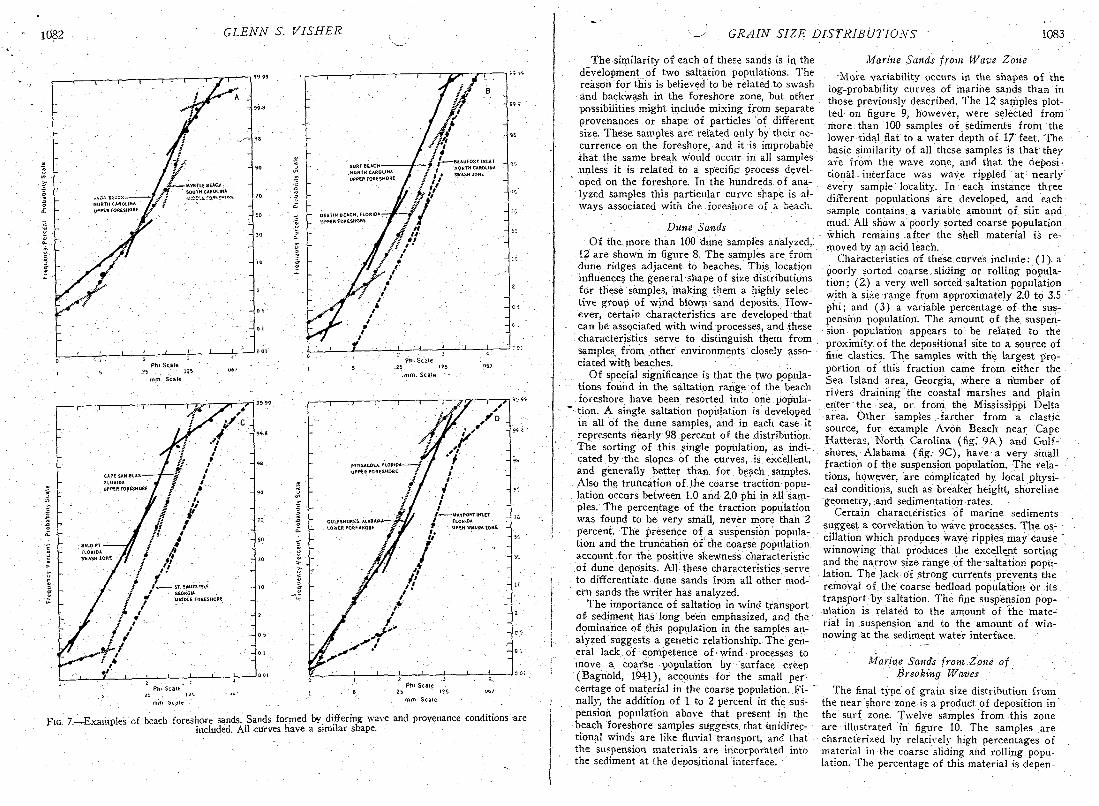
Analysis of the size data from these samples showed tha t there were several different fundamental log-probability curve shapes. The samples could be classified into those deposited by: ( 1) beach processes; (2 ) aeolian processes; (3) 'wave action;, and (4) breaking waves. Each of these four shows characteristic log- probability plots.
Beach .Figure 7 illustrates the characteristics of
foreshore sands from 11 different beaches, from a wide range of physical and provenance conditions. Each size distribution is plotted in identical fashion, and all show three or four populations, with two saltation, populations. ' Many differences appear, however, and the position of truncation points is highly variable. At Myrtle Beach (fig. 7A) the 2-phi break occurs at 1.0 phi, and at Pensacola Beach (fig. 7D) no 2-phi break is present. The break in the saltation populations ranges from about 15 percent to near 80 percent. Also slopes, or sorting, of the various populations are highly variable.
PRO
BA
BIL
ITY
S
CA
LE
{jK/i lM àlZrtL U l S l K1ÖUI 1UNS IU8L
T IN N . N.C.ATLANTIC SOUND
BEAUFORT INLET
5.C.SURF B.
M IS S . ALA.
MAYPORT ISLE.
FLA.
SAMPLE LOCATIONS
F i g . S.—Recent sediment sample localities.
5 FEET - LOWER . FORESHORE
S H O R E - P R O F IL E TIDE GOING OUT PR EDO M .
SH E L L PR E D O M . S H E L L j
50DUNE
50
P H I SC A LE P H I SC A LE
11 FEET15 FEET99
0.16 .5 FEET99
90; PR E D O M . ! SH E L L5 0 ’ P H I SC A LE
P R E D O M .S H E L L
P R E D O M .S H E L L
P H I SC A LEP H I SC A L E HIGH TIDET- SEA LEVEL
P H I SC A LE
•LOW TID E
FOREST BEACH S. G.
F i g . 6 .— Shore profile and sample distribution. Grain .size curves illustrate effects o£ environment on texture.
Fre
quen
cy
Per
cen
t -
Pro
babi
lity
Sc
ale
' ,
"W
»*
"»
1 P
roba
bili
ty
Sca
le1Ö82 G L E N N S. V I S H E R
UPPER FORESHORE
DESTIN REACH, FtORlD*- URPER FORESHORE
P h i S c a le
m m . S c a le
UPPER FORESHORE
P h i S c a le
UPPER FORESHORE
cí
s c a l e
7/
s '
'4
Fig 7 —Exam ples o£ beach foreshore sands. Sands formed by differing wave and provenance conditions areincluded. All curves have a similar shape.
G R A I N S I Z E D I S T R I B U T I O N S 1083
The similarity of each of these sands is in the development of two saltation populations. The reàsüïTfor this is believed to be related to swash ánd backwash in the foreshore zone, but other possibilities might include mixing from separate provenances or shape of particles 'of different size. These samples are related only by their Occurrence on the foreshore, and it is improbable that the same break would occur in all samples unless it is related to a specific process developed on the foreshore. In the hundreds of analyzed samples this particular curve shape is always associated with the foreshore of a beach.
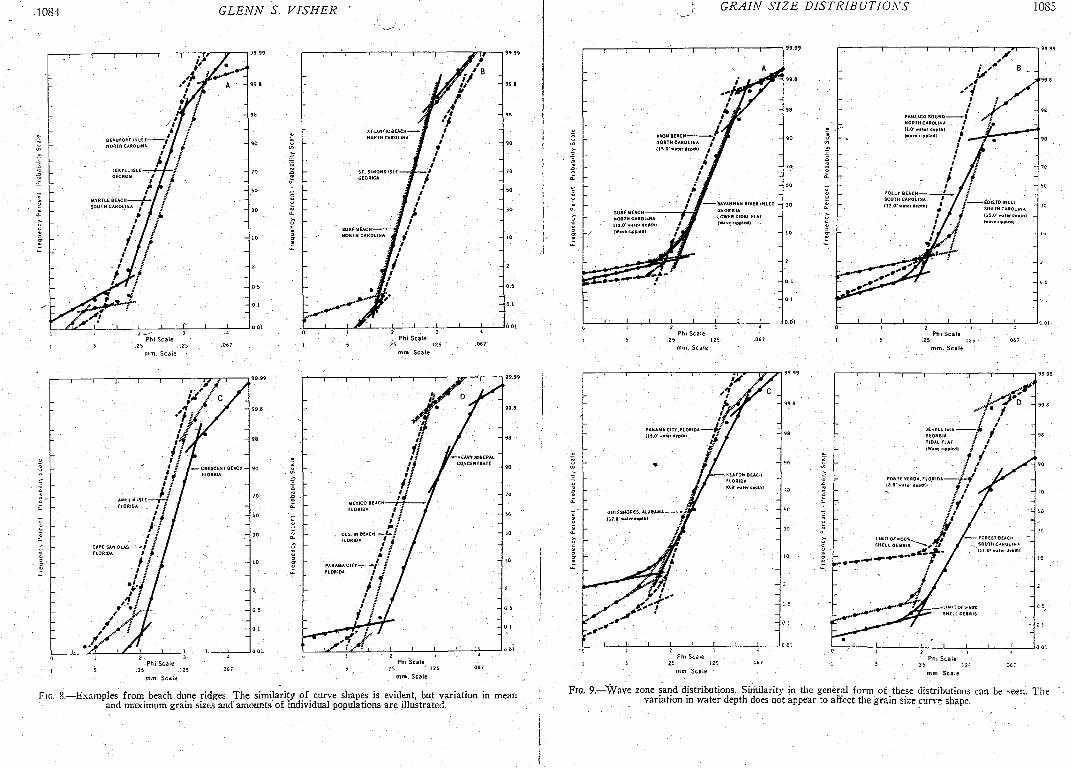
Dune SandsOf the more than 100 dune samples analyzed,.
12 are shown in figure 8. The samples are from dune ridges adjacent to beaches. This location influences the general shape of size distributions for these samples, making them a highly selective group of wind blown sand deposits. However, certain characteristics are developed that can be- associated with wind processes, and these characteristics serve to distinguish them from samples_ from other environments closely associated with beaches.
Of special significance is that the two populations found in the saltation range of the beach foreshore have been resorted into one popula-
■ tion. A single saltation population is developed in all of the dune samples, and in each case it represents nearly 98 percent of the distribution; The sorting of this single population, as indicated by the slopes of the curves, is excellent, and generally better than for beach samples. Also the truncation of ..the coarse traction population occurs between 1.0 and 2,0 phi in alt samples. The percentage of the traction population was found to he very small, never more than 2 percent. The presence of a suspension population and the truncation of the coarse population account for the positive skewness characteristic of dune deposits. All these characteristics serve to differentiate dune sands from all other modern sands the writer has analyzed.
The importance of saltation , in wind transport of sediment has long been emphasized, and the dominance of this population in the samples analyzed suggests a genetic relationship. The general lack of competence of wind processes to move a coarse population by surface creep (Bagnold, 1941), accounts for the small percentage of material in the coarse population. Finally, the addition of 1 to 2 percent in' the suspension population above that present in the beach foreshore samples suggests, that unidirectional winds are like fluvial transport, and that the suspension materials are incorporated into the sediment at the depositional interface.
Marine Sands from Wave ZoneMore variability occurs in the shapes of the
log-probability curves of marine sands than in those previously described. The 12 samples plotted on figure 9, however, were selected from more than 100 samples of sediments from the lower tidal .flat to a water depth of 17 feet. The basic similarity of all these samples is that they are from the wave zone, and that the depositional-interface was wave rippled at nearly every sample locality. In each instance three different populations are developed, and each sample, contains, a variable amount of silt and mud. All show a poorly sorted coarse population which remains after the shell material is removed by an acid leach.
Characteristics of these curves include : ( 1 )- a poorly sorted coarse, sliding or rolling population; (2 ) a very well sorted saltation population with a size range from approximately 2.0 to 3.5 phi,; and (3) a variable percentage of the suspension population. The amount of the suspension population appears to be related to the proximity of the depositional site to a source of fine elastics. The samples with the largest proportion of this fraction came from either the Sea Island area, Georgia, where a dumber of rivers draining the coastal marshes and plain enter the sea, or from the Mississippi Delta area. Other samples.. farther from a clastic source, for example Avon Beach near Cape Hatteras, North Carolina (fig.' 9A) and Gulf- shores, Alabama (fig.- 9C), have a very small fraction of the suspension population. The relations, however, are complicated by local physical conditions, such as breaker height, shoreline geometry, and sedimentation rates.
Certain characteristics of marine sediments ■suggest a correlation to wave processes. The oscillation which produces wave ripples may cause ’ winnowing that produces the excellent sorting and the narrow size range of the saltation population. The lack of strong currents prevents the removal of the coarse bedload population or i ts . transport by saltation. The fine suspension population is related to the amount of the material in suspension and to the amount of winnowing at the sediment water interface.
Marine Sands from.Zone of Breaking Waves
' The final type of grain size distribution from the near shore zone is a product of deposition in the surf zone. Twelve samples from this zone are illustrated in figure 10. The samples are characterized by relatively high percentages of material in the coarse sliding and rolling population.. The percentage of this material is depen-
tequ
ency
P
erce
nt
Pro
babi
lity
Sc
ale
> F
lequ
ency
P
erce
nt
1’iob
abil
ity
S:a
le
.1084 G L E N N S. V I S H E R
t/>-
0.01
. P h i S c a le.0675 .25
m m . S c a le m m . S c a le
i f
P h i S c a le
Vf
-P h i S c a le5 .25 .125
m m S c a le m m . S c a le
F io. 8 .—Examples from beach dune ridges. The similarity o f curve shapes is evident, but variation in mean and maximum grain sizes and amounts of individual populations are illustrated.
Fre
quen
cy
Per
cen
t P
roba
bili
ty
Scal
e >
F re
ou
en
cy
Per
cen
t P
roba
bili
ty
Sca
le
G R A I N S I Z E D I S T R I B U T I O N S 1085
P h i S c a le
4>Cl
5 .25m m . S c a le m m . S c a le
t / t
- ■ s & t
P h i S c a le
"»•" S c a le m m S c a le
F ig. 9.—W ave zone sand distributions. Similarity in the general form of these distributions can be seen. The variation in w ater depth does not appear to affect the grain size curve shape.
Fre
quen
cy
Per
cen
t -
Pro
babi
lity
Sc
ale
‘ fr
equ
ency
P
erce
nt-
.Pro
bab
ilit
y
Sca
le1086 G L E N N S. V I S H E R
P h i S c a le
m m . S c a le . m m . S c a le
-DESTIN BEACH, FLORIDA
Ph i S c a le
'K
P h i S c a le1 .5 .25 .125 .067 | .5 25 125 .067
m m . S c a le m m . S c a l e -
F i g . 10.—Examples o f sands from the surf zone. All samples show a high concèntration o f the coarser population. Comparison with beach sands (fig. 7) indicates the coarser population is more poorly sorted.
G R A I N S I Z E D I S T R I B U T I O N S 1087
dent upon the source area and wave conditions, but ranges from several percent to 80 percent of the grain size distribution. The saltation population is added to this coarse material, but mixing occurs between the two populations. The fine end of the saltation population is truncated, and little suspension population is present.
These characteristics appear to be consistent with the processes of waves interacting with' strong currents. Breaking waves keep the depositional interface agitated, and suspension material is winnowed out and transported seaward
. by currents. The traction carpet is of an intermittent nature, depending on the position of the breaker and on the direction and magnitude of the currents. These combine to allow mixing between the saltation and the sliding or rolling populations.
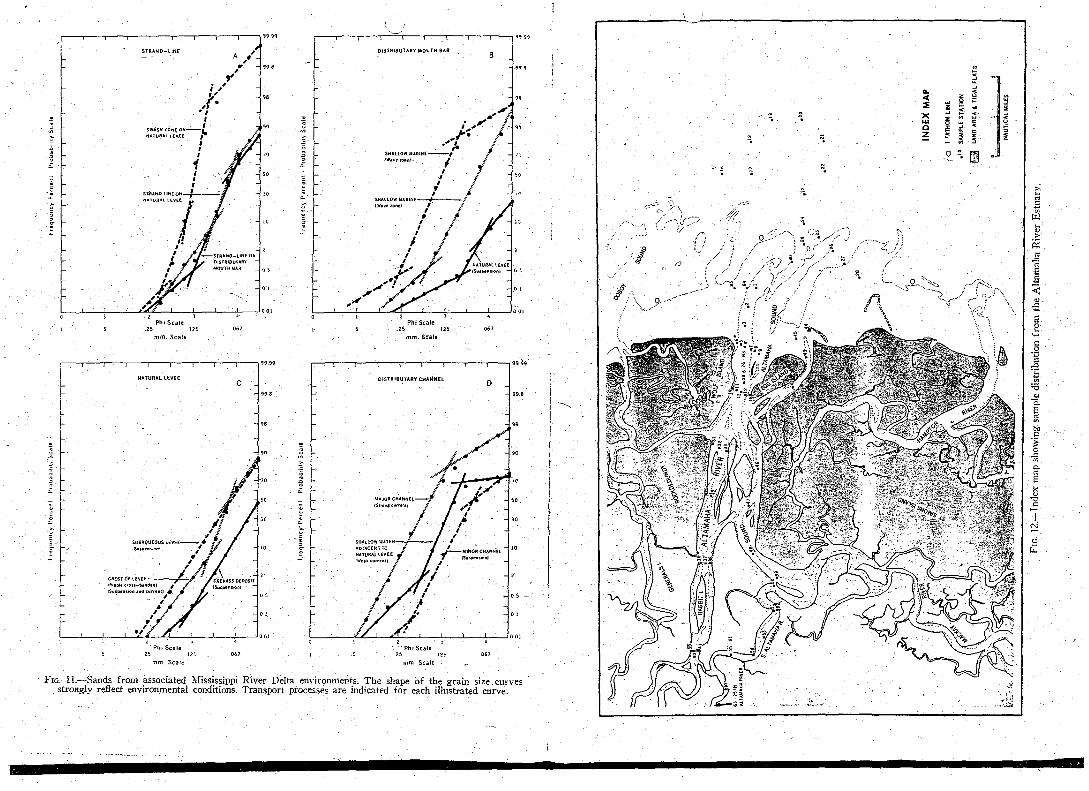
Mississippi Delta Samples Nature of samples.—A group of 30 samples was taken from a series of short 2—3 ft cores collected by James.. Coleman and Sherwood Gagli- ano of the Coastal Studies Institute of Louisiana State University. These cores were taken in the area of the Southeast Pass of the Mississippi River for the study of sedimentary structures. The sampling and textural analysis were performed by the writer to determine the relationship of specific structures and environments to the shapes of log-probability curves.
Environments sampled and nature of size distri- ■ butions.—The size distributions for this group
of samples appear to be fundamentally different from those described for the beach and nearshore environments, but some similarities exist. Three examples from each of four environments are illustrated in figure 11. .These include: (1) strand-line deposits (fig. 11A) ; (2) distributary mouth bar (fig, 11B) ; (3) natural levee (fig. 11C) ; and (4) channel deposits (fig. 110).
Distributary mouth bar samples are similar to the shallow marine sands previously described, but they contain an appreciable amount of the suspension population (fig: 11B). These samples are from shallow water (less than 6 ft), but. wave energy is not sufficient to remove the suspension population. The amount of this fraction is likely to be related to the high load of suspension material in transport in the waters of the Mississippi River.
The deposits, from the natural levee (fig. 11C) along the distributary are different from those developed in other environments. The curves show a single population, with a size range and sorting characteristic, of suspension transported detritus. Natural levee deposits are
formed by the rapid fallout of suspension material along the flanks of the distributary. This is a product of rapid change in current velocity at the channel margin, and may account for the single population. Similar distributions were recognized by Kiovan (1966) in the area of rapid sediment fallout in the Barataría Bay area, Louisiana.
Strand line deposits (fig. 11A) show the dual saltation populations characteristic of foreshore beach deposits. The maior difference lies in the presence of a .considerable silt and mud suspension population. This is to be expected close to the mouth of the Mississippi River with its high suspension load, and also because of the minimum wave energy developed along strand lines associated with the delta:.
The distributary channel deposits show two major populations, one related to suspension and the other to saltation (fig. 1 ID). The saltation population has a size range of nearly 2 phi, and it is truncated at 3.0 phi in one sample and near 3.7S phi in the other. The percentage of the suspension population ranges from SO to 80 percent. These two samples possibly reflect differing current velocities.
Altamaha River Estuary Samples Nature of samples.—A series of 86 samples of the bottom sediment was collected from the AÍ- talnaha River Estuary. The distribution of sample stations is shown in figure 12. At most localities current, wave, tidal, depth, salinity, and turbidity measurements were taken at the time of sampling. The environments sampled included: ( 1). marine tidal delta; (2 ) shoal area seaward of inlet; (3) wave-current zone; (4) tidal inlet; (5) low energy tidal channel and tidal river; and (6 ) major tidal channel above the zone of the salt wedge. In adddition to these environments two sample stations (nos. 10 and 55) were occupied over a 12-hour tidal cycle, with sampling carried out at 2-hour intervals. These 12-hour sample stations provided a measure* of the response to high and low velocity conditions. In most instances the sample was from the upper few centimeters of the bed : consequently i t .represented the physical conditions for a short period of time prior to sampling. In areas of strong velocity changes over short periods of time, the sample represented an average of the prior transport conditions. This is a characteristic aspect of each environment, and the individual samples develop characteristic size distributions.
Characteristic size distributions.—Selected size distributions shown in figures 13 and 14 illustrate different shaped logr-probabilitv curves.
.067.5 125IS c a le
I
S c a le
Ii
I5
%I
P h i S c a le; 5 21 12'. 067 1 .5
m m S c a le m m S c a le
F i g . 11.—Sands from associated Mississippi RiVér Delta environments. T he shape o f the grain size, cu: . strongly reflect environmental conditions. Transport processes are indicated for each illustrated curve.
P h i S c a le06725
size curves
Fig
. 12.
—In
dex
map
show
ing,
sam
ple
1090 G L E N N S. V I S H E R
The offshore marine sands in the area of the tidal delta at depths of 10 to 40 ft show the characteristic- shape described for the shallow' marine samples associated with beach deposits. The three examples illustrated in figure 13A are from different depths and positions within the tidal delta. They all show the well sorted saltation 'population developed within a very narrow size range. The break between saltation and Suspension populations was in the very fine sand rangé, usually near 3.5 phi. The break between the bedload population and the saltation population was also fine, generally near 2.5 phi. These characteristics are thought to be typical of deposition by oscillation waves. The variation in shape of the curves appears to be related to position on the delta and to proximity to the source of clastic detritus. Close do the Channel the traction population is more abundant, and there is less of the suspension population. This, appears to be related to stronger; currents and shoaling action of the waves.
The shoal .areas shoreward of the tidal delta (fig. 13B) reflect the action of breaking waves: They contain a well developed saltation population, truncated at the fine end. Also a large bedload population joins the saltation- population between 2.0 and 2.25 phi. These characteristics are similar to those samples from the beach plunge zone (fig. 10), but the percentage Of bedload is much greater. The three samples illustrated are from shallow water areas close to breakers marginal to the channel which extends’ across the tidal delta. This environment is similar physically to the plunge zone adjacent to beaches, and a similar log-probability curve shape is reflected.
The zone of interaction of waves and tidal currents (fig. 13C) produces a different shaped distribution curve. Each of the three curves illustrated contains three populations (fig. 13Ç). The saltation population is truncated on the fine end and has a restricted size range. The coarse end is truncated between 2.5 and 3.5 phi, which is relatively fine when compared to other types of size .distributions. The coarse truncation point is from ,1.0 phi to nearly 2.0 phi. The saltation population is poorly sorted and has a broad; size range. Its size range and sorting is .unique when compared to any other distribution. .The third population, truncated on the coarse end, shows good sorting and extends over a wide size range.
The mechanism for the formation of this size distribution is unknown, but the fine saltation population suggests winnowing by wave action. The poorly sorted intermediate population suggests dumping from a highly turbulent graded suspension-traction carpet, and the coarse popu
lation suggests bedload transport by a strong current. These conditions would be the result of the interaction of a strong bottom current with surface waves within a tidal channel. Supporting this interpretation, the sample localities where these distributions were developed were at the margin between the tidal channel and the shoal area.
Samples from the tidal inlet (fig. 13D) were characterized by three well developed and moderately well sorted populations. The- suspension population comprised from 2 to 5 percent of the distribution and ranged from near 2.0 phi to 4.Ù phi. The saltation population was well sorted and occurred over a very narrow size range from 1.5 phi to 2.0-2.5 phi. The bedload or surface creep population was also well sorted and represented from 30 to 70 percent of the distribution. These two populations join with little mixing at aboiit 1.5 phi, and; are truncated on the coarse end near —1-0 phi. -
Strong turbulent currents generated by discharge into the ocean combine to'produce a suspension population, a coarse truncation, point between saltation and suspension, and a large bedload fraction. The sorting of the bedload population was directly related to the position in the channel inlet and the velocity of the bottom current. The sample from station number 10 (fig. 13D) shows only one population, possibly indicating that the coarse bedload population is transported by saltation when current velocity is high. This is supported by data from the 12- hour sample station at the inlet mouth, which indicates that during low-flow conditions three distinct populations are developed, and that after periods of high flow the grain size distribution approaches a single population (fig. 14A).- Grain size distributions upstream -from the
salt wedge (fig. 14B) are similar to those found in the inlet area. They generally contain les^ of the suspension population, typically from 0 to less than 2 percent. The 12-hour tidal station exhibits the same relationship between population discrimination and periods of maximum
-flow velocity (fig. 14C). The percentages of the other populations are similar, and the sorting and points of truncation between populations are nearly identical. This suggests that the tidal action and currents are important in producing these log-probability curve shapes, and that physical processes associated with the inlet, or the salt wedge, are not as important.
-The final group of distributions is from areas in the Altamaha River where current velocity is lower because of a reduced tidal range or a location in one of, the less important tidal channels (fig. 1 4 D ). Two types may be recognized:
G R A I N S I Z E D I S T R I B U T I O N S 1091
OffSMOM BAU - *21 —— (32.0* wtMrdvpUil fI O lí koon bottom cunoni) /
(.175 knot* bottom entrent)a .
U37S knys bottom cwreatl
m m . S c a le
ooiP h i S c a le
P h i S c a le
from inlet and marine delta areas. Sample numbers indicate position on in- shown illustrate effects of varying processes.. W ater depths and current
F ig. 13.—Examples o f curves dex map (fig. 12). The.variations. _ . velocities at the time of sampling are indicated.
Fre
quen
cy
'Per
cen
t •
Prob
abil
ity
Scal
e '
D ,
r> .
.
1 F
requ
ency
P
erce
nt
• P
roba
bili
ty
Sea
l
1092 G L E N N S. V I S H E R
P h i S c a le.5 .25 .067
SOUTH CHANNEL - »48
SOUTH CHANNEL .- * 4 9
P h i S c a le5 .25 125 .067
BOTTOM VELÓCITY
P h i S c a le5 .25 .125 .067
t t
.5 125 067
Fig. 14.—Samples from the A ltam aha River Estuary and River Also selerferl sa m n lp c i™ t, n n iT ide information is ploffedto illu strée effects’ on g r a b s L T c u ^ T a p e h0Ur
G R A I N S I Z E D I S T R I B U T I O N S 1093
( 1) distributions similar in shape to those described for the main channel; and (2 ) distributions with three well defined populations. This latter type is characterized by a highly variable percentage of the suspension population (from less than 1 to more than 10 percent), and by truncation with the saltation population between 2.5 and 3.5 phi. The saltation population of this type extends over a range from 1.25 to 2.0 phi, is more poorly sorted, and the truncation with the traction population, if present, occurs between 1.0 and 1.5 phi. The amount of the surface Creep fraction ranges from 2 to 25 percent- The difference between these two types of distributions appears to be related to position within .the channel, with the second type found in shallower water of a lower current velocity.
The difference between these two types of distributions suggests that current velocity is the controlling factor both for the position of the break between saltation and suspension and for the slope of the saltation population. The maintaining of a bedload or surface creep population appears to be related to the tidal action rather than to current conditions. This population is thought to be concentrated in the estuary by the alternating direction of the bottom current and may be an important textural criterion indicating tidal action. . .
i S
m m S c a le
F ig. )5.--Selected examples of modern channel sands.and slopes of indivl
Modern Fluvial SamplesFluvial samples, illustrated in figure 15, show
a distinctive pattern. They are characterized by :(1 ) a w ell developed S uspension p o p u la tio n
. co m prising up to 20 p e rc e n t of th e d is tr ib u tio n ;(2 ) the truncation between suspension and saltation occurring between 2.75 and 3.5 phi; (3) the size ranging from 1.75 to 2.5 phi in the saltation population; and (4) the saltation population having a slope or sorting intermediate between deposits' formed by waves or reversing currents and those formed by suspension. The slope of the saltation population is in the 60 to 65 degree range, as compared to the high 60’s or 70’s for wave deposited distributions or the 50’s for suspension deposits. The bedload or surface creep population, if present, would be coarser than 1.0 phi. This is strongly provenance controlled, and is developed most frequently in the deepest portion of the channel. Because of variations in chánnel patterns and the ' size of materials in transport, an inclusive statement concerning the shape of fluvial grain size distributions cannot be made.
The characteristics described above are partially developed in some of the samples described from the .Altamaha River Estuary (fig. 14D) and the Mississippi River channel sands (fig. 11D). A gradation between deltaic and flu-
P h i S c a le25 125 0 6 /
m m . S c a ie
These curves illustrate variation in truncation points ' populations.
1094 G L E N N S. V I S H E R
vial - grain size curve shapes is indicated that might make it possible to place individual samples within the fluvial, upper deltaic plain, or lower deltaic plain environmental regimes.
RELATION OF MODERN..DÍSTRIBUTIONS TO A N C IEN T SEDIMENTS
Possible Differences in Curve Shapes The primary purpose of the study of modern
sediments was to obtain information from known environments to aid in classifying distributions from ancient sediments. Nearly 1000 distributions from ancient rocks have been obtained, and a number of specific patterns can be recognized. Specific shaped curves also were correlated with environments determined from other physical and paleontologie criteria, but textural data from modern sediments provided the basis for environmental comparisons.
The major difference observed between ancient and modern grain size distributions is in the amount of fines less than 44 microns that occurs in the ancient samples. The reason for this is probably multiple ( 1 ) related to diage- netic addition of clays, ( 2) post-depositional mixing, (3) sediment settling downward through the pores, and (4) possible transport by moving interstitial fluids. Each of these processes is described in the literature, but little information has been published evaluating the relative importance of each process. When grain, size distributions of ancient sediments are interpreted, the possibility of these processes modifying the curve shape must be recognized.
Other changes might be related to solution and precipitation of fine clastic particles and to enlargement of grains by precipitation of materials on larger grains. In the size range from 1 mm to 44 microns such processes probably are not quantitatively important for most sedimentary rocks, but in deeply buried or strongly deformed elastics the possible effects cannot be ig-
• nored.The mechanical disaggregation of • consoli
dated rocks alters the grain size distributions to some degree, but can be minimized if care is taken. Still, little hope can be held out for obtaining, the original size distribution of materials in the clay or fine silt size range. Problems of flocculation, dispersion, crushing, recrystalli-. zation, and cleavage appear to be insurmountable. Consequently, size analyses have not been carried finer than 44 microns.
• Similarities in Curve Shapes The consistency of curve shapes from sample
to sample produced by similar processes and that between ancient and modern analogues are noteworthy. A comparison of curve shapes be
tween ancient and modern examples shows these similarities. Comparisons show the applicability of log-probability curves in the interpretation of depositional processes and environments.
Variations in the slopes or sorting of individual populations, positions of truncation points, and amounts of various populations are developed. This is to be expected since similar variations occur within modern environments, but the general curve shapes provide sufficient character to recognize specific processes and environments.
Curve Shapes With No Modern AnalogueA number of curve shapes from ancient rocks
do not have a close analogue in the'modern-sediments included in this study. All modern environments have not been thoroughly sampled, and these curve shapes may be found when more extensive sampling can be accomplished. In a number of instances the environmental information from ancient sediments is sufficient to draw conclusions as to the origin of a particular size distribution. In these instances interpretations are suggested.
PATTERNS FROM A NCIENT ROCKS
Fluvial DepositsLog-probability curve shapes developed in an
cient fluvial sands are similar to those described for modern environments. Similar saltation and suspension populations are developed with a truncation point between 2.75 to 3.5 phi. The suspension population ranges from 2 to 30 percent, with the sliding or rolling population generally absent. These characteristics are shown in examples of fluvial sands selected from more than 300 samples (fig. 16).
Samples from Missourian Series of Oklahoma. —Characteristic size curves are shown in figure 16A illustrating the major types of fluvial sands classified by a factor analysis study of more than 200 samples (Visher, 1965a). These samples range from the base of a channel to the uppermost ripple cross-bedded unit. Sample varia-
• bility is small compared to the range of curve shapes described from modern environments, but some variability exists in the position of the - saltation-suspension truncation point and in the - slope of the saltation population. These measures..probably are related to sedimentary structures and to the position within the channel. Grain size distributions of sands with small scale cross-beds, found in the upper part of the channel, showed a finer truncation point than the current-laminated or festoon cross-bedded units; also, the saltation population was more
freq
uenc
y P
erce
nt
• P
rob
abili
ty
Sca
lefr
eq
ue
ncy
P
erce
nt
• P
roba
bilit
y S
cale
'g r a i n s i z e d i s t r i b u t i o n s 1095
FLUVIAL SANDS MISSOURIAN A6E, OKLAHOMA
Phi Scale5 .251
Phi Scale
m m . S c a le m m S c a le
/ƒa .
■ m n v r u i w w " »• ROCK SPRINGS UPLIFT ƒ
P h i S c a le5
a?iP h i S c a le5 .25 - m m .,S c a le
m m S c a le
FIC. 16. Examples from a wide v a r i e t y ^ ^ f l u v i a l ^ n e s . These sandstones show very shmlar
u-miiyiv o. y u n c u
poorly sorted. These factors suggest that current velocity and depth control the saltation-suspension truncation point as'well as the slope of the saltation population.
The sliding or rolling population was not commonly developed in these size distributions. The only samples that showed this population were ripple cross-beds at the very top of the fluvial sequence (not illustrated). The absence of a traction population appears to be characteristic of many fluvial sand deposits.
Mid-Continent Pennsylvanian channel sands.— Sandstones from Mississippian and Pennsylvanian channel deposits were analyzed, and repre-' sentative examples from the. Arkoma basin, the Illinois basin, and the Oklahoma shelf are illustrated in figures 16B and 16C. The sandstones from the Illinois basin (fig. 16B) are described by Potter (1963), who provides detailed de-
• scriptions of the channel sequences and geometries. The sands from the Oklasotna shelf (figs. 16B'and C) are.described,by Saitta (1968) and are from the alluvial plain of the Bluejacket- Bartlesville delta. The A.rkoma basin samples (fig. 16B) are from a large channel in the Atoka Formation near . Ozark, Arkansas, described hy Hendricks (1950).
All examples show the same characteristic saltation and suspension populations. Differences between these sands and modern examples are slight, supporting a fluvial origin.
Cretaceous fluvial sands—Rock Springs Area, IVyoming.—The sands illustrated (fig. 16D) are from channels in the Almond and Lance For-:
.mations. The channel origin of these sands is based on the work by Weimer (1965). The shapes of the log-probability plots are nearly identical to those described from other fluvial deposits, thus supporting Weime'r’s interprétation. '. '
Deltaic Distributary Sands Bluejacket-Bartlesville.—Sandstones from the Pennsylvanian Bluejacket-Bartlesville delta of the Oklahoma shelf (fig. I7A) are described by Saitta (1968) and are similar to those developed in the north-channel of the Altamaha River Estuary, (fig, ,14D). Three populations are present, with the poorly sorted surface creep population ranging from 15 to 35 percent of the distribution, The moderately'well sorted saltation population ranges from about 2.0 to 3.0 phi. The suspension population is poorly sorted, with nearly 10 percent of the distribution less than 44 microns in size.
The 'same characteristics are shown by the ' sands from the modern Altamaha tidal channel
(fig. 13), in d i t in g that physical conditions may have been similar arid that low current velocity and high suspended load also characterized the Bluejacket-Bartlesville delta. In addition, the high concentration and poor sorting of the surface creep population in these Pennsylvanian sandstones suggest dumping of the coarse fraction, possibly as a result of a large tidal range similar to that of the Altahama Estuary.
Cretaceous deltaic sands.-—Samples from the Almond and Lance Formations show a different shaped log-probability curve shape (figs. 17B
^and C). These sands have been described by Weime'r (1965) and are interpreted by him as being of deltaic origin. The curves show a small moderately well sorted surface creep population (figs. 17B-C). The saltation population ranges from about 2.5 to 3.5 phi with moderate sorting (slope from 60 to 68 degrees). Some of these curves are similar to the fluvial curves, except that they contain a surface creep population. These curves are interbedded with fluvial type curves and another type not seen in modern sediments sampled for this study. The log-probability curves without a modern analogue have a well sorted saltation population (usually with a slope above 70 degrees) and a poorly sorted suspension population (fig. 17Ç). The point of junction of the two populations usually occurs between 2.0 and 2.75 phi. '
These curves are thought fo be produced by (strong tidal currents-in an area where the surface creep population has been removed, possibly in shallow water or on bars in the tidal channel. The close association of three types of curves—(I) fluvial type, (2 ) fluvial with a surface creep population, and (3) truncated and winnowed saltation population with a large suspension population—suggests a genetic association and possibly reflects a distributary with only a small tidal range. This would account for the absence of a large surface creep population and for the close association with fluvial type distributions.
Atoka deltaic sands.—The log probability plots are of outcrop samples collected during outcrop studies by the writer (Visher, 1965b). The environmental interpretation is based on sedimentary structures and vertical sequences. Similar shaped curves are developed as were described for the Cretaceous sands of the Rock Springs area (fig. 17D), and a similar origin is suggested.
Log probability plots—deltaic sands.—These examples illustrate the types of distributions developed. Additional textural studies from mod-
Fre
quen
cy
Per
cen
t •
Pro
babi
lity
S
cale
G R A I N S I Z E D I S T R I B U T I O N S . 1097
CORE SAMPLES - BLUEJACKET-BARTLESVILLE SANDSTONE
P h i S c a le ,1 .5
ALMOND FORMATION - NORTH OF SUPERIOR. WYOMING
WHITE SANOSrONE-0.
P h i S c a le
UPPER CRETACEOUS SANDS - ROCK SPRINGS UPLIFT
P h i S c a lest 25 067
A TOKA FORMATION. ARKOMA BASIN. ARKANSAS
8LUFF OF filVÍR
P h i S c a le5 067
F ig. 17. Deltaic distributary sandstone curve shapes. These examples show a wide variation in curve shaoe ■and possibly reflect strongly contrasting delta types and positions within the, delta complex.
P h i S c a le
m m . S c a ie
ALMOND FORMATION NORTH OF SUPERIOR 47% CARBONATE
NORTH OF SUPERTOR **
Ph i S c a le
PENNSYLVANIAN SANDSTONES - NORTHEASTERN. OKLAHOMA
1 C
WANN FORMATION
P h i S c a le
Scale
i —:— i------ r~ —r~ATOKA FORMATION, ARKOMA BASIN. ARKANSAS
} MILE SOOTH- MOUNTAINBURG U.S ROUTE 71
GREERS FERRY DAM
Phi Scale
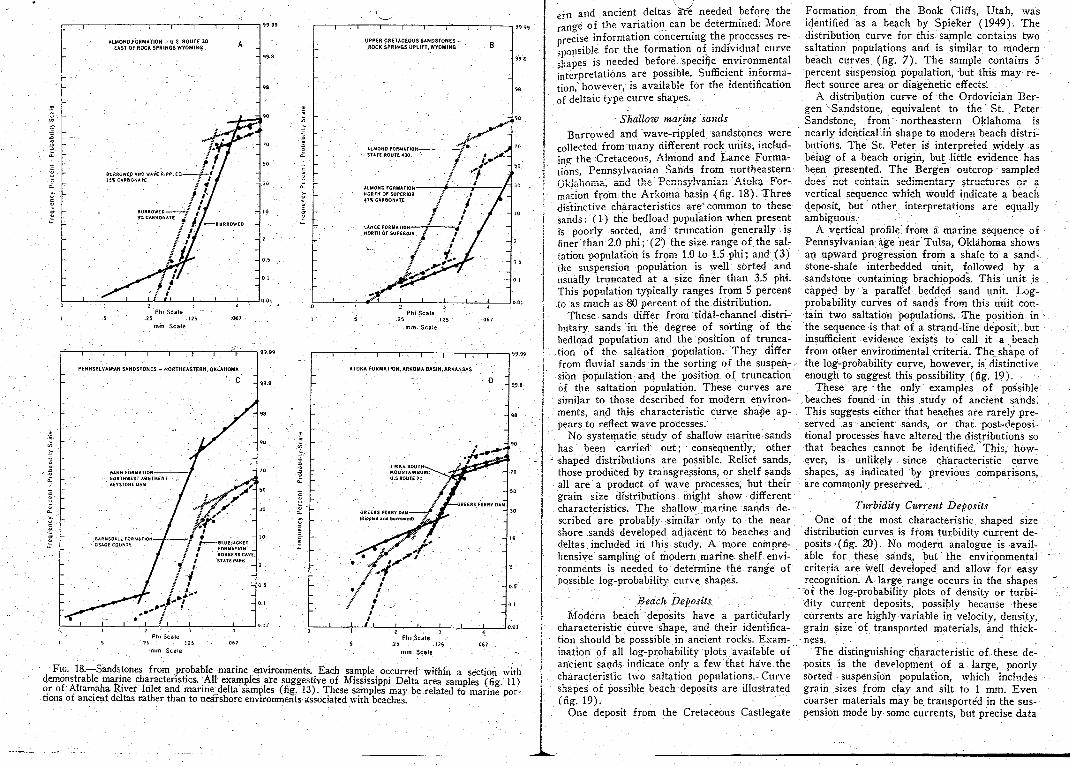
F i g . 18.—Sandstones from probable m arine environments. Each sample occurred within a section with demonstrable marine characteristics. All examples are suggestive of Mississippi Delta area samples (fig 11) o r o f'A ltam aha River Inlet and m arine delta samples (fig. 13). These samples may be related to marine portions ol ancient deltas rather than to nearshore environments associated with beaches.
ern and ancient deltas ife needed before the range of the variation can be determined. More precise information concerning the processes responsible for the formation of individual curve shapes is needed before specific environmental interpretations are possible. Sufficient information," however^ is available for the identification of deltaic type curve shapes.
Shallow marine sands Burrowed and wave-rippled sandstones were
collected from many different rock units, including the Cretaceous, Almond and Lance Formations, Pennsylvanian Sands from northeastern
~ . 4 4-V* a a r t +-> o r r l a r ' i n ’ p n A i r t l r oa .n < a u i v *. w u i J ) i i c n i i a * i * — v .
mation from the Arkoma basin (fig. 18). Three distinctive characteristics are* common to these
I sands : ( 1) the bedload population when present is poorly sorted, and truncation generally is finer than 2.0 phi; (2 ) the size range of the saltation population is from 1.0 to 1.5.phi; and (3) the suspension population is well sorted and usually truncated at a size finer than 3.5 phi. This population typically ranges from 5 percent to as much as 80 percent of the distribution.
These sands differ from tidal-channel distributary sands in the degree of sorting of the bedload population and the position of truncation of the saltation population. They differ from fluvial sands in the sorting of the suspensión population and the position of truncation of the saltation population. These curves are similar to those described for modern environments, and this characteristic curve shape appears to reflect wave processes.
No systematic study of shallow marine sands has been carried" out ; ' consequently, other
• shaped distributions are possible. Relict sands, those produced by transgressions, or shelf sands all are a product of wave processes, but their
grain size distributions might show different characteristics. The shallow marine sands described are probably -similar only to the near shore sands developed adjacent to beaches and deltas. included in this study. A more compre- hensivé sampling of modern marine-shelf environments is needed to determine the range of possible log-probability curve shapes.
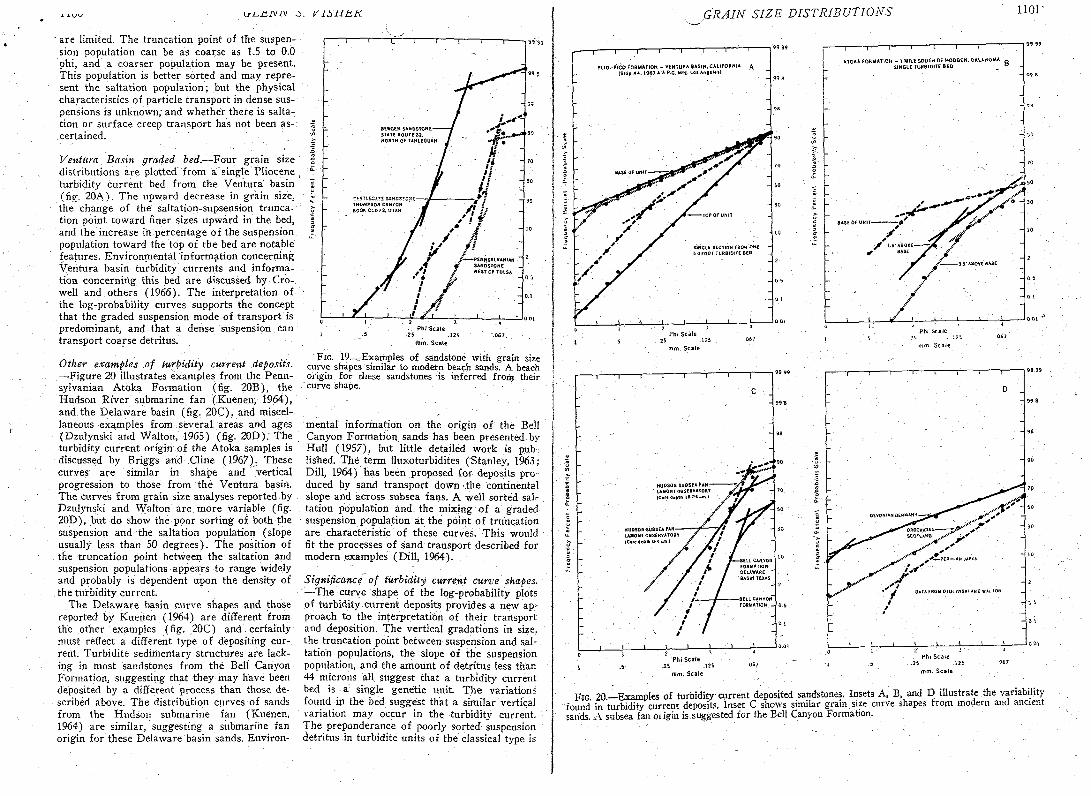
Beach Deposits Modern beäch deposits have a particularly
i characteristic curve shape, and their identifica-i tion should be posssible in ancient rocks. Exam-j ¡nation of all log-probability plots available ofj ancient sands indicate only a few that have the
characteristic two saltation populations.- Curveshapes of possible beach deposits are illustrated (fig. 19). .
One deposit from the Cretaceous Castlegate
Formation from the Book Cliffs, Utah, was identified as a beach by Spieker (1949). The distribution curve for this sample contains tyvo saltation populations and is similar to modern beach curves (fig. 7). The sample contains 5 percent suspension population, but this may reflect source area or diagenetic effects.
A distribution curve of the Ordovician Bergen ^Sandstone, equivalent to the St. Peter Sandstone, from northeastern Oklahoma is nearly identical iii shape to modern beach distributions. The St. Peter is interpreted widely as being of a beach origin, but little evidence has been presented. The Bergen outcrop sampled doss iiot contain ssdimsntai*,r structures or a vertical sequence which would indicate a beach deposit, but other interpretations are equally ambiguous.'
A vertical profile from a marine sequence of Pennsylvanian age near Tulsa, Oklahoma shows an upward progression from a shale to a sand- stone-shale interbedded unit, followed by a sandstone containing brachiopods. This unit is capped by a parallel bedded sand unit. Log- probability curves of sands from this unit contain two saltation populations. The position in the sequence is that of a strand-line deposit, but insufficient evidence exists to call it a beach from other environmental criteria. The_ shape of the log-probability curve, however, is distinctive enough to suggest this possibility (fig. 19).
These are - the only examples of possible beaches found in this study of ancient sands. This suggests either that beaches are rarely preserved as - ancient' sands, or that post-deposi- tional processes have altered the distributions so that beaches cannot be identified. This, however, is unlikely since characteristic curve shapes, as indicated by previous comparisons, are commonly preserved.
Turbidity Current DepositsOne of the most characteristic shaped size
distribution curves is from turbidity current deposits '(fig. 20). No modern analogue is available for these sands, but the environmental criteria are well developed and allow for easy recognition. A-large range occurs in the shapes
" of the log-probability plots of density or turbidity current deposits, possibly because these currents are highly variable in velocity, density, grain size of transported materials, and thick-
- ness.The distinguishing characteristic of these de
posits is the development of a large, poorly sorted suspension population, which includes grain sizes from clay and silt to 1 mm. Even coarser materials may be transported in the suspension mode by some currents, but precise data
U-.L.CÍV.ÍV o. V LSti tsK
' are limited. The truncation point of the suspension population can be ás coarse as l.S to 0.0 phi, and a coarser population may be present. This population is better sorted and may represent the saltation population; but the physical characteristics of particle transport in dense suspensions is unknown, and whether there is saltation or surface creep transport has not been ascertained.
Ventura Basin graded bed.—Four grain size distributions are plotted from a'single Pliocene , turbidity current bed from the Ventura basin (fig. 20A). The upward decrease in grain size, the change of the saltation-supsension truncation point toward finer sizes upward in the bed, and the increase in percentage of the suspension population toward the top of the bed are notable features. Environmental information concerning Ventura basin turbidity currents and information concerning this bed are discussed by Crowell and . others (1966). The interpretation of the log-probability curves supports the concept that the graded suspension mode of transport is predominant, and that a dense suspension can transport coarse detritus.
Other examples .of turbidity current deposits. —-Figure 20 illustrates examples from the Pennsylvanian Atoka Formation (fig. 20B), the Hudson River submarine fan (Kuenen, 1964), and the Delaware basin (fig. 20C), and miscellaneous examples from several areas and ages (Dzulynski and Walton, 1965) (fig. 20D). The turbidity current origin of the Atoka samples is discussed by Briggs and Cline (1967). These curves are similar in shape and vertical progression to those from the Ventura basin. The curves from grain size analyses reported by Dzulynski and Walton are more variable (fig. 20D), but do show the poor sorting of both the suspension and the saltation population (slope usually less than 50 degrees). The position of the truncation point between the saltation and suspension populations appears to range widely and probably is dependent upon the density of the turbidity current.
The Delaware basin curve shapes and those reported by Kuenen (1964) are different from the other examples (fig. 20C) and certainly must reflect a different type of depositing current. Turbidite sedimentary structures are lacking in most sandstones from thé Bell Canyon Formation, suggesting that they may have been deposited by a different process than those described above. The distribution curves of sands from the Hudson submarine fan (Kuenen, 1964) are similar, suggesting a submarine fan origin for these Delaware basin sands. Environ-
CL
a.
WEST OF TULSA
.51 .25 125 .067m m . S ca le
F ig . 19—Examples of sandstone w ith grain size c u p e shapes similar to modern beach sands. A beach origin fo r these sandstones is inferred from their curve shape.
mental information on the origin of the Bell Canyon Formation sands has been presented by Hull (1957), but little detailed work is published. Thè term fluxoturbidites (Stanley, 1963; Dill, 1964) has been proposed for deposits produced by sand transport, down - the continental slope and across subsea fans. A well sorted saltation population and. the mixing of a graded suspension population at the point of truncation are characteristic of these curves. This would fit the processes of sand transport described for modern examples (Dill, 1964).
Significance of turbidity current curve shapes. —The curve shape of the log-probability plots of turbidity current deposits provides a new approach to the interpretation of their transport and deposition. The vertical gradations in size, the truncation point between suspension and saltation populations, the slope of the suspension population, and the amount of detritus less than 44 microns all suggest that a turbidity current bed is - a single genetic unit. The variations found in the bed suggest that a similar vertical variation may occur in the turbidity current. The preponderance of poorly sorted suspension detritus in turbidite units of the classical type is
1101,G R A I N S I Z E D I S T R I B U T I O N S
AT0K» FORMATION _ 1 MILE SOUTH Of HODGEK, OKLAHOMA SINGLE TURBIOITE BEDPLIO-PÏCO FORMATION - VENTURA BASIN, CALIFORNIA A
(Slop A4.1967 A A P.G. Ml*. Loi Angel*»!
P h i S c a le
m m S c a lem m . S c a le
vt
*AA (Cert depth 18-.
Cl "o.
O.AIA FROM OJÜITNSKI An O
P h i S c a lePhi ScaleV .5 -z&
m m . S cale
P ig 2 0 Examples of turbidity current deposited sandstones. Insets A, B, and D illustrate the variabilityfound in turbidity current deposits. Inset C shows similar grain si?e curve shapes trom modern and ancient sands. A subsea fan origin is suggested fo r the Bell Canyon Formation.
n rm . S c a le
i 1KJ£, OLüWiV s . V I S H E R
a.
P h i S c a le
i ?
P h i S c a le
m m . S c a le
Fig. 21.—Examples of ancient sandstones not observed in modem sands. The possible mode of origin is indicated from curve shape and the relation to other samples and data.
cance must await detailed analyses of samples from known modem environments.
The most important group of grain- size distribution curve shapes that have not been described are those developed by deposition from suspension (fig. 21 A). Many density current and slump deposits occur at relatively shallow water depths. These curves usually show a poorly developed saltation population, or strong mixing between surface creep and suspension transport populations. These characteristics also can be developed by post-depositional reworking produced by burrowing organisms or secondary processes (fig. 21B), and care must be taken not to confuse these curve shapes with ones produced by primary depositional processes. These curve shapes are included to show the hazards of attempting to interpret every distribution found within a sand unit.
DYNAMIC RESPONSE OF CURVE SHAPES TO ENVIRONMENTAL CHARACTERISTICS
The analysis of grain size distribution curve, shapes from both modern and ancient environments has provided information concerning characteristics of the log-probability curves. Most of these characteristics were suggested by the association of a specific property of an environment to a unique characteristic of one or more of the Sbbordinatepopulations of the size
supporting evidence for the concept of a dense turbid cloud moving rapidly down a slope. The turbidite unit from the sole marks to the upper laminated zone, therefore, would all be a product of the same flow. Alternative modes of deposition would be reflected by abrupt changes in the shapes of the log-probability plots and should be easily recognized.
Miscellaneous Curve Shapes . The study of any group of log-probability distribution curves from an ancient sand provides many unanswered questions concerning a number of curve shapes. Many variations and unusual curve shapes are present, and their explanation necessitates a re-study- of all the physical and biologic aspects of the sedimentary sequence. Some of the anomalous curve shapes may be due to composite'samples (those representing more than a single depositional unit), but others may represent unusual processes and have real significance in interpretation of the genesis of the sand body. These curve shapes usually can be related to the vertical sequence of sedimentary units or to their position within the environmental framework, and their significance can thus be properly evaluated. Some of the interpretations suggested for specific types of grain size distribution curves have been developed in this manner, but their true signifi-
G R A I N S I Z E D I S T R I B U T I O N S 1103
Jistribution.-The characteristics indicate certain general hypotheses concerning cause and effect relationships between sedimentary processes and •éxtural responses. These relationships are outlined below, but with the precautionary note that they are only empirical and are not based ¡ipon quantitàtive hydraulic studies. They, are outlined here to provide a basis for the more quantitative work that is needed to support the general thesis that log-probability curves do reject sedimentary processes.
Characteristics Reflected by the, - 1 __ - . V . . E > - t . , .1 ~ l í
J y t£ 7 tr¿ U S 'n 1 v y n h i . t n u n
The suspension population reflects the conditions above the depositional interface. A close association exists between a large suspension population, a high concentration of suspended sediment in the fluid, and rapid sedimentation rates. Relations concerning sorting of this population and mixing with the’ saltation population are ambiguous, but appear to reflect turbulence in the overlying fluid and the presence of a boundary layer. Strong currents produce a boundary layer and restrict both the amount and the sorting of the suspension population in-' duded in the .distribution. Strong mixing between the suspension and saltation population appears to be related to highly variable energy conditions which result in the partial destruction of the boundary layer.
Churacteristics Reflected by the Saltation Population
The saltation population is a product of the moving grain layer. The forces active in the transport of sediments within this zone are poorly' understood. The range of grain sizes, sorting, and points of truncation of the population are highly variable, but they do suggest certain interpretations.'
Samples with good sorting of the saltation population appear to reflect reworking or winnowing by wave, tide, or swash and backwash. The higher the velocity of the opposing currents and the slower the rate of sedimentation, the better is the sorting and therefore the steeper is the slope of this part of the distribution curve. When opposing currents each form separate laminae, two distinct saltation populations may be developed as described for beach foreshore deposits. The position of the fine truncation point may reflect turbulent energy at the depositional interface. High turbulent energy would produce truncation at a course Point, and.low. turbulent energy at a'finer trun-, totion point. The coarse truncation point would reflect the shear at the depositional interface, ttith high shear produced by high bed layer ve
locities. The amount of the saltation population depends upon the stability of the moving bed layer and the rate of deposition.
Characteristics Reflected by Surface Creep Popidation
The amount of the surface creep population is largely provenance controlled. A large percentage of this population necessitates the removal of finer grain sizes. This can occur by the selective removal of finer materials by winnowing. The slope of this population reflects the competence of the transporting currents. The maximum size may indicate a provenance control, or a limit related to current velocity. Many distributions are truncated at the coarse end, which suggests there is a mechanism limiting the coarsest size material in transport.
CLASSIFICATION OF GRAIN SIZE CURVES
The characteristics of the individual grain size distribution curves provide a basis for an environmental classification. Any attempt to define precise limits for the slopes, truncation points, and percentages of each of the' three basic populations for individual environments probably is impossible. Certain guidelines, however, may be based on the samples that were . available for this study. Because of variations in provenance, post-depositional processes, and improper sampling, any single grain size distribution curve may not fit into a unique category. Also improper classification, is possible if the guidelines are taken too rigidly. With these limitations as a guide, a proposed classification is presented in table 1. Only a few sedimentary environments are included, but others may be added as more information is obtained.
CONCLUSIONS
’ The determination of the depositional environments of an ancient sand is a difficult problem, and in most , instances physical, biological, and chemical criteria are needed before a firm interpretation is possible. The textural criteria
■ outlined in this paper should properly be only another set of criteria to be used in conjunction with many others. Together with other information such as sedimentary structures, position in sequence, fauna, and mineralogy, the textural information may provide new insight or possibly the confirming data needed for environmental interpretation.
The emphasis of this paper has been in developing the background material for a new approach to textural analysis. Sufficient data have been presented to indicate that this approach has possibilities. Rigid application of the proposed classification, or specific genetic in-
1104 G L E N N S. V I S H E R ■ V
T a b le 1.—Key: C.7'. — Coarse Truncation point; F.T.= Fine Truncation point;.4 = Saltation population; B = Suspension population; C= Surface creep population.
-------------------- —Saltation population Suspension population Surface creep population
Sand type Percent Sorting -C.T.Phi.
F .T. - Phi. Percent Sorting
MixingA&B
F.T.Phi. Percent Sorting
C.T.Phi.
MixingA&C
Fluvial 6598
Fair -1 .5 -1 .0 '
2 .75-3.50
2-35
Poor Little > 4 .5 Varies Poor No Limit Little
N atural levee 0—30
Fair 2 .0 -1.0
2 .0 -3.5
60-100
Poor Much > 4 .5 0 -5- None
Tidal channel 2080
Good ■ 1 .5 - 2 .0
1 .5 -3.5
0 - .20
PoorGood
Much 35.> 4 .5
0-70.
Fair-Good
- 0 .5 --1 .5 Average
Tidal inlet 30-65.
Good 1.25-1.75
2 .0 - 2. S
2 -5
FairGood
Average 3 .5 -4.0
30-,70
Fair-Good
-0 .5 - No Limit
Average
Beach 50-99
2 Populations Excellent
.52.0
3.04.25
0 -10
Fair-Good
Little 3 .5 -> 4 .5
0-50
Fair -1 .0 - No Limit
Average
Plunge zone 20-90
Good 1 .5 -2.5
3.04.25
0— 2
Good Much 3 .0 -> 4 .5
1090
Fair-Poor
No Limit Average
Shoal area soos
Good 2.002.75
3 .5 -> 4 .5
0 - '2
Poor-Fair
Little 3*5-> 4 .5
5-70
Fair-Poor
0 .0 --2 .0
Much
Wave zone 35-90
Good-Excellent
2.003.00
3.0 >4'. 5
5 -70
FairPoor-
Muchi
3.75> 4 .5
0-10
Poor . 0 .0 - No Limit
L ittle ■
.Dune 97-99
Excellent 1 .0 -2 .0
- 3.0 4 .0
1-3
Fair Average 4 .0 -> 4 .5
0 - 1 2.
Poor l.Or-0.0
Little
T urbiditycurrent
0 -70
FairPoor
1 .0 -2 S
0 .0 - .3.5
30100
Poor Much > 4 .5 0 -40
Fair-Poor
No-Limit Much
terpretations, probably is unwarranted at this time, but the approach has been successfully applied to a number of study areas.
The analysis-of log-probability grain size distribution curves appears to be a fruitful method for studying sedimentary dynamics. If more textural data were presented in this manner a basis would exist for comparing textures of clastic rocks. More information is believed to be obtainable from this type of plot than for any other method of presenting the data, and for this reason alone such curves should be included as a part of the pétrographie description Of clastic rocks.
Nos. GA-997 and GA-1635, and The University of Tulsa provided direct aid. Without the financial assistance of these organizations this study would not have been possible. In addition, a portion of the publication costs have been provided by The University of Tulsa and thé 'National Science Foundation. Ideas expressed in this paper were developed during discussions with colleagues at Sinclair Research and in classes at The-University of Tulsa. Drs. James Davis, Phillips Petroleum Company, and Roderick Tillman, Sinclair Research, Inc., offered suggestions for revision of the manuscript which have been helpful in clarifying the ideas expressed. The careful editing of the manuscript by Dr. Roy Graves, Information Services. University of Tulsa, is gratefully acknowledged. Responsibility for all errors and interpretations, however, must rest with the writer.
. a c k n o w l e d g e m e n t s
Support during the early phases of this study was furnished by Sinclair Research, Inc. Later the National Science Foundation, under Grant
R E F E R E N C E SB ag n o ld , R. A , 1941, Physics of blown sand and desert dunes. Methuen and Co., London, 265 p. 1954, Experiments on a gravity-free dispersion of large spheres in a Newtonian fluid under stress:
P h il T rans . Roy. Soc. London, V. 225, p. 49-63. ' _____ 1956, The flow of cohesionless grains in fluids: P h il-T ra n s . Roy. Soc. London, v. 249, p. 23=-2w;B r i g g s ’ G a r r e t t , a n d C l i n e , L. M., 1967, Paleocurrents and source areas of late Paleozoic sediments ot
the Ouachita Mountains, southeastern Oklahoma: Jour. Sedientary Petrology, w 37, p. 985-1000. B rooks, N. H ., 1958, Mechanics of streams w ith movable beds o f fine sand: Am. Civil Engineers Trans.,
C h i e n N ^1956 The present stratus o f research on sediment transport : Am. Soc. Civil Engineers Trans- P aper 2824, p. 833-844. „ . - i
C r o w e l l , J. C., a n d o t h e r s , 1966, Deep water sedimentary structures—Pliocene P lio Pico Form ation band P au la Creek, Ventura basin, California : Calif. Div. Mines Geol., Spec. Rept. 89, 40 p. “
D ill, R. F., 1964, Contemporary submarine erosion in Scripps submarine Canyon: Unpub. Ph.D . Thesis, Univ. of Calif. San Diego, 299 p.
JG R A I N S I Z E D I S T R I B U T I O N S 1105
rjOEGLAS, D. J., 1946, Interpretation o f the results of mechanical analyses: Jour. Sedimentary Petrology v. 16, p. 19-40. -
pzuLYSKi,. S ta n is la w , an d W a lto n , E. K., 1965, Developments in Sedimentology, 7, Sedimentary features of flysch and greywacke. Elsevier Publishing Co., New York, 274 p.
Cixstein, H . A., 1950, The bed-load function fo r sediment transportation in open channel flows ■ T J ^ Dept. Agriculture, Tech. Bull. 1026, 71 p.
_ — -, an d B arb aro ssa , N. L., 1952, R iver channel roughness: Am.- Soc. Civil-Engineers Trans., v. 11/ p. 1211—1146. _ ’— , and Ch ie n , N., 1953, T ransport of sediment m ixtures with large ranges ó f grain size - Univ Calif Inst. Eng. Research, M. R. D. Sed. Series, No. 2, 49 p
Folk, R. L., and W ard, W . C., 1957, Brazos River b a r: a study in the significance of grain-size param eters- Jour. Sedimentary Petrology', v. 27, p. 3-26. ,
Friedman, G. Mi, 1961, Distinction between dune, beach, arid river sands from the tex tural characteristics •1 Jour. Sedimentary Petrology, v. 31, p. 514-529.
_ ---- , 1967, Dynamic processes and statistical param eters compared fo r size frequency distributions ofbeach and river sands: Jour. Sedimentary Petrology, v. 37, p. 327-354.
Füller, ’A. O., 1961, Size characteristics o t shallow marine sands from Cape of Good Hope. South A frica •Jour. Sedimentary Petrology, v. 31, p. 256-61.
Hilbert, G. K., 1914, T he transportation of debris by running w ater: U . S. Geol. Survey P rof. Paper 86 , 263 p.
Harris, S. A., 1959, T he mechanical composition o f some intertidal sands: Jour. Sedimentan- Pefrologv v. 29, p, 412-424. '
Hendricks, T. A., 1950, Geology of F t. Smith District, A rkansas: U. S. Geol. Survey P ro f. Paper 221E p. 67-94.
Hull, J . P . D., J r., 1957, Petrogenesis of Perm ian Delaware Mountain sandstone Texas, New Mexico-Am. Assoc. Petroleum Geologists, v. 41, p. 278—307. ’
G-man, D. L., 1949, Sorting of sediment in light of fluvial mechanics: Jour. Sedimentary Petrology, v. 19, p. 51—70. ; - ’ ’
Jopling, A. V., 1966, Some principles and techniques used in reconstructing the hydauliç param eters o f a paleo-flow regim e: Jour. Sedimentary Petrology, v. 36, p: 5-49,
Kalinski, A . A., -1943, Turbulence and the transport of,,sand and silt by wind: Ann. N Y Acad Sei v 44' Art. 1, p. 41-54. ' ' •
StovAij, J . E., 1966, T he use of factor analysis in determining depositional environments from grain-size distributions : [our. Sedimentary Petrology, V. 36, p . 115-125.
Kr u m b e i n , W . C., 1937, Sediments and exponential curves: Jour. Geol., y- 45, p. 577-601.t ,1938, Size frequency distributions and the normal phi curve: Jour. Sedimentary Petrology, v. 8 p. 84-90
— , and Aberdeen, Ë. J., 1937, The sediments o f B arataría Bay (L a.) : Jour. Sedimentary Petrology v. 7, p. 3-17. '
Kuenen, P h . Hi, 1964, Deep-sea sands and ancient turbidites, p. 3-33 in Bouma, A. H., and: Brower A eds., Developments i n Sedimentology, 3, Turbidites. Elsevier Pub. Co., New York, 264 p. ’ ’
U ne, Ë. W .,-1938, Notes on the formation of sand: Am. Geophys. Union, Trans., v. 19, p. 505-508.SIaSon, C. C., and F olk, R. L., 1958, Differentiation of beach, dune, and aeolian flat environments by size
analysis, M ustang Island, T exas: Jour. Sedimentary Petrology, v. 28, p. 211-226. 'floss, A . J., 1962, T he physical nature o f common sandy and pebbly deposits. P a r t I : Am. Jour. Sei. v 260
p. 337-373. - ’— , 1963, The: physical nature o f common sandy and pebbly deposits. P a r t I I ; Am. Jour. Sei v ?6 I p. 297-343. ' ’
?ASSEGA, R., 1957. T ex ture as characteristic o f clastic deposition: Am. Assoc. Petroleum Geologists Bull v. 41, p. 1952-1984. - ’’
——, Riz z in i, A., and Borghetti, G., 1967, T ransport o f sediments by waves, A driatic coastal shelf Italy : Am. Assoc. Petroleum Geologists, v. 51, p. 1304-1319. ’
ettijohn, F. J., 1949, Sedimentary Rocks. H arper and Bros., New York, 526 p.«TOR, P. E., 1963, Late Paleozoic sandstones o f the Illinois basin : 111. State Geol. Survey, Rept. of Invest
21/, 92 p. ‘ -''.vW. W ., 1938, The force required to move particles on a stream bed:-U. S. Geol. Survey P ro f. Paper
. l8v E 'p . 121—141. _ *'•*5*. Sandro, 1968, Bluejacket Formation—a subsurface study in.northeastern Oklahoma: Unpub M S . Thesis, Univ. o f Tulsa, 142 p.-Hields, A,, 1936, Anwendung der Aehnlichkeitsmechanik und der Turbulenzforschung an die Geschiebe- . bewegung: Mitt. Preuss. Versuchsanst. W asserblau und Schiffbau., H eft 26, Berlin.'IX0OWSKI, K. H ., 1958, D ie synoptische Methode des Korkurven—Vergleiches zur Aussenzüg fossiler Sedi-. mentationsräume : Géol. Jahrb., v. 73, p. 235-275. .’» ncer, D. W., 1963, T he interpretation of grain size distribution curves o f clastic sediments- Tour . Sedimentary Petrology, v, 33, p. 180-190. ' 'Heker, E M-, 1949j_Sedimentary facies and associated diastrophism in the Upper Cretaceous o f central
eastern Utah, p. do-81 m Longwell, C. R., chairmaç, Sedimentary facies in geologic historv. Geol Soc . America Mem. 39,171 p . 1Janley , D J., 1963 Non-turbidites in flysch-like sequences : Geol. Soc. America, Spec. P aper 76 p. 155-156 -S.DBORG, A ke, 19=6; The River Klaralven—a study of fluvial processes: Geografiska A nnlaer v 38 D IV -
316. ’ ’' S W aterways Experiment Station, 1939, Study of materials in suspension, Mississippi River- T ech ’
Memo. 122-1, Vicksburg, La., 27 p. ‘
J. U J O U ' i - . X - i V i V O . Y 1 J 4 4 D Í I
■ ' s
V a n o n i V . A ., a n b B r o o k s , N . H ., 1957, Laboratory studies of the roughness and suspended load of allu.vial stream s: Calif. Inst. Tech. Sed. Lab., Rept. E -6 8 , 121 p . .
V ish e r G S 1965a Fluvial processes as interpreted from ancient and Recent fluvial deposits, p. lló -IJ i in Middleton, G.’ V., ed., P rim ary sedimentary structures and their hydrodynamic interpretation. SotEcon. Paleontologists and Mineralogists, Spec. Pub. No. 12, 265 p. ’
-______ 1965b, Use of the vertical profile m environmental reconstruction: Am. Assoc. Petroleum Geologists.
———,^l’967a,^ Grain size distributions and depositional processes: P re -prin t V II International Sedimentologic ' Congress’, Reading and Erinburg, England 4 p. „ A . , o ~
_ 1967b. The relation of gram size to sedimentary processes (A bst.) : Am. Assoc. Petroleum Geol. Bull..
W eimer,’ R.4j t 1965, L ate Cretaceous deltas Rocky Mountain region (A bst.) : Am. Assoc. Petroleum Geologists, v. 49, p. 363,
J o u r n a , S e d i m e n t a r y P e t r o l o g y , V o l . 39, No. 3, P: 1107-1117 F i g s . 1 -1 7 , S e p t e m b e r , 1969
EXPERIMENTAL INVESTIGATION OF PRESSURE SOLUTION OF QUARTZ1
J. J . R E N T O N , M. T. H E A L D , a n d C. B. C E C IL 2 W est V irginia University, Morgantown, W est V irginia
A B S T R A C TExperimental pressure solution of quartz was conducted in hydrothermal reactors. Loads ranged from
2500 psi to 12,000 psi, w ith temperatures ranging from 270°C to 550°C. Pressure solution occurred in distilled water as well as in solutions of. N aO H , N a*C03, NaCl, and natural brines. Clearly defined pressure solution pits were readily observed on faces of quartz crystals which had been surrounded by small zircon grains and subjected to load. .
The rate of compaction of fine sand was much greater than that of coarse sand, resulting in a pore space reduction o f 70 percent in fine sand compared to a 45 percent reduction in coarse sand. T he rate o f compaction of fine angular sand was approximately 2.3 times th a t o f fine round sand. A s a result o f pressure solution and growth, the appearance o f the angular grains was little different from that o f the round 'g ra ins after comparable’ pressure solution. Simultaneous pressure solution and quartz growth in sand samples produced aggregates which were considerably stronger than those resulting from cementation alone.
/Samples composed o f grains o f chert responded to pressure solution much more rapidly than monocrystalline quartz. The chert d id not completely recrystallize, but grain boundaries'Tiecame very indistinct and the resulting product resembled a solid mass o f chert. ' . . .
The experimental studies show that as a result of pressure solution, initial differences in texture and composition o f natural sands m ay lead to striking differences in final porosity.
i n t r o d u c t i o n
The phenomenon of pressure solution refers to the solution of quartz at the point of grain contact as a result of stress, generally from load pressure. The. effects of pressure solution have been widely observed and reported from pétrographie studies of sedimentary rocks. Probably the most dramatic expression of pressure solution takes the form of styidlite seams. Heald (1955) described the formation of styloides in sandstones and stated that the silica produced by stylolitic solution could be an important source of silica cement in sediments. In some parts of the Simpson and St. Peter sandstones, the entire volume of secondary silica cement may have been derived by pressure solution (ileald, 1956).
The possibility of clay promoting the process of pressure solution has been proposed by a number of workers. Heald (1956) suggested that the clay simply ácted as a catalyst. Weyl (1959) advanced the idea that solution wás favored by the greater diffusion through clay between grains, Thomson ( 1959) theorized that the clay promoted the process of pressure solution by-providing a microenvironment of high pH at grain contacts. As the silica migrated away from the points of grain contact into the pore spaces, the silica would be deposited as secon-
1 Manuscript received October 16, 1968.. 2 Present address : Colgate University, Hamilton,
New York.
dary quartz overgrowths on the quartz grains as a result of a decrease in pH.
. METHODS OF INVESTIGATION
Recognizing the potential importance of pressure solution as a process of sandstone lithifica- tion, the present writers initiated a series of experiments designed to produce, pressure solution under laboratory conditions. Fine grained natural quartz sands have heeii used in most previous studies of compaction (Maxwell, I960 ; Ernst and Blatt, 1963). Modifications developing on these grains during the early stages of compaction are difficult to distinguish from original surface irregularities, and thechanical effects cannot be clearly distinguished from solution effects. In an attempt to increase the possibility of detecting solution effects at the contacts, grains were polished by air abrading with fine grit. The treatment was partially successful in that some small pits were observed on the polished grains at the completion of the pressure solution experiments. However, the pits were so small in the early stages of solution that quantitative measurements were difficult to carry out and mechanical effects could not be easily recognized.
It was found that the best method of observing incipient pressure solution was to use crystals or cut plates of quartz surrounded by grains under load. In transmitted light under a pétrographie microscope, .‘solution pits of extremely