GRAÑA Y MONTERO S.A.A. AND SUBSIDIARIES CONDENSED INTERIM CONSOLIDATED FINANCIAL STATEMENTS FOR THE SIX-MONTH PERIOD ENDED AT JUNE 30, 2017 AND 2018 (UNAUDITED); AND CONSOLIDATED STATEMENT OF FINANCIAL POSITION AT DECEMBER 31, 2017 (AUDITED)
Transcript
GRAÑA Y MONTERO S.A.A. AND SUBSIDIARIES
CONDENSED INTERIM CONSOLIDATED FINANCIAL STATEMENTS FOR THE SIX-MONTH PERIOD ENDED AT JUNE 30, 2017 AND 2018 (UNAUDITED); AND CONSOLIDATED STATEMENT OF FINANCIAL POSITION AT DECEMBER 31, 2017 (AUDITED)
GRAÑA Y MONTERO S.A.A. AND SUBSIDIARIES CONDENSED INTERIM CONSOLIDATED FINANCIAL STATEMENTS FOR THE SIX-MONTH PERIOD ENDED AT JUNE 30, 2017 AND 2018 (UNAUDITED); AND CONSOLIDATED STATEMENT OF FINANCIAL POSITION AT DECEMBER 31, 2017 (AUDITED) CONTENTS
Page
Condensed Interim Consolidated Statement of Financial Position 1
Condensed Interim Consolidated Income Statement 2
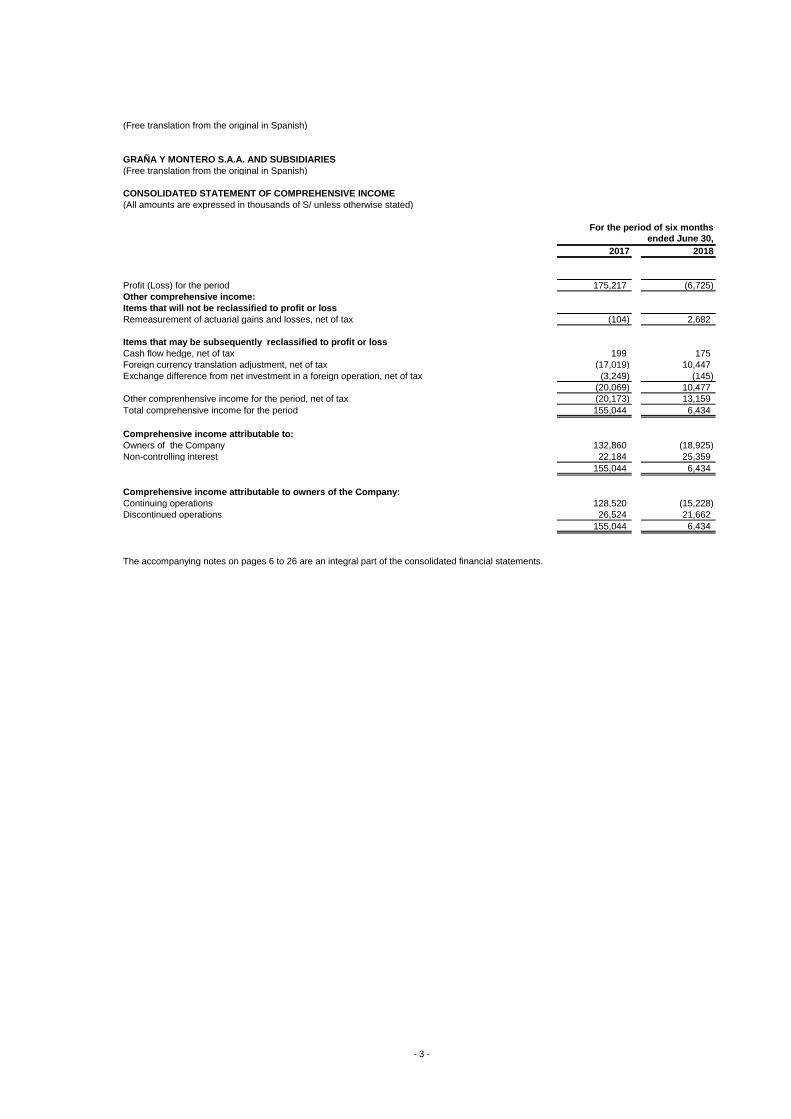
Condensed Interim Consolidated Statement of Comprehensive Income 3
Condensed Interim Consolidated Statement of changes in Equity 4
Condensed Interim Consolidated Statement of Cash Flows 5
Notes to the Condensed Interim Consolidated Financial Statements 6 - 26
S/ = Peruvian Sol US$ = United States dollar
GRAÑA Y MONTERO S.A.A. AND SUBSIDIARIES
(Free translation from the original in Spanish)
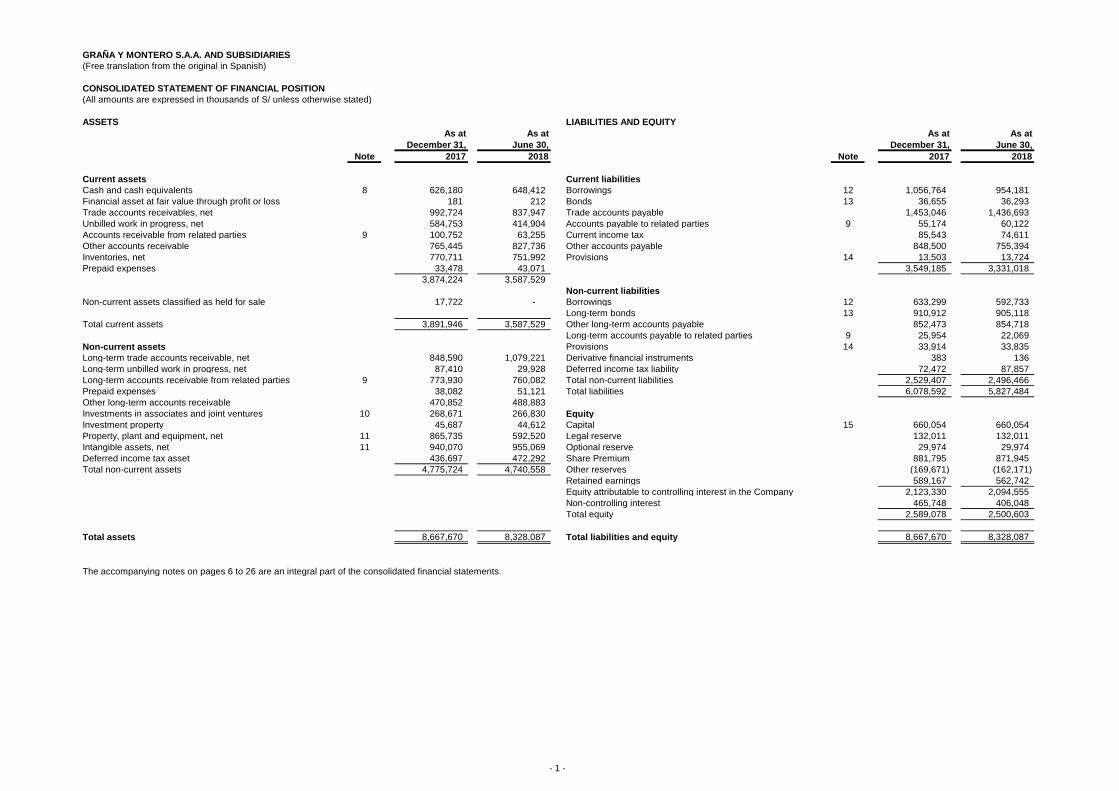
CONSOLIDATED STATEMENT OF FINANCIAL POSITION
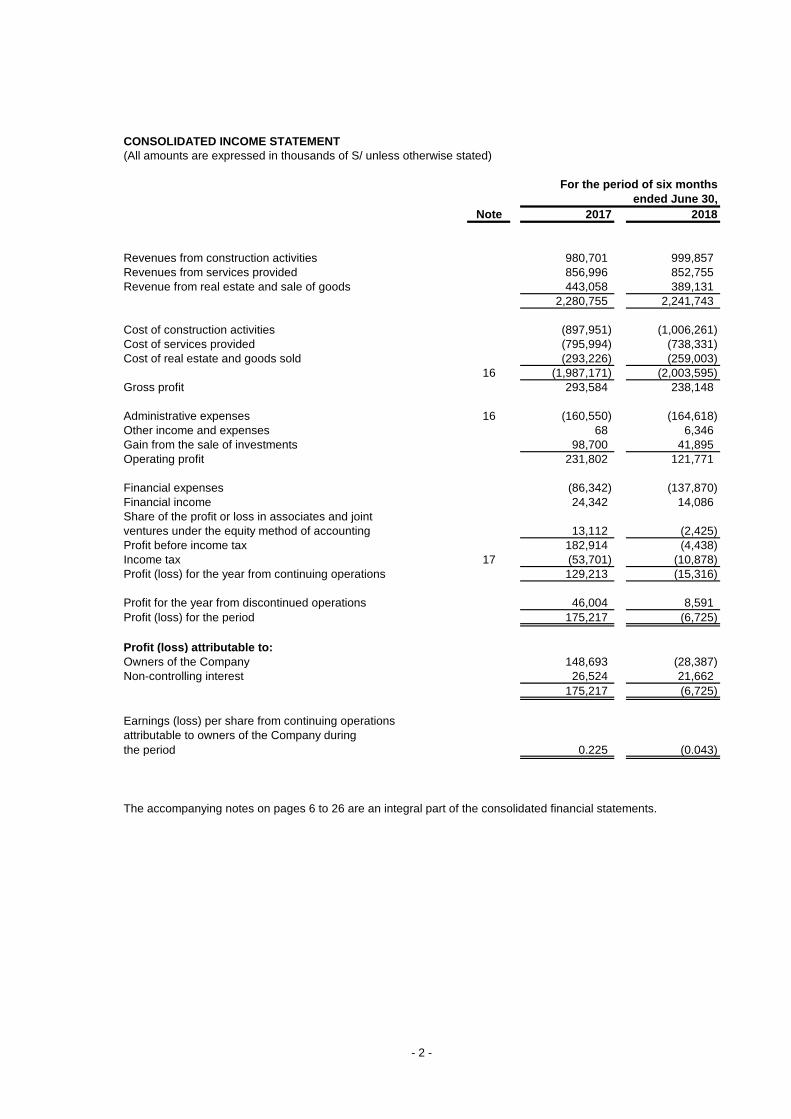
(All amounts are expressed in thousands of S/ unless otherwise stated)
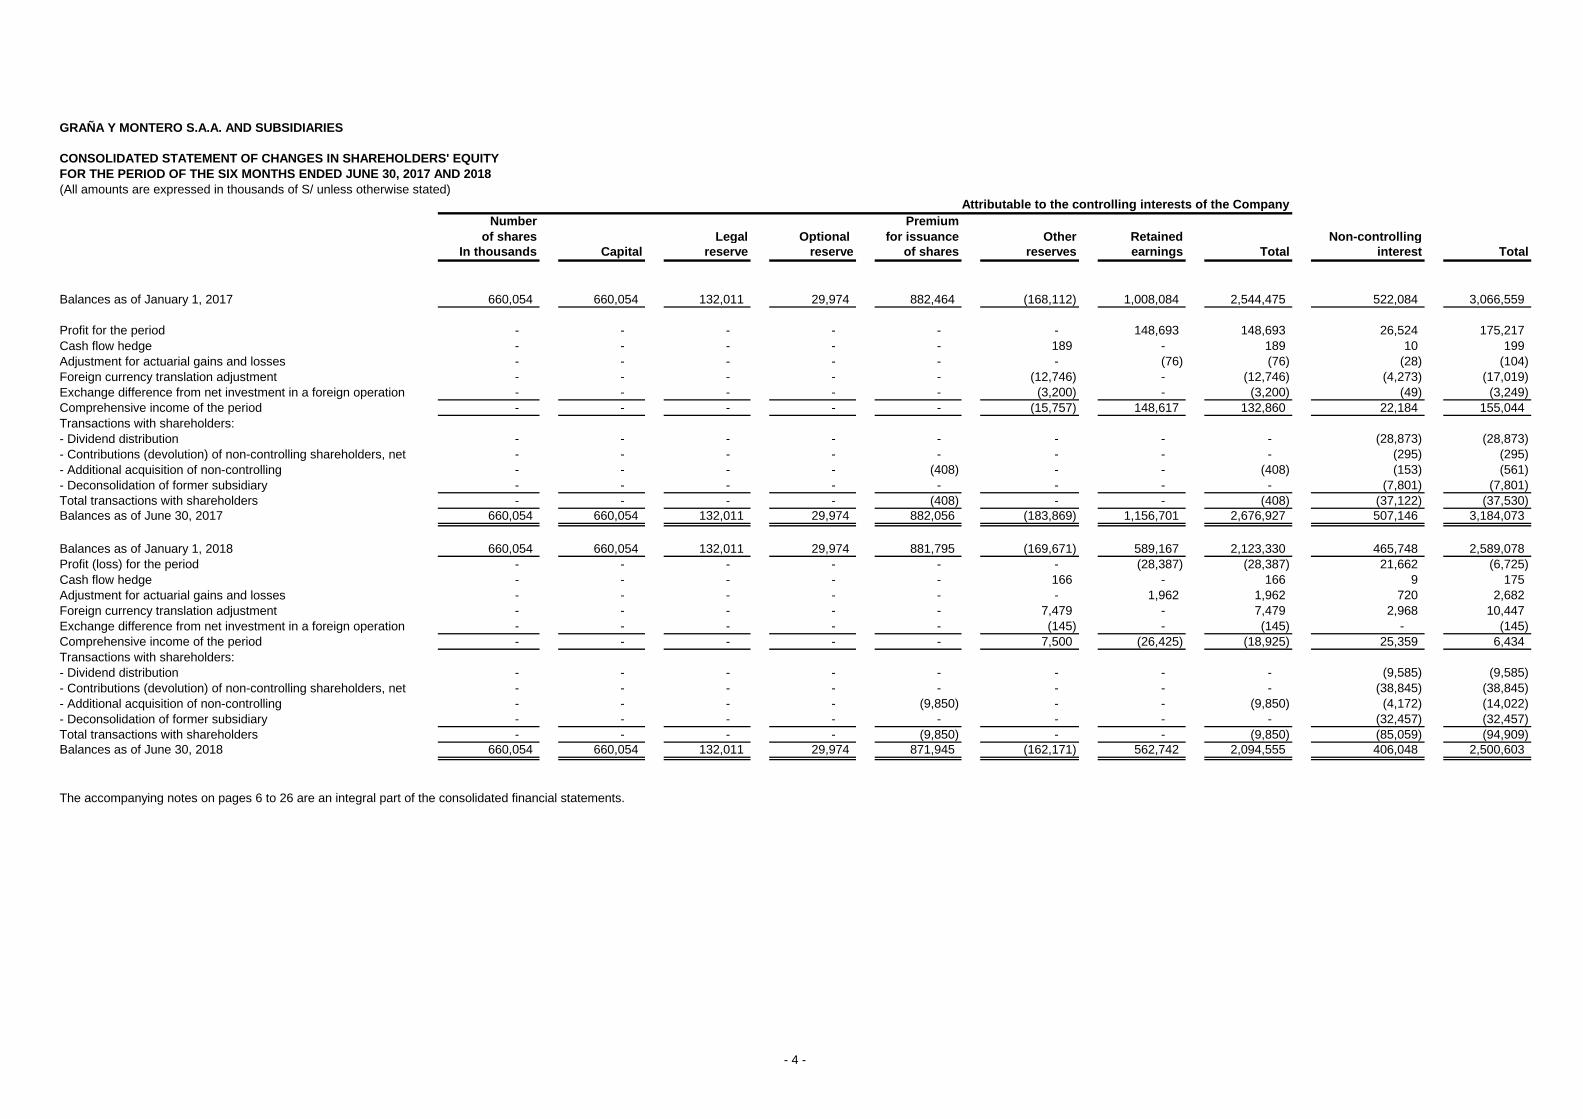
- Deconsolidation of former subsidiary - - - - - - - - (32,457) (32,457)
Total transactions with shareholders - - - - (9,850) - - (9,850) (85,059) (94,909)
Balances as of June 30, 2018 660,054 660,054 132,011 29,974 871,945 (162,171) 562,742 2,094,555 406,048 2,500,603
The accompanying notes on pages 6 to 26 are an integral part of the consolidated financial statements.
Attributable to the controlling interests of the Company
- 4 -
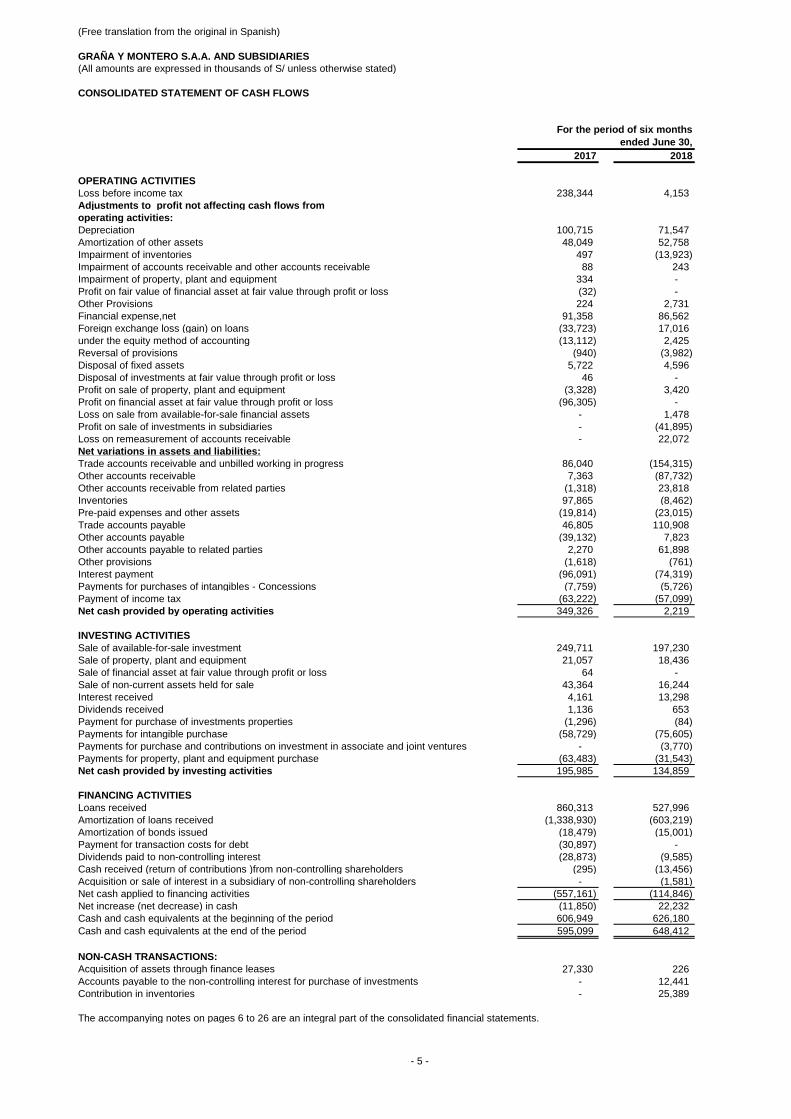
(Free translation from the original in Spanish)
GRAÑA Y MONTERO S.A.A. AND SUBSIDIARIES
(All amounts are expressed in thousands of S/ unless otherwise stated)
CONSOLIDATED STATEMENT OF CASH FLOWS
Note 2017 2018
OPERATING ACTIVITIES
Loss before income tax 238,344 4,153
Adjustments to profit not affecting cash flows from
operating activities:
Depreciation 100,715 71,547
Amortization of other assets 48,049 52,758
Impairment of inventories 497 (13,923)
Impairment of accounts receivable and other accounts receivable 88 243
Impairment of property, plant and equipment 12 334 -
Profit on fair value of financial asset at fair value through profit or loss (32) -
Other Provisions 15 224 2,731
Financial expense,net 91,358 86,562
Foreign exchange loss (gain) on loans (33,723) 17,016
under the equity method of accounting 11 (13,112) 2,425
Reversal of provisions 15 (940) (3,982)
Disposal of fixed assets 5,722 4,596
Disposal of investments at fair value through profit or loss 46 -
Profit on sale of property, plant and equipment (3,328) 3,420
Profit on financial asset at fair value through profit or loss (96,305) -
Loss on sale from available-for-sale financial assets - 1,478
Profit on sale of investments in subsidiaries - (41,895)
Loss on remeasurement of accounts receivable - 22,072
Net variations in assets and liabilities:
Trade accounts receivable and unbilled working in progress 86,040 (154,315)
Other accounts receivable 7,363 (87,732)
Other accounts receivable from related parties (1,318) 23,818
Inventories 97,865 (8,462)
Pre-paid expenses and other assets (19,814) (23,015)
Trade accounts payable 46,805 110,908
Other accounts payable (39,132) 7,823
Other accounts payable to related parties 2,270 61,898
Other provisions (1,618) (761)
Interest payment (96,091) (74,319)
Payments for purchases of intangibles - Concessions (7,759) (5,726)
Payment of income tax (63,222) (57,099)
Net cash provided by operating activities 349,326 2,219
INVESTING ACTIVITIES
Sale of available-for-sale investment 249,711 197,230
Sale of property, plant and equipment 21,057 18,436
Sale of financial asset at fair value through profit or loss 64 -
Sale of non-current assets held for sale 43,364 16,244
Interest received 4,161 13,298
Dividends received 1,136 653
Payment for purchase of investments properties (1,296) (84)
Payments for intangible purchase (58,729) (75,605)
Payments for purchase and contributions on investment in associate and joint ventures - (3,770)
Payments for property, plant and equipment purchase (63,483) (31,543)
Net cash provided by investing activities 195,985 134,859
FINANCING ACTIVITIES
Loans received 860,313 527,996
Amortization of loans received (1,338,930) (603,219)
Amortization of bonds issued (18,479) (15,001)
Payment for transaction costs for debt (30,897) -
Dividends paid to non-controlling interest (28,873) (9,585)
Cash received (return of contributions )from non-controlling shareholders (295) (13,456)
Acquisition or sale of interest in a subsidiary of non-controlling shareholders - (1,581)
Net cash applied to financing activities (557,161) (114,846)
Net increase (net decrease) in cash (11,850) 22,232
Cash and cash equivalents at the beginning of the period 606,949 626,180
Cash and cash equivalents at the end of the period 8 595,099 648,412
NON-CASH TRANSACTIONS:
Acquisition of assets through finance leases 27,330 226
Accounts payable to the non-controlling interest for purchase of investments - 12,441
Contribution in inventories - 25,389
The accompanying notes on pages 6 to 26 are an integral part of the consolidated financial statements.
For the period of six months
ended June 30,
- 5 -
- 6 -
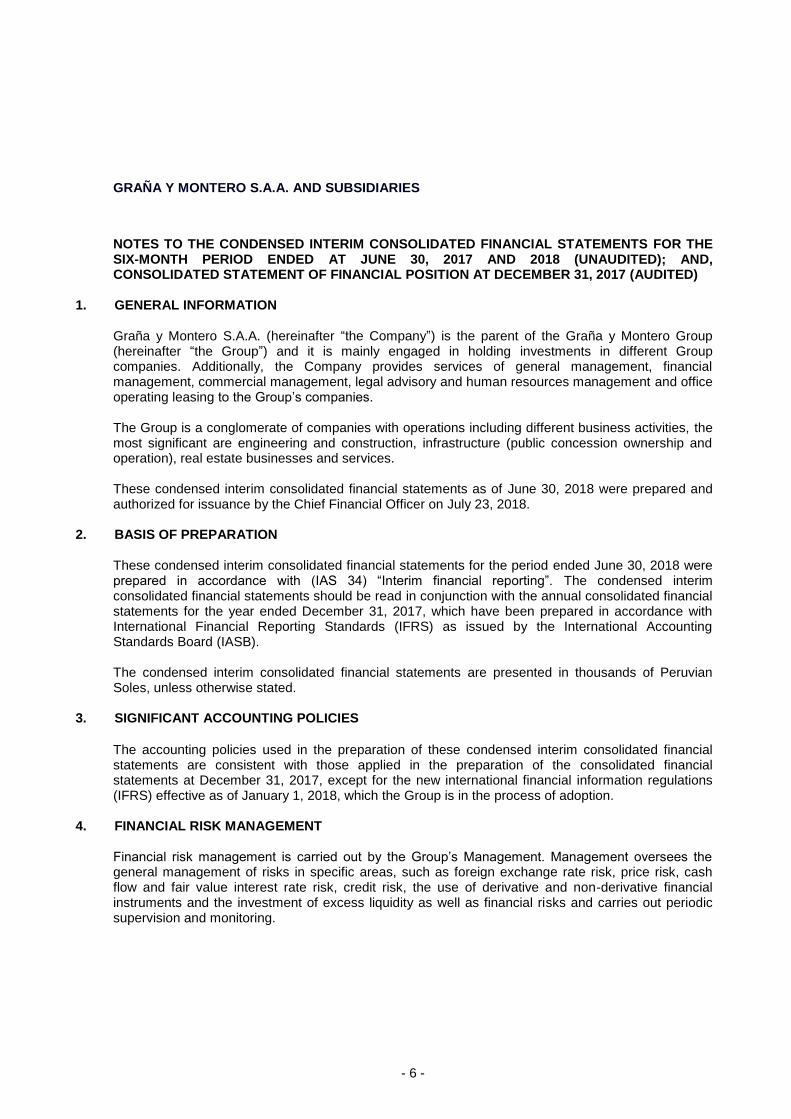
GRAÑA Y MONTERO S.A.A. AND SUBSIDIARIES
NOTES TO THE CONDENSED INTERIM CONSOLIDATED FINANCIAL STATEMENTS FOR THE SIX-MONTH PERIOD ENDED AT JUNE 30, 2017 AND 2018 (UNAUDITED); AND, CONSOLIDATED STATEMENT OF FINANCIAL POSITION AT DECEMBER 31, 2017 (AUDITED)
GENERAL INFORMATION 1. Graña y Montero S.A.A. (hereinafter “the Company”) is the parent of the Graña y Montero Group (hereinafter “the Group”) and it is mainly engaged in holding investments in different Group companies. Additionally, the Company provides services of general management, financial management, commercial management, legal advisory and human resources management and office operating leasing to the Group’s companies. The Group is a conglomerate of companies with operations including different business activities, the most significant are engineering and construction, infrastructure (public concession ownership and operation), real estate businesses and services. These condensed interim consolidated financial statements as of June 30, 2018 were prepared and authorized for issuance by the Chief Financial Officer on July 23, 2018.
BASIS OF PREPARATION 2. These condensed interim consolidated financial statements for the period ended June 30, 2018 were prepared in accordance with (IAS 34) “Interim financial reporting”. The condensed interim consolidated financial statements should be read in conjunction with the annual consolidated financial statements for the year ended December 31, 2017, which have been prepared in accordance with International Financial Reporting Standards (IFRS) as issued by the International Accounting Standards Board (IASB). The condensed interim consolidated financial statements are presented in thousands of Peruvian Soles, unless otherwise stated.
SIGNIFICANT ACCOUNTING POLICIES 3.
The accounting policies used in the preparation of these condensed interim consolidated financial statements are consistent with those applied in the preparation of the consolidated financial statements at December 31, 2017, except for the new international financial information regulations (IFRS) effective as of January 1, 2018, which the Group is in the process of adoption.
FINANCIAL RISK MANAGEMENT 4. Financial risk management is carried out by the Group’s Management. Management oversees the general management of risks in specific areas, such as foreign exchange rate risk, price risk, cash flow and fair value interest rate risk, credit risk, the use of derivative and non-derivative financial instruments and the investment of excess liquidity as well as financial risks and carries out periodic supervision and monitoring.
- 7 -
4.1 Financial risk factors
The Group’s activities expose it to a variety of financial risks: market risk (including foreign exchange risk, price risk, fair value interest rate risk and cash flow interest rate risk), credit risk and liquidity risk. The Group’s overall risk management program focuses on the unpredictability of financial markets and seeks to minimize potential adverse effects on the Group’s financial performance. The Group uses derivative financial instruments to hedge certain risk exposures in one of its subsidiaries and considers the use of other derivatives in the event that it identifies risks that may generate an adverse effect for the Group in the short and medium-term. a) Market risks
i. Foreign Exchange risk
The Group is exposed to exchange rate risk as a result of the transactions carried out locally in foreign currency and due to its operations abroad. As of June 30, 2018, and December 31, 2017, this exposure is mainly concentrated in fluctuations of U.S. dollar, the Chilean and Colombian Pesos.
ii. Price risk
Management considers that the exposure of the Group to the price risk of its investments in mutual funds, bonds and equity securities is low, since the invested amounts are not significant. Any fluctuation in their fair value will not have any significant impact on the balances reported in the condensed interim consolidated financial statements.
iii. Cash flow and fair value interest rate risk The Group’s interest rate risk mainly arises from its long-term borrowings. Borrowings issued at variable rates expose the Group to cash flow interest rate risk. Borrowings issued at fixed rates expose the Group to fair value interest rate risk.
b) Credit risk Credit risk arises from cash and cash equivalent and deposits with banks and financial institutions, as well as customer credit counterparties, including the outstanding balance of accounts receivable and committed transactions. For banks and financial institutions, only independently rated parties with a minimum rating of ‘A’ are accepted. With respect to loans to related parties, the Group has measures in place to ensure the recovery of these loans through the controls maintained by the Corporate Finance Management and the performance evaluation conducted by the Board. c) Liquidity risk Prudent liquidity risk management implies maintaining sufficient cash and cash equivalents, the availability of funding through an adequate number of sources of committed credit facilities and the capacity to close out positions in the market. Historically, the Group cash flows enabled it to maintain sufficient cash to meet its obligations. However, as of December 31, 2016, the Group started to experienced liquidity risk due to the early termination of the GSP concession agreement and the obligations assumed. As a consequence, the Group started a disinvestment plan to be able to meet the obligations resulting from this scenario. Group Corporate Finance monitors rolling forecasts of the Group’s liquidity requirements to ensure it
- 8 -
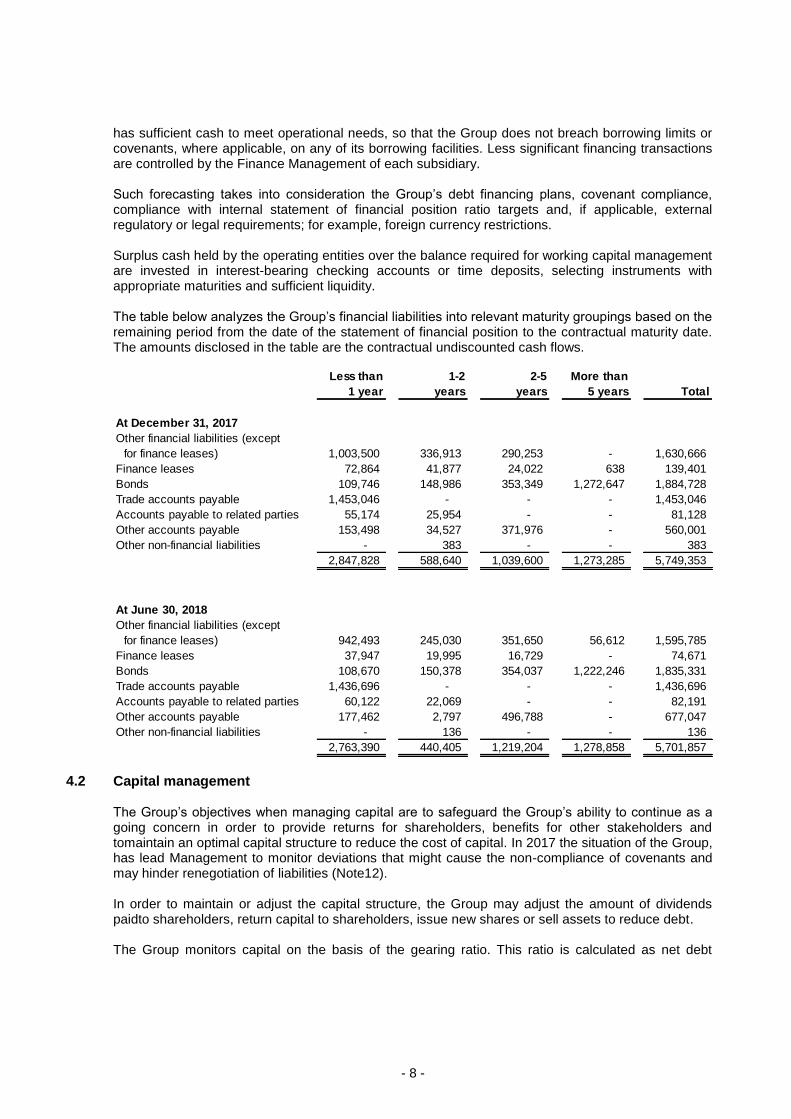
has sufficient cash to meet operational needs, so that the Group does not breach borrowing limits or covenants, where applicable, on any of its borrowing facilities. Less significant financing transactions are controlled by the Finance Management of each subsidiary. Such forecasting takes into consideration the Group’s debt financing plans, covenant compliance, compliance with internal statement of financial position ratio targets and, if applicable, external regulatory or legal requirements; for example, foreign currency restrictions. Surplus cash held by the operating entities over the balance required for working capital management are invested in interest-bearing checking accounts or time deposits, selecting instruments with appropriate maturities and sufficient liquidity. The table below analyzes the Group’s financial liabilities into relevant maturity groupings based on the remaining period from the date of the statement of financial position to the contractual maturity date. The amounts disclosed in the table are the contractual undiscounted cash flows.
4.2 Capital management
The Group’s objectives when managing capital are to safeguard the Group’s ability to continue as a going concern in order to provide returns for shareholders, benefits for other stakeholders and tomaintain an optimal capital structure to reduce the cost of capital. In 2017 the situation of the Group, has lead Management to monitor deviations that might cause the non-compliance of covenants and may hinder renegotiation of liabilities (Note12). In order to maintain or adjust the capital structure, the Group may adjust the amount of dividends paidto shareholders, return capital to shareholders, issue new shares or sell assets to reduce debt. The Group monitors capital on the basis of the gearing ratio. This ratio is calculated as net debt
Less than 1-2 2-5 More than
1 year years years 5 years Total
At December 31, 2017
Other financial liabilities (except
for finance leases) 1,003,500 336,913 290,253 - 1,630,666
Finance leases 72,864 41,877 24,022 638 139,401
Bonds 109,746 148,986 353,349 1,272,647 1,884,728
Trade accounts payable 1,453,046 - - - 1,453,046
Accounts payable to related parties 55,174 25,954 - - 81,128
Other accounts payable 153,498 34,527 371,976 - 560,001
Other non-financial liabilities - 383 - - 383
2,847,828 588,640 1,039,600 1,273,285 5,749,353
At June 30, 2018
Other financial liabilities (except
for finance leases) 942,493 245,030 351,650 56,612 1,595,785
Finance leases 37,947 19,995 16,729 - 74,671
Bonds 108,670 150,378 354,037 1,222,246 1,835,331
Trade accounts payable 1,436,696 - - - 1,436,696
Accounts payable to related parties 60,122 22,069 - - 82,191
Other accounts payable 177,462 2,797 496,788 - 677,047
Other non-financial liabilities - 136 - - 136
2,763,390 440,405 1,219,204 1,278,858 5,701,857
- 9 -
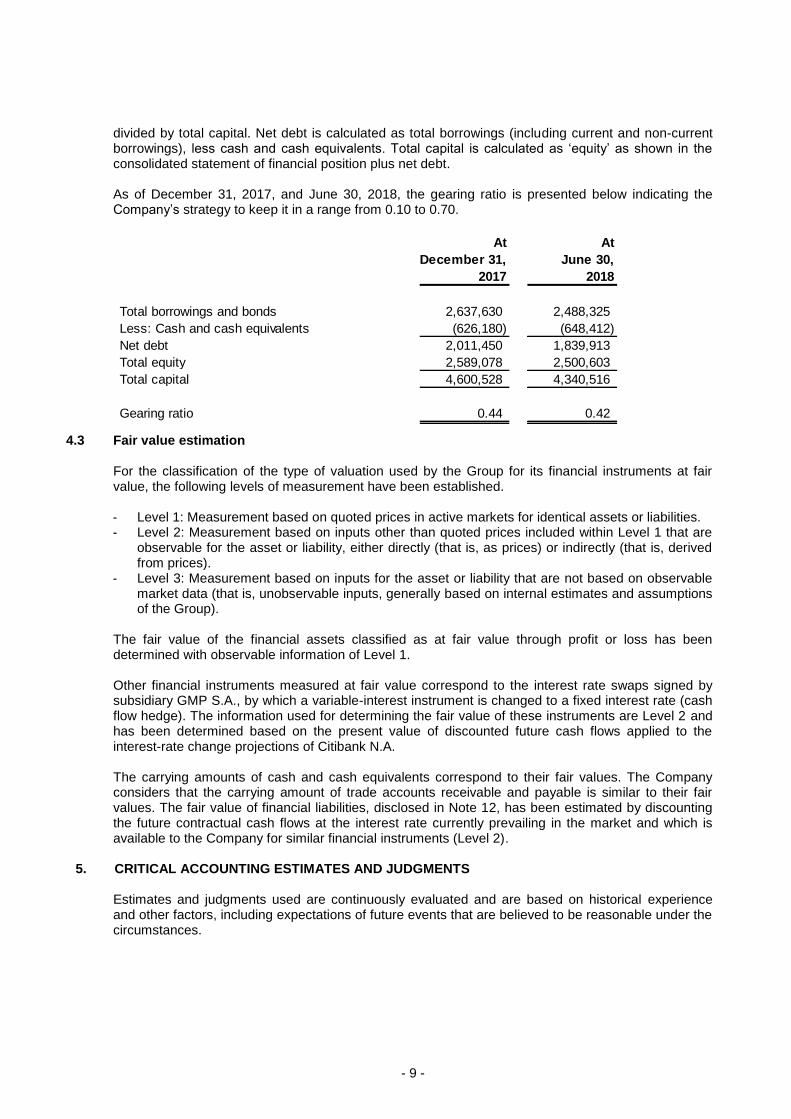
divided by total capital. Net debt is calculated as total borrowings (including current and non-current borrowings), less cash and cash equivalents. Total capital is calculated as ‘equity’ as shown in the consolidated statement of financial position plus net debt. As of December 31, 2017, and June 30, 2018, the gearing ratio is presented below indicating the Company’s strategy to keep it in a range from 0.10 to 0.70.
4.3 Fair value estimation
For the classification of the type of valuation used by the Group for its financial instruments at fair value, the following levels of measurement have been established. - Level 1: Measurement based on quoted prices in active markets for identical assets or liabilities. - Level 2: Measurement based on inputs other than quoted prices included within Level 1 that are
observable for the asset or liability, either directly (that is, as prices) or indirectly (that is, derived from prices).
- Level 3: Measurement based on inputs for the asset or liability that are not based on observable market data (that is, unobservable inputs, generally based on internal estimates and assumptions of the Group).
The fair value of the financial assets classified as at fair value through profit or loss has been determined with observable information of Level 1. Other financial instruments measured at fair value correspond to the interest rate swaps signed by subsidiary GMP S.A., by which a variable-interest instrument is changed to a fixed interest rate (cash flow hedge). The information used for determining the fair value of these instruments are Level 2 and has been determined based on the present value of discounted future cash flows applied to the interest-rate change projections of Citibank N.A. The carrying amounts of cash and cash equivalents correspond to their fair values. The Company considers that the carrying amount of trade accounts receivable and payable is similar to their fair values. The fair value of financial liabilities, disclosed in Note 12, has been estimated by discounting the future contractual cash flows at the interest rate currently prevailing in the market and which is available to the Company for similar financial instruments (Level 2).
CRITICAL ACCOUNTING ESTIMATES AND JUDGMENTS 5. Estimates and judgments used are continuously evaluated and are based on historical experience and other factors, including expectations of future events that are believed to be reasonable under the circumstances.
At At
December 31, June 30,
2017 2018
Total borrowings and bonds 2,637,630 2,488,325
Less: Cash and cash equivalents (626,180) (648,412)
Net debt 2,011,450 1,839,913
Total equity 2,589,078 2,500,603
Total capital 4,600,528 4,340,516
Gearing ratio 0.44 0.42
- 10 -
In preparing these condensed interim consolidated financial statements, the significant judgements made by management in applying the Group’s accounting policies and the key sources of uncertainty were the same as those that applied to the consolidated financial statements for the year ended December 31, 2017.
SEASONALITY OF OPERATIONS 6.
The Group shows no seasonality in the operations of any of its subsidiaries; operations are carried out regularly during the course of the period.
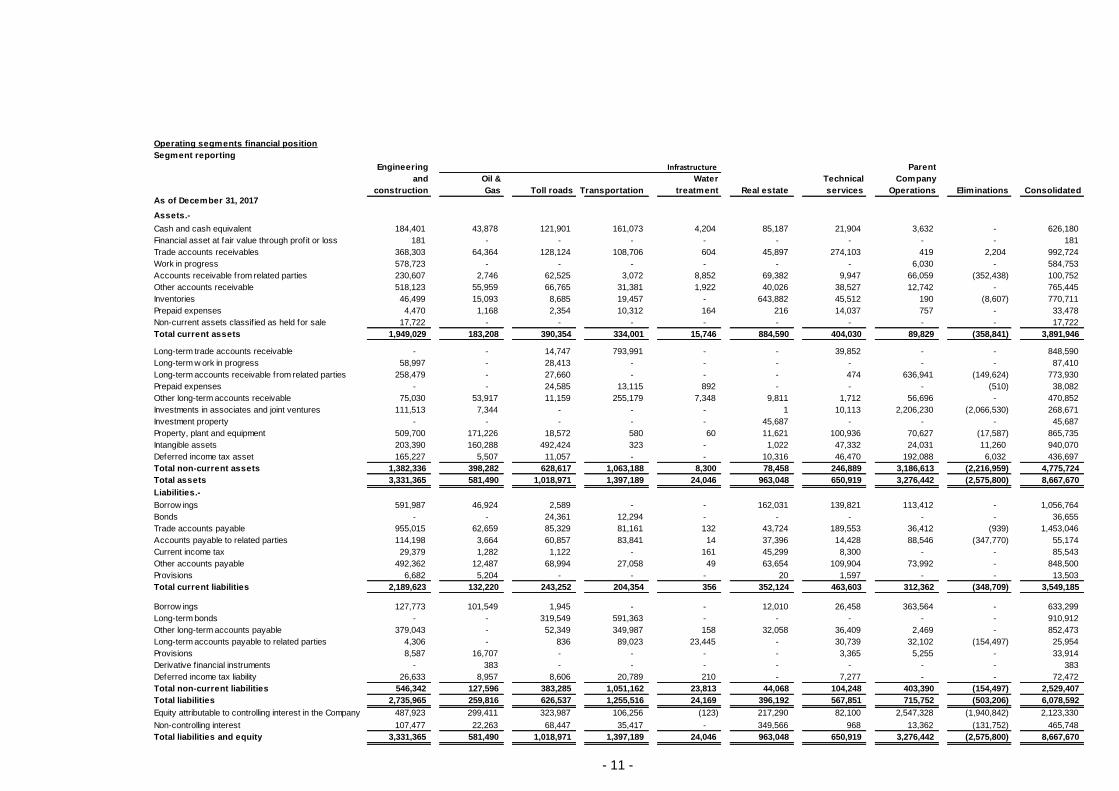
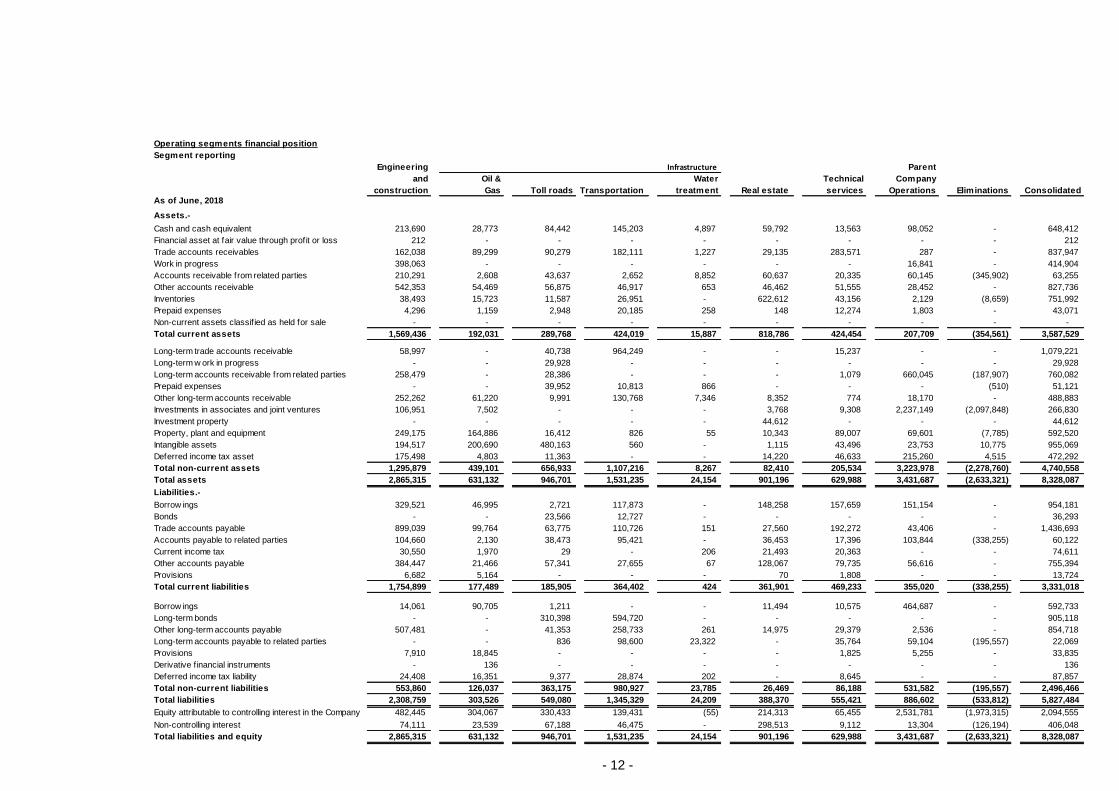
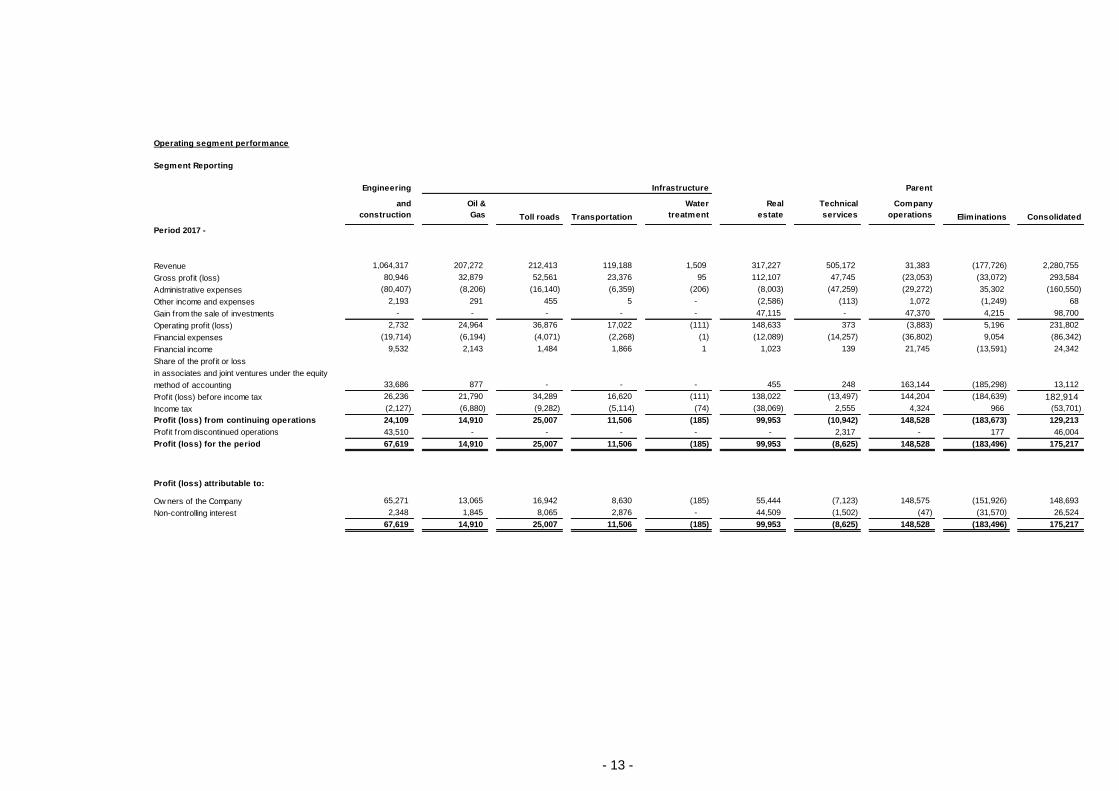
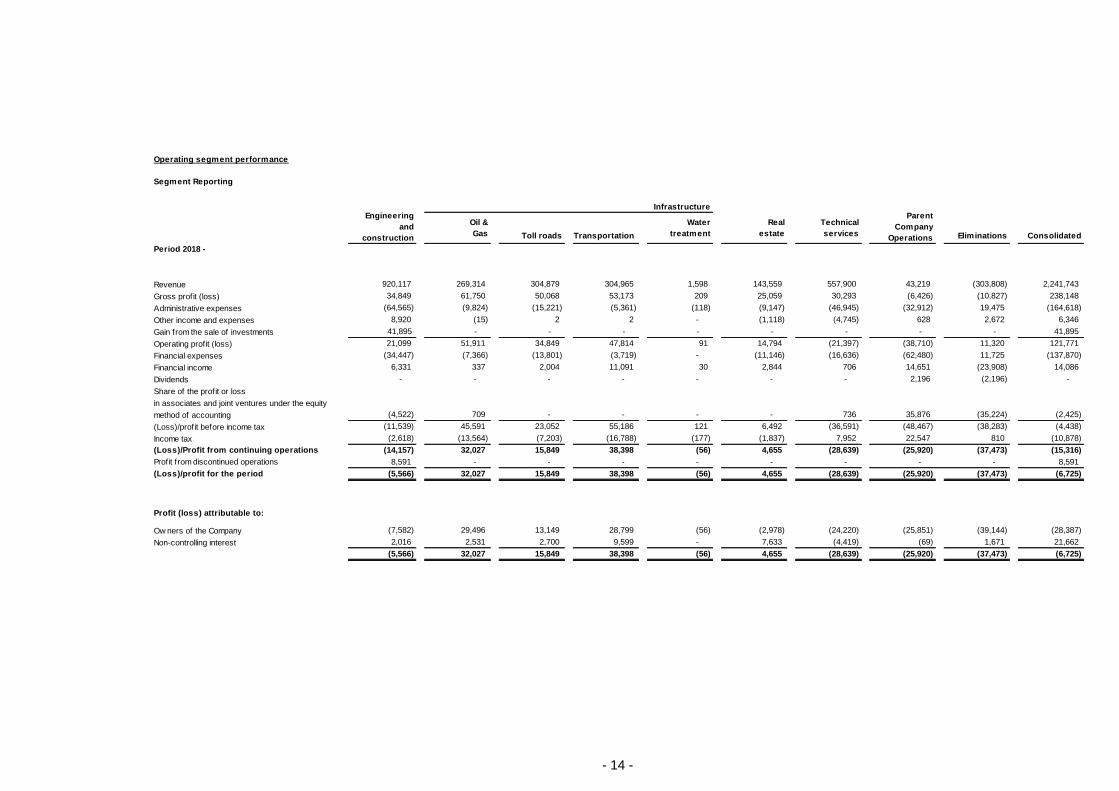
SEGMENT INFORMATION 7. Operating segments are reported consistently with the internal reports that are reviewed by the Group’ chief decision-maker; that is, the Executive Committee, which is led by the Chief Executive Officer. This Committee is responsible for allocating resources and evaluating the performance of each operating segment. The Group's operating segments are assessed by the activities of the following business units: (i) engineering and construction, (ii) infrastructure, (iii) real estate and (iv) technical services. As set forth under IFRS 8, reportable segments by significance of income are: ‘engineering and construction’ and ‘infraestructure’. However, the Group has voluntarily decided to report on all its operating segments as detailed in this Note. Inter-segmental sales transactions are entered into at prices that are similar to those that would have been agreed to with unrelated third parties. Revenues from external customers reported are measured in a manner consistent with the basis of preparation of the financial statements. Group sales and receivables are not concentrated on a few customers. There is no external customer that represents 10% or more of the Goup’s revenue. The table below shows the Group’s financial statements by operating segments:
No major changes occurred in total assets as compared to the amount stated in previous year-end financial statements.
There are no differences as compared to previous year-end financial statements based on segmentation or measurement of financial performance by segment.
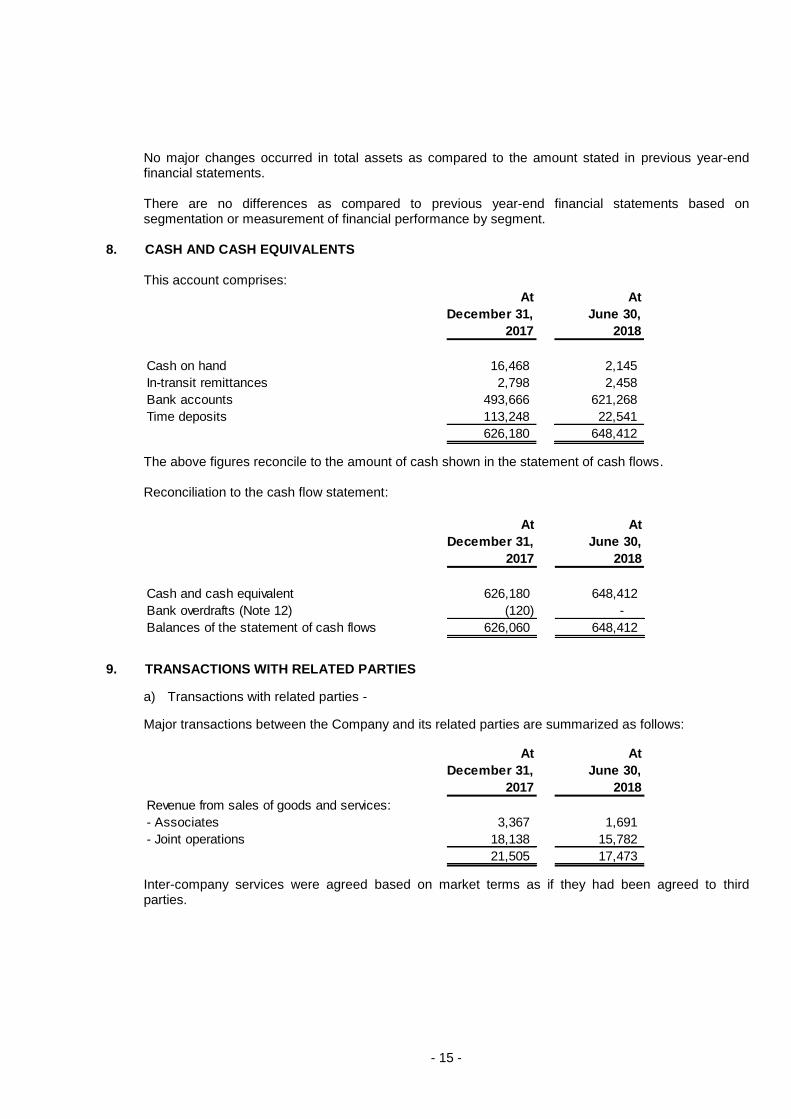
CASH AND CASH EQUIVALENTS 8. This account comprises:
The above figures reconcile to the amount of cash shown in the statement of cash flows. Reconciliation to the cash flow statement:
TRANSACTIONS WITH RELATED PARTIES 9.
a) Transactions with related parties -
Major transactions between the Company and its related parties are summarized as follows:
Inter-company services were agreed based on market terms as if they had been agreed to third parties.
At At
December 31, June 30,
2017 2018
Cash on hand 16,468 2,145
In-transit remittances ) 2,798 2,458
Bank accounts 493,666 621,268
Time deposits 113,248 22,541
626,180 648,412
At At
December 31, June 30,
2017 2018
Cash and cash equivalent 626,180 648,412
Bank overdrafts (Note 12) ) (120) -
Balances of the statement of cash flows 626,060 648,412
At At
December 31, June 30,
2017 2018
Revenue from sales of goods and services:
- Associates 3,367 1,691
- Joint operations 18,138 15,782
21,505 17,473
- 16 -
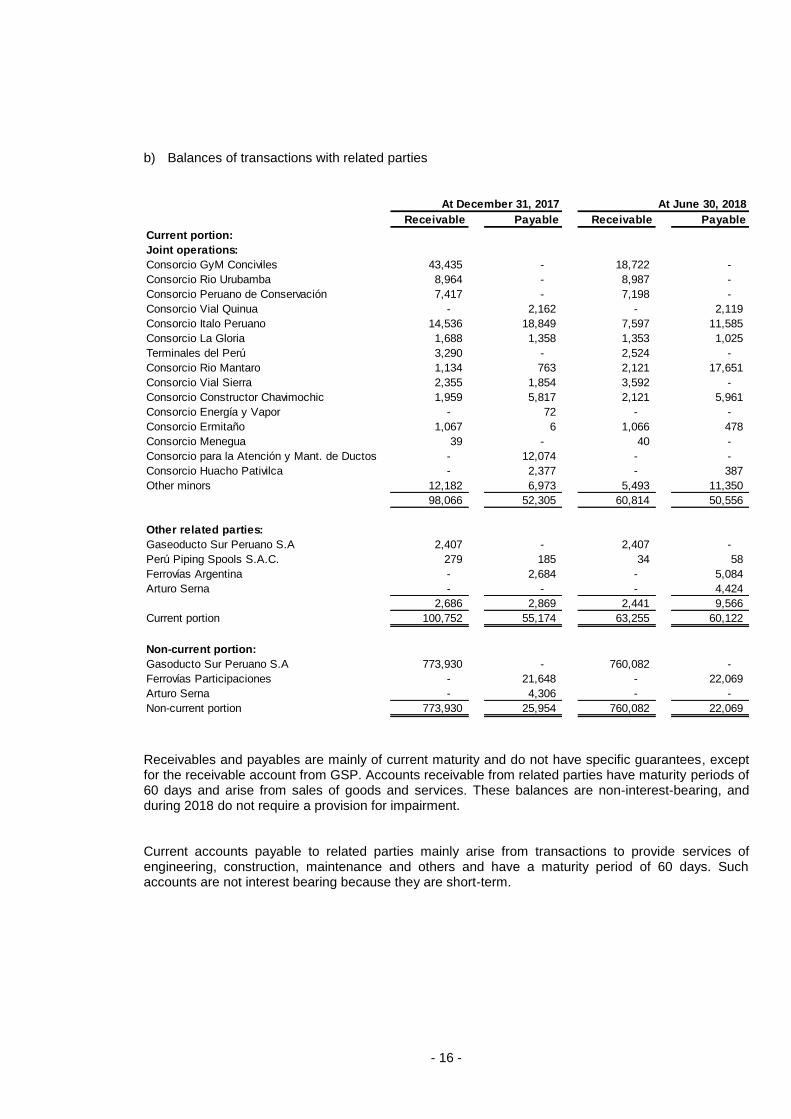
b) Balances of transactions with related parties
Receivables and payables are mainly of current maturity and do not have specific guarantees, except for the receivable account from GSP. Accounts receivable from related parties have maturity periods of 60 days and arise from sales of goods and services. These balances are non-interest-bearing, and during 2018 do not require a provision for impairment. Current accounts payable to related parties mainly arise from transactions to provide services of engineering, construction, maintenance and others and have a maturity period of 60 days. Such accounts are not interest bearing because they are short-term.
Al 30 de junio de 2018 At December 31, 2017 At June 30, 2018
Consorcio para la Atención y Mant. de Ductos - 12,074 - -
Consorcio Huacho Pativilca - 2,377 - 387
Other minors 12,182 6,973 5,493 11,350
98,066 52,305 60,814 50,556
Other related parties:
Gaseoducto Sur Peruano S.A 2,407 - 2,407 -
Perú Piping Spools S.A.C. 279 185 34 58
Ferrovías Argentina - 2,684 - 5,084
Arturo Serna - - - 4,424
2,686 2,869 2,441 9,566
Current portion 100,752 55,174 63,255 60,122
Non-current portion:
Gasoducto Sur Peruano S.A 773,930 - 760,082 -
Ferrovías Participaciones - 21,648 - 22,069
Arturo Serna - 4,306 - -
Non-current portion 773,930 25,954 760,082 22,069
- 17 -
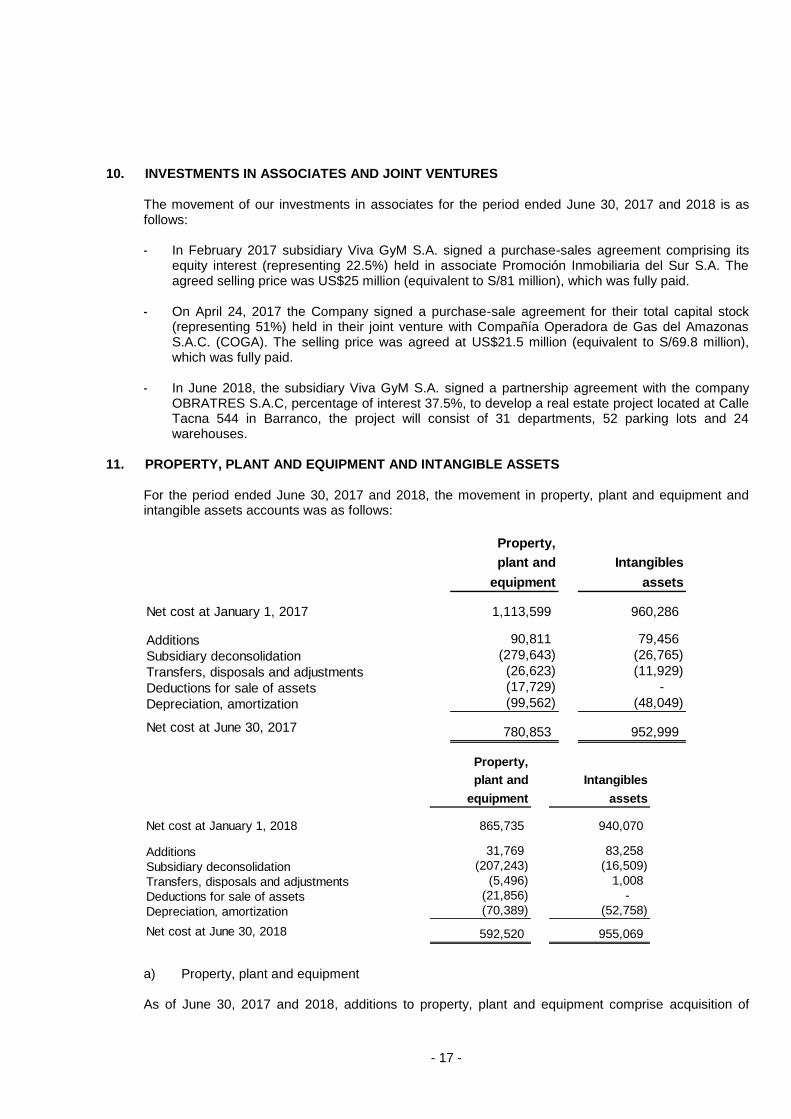
INVESTMENTS IN ASSOCIATES AND JOINT VENTURES 10.
The movement of our investments in associates for the period ended June 30, 2017 and 2018 is as follows: - In February 2017 subsidiary Viva GyM S.A. signed a purchase-sales agreement comprising its
equity interest (representing 22.5%) held in associate Promoción Inmobiliaria del Sur S.A. The agreed selling price was US$25 million (equivalent to S/81 million), which was fully paid.
- On April 24, 2017 the Company signed a purchase-sale agreement for their total capital stock
(representing 51%) held in their joint venture with Compañía Operadora de Gas del Amazonas S.A.C. (COGA). The selling price was agreed at US$21.5 million (equivalent to S/69.8 million), which was fully paid.
- In June 2018, the subsidiary Viva GyM S.A. signed a partnership agreement with the company
OBRATRES S.A.C, percentage of interest 37.5%, to develop a real estate project located at Calle Tacna 544 in Barranco, the project will consist of 31 departments, 52 parking lots and 24 warehouses.
PROPERTY, PLANT AND EQUIPMENT AND INTANGIBLE ASSETS 11.
For the period ended June 30, 2017 and 2018, the movement in property, plant and equipment and intangible assets accounts was as follows:
a) Property, plant and equipment As of June 30, 2017 and 2018, additions to property, plant and equipment comprise acquisition of
Property,
plant and Intangibles
equipment assets
Net cost at January 1, 2017 1,113,599 960,286
Additions 90,811 79,456
Subsidiary deconsolidation (279,643) (26,765)
Transfers, disposals and adjustments (26,623) (11,929)
Deductions for sale of assets (17,729) -
Depreciation, amortization (99,562) (48,049)
Net cost at June 30, 2017 780,853 952,999
Property,
plant and Intangibles
equipment assets
Net cost at January 1, 2018 865,735 940,070
Additions 31,769 83,258
Subsidiary deconsolidation (207,243) (16,509)
Transfers, disposals and adjustments (5,496) 1,008
Deductions for sale of assets (21,856) -
Depreciation, amortization (70,389) (52,758)
Net cost at June 30, 2018 592,520 955,069
- 18 -
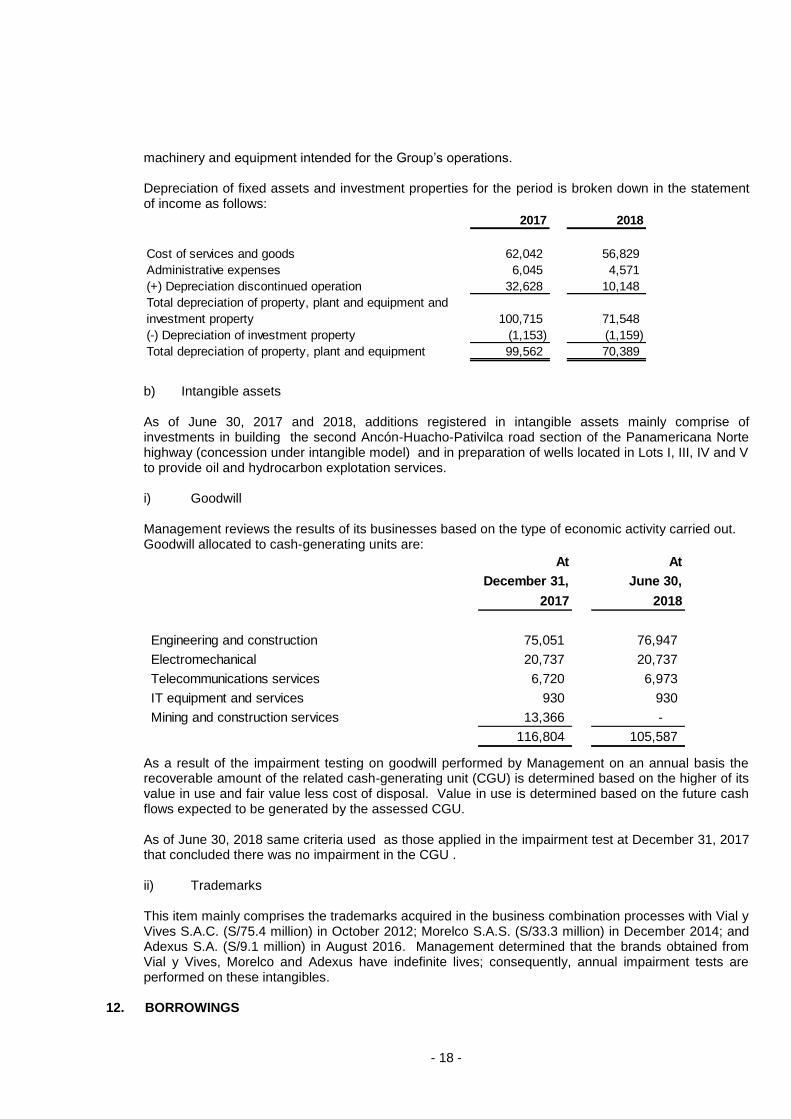
machinery and equipment intended for the Group’s operations. Depreciation of fixed assets and investment properties for the period is broken down in the statement of income as follows:
b) Intangible assets As of June 30, 2017 and 2018, additions registered in intangible assets mainly comprise of investments in building the second Ancón-Huacho-Pativilca road section of the Panamericana Norte highway (concession under intangible model) and in preparation of wells located in Lots I, III, IV and V to provide oil and hydrocarbon explotation services. i) Goodwill Management reviews the results of its businesses based on the type of economic activity carried out. Goodwill allocated to cash-generating units are:
As a result of the impairment testing on goodwill performed by Management on an annual basis the recoverable amount of the related cash-generating unit (CGU) is determined based on the higher of its value in use and fair value less cost of disposal. Value in use is determined based on the future cash flows expected to be generated by the assessed CGU. As of June 30, 2018 same criteria used as those applied in the impairment test at December 31, 2017 that concluded there was no impairment in the CGU . ii) Trademarks This item mainly comprises the trademarks acquired in the business combination processes with Vial y Vives S.A.C. (S/75.4 million) in October 2012; Morelco S.A.S. (S/33.3 million) in December 2014; and Adexus S.A. (S/9.1 million) in August 2016. Management determined that the brands obtained from Vial y Vives, Morelco and Adexus have indefinite lives; consequently, annual impairment tests are performed on these intangibles.
Total depreciation of property, plant and equipment and
investment property 100,715 71,548
(-) Depreciation of investment property (1,153) (1,159)
Total depreciation of property, plant and equipment 99,562 70,389
At At
December 31, June 30,
2017 2018
Engineering and construction 75,051 76,947
Electromechanical 20,737 20,737
Telecommunications services 6,720 6,973
IT equipment and services 930 930
Mining and construction services 13,366 -
116,804 105,587
- 19 -
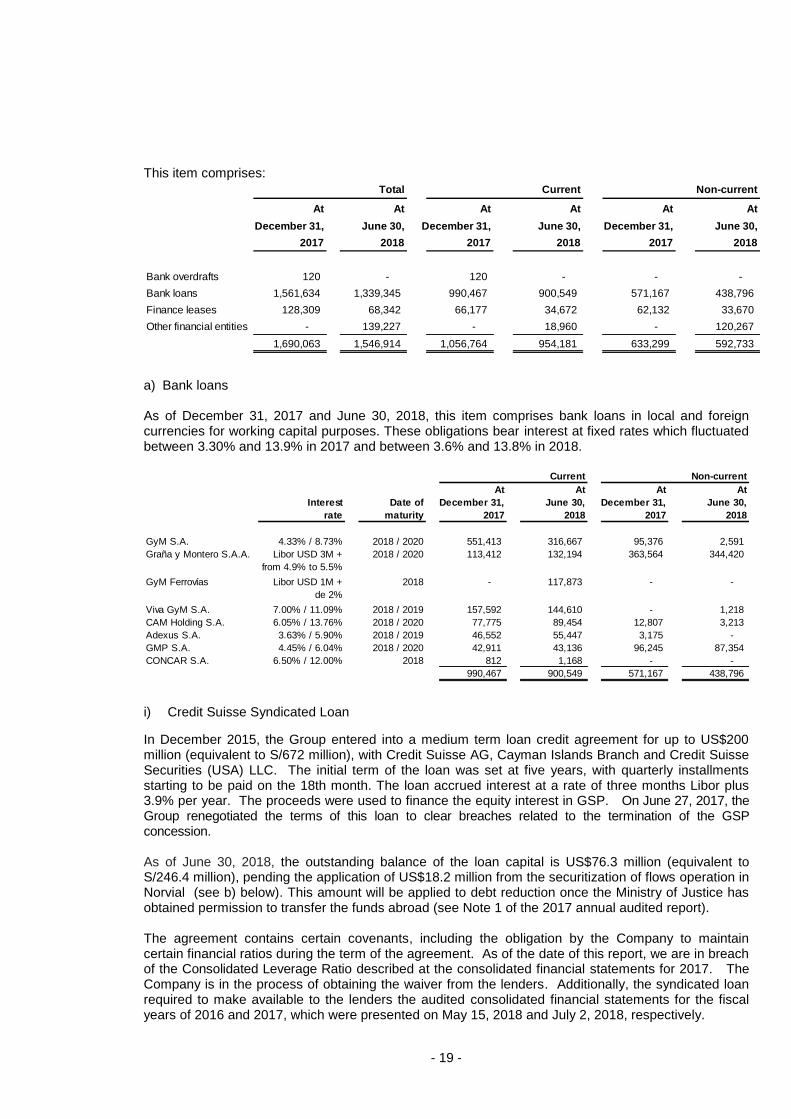
This item comprises:
a) Bank loans
As of December 31, 2017 and June 30, 2018, this item comprises bank loans in local and foreign currencies for working capital purposes. These obligations bear interest at fixed rates which fluctuated between 3.30% and 13.9% in 2017 and between 3.6% and 13.8% in 2018.
i) Credit Suisse Syndicated Loan
In December 2015, the Group entered into a medium term loan credit agreement for up to US$200 million (equivalent to S/672 million), with Credit Suisse AG, Cayman Islands Branch and Credit Suisse Securities (USA) LLC. The initial term of the loan was set at five years, with quarterly installments starting to be paid on the 18th month. The loan accrued interest at a rate of three months Libor plus 3.9% per year. The proceeds were used to finance the equity interest in GSP. On June 27, 2017, the Group renegotiated the terms of this loan to clear breaches related to the termination of the GSP concession. As of June 30, 2018, the outstanding balance of the loan capital is US$76.3 million (equivalent to S/246.4 million), pending the application of US$18.2 million from the securitization of flows operation in Norvial (see b) below). This amount will be applied to debt reduction once the Ministry of Justice has obtained permission to transfer the funds abroad (see Note 1 of the 2017 annual audited report). The agreement contains certain covenants, including the obligation by the Company to maintain certain financial ratios during the term of the agreement. As of the date of this report, we are in breach of the Consolidated Leverage Ratio described at the consolidated financial statements for 2017. The Company is in the process of obtaining the waiver from the lenders. Additionally, the syndicated loan required to make available to the lenders the audited consolidated financial statements for the fiscal years of 2016 and 2017, which were presented on May 15, 2018 and July 2, 2018, respectively.
At At At At At At
December 31, June 30, December 31, June 30, December 31, June 30,
2017 2018 2017 2018 2017 2018
Bank overdrafts 120 - - 120 - - - - -
Bank loans 1,561,634 1,339,345 990,467 900,549 571,167 438,796
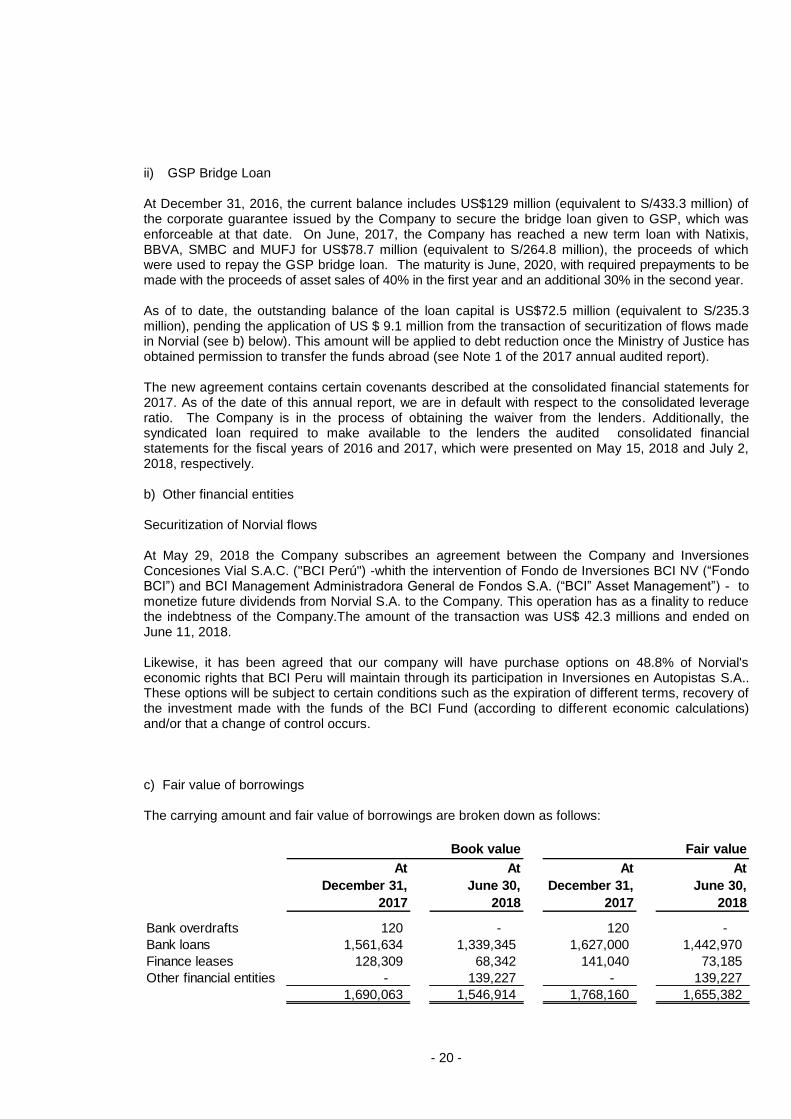
ii) GSP Bridge Loan At December 31, 2016, the current balance includes US$129 million (equivalent to S/433.3 million) of the corporate guarantee issued by the Company to secure the bridge loan given to GSP, which was enforceable at that date. On June, 2017, the Company has reached a new term loan with Natixis, BBVA, SMBC and MUFJ for US$78.7 million (equivalent to S/264.8 million), the proceeds of which were used to repay the GSP bridge loan. The maturity is June, 2020, with required prepayments to be made with the proceeds of asset sales of 40% in the first year and an additional 30% in the second year. As of to date, the outstanding balance of the loan capital is US$72.5 million (equivalent to S/235.3 million), pending the application of US $ 9.1 million from the transaction of securitization of flows made in Norvial (see b) below). This amount will be applied to debt reduction once the Ministry of Justice has obtained permission to transfer the funds abroad (see Note 1 of the 2017 annual audited report). The new agreement contains certain covenants described at the consolidated financial statements for 2017. As of the date of this annual report, we are in default with respect to the consolidated leverage ratio. The Company is in the process of obtaining the waiver from the lenders. Additionally, the syndicated loan required to make available to the lenders the audited consolidated financial statements for the fiscal years of 2016 and 2017, which were presented on May 15, 2018 and July 2, 2018, respectively. b) Other financial entities Securitization of Norvial flows At May 29, 2018 the Company subscribes an agreement between the Company and Inversiones Concesiones Vial S.A.C. ("BCI Perú") -whith the intervention of Fondo de Inversiones BCI NV (“Fondo BCI”) and BCI Management Administradora General de Fondos S.A. (“BCI” Asset Management”) - to monetize future dividends from Norvial S.A. to the Company. This operation has as a finality to reduce the indebtness of the Company.The amount of the transaction was US$ 42.3 millions and ended on June 11, 2018. Likewise, it has been agreed that our company will have purchase options on 48.8% of Norvial's economic rights that BCI Peru will maintain through its participation in Inversiones en Autopistas S.A.. These options will be subject to certain conditions such as the expiration of different terms, recovery of the investment made with the funds of the BCI Fund (according to different economic calculations) and/or that a change of control occurs. c) Fair value of borrowings The carrying amount and fair value of borrowings are broken down as follows:
At At At At
December 31, June 30, December 31, June 30,
2017 2018 2017 2018
Bank overdrafts 120 - 120 -
Bank loans 1,561,634 1,339,345 -1,627,000 -1,442,970
Finance leases 128,309 68,342 141,040 73,185
Other financial entities - 139,227 - 139,227
1,690,063 1,546,914 1,768,160 1,655,382
Book value Fair value
- 21 -
As of June 30, 2018, the fair value is based on cash flows discounted using a rate based on the borrowing rate of 3.0% and 13.8% (2.4% and 13.8% in 2017). It should be noted that the interest rate used are those applicable and negotiated by each Company.
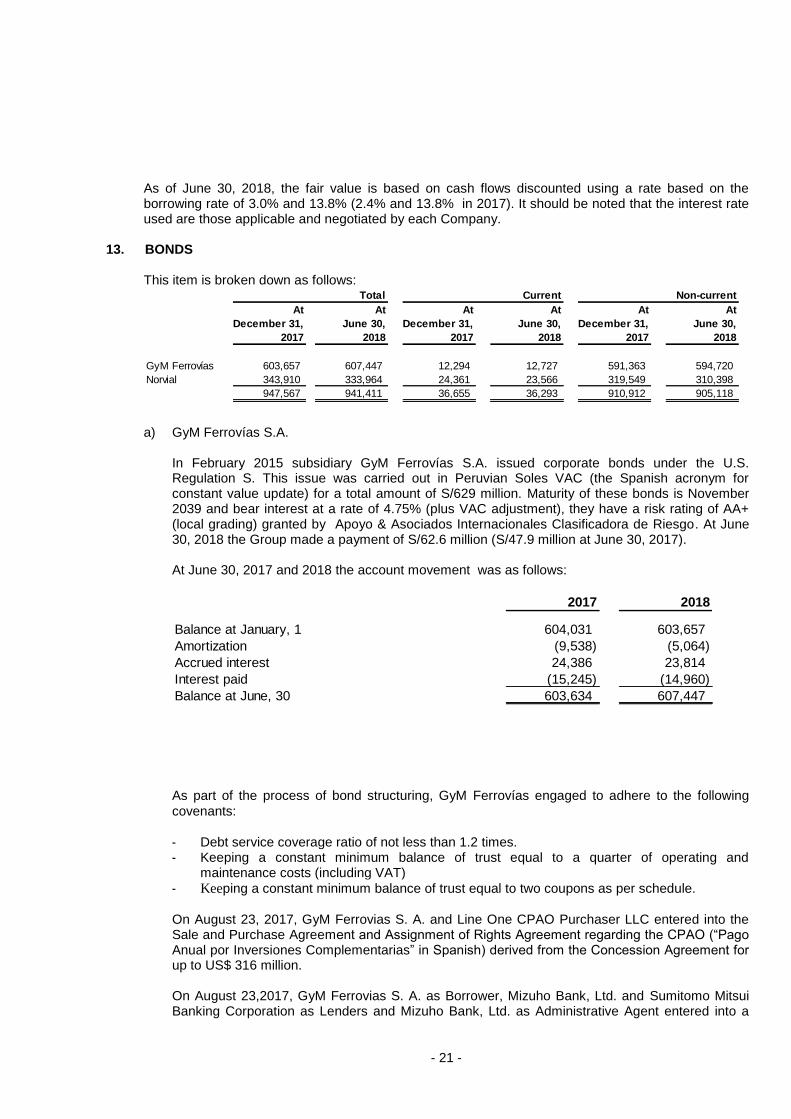
BONDS 13. This item is broken down as follows:
a) GyM Ferrovías S.A.
In February 2015 subsidiary GyM Ferrovías S.A. issued corporate bonds under the U.S. Regulation S. This issue was carried out in Peruvian Soles VAC (the Spanish acronym for constant value update) for a total amount of S/629 million. Maturity of these bonds is November 2039 and bear interest at a rate of 4.75% (plus VAC adjustment), they have a risk rating of AA+ (local grading) granted by Apoyo & Asociados Internacionales Clasificadora de Riesgo. At June 30, 2018 the Group made a payment of S/62.6 million (S/47.9 million at June 30, 2017). At June 30, 2017 and 2018 the account movement was as follows:
As part of the process of bond structuring, GyM Ferrovías engaged to adhere to the following
covenants:
- Debt service coverage ratio of not less than 1.2 times. - Keeping a constant minimum balance of trust equal to a quarter of operating and
maintenance costs (including VAT)
- Keeping a constant minimum balance of trust equal to two coupons as per schedule.
On August 23, 2017, GyM Ferrovias S. A. and Line One CPAO Purchaser LLC entered into the Sale and Purchase Agreement and Assignment of Rights Agreement regarding the CPAO (“Pago Anual por Inversiones Complementarias” in Spanish) derived from the Concession Agreement for up to US$ 316 million. On August 23,2017, GyM Ferrovias S. A. as Borrower, Mizuho Bank, Ltd. and Sumitomo Mitsui Banking Corporation as Lenders and Mizuho Bank, Ltd. as Administrative Agent entered into a
Total Current Non-current
At At At At At At
December 31, June 30, December 31, June 30, December 31, June 30,
US$80 million Working Capital loan agreement to partially finance the Expansion Project of Line 1 Lima Metro. As of June 30, 2018, US$36 million has been disbursed.
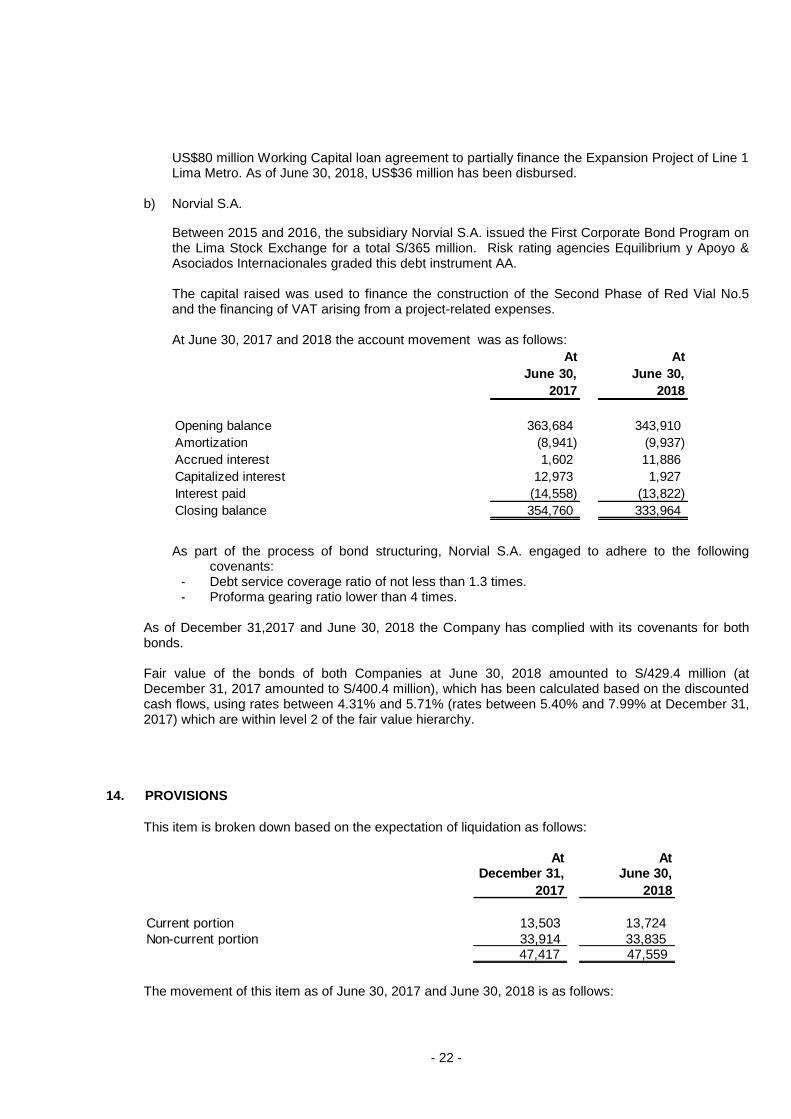
b) Norvial S.A.
Between 2015 and 2016, the subsidiary Norvial S.A. issued the First Corporate Bond Program on the Lima Stock Exchange for a total S/365 million. Risk rating agencies Equilibrium y Apoyo & Asociados Internacionales graded this debt instrument AA. The capital raised was used to finance the construction of the Second Phase of Red Vial No.5 and the financing of VAT arising from a project-related expenses. At June 30, 2017 and 2018 the account movement was as follows:
As part of the process of bond structuring, Norvial S.A. engaged to adhere to the following
covenants: - Debt service coverage ratio of not less than 1.3 times. - Proforma gearing ratio lower than 4 times.
As of December 31,2017 and June 30, 2018 the Company has complied with its covenants for both bonds. Fair value of the bonds of both Companies at June 30, 2018 amounted to S/429.4 million (at December 31, 2017 amounted to S/400.4 million), which has been calculated based on the discounted cash flows, using rates between 4.31% and 5.71% (rates between 5.40% and 7.99% at December 31, 2017) which are within level 2 of the fair value hierarchy.
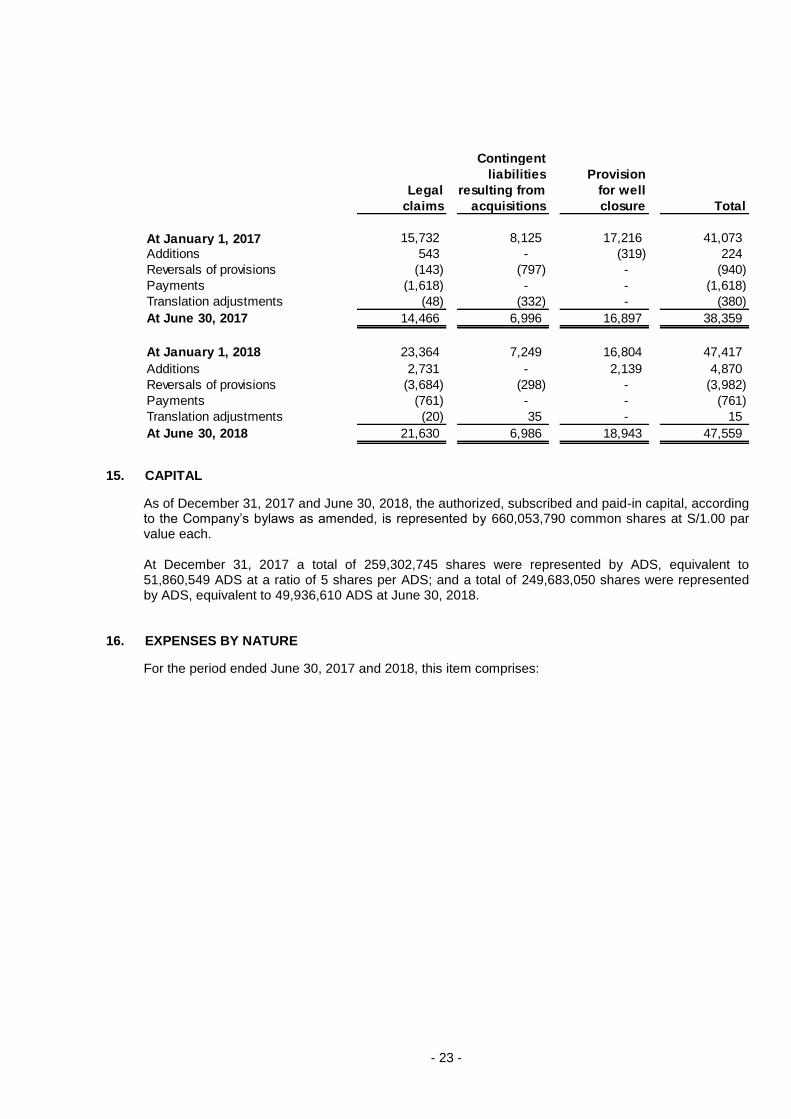
PROVISIONS 14.
This item is broken down based on the expectation of liquidation as follows:
The movement of this item as of June 30, 2017 and June 30, 2018 is as follows:
At At
June 30, June 30,
2017 2018
Opening balance 363,684 343,910
Amortization (8,941) (9,937)
Accrued interest 1,602 11,886
Capitalized interest 12,973 1,927
Interest paid (14,558) (13,822)
Closing balance 354,760 333,964
At AtDecember 31, June 30,
2017 2018
Current portion 13,503 13,724
Non-current portion 33,914 33,835 47,417 47,559
- 23 -
CAPITAL 15.
As of December 31, 2017 and June 30, 2018, the authorized, subscribed and paid-in capital, according to the Company’s bylaws as amended, is represented by 660,053,790 common shares at S/1.00 par value each. At December 31, 2017 a total of 259,302,745 shares were represented by ADS, equivalent to 51,860,549 ADS at a ratio of 5 shares per ADS; and a total of 249,683,050 shares were represented by ADS, equivalent to 49,936,610 ADS at June 30, 2018.
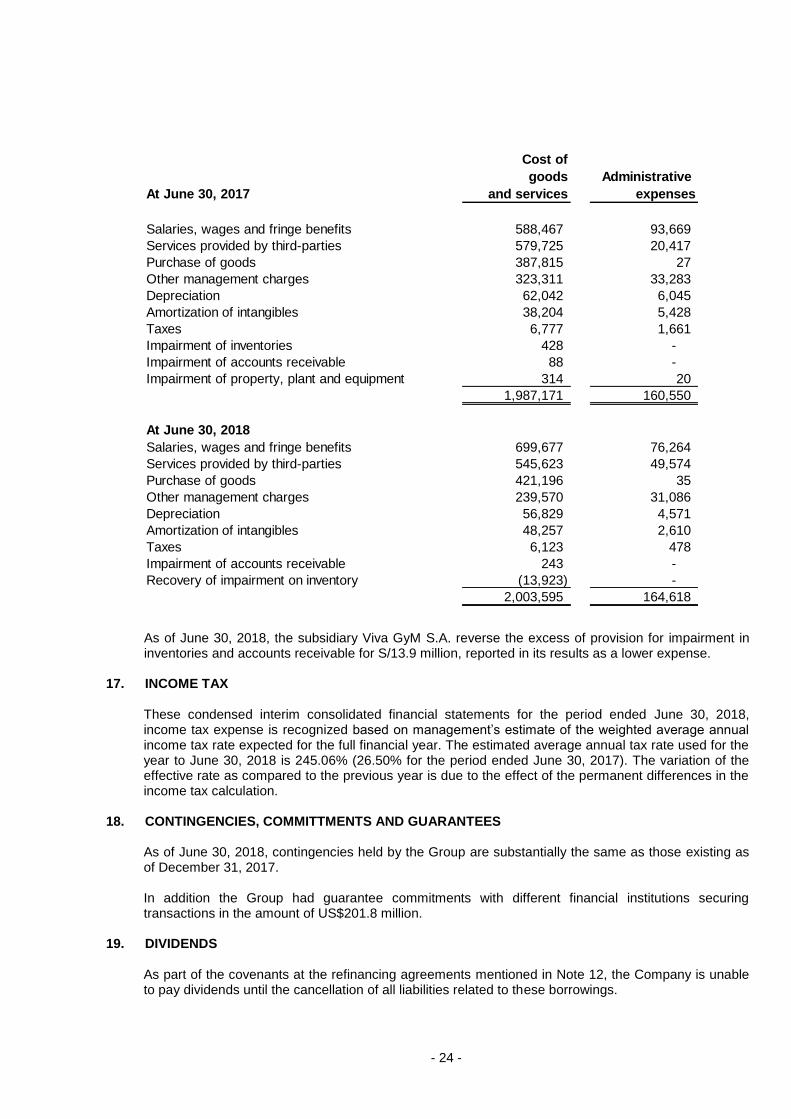
EXPENSES BY NATURE 16.
For the period ended June 30, 2017 and 2018, this item comprises:
Contingent
liabilities Provision
Legal resulting from for well
claims acquisitions closure Total
At January 1, 2017 15,732 8,125 17,216 41,073
Additions 543 - (319) 224
Reversals of provisions (143) (797) - (940)
Payments (1,618) - - (1,618)
Translation adjustments (48) (332) - (380)
At June 30, 2017 14,466 6,996 16,897 38,359
At January 1, 2018 23,364 7,249 16,804 47,417
Additions 2,731 - 2,139 4,870
Reversals of provisions (3,684) (298) - (3,982)
Payments (761) - - (761)
Translation adjustments (20) 35 - 15
At June 30, 2018 21,630 6,986 18,943 47,559
- 24 -
As of June 30, 2018, the subsidiary Viva GyM S.A. reverse the excess of provision for impairment in inventories and accounts receivable for S/13.9 million, reported in its results as a lower expense.
INCOME TAX 17. These condensed interim consolidated financial statements for the period ended June 30, 2018, income tax expense is recognized based on management’s estimate of the weighted average annual income tax rate expected for the full financial year. The estimated average annual tax rate used for the year to June 30, 2018 is 245.06% (26.50% for the period ended June 30, 2017). The variation of the effective rate as compared to the previous year is due to the effect of the permanent differences in the income tax calculation.
CONTINGENCIES, COMMITTMENTS AND GUARANTEES 18. As of June 30, 2018, contingencies held by the Group are substantially the same as those existing as of December 31, 2017. In addition the Group had guarantee commitments with different financial institutions securing transactions in the amount of US$201.8 million.
DIVIDENDS 19. As part of the covenants at the refinancing agreements mentioned in Note 12, the Company is unable to pay dividends until the cancellation of all liabilities related to these borrowings.
Cost of
goods Administrative
At June 30, 2017 and services expenses
Salaries, wages and fringe benefits 588,467 93,669
Services provided by third-parties 579,725 20,417
Purchase of goods 387,815 27
Other management charges 323,311 33,283
Depreciation 62,042 6,045
Amortization of intangibles 38,204 5,428
Taxes 6,777 1,661
Impairment of inventories 428 -
Impairment of accounts receivable 88 -
Impairment of property, plant and equipment 314 20
1,987,171 160,550
At June 30, 2018
Salaries, wages and fringe benefits 699,677 76,264
Services provided by third-parties 545,623 49,574
Purchase of goods 421,196 35
Other management charges 239,570 31,086
Depreciation 56,829 4,571
Amortization of intangibles 48,257 2,610
Taxes 6,123 478
Impairment of accounts receivable 243 -
Recovery of impairment on inventory (13,923) -
2,003,595 164,618
- 25 -
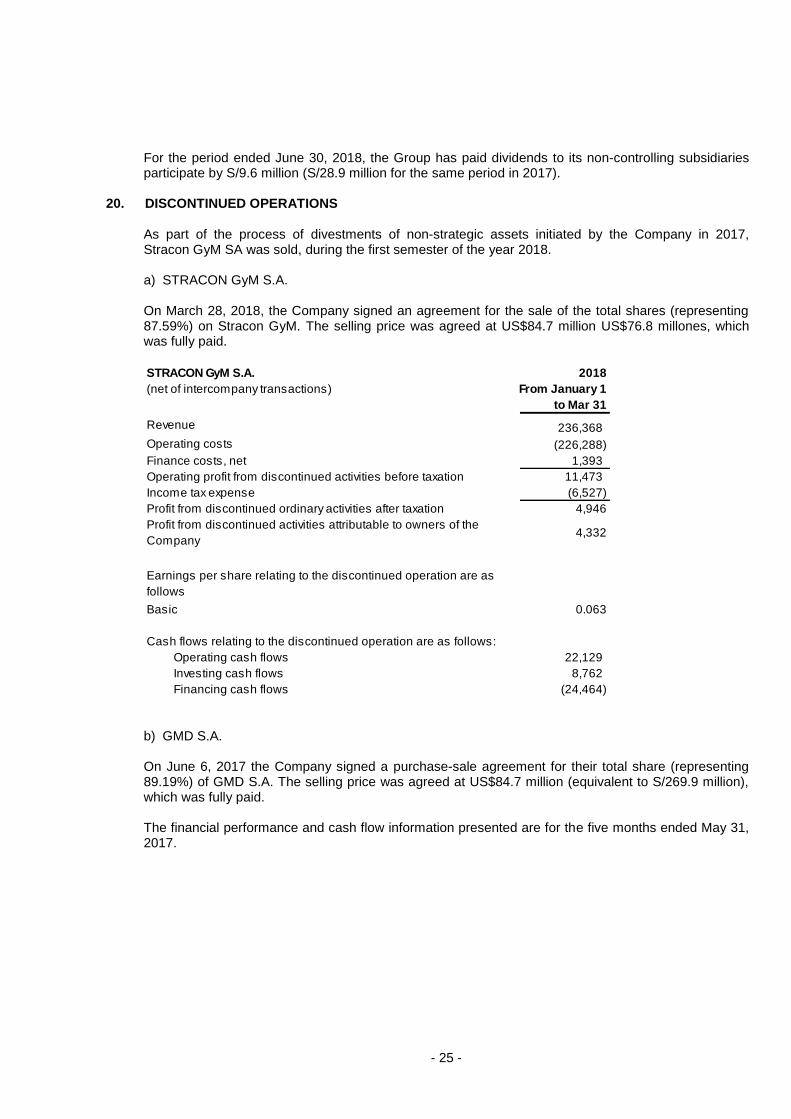
For the period ended June 30, 2018, the Group has paid dividends to its non-controlling subsidiaries participate by S/9.6 million (S/28.9 million for the same period in 2017).
DISCONTINUED OPERATIONS 20.
As part of the process of divestments of non-strategic assets initiated by the Company in 2017, Stracon GyM SA was sold, during the first semester of the year 2018. a) STRACON GyM S.A. On March 28, 2018, the Company signed an agreement for the sale of the total shares (representing 87.59%) on Stracon GyM. The selling price was agreed at US$84.7 million US$76.8 millones, which was fully paid.
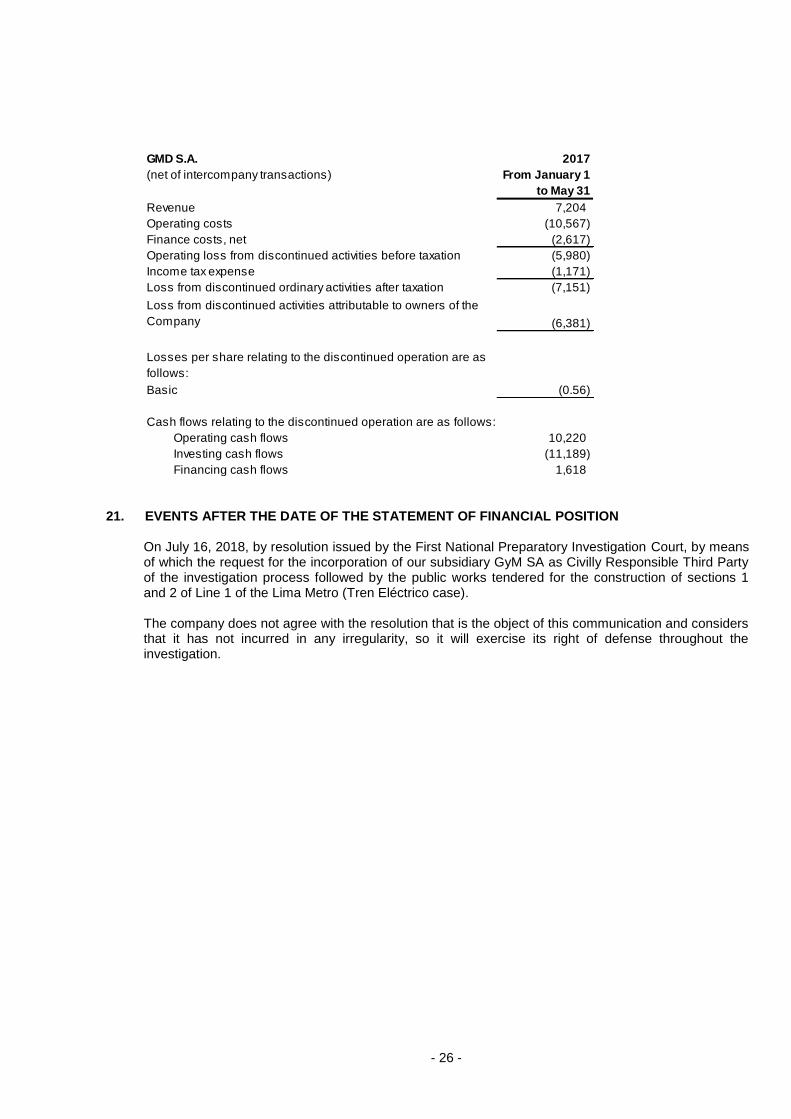
b) GMD S.A. On June 6, 2017 the Company signed a purchase-sale agreement for their total share (representing 89.19%) of GMD S.A. The selling price was agreed at US$84.7 million (equivalent to S/269.9 million), which was fully paid. The financial performance and cash flow information presented are for the five months ended May 31, 2017.
STRACON GyM S.A. 2018
(net of intercompany transactions) From January 1
to Mar 31
Revenue 236,368
Operating costs (226,288)
Finance costs, net 1,393
Operating profit from discontinued activities before taxation 11,473
Income tax expense (6,527)
Profit from discontinued ordinary activities after taxation 4,946
Profit from discontinued activities attributable to owners of the
Company 4,332
Earnings per share relating to the discontinued operation are as
follows
Basic 0.063
Cash flows relating to the discontinued operation are as follows:
Operating cash flows 22,129
Investing cash flows 8,762
Financing cash flows (24,464)
- 26 -
EVENTS AFTER THE DATE OF THE STATEMENT OF FINANCIAL POSITION 21. On July 16, 2018, by resolution issued by the First National Preparatory Investigation Court, by means of which the request for the incorporation of our subsidiary GyM SA as Civilly Responsible Third Party of the investigation process followed by the public works tendered for the construction of sections 1 and 2 of Line 1 of the Lima Metro (Tren Eléctrico case). The company does not agree with the resolution that is the object of this communication and considers that it has not incurred in any irregularity, so it will exercise its right of defense throughout the investigation.
GMD S.A. 2017
(net of intercompany transactions) From January 1
to May 31
Revenue 7,204
Operating costs (10,567)
Finance costs, net (2,617)
Operating loss from discontinued activities before taxation (5,980)
Income tax expense (1,171)
Loss from discontinued ordinary activities after taxation (7,151)
Loss from discontinued activities attributable to owners of the
Company (6,381)
Losses per share relating to the discontinued operation are as
follows:
Basic (0.56)
Cash flows relating to the discontinued operation are as follows: