This paper was presented at the 7th International Conference on Applied Energy (ICAE2015), March 28-31, 2015, Abu Dhabi, UAE (Original paper title: " Preliminary optical, thermal and structural design of a 100 kWth CSPonD beam-down on-sun demonstration plant” and Paper No.: 630)
Preliminary optical and thermal design of a 600 kWh direct 1
absorption molten salt receiver/storage system 2
Benjamin Grange a, *, Vikas Kumar a, Antoni Gil b, Miguel Diago a, Peter R. Armstrong a, 3 Alexander Slocum b, and Nicolas Calvet a 4
a Institute Center for Energy (iEnergy), Department of Mechanical and Materials Engineering, 5 Masdar Institute of Science and Technology, Masdar City, P.O. Box 54224, Abu Dhabi, United Arab Emirates. 6
b Department of Mechanical Engineering, Massachussets Institute of Technology, 7 77 Massachussets Ave, Cambridge, MA 02139, United States of America. 8
Concentrating solar power (CSP) systems that use thermal energy storage (TES) to provide dispatchability [1, 2, 3] 28 do so at costs much lower than than the costs of electro-chemical storage options currently available to make wind and 29 PV power dispatchable. Nevertheless, opportunities exist to further improve TES implementations in terms of transport 30 energy and heat exchanger exergy losses. To effect these improvements, a hot-tank volumetric receiver scheme that 31 requires a window on top of it to suppress convection losses was proposed [4]. The CSPonD single-tank molten salt 32 TES which also serves as a low-cost volumetric receiver was developed [5, 6]. To improve upon the natural thermocline 33 effect, an insulated divider plate is positioned within the tank to promote thermal stratification between hot and cold salt 34 volumes [7]. In contrast to conventional solar tower systems, the CSPonD receiver must be built on the ground 35 necessitating a hillside heliostat field [8] and hybrid cavity receiver design [9], or a beam-down optical system [10]. 36 One such system, the Masdar Institute Beam Down Optical Experiment (BDOE) is a 100 kWth demonstration plant that 37 was initially (2009-2011) operated to prove and gain experience with novel beam-down optical elements [11, 12]. To 38 achieve high concentration ratio with beam-down towers while reducing spillage and thermal losses, a CPC or final 39 optical element is essential. This element has already been investigated either with collimated beams with uniform 40 radiation [13, 14] or with non-symmetric input beam [15]. Several designs have been analyzed such as CPC 41 approximation and cone [15], polygonal or truncated CPC [16, 17]. However with the BDOE specific beam distribution 42 and the molten salt direct absorption receiver / TES tank on the ground, the optimization of the final optical element is 43 unique and needs to be carried out. In this paper we describe the design of a continuous 25 kWth CSPonD system using 44 the BDOE with modified optics as a source of concentrated radiation to test a 600 kWh directly irradiated molten salt 45 TES operating between 250ºC and 550ºC [18]. 46
47 48
* Corresponding author. Dr. Benjamin Grange. Tel.: +971-2810-9350; fax: +971-2810-9901; E-mail address: [email protected].
2.1. Heliostat field and central reflector description 50
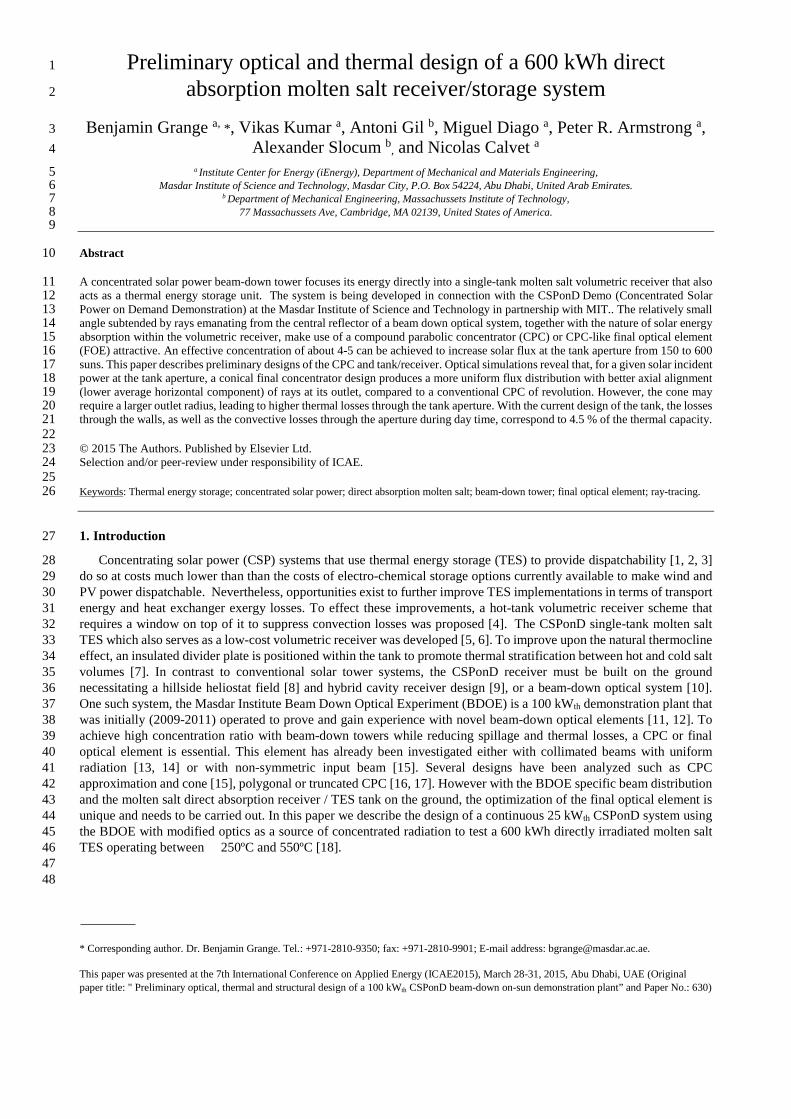
The BDOE heliostat field comprises 33 ganged-type heliostats each of 8.505 m2 reflector area representing a total 51 aperture area of 280.7 m2. Heliostats are arranged in three circles around the tower with an outer circle radius of 18 m. 52 Each heliostat comprises 42 individual mirror facets arranged in three banks presented in Fig. 1(a). The elevation and 53 azimuth angles are calculated to reflect the incident Direct Normal Irradiation (DNI) to a focal point above the top of 54 the tower (Fig. 2). A sun sensor aimed at the central facet of each heliostat provides reflected ray feedback for positioning 55 each heliostat such that the sun’s image as viewed from z = 20.3 m is always centred in the control mirror. 56 A central reflector (CR), mounted at 16 m on the central tower, provides a second optical stage consisting of three multi-57 faceted rings, as shown in Fig. 1(b). The rings of the CR correspond to the heliostats rings on the ground such that each 58 secondary mirror facet is used for a specific heliostat. The overall arrangement is shown in Fig. 1(c). 59
60
61 (a) (b) (c) 62
Fig. 1. Solar beam down components (a) typical heliostat [11]; (b) central reflectors, (c) view of central tower in heliostat field. 63
The CR facets, which are manually adjustable but stationary in operation, were initially canted so as to reflect 64 radiation to a solar receiver located 2 m above the ground directly below the CR as shown in Fig. 2. The receiver of the 65 original BDOE was a 16 ft x 16 ft (4.88 m x 4.88 m) projection screen comprising 256 white, near-lambertian ceramic 66 tiles, used for photogrammetric evaluation of the concentrated beam [19]. 67
68 Fig. 2. Schematic of Masdar Institute BDOE showing its essential dimensions and the projection screen used for flux mapping 69
2.2. Modification to CR and addition of 3rd optical stage 70
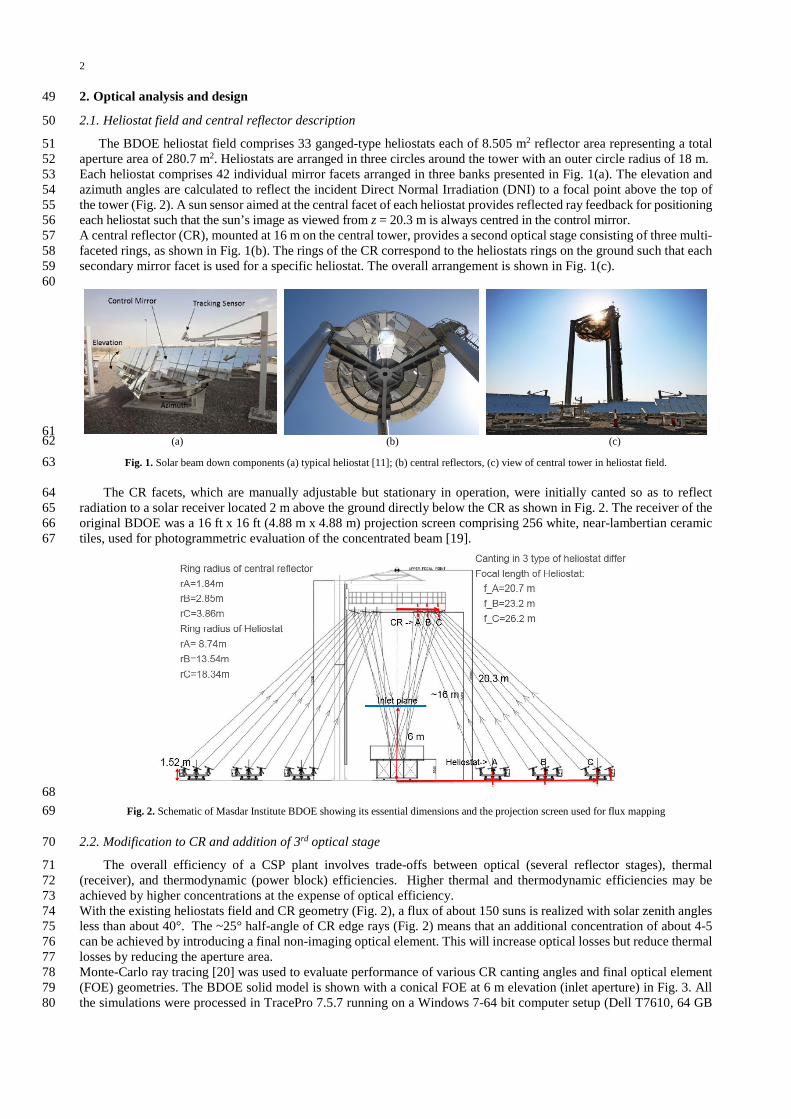
The overall efficiency of a CSP plant involves trade-offs between optical (several reflector stages), thermal 71 (receiver), and thermodynamic (power block) efficiencies. Higher thermal and thermodynamic efficiencies may be 72 achieved by higher concentrations at the expense of optical efficiency. 73 With the existing heliostats field and CR geometry (Fig. 2), a flux of about 150 suns is realized with solar zenith angles 74 less than about 40°. The ~25° half-angle of CR edge rays (Fig. 2) means that an additional concentration of about 4-5 75 can be achieved by introducing a final non-imaging optical element. This will increase optical losses but reduce thermal 76 losses by reducing the aperture area. 77 Monte-Carlo ray tracing [20] was used to evaluate performance of various CR canting angles and final optical element 78 (FOE) geometries. The BDOE solid model is shown with a conical FOE at 6 m elevation (inlet aperture) in Fig. 3. All 79 the simulations were processed in TracePro 7.5.7 running on a Windows 7-64 bit computer setup (Dell T7610, 64 GB 80
3
RAM, 2 Intel Xeon processors E5-2650 v2 at 2.60 GHz). The sun was modelled as a circular source of radius 30 m in 81 which the ray origins were arranged in 1420 concentric rings producing 6,044,941 rays. The solar angular profile was 82 included in the simulations. All HS and CR facets were modelled as perfectly flat mirrors. 83
(a)
(b)
(c)
Fig. 3. BDOE models (a) reflective and opaque surfaces; (b) reflective surfaces only; (c) CPC, cone and faceted cone 84
The CR mirrors shown in Figure 3 are canted more toward the z-axis than in Fig. 2 to produce maximum 85 concentration at a FOE inlet aperture raised from 2 m to 6 m. Elevation of the inlet aperture is a key parameter for 86 certain FOE geometries such as the compound parabolic concentrator (CPC) of revolution [21, 22]. For a CPC FOE, the 87 optimal CR cantings result in all 33 CR facet central reflected rays intersecting the z-axis at the inlet aperture plane. CR 88 canting also affects the angular distribution, as well as spatial distribution, of rays incident on the inlet plane. We consider 89 both surface-of-revolution FOE’s and their faceted counterparts as shown in Fig. 3c. 90
2.3. Optical simulation results for BDOE with different CR canting angles 91
The beam down optics are modelled in two steps. The heliostat field and CR are simulated first to produce a ray 92 vector file at an intermediate plane above the highest reasonable inlet aperture plane as shown at 6 m in Fig. 2. An 93 intermediate-plane ray vector file can be produced for any given sun position and CR canting. We define optical 94 efficiency of the heliostat-CR subsystem as 95
HF
FOEInoptical Q
Q
,=η (1) 96
where FOEInQ , is the power available at the inlet plane of the final optical element and HFQ is the incident power on 97
heliostats taken one by one without shading, to account for the overall cosine efficiency (cf. orange plot in Fig. 4) 98 according to: 99
( )33
1
cosHF HS ii
Q A DNI θ=
= ∑ (2) 100
where AHS is the reflective surface of a single heliostat, DNI is the Direct Normal Irradiance and θi is direct beam 101 incident angle on ith heliostat for the sun position in question. 102
Thus ηoptical accounts for shading, blocking, heliostat reflection loss, CR spillage, CR reflection loss, and FOE spillage. 103 With the FOE inlet situated 6 m above grade, the optical efficiency of the heliostat-CR subsystem varies from 77 % to 104 22 % depending mainly on the solar zenith angle. 105 The results of heliostat-CR ray-tracing simulations for zenith angles from 5° to 85° may be used to produce subsystem 106 efficiency curves like those shown in Fig. 4. 107
2.4. Optical simulation results for different FOE geometries 110
Final optical element efficiency is usually given as outlet power divided by inlet power. However, in the case of a 111 molten salt volume receiver, angular distribution of outlet flux has a significant impact on receiver “window” reflection 112 loss. It may also be important to consider uniformity of flux (areal distribution) over the outlet aperture. Results for the 113 21st of June at noon (DNI = 796 W/m2) and at 10 am (DNI = 724 W/m2), Figures 5 and 6, show that flux distributions 114 typically have good radial symmetry (θz = 1°) at noon but are slightly skewed (θz = 27°) at 10 am. 115
116
Fig. 5. Outlet aperture flux maps at noon June 21st for two final optical elements: CPC on left and conical FOE on right. 117
Fig. 6. Outlet aperture flux maps at 10am June 21st for two final optical elements: CPC on left and conical FOE on right. 118
0.2
0.3
0.4
0.5
0.6
0.7
0.8
0.9
1.0
0 10 20 30 40 50 60 70 80 90
Effic
ienc
y
Zenith Angle (degree)
Cosine Efficiency
Optical Efficiency
5
To ease the manufacture and the possible maintenance of the FOE, the optical performance of a 6 faceted conical 119 FOE was also investigated. Inlet and exit radii are defined to get the same inlet and exit areas as the conical FOE. Figures 120 7 and 8, show the flux distributions with a smaller colormap range. It is interesting that although a 6 faceted FOE is very 121 slightly less efficient, it produces a more uniform flux. 122
123
Fig. 7. Outlet aperture flux maps at noon June 21st for two final optical elements: conical FOE on left and 6 faceted conical FOE on right. 124 125
Fig. 8. Outlet aperture flux maps at 10 am June 21st for two final optical elements: conical FOE on left and 6 faceted conical FOE on right. 126 127
FOE ray-tracing results are summarized in terms of total flux in Table 1. The parameterizations of Fig. 4 and Table 128 1 enable hour-by-hour simulations and system-level optimal control with reasonable computational effort. 129
130 Table 1. Final optical element performance for a CPC and a cone 131
Monte-Carlo ray tracing produces millions of source rays with angular and spatial distributions determined by a 133 pseudo-random number algorithm. We use such a ray source to model the sun. Thus the outcome of a given simulation 134 depends on the number used to seed the random number generator. 135 A simulation at solar noon, June 21st, 2011, was repeated 35 times using different random number seeds. Both the total 136 power and maximum flux at the inlet of the CPC were determined and processed to obtain their mean values and 137 estimated standard deviations (confidence interval, CI = 65%). It was found that the total power reaching the CPC inlet 138 was 1.369×10⁵ ± 81.24 W and the maximum flux was 3.731×10⁵ ± 1.203×10⁴ W/m2. 139
3. TES tank design 140
3.1. Description of the TES system 141
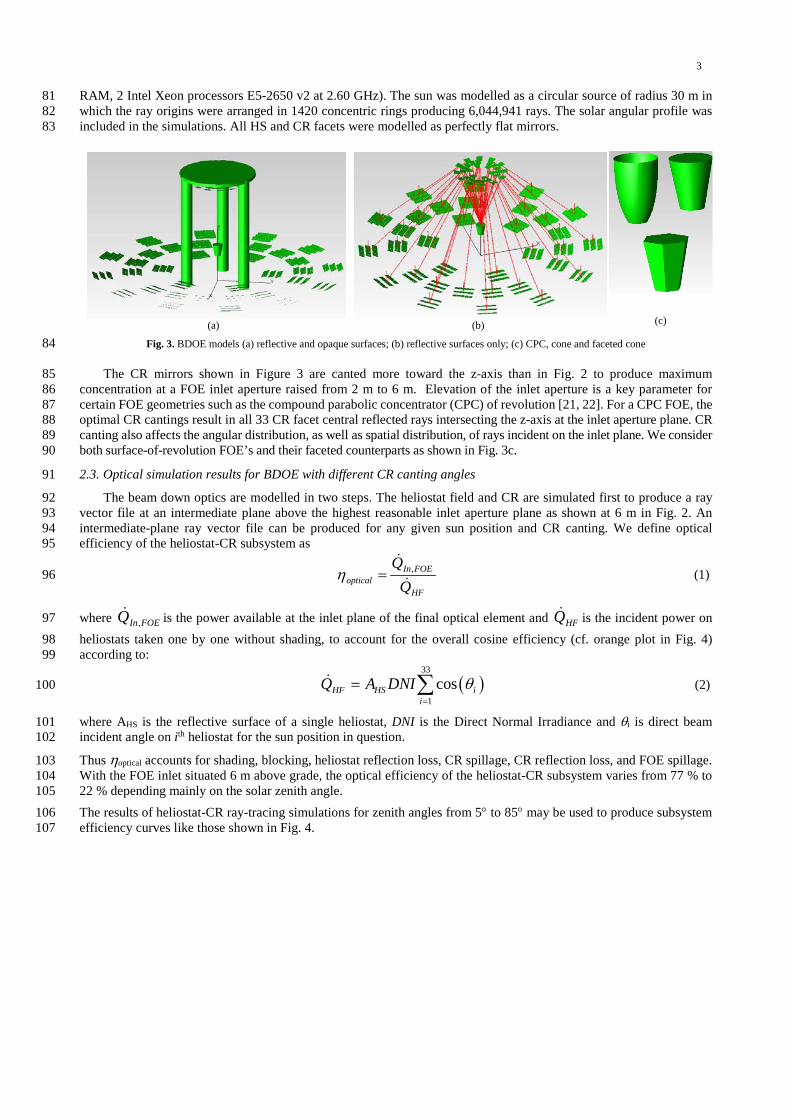
The TES system linked to the CPC is designed to store 400 kWh and allow a constant nominal power of 25 kW over 142 24 hours per day. During the day (charging period of 8 hours) the storage system is designed to generate 25 kW and 143 store the energy necessary to keep the system at full load operation during night (discharging period of 16 hours), 144 resulting in a total energy of 600 kWh. 145 The system consists of a SS316 cylindrical tank containing 2990 kg of Solar Salt (60 wt.% NaNO3 + 40 wt.% KNO3) 146 as storage material [23]. The salt is heated up from 250ºC to 550ºC by the solar incident power coming from the final 147 optical element (CPC or cone) of the BDOE. Figure 9 shows a scheme of the different parts of the system. 148 Dimensions of the TES tank (Figure 9.c) were defined according to criterion of thermocline tank design which 149 recommends an aspect ratio (Height/Diameter) around 1.5. In this case, since the thermocline effect will be enhanced 150 by the addition of an insulated divider plate inside the tank, this ratio was set to 1.55 (tank diameter of 1.25 m and height 151 of 1.94 m). The tank is surrounded by a safety tank to recover the possible salt leakage (Fig. 9f). 152
153 The tank cover (Fig. 9b) has a 0.9 m diameter aperture to allow the entrance of the solar incident power. In order to 154 avoid optical losses [23] and window damage due to dirt an open top container concept was implemented. The effect of 155 sand intrusion in the tank is under study in the framework of the project. 156 Wall thickness of 3 mm was selected as a compromise addressing both corrosion rates (estimated from Goods et al. [24]) 157 and energy leakage due to the thermal shortcut through the wall shell between the hot and cold salt volumes. 158
159
160 Fig. 9. Section of the FOE concept and the TES tank of the CSPonD2 concept: (a) FOE; (b) tank cover; (c) TES tank; (d) divider plate; (e) 161
insulation; (f) safety tank. 162 163
3.2. Operation mode description 164
At sunrise, the tank is completely discharged, mean salt temperature is 250ºC, and the divider plate is at its top of 165 tank position. During the charging period salts are heated to 550ºC while the divider plate moves down with a velocity 166 proportional to net energy accumulation within the tank. This displacement allows the increasing of the upper volume 167 occupied by the hot salts and the decreasing of the lower volume. Cold salts moves to the upper volume through the gap 168 between the divider plate and the tank wall. After 8 hours, the tank is completely charged and at sunset the aperture of 169 the tank is closed with an insulated cover to avoid convective and radiative losses. Then the off-sun discharging process 170 starts, moving the plate from bottom to top and allowing cold salts returning from the power block HX to enter through 171 the lower penetration of the tank. During both charging and discharging processes a salt design flow rate of 3.10-5 m3/s 172 is constantly sent to the power block heat exchanger through the upper penetration of the tank. 173
7
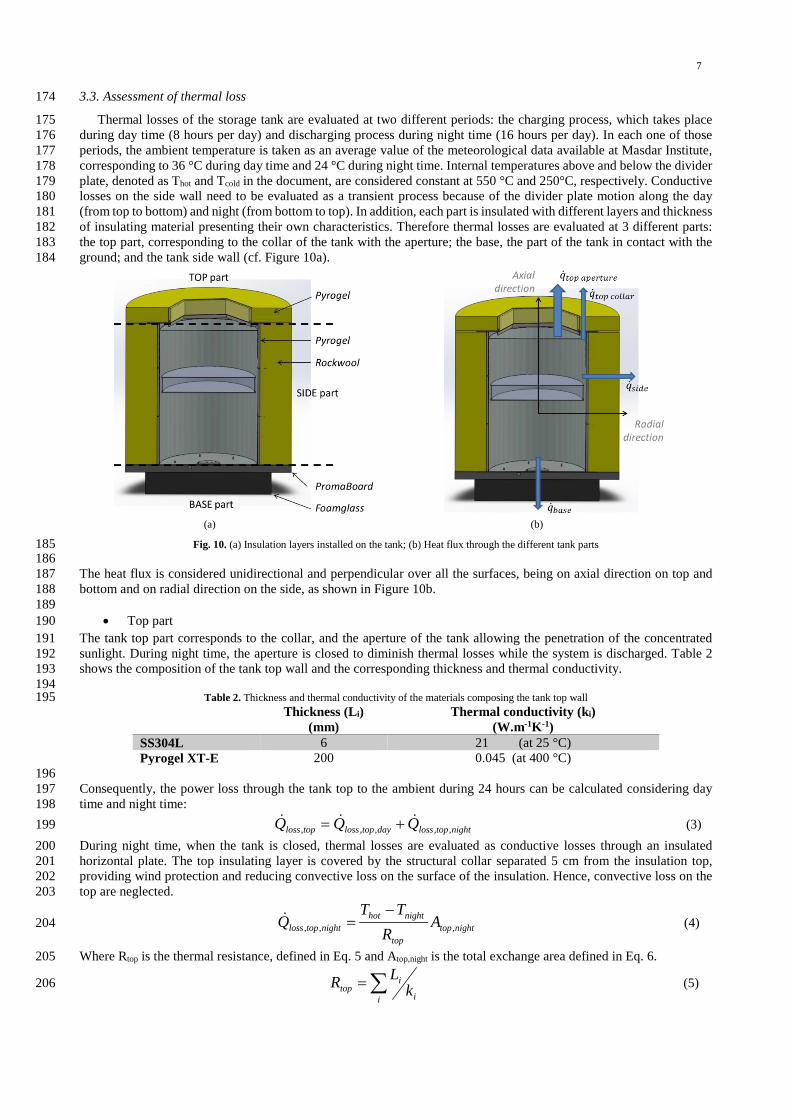
3.3. Assessment of thermal loss 174
Thermal losses of the storage tank are evaluated at two different periods: the charging process, which takes place 175 during day time (8 hours per day) and discharging process during night time (16 hours per day). In each one of those 176 periods, the ambient temperature is taken as an average value of the meteorological data available at Masdar Institute, 177 corresponding to 36 °C during day time and 24 °C during night time. Internal temperatures above and below the divider 178 plate, denoted as Thot and Tcold in the document, are considered constant at 550 °C and 250°C, respectively. Conductive 179 losses on the side wall need to be evaluated as a transient process because of the divider plate motion along the day 180 (from top to bottom) and night (from bottom to top). In addition, each part is insulated with different layers and thickness 181 of insulating material presenting their own characteristics. Therefore thermal losses are evaluated at 3 different parts: 182 the top part, corresponding to the collar of the tank with the aperture; the base, the part of the tank in contact with the 183 ground; and the tank side wall (cf. Figure 10a). 184
(a) (b)
Fig. 10. (a) Insulation layers installed on the tank; (b) Heat flux through the different tank parts 185 186
The heat flux is considered unidirectional and perpendicular over all the surfaces, being on axial direction on top and 187 bottom and on radial direction on the side, as shown in Figure 10b. 188 189
• Top part 190 The tank top part corresponds to the collar, and the aperture of the tank allowing the penetration of the concentrated 191 sunlight. During night time, the aperture is closed to diminish thermal losses while the system is discharged. Table 2 192 shows the composition of the tank top wall and the corresponding thickness and thermal conductivity. 193 194
Table 2. Thickness and thermal conductivity of the materials composing the tank top wall 195 Thickness (Li)
196 Consequently, the power loss through the tank top to the ambient during 24 hours can be calculated considering day 197 time and night time: 198 nighttoplossdaytoplosstoploss QQQ ,,,,,
+= (3) 199 During night time, when the tank is closed, thermal losses are evaluated as conductive losses through an insulated 200 horizontal plate. The top insulating layer is covered by the structural collar separated 5 cm from the insulation top, 201 providing wind protection and reducing convective loss on the surface of the insulation. Hence, convective loss on the 202 top are neglected. 203
nighttoptop
nighthotnighttoploss A
RTT
Q ,,,
−= (4) 204
Where Rtop is the thermal resistance, defined in Eq. 5 and Atop,night is the total exchange area defined in Eq. 6. 205
∑=i i
itop k
LR (5) 206
8
2
tan, 2.
= k
nighttopDA π (6) 207
During day time, the top part can be divided in two separated areas: the aperture without any insulation and the collar, 208 with the insulating layer described in Table 2. Then, the heat loss is defined as: 209
( )dayhotconvaperturecollartop
dayhotdaytoploss TThAA
RTT
Q −+−
= ...,, (7) 210
aperturekcollar AAA −= tan (8) 211 For this preliminary analysis, the convective losses through the aperture of the receiver are treated as losses through an 212 open cavity facing upward. The CPC is approximated as a 0.9 meter diameter and 1.85 meter high cylinder. The 213 convective losses occur at the salt surface located at the bottom of the cavity with surfacetemperature set to 550 °C. The 214 correlation of Leibfried and Ortjohann [25] is applied with an ambient temperature of 36 °C. A mean temperature 215 between the salt surface and the CPC walls of 400 °C is assumed to calculate the Grashof number. This correlation gives 216 a convective heat transfer coefficient of 8.2 Wm-2K-1. For these boundary conditions and cavity geometry the correlation 217 returns a convective loss from the salt surface of 21.3 kWh. The effective emissivity of a pool of molten salt is not 218 known however the upper bound based on ϵ = 1 is 60.5 Wm-2K-1 corresponding to energy loss during an 8-hour collection 219 period of 193.5 kWh. The minimum energy loss through the collar (not including thermal radiation) during charging 220 and discharging processes can be determined integrating thermal losses equations for each period, respectively (Eq. 4 221 and 7). The values obtained from the integration are shown in Table 3. 222 223
Table 3. Thermal loses through top part of the tank calculated for day time, night time and total 224 Energy loss during day (kWh) Energy loss during night (kWh) Conductive loss 0.55 2.32 Convective loss 21.3 n/a Total loss 24.17
225 • Base part 226
The tank is installed over two different insulating layers, as shown in Figure 11a. Table 4 shows the thickness and 227 thermal conductivity of each layer, including the tank base plate. 228 229
Table 4. Thickness and thermal conductivity of the materials composing the tank base 230 Thickness (Li)
231 The base is analysed as a flat plate with an inner salt temperature of 250 °C, while the ground temperature is set to 24 °C 232 during both night and day. Thermal losses through the base can be expressed as in Equation 13. 233
( )base
basenightdaycoldnightbaselossdaybaselossbaseloss R
ATTTQQQ .2,,,,, −−=+= (9) 234
Where Rbase is the thermal resistance at the base, similar to Equation 5 and Abase coincides with Atop,night (Eq. 6). 235 The total energy loss through the base can be easily calculated by integrating Equation 9 during 24 hours, and is equal 236 to 0.87 kWh. 237 238
• Side wall 239 The tank side wall is composed of the material layers listed in Table 5. 240 241
Table 5. Thickness and thermal conductivity of the materials composing the tank side wall 242
243 Thermal losses from the tank side wall vary as the divider plate moves during discharging and charging processes and 244 the relative exchange surface areas of the hot and cold salt parts change with time. Moreover thermal losses depend on 245
9
the external temperature which is different for day time and night time. Consequently, energy losses from the side wall 246 need to be calculated taking into account four main terms as shown in Equations 11 and 12. 247 nightsidelossdaysidelosssideloss QQQ ,,,,,
+= (10) 248
bottomdayside
daycold
topdayside
dayhotdaysideloss R
TTR
TTQ
,,,,,,
−+
−= (11) 249
bottomnightside
nightcold
topnightside
nighthotnightsideloss R
TTR
TTQ
,,,,,,
−+
−= (12) 250
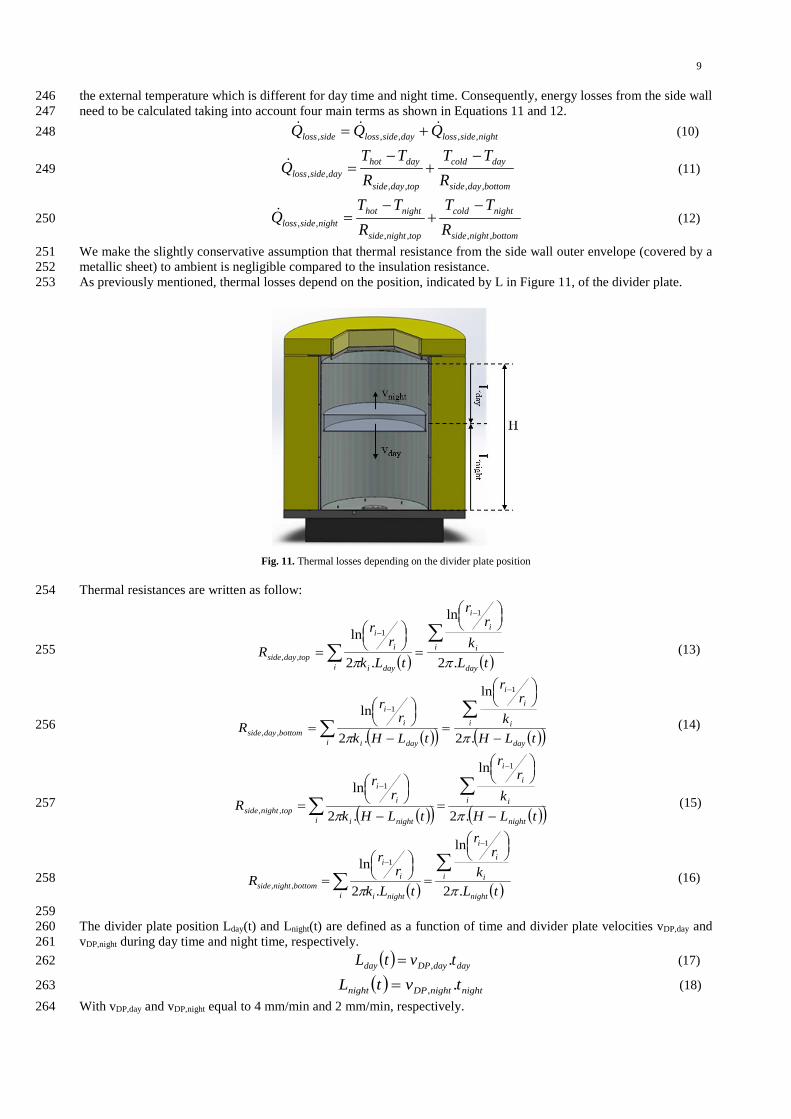
We make the slightly conservative assumption that thermal resistance from the side wall outer envelope (covered by a 251 metallic sheet) to ambient is negligible compared to the insulation resistance. 252 As previously mentioned, thermal losses depend on the position, indicated by L in Figure 11, of the divider plate. 253
Fig. 11. Thermal losses depending on the divider plate position
Thermal resistances are written as follow: 254
( ) ( )tL
kr
r
tLkr
r
Rday
i i
i
i
i dayi
i
i
topdayside .2
ln
.2
ln
1
1
,, ππ
∑∑
=
=
−
−
(13) 255
( )( ) ( )( )tLH
kr
r
tLHkr
r
Rday
i i
i
i
i dayi
i
i
bottomdayside −
=−
=∑
∑
−
−
.2
ln
.2
ln
1
1
,, ππ (14) 256
( )( ) ( )( )tLH
kr
r
tLHkr
r
Rnight
i i
i
i
i nighti
i
i
topnightside −
=−
=∑
∑
−
−
.2
ln
.2
ln
1
1
,, ππ (15) 257
( ) ( )tL
kr
r
tLkr
r
Rnight
i i
i
i
i nighti
i
i
bottomnightside .2
ln
.2
ln
1
1
,, ππ
∑∑
=
=
−
−
(16) 258
259 The divider plate position Lday(t) and Lnight(t) are defined as a function of time and divider plate velocities vDP,day and 260 vDP,night during day time and night time, respectively. 261 ( ) daydayDPday tvtL .,= (17) 262
( ) nightnightDPnight tvtL .,= (18) 263 With vDP,day and vDP,night equal to 4 mm/min and 2 mm/min, respectively. 264
10
The total energy loss during day time is calculated by integrating Equation 11 versus time, once Equations 13, 14 and 265 17 are included. 266
( ) ( ) ( ) ( )∫
∑
∫
∑
−
−+
−=
−−
8
0,
1
8
0,
1,, ..
ln
2..
ln
2daydaydayDP
i i
i
i
daycolddaydaydayDP
i i
i
i
dayhotdaysideloss dttvH
kr
rTT
dttv
kr
rTT
Eππ
(19) 267
The energy loss during night can be calculated with the same procedure, obtaining as final result Equation 20. 268 269
( ) ( ) ( ) ( )∫
∑
∫
∑
−+−
−=
−−
16
0,
1
16
0,
1,, ..
ln
2..
ln
2nightnightdayDP
i i
i
i
nightcoldnightnightnightDP
i i
i
i
nighthotdaysideloss dttv
kr
rTT
dttvH
kr
rTT
Eππ
(20) 270
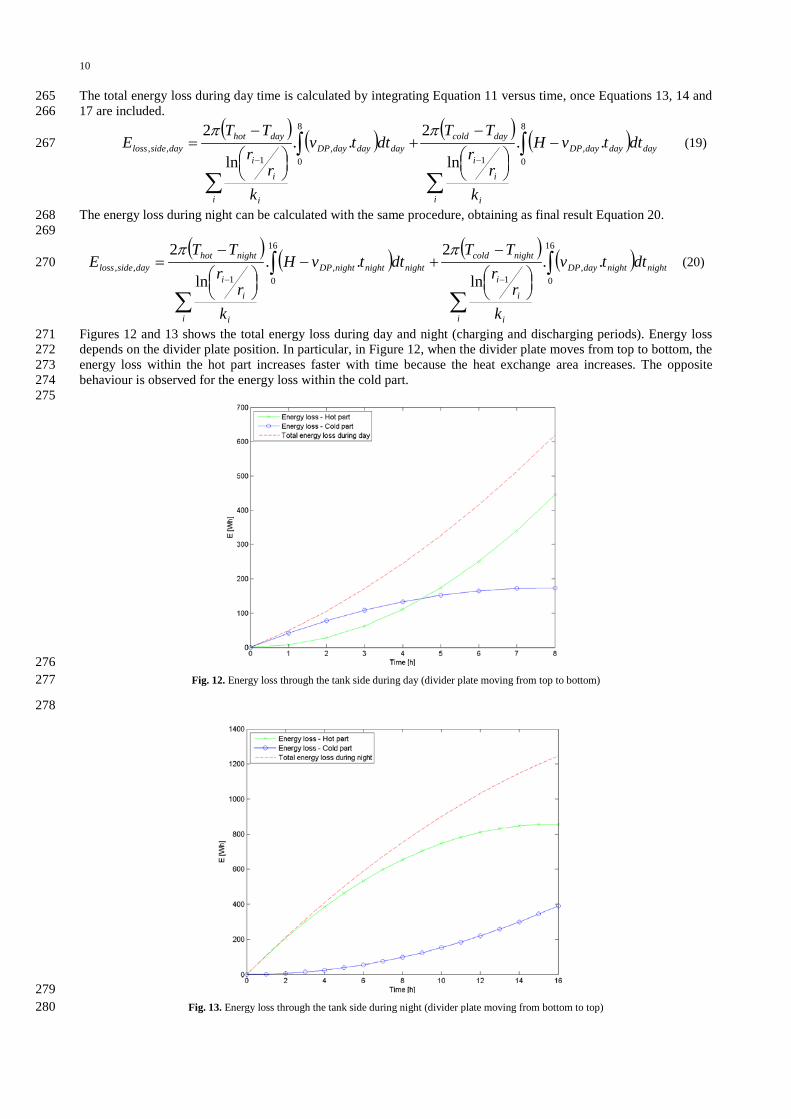
Figures 12 and 13 shows the total energy loss during day and night (charging and discharging periods). Energy loss 271 depends on the divider plate position. In particular, in Figure 12, when the divider plate moves from top to bottom, the 272 energy loss within the hot part increases faster with time because the heat exchange area increases. The opposite 273 behaviour is observed for the energy loss within the cold part. 274 275
276 Fig. 12. Energy loss through the tank side during day (divider plate moving from top to bottom) 277
278
279 Fig. 13. Energy loss through the tank side during night (divider plate moving from bottom to top) 280
11
During the day, the total energy loss through the tank side wall tends to increase faster with time due to a larger surface 281 of hot salt volume at 550 °C while the divider plate moves down. During night period, the total energy loss increases 282 slower with time for the opposite reason: the upward motion of the divider plate leads to an increase of the surface of 283 cold salt. 284 Table 6 shows the total energy loss within the hot and cold parts of the tank side wall during day and night periods. The 285 energy loss during night time is higher than during day time mainly because night period is twice longer than day period. 286 Another detail to be remarked is the energy loss within the hot part during night time is almost 3 times the one during 287 day time. This difference comes from two factors: the different ambient temperature and divider plate velocity. 288 289
Table 6. Total energy losses through the side wall of the tank 290 Day time
(charging process) Night time
(discharging process) Energy loss through tank hot part (kWh) 0.45 0.85 Energy loss through tank cold part (kWh) 0.17 0.39 Total energy loss through tank side wall (kWh) 1.83
291 The calculated energy loss by conduction through the tank walls (top, base and side), of 26.9 kWh per day is dominated 292 by convective loss through the aperture of 21.3 kWh. This energy loss represents 4.5 % of the total energy stored by the 293 system of 600 kWh. 294 295
4. Conclusion and discussion 296
Optical simulations revealed that a 6 faceted conical design for the FOE is the best choice in terms of flux distribution 297 uniformity, more nearly axial angular distribution of rays entering the molten salt tank and ease of manufacture and 298 maintenance. The potential for changes in salt chemistry due to hot spots is reduced as well as the reflected flux at the 299 molten salt surface. However for a given FOE efficiency, the cone may require a larger outlet radius, hence a larger tank 300 aperture. A preliminary analysis focused on the conductive loss through the tank walls and on the convective loss 301 through the aperture reveals that the total energy loss corresponds to 4.5 % of the thermal capacity. However, the thermal 302 performance of the tank is highly dependent on the salt emissivity at 550 °C, which is not available in the literature. 303 Ongoing experiments will provide this data and enable a better design of the FOE/tank system. 304
305
Acknowledgements 306
This work is funded by the Masdar Institute/MIT collaborative flagship project, grant # FR2014-000002. 307 Research at Masdar Institute is supported by the Government of Abu Dhabi to help fulfill the vision of the late President 308 Sheikh Zayed bin Sultan Al Nayhan for sustainable development and empowerment of the UAE and humankind. 309 Masdar Institute and MIT acknowledge in alphabetic order: Dongfang Electric Corporation for designing and providing 310 the molten salt-air heat exchanger system, National Instruments and Parker/Sunpower for donating part of 311 instrumentation, control and motion systems, and SQM for kindly providing the nitrate salts for the prototype. 312 313
References 314
[1] Lund H. Renewable energy strategies for sustainable development, Energy 2007;32-8. 315 [2] Gil A et al. State of the art on high temperature thermal energy storage for power generation. Part1-Concepts, materials and modellization. 316
Renewable and Sustainable Energy reviews 2010;14-25. 317 [3] Miro L, Oro E, Boer D, Cabeza FL. Embodied energy in thermal energy storage (TES) systems for high temperature applications, Applied Energy 318
2015;137-7. 319 [4] Epstein M, Segal A, Yogev, A. A molten salt system with ground base-integrated solar receiver storage tank, Le Journal de Physique IV 1999, 320 9(3). 321 [5] Slocum AH, et al. Concentrated solar power on demand. Solar Energy 2011;85-9. 322 [6] Codd DS, Carlson A, Rees J, Slocum AH. A low cost high flux solar simulator. Solar Energy 2010;84:2202-12. 323 [7] Copeland RJ. Method and apparatus for operating an improved thermocline storage unit. U.S. Patent 4,523,6291985. 324 [8] Noone CJ, Ghobeity A, Slocum AH, Tzamtzis G, Mitsos A, Site selection for hillside central receiver solar thermal plants, Solar Energy 325
2011;85:10. 326 [9] Codd DS, Slocum AH. Direct absorption volumetric molten salt receiver with integral storage. Proceedings of 5th International Conference on 327
Energy Sustainability, Washington, DC, USA 2011. 328 [10] Rabl A. Tower reflector for solar power plant, Solar Energy 1976;18-3. 329 [11] Hasuike H et al. Demonstration of Tokyo Tech Beam-Down Solar Concentration Power System in 100 kW Pilot Plant. Proceedings of 15th 330
International Symposium on Concentrated Solar Power and Chemical Energy Technologies, Berlin, Germany 2009. 331 [12] Mokhtar M, Meyers SA, Armstrong PR, Chiesa M. Performance of a 100 kWth concentrated solar beam-down optical experiement. Journal of 332
Solar Engineering 2014;136:4-8. 333
12
[13] Parretta A, Antonini A. Optics of solar concentrators. Part II: Models of light collection of 3D-CPCs under direct and collimated beams. 334 International Journal of Optics and Applications 2013;3(5)-31. 335
[14] Timinger A, Kribus A, Doron P and Ries H. Faceted concentrators optimized for homogeneous radiation. Applied Optics 2000;39(7):7. 336 [15] Jafrancesco D, Sani E, Fontani D, Mercatelli L, Sansoni P, Giannini A and Francini F. Simple methods to approximate CPC shape to preserve 337
collection efficiency. International Journal of Photoenergy 2012;2012-7. 338 [16] Cooper T, Dähler F, Ambrosetti G, Pedretti A and Steinfeld A, Performance of compound parabolic concentrators with polygonal apertures. 339
Solar Energy 2013;95-11. 340 [17] Segal A and Epstein M. Truncation of the secondary concentrator (CPC) as means to cost effective beam-down system. Proceedings of the ASME 341
3rd International Conference of Energy Sustainability, San Fransisco, CA, USA, 2009. 342 [18] Calvet N, Armstrong, PR, Codd, S and Slocum A. Advanced Thermal Energy Storage System Directly Charged by Concentrated Solar Power, 343
Flagship Research Project Full Proposal 2014. 344 [19] Meyers SA, Qadir A, Mokhtar M, Rubalcaba I, Chiesa M, Armstrong PR. Development of a correlation between luminous intensity and solar 345
flux for the beam-down tower configuration. Proceedings of SolarPACES 2010, Perpignan, France. 346 [20] Kumar, VK. Modelling and Final Optical Element Design for Beam Down Optical Experiment, MSME Thesis, Masdar Institute 2015 347 [21] Rabl A. Comparison of solar concentrators, Solar Energy, 1976;18:2-19. 348 [22] Winston R., Miñano JC and Benítez P. Nonimaging Optics. Elsevier Academic Press; 2005. 349 [23] Codd DS. Concentrated Solar Power on Demand, DS Codd thesis, PhD, Massachusetts Institute of Technology, June 2011. 350 [24] Goods SH, Bradshaw RW, Prairie MR, Chavez JM. Report SAND94-8211 - UC-234, March 1994. 351 [25] Leibfried U and Ortjohann J. Convective heat loss from upward and downward-facing cavity solar receivers: Measurements and calculations. 352
Journal of Solar Energy Engineering 1995; 117:10. 353


![[Nayfeh a.H., Chin C.-m.] Perturbation Methods](https://static.documents.pub/doc/80x56/577cd1261a28ab9e7893bd4c/nayfeh-ah-chin-c-m-perturbation-methods.jpg)
