Page 1
Title Granular activated carbon for aerobic sludge granulation in abioreactor with a low-strength wastewater influent
Author(s) Li, Aj; Li, Xy; Yu, Hq
Citation Separation And Purification Technology, 2011, v. 80 n. 2, p. 276-283
Issued Date 2011
URL http://hdl.handle.net/10722/137236
Rights Creative Commons: Attribution 3.0 Hong Kong License
Page 2
1
Re-submitted to: Separation and Purification Technology (SEPPUR-D-11-00128)
Date: April 30, 2011
Granular Activated Carbon for Aerobic Sludge Granulation in
A Bioreactor with A Low-strength Wastewater Influent
An-jie Li1,2, Xiao-yan Li2,* and Han-qing Yu3
1State Key Laboratory of Water Environment Simulation, School of Environment,
Beijing Normal University, Beijing, 100875, China
2Environmental Engineering Research Centre, Department of Civil Engineering,
The University of Hong Kong, Pokfulam Road, Hong Kong, China
3School of Chemistry, University of Science and Technology of China, Hefei, 230026, China
(*Corresponding Author: Tel: (852)28592659; Email: [email protected] ; Homepage: http://web.hku.hk/~xlia/)
Abstract 1
Aerobic sludge granulation is rather difficult or impossible for the treatment of low-strength 2
wastewater. In this study, a novel technique involving granular activated carbon (GAC) was 3
developed for rapid aerobic granulation under a low organic loading condition. Laboratory 4
experiments were conducted with two sequencing batch reactors (SBRs) running side by 5
side. One reactor had fine GAC added to the sludge mixture, and the other had no GAC 6
added. A low-strength organic wastewater with a chemical oxygen demand (COD) 7
concentration of only 200 mg/L was used as the influent to the SBRs. The morphology, 8
Page 3
2
physical properties, and bacterial community structure of the sludge in the two reactors 9
were characterized and compared throughout the experiments. The results showed that 10
granules could not be formed in the SBR without added GAC. However, complete 11
granulation was achieved in the SBR with GAC addition. Selective discharge of slow 12
settling sludge was also essential to the granulation process. Adding GAC to the seed sludge 13
mixture, together with the selective discharge of small and loose sludge flocs, facilitated the 14
retention and growth of bacterial cells on GAC in attached-growth mode, leading to 15
complete granulation. In addition, the use of GAC produced aerobic granules with strong 16
cores to help maintain the long-term stability of mature granules. With granulation, the 17
solid-liquid separation property of the sludge was greatly improved. Once granules were 18
formed, the granules were quite stable and GAC addition was no longer needed. Therefore, 19
adding GAC is a simple and effective strategy to initiate granule formation for complete 20
sludge granulation in bioreactors treating low-strength organic wastewater. 21
22
Keywords: Aerobic granulation, granular activated carbon (GAC), low-strength wastewater, 23
microbial community, sequencing batch reactor (SBR), wastewater treatment. 24
25
1. Introduction 26
Aerobic granulation is an appealing new technology that transforms loose sludge flocs into 27
dense granules for biological wastewater treatment. Due to attributes such as a compact 28
structure and fast settling velocity [1-5], granular sludge allows a high level of biomass 29
concentration, a very short phase of sludge-water separation, and a much higher organic 30
loading rate in bioreactors [3,6-8]. Given its potential in the development of novel, compact, 31
and high-rate biological treatment systems, aerobic granulation may lead to fundamental 32
advances in wastewater treatment [5,9,10]. 33
Page 4
3
Aerobic granulation relies on rapid biomass growth that requires a sufficient supply of 34
substrates into the bioreactors. Granule formation has been reported with a high organic, or 35
COD (chemical oxygen demand), loading rate ranging from 1 to 15 kg/m3·d [3,11,12]. 36
However, granulation may not be achieved with a relatively low organic loading of 1 kg 37
COD/m3·d or lower [10,13]. Apart from a low organic loading rate, a low influent organic 38
concentration would greatly increase the difficulty of granule formation and growth [14]. 39
Moreover, a low influent concentration often results in more filamentous growth, leading to 40
deterioration and breakage of the granules [15]. There have been few reports of successful 41
granulation for a low-strength wastewater influent with an organic concentration of less 42
than 250 mg COD/L. However, considering the low organic concentration level in most 43
municipal sewage, a simple and effective granulation startup strategy needs to be developed 44
for low-strength wastewater influents. 45
Aerobic granules can be regarded as a special type of biofilm growth in a stable, 46
contiguous, and multicellular association [16,17]. Granular activated carbon (GAC) has 47
been used as the support medium for microbial immobilization and attached biofilm growth 48
in biological wastewater treatment [18,19]. GAC has a large specific surface area and a fast 49
settling velocity. Its coarse and irregular surface and characteristic adsorption property also 50
provide a favorable microenvironment for bacterial growth. GAC has been successfully 51
applied as the support media in biological aerated filters [20,21] and fluidized-beds [22,23] 52
for water and wastewater treatment. Thus, GAC could be used as the carrier medium for 53
aerobic granulation under unfavorable conditions, such as a low substrate concentration and 54
a low organic loading rate. However, the technique of using GAC for rapid granule 55
formation and long-term granule stability in biological wastewater treatment has yet to be 56
developed. 57
Page 5
4
In this study, laboratory experiments were conducted with two sequencing batch 58
reactors (SBRs) running side by side. GAC was added to the sludge mixture in only one of 59
the reactors. A low organic influent with a COD concentration of only 200 mg/L was tested 60
in the SBRs. With the low-strength influent, granules could not be formed in the SBR 61
without adding GAC. In contrast, complete granulation was achieved in the reactor with 62
GAC added. The morphology, structure, physical properties, and bacterial community of 63
the sludge in the two reactors were characterized and compared throughout the experiments. 64
The aims of the experimental study were to develop an effective technique using GAC for 65
rapid aerobic granulation in bioreactors with a low-strength influent and to investigate the 66
underlying mechanisms of granule formation on GAC. 67
68
2. Materials and Methods 69
2.1. Experimental set-up and SBR operation 70
Two identical columns (6 cm in diameter and 80 cm in height) with a working volume 71
of 2.4L each were used as SBRs for the experimental study (Fig. S1, Supplementary Data). 72
The two reactors, R1 and R2, were operated in a fixed sequential mode for a 3 hr cycle with 73
4 min of feeding, 142 min of aeration, 30-min of sludge settling and 4 min of effluent 74
withdrawal from the middle ports of the columns. The reactors were fed with a glucose-75
based synthetic wastewater prepared according to the chemical composition given by Tay et 76
al. [24]. A low organic concentration with a COD of 200 mg/L was used for the SBR 77
influent. Activated sludge from a full-scale sewage treatment plant (Stanley Sewage 78
Treatment Works, Hong Kong) was used as the seed sludge. The sludge was acclimated in 79
the two SBRs for one month with the glucose-based synthetic wastewater, and the initial 80
sludge MLVSS (mixed liquor volatile suspended solids) concentration was 3000 mg/L. 81
Page 6
5
Fine GAC particles were used to enhance aerobic sludge granulation for the low-82
strength influent in one of the reactors. The GAC had a mean size of 224 µm with a specific 83
surface area of 1002 m2/g and an apparent density of 1.183 g/cm3 (Merck, NJ, USA). No 84
GAC was added to R1, while 7.2 g of GAC was added to R2 to result in a GAC 85
concentration of 3 g/L or a volume fraction of less than 0.3%. The experiments were 86
performed at room temperature, and the water temperature was 20-22˚C. NaHCO3 was 87
dosed into the feed wastewater to maintain the reactor pH in the neutral range between 7.0 88
and 7.5. Air was supplied at a flow rate of 2.0 L/min into the reactors during the aeration 89
phase to keep the dissolved oxygen (DO) concentration in the sludge suspension in the 90
range of 2-5 mg/L. 91
Sludge was discharged once a day from the two SBRs at a predetermined rate to 92
maintain a stable biomass concentration. Sludge loss in the effluent during effluent 93
withdrawal was minimized by allowing a settling time of 30 min in each SBR cycle. The 94
SBR experiment was conducted for a total of 120 days in two operating phases with 95
different sludge discharge methods. In the first 30 days, Phase 1, the mixed sludge 96
discharge method was used, and in the next 90 days, Phase 2, selective discharge of slow-97
settling sludge was applied. For the mixed sludge discharge in Phase 1, the sludge mixture 98
was discharged from the middle ports of the SBR columns while the aeration was still being 99
conducted. The GAC in the sludge mixture discharged from R2 was recovered and returned 100
to R2. For the selective sludge discharge in Phase 2, the sludge was discharged from the 101
middle ports during the settling phase without aeration after a few minutes of sludge settling. 102
The settling period varied from 1 to 5 min depending on the sludge settling property and the 103
targeted amount of sludge to be discharged. In comparison to the mixed sludge discharge 104
method, the selective discharge had a higher fraction of small and slow-settling sludge flocs 105
in the discharged sludge than in the bulk sludge mixture. The amount of sludge loss in the 106
Page 7
6
effluent was measured every day. The amount of daily sludge discharge was adjusted 107
accordingly to maintain a biomass MLVSS concentration of 3000 mg/L in each reactor. 108
109
2.2. Determination of the organic uptake capability of the sludge in batch test 110
The biomass sludge was collected from R1 and R2 periodically to test the organic 111
substrate uptake capability of the sludge. The organic uptake tests were performed in 250-112
mL glass beakers as batch reactors, with sufficient aeration provided. In each reactor, sludge 113
was added to an MLVSS concentration of 3000 mg/L before adding wastewater. Two 114
different initial glucose concentrations - 200 and 500 mg/L - were used for the substrate 115
uptake tests. After adding the wastewater, the sludge mixtures were sampled at various time 116
intervals. The samples were filtered, and the glucose and COD concentrations in the filtrates 117
were measured. A first-order kinetics may be assumed for the early phase of glucose uptake 118
in the batch reactor, i.e.
kXSdtdS
−= , where S is the glucose concentration, t is time, k is a 119
rate constant and X is the sludge concentration. From a linear regression of ln(S0/S) versus 120
Xt, where S0 is the initial glucose concentration, the substrate uptake rate constant of the 121
sludge can be determined. 122
123
2.3. Analysis of microbial population and identification of dominant species in reactors 124
The microbial population of the sludge samples was analyzed for the two reactors on 125
experimental days 10, 40 and 70 of the second phase. The genomic DNA of the sludge was 126
extracted using a beadbeater (Mini-beadbeaterTM, Biospec, Bartlesville, OK, USA) and 127
micro-centrifuge (MiniSpin plus®, Eppendorf, Hamburg, Germany) [25]. The bacterial 16S 128
rDNA gene sequence (V3 region, corresponding to positions 341-534 of E. coli sequence) 129
was amplified by polymerase chain reaction (PCR) (PTC-200, MJ Research, Waltham, MA, 130
USA) following the procedure detailed previously [10]. The PCR amplified DNA products 131
Page 8
7
were then separated by denaturing gradient gel electrophoresis (DGGE) through 8% 132
polyacrylamide gels with a linear gradient of 30-50% denaturant, using the DCodeTM 133
Universal Mutation Detection System (Bio-Rad, Hercules, CA, USA). The gels were run for 134
6 h at 130V in 1× TAE buffer at 60◦C, and then stained with ethidium bromide for 10 min 135
and visualized by a UV illuminator. The DGGE images were acquired using the ChemiDoc 136
(Bio-Rad) gel documentation system. 137
A 16S rRNA gene sequence clone library was constructed to identify the phylogeny of 138
the DGGE bands of the sludge samples [26]. Representative clones of the operational 139
taxonomic units (OTUs) underwent the same DGGE analysis under the conditions used for 140
the biomass PCR products. The migration positions of the library clones were compared 141
with the DGGE profiles of the sludge samples. Based on the comparison, an OTU in the 142
clone library was assigned to a particular DGGE band for species identification. 143
144
2.4. Analytical methods 145
The COD concentration, sludge MLSS (mixed liquor suspended solids) and MLVSS 146
concentrations, effluent suspended solids (ESS) concentration, and the sludge volume 147
indexes after 5 min (SVI5) and 30 min (SVI30) of sedimentation were measured according to 148
the Standard Methods [27]. The interfacial settling velocity of the sludge layer, which is 149
defined as the falling velocity of the water-sludge interface during sludge sedimentation, 150
was measured regularly during the early phase of sludge settling in the two SBR columns. 151
The glucose content was determined using the phenol-sulphuric acid method [28]. The 152
morphology of the sludge flocs and granules was examined under a stereomicroscope (S8 153
APO, Leica, Cambridge, UK) equipped with a digital camera (EC3, Leica, Cambridge, UK). 154
A laser diffraction particle counter (LS13 320, Beckman Coulter, Miami, FL, USA) was 155
Page 9
8
used to measure the size distribution of the sludge flocs and granules. Accordingly, the 156
volume-based mean size of the sludge in a sample was calculated from its size distribution. 157
158
3. Results and Discussion 159
3.1. Formation of aerobic granules in the SBR 160
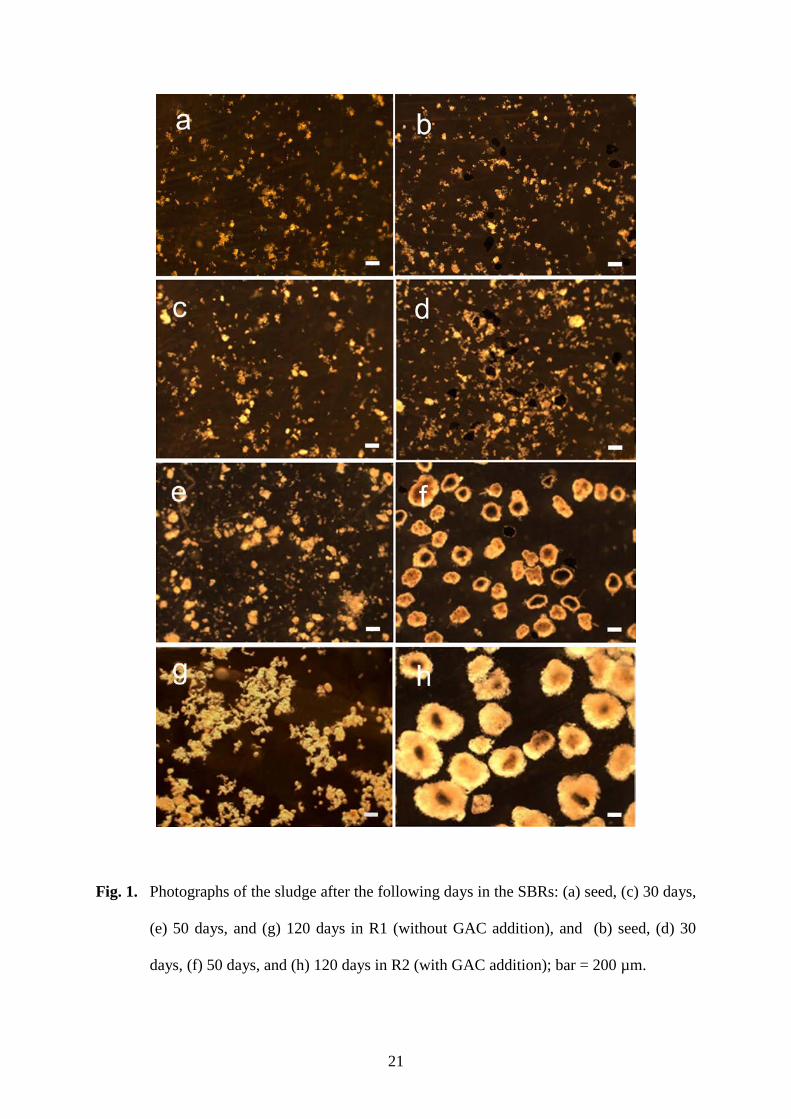
During the first 30 days of SBR startup (Phase 1), the mixed sludge discharge method 161
was used in the two SBRs. Sludge remained in the form of flocs in both R1 without GAC 162
and R2 with added GAC (Fig. 1). A few sludge flocs were found to attach to the GAC, and 163
the amount of biomass that attached to or grew on the GAC was about 9% of the total 164
biomass in R2 by the end of Phase 1. Both reactors were then changed to the elective sludge 165
discharge mode in Phase 2 to facilitate aerobic sludge granulation. As expected, complete 166
granulation was difficult with the low-strength (200 mg COD/L) influent. There was little 167
sign of granule formation in R1 throughout Phase 2. In contrast, however, GAC-based 168
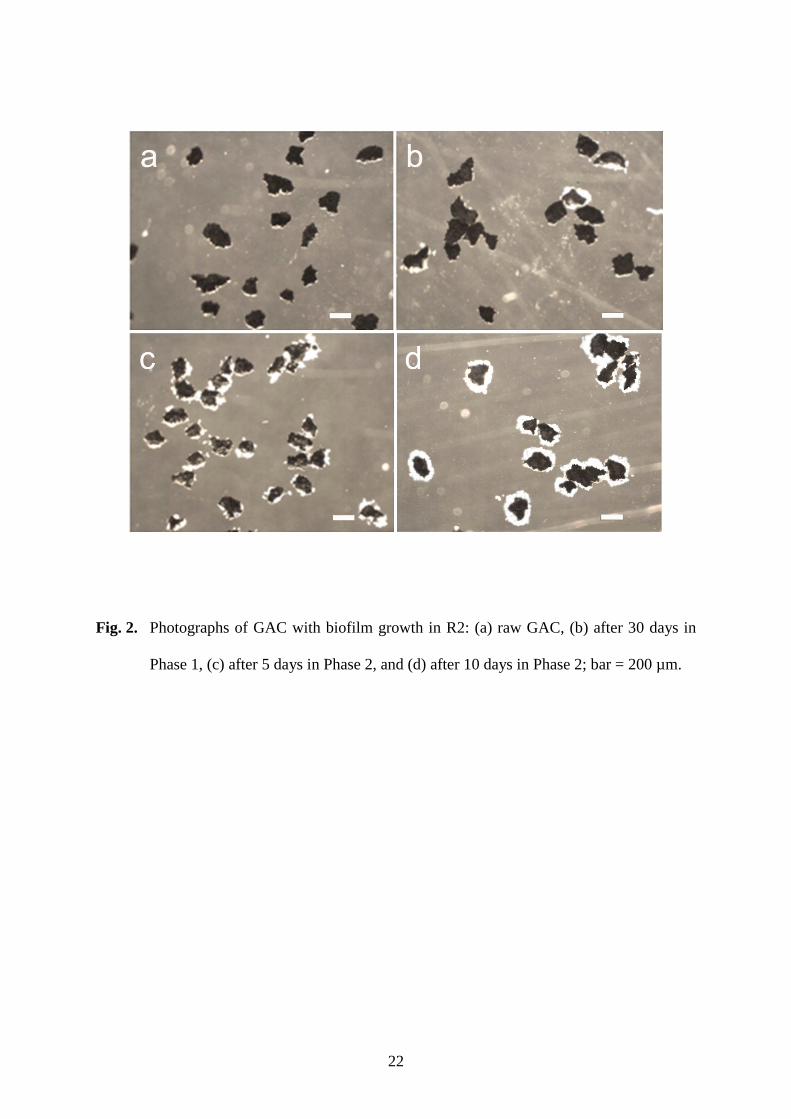
granules began to form rapidly in R2, despite the same low-strength influent. Biofilm 169
appeared to grow on the GAC surface after only 5 days of Phase 2 (Fig. 2), while the 170
amount of biomass growing on GAC increased to 16% of the total biomass in R2. After 10 171
days of Phase 2, the GAC was fully covered by biofilm, and small granules became visible. 172
Sludge granulation was almost fully achieved in R2 after 20 days (Fig. 1). The granules in 173
R2 were round with a clear boundary, and were completely different from the loose and 174
irregular sludge flocs in R1. The amount of biomass in the GAC-based granules accounted 175
for more than 80% of the total sludge in R2. 176
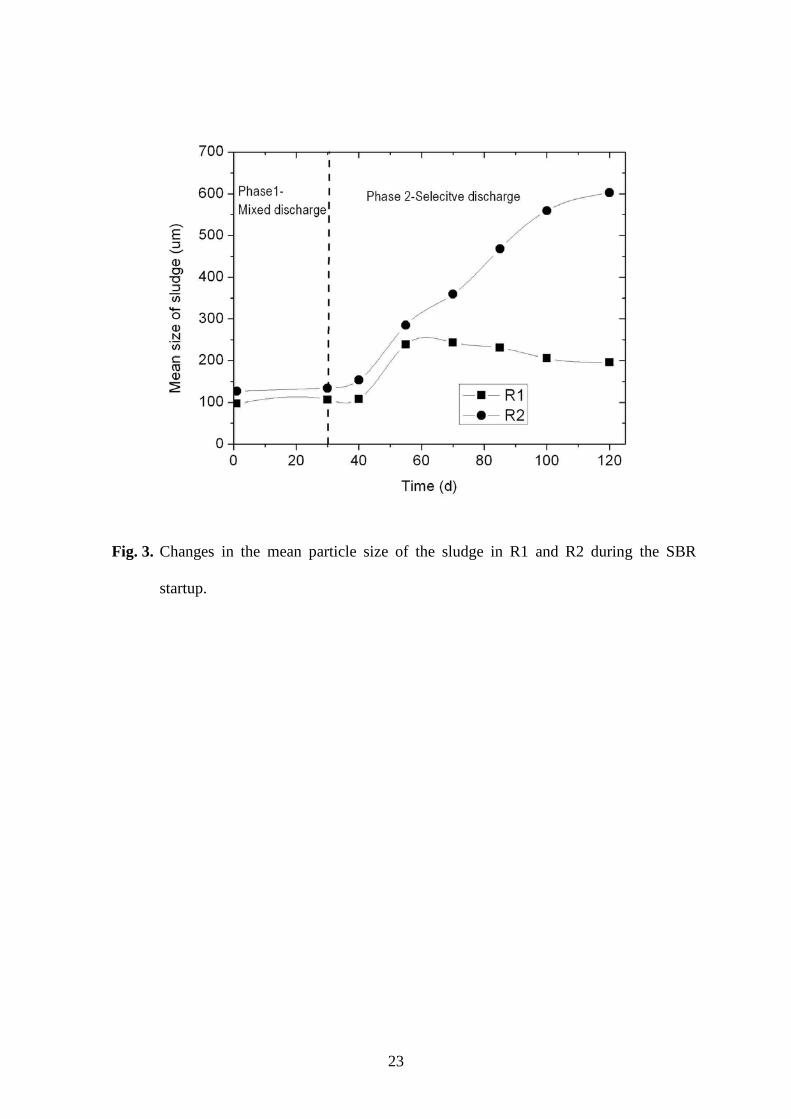
Measurement of the particle size showed that the mean size of the sludge in R2 with 177
added GAC was larger than that in R1 (Fig. 3). During Phase 1, with mixed sludge 178
discharge, the mean sludge sizes in both R1 and R2 were quite stable at no more than 130 179
µm after 30 days. Selective sludge discharge in Phase 2 led to an increase in sludge size in 180
Page 10
9
both reactors, particularly in R2. The mean size of the R2 sludge increased from 134 to 153 181
µm after only 10 days in Phase 2. The size increased continuously with the formation and 182
growth of granules, and the mature granules had a mean size of around 600 µm. The sludge 183
in R1 also increased in size to about 250 µm after 20 days in Phase 2, and a few small 184
granules were found in the sludge mixture (Fig. 1). However, complete aerobic granulation 185
could not be achieved in R1 with no GAC added. The small granules apparently broke up 186
and the mean sludge size eventually decreased to about 200 µm (Fig. 3). 187
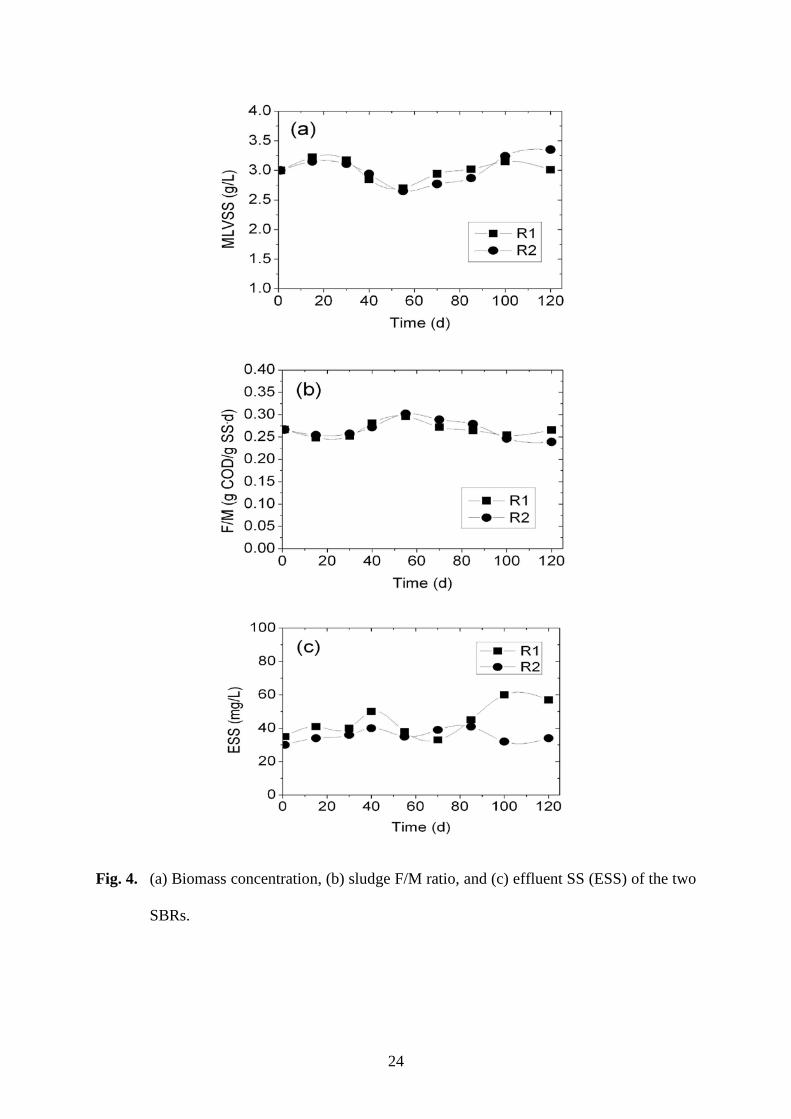
The two reactors were operated under the same condition except for the GAC addition 188
(Fig. 4). The two SBRs had the same organic loading of 0.8 kg COD/m3·d, the same HRT 189
of 6 h and a similar SRT of around 15 d. Sludge was discharged from the two SBRs once a 190
day at an overall biomass sludge removal ratio of about 6%, and the MLVSS was kept at 191
around 3000 mg/L in both reactors (Fig. 4a). The F/M (food-to-microorganism) ratio was 192
maintained between 0.25 to 0.30 g COD/g SS·d (Fig. 4b). Both reactors performed well on 193
organic removal with an effluent COD of below 30 mg/L. The amount of SS in the effluent 194
was 60 mg/L or lower for R1, without GAC addition and granulation. In comparison, R2 195
had a lower effluent SS level of less than 40 mg/L after GAC-enhanced granule formation, 196
which showed the benefit of sludge granulation (Fig. 4c). 197
198
3.2. Comparison of the sludge between the two SBRs 199
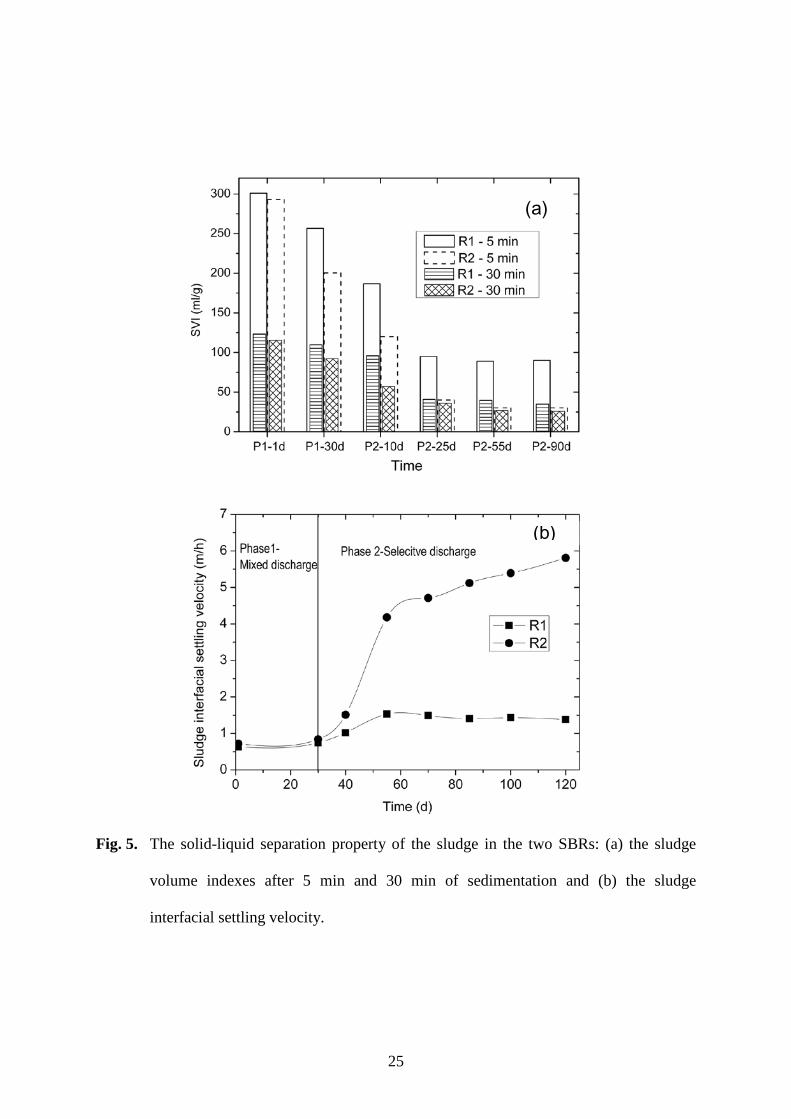
GAC addition during the SBR startup significantly improved the sludge settleability and 200
compression (Fig. 5). The sludge in R2 with the initial GAC addition always had a lower 201
SVI value than the sludge in R1 (Fig. 5a). With the mixed sludge discharge in Phase 1, the 202
SVI30 was about 110 ml/g for the R1 sludge and 90 ml/g for the R2 sludge after 30 days. 203
The SVI5 values were more than twice the respective SVI30 values, implying typical 204
activated sludge flocs without granulation in both SBRs [4]. Selective sludge discharge in 205
Page 11
10
Phase 2 led to a considerable improvement in sludge compressibility and settleability. The 206
SVI30 decreased to 40 ml/g for the sludge in R1 and to 30 ml/g for R2 after 25 days of Phase 207
2 operation (Fig. 5a). Meanwhile, the SVI5 decreased from 250 to 100 ml/g in R1 and from 208
200 to 40 ml/g in R2. However, the SVI5 remained about twice as large as SVI30 for the R1 209
sludge throughout the rest of the SBR test. This agreed with the microscopic observation 210
that the sludge in R1 remained in the form of suspended flocs. Although selective discharge 211
of small and loose flocs improved the sludge settleability, it was not enough to lead to 212
complete granulation for the low-strength influent. In contrast, the sludge SVI5 was similar 213
to SVI30 for the R2 sludge after 25 days of Phase 2. This indicated complete granulation 214
according to the typical defining feature of aerobic granules [4]. The comparative results 215
demonstrate that the initial GAC addition was crucial to the granule formation in R2. In 216
other words, aerobic granulation would not be achieved for a low-strength influent of 200 217
mg COD/L or less without the addition of GAC during the SBR startup. 218
Granular sludge showed its great advantage in sludge water separation. For the 219
suspended sludge in R1, the sludge-water interfacial settling velocity was rather stable at a 220
rate of no more than 1.5 m/h (Fig. 5b). In contrast, the bulk sludge settling velocity 221
continuously increased in R2 with the formation and growth of granules. The mature 222
granules had an interfacial settling velocity of about 6 m/h, which was at least 4 times as 223
fast as that of the sludge flocs in R1. In comparison to conventional activated sludge, sludge 224
after granulation could be separated much more rapidly from the wastewater after treatment. 225
In other words, granular sludge would request a very short phase of sludge-water separation, 226
which is particularly beneficial to low-strength wastewater treatment. In addition, aerobic 227
granulation would allow a much higher level of biomass concentration at 5-8 g/L and in 228
granular SBRs, which has been well demonstrated by previous studies [3-5,10]. 229
Page 12
11
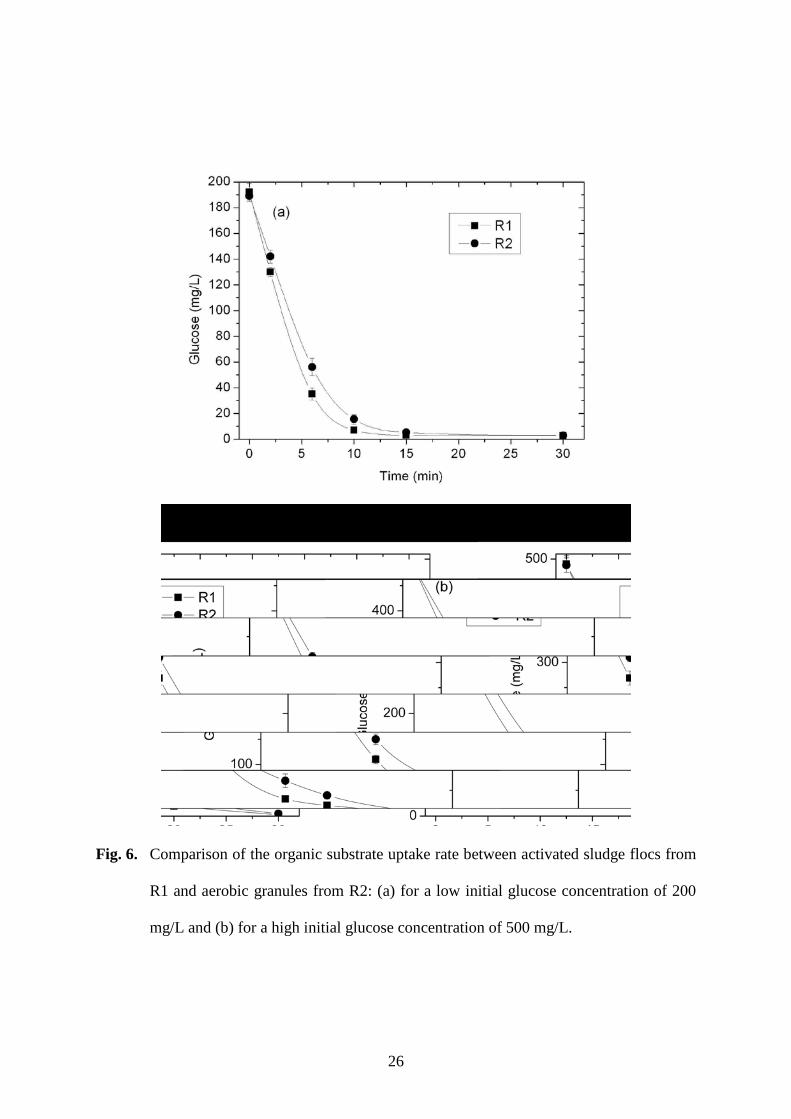
Although the granular sludge in R2 performed better in sludge-water separation, the 230
sludge flocs in R1 were found to have a greater substrate uptake capability than the granules 231
in R2. For the same biomass SS content of 3 g/L, the feeding glucose concentration dropped 232
more rapidly with the R1 sludge than with the R2 sludge (Fig. 6). For the initial glucose 233
concentrations of 200 mg/L, the activated sludge flocs in R1 had a glucose uptake rate 234
constant k at 6.7 L/g SS·h, which is considerably higher than that of the mature granules in 235
R2, at 4.9 L/g SS·h. The different glucose uptake rates suggest that loose sludge flocs have 236
a clear advantage over dense granules for the uptake of substrates and nutrients. Small and 237
loose flocs can obtain substrates from the suspension more easily than tightly-packed 238
granules [29]. With mixed sludge discharge, there is less substrate available for uptake by 239
dense flocs and granules due to competition from loose sludge flocs [26]. Thus, as 240
demonstrated in Phase 1, it is apparently impossible for granules to grow and become 241
dominant in a reactor without selective discharge. Discharge of suspended small and loose 242
sludge flocs removes these competitors from the system and makes the substrates more 243
available for the biomass in attached-growth form, which leads to granulation [30]. 244
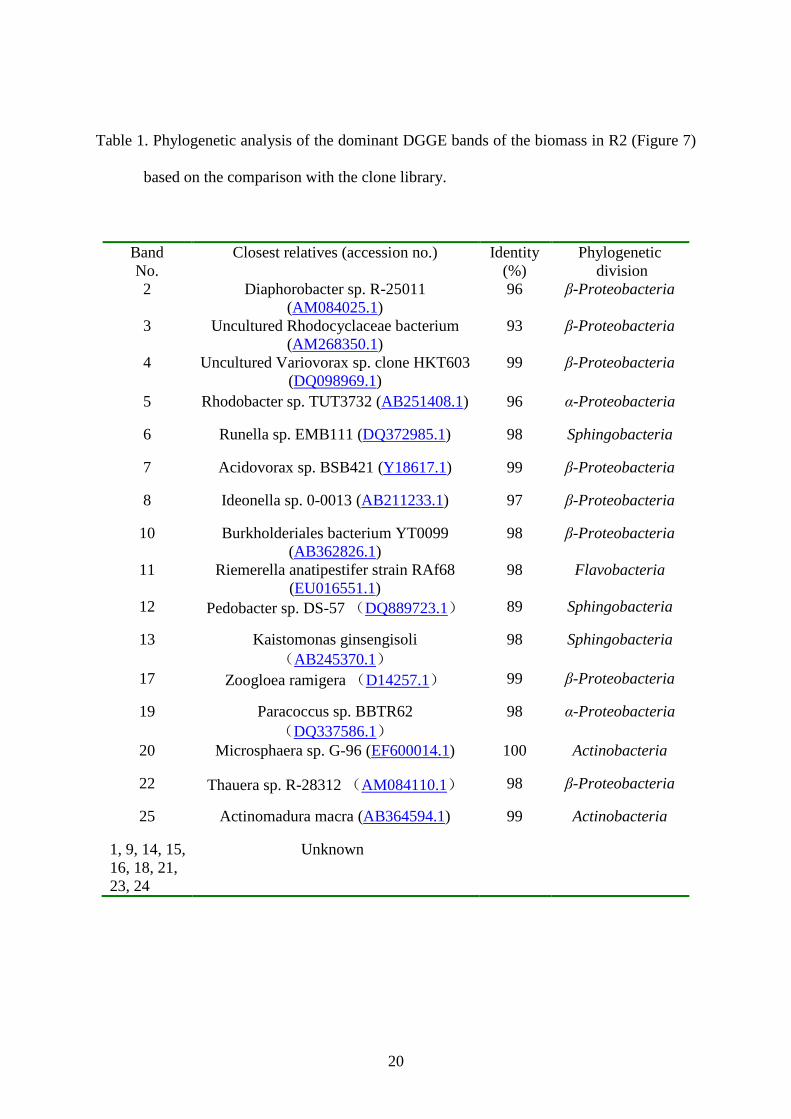
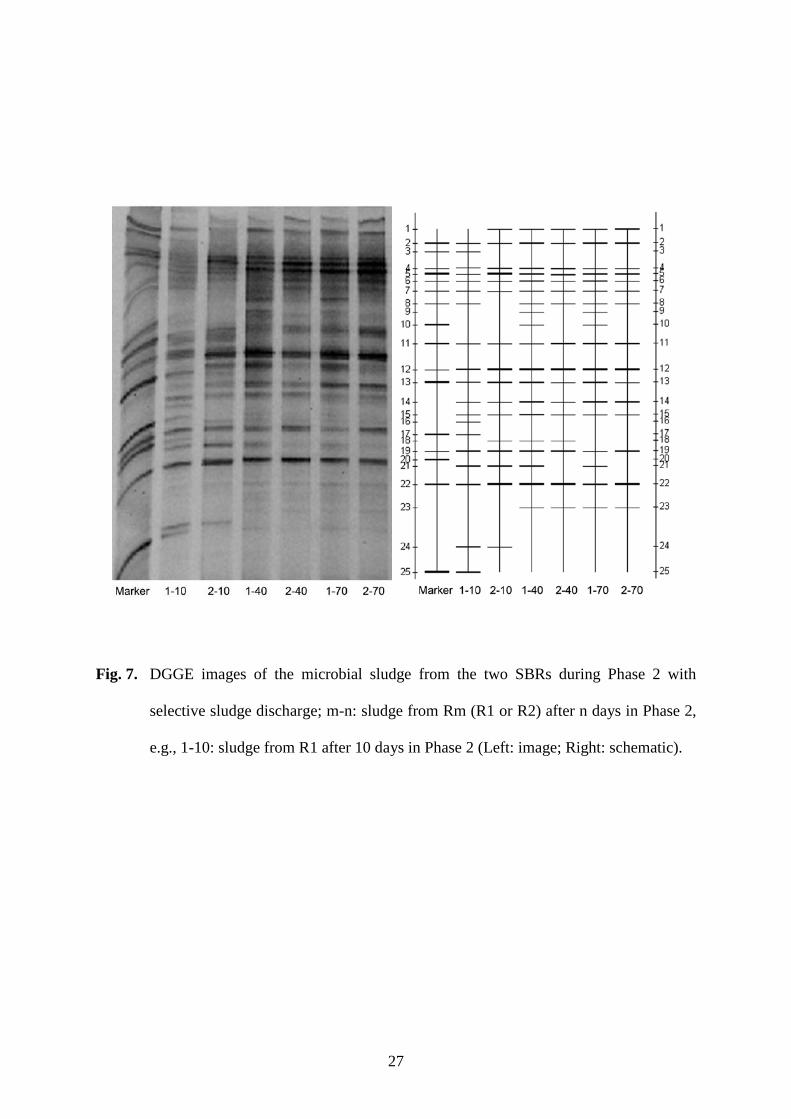
Well-resolved DGGE bands were obtained from the biomass from R1 and R2 (Fig. 7). 245
Changes in the DGGE banding profile are presumed to indicate the evolution of bacterial 246
species in a reactor [10,31]. To determine the identity of the bands in the DGGE profiles, 247
OTUs from 98 clones in the library were compared with the DGGE patterns. Of the 25 248
bands that appeared in the DGGE profiles, 16 dominant bands were identified (Table 1), 249
which accounted for 70% of the microbial abundance represented by the DGGE banding 250
profiles. The majority of the bacterial 16S rDNA sequences grouped with members of 251
Proteobacteria, with two in the α subdivision and eight in the β subdivision. The next three 252
groups clustered with Sphingobacteria, one clustered with Flavobacteria and two clustered 253
with Actinobacteria. 254
Page 13
12
The DGGE banding patterns show some difference between the microbial community 255
structure in R1 and R2 in the early stage of Phase 2. After running 10 days of phase 2, the 256
R2 sludge with GAC addition appeared to have fewer band numbers and a lower species 257
diversity than R1 without GAC (Fig. 7). Some species ((B4, B5, B12, B22) became more 258
dominant in R2 compared to R1 after 10 days of Phase 2. GAC addition had an apparent 259
effect on species selection and accumulation in the initial phase of sludge granulation. 260
These four dominant microbial species indicted by the DGGE analysis in R2 were the 261
organisms related to the genera Variovorax, Rhodobacter, Pedobacter and Thauera (Table 262
1). A previous study also found that Pedobacter (B12) clustered with Sphingobacteria 263
increased rapidly in the early phase of aerobic granulation [26]. The class Sphingobacteria 264
is composed of environmental bacteria capable of producing sphingolipids [32]. Certain 265
complex glycosphingolipids have been found to be involved in specific microbial functions, 266
such as cell recognition and signaling for attached-growth and biofilm formation [33]. Thus, 267
the use of GAC helped to facilitate the retention and growth of some species in attached-268
growth mode to enhance biofilm growth and granulation. 269
There were minor changes in the DGGE banding pattern for R2 after 40 days of Phase 2, 270
which indicates the stability of the microbial population of the mature granules formed on 271
GAC in R2. Despite the apparent difference in physical characteristics between the R1 and 272
R2 sludge, comparison of the DGGE showed little difference between the microbial 273
diversity of R1 activated sludge and R2 granules after 40 days of Phase 2. The comparison 274
implies that aerobic granulation may not require the dominance of particular bacterial 275
species. Rather, granules can be formed from the bacteria ordinarily present in biological 276
wastewater treatment systems, such as activated sludge. Nonetheless, without the addition 277
of GAC in R1, sludge still remained in the form of suspended-growth (flocs) rather than 278
attached-growth (granules) for the low-strength influent. 279
Page 14
13
280
3.3. Importance of GAC to aerobic granulation for low-strength wastewater influent 281
It is generally believed that SBRs are the most suitable type of bioreactors for aerobic 282
granule formation [5]. The initial washout of slow-settling sludge is important in starting up 283
the SBR for aerobic granulation [26]. However, granule formation is still difficult or 284
impossible for low-strength wastewater influent even with the selective discharge of loose 285
and small flocs, as demonstrated by R1. In contrast, the initial addition of GAC to the 286
sludge mixture, together with the selective sludge discharge, facilitated the attached 287
biomass growth that led to complete sludge granulation in R2. Thus, the addition of GAC is 288
shown as a necessary and effective technique to initiate granule formation for complete 289
granulation in SBRs with a low-strength influent. Previous studies have found that GAC is 290
an effective carrier for the growth of biofilm in wastewater treatment bioreactors [20-23]. In 291
the present study, only the initial GAC addition was needed for aerobic granulation. Once 292
granules had formed, they were rather stable and GAC addition was no longer needed. 293
Under the low influent condition, GAC provided the core for granule formation and growth. 294
Moreover, the use of GAC would greatly improve the stability of granules under 295
unfavorable conditions. Due to the large size and dense structure of aerobic granules, mass 296
transport limitation is often a problem for granular sludge [34,35]. The centers of individual 297
granules have a limited or no supply of organic substrates, DO, and nutrients. Hence, large 298
granules often suffer from cell death and decay, resulting in hollow centers and even 299
breakage of the granules [13]. The mass transfer limitation and instability of aerobic 300
granules can only be worse for sludge treating low-strength wastewater. GAC, however, can 301
provide the support medium and strong cores for aerobic granules. The GAC cores do not 302
require substrates or DO, which helps to stabilize the biofilm growing on GAC. Thus, the 303
use of GAC offers an effective solution for aerobic granulation in SBRs for treating low-304
Page 15
14
strength wastewater. GAC facilitates biofilm growth and granule formation and helps to 305
sustain the stability of mature granules for long-term wastewater treatment operation. 306
307
4. Conclusions 308
• Adding GAC is shown to be a necessary and effective technique to initiate granule 309
formation for complete sludge granulation in SBRs with an influent COD of only 200 310
mg/L. In contrast, without GAC, aerobic granulation cannot be achieved in an SBR for 311
treating low-strength influent. 312
• Selective discharge of slow-settling sludge is also essential for granulation. Adding 313
GAC to the seed sludge mixture, together with the selective discharge of small and 314
loose sludge flocs, facilitates the retention and growth of bacterial cells on GAC in 315
attached-growth mode, leading to complete granulation. 316
• The use of GAC produces aerobic granules with a fast settling velocity and a much 317
improved sludge-water separation property. The granules have strong cores that will 318
help to maintain the long-term stability of mature granules for treatment of low-strength 319
wastewater. 320
321
Acknowledgements 322
This research was supported by grants HKU7144/E07 from the Research Grants 323
Council (RGC) and SEG_HKU10 from the University Grants Council (UGC) of the Hong 324
Kong SAR Government and grant 50828802 from the Natural Science Foundation of China. 325
The technical assistance of Mr. Keith C.H. Wong is highly appreciated. 326
327
References 328
Page 16
15
[1] E. Morgenroth, T. Sherden, M.C.M. van Loosdrecht, J.J. Heijnen, P.A. Wilderer, 329
Aerobic granular sludge in a sequencing batch reactor, Water Res. 31 (1997) 3191-330
3194. 331
[2] B. Arrojo, A. Mosquera-Corral, J.M. Garrido, R. Mendez, Aerobic granulation with 332
industrial wastewater in sequencing batch reactors, Water Res. 38 (2004) 3389-3399. 333
[3] Y. Liu, J.H. Tay, State of the art of biogranulation technology for wastewater treatment, 334
Biotechnol. Adv. 22 (2004) 533-563. 335
[4] M.K. de Kreuk, N. Kishida, M.C.M. van Loosdrecht, Aerobic granular sludge - state of 336
the art, Water Sci. Technol. 55(8-9) (2007) 75-81. 337
[5] S.S. Adav, D.J. Lee, K.Y. Show, J.H. Tay, Aerobic granular sludge: recent advances, 338
Biotechnol. Adv. 26 (2008) 411-423. 339
[6] J.J. Beun, A. Hendriks, M.C.M. van Loosdrecht, E. Morgenroth, P.A. Wilderer, J.J. 340
Heijnen, Aerobic granulation in a sequencing batch reactor, Water Res. 33 (1999) 341
2283-2290. 342
[7] K.Z. Su, H.Q. Yu, Formation and characterization of aerobic granules in a sequencing 343
batch reactor treating soybean-processing wastewater, Environ. Sci. Technol. 39 344
(2005) 2818-2827. 345
[8] M.K. de Kreuk, M.C.M. van Loosdrecht, Formation of aerobic granules with domestic 346
sewage, J. Environ. Eng.-ASCE, 132 (2006) 694-697. 347
[9] B.Y.P. Moy, J.H. Tay, S.K. Toh, Y. Liu, S.T.L. Tay, High organic loading influences 348
the physical characteristics of aerobic sludge granules, Lett. Appl. Microbiol. 34 349
(2002) 407-412. 350
[10] A.J. Li, S.F. Yang, X.Y. Li, J.D. Gu, Microbial population dynamics during aerobic 351
sludge granulation at different organic loading rates, Water Res. 42 (2008) 3552-3560. 352
Page 17
16
[11] M.K. de Kreuk, M. Pronk, M.C.M. van Loosdrecht, Formation of aerobic granules and 353
conversion processes in an aerobic granular sludge reactor at moderate and low 354
temperatures, Water Res. 39 (2005) 4476-4484. 355
[12] M. Torregrossa, G. Di Bella, G. Viviani, A. Gnoffo, Performances of a granular 356
sequencing batch reactor (GSBR), Water Sci. Technol. 55 (8-9) (2007) 125-133. 357
[13] J.H. Tay, S. Pan, Y.X. He, S.T.L. Tay, Effect of organic loading rate on aerobic 358
granulation. II: Characteristics of aerobic granules, J. Environ. Eng.-ASCE 130 (2004) 359
1102-1109. 360
[14] S.G. Wang, L.H. Gai, L.J. Zhao, M.H. Fan, W.X. Gong, B.Y. Gao, Y. Ma, Aerobic 361
granules for low-strength wastewater treatment: formation, structure, and microbial 362
community, J. Chem. Technol. Biot. 84 (2009) 1015-1020. 363
[15] Y. Liu, Q.S. Liu, Causes and control of filamentous growth in aerobic granular sludge 364
sequencing batch reactors, Biotechnol. Adv. 24 (2006) 115-127. 365
[16] S.T.L. Tay, W.Q. Zhuang, J.H. Tay, Start-up, microbial community analysis and 366
formation of aerobic granules in a tert-butyl alcohol degrading sequencing batch 367
reactor, Environ. Sci. Technol. 39 (2005) 5774-5780. 368
[17] S.F. Yang, X.Y. Li, H.Q. Yu, Formation and characterisation of fungal and bacterial 369
granules under different feeding alkalinity and pH conditions, Process Biochem. 43 370
(2008) 8-14. 371
[18] S.W. Maloney, N.R. Adrian, R.F. Hickey, R.L. Heine, Anaerobic treatment of 372
pinkwater in a fluidized bed reactor containing GAC, J. Hazard. Mater. 92 (2002) 77-373
88. 374
[19] M.A. Moteleb, M.T. Suidan, J. Kim, S.W. Maloney, Pertubated loading of a 375
formaldehyde waste in an anaerobic granular activated carbon fluidized bed reactor, 376
Water Res. 36 (2002) 3775-3785. 377
Page 18
17
[20] A. Andersson, P. Laurent, A. Kihn, M. Prevost, P. Servais, Impact of temperature on 378
nitrification in biological activated carbon (BAC) filters used for drinking water 379
treatment, Water Res. 35 (2001) 2923-2934. 380
[21] K. Yapsakli, B. Mertoglu, F. Cecen, Identification of nitrifiers and nitrification 381
performance in drinking water biological activated carbon (BAC) filtration, Process 382
Biochem. 45 (2010) 1543-1549. 383
[22] W.P. Flanagan, Biodegradation of dichloromethane in a granular activated carbon 384
fluidized-bed reactor, Water Environ. Res. 70 (1998) 60-66. 385
[23] A. Patel, G. Zuo, S.G. Lehman, M. Badruzzaman, D.A. Clifford, D.J. Roberts, 386
Fluidized bed reactor for the biological treatment of ion-exchange brine containing 387
perchlorate and nitrate, Water Res. 42 (2008) 4291-4298. 388
[24] J.H. Tay, Q.S. Liu, Y. Liu, Characteristics of aerobic granules grown on glucose and 389
acetate in sequential aerobic sludge blanket reactors, Environ. Technol. 23 (2002) 390
931-936. 391
[25] W.Q. Zhuang, J.H. Tay, S. Yi, S.T.L. Tay, Microbial adaptation to biodegradation of 392
tert-butyl alcohol in a sequencing batch reactor, J. Biotechnol. 118 (2005) 45-53. 393
[26] A.J. Li, X.Y. Li, Selective sludge discharge as the determining factor in SBR aerobic 394
granulation: numerical modelling and experimental verification, Water Res. 43 (2009) 395
3387-3396. 396
[27] APHA-AWWA-WEF, Standard methods for the examination of water and wastewater, 397
20th ed.; American Public Health Association/American Water Works 398
Association/Water Environment Federation: Washington D.C., USA, 1998. 399
[28] P. Gerhardt, R.G.E. Murray, W.A. Wood, N.R. Krieg, Methods for General and 400
Molecular Bacteriology, Washington D.C., USA, 1994. 401
Page 19
18
[29] S.F. Yang, Q.S. Liu, J.H. Tay, Y. Liu, Growth kinetics of aerobic granules developed 402
in sequencing batch reactors, Lett. Appl. Microbiol. 38 (2004) 106-112. 403
[30] A.J. Li, T. Zhang, X.Y. Li, Fate of aerobic bacterial granules with fungal 404
contamination under different organic loading conditions, Chemosphere 78 (2010) 405
500-509. 406
[31] C.A. Eichner, R.W. Erb, K.N. Timmis, I. Wagner-Dobler, Thermal gradient gel 407
electrophoresis analysis of bioprotection from pollutant shocks in the activated sludge 408
microbial community, Appl. Environ. Microbiol. 65 (1999) 102-109. 409
[32] D.R. Boone, R.W. Castenholz, G.M. Garrity, Bergey’s Manual of Systematic 410
Bacteriology, 2nd ed., Volume 1: Springer, New York, USA, 2001. 411
[33] Y.A. Hannun, L.M. Obeid, The ceramide-centric universe of lipid-mediated cell 412
regulation: stress encounters of the lipid kind, J. Biol. Chem. 277 (2002) 25847-25850. 413
[34] Z.C. Chiu, M.Y. Chen, D.J. Lee, C.H. Wang, J.Y. Lai, Oxygen diffusion and 414
consumption in active aerobic granules of heterogeneous structure, Appl. Microbiol. 415
Biotechnol. 88 (2007) 789-797. 416
[35] Y.Q. Liu, J.H. Tay, Influence of starvation time on formation and stability of aerobic 417
granules in sequencing batch reactors, Bioresource Technol. 99 (2008) 980-985. 418
419
Page 20
19
Figure captions 420
Fig. 1. Photographs of the sludge after the following days in an SBR: (a) seed, (c) 30 days, 421
(e) 50 days, and (g) 120 days in R1 (without GAC addition), and (b) seed, (d) 30 422
days, (f) 50 days, and (h) 120 days in R2 (with GAC addition); bar = 200 µm. 423
Fig. 2. Photographs of GAC with biofilm growth in R2: (a) raw GAC, (b) after 30 days in 424
Phase 1, (c) after 5 days in Phase 2, and (d) after 10 days in Phase 2; bar = 200 µm. 425
Fig. 3. Changes in the mean particle size of the sludge in R1 and R2 during the SBR startup. 426
Fig. 4. (a) Biomass concentration, (b) sludge F/M ratio, and (c) effluent SS (ESS) of the two 427
SBRs. 428
Fig. 5. The solid-liquid separation property of the sludge in the two SBRs: (a) the sludge 429
volume indexes after 5 min and 30 min of sedimentation and (b) the sludge 430
interfacial settling velocity. 431
Fig. 6. Comparison of the organic substrate uptake rate between activated sludge flocs from 432
R1 and aerobic granules from R2: (a) for a low initial glucose concentration of 200 433
mg/L and (b) for a high initial glucose concentration of 500 mg/L. 434
Fig. 7. DGGE images of the microbial sludge from the two SBRs during Phase 2 with 435
selective sludge discharge; m-n: sludge from Rm (R1 or R2) after n days in Phase 2, 436
e.g., 1-10: sludge from R1 after 10 days in Phase 2 (Left: image; Right: schematic). 437
Page 21
20
Table 1. Phylogenetic analysis of the dominant DGGE bands of the biomass in R2 (Figure 7)
based on the comparison with the clone library.
Band No.
Closest relatives (accession no.) Identity (%)
Phylogenetic division
2 Diaphorobacter sp. R-25011 (AM084025.1)
96 β-Proteobacteria
3 Uncultured Rhodocyclaceae bacterium (AM268350.1)
93 β-Proteobacteria
4 Uncultured Variovorax sp. clone HKT603 (DQ098969.1)
99 β-Proteobacteria
5 Rhodobacter sp. TUT3732 (AB251408.1) 96 α-Proteobacteria
6 Runella sp. EMB111 (DQ372985.1) 98 Sphingobacteria
7 Acidovorax sp. BSB421 (Y18617.1) 99 β-Proteobacteria
8 Ideonella sp. 0-0013 (AB211233.1) 97 β-Proteobacteria
10 Burkholderiales bacterium YT0099 (AB362826.1)
98 β-Proteobacteria
11 Riemerella anatipestifer strain RAf68 (EU016551.1)
98 Flavobacteria
12 Pedobacter sp. DS-57 (DQ889723.1) 89 Sphingobacteria
13 Kaistomonas ginsengisoli (AB245370.1)
98 Sphingobacteria
17 Zoogloea ramigera (D14257.1) 99 β-Proteobacteria
19 Paracoccus sp. BBTR62 (DQ337586.1)
98 α-Proteobacteria
20 Microsphaera sp. G-96 (EF600014.1) 100 Actinobacteria
22 Thauera sp. R-28312 (AM084110.1) 98 β-Proteobacteria
25 Actinomadura macra (AB364594.1) 99 Actinobacteria
1, 9, 14, 15, 16, 18, 21, 23, 24
Unknown
Page 22
21
Fig. 1. Photographs of the sludge after the following days in the SBRs: (a) seed, (c) 30 days,
(e) 50 days, and (g) 120 days in R1 (without GAC addition), and (b) seed, (d) 30
days, (f) 50 days, and (h) 120 days in R2 (with GAC addition); bar = 200 µm.
Page 23
22
Fig. 2. Photographs of GAC with biofilm growth in R2: (a) raw GAC, (b) after 30 days in
Phase 1, (c) after 5 days in Phase 2, and (d) after 10 days in Phase 2; bar = 200 µm.
Page 24
23
Fig. 3. Changes in the mean particle size of the sludge in R1 and R2 during the SBR
startup.
Page 25
24
Fig. 4. (a) Biomass concentration, (b) sludge F/M ratio, and (c) effluent SS (ESS) of the two
SBRs.
Page 26
25
Fig. 5. The solid-liquid separation property of the sludge in the two SBRs: (a) the sludge
volume indexes after 5 min and 30 min of sedimentation and (b) the sludge
interfacial settling velocity.
(a)
(b)
Page 27
26
Fig. 6. Comparison of the organic substrate uptake rate between activated sludge flocs from
R1 and aerobic granules from R2: (a) for a low initial glucose concentration of 200
mg/L and (b) for a high initial glucose concentration of 500 mg/L.
Page 28
27
Fig. 7. DGGE images of the microbial sludge from the two SBRs during Phase 2 with
selective sludge discharge; m-n: sludge from Rm (R1 or R2) after n days in Phase 2,
e.g., 1-10: sludge from R1 after 10 days in Phase 2 (Left: image; Right: schematic).


![Aerobic sludge granulation facilitated by activated carbon ...hub.hku.hk/bitstream/10722/202687/1/Content.pdf · (anammox) or other similar processes [3,4]. Partial nitrification](https://static.documents.pub/doc/80x56/5e39f269c9f5a25fcb5be0fc/aerobic-sludge-granulation-facilitated-by-activated-carbon-hubhkuhkbitstream107222026871.jpg)


