10
Granular filtration Hydraulics LAB EXPERIMENTS DRINKING WATER - LAB EXPERIMENTS
Granular filtrationHydraulics
LAB EXPERIMEN
TS
DRINKING WATER - LAB EXPERIMENTS
�
lab experimentsgranular filtration - hydraulics
FrameworkThis module explains the lab experiments on the hydraulics of filtration.
ContentsThis module has the following contents:
1. Objective2. Experiment set-up3. Theory 3.1 Hydraulic aspects 3.2 Backwashing 3.3 Characteristics of the filter material 3.4 Further application4. Procedure 4.1 Filter materials 4.2 Head losses and expansion measurements 4.3 Changing the filter bed 4.4 Sieve analysis5. Elaboration
Data forms

�
granular filtration - hydraulicslab experiments
1. Objective
When designing rapid filters for drinking water treatment knowledge of the physical properties of filter materials is required. Parameters such as grain size and shape, shape factor, bed porosity and specific surface can be found experimentally by measuring the head losses over the filter bed. Furthermore the bed expansion for different flow rates can be measured to get information about the quantities of water necessary for backwashing.
2. Experimentset-up
The pilot plant is a perspex column with a diameter of 67 mm and an area of �5 cm� can be used in upward and downward flow direction (see figure 1). Tap water is pumped from a storage tank with a constant temperature. The flow velocity for down-flow filtration is controlled downstream of the filter bed. Connections for pressure gauges are spirally mounted on the column. The pressure is measured with water manometers.
3. Theory
3.1 HydraulicaspectsThe most important part of a rapid filter is the filter material. It has to be free of clay, silt and organics and must be sustainable. Sand is an appropriate filter material. However, the variation in grains sizes is large. This induces stratification during backwashing because the finer particles move to the top of the bed, while the bigger particles are moving downward.
The finer particles give the highest removal but the filter will clog faster. One has to apply a filter bed as uniform as possible to prevent rapid clogging.With a certain type of filtersand different measurements can be used to determine the specific properties of the sand. According to Carman-Kozeny a linear relationship exists between the head loss of the clean bed and the laminar flow velocity:
[1]
in which:ΔH = head loss (m)ν = kinematic viscosity (m�/s)g = gravity acceleration (m/s�)p = porosity (-)v = velocity (m/s)dh = hydraulic diameter of sand grains (m)L = bed height (m)
The porosity is calculated from the bed volume and the mass and density of the filter material.
The Carman-Kozeny relationship can be tested by plotting the head loss as function of the filtra-tion velocity. This should give a linear relationship. The slope of this line can be used to calculate the hydraulic diameter of the sand grains.
with[�]
this equation is only true if Re ≤ 5. Figure 1 - Experiment set-up hydraulics of filtration
�
� �h
(1 p) vH 180 Lg p dν −
∆ =
��
h �0
v 180 (1 p)dI g p
ν −=
0HI
L∆
=
4
lab experimentsgranular filtration - hydraulics
[�]
The quotient of v and I0 is the permeability coef-ficient K (m/s) which is a measure for the ease of flow through a bed of grains.
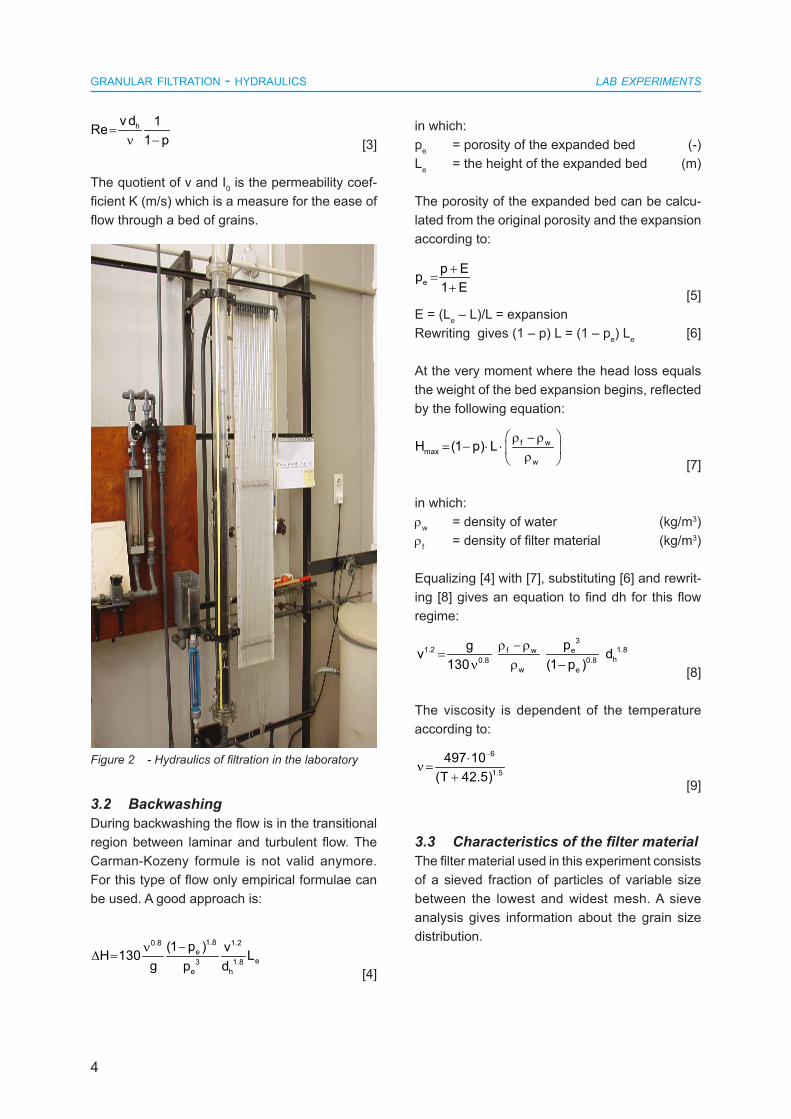
3.2 BackwashingDuring backwashing the flow is in the transitional region between laminar and turbulent flow. The Carman-Kozeny formule is not valid anymore. For this type of flow only empirical formulae can be used. A good approach is:
[4]
in which:pe = porosity of the expanded bed (-)Le = the height of the expanded bed (m)
The porosity of the expanded bed can be calcu-lated from the original porosity and the expansion according to:
[5]
E = (Le – L)/L = expansionRewriting gives (1 – p) L = (1 – pe) Le [6]
At the very moment where the head loss equals the weight of the bed expansion begins, reflected by the following equation:
[7]
in which:rw = density of water (kg/m�)rf = density of filter material (kg/m�)
Equalizing [4] with [7], substituting [6] and rewrit-ing [8] gives an equation to find dh for this flow regime:
[8]
The viscosity is dependent of the temperature according to:
[9]
3.3 CharacteristicsofthefiltermaterialThe filter material used in this experiment consists of a sieved fraction of particles of variable size between the lowest and widest mesh. A sieve analysis gives information about the grain size distribution.
Figure 2 - Hydraulics of filtration in the laboratory
hv d 1Re1 p
=ν −
1.80.8 1.2e
e3 1.8e h
(1 p ) vH 130 Lg p d
−ν∆ =
�1.2 1.8ef w
h0.8 0.8w e
pgv d130 (1 p )
r − r=
rν −
ep Ep1 E+
=+
f wmax
w
H (1 p) L r − r
= − ⋅ ⋅ r
6
1.5
497 10(T 42.5)
−⋅ν =
+

5
granular filtration - hydraulicslab experiments
CoefficientofuniformityThe spread in grain sizes should not be too big to avoid stratification during backwashing. The spread is characterized by the coefficient of uni-formity U = d60/d10. Preference is gives to a value of U ≤ 1.2.
SpecificdiameterandshapefactorThe so-called specific diameter of the grains can be found from a sieve analysis with:
[10]in which:W = total weight of the sand sample (g)Wi = weight on sieve i (g)Si = mesh of sieve i (mm)ϕi = shape factor for fraction between sieve i
and sieve i+1 (-)
The shape factor is a measure for the deviation of a spherical particle. For an exact calculation of ds the shape factor of the subfractions should be known. Because these factors cannot be quanti-fied they are assumed to be 1. From formula above is follows that:
[11]
The hydraulic diameter dh as it is determined from the experimental results depends on the bed conditions. Different values will be found for low porosities, high porosities and expanded beds. The ratio between the hydraulic diameter and the specific diameter gives the shape factors for the different hydraulic conditions:
ϕe = dh/ds for expanded bedsϕh = dh/ds for high porosity fixed bedsϕl = dh/ds for low porosity fixed beds
EffectivediameterThe hydraulic diameter for filter materials with unknown shape factors can be approximated In practice by the so-called effective diameter de,
defined as the d10 from a sieve analysis. From the results is should be proved that the ratio between the hydraulic and effectieve diameter is close to 1. This means that the shape factor is determined as ϕ = de/ds
3.4 FurtherapplicationIf the specific diameter ds, the shape factor φ and the density are known, than the flow velocity can be calculated for any expansion using equations [5] and [8], whith the hydraulic diameter dh = φ ds. The porosity that corresponds with that expansion is found with equation [6]. The porosity of the fixed bed is found from the mass and density of the filter material and the bed volume. The head loss of a clean filter bed is calculated with equation [4].
On the other hand the hydraulic diameter dh for any unknown filter material can be calculated from a single expansion experiment using equations [5] and [8]. Next the flow velocity can be calculated for other expansions. The porosity is calculated as explained before.
The experimental results are used for the design of a real-scale treatment plant. It is assumed that the same filter material is used as in the experiment.
4. Procedure
4.1 FiltermaterialsThe experiment is performed with two filter mate-rials:- Meuse sand, commercial fraction 1.0 – 1.6 mm,
density 2,650 kg/m�.- Anthracite (an adapted mineral coal), com-
mercial fraction 1.4 – 2.5 mm, density 1,450 kg/m�.
The masses of both filter beds are given during the experiment.
�1 � n
s 1 1 2 2 2 3 3 3 4 n n n 1
WW W WW ..d S S S S S S S S +
= + + +ϕ ϕ ϕ ϕ
ii
1s i i 1
WWd S S +
=∑
6
lab experimentsgranular filtration - hydraulics
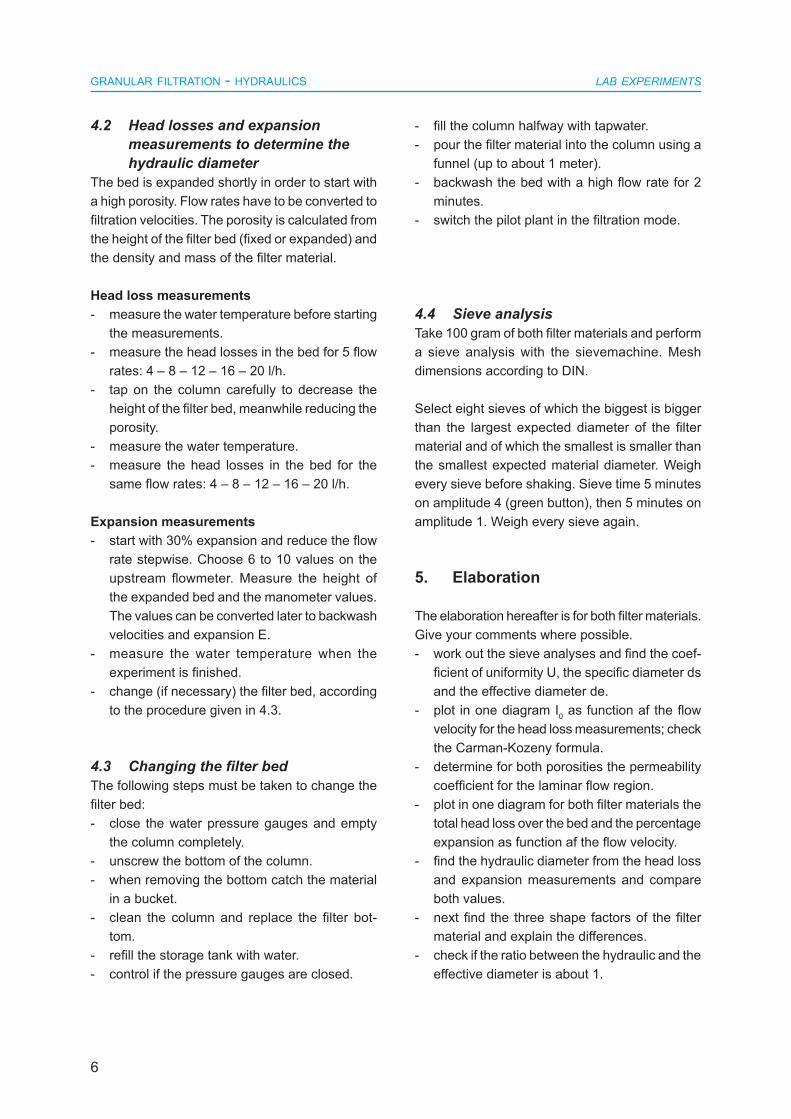
4.2 Headlossesandexpansionmeasurementstodeterminethehydraulicdiameter
The bed is expanded shortly in order to start with a high porosity. Flow rates have to be converted to filtration velocities. The porosity is calculated from the height of the filter bed (fixed or expanded) and the density and mass of the filter material.
Headlossmeasurements- measure the water temperature before starting
the measurements.- measure the head losses in the bed for 5 flow
rates: 4 – 8 – 12 – 16 – 20 l/h.- tap on the column carefully to decrease the
height of the filter bed, meanwhile reducing the porosity.
- measure the water temperature.- measure the head losses in the bed for the
same flow rates: 4 – 8 – 12 – 16 – 20 l/h.
Expansionmeasurements- start with 30% expansion and reduce the flow
rate stepwise. Choose 6 to 10 values on the upstream flowmeter. Measure the height of the expanded bed and the manometer values. The values can be converted later to backwash velocities and expansion E.
- measure the water temperature when the experiment is finished.
- change (if necessary) the filter bed, according to the procedure given in 4.3.
4.3 ChangingthefilterbedThe following steps must be taken to change the filter bed:- close the water pressure gauges and empty
the column completely.- unscrew the bottom of the column.- when removing the bottom catch the material
in a bucket.- clean the column and replace the filter bot-
tom.- refill the storage tank with water.- control if the pressure gauges are closed.
- fill the column halfway with tapwater.- pour the filter material into the column using a
funnel (up to about 1 meter).- backwash the bed with a high flow rate for 2
minutes.- switch the pilot plant in the filtration mode.
4.4 SieveanalysisTake 100 gram of both filter materials and perform a sieve analysis with the sievemachine. Mesh dimensions according to DIN.
Select eight sieves of which the biggest is bigger than the largest expected diameter of the filter material and of which the smallest is smaller than the smallest expected material diameter. Weigh every sieve before shaking. Sieve time 5 minutes on amplitude 4 (green button), then 5 minutes on amplitude 1. Weigh every sieve again.
5. Elaboration
The elaboration hereafter is for both filter materials. Give your comments where possible.- work out the sieve analyses and find the coef-
ficient of uniformity U, the specific diameter ds and the effective diameter de.
- plot in one diagram I0 as function af the flow velocity for the head loss measurements; check the Carman-Kozeny formula.
- determine for both porosities the permeability coefficient for the laminar flow region.
- plot in one diagram for both filter materials the total head loss over the bed and the percentage expansion as function af the flow velocity.
- find the hydraulic diameter from the head loss and expansion measurements and compare both values.
- next find the three shape factors of the filter material and explain the differences.
- check if the ratio between the hydraulic and the effective diameter is about 1.
7
granular filtration - hydraulicslab experiments
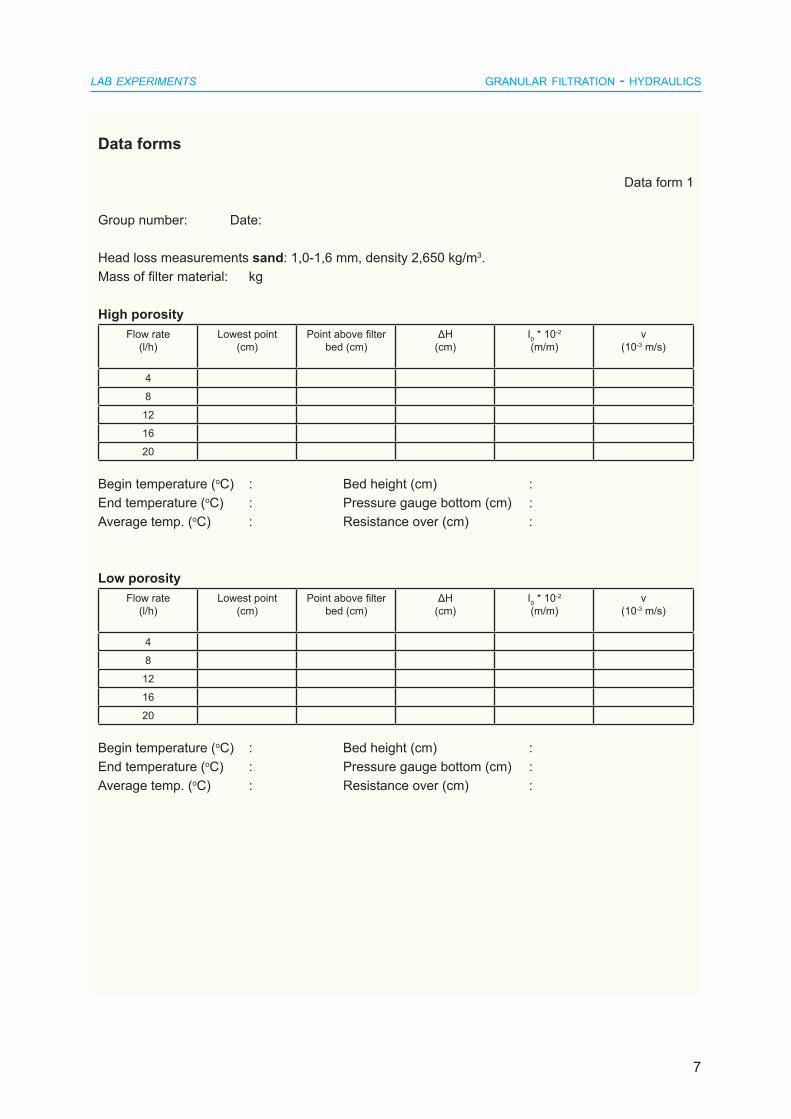
Dataforms
Data form 1
Group number: Date:
Head loss measurements sand: 1,0-1,6 mm, density 2,650 kg/m�.Mass of filter material: kg
HighporosityFlow rate
(l/h)Lowest point
(cm)Point above filter
bed (cm)ΔH
(cm)I0 * 10-�
(m/m)v
(10-� m/s)
4
8
1�
16
20
Begin temperature (oC) : Bed height (cm) :End temperature (oC) : Pressure gauge bottom (cm) :Average temp. (oC) : Resistance over (cm) :
LowporosityFlow rate
(l/h)Lowest point
(cm)Point above filter
bed (cm)ΔH
(cm)I0 * 10-�
(m/m)v
(10-� m/s)
4
8
1�
16
20
Begin temperature (oC) : Bed height (cm) :End temperature (oC) : Pressure gauge bottom (cm) :Average temp. (oC) : Resistance over (cm) :
8
lab experimentsgranular filtration - hydraulics
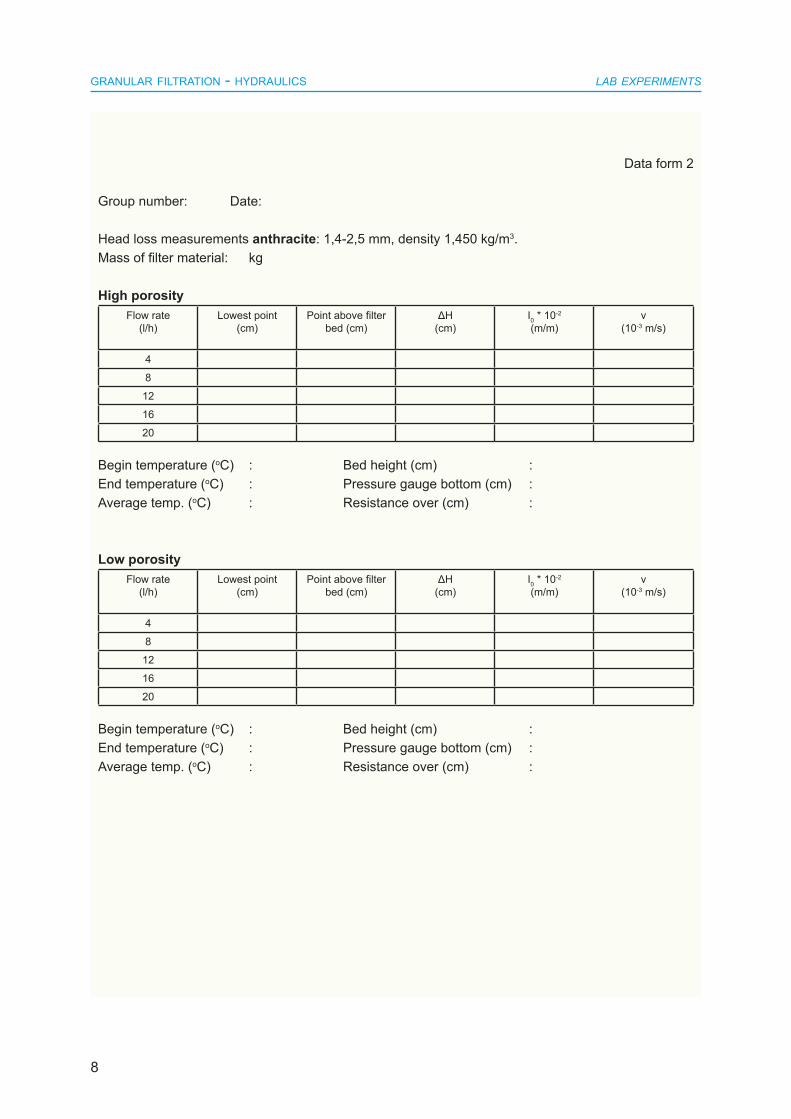
Data form �
Group number: Date:
Head loss measurements anthracite: 1,4-2,5 mm, density 1,450 kg/m�.Mass of filter material: kg
HighporosityFlow rate
(l/h)Lowest point
(cm)Point above filter
bed (cm)ΔH
(cm)I0 * 10-�
(m/m)v
(10-� m/s)
4
8
1�
16
20
Begin temperature (oC) : Bed height (cm) :End temperature (oC) : Pressure gauge bottom (cm) :Average temp. (oC) : Resistance over (cm) :
LowporosityFlow rate
(l/h)Lowest point
(cm)Point above filter
bed (cm)ΔH
(cm)I0 * 10-�
(m/m)v
(10-� m/s)
4
8
1�
16
20
Begin temperature (oC) : Bed height (cm) :End temperature (oC) : Pressure gauge bottom (cm) :Average temp. (oC) : Resistance over (cm) :
9
granular filtration - hydraulicslab experiments
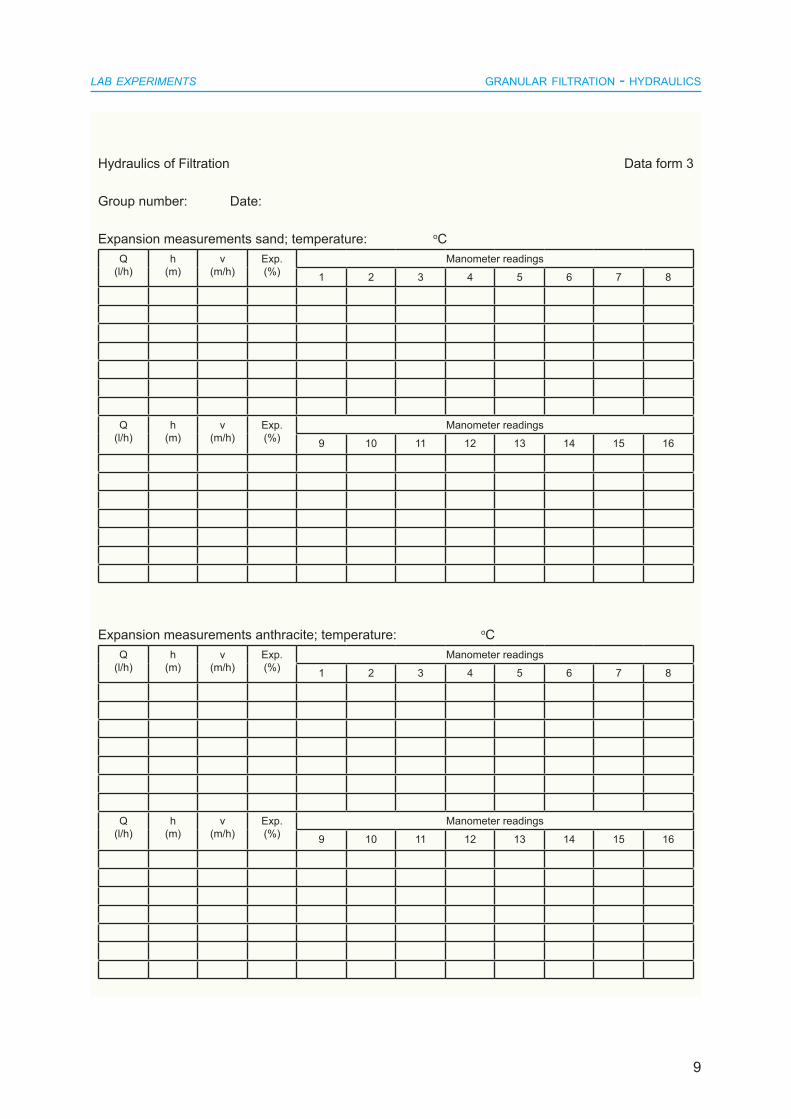
Hydraulics of Filtration Data form 3
Group number: Date:
Expansion measurements sand; temperature: oCQ
(l/h)h
(m)v
(m/h)Exp.(%)
Manometer readings
1 � � 4 5 6 7 8
Q(l/h)
h(m)
v(m/h)
Exp.(%)
Manometer readings
9 10 11 1� 1� 14 15 16
Expansion measurements anthracite; temperature: oCQ
(l/h)h
(m)v
(m/h)Exp.(%)
Manometer readings
1 � � 4 5 6 7 8
Q(l/h)
h(m)
v(m/h)
Exp.(%)
Manometer readings
9 10 11 1� 1� 14 15 16
10
lab experimentsgranular filtration - hydraulics
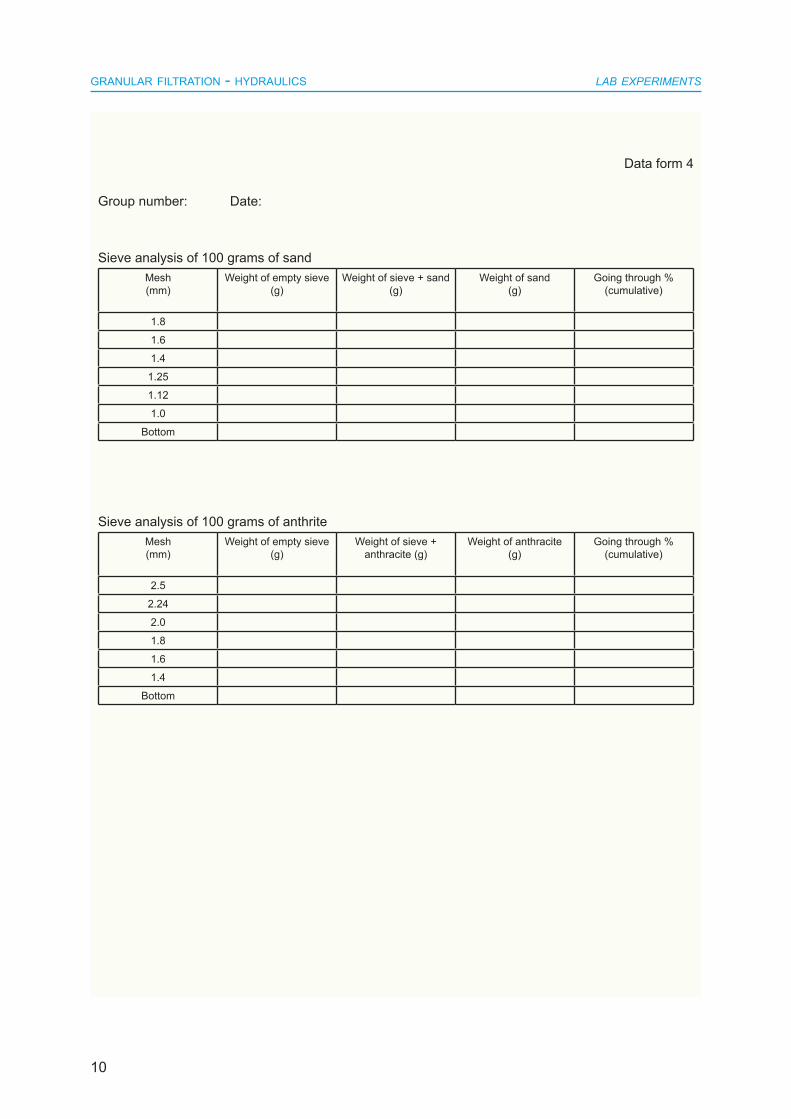
Data form 4
Group number: Date:
Sieve analysis of 100 grams of sandMesh(mm)
Weight of empty sieve (g)
Weight of sieve + sand (g)
Weight of sand(g)
Going through % (cumulative)
1.8
1.6
1.4
1.25
1.12
1.0
Bottom
Sieve analysis of 100 grams of anthriteMesh(mm)
Weight of empty sieve (g)
Weight of sieve + anthracite (g)
Weight of anthracite(g)
Going through %(cumulative)
2.5
2.24
2.0
1.8
1.6
1.4
Bottom


