Granular Friction, Coulomb Failure, and the Fluid-Solid Transition for Horizontally Shaken Granular Materials Guy Metcalfe CSIRO Thermal & Fluids Engineering, Melbourne, VIC 3190, Australia S.G.K. Tennakoon Center for Nonlinear and Complex Systems and Physics Department, Duke University, Durham NC, 27708-0305, USA L. Kondic Mathematics Department, New Jersey Institute of Technology, Newark NJ 07102, USA D.G. Schaeffer Center for Nonlinear and Complex Systems and Mathematics Department, Duke University, Durham NC 27708, USA R. P. Behringer Center for Nonlinear and Complex Systems and Physics Department, Duke University, Durham NC, 27708-0305, USA (November 15, 2001) Abstract We present the results of an extensive series of experiments, molecular dynamics simulations, and models that address hor- izontal shaking of a layer of granular material. The goal of this work was to better understand the transition between the ‘fluid’ and ‘solid’ states of granular materials. In the ex- periments, the material—consisting of glass spheres, smooth and rough sand—was contained in a container of rectangular cross section, and subjected to horizontal shaking of the form x = A sin(ωt). The base of the container was porous, so that it was possible to reduce the effective weight of the sample by means of a vertical gas flow. The acceleration of the shak- ing could be precisely controlled by means of an accelerometer mounted onboard the shaker, plus feedback control and lockin detection. The relevant control parameter for this system was the dimensionless acceleration, Γ = Aω 2 /g, where g was the acceleration of gravity. As Γ was varied, the layer underwent a backward bifur- cation between a solid-like state that was stationary in the frame of the shaker, and a fluid-like state that typically con- sisted of a moving/sloshing layer of maximum depth H riding on top of a solid layer. That is, with increasing Γ, the solid state made a transition to the fluid state at Γcu and once the system was in the fluid state, a decrease in Γ left the system in the fluidized state until Γ reached Γ cd < Γcu. In the flu- idized state, the flow consisted of back and forth sloshing at the shaker frequency, plus a slower convective flow along the shaking direction and additionally in the horizontal direction transverse to the shaking direction. Molecular dynamics sim- ulations show that the last of these flows is associated with shear and dilation at the vertical sidewalls. For Γ < Γcu and in the solid state, there was a ‘gas’ of free particles sliding on the surface of the material. These constituted much less than one layer’s worth of particles in all cases. If these ‘sliders’ were suppressed by placing a thin strip of plastic on the surface, the hysteresis was removed, and the transition to fluidization occurred at a slightly lower value than Γ cd for the free surface case. The hysteresis was also suppressed if a vertical gas flow from the base was sufficient to support roughly 40% of the weight of the sample. Both the transition to the fluid state from the solid and the reverse transition from the fluid to the solid were char- acterized by similar divergent time scales. If Γ was increased above Γcu by a fractional amount ² = (Γ - Γcu)/Γcu, where ² was small, there was a characteristic time τ = A² -β , for the transition from solid to fluid to occur, where β is 1.00 ± 0.06. Similarly, if Γ was decreased below Γ cd in the fluidized state by an amount ² = (Γ - Γ cd )/Γ cd , there was also a transient time τ = B² -β , where β is again indistinguishable from 1.00. In addition, the amplitudes A and B are essentially identical. By placing a small ‘impurity’ on top of the layer, consisting of a heavier particle, we found that the exponent β varied as the impurity mass squared and changed by a factor of 3. A simple Coulomb friction model with friction coefficients μ k <μs for the fluid and solid states predicts a reversible rather than hysteretic transition to the fluid state, similar to what we observe with the addition of the small overload from a plastic strip. In an improved model, we provide a relaxational mechanism that allows the friction coefficient to change continuously between the low and high values. This model produces the hysteresis seen in experiments. PACS numbers: 46.10.+z, 47.20.-k I. INTRODUCTION Granular materials have been the focus of considerable recent interest, as discussed in a number of reviews and collections of papers [1]. An important aspect of granular materials concerns the transition from a compact, rigid solid-like state to a fluid-like state, and the reverse tran- sition from fluid to solid. Solid-fluid granular transitions occur broadly in natural and commercial processes. Ex- amples in nature include avalanches, mudslides, and ice 1
Transcript
Granular Friction, Coulomb Failure, and the Fluid-Solid Transition for Horizontally
Shaken Granular Materials
Guy MetcalfeCSIRO Thermal & Fluids Engineering, Melbourne, VIC 3190, Australia
S.G.K. TennakoonCenter for Nonlinear and Complex Systems and Physics Department, Duke University, Durham NC, 27708-0305, USA
L. KondicMathematics Department, New Jersey Institute of Technology, Newark NJ 07102, USA
D.G. SchaefferCenter for Nonlinear and Complex Systems and Mathematics Department, Duke University, Durham NC 27708, USA
R. P. BehringerCenter for Nonlinear and Complex Systems and Physics Department, Duke University, Durham NC, 27708-0305, USA
(November 15, 2001)
Abstract
We present the results of an extensive series of experiments,molecular dynamics simulations, and models that address hor-izontal shaking of a layer of granular material. The goal ofthis work was to better understand the transition betweenthe ‘fluid’ and ‘solid’ states of granular materials. In the ex-periments, the material—consisting of glass spheres, smoothand rough sand—was contained in a container of rectangularcross section, and subjected to horizontal shaking of the formx = A sin(ωt). The base of the container was porous, so thatit was possible to reduce the effective weight of the sampleby means of a vertical gas flow. The acceleration of the shak-ing could be precisely controlled by means of an accelerometermounted onboard the shaker, plus feedback control and lockindetection. The relevant control parameter for this system wasthe dimensionless acceleration, Γ = Aω2/g, where g was theacceleration of gravity.
As Γ was varied, the layer underwent a backward bifur-cation between a solid-like state that was stationary in theframe of the shaker, and a fluid-like state that typically con-sisted of a moving/sloshing layer of maximum depth H ridingon top of a solid layer. That is, with increasing Γ, the solidstate made a transition to the fluid state at Γcu and once thesystem was in the fluid state, a decrease in Γ left the systemin the fluidized state until Γ reached Γcd < Γcu. In the flu-idized state, the flow consisted of back and forth sloshing atthe shaker frequency, plus a slower convective flow along theshaking direction and additionally in the horizontal directiontransverse to the shaking direction. Molecular dynamics sim-ulations show that the last of these flows is associated withshear and dilation at the vertical sidewalls. For Γ < Γcu andin the solid state, there was a ‘gas’ of free particles sliding onthe surface of the material. These constituted much less thanone layer’s worth of particles in all cases. If these ‘sliders’ weresuppressed by placing a thin strip of plastic on the surface,the hysteresis was removed, and the transition to fluidizationoccurred at a slightly lower value than Γcd for the free surface
case. The hysteresis was also suppressed if a vertical gas flowfrom the base was sufficient to support roughly 40% of theweight of the sample.
Both the transition to the fluid state from the solid andthe reverse transition from the fluid to the solid were char-acterized by similar divergent time scales. If Γ was increasedabove Γcu by a fractional amount ε = (Γ−Γcu)/Γcu, where εwas small, there was a characteristic time τ = Aε−β , for thetransition from solid to fluid to occur, where β is 1.00± 0.06.Similarly, if Γ was decreased below Γcd in the fluidized stateby an amount ε = (Γ − Γcd)/Γcd, there was also a transienttime τ = Bε−β , where β is again indistinguishable from 1.00.In addition, the amplitudes A and B are essentially identical.By placing a small ‘impurity’ on top of the layer, consistingof a heavier particle, we found that the exponent β varied asthe impurity mass squared and changed by a factor of 3.
A simple Coulomb friction model with friction coefficientsµk < µs for the fluid and solid states predicts a reversiblerather than hysteretic transition to the fluid state, similarto what we observe with the addition of the small overloadfrom a plastic strip. In an improved model, we provide arelaxational mechanism that allows the friction coefficient tochange continuously between the low and high values. Thismodel produces the hysteresis seen in experiments.
PACS numbers: 46.10.+z, 47.20.-k
I. INTRODUCTION
Granular materials have been the focus of considerablerecent interest, as discussed in a number of reviews andcollections of papers [1]. An important aspect of granularmaterials concerns the transition from a compact, rigidsolid-like state to a fluid-like state, and the reverse tran-sition from fluid to solid. Solid-fluid granular transitionsoccur broadly in natural and commercial processes. Ex-amples in nature include avalanches, mudslides, and ice
1
floes. In commercial processes, this transition occurs atthe outlet of hoppers, in chute flows, vibration devices,and under other conditions where flow is necessary.
These transitions are intimately connected to Coulombfriction for granular materials and with the solid-on-solid(SoS) friction of grains rubbing against each other. Theyare also connected to Reynolds dilatancy–i.e. the factthat a densely packed granular sample must expand ifthe sample is to deform. The inverse process of com-paction occurs as a dilated or fluidized granular samplecoalesces into a solidified state. The current understand-ing of the solid and fluid states comes from two ratherdisjoint models: continuum models [2] such as those usedin soil mechanics, and kinetic theory models [3].
The standard Mohr-Coulomb failure criterion of soilmechanics predicts failure of a granular layer when theratio of the shear stresses to the normal stresses exceedsan appropriate factor. In general, failure should occuralong surfaces where this condition is met.
In a dilated, energetic state, kinetic theory models, andmore sophisticated Chapman-Enskog theories describethe material as a “granular gas”. The ordinary thermo-dynamic temperature is replaced by the granular temper-ature, Tg, which is proportional to the mean fluctuatingpart of the granular kinetic energy. The hydrodynam-ics of granular materials in this representation are nearlythe same as those for a conventional Newtonian fluid, ex-cept for an additional term in the energy equation due tocollisional energy losses. Additionally, the transport co-efficients and equation of state must reflect the propertiesof a granular system. At present, there is no well estab-lished unifying model that describes the nonequilibriumprocesses involved during the phase change between solidand fluid-like behavior and vice-versa, although a step to-wards a unification of the two approaches has been takenby Savage [4].
The goal of the present experiments and models is tohelp fill the gap by characterizing in detail the transi-tion that occurs between solid and fluid granular stateswhen a granular material is subject to horizontal shaking.Specifically, in the experiments described here, the ma-terial rests within a rectangular container that is subjectto oscillations of the form
x = A sin(ωt). (1)
A key parameter is then the peak acceleration, a = Aω2,or in dimensionless form
Γ ≡ Aω2/g, (2)
where g is the acceleration of gravity. When Γ > µ, orwhen a > µg, where µ is an appropriate friction coeffi-cient, the Mohr-Coulomb picture of failure indicates thatslipping will occur. The idea behind the present experi-ments is to provide an environment in which slipping canbe sustained and hence studied in detail. More precisely,
this environment provides a method to study the transi-tions between the solid and fluid granular states. We alsouse fully three-dimensional discrete element or moleculardynamics (MD) techniques to study aspects of the flowthat occur once the material has made the transition tothe fluid state.
Several other groups or individuals have probed the dy-namics of granular materials subject to horizontal shak-ing. This work includes studies by Evesque [8], Ristowet al. [11], Liffman et al. [10], Saluena et al. [7] andMedved et al. [6]. The work by Ristow et al., Liffmanet al., and Saluena et al. is focused on the application ofMD techniques in two-dimensions. The other two stud-ies noted here are experimental in nature, but they donot focus specifically on the solid-fluid transition regime.The present experiments are an expansion of work thatwe reported earlier [5].
For the present discussion, it is useful to compare thecase of a granular material subject to horizontal shakingto the corresponding case of an ordinary block that rideson an oscillating substrate and experiences SoS Coulombfriction. This model is then germane to the case of gran-ular failure along a horizontal plane. For low substrateaccelerations, such a block experiences a frictional forceFf of magnitude |Ff | ≤ µsmg when the block and thesubstrate are moving at the same speed. Here, µs is thestatic friction coefficient. The point of Mohr-Coulombfailure in a granular material is analogous to the point atwhich the SoS friction is inadequate to hold the block onthe surface without slipping. If the block and substrateare in relative motion, the friction is reduced, and thefrictional force has a magnitude µkmg that is oriented inthe direction of ~vsubstrate−~vblock. If the magnitude of thesubstrate acceleration exceeds µkg, then the block nec-essarily slips. This primitive model shares at least twofeatures with its granular counterpart: first, both exhibitfrictional failure when the acceleration exceeds µg, and inboth cases, once failure has occurred, we expect that thefrictional drag exerted by the substrate will be reduced.There are also important differences between the blockand granular systems, and an understanding of these dif-ferences is crucial to an understanding of the collectivebehavior of granular systems. In Section VI, we explorean improved model that captures features that appear inthe granular case, but that are not necessarily present inthe block-slider case.
The rest of this work is structured as follows. In Sec-tion II, we provide details of the experiment and proce-dure. In Section III, we present a detailed probing of thetransition to sloshing flow, and its origins. In Section IV,we consider a number of approaches where we modify theordinary conditions of the experiment in order to gain in-sight into the nature of the transition and resulting flow.We use MD studies to probe aspects of the convectiveflow, as described in Section V. In Section VI, we proposeand investigate a simple friction model that accounts for
2
the hysteresis seen at the transition. Section VII containsa discussion of the results and conclusions.
II. EXPERIMENT
Air flow
Porous base
Accelerometer
Granular mediumshakerElectro-magnetic
Cell
Shaker table
Linear bearingsFIG. 1. Schematic of the apparatus. The rectangular cell is
made of Plexiglas, and is mounted on a Plexiglas base of thesame cross-sectional dimensions. The base is attached to asmall table, which in turn is mounted on four linear bearingsrunning on horizontal cylindrical guide rods rigidly attachedto a fixed bottom frame. The porous base of the cell can actas a gas distributor. An electro-mechanical actuator, drivenby a sinusoidal AC signal provides the horizontal driving.
Our experimental setup is shown in Fig. 1. To facilitatethe discussion, we refer to the direction of shaking as x,the horizontal direction perpendicular to x as z, and thevertical direction as y. The heart of the experiment is arectangular Plexiglas cell with dimensions Lz = 1.93 cmby Lx = 12.1 cm. The height, Ly ' 12 cm, of the cell ismuch taller than the fill height. The base of the cell ismade of porous polypropylene (average pore size 50µm)through which gas can flow in order to fluidize the gran-ular medium. This provides an independent control overthe dilation of the material. The pressure gradient acrossthe distributor is more than 50% of the total pressure gra-dient; hence, when gas flow is used, there is reasonablyeven air distribution across the granular bed. The cell ismounted on a Plexiglas base of the same cross-sectionaldimensions as the cell, which is in turn mounted on amovable table. The base acts as the gas distributor tothe system, and it is connected to a constant pressuresource through a flexible hose. The table is mountedon four linear bearings sliding on two horizontal shaftsrigidly attached to the fixed bottom frame. An electro-mechanical actuator provides a sinusoidal drive of theform x = A sin ωt at frequencies, f = ω/2π, spanning3 − 15Hz and at amplitudes A, spanning 0 − 15mm.The maximum acceleration that we can achieve with thepresent apparatus is Γmax ' 2. A calibrated accelerom-eter [12] mounted on the moving table measures the ac-celeration of the cell.
In order to investigate the behavior of this system nearthe relevant transitions points, it is crucial to have a pre-cise measure of Γ. The acceleration is measured witha resolution of ∼ 0.011% with lock-in detection and abridge circuit sketched in Fig. 2. We discuss the detailsof the detection process in that figure.
Oscillator
Vo
Voltagedivider
Rp
Rv
Currentamplifier Shaker Accelerometer
Phaseshifter
Isolationtransformer
Ratiotransformer
VDDifferentialamplifier
Lockinamplifier
Chartrecorder
+
–
φ
VA
FIG. 2. Schematic of acceleration measurement electron-ics. The principle of operation is that an oscillator providesa reference source to both a power amplifier and to a ratiotransformer (variable center-tapped inductor). The output ofthe power amplifier drives the shaker. An accelerometer rideswith the shaker, and the output of the accelerometer VA iscompared with a fraction of the voltage from the oscillatorVD through a differential amplifier and lock-in detector. Thislatter voltage has been phase shifted appropriately, so thatits phase matches that of the signal from the accelerometer.The bridge circuit is nulled by adjusting the ratio transformer,whose value directly yields the acceleration amplitude.
We note that other parameters besides Γ, might beimportant, as is the case in describing higher order phe-nomena in vertically shaken materials (e.g. travelingwaves [13] and coarsening [14]). In horizontal shakingexperiments, frictional properties are relevant. Recentexperiments [9] show that the ratio A/d may be impor-tant for highly monodisperse grains which can lock intoa crystalline state, depending on that ratio. However,the materials used here were not particularly monodis-perse. And, we did not observe any dependence of thequalitative flow properties or of the quantitative resultsfor critical parameters on A/d. We consider this point inmore detail below.
We used several types of approximately monodis-perse granular materials, including spherical glass beads,smooth Ottawa sand, and sieved rough sand—with sim-ilar effects. Some relevant information is summarized inTable I.
TABLE I. Summary of materials used and of cell dimen-sions.
3
Throughout these experiments, we used the followingprocedure. The material was poured into the cell andpartially compacted by flattening the surface. The com-paction was enhanced by shaking at relatively low Γ be-fore proceeding to higher values. Typically, the layer hada height h/d ' 40; as long as h/d ' 20, we found no de-pendence on h, as demonstrated below. In a typical run,we observed the evolution of the system as A, and henceΓ, was increased from zero while keeping ω fixed. Onceflow was well initiated, we then decreased A.
III. THE PRIMARY BIFURCATION
In this section, we present detailed studies of the ex-perimentally determined bifurcation diagram near onset.We also discuss the character of the flow field in the fluidstate. We conclude this section with an exploration ofunstable states and a comparison to previous results.
A. A Backwards Bifurcation
As Γ is increased slowly from a low value, the system,regardless of material type, undergoes a hysteretic, i.e.backward, bifurcation at Γcu to a flow state character-ized by strong sloshing motion of a fluidized layer. Auseful measure of the strength of the flow is the thick-ness, H, of the liquefied material in the middle (Lx/2)of the cell, as in Fig. 3. We show results for three dif-ferent materials in Fig. 4. Specifically, with increasingΓ, the solid layer becomes unstable at Γcu to the forma-tion of a fluidized layer. In the experiments, H was mea-sured by following the motion of the grains using close-upimages from a shaker mounted camera. Grain displace-ments near x = Lx/2 decrease roughly linearly with thedistance y from the top surface, except for the last fewparticle layers that separate the fluid and solid. Once thefluid state has formed, it is stable for decreasing Γ untilΓcd < Γcu. At Γcd, the fluidized layer disappears, andthe material is once more in the solid state. In additionto the sloshing flow, there are two types of circulatingor convective flow. The two different convective compo-nents have very different origins, and we discuss thesebelow. An additional feature is the existence of a smallnumber of free grains, ‘sliders’, that move on the surfaceat Γ’s less than Γcu.
It is interesting that this transition is hysteretic. Bycontrast, ordinary SoS friction for a block on an oscillat-ing substrate is not hysteretic. Specifically, for the blocksystem, if Γ exceeds µs by a small amount, stick-slip mo-tion evolves, in which the block spends part of each cycleslipping, and part moving with the substrate. We dis-cuss this at some length in the context of Section VI andFig. 24. If Γ is reduced below µs, this stick-slip motionvanishes. The important difference appears to be that
for the granular system, the grains must dilate in orderto flow [15], but once dilated, the flow is more easily sus-tained. The time needed for this dilation/compaction tooccur is an important piece of the explanation for hys-teresis in the granular system.
x
yz
H
FIG. 3. Sketch of time-averaged convection flow lines inthe liquefied layer induced by horizontal shaking as seen inperspective from the top, and side. Grains rise in the middleof the cell, flow along the surface towards the side walls, andthen sink at the wall boundaries. Superposed on this motionis the sloshing that occurs in the x-direction.
B. Properties of the Transition
Different ω’s or A’s yield the same critical Γcd’s andΓcu’s for a given material and fill height for the full rangeof A’s and ω’s that we explored. Thus, Γ is the relevantcontrol parameter. We document this point in Fig 5,which shows data for Γcu as a function of shaker fre-quency. Within experimental resolution (and within theexperimentally accessible range of parameters), there isno variation of these Γ’s with ω. A similar conclusion fol-lows concerning the independence of critical Γ’s on theamplitude, A.
4
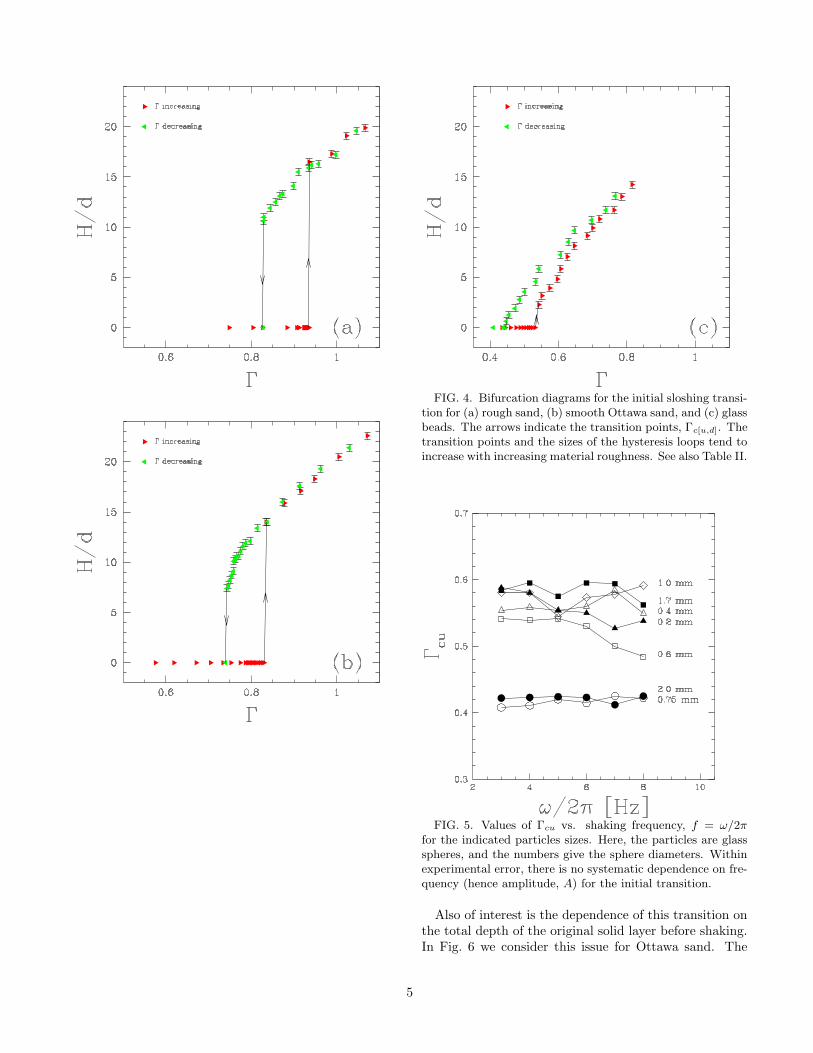
FIG. 4. Bifurcation diagrams for the initial sloshing transi-tion for (a) rough sand, (b) smooth Ottawa sand, and (c) glassbeads. The arrows indicate the transition points, Γc[u,d]. Thetransition points and the sizes of the hysteresis loops tend toincrease with increasing material roughness. See also Table II.
FIG. 5. Values of Γcu vs. shaking frequency, f = ω/2πfor the indicated particles sizes. Here, the particles are glassspheres, and the numbers give the sphere diameters. Withinexperimental error, there is no systematic dependence on fre-quency (hence amplitude, A) for the initial transition.
Also of interest is the dependence of this transition onthe total depth of the original solid layer before shaking.In Fig. 6 we consider this issue for Ottawa sand. The
5
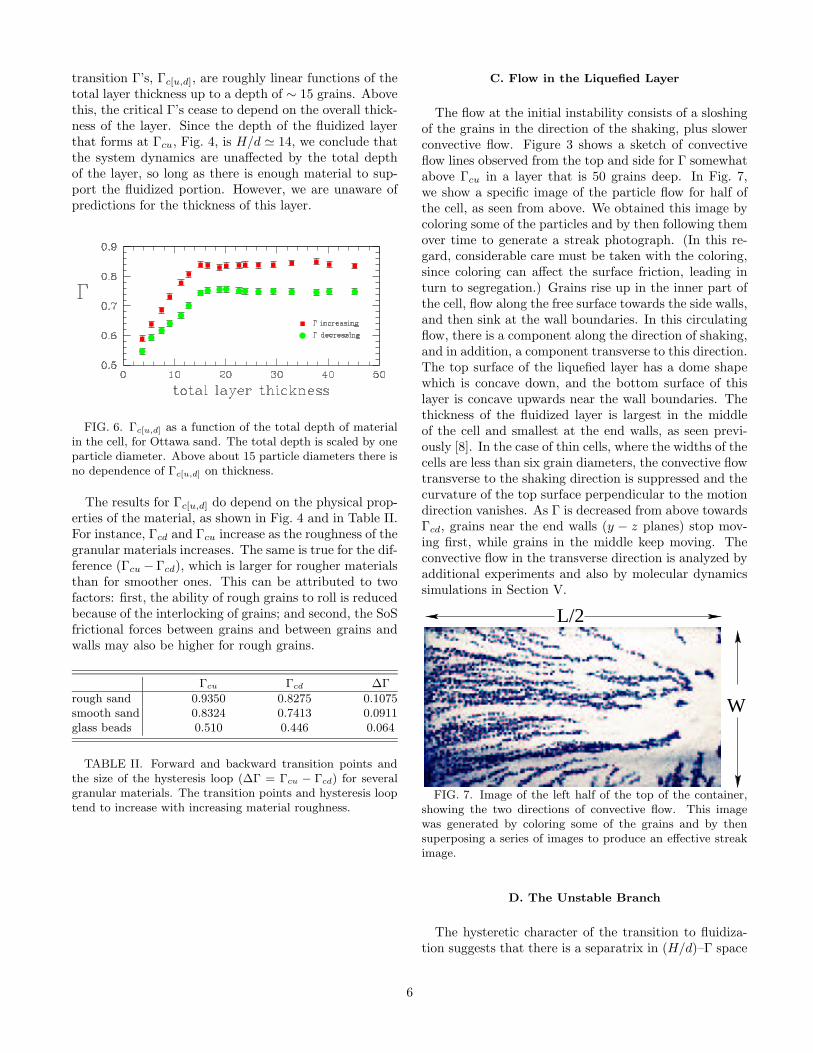
transition Γ’s, Γc[u,d], are roughly linear functions of thetotal layer thickness up to a depth of ∼ 15 grains. Abovethis, the critical Γ’s cease to depend on the overall thick-ness of the layer. Since the depth of the fluidized layerthat forms at Γcu, Fig. 4, is H/d ' 14, we conclude thatthe system dynamics are unaffected by the total depthof the layer, so long as there is enough material to sup-port the fluidized portion. However, we are unaware ofpredictions for the thickness of this layer.
FIG. 6. Γc[u,d] as a function of the total depth of materialin the cell, for Ottawa sand. The total depth is scaled by oneparticle diameter. Above about 15 particle diameters there isno dependence of Γc[u,d] on thickness.
The results for Γc[u,d] do depend on the physical prop-erties of the material, as shown in Fig. 4 and in Table II.For instance, Γcd and Γcu increase as the roughness of thegranular materials increases. The same is true for the dif-ference (Γcu −Γcd), which is larger for rougher materialsthan for smoother ones. This can be attributed to twofactors: first, the ability of rough grains to roll is reducedbecause of the interlocking of grains; and second, the SoSfrictional forces between grains and between grains andwalls may also be higher for rough grains.
TABLE II. Forward and backward transition points andthe size of the hysteresis loop (∆Γ = Γcu − Γcd) for severalgranular materials. The transition points and hysteresis looptend to increase with increasing material roughness.
C. Flow in the Liquefied Layer
The flow at the initial instability consists of a sloshingof the grains in the direction of the shaking, plus slowerconvective flow. Figure 3 shows a sketch of convectiveflow lines observed from the top and side for Γ somewhatabove Γcu in a layer that is 50 grains deep. In Fig. 7,we show a specific image of the particle flow for half ofthe cell, as seen from above. We obtained this image bycoloring some of the particles and by then following themover time to generate a streak photograph. (In this re-gard, considerable care must be taken with the coloring,since coloring can affect the surface friction, leading inturn to segregation.) Grains rise up in the inner part ofthe cell, flow along the free surface towards the side walls,and then sink at the wall boundaries. In this circulatingflow, there is a component along the direction of shaking,and in addition, a component transverse to this direction.The top surface of the liquefied layer has a dome shapewhich is concave down, and the bottom surface of thislayer is concave upwards near the wall boundaries. Thethickness of the fluidized layer is largest in the middleof the cell and smallest at the end walls, as seen previ-ously [8]. In the case of thin cells, where the widths of thecells are less than six grain diameters, the convective flowtransverse to the shaking direction is suppressed and thecurvature of the top surface perpendicular to the motiondirection vanishes. As Γ is decreased from above towardsΓcd, grains near the end walls (y − z planes) stop mov-ing first, while grains in the middle keep moving. Theconvective flow in the transverse direction is analyzed byadditional experiments and also by molecular dynamicssimulations in Section V.
L/2
W
FIG. 7. Image of the left half of the top of the container,showing the two directions of convective flow. This imagewas generated by coloring some of the grains and by thensuperposing a series of images to produce an effective streakimage.
D. The Unstable Branch
The hysteretic character of the transition to fluidiza-tion suggests that there is a separatrix in (H/d)–Γ space
6
connecting the fluid state at Γcd with the solid state atΓcu. If a perturbation of size h is created for Γcd ≤ Γ ≤Γcu, this perturbation will grow to the fluid state if hlies above the separatrix, and it will shrink if it lies be-low. (In the case of a simple backwards bifurcation, thiscurve is a line of unstable equilibrium states.) Such acurve does exist for this system, and we have accessed itby applying controlled perturbations consisting of smallbursts of pressurized air. We use the device sketched inFig. 8. A constant pressure air flow jets onto the gran-ular surface. A solenoid valve controls the jet duration,which in these experiments was fixed at 1 sec. The jet de-posits a fixed amount of momentum to the surface, whichwe adjust by changing the pressure. Note that the per-turbation could produce different results if the jet weredirected at an angle to the surface. However, in theseexperiments the jet always impinged perpendicularly tothe surface. The resulting bolus of air is delivered toa region directly above the middle of the surface of thegranular material through a flexible tube that is termi-nated by a glass eye-dropper. Depending on the valueof Γ, there is a well defined and reproducible pressurepulse that is just sufficient to initiate a transition to thefluid state if Γcd ≤ Γ ≤ Γcu. Just above Γcd, a modestlylarge pressure pulse is needed to make the transition tothe fluidized state; just below Γcu, only a tiny pulse isneeded. We show the locus of this curve, along withthe data for H/d for the case of smooth Ottawa sand inFig. 9. Here, we have rescaled the pressure pulse data sothat it coincides with the curve of H/d at Γcd. A usefulfeature of this procedure is a demonstration of the factthat the system is unstable to very weak perturbationsas Γ approaches Γcu from below. For instance, Fig. 10shows the amount of excess pressure needed to initiatethe instability and the time interval from application ofthe pulse to a completely sloshing cell.
FIG. 8. Schematic of air cannon used to perturb the gran-ular surface.
FIG. 9. Complete bifurcation diagram for horizontallyshaken smooth Ottawa sand.
FIG. 10. Perturbation pressures and transition time variesalong the unstable branch of figure 9. Plotted above is theperturbation in pressure units of inches of water. Plottedbelow is the time interval from application of the perturbationto completion of the transition versus ε = (Γ − Γcu)/Γcu.
E. Nucleation of the Fluid State and Decay to the
Solid State
The spatial character of the onset to flow is an im-portant aspect of the transition from solid to fluid with
7
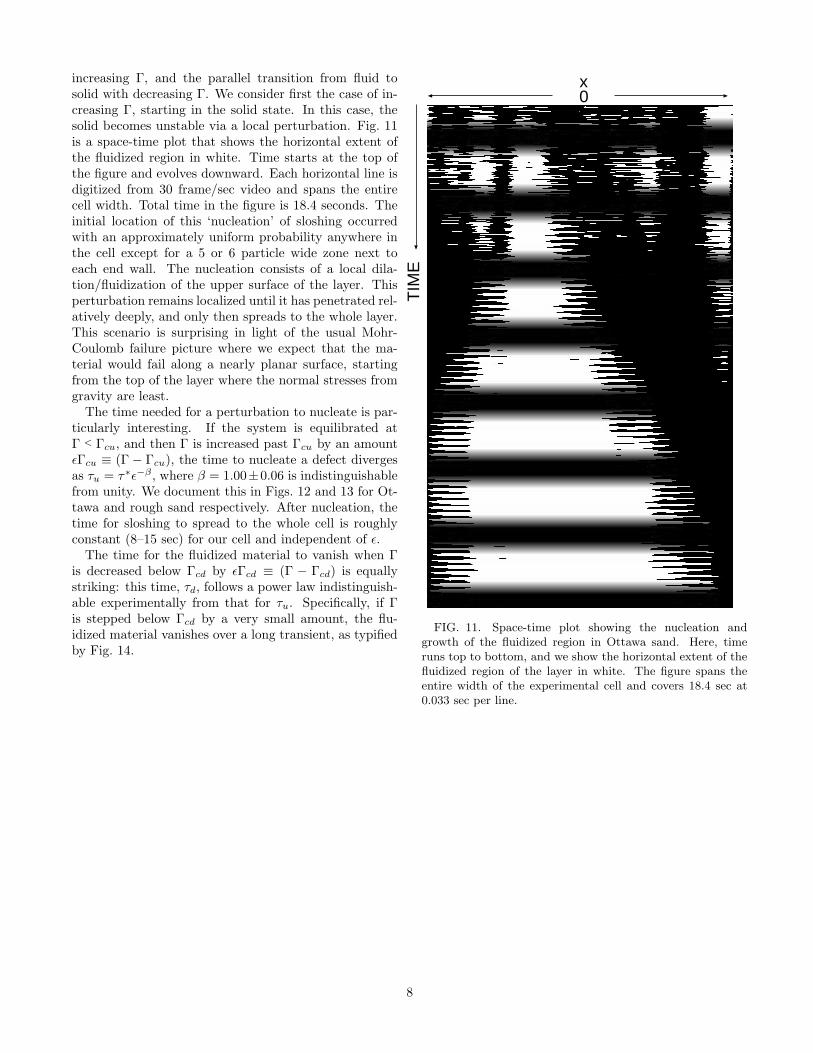
increasing Γ, and the parallel transition from fluid tosolid with decreasing Γ. We consider first the case of in-creasing Γ, starting in the solid state. In this case, thesolid becomes unstable via a local perturbation. Fig. 11is a space-time plot that shows the horizontal extent ofthe fluidized region in white. Time starts at the top ofthe figure and evolves downward. Each horizontal line isdigitized from 30 frame/sec video and spans the entirecell width. Total time in the figure is 18.4 seconds. Theinitial location of this ‘nucleation’ of sloshing occurredwith an approximately uniform probability anywhere inthe cell except for a 5 or 6 particle wide zone next toeach end wall. The nucleation consists of a local dila-tion/fluidization of the upper surface of the layer. Thisperturbation remains localized until it has penetrated rel-atively deeply, and only then spreads to the whole layer.This scenario is surprising in light of the usual Mohr-Coulomb failure picture where we expect that the ma-terial would fail along a nearly planar surface, startingfrom the top of the layer where the normal stresses fromgravity are least.
The time needed for a perturbation to nucleate is par-ticularly interesting. If the system is equilibrated atΓ < Γcu, and then Γ is increased past Γcu by an amountεΓcu ≡ (Γ − Γcu), the time to nucleate a defect divergesas τu = τ∗ε−β , where β = 1.00±0.06 is indistinguishablefrom unity. We document this in Figs. 12 and 13 for Ot-tawa and rough sand respectively. After nucleation, thetime for sloshing to spread to the whole cell is roughlyconstant (8–15 sec) for our cell and independent of ε.
The time for the fluidized material to vanish when Γis decreased below Γcd by εΓcd ≡ (Γ − Γcd) is equallystriking: this time, τd, follows a power law indistinguish-able experimentally from that for τu. Specifically, if Γis stepped below Γcd by a very small amount, the flu-idized material vanishes over a long transient, as typifiedby Fig. 14.
0x
TIM
E
FIG. 11. Space-time plot showing the nucleation andgrowth of the fluidized region in Ottawa sand. Here, timeruns top to bottom, and we show the horizontal extent of thefluidized region of the layer in white. The figure spans theentire width of the experimental cell and covers 18.4 sec at0.033 sec per line.
8
FIG. 12. Power law transition times for smooth Ottawasand. The circles are for the transition from fluid to solid,and the triangles are for the transition from all solid to thestate with a fluid layer.
FIG. 13. Powerlaw transition times for rough sand. Thesymbols are the same as those for Ottawa sand.
��
���
�
FIG. 14. Space-time plot showing the vanishing of the fluidlayer for a small step below Γcd in Ottawa sand, similar tofigure 11 for nucleation growth but covering a total time of919 sec at 1 sec per line.
F. Comparison to Other Work
It is useful to compare our observations to previous MDcalculations and experiments. Regarding hysteresis, wenote that some hysteresis is present in 2D studies by Ris-tow et al. [11], but the hysteresis in our 3D experiments islarger, particularly for rougher materials. Also, we do notsee the 4-roll state reported by Liffman et al. in 2D MDstudies [10]. In order to further pursue their prediction,we have tried to replicate these studies [10] using a tallnarrow cell for which Lx is similar to the model value (30particle diameters), and Lz is only slightly larger than aparticle diameter. However, we still do not observe thesecondary 4-roll convective state for Γ ≤ 2. We notethat 4-roll states have been experimentally observed byMedved et al. [6] but in a 3D system, at much larger ac-
9
celerations, and with an opposite sense of rotation fromthose predicted in [10] (see also [7]). It seems most likelythat friction with the sidewalls significantly perturbs theexperimental flow, thus limiting the similarity betweenthe system considered here and in [10]. Also using MD,Zhang and Campbell [21] study the solid to fluid (but notthe reverse) transition. They find the transition followsa Mohr-Coulomb failure mode with a flow rapidly chang-ing from stagnant, through quasi-static to fully mobilizedrapid granular flow.
IV. MODIFYING THE BIFURCATION
In order to obtain additional insight into the collectiveprocess that is at play in the fluidization and transitionprocesses, we have carried out several additional experi-ments (without the gas puffer) that modify the conditionsof the layer. Interestingly, even seemingly weak pertur-bations have a dramatic effect on the transition. Themodifications to the unperturbed flow that we considerhere include a) vertical gas flow (below the fluidizationpressure), b) suppression of the sliders by a light, solidstrip of plastic; and c) the addition of a particle on thesurface that is more massive than the sand particles. Wediscuss these experiments and their results in the follow-ing subsections.
A. Air Fluidization
To obtain additional insight into the relative impor-tance of dilatancy and friction, we have fluidized thegranular bed by passing air through it, using the flow-controlled air supply and the porous base of the shaker(see Fig. 1). Here, the goal is to remove or reduce theinterlocking of the grains. Figure 15, which presents Γcu
and Γcd as a function of the measured pressure differ-ence ∆P across the granular medium, indicates a strongdependence of these quantities on dilation. In this fig-ure, we nondimensionlize ∆P by the weight W of thegranular material per unit area. In particular, a mod-est air flow corresponding to about 40% of the weightof the bed reduces the critical Γ’s by as much as half,and effectively removes the hysteresis in the initial tran-sition. The measured dilation of the bed at this pointdue to the air flow corresponds to less than one granularlayer for a bed of 45 layers, i.e. less than 2% dilation.As a rough comparison, all interlocking is removed for asquare sphere packing (solids fraction ν = 0.52), whereasa typical dense sphere packing has ν = 0.64; these differby 18%.
FIG. 15. Modification of bifurcation points, Γc[u,d], by airfluidization for smooth Ottawa sand. ∆P is the pressure dif-ference across the granular material normalized by its weightper area, W .
B. Effect of a Uniform Overburden
The Mohr-Coulomb picture of failure suggests that thetransition from solid to fluid would occur along a roughlyplanar surface such that the material is at the failurelocus. The end walls provide additional stress, so thatthe failure locus need not be exactly planar. However, inthese experiments, the failure occurs at a local nucleationsite.
In order to further investigate the issue of what causesfailure, we added an overburden consisting of strips ofplastic that covered the majority of the upper surfaceof the sample. These strips were free to move verticallyand also had limited (less than half a particle diameter)freedom of movement in the horizontal directions. Theexpectation was that this overburden would apply an ad-ditional uniform force on the sample, hence elevating thetransition point, and possibly increasing the amount ofhysteresis in the bifurcation diagram, H-vs-Γ.
Neither of these expectations were borne out in theexperiment. Rather, the transition point from solid tofluid occurred at a value of Γ that was slightly less thanΓcd, and no hysteresis was evident. We document thisin Fig. 16. Here, the open symbols represent the origi-nal data obtained without any overburden, and the solidsymbols represent the data obtained with an overburdenthat has a mass corresponding to 0.5 grain layers–a veryslight overburden. With this overburden, there is now ajump in the mean thickness of the layer at the transition,and no observable hysteresis.
10
The behavior with the overburden is what we wouldexpect from a naive friction model with an instantaneouschange between µs and µk. The low mass of the over-burden suggests, in the context of the Mohr-Coulombpicture, that it should have a relatively weak affect onthe granular failure. Yet, it has a dramatic effect on thetransition. The overburden strips play at least one clearrole on the dyanamics of this system, which is to suppressthe layer of ‘sliders’, i.e. the small number of free gas-likeparticles that are present for Γ’s below Γcu. In general,however, we can only speculate on the mechanism thatchanges the bifurcation. One possibility is that the sup-pression of the sliders and the additional small overbur-den makes the system more uniform. Alternatively, thesliders may stabilize the surface layer by strengtheningweak regions or by disrupting the growth of an unstablenucleus.
FIG. 16. Modification of the bifurcation by a small over-burden, for smooth Ottawa sand. In this case, the mass ofthe overburden corresponds to 50% of one layer of particles.The primary physical effect of the overburden appears to bea suppression of the motion of the surface “sliders”. Opensymbols and dotted lines are the scaled data with no suppres-sion from figure 4(b). Filled symbols are the data with slidersuppression. The hysteresis loop disappears, and the bifur-cation appears similar to that expected for a Coulomb block,c.f. Fig. 24a.
As the amount of confining pressure, Pc, from an over-burden increases, the depth of the fluid layer is system-atically reduced. We show this is Fig. 17. Here, we nor-malize Pc by the mass per area of a single layer of grains.The different symbols show different initial H/d’s (andhence Γ’s) corresponding to unburdened layers from fig-ure 4b. For small overburdens, there is a linear reduction
in H as Pc is increased. As Pc increases, H/d tends toasymptote to a minimum value of H/d ' 5, regardless ofthe thickness that the layer would have in the absence ofan overburden. The figure inset shows the slope of thesolid lines as a function of the unburdened layer height.The deeper the initial fluidized layer (or the larger Γ),the fewer layers cease sloshing on application of greaterconfining pressure.
FIG. 17. Depth of sloshing layer of smooth Ottawa sand asa function of confining pressure, Pc, at several unconfinedlayer thicknesses. The confining pressure is scaled by theweight of one layer of particles. mp and dp are a particlemass and diameter. f describes the layer packing fraction,assumed to be 0.64, which is appropriate for random closepacking.
C. Surface Impurities
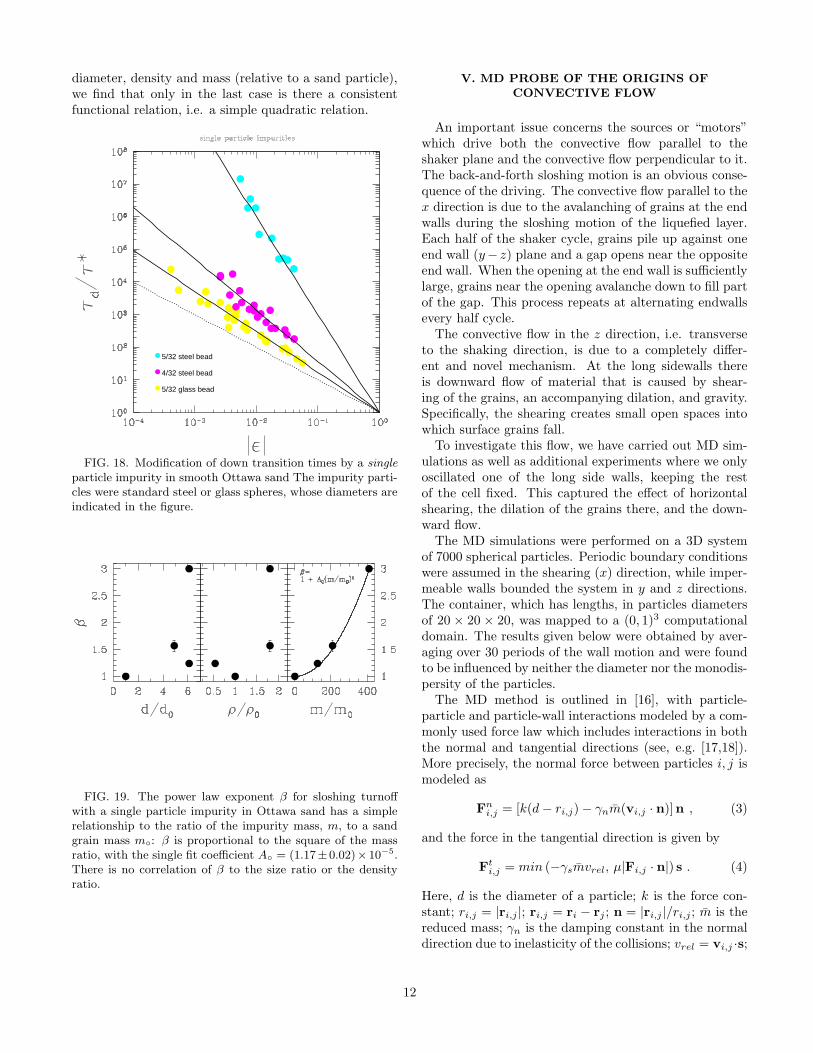
The addition of an impurity particle that is larger ormore massive than the rest of the particles in an approx-imately monodisperse sample has a strong effect on therelaxation time from the fluid to the solid when Γ is de-creased below Γcd. By adding a much more massive par-ticle, it is possible to sustain the fluid phase for times thatare four orders of magnitude greater than in the absenceof the intruder. In particular, the exponent β can beincreased in magnitude from 1 to ≈ 3. Fig. 18 shows re-laxation times vs. ε for various particles in Ottawa sand,which has a typical grain diameter of 0.6 mm. The dot-ted line is the least-squares fit to the unperturbed data.Note that the exponent, β in the power law τ ∝ |ε|−β
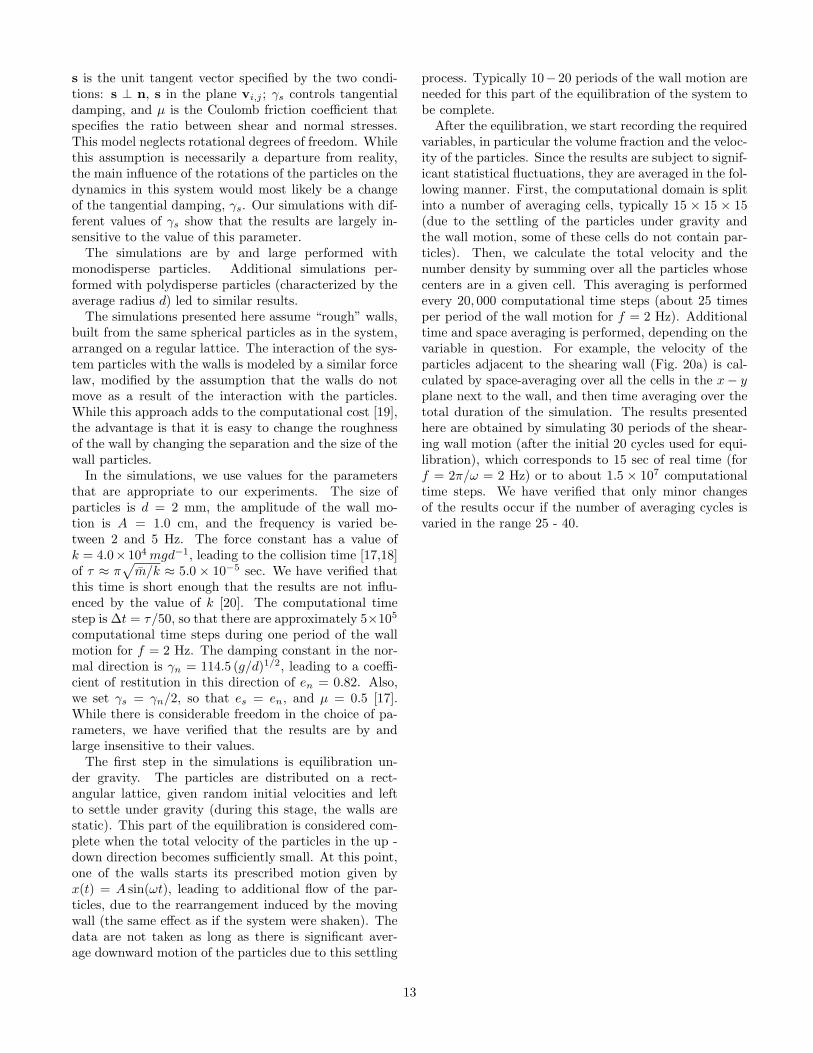
rises dramatically. In Fig. 19, we show that it is themass of the intruder that is responsible for the changein β. Specifically, when we plot β versus the intruder
11
diameter, density and mass (relative to a sand particle),we find that only in the last case is there a consistentfunctional relation, i.e. a simple quadratic relation.
5/32 steel bead
5/32 glass bead
4/32 steel bead
FIG. 18. Modification of down transition times by a single
particle impurity in smooth Ottawa sand The impurity parti-cles were standard steel or glass spheres, whose diameters areindicated in the figure.
FIG. 19. The power law exponent β for sloshing turnoffwith a single particle impurity in Ottawa sand has a simplerelationship to the ratio of the impurity mass, m, to a sandgrain mass m◦: β is proportional to the square of the massratio, with the single fit coefficient A◦ = (1.17± 0.02)× 10−5.There is no correlation of β to the size ratio or the densityratio.
V. MD PROBE OF THE ORIGINS OF
CONVECTIVE FLOW
An important issue concerns the sources or “motors”which drive both the convective flow parallel to theshaker plane and the convective flow perpendicular to it.The back-and-forth sloshing motion is an obvious conse-quence of the driving. The convective flow parallel to thex direction is due to the avalanching of grains at the endwalls during the sloshing motion of the liquefied layer.Each half of the shaker cycle, grains pile up against oneend wall (y− z) plane and a gap opens near the oppositeend wall. When the opening at the end wall is sufficientlylarge, grains near the opening avalanche down to fill partof the gap. This process repeats at alternating endwallsevery half cycle.
The convective flow in the z direction, i.e. transverseto the shaking direction, is due to a completely differ-ent and novel mechanism. At the long sidewalls thereis downward flow of material that is caused by shear-ing of the grains, an accompanying dilation, and gravity.Specifically, the shearing creates small open spaces intowhich surface grains fall.
To investigate this flow, we have carried out MD sim-ulations as well as additional experiments where we onlyoscillated one of the long side walls, keeping the restof the cell fixed. This captured the effect of horizontalshearing, the dilation of the grains there, and the down-ward flow.
The MD simulations were performed on a 3D systemof 7000 spherical particles. Periodic boundary conditionswere assumed in the shearing (x) direction, while imper-meable walls bounded the system in y and z directions.The container, which has lengths, in particles diametersof 20 × 20 × 20, was mapped to a (0, 1)3 computationaldomain. The results given below were obtained by aver-aging over 30 periods of the wall motion and were foundto be influenced by neither the diameter nor the monodis-persity of the particles.
The MD method is outlined in [16], with particle-particle and particle-wall interactions modeled by a com-monly used force law which includes interactions in boththe normal and tangential directions (see, e.g. [17,18]).More precisely, the normal force between particles i, j ismodeled as
Fni,j = [k(d − ri,j) − γnm(vi,j · n)]n , (3)
and the force in the tangential direction is given by
Fti,j = min (−γsmvrel, µ|Fi,j · n|) s . (4)
Here, d is the diameter of a particle; k is the force con-stant; ri,j = |ri,j |; ri,j = ri − rj ; n = |ri,j |/ri,j ; m is thereduced mass; γn is the damping constant in the normaldirection due to inelasticity of the collisions; vrel = vi,j ·s;
12
s is the unit tangent vector specified by the two condi-tions: s ⊥ n, s in the plane vi,j ; γs controls tangentialdamping, and µ is the Coulomb friction coefficient thatspecifies the ratio between shear and normal stresses.This model neglects rotational degrees of freedom. Whilethis assumption is necessarily a departure from reality,the main influence of the rotations of the particles on thedynamics in this system would most likely be a changeof the tangential damping, γs. Our simulations with dif-ferent values of γs show that the results are largely in-sensitive to the value of this parameter.
The simulations are by and large performed withmonodisperse particles. Additional simulations per-formed with polydisperse particles (characterized by theaverage radius d) led to similar results.
The simulations presented here assume “rough” walls,built from the same spherical particles as in the system,arranged on a regular lattice. The interaction of the sys-tem particles with the walls is modeled by a similar forcelaw, modified by the assumption that the walls do notmove as a result of the interaction with the particles.While this approach adds to the computational cost [19],the advantage is that it is easy to change the roughnessof the wall by changing the separation and the size of thewall particles.
In the simulations, we use values for the parametersthat are appropriate to our experiments. The size ofparticles is d = 2 mm, the amplitude of the wall mo-tion is A = 1.0 cm, and the frequency is varied be-tween 2 and 5 Hz. The force constant has a value ofk = 4.0× 10⁴ mgd−1, leading to the collision time [17,18]of τ ≈ π
√
m/k ≈ 5.0 × 10⁻⁵ sec. We have verified thatthis time is short enough that the results are not influ-enced by the value of k [20]. The computational timestep is ∆t = τ/50, so that there are approximately 5×10⁵
computational time steps during one period of the wallmotion for f = 2 Hz. The damping constant in the nor-mal direction is γn = 114.5 (g/d)1/2, leading to a coeffi-cient of restitution in this direction of en = 0.82. Also,we set γs = γn/2, so that es = en, and µ = 0.5 [17].While there is considerable freedom in the choice of pa-rameters, we have verified that the results are by andlarge insensitive to their values.
The first step in the simulations is equilibration un-der gravity. The particles are distributed on a rect-angular lattice, given random initial velocities and leftto settle under gravity (during this stage, the walls arestatic). This part of the equilibration is considered com-plete when the total velocity of the particles in the up -down direction becomes sufficiently small. At this point,one of the walls starts its prescribed motion given byx(t) = A sin(ωt), leading to additional flow of the par-ticles, due to the rearrangement induced by the movingwall (the same effect as if the system were shaken). Thedata are not taken as long as there is significant aver-age downward motion of the particles due to this settling
process. Typically 10−20 periods of the wall motion areneeded for this part of the equilibration of the system tobe complete.
After the equilibration, we start recording the requiredvariables, in particular the volume fraction and the veloc-ity of the particles. Since the results are subject to signif-icant statistical fluctuations, they are averaged in the fol-lowing manner. First, the computational domain is splitinto a number of averaging cells, typically 15 × 15 × 15(due to the settling of the particles under gravity andthe wall motion, some of these cells do not contain par-ticles). Then, we calculate the total velocity and thenumber density by summing over all the particles whosecenters are in a given cell. This averaging is performedevery 20, 000 computational time steps (about 25 timesper period of the wall motion for f = 2 Hz). Additionaltime and space averaging is performed, depending on thevariable in question. For example, the velocity of theparticles adjacent to the shearing wall (Fig. 20a) is cal-culated by space-averaging over all the cells in the x − yplane next to the wall, and then time averaging over thetotal duration of the simulation. The results presentedhere are obtained by simulating 30 periods of the shear-ing wall motion (after the initial 20 cycles used for equi-libration), which corresponds to 15 sec of real time (forf = 2π/ω = 2 Hz) or to about 1.5 × 10⁷ computationaltime steps. We have verified that only minor changesof the results occur if the number of averaging cycles isvaried in the range 25 - 40.
FIG. 20. (a) The average speed at which grains fall alongthe shearing wall versus shearing speed Aω of the wall forexperiments (solid symbols) and simulations (open symbols).The line is the least square fit to experimental data. Theerror bars show two typical standard deviations. (b) MDresults for Vy (in units of Aω), and for solids fraction γ(A = 1 cm, f = 2 Hz). An indication of the particle diam-eter, d = 2 mm, is also shown.
Figure 20a shows the MD and experimental results forthe average speed vy at which the particles fall alongthe shearing wall, as a function of shearing speed, Aω.We find that Vy varies approximately linearly with Aω.While MD simulations give slightly smaller values for Vy
compared to the experiment, the results are consistentup to the experimental and computational accuracy. Wehave not observed significant changes in the results whenthe simulations or experiments are performed with parti-cles of different size. Also, the results presented here donot depend in any significant manner on the roughnessof the wall in the MD simulations, or on the monodisper-sity of the particles, even though some ordering of thesystem particles next to the walls have been observed inthe simulations performed with monodisperse particles.
Figure 20b shows the velocity of the particles in the ydirection (a ‘+’ sign corresponds to upward motion), andthe solid fraction, γ, occupied by the particles, as a func-
tion of the horizontal distance from the shearing wall,which is at z = 0. There is strong motion of the particlesjust next to the shearing wall in the −y direction, as wellas a pronounced positive peak in the velocity profile atabout 2-4 particle diameters in from the wall. Further-more, the volume fraction is significantly reduced justnext to this wall. These two features parallel our experi-mental observation that the dilation close to the shearingwall allows nearby particles to flow predominantly down.These particles have to move inward, and then developupward flow in the interior of the shearing layer. In theexperiment, the upward flow, presumably occurs deeperin the layer leading to a clear central hump.
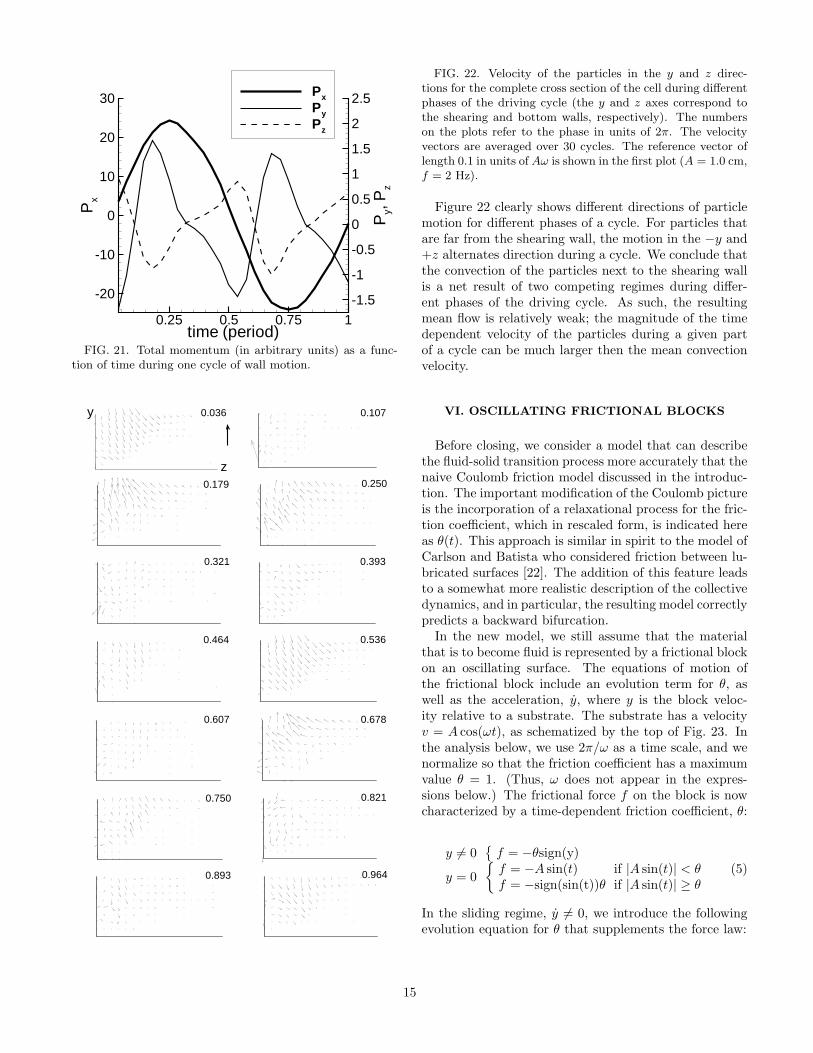
The dynamics of the particles strongly depends on thephase of the shearing cycle, as shown in Fig. 21. This fig-ure presents the total momentum of all particles in thex, y, z directions as a function of the phase of the cyclewhere these results are averaged over 30 cycles. There isa clearly defined harmonic pattern of the motion in the xdirection, due to the fact that momentum is being trans-ferred from the shearing wall to the system particles. Weobserve that the particles move predominantly in the −ydirection during those parts of the cycle when the wallvelocity changes sign, i.e. whenever the magnitude ofthe wall acceleration, and hence the shear stress, are thelargest. These are the parts of the cycle when significantrearrangement of the system is induced by the wall mo-tion, freeing space for the particles from the upper partsof the system to fall under gravity. During the rest ofthe cycle, there is predominantly motion in the +y direc-tion, as required by the (approximate) incompressibilityof the system. Also, during the parts of the cycle charac-terized by the large acceleration of the wall, the particlesmove predominantly away from the shearing wall (pos-itive Pz), while motion towards the wall results duringthe rest of the cycle. Note that the downward motion(vy < 0) correlates well with the inward motion (vz > 0).
Better insight into this and other effects can be ob-tained from Fig. 22, which shows the velocity field ofthe particles in the y and z directions at different phasesof the cycle. We immediately observe that the domi-nant contribution to the dynamics comes from the partof the system that is closest to the shearing wall, with nosignificant motion away from this wall. One interestingobservation is that the motion is considerably strongerin the upper parts of the sample, because the lower partis compacted due to gravity. We observe a similar trendin the experiment for the particles that are next to theshearing wall.
14
time (period)
Px
Py,
Pz
0.25 0.5 0.75 1
-20
-10
0
10
20
30
-1.5
-1
-0.5
0
0.5
1
1.5
2
2.5Px
Py
Pz
FIG. 21. Total momentum (in arbitrary units) as a func-tion of time during one cycle of wall motion.
0.250
0.321 0.393
0.5360.464
0.607 0.678
0.750 0.821
0.893 0.964
0.107
0.179
0.036
z
y
FIG. 22. Velocity of the particles in the y and z direc-tions for the complete cross section of the cell during differentphases of the driving cycle (the y and z axes correspond tothe shearing and bottom walls, respectively). The numberson the plots refer to the phase in units of 2π. The velocityvectors are averaged over 30 cycles. The reference vector oflength 0.1 in units of Aω is shown in the first plot (A = 1.0 cm,f = 2 Hz).
Figure 22 clearly shows different directions of particlemotion for different phases of a cycle. For particles thatare far from the shearing wall, the motion in the −y and+z alternates direction during a cycle. We conclude thatthe convection of the particles next to the shearing wallis a net result of two competing regimes during differ-ent phases of the driving cycle. As such, the resultingmean flow is relatively weak; the magnitude of the timedependent velocity of the particles during a given partof a cycle can be much larger then the mean convectionvelocity.
VI. OSCILLATING FRICTIONAL BLOCKS
Before closing, we consider a model that can describethe fluid-solid transition process more accurately that thenaive Coulomb friction model discussed in the introduc-tion. The important modification of the Coulomb pictureis the incorporation of a relaxational process for the fric-tion coefficient, which in rescaled form, is indicated hereas θ(t). This approach is similar in spirit to the model ofCarlson and Batista who considered friction between lu-bricated surfaces [22]. The addition of this feature leadsto a somewhat more realistic description of the collectivedynamics, and in particular, the resulting model correctlypredicts a backward bifurcation.
In the new model, we still assume that the materialthat is to become fluid is represented by a frictional blockon an oscillating surface. The equations of motion ofthe frictional block include an evolution term for θ, aswell as the acceleration, y, where y is the block veloc-ity relative to a substrate. The substrate has a velocityv = A cos(ωt), as schematized by the top of Fig. 23. Inthe analysis below, we use 2π/ω as a time scale, and wenormalize so that the friction coefficient has a maximumvalue θ = 1. (Thus, ω does not appear in the expres-sions below.) The frictional force f on the block is nowcharacterized by a time-dependent friction coefficient, θ:
y 6= 0{
f = −θsign(y)
y = 0
{
f = −A sin(t) if |A sin(t)| < θf = −sign(sin(t))θ if |A sin(t)| ≥ θ
(5)
In the sliding regime, y 6= 0, we introduce the followingevolution equation for θ that supplements the force law:
15
y = f + A sin(t) (6)
σθ = 1 − θ
(
1 + R|y|
W + |y|.
)
(7)
The equation for θ is structured so that when y van-ishes, θ → 1(= µs). And, if y 6= 0, θ will decrease to1/(1 + R) = µk. The term multiplying R is chosen sothat θ saturates at µk when the velocity exceeds the smallthreshold value W . The key new feature is that the fric-tional force evolves towards its static or dynamic valueswith a time constant σ. The Coulomb case of instanta-neous switching between static and dynamic friction is asingular case of the limit W → 0, σ → 0. We note that inorder to model the Coulomb case numerically, we explic-itly set θ = 1 whenever y = 0, in which case θ = −R/σis large and negative for σ small. In turn, this causes aquick change from θ = 1 to θ = µk when y 6= 0. Wecontrast the switching of the frictional force for the sim-ple Coulomb and relaxational models in the lower partof Fig. 23.
oscillating bed
frictionalblock
Coulomb friction
v
f
-W
W
relaxing friction
v
f
static friction
kinetic friction
v
f
static friction
kinetic friction
FIG. 23. (top) A sketch of the heuristic block model. (bot-tom) The relaxation processes for simple Coulomb friction,and the modified model. The latter incorporates a relaxationprocess between static and dynamic friction. FIG. 24. Comparison of the transitions near failure for (a)
the simple Coulomb model (instantaneous switching of fric-tion coefficient) and (b) an improved model with relaxationalswitching. The data show the maximum velocity, y (circles)and the median value of the friction coefficient, θ (triangles).Closed symbols are for increasing shaking amplitude A; opensymbols are for decreasing A. Model parameters are W = 0,τ = 10−6 in (a) and W = 10−4, τ = 102 in (b).
We compare results computed for the simple Coulombcase and the relaxation model in Fig. 24. Note that inthe Coulomb case, there is a discontinuous but reversibletransition in the variables y and θ when the amplitude Ais increased past the failure point. By contrast, with therelaxation model, the transition is hysteretic. To demon-
16
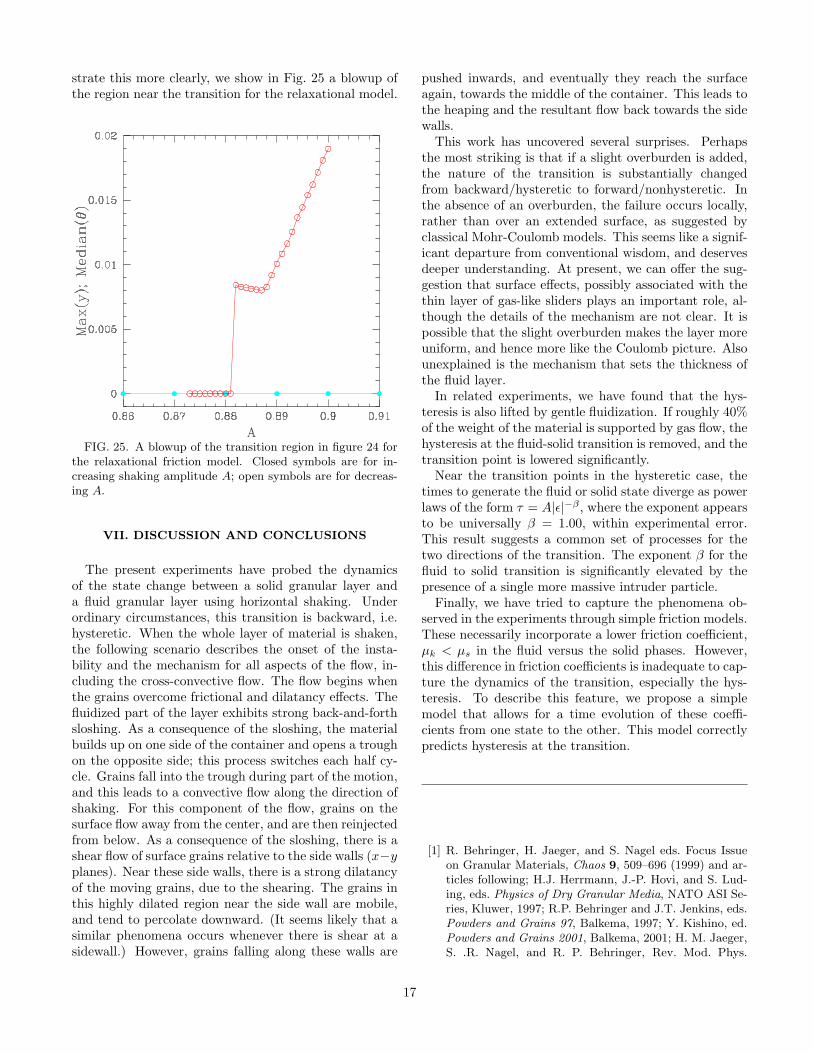
strate this more clearly, we show in Fig. 25 a blowup ofthe region near the transition for the relaxational model.
FIG. 25. A blowup of the transition region in figure 24 forthe relaxational friction model. Closed symbols are for in-creasing shaking amplitude A; open symbols are for decreas-ing A.
VII. DISCUSSION AND CONCLUSIONS
The present experiments have probed the dynamicsof the state change between a solid granular layer anda fluid granular layer using horizontal shaking. Underordinary circumstances, this transition is backward, i.e.hysteretic. When the whole layer of material is shaken,the following scenario describes the onset of the insta-bility and the mechanism for all aspects of the flow, in-cluding the cross-convective flow. The flow begins whenthe grains overcome frictional and dilatancy effects. Thefluidized part of the layer exhibits strong back-and-forthsloshing. As a consequence of the sloshing, the materialbuilds up on one side of the container and opens a troughon the opposite side; this process switches each half cy-cle. Grains fall into the trough during part of the motion,and this leads to a convective flow along the direction ofshaking. For this component of the flow, grains on thesurface flow away from the center, and are then reinjectedfrom below. As a consequence of the sloshing, there is ashear flow of surface grains relative to the side walls (x−yplanes). Near these side walls, there is a strong dilatancyof the moving grains, due to the shearing. The grains inthis highly dilated region near the side wall are mobile,and tend to percolate downward. (It seems likely that asimilar phenomena occurs whenever there is shear at asidewall.) However, grains falling along these walls are
pushed inwards, and eventually they reach the surfaceagain, towards the middle of the container. This leads tothe heaping and the resultant flow back towards the sidewalls.
This work has uncovered several surprises. Perhapsthe most striking is that if a slight overburden is added,the nature of the transition is substantially changedfrom backward/hysteretic to forward/nonhysteretic. Inthe absence of an overburden, the failure occurs locally,rather than over an extended surface, as suggested byclassical Mohr-Coulomb models. This seems like a signif-icant departure from conventional wisdom, and deservesdeeper understanding. At present, we can offer the sug-gestion that surface effects, possibly associated with thethin layer of gas-like sliders plays an important role, al-though the details of the mechanism are not clear. It ispossible that the slight overburden makes the layer moreuniform, and hence more like the Coulomb picture. Alsounexplained is the mechanism that sets the thickness ofthe fluid layer.
In related experiments, we have found that the hys-teresis is also lifted by gentle fluidization. If roughly 40%of the weight of the material is supported by gas flow, thehysteresis at the fluid-solid transition is removed, and thetransition point is lowered significantly.
Near the transition points in the hysteretic case, thetimes to generate the fluid or solid state diverge as powerlaws of the form τ = A|ε|−β , where the exponent appearsto be universally β = 1.00, within experimental error.This result suggests a common set of processes for thetwo directions of the transition. The exponent β for thefluid to solid transition is significantly elevated by thepresence of a single more massive intruder particle.
Finally, we have tried to capture the phenomena ob-served in the experiments through simple friction models.These necessarily incorporate a lower friction coefficient,µk < µs in the fluid versus the solid phases. However,this difference in friction coefficients is inadequate to cap-ture the dynamics of the transition, especially the hys-teresis. To describe this feature, we propose a simplemodel that allows for a time evolution of these coeffi-cients from one state to the other. This model correctlypredicts hysteresis at the transition.
[1] R. Behringer, H. Jaeger, and S. Nagel eds. Focus Issueon Granular Materials, Chaos 9, 509–696 (1999) and ar-ticles following; H.J. Herrmann, J.-P. Hovi, and S. Lud-ing, eds. Physics of Dry Granular Media, NATO ASI Se-ries, Kluwer, 1997; R.P. Behringer and J.T. Jenkins, eds.Powders and Grains 97, Balkema, 1997; Y. Kishino, ed.Powders and Grains 2001, Balkema, 2001; H. M. Jaeger,S. .R. Nagel, and R. P. Behringer, Rev. Mod. Phys.
17
68, 1259 (1996); Physics Today, 49, 32 (1996); See alsoR. P. Behringer, Nonlinear Science Today, 3, No. 3, 1-15,(1993); A. Mehta, Ed. Granular Matter: An Interdisci-
plinary Approach, Springer, NY (1994); H. M. Jaeger andS. R. Nagel, Science 255, 1523 (1992).
[2] R. Jackson, in Theory of Dispersed Multiphase Flow, Ed.
Re. E. Meyer (Academic Press, NY, 1983, p. 291; R. M.Nedderman, Statics and Kinematics of Granular Materi-


![SSNP503 - Contact in great slips with X-FEM [] the activation of friction, it is necessary to inform the keyword FRICTION in the operator DEFI_CONTACT with the option ‘COULOMB’](https://static.documents.pub/doc/80x56/5ab365e07f8b9a6b468e6279/ssnp503-contact-in-great-slips-with-x-fem-the-activation-of-friction-it-is.jpg)


