21
Graph and solve systems of linear inequalitites A-CED 3
| Date post: | 24-Dec-2015 |
| Category: |
Documents |
| Upload: | denis-mason |
| View: | 214 times |
| Download: | 0 times |
Graph and solve systems of linear inequalititesA-CED 3
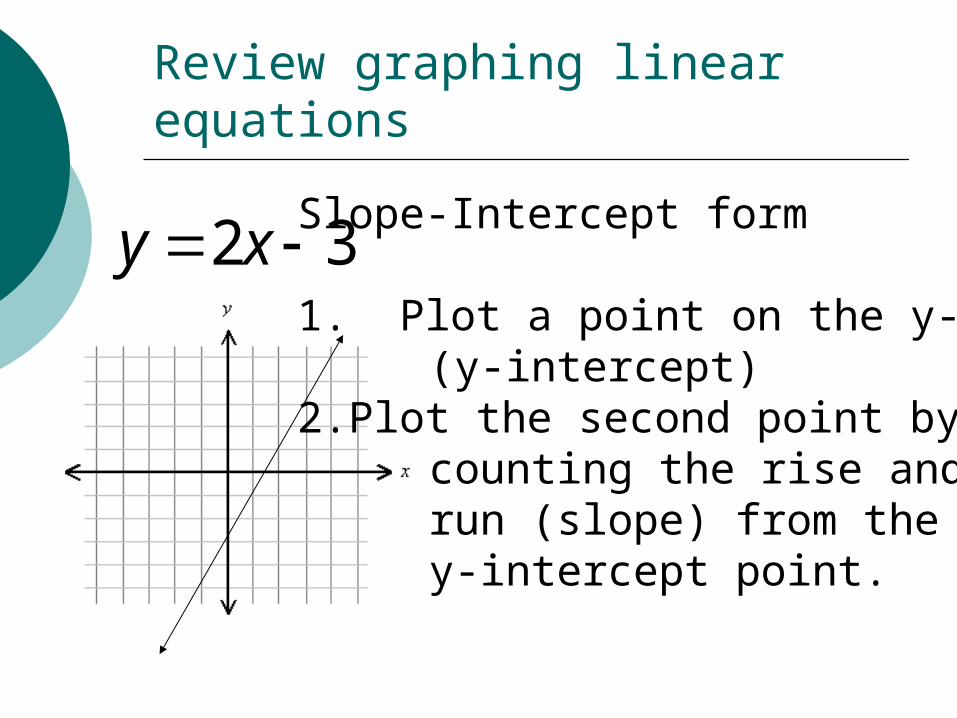
Review graphing linear equations
2 3y x Slope-Intercept form
1. Plot a point on the y-axis (y-intercept)
2.Plot the second point by counting the rise and run (slope) from the y-intercept point.
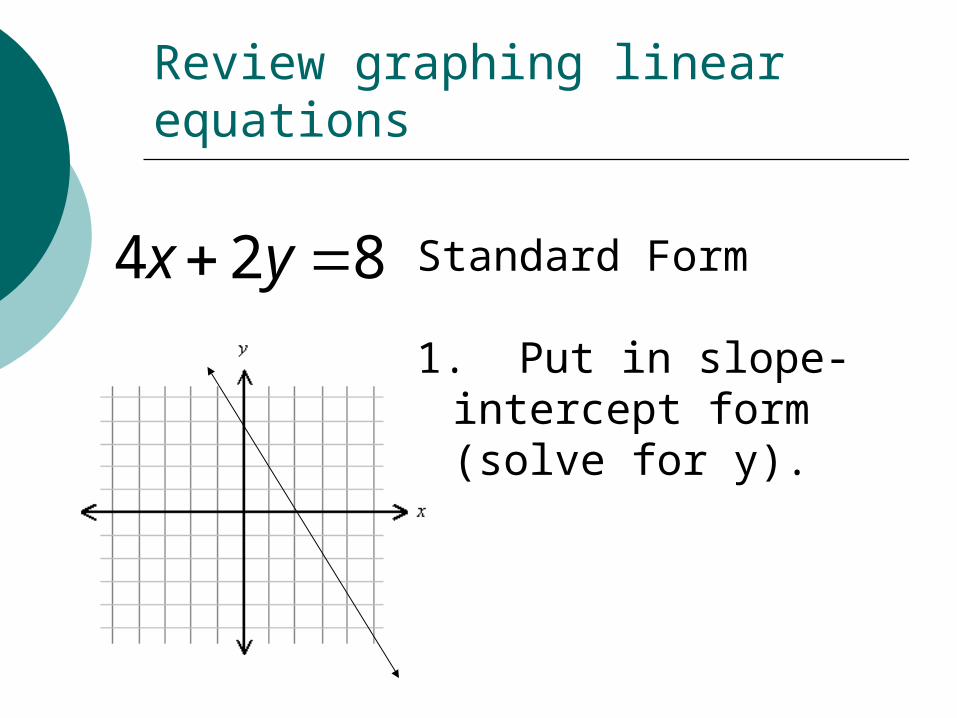
Review graphing linear equations
4 2 8x y Standard Form
1. Put in slope-intercept form (solve for y).

Review graphing linear equations
1y Vertical Line
4x Horizontal Line
What does a graph represent?
Graphs represent solutions of the equation.

If I wanted to graph an inequality, how would I represent all possible ordered pairs that are solutions to the problem?
SHADE
Graphing Inequalities
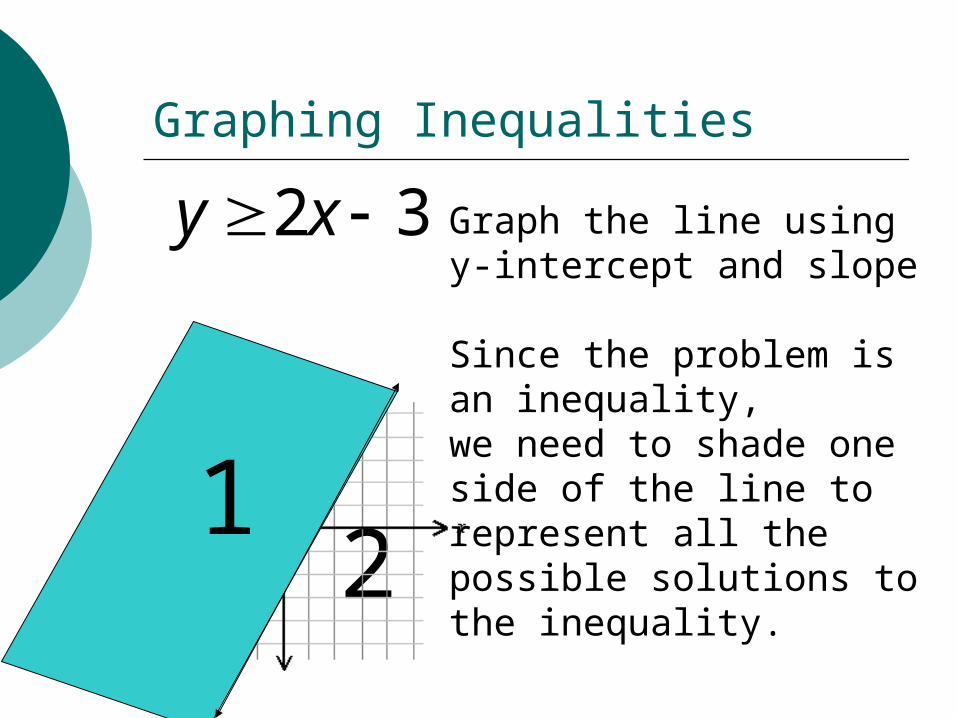
2 3y x
2
Graph the line using y-intercept and slope
Since the problem is an inequality, we need to shade oneside of the line to represent all the possible solutions to the inequality.
1
Graphing Inequalities
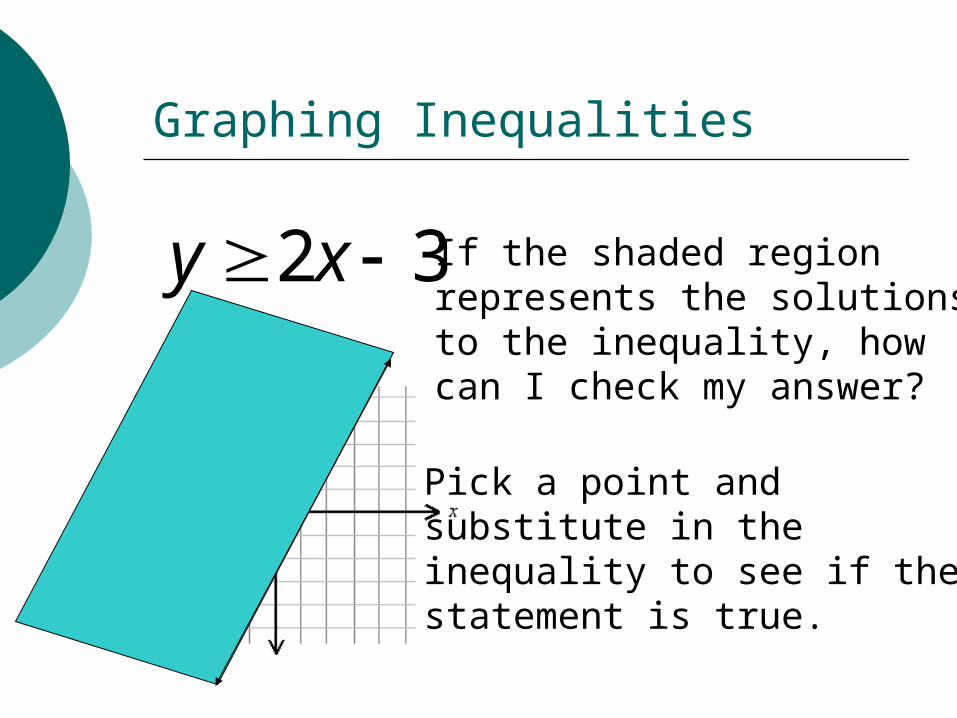
2 3y x If the shaded region represents the solutions to the inequality, how can I check my answer?
Pick a point and substitute in the inequality to see if the statement is true.
Graphing Inequalities
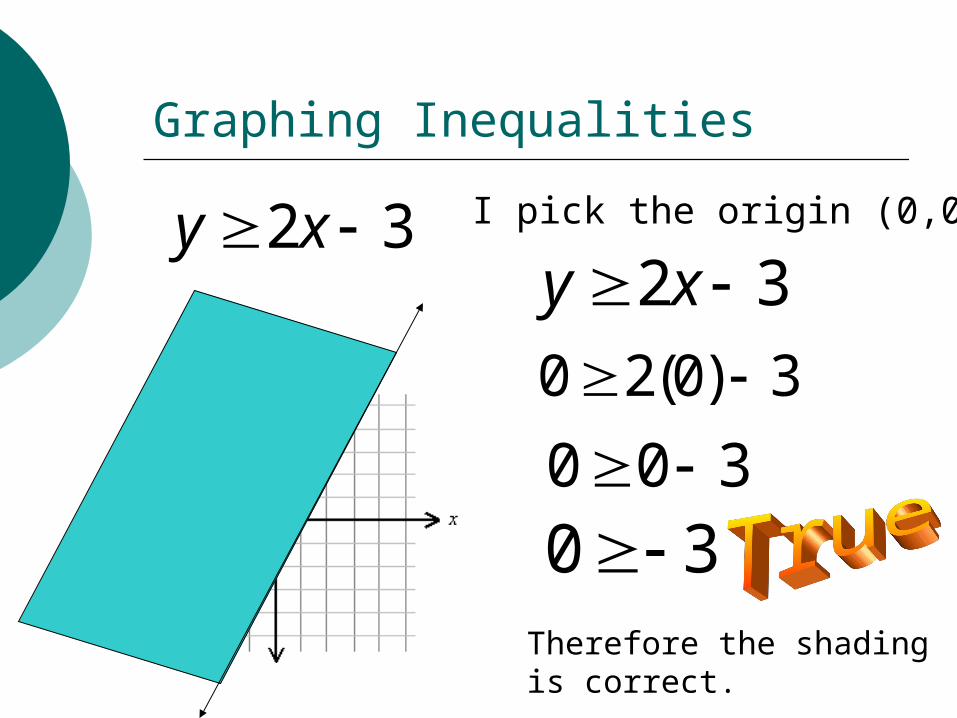
2 3y x 2 3y x
I pick the origin (0,0)
0 2(0) 3
0 0 3 0 3Therefore the shadingis correct.

Graphing Inequalities
4 2 8x y 4 2 8x y 4(0) 2(0) 8
I pick the origin (0,0)
0 8
Shade the side of theline containing the origin.
Graphing Inequalities
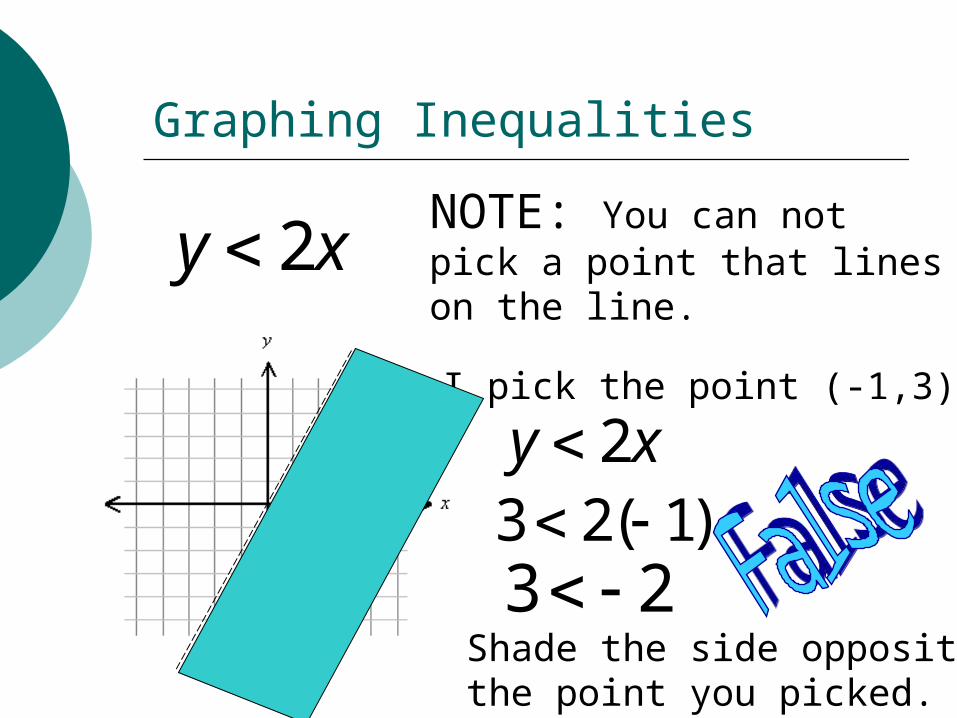
2y x
3 2( 1)
NOTE: You can not pick a point that lines on the line.
I pick the point (-1,3)
2y x
3 2 Shade the side oppositethe point you picked.
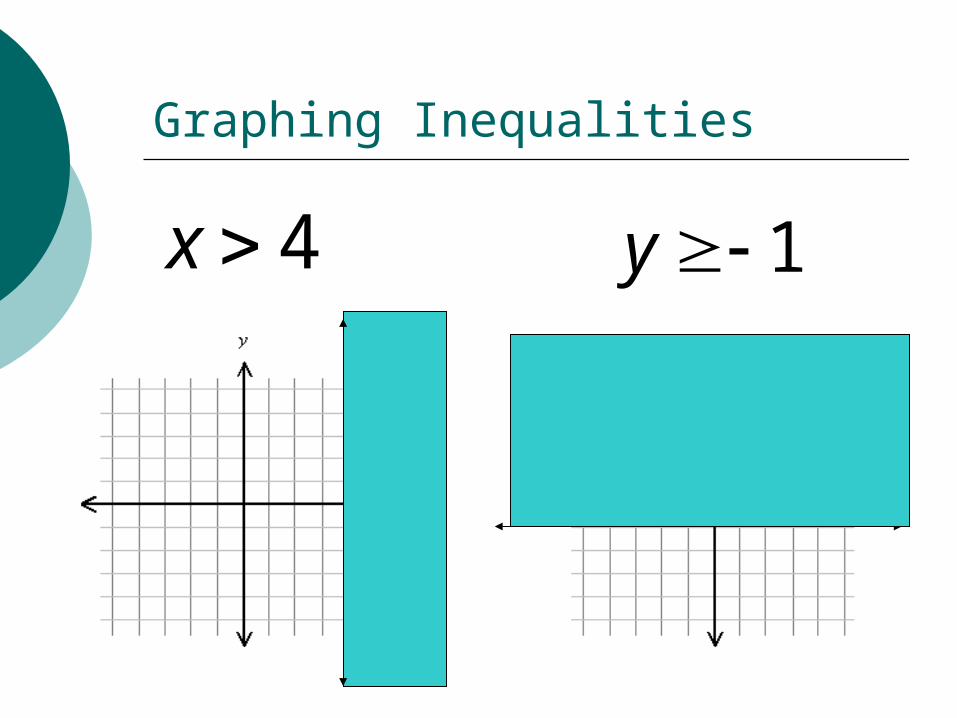
Graphing Inequalities
4x 1y


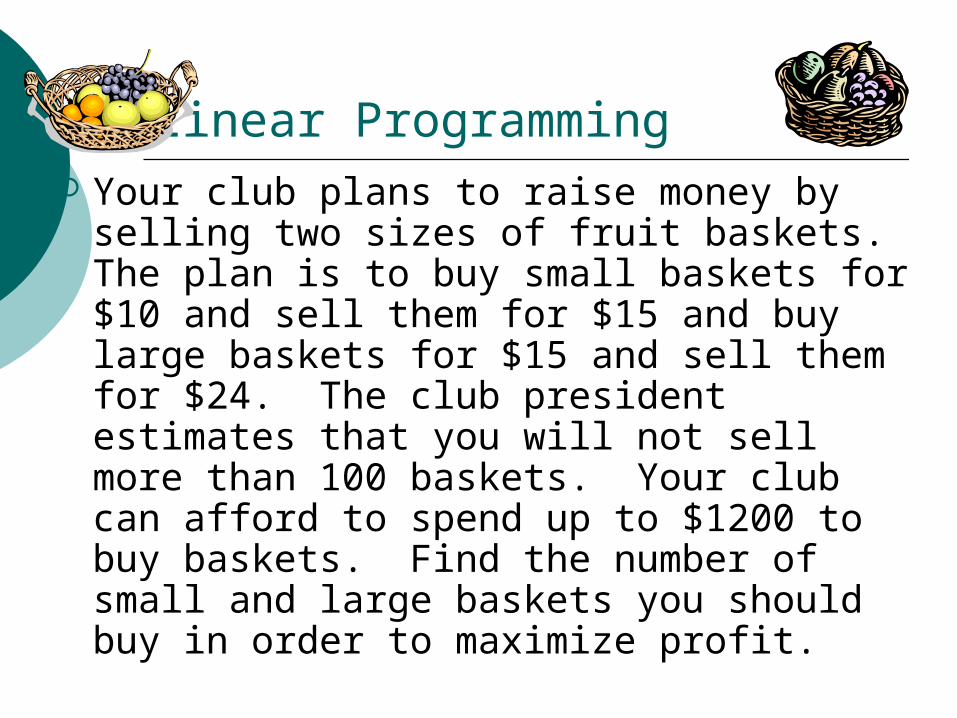
Linear Programming Your club plans to raise money by selling
two sizes of fruit baskets. The plan is to buy small baskets for $10 and sell them for $15 and buy large baskets for $15 and sell them for $24. The club president estimates that you will not sell more than 100 baskets. Your club can afford to spend up to $1200 to buy baskets. Find the number of small and large baskets you should buy in order to maximize profit.
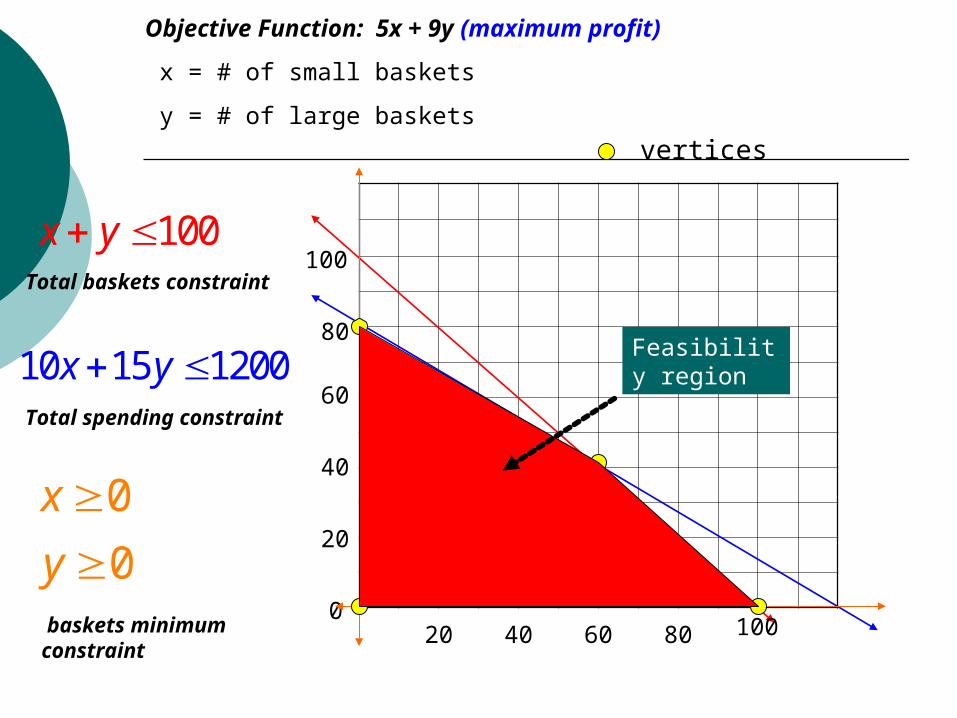
100x y
0
20
40
6010 15 1200x y
0
0
x
y
Objective Function: 5x + 9y (maximum profit)
x = # of small baskets
y = # of large baskets
Total baskets constraint
Total spending constraint
baskets minimum constraint
80
100
20 40 60 80 100
Feasibility region
vertices

0
20
40
60
Objective Function: 5x + 9y (maximum profit)
x = # of small baskets
y = # of large baskets
80
100
20 40 60 80 100
Feasibility region
(0, 80)
(60, 40)
(0, 0)
(100, 0)
vertices
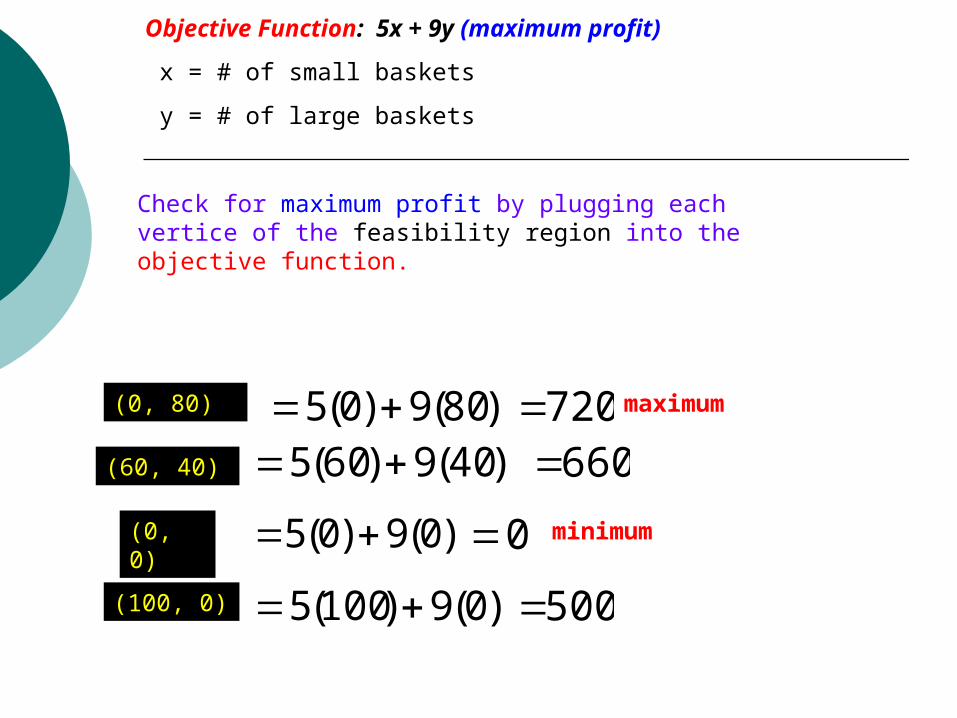
Objective Function: 5x + 9y (maximum profit)
x = # of small baskets
y = # of large baskets
(0, 80)
(60, 40)
(0, 0)
(100, 0)
5(0) 9(0) 0 minimum
maximum
Check for maximum profit by plugging each vertice of the feasibility region into the objective function.
)80(9)0(5 720)40(9)60(5 660
)0(9)100(5 500