Page 1
BULLETIN OF THE POLISH ACADEMY OF SCIENCES
TECHNICAL SCIENCES, Vol. 62, No. 1, 2014
DOI: 10.2478/bpasts-2014-0011
Graph based discrete optimization in structural dynamics
B. BLACHOWSKI1 and W. GUTKOWSKI2∗
1 Institute of Fundamental Technological Research of the Polish Academy of Sciences, 5b Pawinskiego St., 02-106 Warsaw, Poland2 Institute of Mechanized Construction and Rock Mining, 6/8 Racjonalizacji St., 02-673 Warsaw, Poland
Abstract. In this study, a relatively simple method of discrete structural optimization with dynamic loads is presented. It is based on a tree
graph, representing discrete values of the structural weight. In practical design, the number of such values may be very large. This is because
they are equal to the combination numbers, arising from numbers of structural members and prefabricated elements. The starting point of
the method is the weight obtained from continuous optimization, which is assumed to be the lower bound of all possible discrete weights.
Applying the graph, it is possible to find a set of weights close to the continuous solution. The smallest of these values, fulfilling constraints,
is assumed to be the discrete minimum weight solution. Constraints can be imposed on stresses, displacements and accelerations. The short
outline of the method is presented in Sec. 2. The idea of discrete structural optimization by means of graphs. The knowledge needed to
apply the method is limited to the FEM and graph representation.
The paper is illustrated with two examples. The first one deals with a transmission tower subjected to stochastic wind loading. The
second one with a composite floor subjected to deterministic dynamic forces, coming from the synchronized crowd activities, like dance or
aerobic.
Key words: discrete structural optimization, combinatorial optimization, structural dynamics, stochastic loading, problem oriented optimiza-
tion, graphs.
1. Introduction
So far, most of research on the minimum weight structural
design has been carried out on structures subjected to static
loads. Only in the sixties and seventies, of the past centu-
ry, first works on structural optimization with constraints im-
posed on eigenvalues were published. Turner [1] discussed a
numerical procedure for finding minimum weight of a com-
plex structure under a constraint imposed on a given natural
frequency. Tang [2] presented an optimum design of three-
member frame subjected to frequency constraints. However,
only few of them, among others by Mroz [3] dealt with con-
straint resulting from dynamic loadings. Most of attention has
been paid to problems with small number of degrees of free-
dom, and with steady-state sinusoidal responses. An extended
survey by Pierson [4] covering over sixty papers, gives pro-
found information about progress, at this time, done in the
field of structural optimization with dynamic constraints.
With the increasing computational possibilities and knowl-
edge of mathematical programming, it was possible to extend
engineering design to more practical problems. McGee and
Phan [5] considered space frames with relatively larger num-
bers of degrees of freedom and dynamic constraints. Their
discussion, based on the Optimality Criteria approach, was
devoted to the computational complexity of problems with
constraints imposed on several natural frequencies. The paper
is illustrated with eight-member frame, and structural weight
concentrated on four rigid joints with six degrees of freedom
each.
The increased demands for research in structural and ma-
chine dynamics optimization were caused, mostly by devel-
opment of aircraft industry. In the review paper Grandhi [6],
widely cited to this day, presents an extended discussion on
variety problems related to structural optimization with fre-
quency constraints. He turns attention, to one of the most
important problem, consisting in the switching of vibration
modes due to structural size modification.
In the last decade, several stochastic approaches has been
used for dynamic structural optimization problems. Most of
them are based on the Genetic Algorithm, a heuristic approach
giving near optimum solutions. A profound review on discrete
stochastic methods in structural optimization is given by Arora
et al. [7]. However, with the lack of the mathematical back-
ground of the algorithm, the distance of the solution from
real extreme is unknown. An example of minimum weight
design with constraints imposed on several natural frequen-
cies, obtained by genetic algorithm, is presented in the paper
by Lee et al. [8]. An extended review of discrete structural
optimization is given by Gutkowski [9]. One of the simplest
heuristic methods for finding minimum structural weight, by
removing redundant material, is presented by Blachowski and
Gutkowski [10].
The increasing requirements for structural safety caused
farther demands for solutions of structural response to dy-
namic loads. However, due the complexity of dynamic analy-
sis, in some papers we don’t find a direct dynamic analysis,
but analysis under a static load equivalent, to a dynamic one.
Kang et al. [11] proposed structural optimization approach un-
der equivalent static load, generating identical displacements
as caused by dynamic excitations. Choi et al. [12] presented a
method, based on modal analysis, transforming dynamic loads
into equivalent static one.
∗e-mail: [email protected]
91
Unauthenticated | 148.81.55.144Download Date | 3/31/14 1:25 PM
Page 2
B. Blachowski and W. Gutkowski
In general, civil engineering structures are subjected, to
a large extent, to stochastic loads. These are mainly loads
coming from wind or earthquake, and their stochastic nature
cannot be neglected in the design. Recently, then, more atten-
tion has been paid to this type of problems. Papadrakakis et al.
[13] discussed multi-objective optimization problem of skele-
tal structures under seismic condition, applying Evolutionary
Algorithm.
Norkus and Karkauskas [14] presented an algorithm for
truss optimization under stochastic load, composed of three
parts. Each of them consists of separate problems. In the first
one, variation bounds of stresses and displacements for a giv-
en time period are presented. Next, an analysis for defined
bounds is performed. The third one is optimizing the member
cross-section areas, satisfying the safety constraints. All three
problems are applied in each optimization cycle. Jensen and
Beer [15] proposed discrete-continuous structural optimiza-
tion under stochastic load, applying generalized Optimality
Criteria method, including dual function for discrete vari-
ables. An adaptive genetic algorithm for structural topology
optimization of transmission tower, with discrete sizing, was
proposed by Guo and Li [16] The problem is solved for static
loads only.
A concept of applying graphs to discrete structural opti-
mization was proposed by Gutkowski et al. [17]. It is based
on an algorithm, elaborated by Iwanow [18], for finding an
ordered sequence of values of a discrete linear function. The
basic assumption made in the method is that the continuous
minimum of structural weight constitutes a lower bound for
discrete solution. However, the mentioned algorithm gives on-
ly structural volumes, without information on member forces.
It means that the obtained, from the graph, discrete solution
should be checked if physical constraints are not violated.
The algorithm allows for arbitrary numbers of permutations
of graph branches, representing member volumes. The idea
of the method is illustrated, by a simple problem, in Sec. 2.
Now, the algorithm presented by Blachowski and Gutkowski
[19] is extended to structure composed of trusses, frames and
plates, under dynamic conditions.
The algorithm is divided in two parts. In the first part,
using the graph property, described in Subsec. 3.2, the values
of the discrete cost function, larger than continuous one, but
next to it are found. The algorithm starts with a tree graph
containing only two branches. In the second part, the obtained
combination of structural members is verified for constraints.
The same procedure is performed, after enlarging the cat-
alogue to four, six etc. available parameters.
In this study, the application of the discussed graph ap-
proach is extended to structures under dynamic loads. Two
practical problems are discussed. The first one is a transmis-
sion tower under stochastic wind load. A transmission tower
can be considered, under static load, as a pin connected. How-
ever, the pin joint assumption can’t be applied in structural
dynamics. Blachowski and Gutkowski [20] presented several
structures for which significant differences between eigenfre-
quencies and even eigenmodes could be observed. It depends
if the structure is considered as a truss (pin joints), or as a
frame (rigid joints). Considering dynamics of the transmission
tower as a frame requires division of each structural member
in several FE. This increases significantly number of degrees
of freedom, entering in the problems. To overcome difficul-
ties with very large numbers of DOF, a load-dependent Ritz
vector method, proposed by Gu et al. [21] is applied. Due
to the wind nature, the method allows to reduce the number
of DOF to be considered from thousand to less than twenty
only.
The second problem deals with a composite floor, which
consists of concrete slab, supported by a set of steel beams.
The floor is subjected to dynamic forces coming from the
synchronized crowd activities, like dance or aerobic. In this
case the load is considered to be deterministic.
In both examples, in the structural analysis, an algorithm
of FEM, based on an earlier work by Blachowski [22] is ap-
plied.
In the paper, as mentioned above, tree graphs are used for
finding the minimum from a very large number of combina-
tions. The latter arises from the number of structural members
and available parameters located in a catalogue of prefabricat-
ed elements. In order to be more consistent in applying graphs,
one could expect the application of the graph based physical
systems modelling approach. However, the experience in the
application of the method is, so far, limited to the problems
with very small numbers of elements. Borutzky [23] is giving
examples with two degrees of freedom, and a one loop elec-
trical circuit. A. Buchacz [24] is discussing free vibrations of
a single beam. These examples show lack of usefulness of the
method in cases of systems with hundreds elements, like the
structures considered in the paper.
2. The idea of discrete structural optimization
by means of graphs
In this study, the discrete minimum weight design consists in
assigning to each structural member a profile from a given list
(catalogue). Here, structures are composed of beams and/or
plates and sheets. It must be pointed out, that “assigning”
means choosing a set of values of cross section area (CSA),
pipes diameters, principal moment of inertia (PMI) etc. from a
catalogue containing dozens or even hundreds of profiles. On
the other hand, the optimized structure can be also composed
of dozens or hundreds of elements.
Denoting by k = the number of all available, in a cat-
alogue, elements, and by j = the number of all structural
members, or linking groups, design consists in searching for
an optimum from among n = kj combinations. Even, in a
relatively simple engineering problem, there can be 10 struc-
tural members and 10 available parameters, which give 1010
combinations. More cases, when several catalogues are taken
into consideration, together with different structural profiles
(beams and plates), are discussed in Sec. 3.
Searches for discrete minimum weight consists in verifica-
tions of fulfilment of state equations and imposed constraints
for each combination. In many practical designs, as mentioned
above, n is so large, that a simple enumeration searching for
92 Bull. Pol. Ac.: Tech. 62(1) 2014
Unauthenticated | 148.81.55.144Download Date | 3/31/14 1:25 PM
Page 3
Graph based discrete optimization in structural dynamics.
optimum is impossible, even using very powerful numerical
tools.
This is the reason, that only applying a heuristic approach
it is possible find optimum, or more rigorously, near optimum.
An outline of the proposed method is presented on a graph
in Fig. 1, showing it for a structure composed of a beam and
a plate. The beam can be chosen from three available parame-
ters, and the plate from two different thicknesses. Subscripts
are indicating position of the parameters in the catalogue, say
CSA. Superscripts indicate structural member numbers.
Fig. 1. Graph with three available parameters for a beam and two
for a plate
The edges of the graph are representing the structural
weights of beams and plates respectively. They are chosen
from catalogues of parameters, which are ordered with their
increasing values. Vertices are representing sum of weights of
structural members represented by edges starting from (0,0)
vertex. This way, at the bottom of the graph, vertices are repre-
senting all possible combination between structural members
and available parameters.
Inspecting the given graph, it can be seen, that extreme
vertex, belonging to the same layer of the graph (subgraph),
represent the smallest and the largest volumes from all pos-
sible volumes included in the layer. This important property
of the discussed graph (subgraph) will be used in finding the
discrete minimum of structural volume.
A large number of discussed combinations can be omitted
from considerations, by applying an assumption that minimum
of the discrete structural weight W d cannot be smaller than
minimum of the continuous structural weight W c This can
be noted as W c ≤ W d. This assumption comes from the
observation of a discretized continuous function.
If W c is smaller than the sum of all smallest structural
weights, it means, that structural elements with smallest avail-
able parameters are candidates for discrete minimum weight.
The minimum can be confirmed only after verification, if im-
posed on the structure constraints are not violated.
On the other hand, if W c is larger than the value at the
vertex being most to the right side of the graph, the solution
within assumed available parameters doesn’t exist. Finally, if
W c is between two extreme vertices, a part of the graph can
be neglected from farther considerations. This is when values
at the vertices are smaller than continuous minimum weight.
The values of structural weight represented by vertices of
the last layer of the graph are not ordered according to their
increasing values. Their order depends on the order of sub-
sequent graph branches. This is the reason for which, in the
cases with large numbers of combinations, a set of graphs
with permuted branches are considered.
Detailed and formal presentation of this problem is pre-
sented in Sec. 3.
3. The algorithm for discrete minimum weight
structural design
Let us present in details, the algorithm outlined in the previ-
ous section. As motioned there, the discrete optimum problem
consists in finding the minimum weight from all values aris-
ing from all combinations relating structural members and
available parameters. In practical design, structural members
are divided in groups having the same sectional parameters.
In general, the number of combinations occurring in a struc-
ture composed of b0 different beams and p0 different plates
is equal to the following product:
b0∏
b=1
k0b
p0
∏
p=1
j0p
, (1)
where k0b and j0p are numbers of, available in catalogues, beam
sections and plate thicknesses respectively.
Before proceeding with farther considerations, let intro-
duce the following, principal notations: b = [1, 2, ..., b0] and
p = [1, 2, ..., p0] is the number of a beam and/or of a plate
in the structure respectively, nb = [n1, n2, n3, . . . , nb0 ] the
number of beam structural members in b-th linking group,
mb =[
m1,m2,m3, . . . ,mp0
]
the number of plate structural
members in p-th linking group, Lb – sum of nb beam lengths
lb,n in b-th linking group, Lb =nb∑
n=1
lb,n, Sp – sum of mp
plate areas sp,m in p-th linking group, Sp =mp∑
m=1sp,m, Ab,
Db, tb, Ib – cross section area, diameter, thickness and mo-
ment of inertia of a pipe respectively, of b-th beam,Ab, Hb, hb
– cross section area, height and flange thickness of a I – beam
respectively, of b-th beam, hp – the thickness of p-th plate, vb
– volume of b-th beam linking group vb = AbLb, vp – volume
of p-th plate linking group, vp = hpSp, kb =[
1, 2, 3, . . . , k0b
]
,
jp =[
1, 2, 3, . . . , j0p]
the number of a beam profile and plate
thickness from the catalogue, assigned to b-th beam or b-th
linking group, or to p-th plate or p-th linking group, respec-
tively, Ab . . . over line defines section parameters obtained
from continuous solution, Akb
b . . . superscript kb defines the
parameter from the catalogue assigned to the b-th structural
element, Akb
b . . . over line with a superscript kb-th define the
parameter from the catalogue, assigned to the b-th structural
element, obtained from discrete minimum solution, V , Vb, Vp
– total structural volume, volume of all beam elements, vol-
Bull. Pol. Ac.: Tech. 62(1) 2014 93
Unauthenticated | 148.81.55.144Download Date | 3/31/14 1:25 PM
Page 4
B. Blachowski and W. Gutkowski
ume of all plate elements respectively, V c, V d – continuous
and discrete minimum volumes, respectively, W c, W d – con-
tinuous and discrete minimum weights, respectively, ρb, ρp –
density of beam and plate materials, respectively.
3.1. Graph representing structural weight. The discussed
graph is a directed tree graph. An edge of the graph is la-
belled with the weight of the structural member. A vertex is
labelled with a pair of numbers and with the sum of all edges
joining the vertex with the graph root (0,0). At the bottom
of the graph, vertices (j0, kj) represent all possible structural
weights, arising from combinations between structural mem-
bers and available parameters.
The applied directed tree graph and all its transformation
belong to well established graph theory [25].
As mentioned above, the algorithm is based on an as-
sumption that the minimum structural weight W c, obtained
from continuous optimization, constitutes the lower bound of
all possible discrete values of structural weight Wd
W c ≤Wd = ρb
b0∑
b=1
vkb
b + ρp
p0
∑
p=1
vkpp . (2)
The algorithm tends to approach the discrete value, as
close as possible, to the continuous one, under the condition
V c ≤ Vd. The first try is along path OCD (Fig. 2). The next
is along OEF. Both of them are giving discrete values larger
than continuous one. The third try along OGH shows that H
vertex value is smaller than continuous minimum. It means
that all other branches at left from GH can be neglected from
farther considerations. Now, the aim is still to approach closer
to V c. This can be done, going along EIJK. In this case, the
discrete structural weight in the closest to V c, and at the same
time larger than it. If the structure composed of such a set of
available cross sections area is fulfilling given constraints, it
is considered as discrete minimum volume V d.
Fig. 2. Search for smallest feasible discrete cost function
3.2. The graph algorithm. The algorithm is composed of
two parts. In the first one, discrete cost function values, clos-
est to the continuous minimum weight are found. In the second
one, verification of constraints in discrete solutions, obtained
in the first part, is performed.
PART 1: Find value of the discrete cost function Wd ≥W c
STEP 1.1
Find continuous minimum weight W c of the given struc-
ture, subjected to the assumed loading conditions and con-
straints.
STEP 1.2
Take, for each structural member, or linking group, two
subsequent values:
for a beam
Akb
b ≤ Ab ≤ Akb+1b (3)
with
Dkb
b ≤ Db ≤ Dkb+1b ; tkb
b ≤ tb ≤ tkb+1b
and/or
Hkb
b ≤ Hb ≤ Hkb+1b ;
hkb
b ≤ hb ≤ hkb+1b ; Ikb
b ≤ Ib ≤ Ikb+1b
and for a plate
hkpp ≤ hp ≤ hkp+1
p . (4)
Set a list of parameters, composed of two, just mentioned,
values for all structural members.
STEP 1.3
Construct two branch graph (Fig. 2) and:
(i) Find the smallest values of the structural weight, Wkj
j,max,
represented by extreme vertices of subgraphs with roots
(j, kj), for j = 1, 2, . . . , (j0−1). Save the subgraph with
root (j, kj), giving the smallest value of(
Wkj
j,max −W c
)
for Wkj
j,max > W c.
(ii) Find the largest values of the structural weight Wkj+1
l,min,
represented by extreme vertices of subgraph with roots
(l, kl + 1), for l = j, (j + 1). . . (j0 − 1). Save the sub-
graph with the root (l, kl + 1), giving the smallest of(
Wkj+1
l,min −W c
)
for Wkj+1
l,min > W c.
(iii) Find the smallest values of the structural weight,Wkp
p,max,
represented by extreme vertices of subgraphs with roots
(p, kp), for p = l, (l+1). . . (j0 − 1). Save the sub-
graph with root (p, kp), giving the smallest value of(
Wkp
p,max −W c
)
for Wkp
p,max > W c.
(iv) Go to (ii) and (iii), increasing subsequently l and p to
(j0 − 1).(v) Save, from all m arrangements, structures with values of
discrete cost function, giving min(
Wd −W c
)
.
STEP 1.4
Assume an arbitrary number m. Select randomlym differ-
ent permutations of graph edges, represented by the index j.
94 Bull. Pol. Ac.: Tech. 62(1) 2014
Unauthenticated | 148.81.55.144Download Date | 3/31/14 1:25 PM
Page 5
Graph based discrete optimization in structural dynamics.
Larger m is, the probability of obtaining better result increas-
es. Preform STEP 1.3 for each permutation.
PART 2: Verify constraint violation
Find, for all m structures obtained in STEP 1.3 (v), a
parameter
µ(1) = max(
qmax,i/
u0, σj/
σ0, q̈max,i/
a0
)
for i = 1, 2, . . . , i0 and j = 1, 2, ..., j0.
If µ ≤ 1, the structure is considered as of minimum weight
W d. If several discrete solutions are fulfilling this condition,
the one with the smallest weight is considered as the discrete
minimum weight.
If all of m structures are not fulfilling this condition, go to
PART 1, STEP 1.2 of the algorithm. Enlarge lists of available
profiles to four positions and proceed with all steps there.
The above algorithm can be also presented in the form of
block diagram (Fig. 3), as follows:
j = 1, 2, . . . , j0 (tree level)
k = 1, 2, . . . , k0 (tree branch, for two branch tree k0 = 2)V c (continuous minimum volume)
V d (discrete minimum volume)
Vd,j (discrete volume obtained, starting from j-th tree le-
vel)
V kd,j =
j−1∑
r=1
Akr
r lr +Akj lj +
j0
∑
r=j+1
Ak0
r lr.
Fig. 3. Block diagram of the algorithm
4. Discrete minimum weigh design
of a transmission tower under wind load
The first example illustrating the application and validity of
the proposed method is devoted to a 27meter high transmis-
sion tower (Figs. 4 and 5). The tower is supporting conductors
and ground-wires. The basic data for the structure are taken
from the Guidelines for Electrical Transmission Line Struc-
tural Loading the 3rd ed., published by ASCE. Spans between
neighbouring towers are equal to 200 meters. The static shape
of the wires and conductors is assumed to be a catenary curve
with a six-meter sag. Initial tension in wires equals 7 kN.
a) b)
Fig. 4. Transmission tower data – plane XZ (a), plane YZ (b)
a) b)
Fig. 5. 3D view of the tower (a), tower divided into four assembling
modules (b)
Bull. Pol. Ac.: Tech. 62(1) 2014 95
Unauthenticated | 148.81.55.144Download Date | 3/31/14 1:25 PM
Page 6
B. Blachowski and W. Gutkowski
It is assumed that structural members are made of pipes,
rigidly connected at joints. The 3D structure is divided in four
sections (Fig. 5), and members are linked in seven groups of
the same cross section areas. A commercially available cata-
logue of circular hollow sections, consisting of 314 sections
from CHS 22/1.2 to CHS 273/8 is considered. Constraints are
imposed on both, stresses and displacements.
The structure is subjected to forces, arising from stochas-
tic wind, blowing horizontally in a direction perpendicular to
wires.
4.1. Structural response to the dynamic load. In the fol-
lowing dynamic response analysis, the classical FEM motion
equations, with NDOF degrees of freedom are applied:
Mq̈total(t) + Cq̇total(t) + Kqtotal(t) = ptotal(t) (5)
where M, C, K are mass, damping and stiffness matrices
respectively (NDOF × NDOF). The number NDOF includes
the numbers of structural joints, together with joints, arising
from partition of each structural member in four FE. q̈total,
q̇total, qtotal are vectors of total structural node accelerations,
velocities and displacements, respectively (NDOF × 1). ptotal
is an external, stochastic force vector (NDOF × 1). It is al-
so assumed that the total displacement can be considered as
a sum of constant static displacements q, equal to the mean
value of total displacements, and fluctuating parts q(t)
qtotal(t) = q + q(t). (6)
The fluctuating part of the dynamic equation, has, under this
assumption the following form
Mq̈(t) + Cq̇(t) + Kq(t) = p(t). (7)
In the problem, relatively a large number of modes are orthog-
onal to the horizontal wind direction, and their contribution to
the structural dynamic response can be neglected. Taking into
account the above statement, one can extract from the system
of Eqs. (7), a set of NMode ≪ NDOF, effective subset of
modes shapes, called Ritz vectors, proposed by Wilson [26].
Applying Ritz vectors the structural displacement vector
q(t) can be transformed into
q(t) = ΦRη(t), (8)
where ΦR is the modal transformation matrix (NDOF ×NMode) defined by a designer, and η(t) modal vector. Here,
ΦR is assumed to be a matrix (2106 × 24).
Substituting (8) in (7) we get
MRη̈(t) + CRη̇(t) + KRη(t) = ΦTRp(t), (9)
where
MR = ΦTRMΦR, CR = ΦT
RCΦR, KR = ΦTRKΦR.
(10)
In the end the dynamics of the transmission tower is repre-
sented by 24 mode shapes (Figs. 6 and 7).
Fig. 6. Two mode shapes of the transmission system – first mode (a),
seventeenth (b)
Fig. 7. Tower mode shapes – first mode (a), sixth mode (b)
4.2. Stochastic wind load and structural displacements.
The formulae, related to stochastic wind forces and displace-
ments, applied in the problem, are based on the monograph
by Buchholdt [27].
The horizontal wind velocity is varying with height above
the ground, starting with the velocity equal to 30 m/sec at
10 meters above the ground level. The wind power spectrum
density is Kaimal type function.
The total wind force ptotal(t) acting on the structure can
be expressed in the form
ptotal(t) =1
2ρairCd ◦ Aproj ◦
◦ (vtotal(t) − q̇(t)) ◦ (vtotal(t) − q̇(t)) ,(11)
where ρair – air density, Cd – vector of drag coefficients,
Aproj – vector of structure’s areas exposed to wind project-
ed in normal direction, vtotal(t) – total wind velocity, ◦ –
denotes Hadamard product (entrywise product).
96 Bull. Pol. Ac.: Tech. 62(1) 2014
Unauthenticated | 148.81.55.144Download Date | 3/31/14 1:25 PM
Page 7
Graph based discrete optimization in structural dynamics.
Assuming that the total wind velocity vtotal(t) is a sum
of a constant part v and fluctuating one v(t), and neglecting
small nonlinear terms, one gets
ptotal(t) =1
2ρairCd ◦ Aproj ◦
◦ (v ◦ v + 2v ◦ v(t) − 2v ◦ q̇(t) ) .(12)
The first term of Eq. (12) describes static loading
p =1
2ρairCd ◦ Aproj ◦ v ◦ v. (13)
The second one describes dynamic loading due to wind fluc-
tuations
p(t) = ρairCd ◦ Aproj ◦ v ◦ v(t). (14)
For a number of adjoining FEM joints, the wind veloc-
ity may have the same value. Denoting it by wtotal,j for
j = [1, 2, . . . , NWind], with NWind ≪ NDOF, the rela-
tion with vtotal,i for i = [1, 2, . . . , NDOF] can be define as
vtotal,i = bijwtotal,j or in a matrix form
vtotal(t) = Bwtotal(t). (15)
Together, it was assumed that the spatial wind turbulence acts
at 7 wind sections (3 along the height of tower, and 1 on
each of 4 windward wires). It means, that all total velocities
wtotal,j for j = [1, 2, . . . , NWind] constitute a vector with
NWind = 7 components.
Finally, dynamic wind loading (14) can be expressed in
matrix notation as
p(t) = Gw(t), (16)
where G is the load pattern matrix.
The third term of (12) is the aerodynamic damping, usu-
ally, for practical calculations a simplified its form is applied,
as follows
ρairCd ◦ Aproj ◦ v ◦ q̇(t). (17)
After reducing the number of equations of motion – ap-
plying equations (8)–(10) – the response of the structure due
to fluctuating wind velocity can be efficiently calculated us-
ing frequency domain method. Based on the paper Carassale
et al. [28] the power spectral density matrix of modal coordi-
nates can be evaluated from
Sη(f) = H(f)ΦTRGSw(f)GTΦRH(f)∗, (18)
where f is the frequency, H(f ) is the frequency response
matrix, and H (f)∗ is its complex conjugate.
Assuming weak correlation between individual modes,
one can simplify the above matrix equation to mode-by-mode
form. Following Strommen [29], this can be done by cal-
culating only diagonal terms of the spectral density matrix.
Knowing spectral of individual modal coordinates, one can
easily estimate their modal variances std2ηj
std2ηj
=1
8 (2π fj)3 ζj
NWind∑
i=1
(ϕ(j)R,ri
Grii)2Swi
(fj), (19)
where fj – natural frequency of j-th mode shape, ζj – di-
mensionless damping coefficient of j-th mode shape, ϕ(j)R, ri
–
ri-th component of j-th mode shape, Grii – load pattern due
to i-th wind velocity at ri-th DOF, Swi(fj) – value of i-th
wind fluctuation power spectrum evaluated for fj frequency.
And finally the maximal modal displacement equals
ηj,max = κjstdηj, (20)
where κj is the peak factor (usually from 3.5 to 5 – after
Buchholdt [27]).
Having calculated maximal modal amplitude, maximal
physical displacements and stresses can be obtained from
Eq. (20) by taking the absolute sum of modal maxima
(Petyt [30])
qmax = q +
NMode∑
j=1
∣
∣
∣ϕ(j)R ηj,max
∣
∣
∣,
σmax = σ +
NMode∑
j=1
∣
∣
∣σ
(
ϕ(j)R
)
ηj,max
∣
∣
∣,
(21)
where q and σ stand for mean values of displacements and
stresses.
The proposed absolute sum of modal maxima always gives
the upper estimation of extreme stresses. This entails that our
optimal design, which is sensitive to the assumed constraints,
will be on the safe side.
4.3. Continuous minimum weight for the tower. The prob-
lem is as follows:
Find fourteen design variables: seven pipe diameters Db
and seven their thicknesses tb of structural members, with
material density ρb, linked in seven groups, assuring the min-
imum of the structural volume Vc equal to
Vc =
b0∑
b=1
LbAb. (22)
Subjected to constraints on:
• Stresses
|σj,t| ≤ σ0 = 215 MPa j = 1, 2, . . . ,NElem. (23)
It is assumed that the largest compressive force Pc
Pc ≤ 0.4PE. (24)
• Displacements
|qmax,i| ≤ q0i i = 1, 2, . . . ,NDOF. (25)
• Maximal and minimal values of pipe diameters and their
wall thicknesses
D1b ≤ Db ≤ D
k0b
b , t1b ≤ tb ≤ tk0
b
b , (26)
where σj,t – the largest value of the sum of stresses from
bending and tension at the cross section of j-th FE, σ0 –
the maximum allowable tension stress, q0i – the maximum
allowable displacements.
Bull. Pol. Ac.: Tech. 62(1) 2014 97
Unauthenticated | 148.81.55.144Download Date | 3/31/14 1:25 PM
Page 8
B. Blachowski and W. Gutkowski
The stresses from bending, in members subjected to com-
pressive forces, are multiplied by the amplification factor
ψ = 1, 6 arising from constrains (24), (Chen and Atsu-
ta [31]).
The continuous optimization has been performed using
MATLAB: Optimization Toolbox and Global Optimization
Toolbox. The former contains several types of local minimiz-
ers, which allow to solve nonlinear programming problems,
but strongly dependent on the initial guess of optimal solution.
The latter invokes a selected local minimizer and looks for a
global solution using hundreds of different starting points.
Six design variables of the problem have been assigned
to cross section parameters of legs and braces for Sec. 1, 2
and 3, respectively. The last variable is related to cross section
parameters of all members in Sec. 4 of the tower.
The volume of structural material Vc = 0.1803 m3, ob-
tained from continuous optimization is given in Table 1.
Table 1
Continuous solution
NoDiameter
[mm]Thickness
[mm]Area[cm2]
Moment of Interia[cm4]
1 48.5 2.0 2.9217 7.9114
2 27.1 2.0 1.5771 1.2499
3 51.9 2.1 3.2855 10.2033
4 46.4 2.0 2.7897 6.8884
5 44.4 2.0 2.6641 6.0000
6 27.9 2.0 1.6273 1.3727
7 41.7 2.0 2.4944 4.9268
Total volume = 0.1803 m3
4.4. Discrete minimum weight for the tower. Let us fol-
low now calculations according to the algorithm presented in
Sec. 3.
PART 1: Find values of the discrete cost function.
STEP 1.1
The continuous optimization presented in the previous
Subsec. 4.3 gives V c = 0.1803 m3 (Table 1).
STEP 1.2
The problem with two-branch graph containing all avail-
able CSA Akb
b and Akb+1b , with Ikb
b and Ikb+1b , for each of
seven linking groups, is constructed (Table 2).
Table 2
Catalogue for graph algorithm
Linking group Ak [cm] A
k+1 [cm]
1 2.5384 – CHS 42.4x2.0 3.3238 – CHS 48.3x2.3
2 1.5645 – CHS 26.9x2.0 1.7775 – CHS 26.9x2.3
3 3.3238 – CHS 48.3x2.3 4.1362 – CHS 48.3x2.9
4 2.5384 – CHS 42.4x2.0 3.3238 – CHS 48.3x2.3
5 2.5384 – CHS 42.4x2.0 3.2509 – CHS 42.4x2.6
6 1.5645 – CHS 26.9x2.0 1.9918 – CHS 33.7x2.0
7 1.9918 – CHS 33.7x2.0 2.5384 – CHS 42.4x2.0
STEP 1.3
The closest found, discrete structural volume is Vd =0.1844 m3.
STEP 1.4
The STEP can be omitted, since all possible solutions are
found in STEP 1.3.
PART 2. Verifying constraint violation.
STEP 2.1
The parameter µ(1) = max(|σj,t| ≤ σ0) (in this exam-
ple constraints imposed on displacements are not active) for
some of j0 structural members are showing that constraints
are violated for a value of Vd = 0.1844 m3.
STEP 2.2
We come back to STEP 1.3, looking for the next dis-
crete larger value. After several iteration following value
of structural volume fulfilling constrains was found to be:
Vd = 0.2031 m3.
Comparison of optimal design obtained by full enumera-
tion and present method is presented in Table 3.
Table 3
Comparison of optimal design obtained by full enumeration and present
method
Method/Linking group Full enumaration Graph algorithm
1 CHS 48.3x2.3 CHS 48.3x2.3
2 CHS 26.9x2 CHS 26.9x2
3 CHS 48.3x2.9 CHS 48.3x2.9
4 CHS 48.3x2.3 CHS 48.3x2.3
5 CHS 42.4x2.6 CHS 42.4x2.6
6 CHS 26.9x2 CHS 33.7x2
7 CHS 42.4x2 CHS 42.4x2
Total volume [m3] 0.1996 0.2031
Since the number of all possible combination for the graph
is 27 = 128, it was possible to verify the obtained discrete
value applying direct enumeration. Four volumes, fulfilling
constraints, are: 0.1996; 0.2031; 0.2023; 0.2058 m3.
It shows that the value obtained by graph algorithm is
larger only by less than two per cent of exact value.
5. Discrete minimum weight design
of a floor under synchronized crowd activity
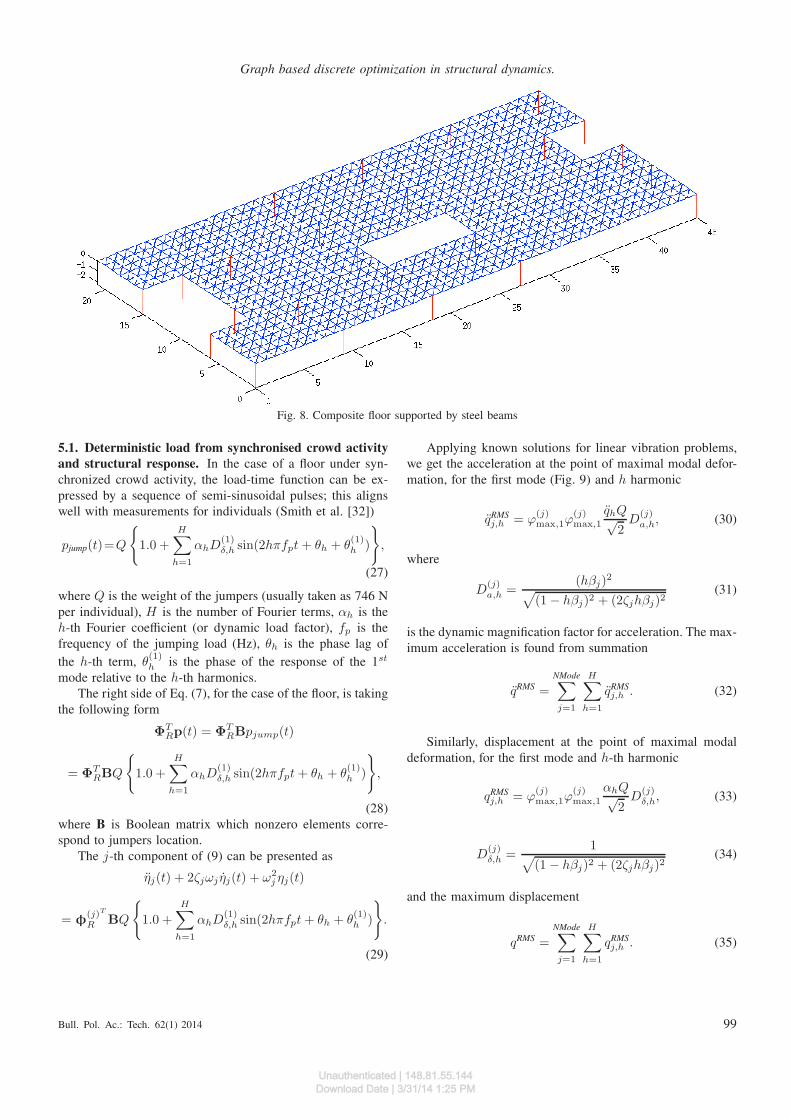
The second example, showing the applicability of the graph
approach to structural optimization is concerning with a floor
(Fig. 8) under synchronised crowd activity. The floor is com-
posed of a concrete plate and a system of supporting steel
beams.
The example demonstrates the optimization of the floor re-
sponse for a composite floor in an office environment (Smith
et al. [32]). The floor consists of a deep normal weight slab
supported by 6.0 m span secondary beams, which, in turn,
are supported by 7.45 m span castellated primary beams.
The thickness of the plate can be chosen from a cata-
logue containing five values hp = [0.10; 0.12; 0.16; 0.18;
0.20] m. On the other hand, there are four design variables
for beams. All of them are selected from a catalogue (British
Universal Columns and Beams), containing 55 different sets
of cross section areas and related to them moments of inertia
and sectional moduli with respect to two axes, starting from
A1 = 16.5 cm2 and ending at A55 = 228.1 cm2.
98 Bull. Pol. Ac.: Tech. 62(1) 2014
Unauthenticated | 148.81.55.144Download Date | 3/31/14 1:25 PM
Page 9
Graph based discrete optimization in structural dynamics.
Fig. 8. Composite floor supported by steel beams
5.1. Deterministic load from synchronised crowd activity
and structural response. In the case of a floor under syn-
chronized crowd activity, the load-time function can be ex-
pressed by a sequence of semi-sinusoidal pulses; this aligns
well with measurements for individuals (Smith et al. [32])
pjump(t)=Q
{
1.0 +
H∑
h=1
αhD(1)δ,h sin(2hπfpt+ θh + θ
(1)h )
}
,
(27)
where Q is the weight of the jumpers (usually taken as 746 N
per individual), H is the number of Fourier terms, αh is the
h-th Fourier coefficient (or dynamic load factor), fp is the
frequency of the jumping load (Hz), θh is the phase lag of
the h-th term, θ(1)h is the phase of the response of the 1st
mode relative to the h-th harmonics.
The right side of Eq. (7), for the case of the floor, is taking
the following form
ΦTRp(t) = ΦT
RBpjump(t)
= ΦTRBQ
{
1.0 +H∑
h=1
αhD(1)δ,h sin(2hπfpt+ θh + θ
(1)h )
}
,
(28)
where B is Boolean matrix which nonzero elements corre-
spond to jumpers location.
The j-th component of (9) can be presented as
η̈j(t) + 2ζjωj η̇j(t) + ω2j ηj(t)
= φ(j)T
R BQ
{
1.0 +
H∑
h=1
αhD(1)δ,h sin(2hπfpt+ θh + θ
(1)h )
}
.
(29)
Applying known solutions for linear vibration problems,
we get the acceleration at the point of maximal modal defor-
mation, for the first mode (Fig. 9) and h harmonic
q̈RMSj,h = ϕ
(j)max,1ϕ
(j)max,1
q̈hQ√2D
(j)a,h, (30)
where
D(j)a,h =
(hβj)2
√
(1 − hβj)2 + (2ζjhβj)2(31)
is the dynamic magnification factor for acceleration. The max-
imum acceleration is found from summation
q̈RMS =
NMode∑
j=1
H∑
h=1
q̈RMSj,h . (32)
Similarly, displacement at the point of maximal modal
deformation, for the first mode and h-th harmonic
qRMSj,h = ϕ
(j)max,1ϕ
(j)max,1
αhQ√2D
(j)δ,h, (33)
D(j)δ,h =
1√
(1 − hβj)2 + (2ζjhβj)2(34)
and the maximum displacement
qRMS =NMode∑
j=1
H∑
h=1
qRMSj,h . (35)
Bull. Pol. Ac.: Tech. 62(1) 2014 99
Unauthenticated | 148.81.55.144Download Date | 3/31/14 1:25 PM
Page 10
B. Blachowski and W. Gutkowski
Fig. 9. First mode shape of composite floor
5.2. Continuous minimum weight for the floor. The prob-
lem consists in finding six design variables, assuring the mini-
mum of the structural weightWc equal to (notations in Sec. 3)
Wc = ρb
b0∑
b=1
LbAb + ρph1S1, (36)
where ρb is the mass density of the beam material, ρp is the
mass density of the floor composite.
Subjected to constraints on:
• Displacements
qRMS ≤ qallowable.
• Accelerations
q̈RMS ≤ q̈allowable.
• Maximal and minimal values of floor composite thickness
hp,min ≤ hp ≤ hp,max.
• Maximal and minimal values of the cross section area of
beams
Aminb ≤ Ab ≤ Amax
b , b = 1, 2, 3, . . . , b0
and related to CSA height Hb of I beam and its web hb.
Similarly to the tower problem, continuous optimization
has been performed using MATLAB: Optimization Toolbox
and Global Optimization Toolbox.
Four design variables of the problem are assigned to cross
section areas, and related to them moments of inertia, of sup-
porting beams and one to the plate thickness.
The distance between the plate middle surface and cen-
troid of the beam cross section (eccentricity), for the largest
profiles is assumed to be
e =hb
2+hp
2.
State constrains are imposed on acceleration q̈RMS ≤ 0.6 m/s2
(Smith at al. [32]) and equivalent static stresses, which are
calculated for the following forces
pjump, equiv = Q
(
1.0 +
H∑
h=1
αhDδ,h
)
.
For beams allowable stress equals to σ0b = 275 MPa and
for concrete of the plate σ0p = 35 MPa.
The weights ρbvb and ρpvp of structural members linked
in the five groups, obtained from continuous optimization are
given in Table 4.
Table 4
Continuous, optimal CSA and plate thickness: available parameters for two-branch graph and discrete optimal solution
Linking group Continuous Solution Discrete two-branch graph for beams and plate Discrete solution Db
1 plate 250.00 { 250.00, 300.00}250.00
(Slab thickness = 10 cm)
2 beam 58.88 { 56.99, 59.82}59.82
(UB 457x152x60)
3 beam 164.07 { 149.15, 179.06}179.06
(UB 610x305x179)
4 beam 108.33 { 101.19, 109.04}109.04
(UB 533x210x109)
5 beam 65.94 { 60.05, 67.12}60.05
(UB 533x210x60)
Structural weight (kg) 251780 { 249330, 295570} 252282
100 Bull. Pol. Ac.: Tech. 62(1) 2014
Unauthenticated | 148.81.55.144Download Date | 3/31/14 1:25 PM
Page 11
Graph based discrete optimization in structural dynamics.
5.3. Discrete minimum weight for the floor. PART 1: Find
values of the discrete cost function.
STEP 1.1
The weights ρbvb and ρpvpof structural members linked
in the five groups, obtained from continuous optimization in
section 5.2, are given in Table 4.
STEP 1.2
The lists of two available beams ρbAkb
b and ρbAkb+1b for
each linking group and two available thicknesses of the plate
ρphkpp and ρph
kp+1p , are constructed. They are listed in Ta-
ble 4.
STEP 1.3
For assumed m = 3, permutations the listed weights are
randomly selected.
STEP 1.4
Performing calculation (i)–(v), a set of m = 3 discrete
values of the cost function are found. They are: Wd ={252178; 252282; 291980} kg.
PART 2.: Verifying constraint violation.
Verification of all constrains shows that for the smallest
weight, they are violated. In the case of the second weight
Wd = 252282 kg, all constrains are satisfied. It is then as-
sumed that this is the discrete minimum weight solution. Val-
ues of optimum parameters for each structural member are
listed in Table 4.
6. Conclusions
A DSO algorithm for structures composed of prefabricated
elements, subjected to stochastic and deterministic loads, is
proposed. The algorithm can be applied to problems with
very large numbers of combinations, arising from numbers of
structural elements and available parameters.
The algorithm is based on a heuristic assumption, that
the structural weight obtained from continuous solution, con-
stitutes a lower bound for a discrete minimum weight. This
assumption, together with the graph representation of the
structural volume, permits to reject from considerations,
very large numbers of structures with volumes smaller, than
the volume obtained from a continuous solution. The algo-
rithm is relatively easy to apply. The only knowledge need-
ed is the FEM and graph representations. In the evolution-
ary type of algorithms, the designer, has to decide about:
number of chromosomes, number of generations, which of
six known methods of the selection of chromosomes for
a crossover should be taken, which of six or even more
mutation types should be applied, the penalty coefficient.
There are no general rules of applying, this or other set
of the mentioned algorithm components. The decision has
to be made through many tedious numerical experiments.
Moreover, evolutionary algorithms need tens of thousands,
or even more, of analysis. The numbers come from products
of numbers of chromosomes multiplied by numbers of gener-
ations.
The proposed algorithm is numerically very efficient. It
requires relatively small numbers of dynamic analyses, com-
paring with Evolutionary Optimization type algorithms [33].
The presented examples are showing advantages of the
proposed algorithm. The number of dynamic analyses, need-
ed to verify, whether obtained from the graph solutions are
not violating constraints, is small. In the first example, with
the transmission tower, this number is 9. In the second one,
dealing with the composite floor, supported with steel beams,
this number is 3. The number of analysis in the continuous
optimisation depends upon the assumed number of starting
points, however usually it does not exceed hundreds.
Acknowledgements. The support of the Polish National Sci-
ence Centre, Grant No 0494/B/T02/2011/40 is much appreci-
ated.
REFERENCES
[1] M.J. Turner, “Design of minimum-mass structures with speci-
fied natural frequencies”, AIAA J. 5 (3), 406–412 (1967).
[2] K.C. Tang, M.Q. Brewster, E.J. Haug, B.R. McCart, and T.D.
Streeter, “Optimal design of structures with constraints on nat-
ural frequency”, AIAA J. 8 (6), 1012–1019 (1970).
[3] Z. Mroz, “Optimum design of elastic structures subjected to
dynamic, harmonically-varying loads”, Ang. Math. Mech. 50,
303–309 (1970).
[4] B.L. Pierson, “A survey of optimal structural design under dy-
namic constraints”, Int. J. Numerical Methods in Engineering
4 (4), 491–499 (1972).
[5] O.G. McGee and K.F. Phan, “On the convergence quality of
minimum-weight design of large space frames under multi-
ple dynamic constraints”, Structural Optimization 4, 156–164
(1992).
[6] R. Grandhi, “Structural optimization with frequency con-
straints – a review”, AIAA J. 31 (1870), 2296–2303 (1993).
[7] J.S. Arora, “Methods for discrete variable structural optimiza-
tion”, in Recent Advances in Optimal Structural Design, ed.
S.A Burns, pp. 1–40, ASCE Publication, Reston, 2002.
[8] L.C. Lee, B. Castro, and P.W. Partridge, “Minimum weight de-
sign of framed structures using a genetic algorithm considering
dynamic analysis”, Latin American J. Solids and Structures 3,
107–123 (2006).
[9] W. Gutkowski, “Structural optimization with discrete design
variables”, Eur. J. Mech., Solids A 16, 107–126 (1997).
[10] B. Blachowski and W. Gutkowski, “Discrete structural opti-
mization by removing redundant material”, Engineering Opti-
mization 40 (7), 685–694 (2008).
[11] B.S. Kang, W.S. Choi, and G.J. Park, “Structural optimiza-
tion under equivalent static loads transformed from dynamic
loads based on displacement”, Computers and Structures 79,
145–154 (2001).
[12] W.S. Choi, K.B. Park, and G.J. Park, “Calculation of equiva-
lent static load and its application”, Trans. SMIRT Washington
DC 16, paper #1111 (2001).
[13] M. Papadrakakis, N.D. Lagaros, and V. Plevris, “Multi-
objective optimization of skeletal structures under static and
seismic loading conditions”, Engineering Optimization 34 (6),
645–669 (2002).
Bull. Pol. Ac.: Tech. 62(1) 2014 101
Unauthenticated | 148.81.55.144Download Date | 3/31/14 1:25 PM
Page 12
B. Blachowski and W. Gutkowski
[14] A. Norkus and R. Karkauskas, “Truss optimization under com-
plex constraints and random loading”, J. Civil Engineering and
Management 10 (3), 217–226 (2004).
[15] H.A. Jensen and M. Beer, “Discrete–continuous variable struc-
tural optimization of systems under stochastic loading”, Struc-
tural Safety 32 (5), 293–304 (2010).
[16] H.Y. Guo and Z.L. Li, “Structural topology optimization
of high-voltage transmission, tower with discrete variables”,
Structural and Multidisciplinary Optimization 43 (6), 851–861
(2011).
[17] W. Gutkowski, J. Bauer, and Z. Iwanow, “Support number and
allocation for optimum structure”, Discrete Structural Opti-
mization, Proc. IUTAM Symp. 1, 168–177 (1993).
[18] Z. Iwanow, “An algorithm for finding an ordered sequence of
values of a discrete linear function”, Control and Cybernetics
6, 238–249 (1990).
[19] B. Blachowski and W. Gutkowski, “A hybrid continuous-
discrete approach to large discrete structural optimization prob-
lems”, Structural and Multidisciplinary Optimization 41 (6),
965–977 (2010).
[20] B. Blachowski and W. Gutkowski, “Revised assumptions for
monitoring and control of 3D lattice structures”, 11th Pan-
American Congress Applied Mechanics PACAM XI 1, CD-
ROM (2010).
[21] J. Gu, Z.D. Ma, and G.M. Hulbert, “A new load-dependent
Ritz vector method for structural dynamics analyses: quasi-
static Ritz vectors”, Finite Elements in Analysis and Design 36
(3), 261–278 (2000).
[22] B. Blachowski, “Model based predictive control of guyed mast
vibration”, J. Theoretical and Applied Mechanics 45 (2), 405–
423 (2007).
[23] W. Borutzky, Bond Graph Methodology: Development and
Analysis of Multidisciplinary Dynamic System Models, SCS
Publishing House, Erlangen, 2004.
[24] A. Buchacz, “Modifications of cascade structures in computer
aided design of mechanical continuous vibration bar systems
represented by graphs and structural numbers”, J. Materials
Processing Technology 157–158, 45–54 (2004).
[25] J.A. Bondy and U.S.R. Murty, Graph Theory, Springer, Berlin,
2008.
[26] E. Wilson, Three-Dimensional Static and Dynamic Analysis of
Structures, 3rd edition, Computers and Structures Inc., Berke-
ley, 2002.
[27] H.A. Buchholdt, Structural Dynamics for Engineers, Thomas
Telford, London, 1997.
[28] L. Carassale and G. Piccardo, “Double modal transformation
and wind engineering applications”, J. Engineering Mechanics
127 (5), 432–439 (2001).
[29] E.N. Strommen, Theory of Bridge Aerodynamics, Springer,
Berlin, 2006.
[30] M. Petyt, Introduction to Finite Vibration Analysis, 2nd edi-
tion, Cambridge University Press, Cambridge, 2010.
[31] W. Chen and T. Atsuta, Theory of Beam-columns, Space
Behavior and Design, vol. 2, J. Ross Publishing, London,
2008.
[32] A.L. Smith, S.J. Hicks, and P.J. Devine, “Design of floors for
vibration: a new approach”, The Steel Construction Institute,
New York, 2009.
[33] M. Szczepaniak and T. Burczynski, “Swarm optimization of
stiffeners locations in 2D structures” , Bull. Pol. Ac.: Tech. 60
(2), 241–246 (2012).
102 Bull. Pol. Ac.: Tech. 62(1) 2014
Unauthenticated | 148.81.55.144Download Date | 3/31/14 1:25 PM