354
GRAPHENE AS SATURABLE ABSORBER FOR PHOTONICS APPLICATIONS FARAH DIANA BINTI MUHAMMAD FACULTY OF SCIENCE UNIVERSITY OF MALAYA KUALA LUMPUR 2014

GRAPHENE AS SATURABLE ABSORBER FOR
PHOTONICS APPLICATIONS
FARAH DIANA BINTI MUHAMMAD
FACULTY OF SCIENCE
UNIVERSITY OF MALAYA
KUALA LUMPUR
2014

GRAPHENE AS SATURABLE ABSORBER FOR
PHOTONICS APPLICATIONS
FARAH DIANA BINTI MUHAMMAD
THESIS SUBMITTED IN FULFILLMENT OF THE
REQUIREMENTS FOR THE DEGREE OF
DOCTOR OF PHILOSOPHY
DEPARTMENT OF PHYSICS
FACULTY OF SCIENCE
UNIVERSITY OF MALAYA
KUALA LUMPUR
2014

UNIVERSITI MALAYA
ORIGINAL LITERARY WORK DECLARATION
Name of Candidate: FARAH DIANA BINTI MUHAMMAD
I/C/Passport No: 900408-03-5244
Regisration/Matric No.: SHC110042
Name of Degree: DOCTOR OF PHILOSOPHY
Title of Project Paper/Research Report/Dissertation/Thesis (“this Work”):
“GRAPHENE AS SATURABLE ABSORBER FOR PHOTONICS APPLICATIONS”
Field of Study: EXPERIMENTAL PHYSICS
I do solemnly and sincerely declare that:
(1) I am the sole author/writer of this Work,
(2) This Work is original,
(3) Any use of any work in which copyright exists was done by way of fair dealing and for
permitted purposes and any excerpt or extract from, or reference to or reproduction of any
copyright work has been disclosed expressly and sufficiently and the title of the Work and its
authorship have been acknowledged in this Work,
(4) I do not have any actual knowledge nor do I ought reasonably to know that the making of
this work constitutes an infringement of any copyright work,
(5) I hereby assign all and every rights in the copyright to this Work to the University of Malaya
(“UM”), who henceforth shall be owner of the copyright in this Work and that any
reproduction or use in any form or by any means whatsoever is prohibited without the
written consent of UM having been first had and obtained,
(6) I am fully aware that if in the course of making this Work I have infringed any copyright
whether intentionally or otherwise, I may be subject to legal action or any other action as
may be determined by UM.
(Candidate Signature) Date:
Subscribed and solemnly declared before,
Witness’s Signature Date:
Name PROFESSOR DR HARITH AHMAD
Designation
Witness’s Signature Date:
Name DR MOHD ZAMANI ZULKIFLI
Designation

ii
ABSTRACT
Graphene, a single layer of carbon atoms, is nowadays considered a great
candidate to be applied as the saturable absorber (SA) with its desirable optical
characteristics such as ultrafast recovery time and ultrawideband absorption due to its
zero bandgap energy and linear dispersion of Dirac electrons. With its advantage over
semiconductor saturable absorber mirror (SESAM) in terms of the cost, tuning range
and ease of fabrication, graphene has been widely accepted to replace the usage of
SESAM. In this work, several methods of graphene integration onto the fiber ferrule
have been demonstrated, such as by optical deposition method, by sandwiching
graphene thin film between the fiber ferrules and by adhering graphene flakes onto the
fiber ferrule using index matching gel. The saturable absorption properties of the
deposited graphene by each different method is also measured and analysed.
Taking advantage of the unique properties of graphene, the graphene deposited
in this work has been demonstrated for Q-switching operation in various setup
configurations, from basic setup of a simple ring cavity of Erbium doped fiber laser
(EDFL) to a more advanced configuration which enables wavelength tunability by
employing different wavelength selective elements including the tunable bandpass filter
(TBF), arrayed waveguide gratings (AWG) and fiber Bragg gratings (FBG).
Comparison on the Q-switching output performance using different wavelength
selective elements is analysed. In addition, graphene Q-switched EDFL based on
distributed Bragg reflector (DBR) cavity configuration and multiwavelength graphene
Q-switched Brillouin-erbium fiber laser have been demonstrated as well, with each

iii
approach having their own advantages. Furthermore, a Q-switched EDFL based on
graphene oxide as the saturable absorber with a simple deposition method has also been
introduced.
Apart from Q-switching, mode-locking generation based on graphene saturable
absorber is also being demonstrated and investigated using a simple ring cavity EDFL.
To provide the wavelength tunability of the mode locked EDFL, a TBF is inserted into
the cavity as the tuning mechanism. Further investigation on the graphene based mode
locked fiber laser is carried out by using an exotic and highly doped Zirconia-erbium
doped fiber (Zr-EDF) as the gain medium. It is interesting to observe that beyond a
certain pump power, harmonic mode locking takes place. In addition, by incorporating a
Mach Zehnder filter into the cavity, the spectrum tunability of the mode locked Zr-
EDFL is achieved and has been well demonstrated. Further development of this
graphene based Zr-EDFL is carried out by demonstrating it as a pulse source for
supercontinuum (SC) generation with an advantage of low cost, since only a short
length of single mode fiber (SMF) is used as the nonlinear medium.
Moreover, in this work, graphene has been also demonstrated as a saturable
absorber for suppressing the noise and multimode oscillations in the laser cavity, and
acts as the key enabler to produce the single longitudinal mode (SLM) operation in the
EDFL. By heterodyning this SLM laser output and an external tunable laser source
(TLS) at a photodetector, a tunable radio frequency generation can be realized.

iv
ABSTRAK
Graphene, satu lapisan atom karbon, dianggap pada masa kini sebagai bahan
kajian yang hebat untuk diaplikasikan sebagai penyerap boleh tepu (saturable absorber)
yang mempunyai karateristik optik yang diinginkan seperti masa pemulihan yang sangat
pantas dan penyerapan dalam lingkungan jalur lebar yang luas disebabkan jurang tenaga
dalam graphene yang bernilai sifar serta serakan lelurus elektron Dirac. Dengan
kelebihan yang dimiliki oleh graphene berbanding cermin penyerap boleh tepu
semikonduktor (SESAM) dari segi kos, julat penalaan dan kemudahan fabrikasi,
graphene telah diterima pakai secara meluas untuk menggantikan penggunaan SESAM.
Dalam projek kajian ini, beberapa kaedah untuk mengintegrasikan graphene pada
hujung gentian optik telah didemonstrasikan, seperti kaedah deposit secara optikal,
kaedah mengapitkan filem nipis graphene antara kedua-dua hujung gentian optik, serta
kaedah melekatkan kepingan graphene pada hujung gentian optik menggunakan gel
bersesuaian indeks (index matching gel). Sifat-sifat penyerapan boleh tepu bagi
graphene yang telah didepositkan menggunakan keadah-kaedah yang berbeza tersebut
juga diukur dan dianalisis.
Graphene yang didedopositkan dalam projek kajian ini juga telah
didemonstrasikan untuk menghasilkan suis-Q (Q-switching) dalam pelbagai bentuk
konfigurasi eksperimen, bermula daripada konfigurasi asas bagi laser fiber berdop-
erbium (EDFL) dalam kaviti membulat kepada konfigurasi yang lebih berteknologi
yang membolehkan penalaan panjang gelombang menggunakan pelbagai jenis alat
pemilih gelombang yang terdiri daripada penapis boleh laras (TBF), parutan gelombang

v
teratur (AWG) dan gentian optik berparut Bragg (FBG). Perbandingan antara prestasi
keluaran suis-Q (Q-switching) menggunakan pelbagai jenis alat pemilih gelombang
tersebut juga telah dicerakinkan. Sebagai tambahan, graphene Q-suis EDFL berdasarkan
konfigurasi kaviti pantulan Bragg teragih (DBR) serta graphene Q-suis dalam multi
gelombang berdasarkan laser Brillouin-erbium juga didemonstrasikan, dengan setiap
pendekatan tersebut mempunyai kelebihahan masing-masing yang tersendiri.
Selain Q-suis, penjanaan mod terkunci (mode locking) berdasarkan graphene
sebagai penyerap boleh tepu juga turut didemonstrasikan dan dikaji menggunakan kaviti
membulat EDFL. Untuk menghasilkan penalaan gelombang dalam EDFL bermod
terkunci tersebut, satu TBF dimasukkan ke dalam kaviti tersebut sebagai alat penala
gelombang. Kajian lanjut tentang laser gentian optik bermod terkunci menggunakan
graphene diteruskan dengan menggunakan fiber eksotik Zirconia berdop-erbium (Zr-
EDF) yang mengandungi kandungan dopan yang tinggi sebagai media gandaan. Selain
itu, dengan memasukkan penapis Mach Zehnder ke dalam kavity tersebut, penalaan
spektrum dapat dicapai dan didemonstrasi dengan baik. Graphene Zr-EDFL bermod
terkunci ini juga dikembangkan lagi sebagai sumber denyutan (pulse) untuk penjanaan
‘supercontinuum’ (SC) yang memupunyai kelebihan dari segi kos.
Dalam projek kajian ini juga, graphene juga telah didemonstrasikan sebagai
penyerap boleh tepu untuk menyekat ayunan multimod dalam kaviti laser bagi
membolehkan hanya satu mode membujur (SLM) untuk beroperasi dalam EDFL.
Dengan menggabungkan keluaran laser SLM tersebut dengan satu sumber laser luaran
(TLS), penjanaan frekuensi radio dapat direalisasikan.

vi
ACKNOWLEDGEMENTS
Praise be to The Almighty, this thesis would not have materialized without the
help and guidance from my supervisor Prof. Harith Ahmad and my co supervisor, Dr.
Mohd. Zamani Zulkifli. No words can describe my deepest appreciation and gratitude to
Prof. Harith who has not only been patient and tolerant to my quest in seeking
knowledge, but also generous in sharing his expertise, immense knowledge and
experience in this field of photonics.
My personal full-hearted appreciation also goes to my family, especially my
parents, Muhammad Yahya and Habsah Yusuf, as well as my siblings, especially my
sisters Hamizah Muhammad and Mazhani Muhammad for supporting, encouraging and
fully understanding me, in order to make sure that I could complete my Ph.D. degree till
the end. Thank you for your love and for being there for me.
My sincere and heartfelt gratitude goes to Mohd. Faizal Ismail for his
selflessness and generous help in the lab, thank you for your kind assistance and strong
encouragement to complete this thesis. Not forgetting the wonderful support from my
relatives, Husin’s family and Datin Rohimah’s family. Also to those who have directly
or indirectly contributed to the completion of this thesis, my gratitude goes to you.
My appreciation also goes to the members of the Photonic Research Center
especially Dr. Richard, Dr. Chong Wu Yi, Dr. Amirah Abdul Latif, Mohd. Hafizin
Jemangin, Fauzan Ahmad, Prof. Sulaiman Wadi Harun and Encik Khairi. You all have
made the lab most enjoyable to work in despite the many challenges we have to put up
with. Thank you for your continuous support and friendship.

vii
LIST OF ISI PUBLICATIONS
1. Muhammad, F. D., Zulkifli, M. Z., Latif, A. A., Harun, S. W., & Ahmad, H. (2012).
Graphene-based saturable absorber for single-longitudinal-mode operation of highly
doped erbium-doped fiber laser. IEEE Photonics Journal, 4(2), 467-475.
2. Ahmad, H., Muhammad, F. D., Zulkifli, M. Z., Latif, A. A., & Harun, S. W. (2012).
Tunable radio frequency generation using a graphene-based single longitudinal mode
fiber laser. Journal of Lightwave Technology, 30(13), 2097-2102.
3. Ahmad, H., Muhammad, F. D., Zulkifli, M. Z., & Harun, S. W. (2012). Graphene-
oxide-based saturable absorber for all-fiber Q-switching with a simple optical
deposition technique. IEEE Photonics Journal, 4(6), 2205-2213.
4. Ahmad, H., Zulkifli, M. Z., Muhammad, F. D., Jemangin, M. H., Dimyati, K., Pal, B.
P., & Harun, S. W. (2012). Passively Q-Switched 11-channel stable Brillouin
erbium-doped fiber laser with graphene as the saturable absorber. IEEE Photonics
Journal, 4(5), 2050-2056. 5. Ahmad, H., Zulkifli, M. Z., Muhammad, F. D., Samangun, J. M., Abdul-Rashid, H.
A., & Harun, S. W. (2013). Temperature-insensitive bend sensor using entirely
centered erbium doping in the fiber core. Sensors, 13(7), 9536-9546.
6. Thambiratnam, K., Ahmad, H., Muhammad, F. D., Zulkifli, M. Z., Zulkifli, A. Z.,
Paul, M., & Harun, S. W. (2014). Q-switching and mode-locking in highly-doped
Zr2O3-Al2O3-Er2O3 doped fiber lasers using graphene as a saturable absorber. IEEE
Journal of Selected Topics in Quantum Electronics, 20(1), 1100108.

viii
7. Ahmad, H., Muhammad, F. D., Zulkifli, M. Z., & Harun, S. W. (2013). Graphene-
based mode-locked, spectrum tunable fiber laser using Mach Zehnder filter. IEEE
Photonics Journal, 5(5), 1501709.
8. Ahmad, H., Razak, N. F., Zulkifli, M. Z., Muhammad, F. D., Munajat, Y., & Harun,
S. W. (2013). Ultra-narrow linewidth single longitudinal mode Brillouin fiber ring
laser using highly nonlinear fiber. Laser Physics Letters, 10(10), 105105.
9. Ahmad, H., Muhammad, F. D., Pua, C. H., & Thambiratnam, K. (2014). Dual-
wavelength fiber lasers for the optical generation of microwave and terahertz
radiation. IEEE Journal of Selected Topics in Quantum Electronics, 20(5), 1-8.
10. Zulkifli, M. Z., Ahmad, H., Taib, J. M., Muhammad, F. D., Dimyati, K., & Harun, S.
W. (2013). S-band multiwavelength Brillouin/Raman distributed Bragg reflector
fiber lasers. Applied Optics, 52(16), 3753-3756.
11. Ahmad, H., Zulkifli, A. Z., Muhammad, F. D., Zulkifli, M. Z., Thambiratnam, K., &
Harun, S. W. (2013). Mode-locked L-band bismuth–erbium fiber laser using carbon
nanotubes. Applied Physics B, 1-6.
12. Ahmad, H., Zulkifli, M. Z., Muhammad, F. D., Zulkifli, A. Z., & Harun, S. W.
(2013). Tunable graphene-based Q-switched erbium-doped fiber laser using fiber
Bragg grating. Journal of Modern Optics, 60(3), 202-212.
13. Ahmad, H., Muhammad, F. D., Zulkifli, M. Z., & Harun, S. W. (2013). Q-switched
pulse generation from an all-fiber distributed Bragg reflector laser using graphene as
saturable absorber. Chinese Optics Letters, 11(7), 071401.
14. Ahmad, H., Zulkifli, M. Z., Muhammad, F. D., Taib, J. M., & Harun, S. W. (2013).
Tunable S-band output based on Raman shift in dispersion shifted fiber. Journal of
Modern Optics, 60(9), 737-740.
ix
15. Ahmad, H., Zulkifli, M. Z., Hassan, N. A., Muhammad, F. D., & Harun, S. W.
(2013). S–C–L triple wavelength superluminescent source based on an ultra-
wideband SOA and FBGs. Quantum Electronics, 43(10), 923-926.
16. Harun, S. W., Ahmad, F., Md Nor, R., Zulkepely, N. R., Muhammad, F. D., Ahmad,
H., & Arof, H. (2014). Mode-locked soliton erbium-doped fiber laser using a single-
walled carbon nanotubes embedded in poly-ethylene oxide thin film saturable
absorber. Journal of Modern Optics, 61(6), 541-545.
17. Ahmad, H., Muhammad, F. D., Zulkifli, M. Z., & Harun, S. W. (2014). Wideband
tunable Q-switched fiber laser using graphene as a saturable absorber. Journal of
Modern Optics, 60(18), 1563-1568.
18. Ahmad, H., Azhari, N. S., Zulkifli, M. Z., Muhammad, F. D., & Harun, S. W. (2014).
S-band SLM distributed Bragg reflector fiber laser. Laser Physics, 20(6), 065109.
19. Ahmad, H., Razak, N. F., Zulkifli, M., Muhammad, F. D., Munajat, Y., & Harun, S.
W. (2014). Closely-spaced dual-wavelength fiber laser using ultra-narrow bandwidth
optical filter for low radio frequency generation. Applied Optics, 53(19), 4123-4127.
20. Ahmad, H., Ismail, M. F., Hassan, S. N. M., Muhammad, F. D., Zulkifli, M. Z., &
Harun, S. W. (2014). Supercontinuum generation from a sub-megahertz repetition
rate femtosecond pulses based on nonlinear polarization rotation technique. Journal
of Modern Optics, 61(16), 1333-1338.
21. Muhammad, F. D., Zulkifli, M. Z., & Ahmad, H. (2014). Graphene based Q-
switched tunable S-band fiber laser incorporating arrayed waveguide gratings
(AWG). Journal of Nonlinear Optical Physics & Materials, 23(1), 1450004.

x
LIST OF ORAL AND POSTER PRESENTATIONS
1. F. D. Muhammad, M. Z. Zulkifli, S. W. Harun, & H. Ahmad, “High resolution
interrogation system for fiber Bragg grating (FBG) sensor application using radio
frequency spectrum analyser” 2012 National Physics Conference (PERFIK 2012),
Colmar Tropicale, Bukit Tinggi, Pahang, 19th – 21th November 2012.
2. F. D. Muhammad, M. Z. Zulkifli, & H. Ahmad, “High resolution temperature sensor
using fiber Bragg gratings (FBGs)” 4th International Graduate Conference on
Engineering Science & Humanity 2013 (IGCESH 2013), Universiti Teknologi
Malaysia (UTM), Skudai, Johor, 16th – 17th April 2013.
3. F. D. Muhammad, M. Z. Zulkifli, & H. Ahmad, “Graphene based Q-switched
tunable S-band fiber laser incorporating Arrayed Waveguide Gratings (AWG)” 9th
International Symposium on Modern Optics and Its Applications (ISMOA 2013)
Institut Teknologi Bandung, Bandung, 24th – 27th June 2013.

xi
CONTENTS
ORIGINAL LITERARY WORK DECLARATION……….………………...….i
ABSTRACT……………………………………………………………………..ii
ABSTRAK…………………………………………………………………...…iv
ACKNOWLEDGEMENTS………………………………….……………...….vi
LIST OF PUBLICATIONS………………………………………….….……..vii
LIST OF ORAL AND POSTER PRESENTATIONS…………….…………….x
CONTENTS………………………………………………………………….....xi
LIST OF FIGURES……………………………………….………….……….xvi
LIST OF TABLES…………………………………………………………...xxiv
ACRONYMS………………………………………………….….…………..xxv
1. INTRODUCTION
1.1 Fiber Lasers……………………………………………………………...1
1.2 Saturable Absorber………………………………………………………3
1.3 Development History and Chronology of Saturable Absorber………….4
1.4 Research Objectives……………………………………………………14
1.5 Thesis Overview………………………………………………………..16
References……………………………………….……………………………..19
2. A REVIEW ON FIBER LASER PHOTONICS
2.1 Introduction…………………………………………………………….33
2.2 Erbium doped fiber……………………………………………………..33
2.2.1 The quasi-three level energy system…………………………...35
2.2.2 Experimental analysis of gain measurement of EDFA………...39
xii
2.3 Modes of laser operation with saturable absorber……………………...40
2.3.1 Single-mode continuous wave………………………………….41
2.3.2 Q-switching…………………………………………………….43
2.3.2.1 Rate equation for passive Q-switched………………….47
2.3.3 Mode locking……………………………………….………….50
2.3.3.1 Broad bandwidth……………………………………….52
2.3.3.2 High pulse repetition rate………………………………53
2.3.3.3 Short pulse duration……………………………………54
2.3.3.4 High peak power……………………………………….55
2.3.3.5 Time bandwidth product……………………………….55
2.3.3.6 Energy Fluctuations and Timing jitter…………………57
2.3.3.7 Group velocity dispersion (GVD)……………………...58
2.3.3.8 Soliton mode locking…………………………………..62
2.3.3.8.1 Soliton formation…………………………….63
2.3.3.8.2 Soliton area theorem…………………………65
2.3.3.8.3 Soliton length………………………………...65
2.3.3.9 Nonlinear Schrodinger equation……………………...66
2.3.3.10 Fiber nonlinearities…………………………………...67
2.3.3.11 Self phase modulation (SPM)………………………...69
2.3.4 Q-switching instabilities (Q-switched mode locking)…………70
References……………………………….…………………………………….74
3. GRAPHENE DEPOSITION AND CHARACTERIZATION
3.1 Graphene: the wondrous material………………………………………79
3.2. Parameters of a saturable absorber……………………………………..83
3.2.1 Two level saturable absorber model……………………………84
xiii
3.2.2 Saturable absorption (Modulation depth)………………………84
3.2.3 Non-saturable loss……………………………………………...85
3.2.4 Saturation intensity……………………………………………..86
3.2.5 Saturation energy……………………………………………….86
3.2.6 Recovery time…………………………………………………..87
3.3 Graphene deposition onto fiber ferrule…………………………………89
3.3.1 Optical deposition method……………………………………...89
3.3.1.1 Characterization of the deposited graphene…………….91
3.3.1.2 Obstacles and challenges in depositing single layer
graphene………………………………………………100
3.3.1.3 Improved and modified optical deposition method for
single layer graphene deposition……………………...101
3.3.2 Graphene adhered by index matching gel…………………….105
3.3.3 Graphene thin film embedment……………………………….108
3.3.4 Optical deposition of graphene oxide with a simple
technique……………………………………………………..110
References…………………………………………………………………….115
4. GRAPHENE FOR Q-SWITCHED FIBER LASERS
4.1 Introduction…………………………………………………………...123
4.2 Graphene Q-switched erbium doped fiber laser………………………125
4.3 Tunable graphene Q-switched EDFLs by employing different
wavelength selective elements………………………………………..132
4.3.1 Tunable graphene Q-switched EDFL by TBF………………..133
4.3.2 Tunable graphene Q-switched EDFL by AWG………………140
4.3.3 Tunable graphene Q-switched EDFL by FBG………………..146
4.3.4 Comparison of the Q-switched output performance between
different wavelength selective elements………………………153
4.4 Graphene Q-switched distributed Bragg reflector (DBR) EDFL……..161
xiv
4.5 Graphene Q-switched multiwavelength Brillouin erbium-doped
fiber laser……………………………………………………………...169
4.6 Graphene oxide Q-switched EDFL…………………………………...181
References…………………………………………………………………….191
5. GRAPHENE FOR MODE LOCKED FIBER LASERS
5.1 Introduction…………………………………………………………...200
5.2 Graphene mode-locked erbium doped fiber laser…………………….202
5.2.1 Tunable graphene mode-locked EDFL by TBF………………215
5.3 Graphene mode-locked zirconia-erbium doped fiber lasers
(ZEDFLs)……………………………………………………………...221
5.3.1 Harmonically mode-locked ZEDFL with graphene…………..228
5.3.2 Spectrum tunable graphene mode-locked ZEDFL by Mach
Zehnder filter………………………………………………….243
5.3.3 Supercontinuum generation from graphene mode-locked
Zr-EDFL……………………...……………………………….254
References…………………………………………………………………….268
6. GRAPHENE FOR SINGLE LONGITUDINAL MODE LASERS AND THEIR
APPLICATION
6.1 Graphene based saturable absorber for single longitudinal
mode EDFL…………………………………………………………...285
6.2 Tunable radio frequency generation using a graphene-based SLM
EDFL………………………………………………………………….294
References…………………………………………………………………….304
7. CONCLUSION AND FUTURE WORKS
7.1 Introduction……………………………………………………….......312
xv
7.2 Summary………………………………………...................................312
7.2.1 Revisiting the EDF as the gain medium and the modes
of laser operation with saturable absorber……………………...313
7.2.2 Depositing graphene onto the fiber ferrule by several
methods…………………………………………………………313
7.2.3 Investigating the use of deposited graphene as SA
for Q-switched fiber lasers……………………………………...316
7.2.4 Investigating the use of deposited graphene as SA
for mode-locked fiber lasers …………………………………...319
7.2.5 Investigating the use of deposited graphene as SA
for SLM fiber lasers ……………………………………………323
7.3 Conclusion……………………………………………………………324
7.4 Future works………………………………………………………….325

xvi
LIST OF FIGURES
1 Introduction
1.1 Schematic diagram of working mechanism of the saturable absorber,
whereby SA, Ec and Ev indicate saturable absorber, energy levels of
conduction band and energy levels of valence band respectively 4
1.2 Atomic layer of (a) graphene and (b) CNT 13
2 A Review on Fiber Laser Photonics
2.1 The illustration of three-level energy system for EDF 35
2.2 Experimental setup for gain measurement of EDFA 39
2.3 Experimental result for gain measurement of the EDFA 40
2.4 Schematic diagram of the Q-switched pulse formation 45
2.5 Evolution of the optical power in a pulsed laser under Q-switched
mode locking condition. Bunches of ultrashort pulses are created in
the pulse train 71
3 Graphene Deposition and Characterization
3.1 Fermi surface showing the Dirac cones which meet at the Dirac point
indicating zero gap nature of graphene 79
3.2 Schematic of light absorption process in graphene 83
3.3 Optical deposition of graphene 90
3.4 Graphene SA assembly 91
3.5 Graphene layer on the core of fiber ferrule as observed from fiber scope 92
3.6 Raman spectrum of the deposited graphene 93
3.7 Spot image of the deposited layer graphene viewed under Raman
spectroscopy 94

xvii
3.8 Data series of optical reflectometry of graphene deposition process 96
3.9 Power dependent transmission data of the deposited graphene 97
3.10 Schematic diagram of ferrule-to-ferrule method 103
3.11 Raman spectrum of the deposited graphene 104
3.12 Power dependent transmission data of the deposited graphene 105
3.13 Raman spectrum of the deposited graphene 106
3.14 The spot image of the deposited graphene under Raman spectroscopy 107
3.15 Graphene-PVA thin film on the fiber ferrule 108
3.16 Raman spectrum of the graphene-PVA thin film 108
3.17 Power dependent transmission data of the graphene-PVA thin film 110
3.18 Raman trace of graphene oxide that is formed on the face of the fiber
ferrule 113
3.19 Power dependent transmission data of the deposited graphene oxide 114
4 Graphene for Q-Switched Fiber Lasers
4.1 Schematic diagram for graphene-based Q-switched EDFL 126
4.2 Average output power against pump power 128
4.3 Pulse repetition rate and pulse width against pump power 129
4.4 Output spectrum of the graphene-based Q-switched EDFL 130
4.5 Output pulse train of the graphene-based Q-switched EDFL 130
4.6 Pulse energy against pump power 131
4.7 Experimental setup of the tunable graphene Q-switched EDFL by TBF 134
4.8 (a) An illustrative layout of the fiber coupled angle-tuned Fabry-Perot
etalon and (b) propagation of light through the Fabry-Perot etalon 135
4.9 (a) Output spectra of the wavelength tunable graphene-based
Q-switched EDFL taken at a wavelength interval of 5 nm, and 137
(b) the zoom in view of the output spectra taken at the wavelength
interval of 1 nm 138
xviii
4.10 Repetition rate of the tunable graphene Q-switched EDFL against
wavelength 139
4.11 Output pulse train with repetition rate of 55.3 kHz at 100.4 mW pump
power 140
4.12 Experimental setup of the tunable graphene Q-switched EDFL by AWG 141
4.13 (a) Schematic diagram of an AWG and (b) slab waveguide 142
4.14 (a) Output spectra of the tunable graphene Q-switched EDFL by AWG
taken at wavelength interval of ~ 3 nm, and (b) the zoom in view of the
output spectra 144
4.15 Repetition rate of the tunable graphene Q-switched by AWG against
wavelength 145
4.16 Output pulse train with repetition rate of 49.8 kHz at 100.4 mW pump
power 146
4.17 Experimental setup of the tunable graphene Q-switched EDFL by FBG 147
4.18 An illustration of the gratings inside the FBG 148
4.19 Schematic of wavelength shift by applying strain to the FBG 149
4.20 An FBG embedded on a Hybrid-material substrate 150
4.21 Schematic layout of the tunable FBGs (a) in normal conditions, i.e.
without giving stress and (b) when stress is induced by rotating the screw 150
4.22 Output spectra of the tunable graphene Q-switched EDFL by FBG at
wavelength interval of ~1 nm 151
4.23 Repetition rate of the tunable graphene Q-switched by FBG against
wavelength 152
4.24 Output pulse train with repetition rate of 42.4 kHz at 100.4 mW pump
power 152
4.25 Combined graph of repetition rate against wavelength for different
wavelength selective elements 153
4.26 Combined graph of the Q-switched output spectrum for different
wavelength selective elements 154
4.27 Combined graph of average output power against pump power 155

xix
4.28 Combined graph of repetition rate against pump power 156
4.29 Combined graph of pulse width against pump power 158
4.30 Combined graph of pulse energy against pump power 159
4.31 Experimental setup of the graphene-based Q-switched DBR fiber laser 163
4.32 Laser output spectrum with respect to different pump power 164
4.33 Average output power against pump power 165
4.34 Pulse repetition rate and pulse width against pump power 166
4.35 Pulse energy and peak power versus pump power 167
4.36 Q-switched output pulse trains taken at different pump powers: 168
4.37 Experimental setup of the graphene-based Q-switched multiwavelength
BEDFL 173
4.38 Output spectrum of the multiwavelength BEDFL with and without
graphene respectively 174
4.39 Output spectrum of the BEDFL for different 980 nm pump power;
(a) with graphene and (b) without graphene as the SA in the cavity 175
4.40 (a)-(e): Optical spectrum of the Stokes lines and the corresponding pulse
spectrum for different 980 nm pump powers 178
4.41 Number of Stokes at different laser diode pump powers 179
4.42 Repetition rate and pulse width of the BEDFL against pump power 180
4.43 Experimental setup of the proposed graphene oxide Q-switched EDFL 183
4.44 Q-switched output pulse trains taken at different pump powers 184
4.45 Repetition rate and pulse width against pump power 185
4.46 Pulse energy and peak power against pump power 186
4.47 Average output power as a function of pump power 188
4.48 Output spectrum of the graphene-oxide Q-switched EDFL 189
xx
5 Graphene for Mode Locked Fiber Lasers
5.1 Experimental setup of graphene mode-locked EDFL 204
5.2 Output spectrum of the mode-locked laser 207
5.3 Short-term stability measurement of the output spectrum over 60 minutes 208
5.4 Output pulse train of the graphene mode-locked EDFL 209
5.5 RF spectrum of the mode-locked pulses at (a) 1 GHz span, and
(b) 200 MHz span 210
5.6 RF spectrum at (a) fundamental frequency peak of 22.47 MHz, and
(b) tenth order of frequency peak of 224.72 MHz 212
5.7 Autocorrelation trace of the mode locked pulse with pulse width of 300 fs 214
5.8 Output spectrum of the mode-locked laser with the incorporation of TBF 216
5.9 (a) Output spectra of the tunable graphene mode locked EDFL at
14 tuned wavelengths at wavelength interval of 5 nm and 217
(b) Autocorrelation traces corresponding to different wavelength spectra 218
5.10 Output pulse train with a repetition rate of 12.9 MHz 219
5.11 3 dB bandwidth and pulse width against wavelengths within the
tuning range 220
5.12 TBP value with respect to different wavelengths within the tuning range 221
5.13 Experimental setup of the graphene-based mode-locked Zr-EDFL 225
5.14 Output spectrum of the graphene-based mode-locked Zr-EDFL 226
5.15 Output pulse train of the graphene-based mode-locked Zr-EDFL 227
5.16 RF spectrum of fundamental frequency at 10.9 MHz 227
5.17 Autocorrelation trace of the mode-locked pulse, with pulse width
of 680 fs 228
5.18 (a): Pulse train at fundamental repetition rate 233
(b): Pulse train at fifth order of harmonic 233
(c): Pulse train at seventh order of harmonic 234
(d): Pulse train at eleventh order of harmonic 234
(e): Zoom in view of the 11th order of harmonic pulse train 235

xxi
5.19 (a) and (b): Example of multipulse bunches formation before being
self-arranged into stable harmonic mode locked pulses 236
5.20 Combined output spectra at different orders of harmonics under
different pump power in a single graph 238
5.21 Stability measurement of the output spectrum at 100 mW within 60
minutes observation time 239
5.22 Repetition rate and pulse energy of the harmonic mode locked pulse
against pump power 240
5.23 Graph of order of harmonic against pump power 241
5.24 Pulse width against pump power 242
5.25 Schematic diagram of the Mach Zehnder interferometer 245
5.26 Configuration of Mach Zehnder filter used as tunable filter 245
5.27 Setup for measuring the transmission spectrum of the Mach Zehnder filter 246
5.28 Transmission spectrum of the Mach Zehnder filter from a white light
source by adjusting the (a) wavelength knob, and (b) the extinction
knob of the filter 247
5.29 Experimental setup for the tunable mode-locked fiber laser using Mach
Zehnder filter 248
5.30 (a)-(c): The mode-locked output spectrum as taken from the OSA for
different transmission bands of the TMZF 250
5.31 The combined mode locked spectrum for different transmission bands
of the TMZF 250
5.32 Output spectra of the mode locked pulses at 13 different central
wavelengths with conserved Kelly sidebands structures 251
5.33 Autocorrelation traces of the laser output at 13 different central
wavelengths 252
5.34 Output pulse width, 3 dB bandwidth and TBP against the central
wavelengths 253
5.35 Experimental setup of the proposed SC generation in the SMF 257
5.36 The SC spectrum in 200 m SMF 259

xxii
5.37 The ASE spectrum from the EDFA 260
5.38 The output spectra from the mode-locked fiber laser, ASE of the EDFA,
amplified mode-locked pulse by EDFA, SC in 200 m SMF 261
5.39 Autocorrelation trace of the SC output, with the measured pulse
width of 630 fs 262
5.40 The SC spectrum in 500 m SMF 263
5.41 Autocorrelation trace of the SC output, with 530 fs pulse width 263
5.42 SC spectrum from the 200 m SMF, 500 m SMF and 100 m HNLF,
combined in a single graph 264
5.43 The SC spectra in the 100 m narrow core SMF 265
5.44 Autocorrelation trace of the SC output, with a FWHM of 120 fs 266
6 Graphene for Single Longitudinal Mode Lasers and Their Application
6.1 Experimental setup for the graphene-based SLM tunable EDFL 287
6.2 Output spectra versus wavelengths in the tuning range of 1547.88
to 1559.88 nm 289
6.3 Output power and SNR versus wavelength 290
6.4 Output stability measurements of the fiber laser over 60 min observation 291
6.5 RF spectrum of the output laser 291
6.6 Schematic diagram of the delayed self-heterodyned technique 292
6.7 RF spectrum of delayed self-heterodyne signal 293
6.8 Linewidth measurement versus wavelength 293
6.9 Experimental setup for tunable microwave generation by beating
two SLM wavelengths from an SLM tunable fiber ring laser and
an inserted external TLS 296
6.10 (a): The optical output spectra of the proposed system and 297
(b): A larger span of the optical output spectra of the proposed system 298
6.11 (a): The electrical spectra of the generated microwave signal and
(b): The zoom-in view of the electrical spectrum at 5 GHz beating signal 299

xxiii
6.12 Wavelength stability measurements over 35 mins observation time 301
6.13 Output power stability measurements over 35 mins observation time 302
6.14 Stability measurement of the generated microwave signal 303

xxiv
LIST OF TABLES
1 Introduction
1.1 Pulsed lasers exploiting graphene as saturable absorber 13
2 A Review on Fiber Laser Photonics
2.1 The symbols in the atomic rate equation and their respective denotations 36
2.2 Different types of pulse shapes, the constant K for the transform limited
pulse and the conversion factors for determining the pulse duration
(at FHWM) 57
2.3 Type of fiber dispersion based on the sign of the dispersion parameter
of the fiber and the corresponding sign of the GVD coefficient 61
2.4 Different regimes of the mode locked operation and the corresponding
pulse shape fitting based on the sign of the total GVD of the cavity 62
3 Graphene Deposition and Characterization
3.1 Reflected power and Raman spectrum of deposited graphene for
different deposition period 99
4 Graphene for Q-Switched Fiber Lasers
4.1 Summarized result of the Q-switched output performance for the
different wavelength selective elements used 160
6 Graphene for Single Longitudinal Mode Lasers and Their Application
6.1 Comparison of the beating frequency from experiment and calculated
value 300
7 Conclusion and Future works
7.1 Summarized result of the Q-switched output performance for the
different wavelength selective elements used 317
xxv
ACRONYMS
AOM acousto-optic modulator
ASE amplified spontaneous emission
ATT attenuator
AWG arrayed waveguide grating
BEDFL Brillouin erbium-doped fiber laser
CCD charge coupled device
CNT carbon nanotube
CVD chemical vapor deposition
CW continuous wave
DFB distributed feedback
DBR distributed Bragg reflector
DWDM dense wavelength division multiplexing
EDF erbium doped fiber
EDFA erbium doped fiber amplifiers
EDFL erbium doped fiber laser
FBG fiber Bragg grating
FWM four wave mixing
GVD group velocity dispersion
HML harmonic mode locking
HNLF highly nonlinear fiber
IMG index matching gel
LD laser diode

xxvi
NMP N-Methyl Pyrrolidone
NPR non-polarization rotation
OC optical circulator
OE opto-electronic
OPM optical power meter
OSA optical spectrum analyzer
PC polarization controller
POA programmable optical attenuator
PVA polyvinyl alcohol
RF radio frequency
RFSA radio frequency spectrum analyser
SA saturable absorber
SBS stimulated Brillouin scattering
SESAM semiconductor saturable absorber
SLM single longitudinal mode
SMF single mode fiber
SNR signal-to-noise ratio
SPM self-phase modulation
TBF tunable bandpass filter
TFBG tunable fiber Bragg gratings
TLS tunable fiber laser
WDM wavelength division multiplexing
Zr-EDF zirconia-based erbium-doped fiber

1
CHAPTER 1
INTRODUCTION
1.1 Fiber Lasers
Development of fiber optic technology was initiated with the invention of the laser
in the 1960s. Copper is acknowledged as the most suitable medium for guiding electrons,
and analogously optical fiber became recognized as the optimal medium for guiding light.
Transmission of light within optical fibers is based on the principle of total internal
reflection, which occurs under conditions of the refractive index of the fiber core being
slightly higher than that of the cladding. Fiber lasers are constructed with a gain medium
of optical fiber doped with rare-earth elements such as erbium, ytterbium, thulium and
neodymium, and these lasers have inherent advantages over traditional solid-state lasers.
One major advantage of fiber lasers lies in the flexible structure of the constituent optical
fiber, which allows the laser to be directed easily to a focusing element with consequent
significance for laser welding, laser cutting, and folding of metals and polymers. Optical
fibers achieve higher optical quality and reliability than solid-state lasers while providing
a far more compact physical size. In general, there are four different modes of laser
operation: continuous wave, Q-switching, mode locking, and Q-switched mode-locking.
High energy pulsed lasing can be achieved by Q-switching, and finds important
applications in the fields of laser processing, medicine, environmental sensing, range
finding, telecommunications, reflectometry, remote sensing and material processing.
Mode locking techniques are primarily applied for generation of very short duration

2
pulses, and particularly pulses with pulse width within the picosecond and femtosecond
regions. Generation of such pulses is significant for various fields, including
telecommunications, range finding, biomedical research, manufacturing, and material
processing. Single-frequency operation on the other hand is important for coherent beam
combining of laser outputs, nonlinear frequency conversion and many other applications
such as high-resolution spectroscopy, interferometry, optical fiber communications,
optical data storage, optical sensors, temperature measurement, atmospheric pollution
monitoring, wind speed measurements via Doppler LIDAR, optical metrology, and
applications requiring a very low intensity noise.
All laser operation modes described above can be achieved by employing
appropriate saturable absorbers in the fiber laser cavity, whereby the laser cavity design
and the saturable absorption properties of the saturable absorber are primarily taken into
account. However, it must be noted that the saturable absorbers work in a different way
for either the pulse or the SLM generation; a saturable absorber operates in time domain
for pulse generation and frequency domain for SLM generation.
In conjunction with the development of compact and simple saturable absorbers,
graphene, a carbon alloptrope, has been well recognized in recent years and widely
adopted as a pure and effective saturable absorber with great potential to replace prior
saturable absorbers. Originating from a one-atom thick layer or a single layer of carbon
atom, this 2-D carbon allotrope has attained much interest and attention in both photonics
and optoelectronics application due to its outstanding and unique features. The working
principle of saturable absorber, as well as the development chronology of the saturable
absorber until the discovery of graphene as saturable absorber, is described in the next
section.

3
1.2 Saturable Absorber
A saturable absorber can be defined as an optical material or device that has a
lower loss for higher light intensities i.e. it absorbs light in different degrees, depending
on the optical intensity of the incident light, with a high degree of absorbance for low
intensity light, and eventual saturated absorption causing a low degree of absorbance for
high intensity light. A simple description of the process of saturable absorption considers
the band structure of the saturable absorber being resembled by a two energy-level
system, which consists of energy levels of valence band, Ev and energy levels of
conduction band, Ec. As the saturable absorber is inserted into the laser cavity, light with
both high and low intensities will pass through the saturable absorber. Upon passing
through the saturable absorber, a high proportion of constituent photons in low intensity
light will be absorbed by the electrons in Ev and facilitate excitation of these electrons to
Ec of the saturable absorber. Absorbance of the photons reduces in the case of high
intensity light incident due to the occupation of electrons in Ec that had experienced
excitation by photons from the low intensity light. In each round trip, an intensity
dependent attenuation is created whereby high intensity light passes through the saturable
absorber with small loss, and vice versa. An effective filtering or omission occurs for the
lower intensity components of the optical pulse (e.g. background continuous wave
radiation, pedestals and pulse wings), while high-intensity components of the pulse
possess the capability to pass through the saturable absorber [1]. Due to this optical
intensity dependent transparency as well as the resulting high intensity contrast, the
saturable absorption consequently divulges [1]. Light thus begins to operate in the pulsed
state. The simplified working mechanism of the saturable absorber is visualized in a
schematic diagram as shown in Figure 1.1.

4
Figure 1.1: Schematic diagram of working mechanism of the saturable
absorber, whereby SA, Ec and Ev indicate saturable absorber, energy
levels of conduction band and energy levels of valence band respectively
1.3 Development History and Chronology of Saturable Absorber
In the early 1970s and 1980s, saturable absorbers were integrated with dye lasers
to generate ultrafast mode locked pulses without exhibiting the Q-switching instabilities.
This mechanism was firstly demonstrated as early as 1974 by Shank and Ippen [2],
whereby a pulse width of 0.5 - 1.0 picosecond is achieved by placing both the satuarble
absorber and gain medium in a single free‐flowing dye stream located near the midpoint
of the laser resonator [2]. Rudlock and Bradley used a similar approach in 1976 [3] to
produce shorter mode locked pulses of 0.3 picoseconds. Five years later, Fork et al. [4]
gave the first report on sub-100 femtosecond colliding pulse mode locked (CPM) dye
lasers, which they realized from the interaction of two synchronized counter propagating

5
pulses with a thin saturable absorber. Despite all these achievements, the existing methods
designed for generating passive mode locked dye lasers were inadequate due to dye laser
disadvantages such as the nanosecond region upper state lifetime being too short and an
overly large gain cross section in the region of 10-16 cm2 [5].
The invention of an artificial saturable absorber generated an intense interest
among scientists for some time. Additive pulse mode locking (APM), also known as
coupled-cavity mode locking, was proposed in 1989 by Mark et al. [6] and Ippen et al.
[7] for generating short optical pulses, and constituted the first type of artificial saturable
absorber. This technique couples an external cavity consisting of single mode fiber to the
main cavity, with both cavities having the same round trip time. The pulses from both
cavities would interfere with each other at the coupling mirror, in which constructive and
destructive interference occur at the pulse center and the pulse wings respectively, thus
enhancing the pulse center while suppressing the pulse wings circulating in the main
cavity. This phenomenon is attributed to the nonlinear phase shift in the single mode fiber
induced by the Kerr effect, which are relatively larger at the temporal pulse center
compared to the pulse wings. Various papers report this technique for mode locking
generation [8-10]. Nevertheless, a major challenge in realizing this technique lies in the
requirement that both the external and the main cavity lengths needed to be properly
adjusted to get an equivalent round trip time as well as to be interferometrically stabilized,
and this condition increases the complexity of this technique.
The innovation of the artificial saturable absorber continued with the discovery of
Kerr lens mode locking (KLM) by Spence et al. in 1991 [11] for the generation of mode
locked pulses with short pulse durations of typically less than 10 picoseconds. KLM is
constructed by introducing a nonlinear self-focusing effect on the laser beam, whereby an

6
active medium with the Kerr nonlinearity is integrated with an aperture. The active
medium with the Kerr nonlinearity will act as a Kerr lensing device with intensity-
dependent focusing power due to the intensity gradients created across the transverse
mode profile in the gain medium. The Kerr effect, which can be defined as the dependence
of the refractive index on the light intensity, plays a major role in this KLM technique.
There are two approaches that can be implemented by this technique, namely soft aperture
KLM and hard aperture KLM. For soft aperture KLM, the beam radius in the gain
medium is reduced by the Kerr lens, which in turn provides an improved spatial overlap
between the pulses and pump beam. This results in increased effective gain for the short
pulses. On the other hand, for hard aperture KLM, the beam radius at the opening of the
aperture is reduced by the Kerr lens, which subsequently decreases the optical losses of
short pulses [5]. This KLM technique has been widely investigated until recent times by
other researchers such as reported in [12-21]. As demonstrated in Ref. [14] for example,
the KLM technique used is able to yield pulses below 5.4 fs directly from a Ti:sapphire
laser without any external cavity pulse compression being added. This technique is
preferred over APM due to the advantage of not requiring cavity stabilization, despite the
recognition of APM for producing picoseconds mode locked pulses effectively. A severe
restriction of KLM is the difficulty in obtaining the self-starting process of the mode
locking. Besides that, to have a stable pulse operation, the cavity needs to be critically
aligned closed to the stability limit of the cavity. This in turn causes cavity design
limitations, which become worse at higher average output powers and massive cavities
[5].
The interest of KLM then diverts to another saturable absorber, known as
semiconductor saturable absorber mirrors (SESAMs), which becomes an alternative to
7
KLM. SESAMs were pioneered by Keller et al. [22] in 1992 by using Nd:YLF laser and
possess an advantage of allowing self-starting and pure continuous wave (CW) passive
mode locking without exhibiting Q-switched instabilities behavior. Subsequent
development of new designs of SESAM rapidly took place. Functioning as an intracavity
saturable absorber, the present SESAMs are basically composed of two non-absorbing
semiconductor layers grown on a semiconductor Bragg mirror, with a quantum well or
bulk absorber embedded in between them. The combination of the semiconductor layer
with the Bragg mirror forms a Fabry-Perot structure, with a reflectivity of about 30 %
from the semiconductor air interface [5]. Unlike previous types of saturable absorbers,
both the linear and nonlinear optical properties of SESAMs could be engineered
accordingly based on the desired characteristics with the advent of modern semiconductor
growth technology as well as the bandgap engineering. This correspondingly allows
researchers to determine the parameters of the saturable absorber including the operation
wavelength, recovery time, modulation depth, absorber lifetime, saturation fluence and
saturation intensity. The design freedom in controlling or customizing those important
parameters of the saturable absorber offers possibilities for generating either pure
passively Q-switched or mode locked pulsed laser operations, with the pulse width
ranging from microseconds to nanoseconds and from picoseconds to femtoseconds
respectively [23]. Furthermore, the compact structure of SESAMs also allows for an
appropriate cavity design without introducing high insertion loss. In general, SESAMs
are mostly employed to generate mode-lock pulses between the wavelength range of 800
and 1550 nm. Multiquantum wells (MQWs) SESAMs, which are formed by the III–V
group binary and ternary semiconductors, have shown the best performance thus far [24-
28]. The process for growing the SESAMs on the distributed Bragg reflectors can be

8
carried out by using either molecular beam epitaxy (MBE) or metal–organic vapor phase
epitaxy (MOVPE) [24,29-31]. The SESAM design guidelines had motivated researches
to extend the frontiers of ultrashort pulse generation throughout the last twenty years,
which were widely being reported [23, 25-37]. Unfortunately, SESAMs have a number
of drawbacks. For instance, SESAMs are prone to damage at high repetition rate of the
output pulse due to its low optical damage threshold, which consequently reduces their
functional lifespan [38,39]. A further shortcoming of SESAMs is that the minimum
output pulse width that can be achieved depends on the carrier relaxation time of the
absorber, thus making limitations to the pulse width engineering [38]. Another major
disadvantage of SESAMs is a rather complex and very costly fabrication process. This
process includes the high-energy heavy-ion implantation procedure, which is involved in
creating defects for shortening the recovery time to the picoseconds timescale. In addition
to exacting fabrication conditions, the SESAMs after fabrication are difficult to be
removed again from the crystalline substrate on which they are grown. This consequently
creates problems in terms of the design flexibility. Fiber-based SESAM moreover should
be integrated for compatibility with fiber optics lasers, but the longer size and higher
saturation intensity in comparison to ordinary SESAMs means this compatibility occurs
at the expense of unstable output. The fiber-based SESAM also shows polarization
dependent characteristics that is undesirable in most cases [40]. Furthermore, the
wavelength tunability dependence on the resonant nonlinearity tends to limit the
wavelength range of operation to a few tens of nanometers [24-26, 30, 41-43], and thus
is not suitable for broadband tunable pulse generation [44,45]. Great demand exists
alongside a growing necessity for new materials for saturable absorbers with the
9
capability to operate in a wide wavelength range and undergo simple, low cost and easy
fabrication and packaging, together with strong ultrafast optical nonlinearities [24].
In conjunction with recent development in nanotechnology, a new group of carbon
materials known as carbon nanotubes (CNTs) have been discovered. These consist of
almost identical 1-D cylindrical structures with a typical length of 1 µm and 0.6 ~ 2 nm
diameter, and their superb properties as a saturable absorber can potentially overcome
many of the shortcomings of traditional saturable absorber technology such as SESAMs.
These CNTs at the same time can also be easily incorporated with fiber-based optical
devices. Several methods for synthesizing CNTs, such as laser vaporization [46], metal-
catalyzed disproportionation of carbon monoxide [47], arc-discharge [48], and gas-phase
pyrolysis [49], have allowed for mass production of CNTs whereby the created CNTs are
deposited as soot on the wall of the production chamber [1]. Fiber end type method is
applicable for incorporating CNTs into a fiber-based optical laser, and can be realized or
prepared based on direct synthesizing of CNTs [50], embedding of CNTs polymer thin
film between two fiber ferrules [51-54] or optical depositing of CNTs [1,55-56]. In terms
of saturable absorber parameters, one of the most distinct benefits of using CNTs
compared to the ordinary semiconductor materials is an intrinsically fast saturable
absorption [40, 57,58] combined with an ultrafast recovery time of less than 1ps [1] to
allow suitability for ultrashort pulse mode locked fiber lasers [40]. The structure of CNTs
can be generally divided into two categories, these being single walled carbon nanotubes
(SWCNTs) and multi walled carbon nanotubes (MWCNTs). SWCNTs consist of only
single cylinder and have more remarkable optical properties in comparison to MWCNTs
[1].
10
The optical absorption of CNTs covers a broad wavelength range from UV to near
infrared [24, 59, 60]. An explanation of the physical process behind this phenomenon
requires firstly understanding the bandgap properties of CNTs. An important criterion of
CNTs, relating to their bandgap properties, is that the synthesized CNT samples naturally
contain a mixture of cylindrical structures of CNTs with different chiralities or diameters
[1]. A particular chirality of CNTs is responsible for a certain absorption band [1].
Bandgap energies of the CNTs are estimated as inversely proportional to their chiralities
or diameters [24,61]. In principle, light is absorbed if its energy matches with that of the
bandgap of an incident material. A material having a wide bandgap energy distribution
thus allows a wide optical absorption band. In summary, the absorption band of CNTs is
determined by the bandgap energies corresponding to the diameters of the nanotubes [62]
and in this respect the wavelength tunable CNT-based mode-locked fiber laser has been
intensively explored [45, 63-65].
Although the wide absorption band of CNTs is crucial for wavelength tunability,
a weakness of having the wide diameter distributions, i.e. the diameters which are not in
resonance with the wavelengths involved in the absorption, is the introduction of extra
insertion loss [62,66]. This is a result of saturable absorption at a specific wavelength of
light being entertained by a particular diameter of CNTs while the other diameters are
unused [66]. The resulting extra linear insertion loss from the idled or unused CNTs cause
a laser system to have difficulty in attaining mode locked operation using a CNT-based
saturable absorber. Another limiting factor of CNTs is that they have high tendency to
form bundles that end up as scattering sites [66] and consequently affect device
performance. A novel material that could offset all these problems is highly desirable.

11
Graphene is another form of carbon alloptrope that nowadays has been well
recognized and widely adopted as a pure and effective saturable absorber for broadband
ultrafast lasers, with great potential to replace CNTs, SESAMs and any other saturable
absorbers. This 2-D carbon allotrope originates from a one-atom thick layer or a single
layer of carbon atom, whereby the carbon atoms are arranged in a regular hexagonal
pattern, as shown in Figure 1.2, and has attained much interest and attention in both
photonics and optoelectronics application due to its outstanding and unique features. The
first postulate of graphene occurred in 1947 [67], whereupon it was considered a mere
theoretical construct due to the infeasibility for a real condensed matter material to get
any thinner than a single atomic layer. A real high quality single layer of graphene was
successfully produced in 2004 [68] and the discoverers Konstantin Novoselov and Andre
Geim were awarded the Nobel Prize in 2010 [38].
The fundamental dynamics of the photo-excited carriers in graphene leads to Pauli
blocking as explained in [62], and saturable absorption in graphene is observed as a
consequence of this Pauli blocking [69]. Graphene has displayed a stunning number of
fascinating and useful properties that affords the advantage to be used as a saturable
absorber [38,62,70-78]. Another interesting property of graphene is the linear dispersion
of Dirac electrons whereby an electron-hole pair in resonance always exists for any
excitation energy due to the gapless behavior of graphene, and this feature provides an
ideal solution for wideband pulse generation [62,79]. The saturable absorption property
of graphene is thus wavelength independent [76,80,81]. In addition, graphene is very
suitable for ultrashort pulse generation as well as for high-repetition-rate laser [38,87,88]
owing to the ultrafast carrier dynamics [62, 82-84] and large absorption of incident light
per layer (α1 = 2.3%) [62,85,86].
12
The myriad superior properties of graphene permit it’s emergence as a strong
candidate to be employed for passively mode-locked [66,72,76] and Q-switched fiber
lasers [89-93] which are tunable over a wide spectral range. Unlike SESAMs and CNTs,
there is no requirement for bandgap engineering or chirality controls in order to optimize
the performance of graphene as a saturable absorber [62]. Moreover, the operational
wavelength range of SESAMs and CNT is quite limited due to their comparative absence
of characteristics found in gapless features of an atomic layer. Taking advantage of the
unique properties of graphene, which meet the important criteria required for a good
saturable absorber in terms of saturation intensity, saturation fluence, saturation energy,
saturation power, modulation depth, recovery time and optical damage threshold, it is
feasible for graphene to overcome and compensate the drawbacks of using SESAM and
SWCNT as a saturable absorber.
Several production methods in graphene fabrication have been introduced and
successfully performed, from a simple method for low-scale production to a more
advanced method for high-scale production. The first production method of graphene is
by micromechanical exfoliation of graphite [94]. Although this approach could yield the
most pure and low defect graphene samples, it cannot produce large-scale assembly of
graphene. More advanced approaches that have been developed to provide a steady
supply of graphene in large areas and quantities include the chemical vapour deposition
(CVD) method [95-98] and liquid phase exfoliation method [99-101]. Apart from these
methods, graphene can also be produced by chemical synthesis [102,103]. Similar to
CNTs, the integration of graphene and the optical fiber system can be achieved by using
the fiber end type method.

13
Figure 1.2: Atomic layer of (a) graphene and (b) CNT
A table that summarizes the major results of pulsed lasers exploiting graphene as
saturable absorber is shown in Table 1.1. EDFL and YDF in the table are the acronyms
for erbium doped fiber laser and ytterbium-doped fiber laser respectively. A detail
summarized results on the performance of pulsed laser using graphene-based saturable
absorber can be found in Ref. [104,105]. A recent report on the summary of graphene as
saturable absorbers has also been discussed in Ref. [106].
Table 1.1: Pulsed lasers exploiting graphene as saturable absorber
Graphene SA
deposition/
fabrication
methods
Laser types
Output
wavelength, λ (nm)
Pulse repetition
rate, f
Pulse width, 𝒕
Polymer-
composite thin
film [62, 72, 89]
EDFL
[62, 72, 89]
1559 nm [62],
1525-1559 nm [72],
1522-1555 nm [89]
19.9 MHz [62],
8 MHz [72],
36-103 kHz [89]
464 fs [62],
~1 ps [72],
~2 µs [89]
Optically driven
deposition
[90,93]
EDFL [90, 93] 1519-1570 nm [90],
1548-1558 nm [93]
8.50-29.05 kHz [90]
1.4-208.0 kHz [93]
~4.6 µs [90]
0.4-94.8 μs [93]
Spray-coating
[78]
EDFL [78] 1561.6 nm [78] 6.99 MHz [78] 1.3 ps [78]
Grown/
transferred
[66, 77, 80,
81,91]
EDFL
[66, 77, 80,91]
YDF [81]
1570-1600 nm [66],
1576.3 nm [77],
1561 nm [80],
1522-1568 nm [91],
1069.8 nm [81]
1.5 MHz [66],
6.84 MHz [77],
2.5 MHz [80],
0.9 MHz [81]
~40-140 ps [66],
415 fs [77],
1.23 ps [80],
>1.5 µs [91],
580 ps [81]
(a) (b)

14
1.4 Research Objectives
As discussed in the earlier section, graphene has a high potential to act as a good
saturable absorber with superior properties such as ultrafast recovery time and
ultrawideband absorption. This would possibly bring a multitude of novel applications
such as for ultrafast laser generation with a simple cavity design and low cost
consumption. As such, the overall focus of this work is in gaining an insight into the
behavior and characteristics of graphene, and subsequently using this graphene in a
number of novel selected applications. These factors form the basis for the motivation
behind this work, which is to investigate this new material for possible applications such
as realizing a compact saturable absorber based fiber laser. There are five main objectives
of this work, which are given as follows:
1. Revisiting erbium-doped fiber (EDF) as the gain medium and the modes of laser
operation with saturable absorber
The first objective of this work is to obtain an in-depth understanding of the
characteristics of the EDF as the gain medium and the possible modes of laser
operation with saturable absorber; continuous wave, Q-switching, mode-locking and
Q-switched mode locking. This will give valuable insights into the importance and
significance of saturable absorber for application in fiber laser system.
2. Depositing graphene onto the fiber ferrule by several methods
The second objective of this work is to experimentally carry out several methods of
graphene deposition onto the fiber ferrule. Subsequently, the characteristics of the
deposited graphene will be examined and analysed. This will consist of an in-depth
study on the physical, optical and saturable absorption properties of the deposited
15
graphene. Understanding these properties will give valuable insights into the
morphology and behavior of graphene created by each different method of graphene
deposition.
3. Investigating the use of deposited graphene as saturable absorber for Q-switched
fiber laser
The third objective of this research work is to investigate the suitability and reliability
of applying the deposited graphene into experimental works for generating Q-switched
fiber lasers. Investigation on tunability, simplicity, cavity compactness and output
performance are among the considerations for a more flexible alternative in
comparison to previous saturable absorbers, alongside interest in overcoming some of
their limitations.
4. Investigating the use of deposited graphene as saturable absorber for mode-
locked fiber laser
Existing technology and research facilities have allowed a lot of the techniques and
concepts in realizing laser pulses to be developed and proven in the laboratory.
Nevertheless, conventional laser pulses systems still lack widespread adoption due to
barriers such as complexity, size, cost and capability. Thus another objective of this
work is to explore and investigate the possibility, capability and superiority of
graphene as a saturable absorber in improving or upgrading the existing technology,
and achievements of laser pulses for mode locking based on the saturable absorber.
Similarly to the third objective, investigation on tunability, simplicity, cavity
compactness and output performance are among the considerations for a more flexible
alternative in comparison to previous saturable absorbers, alongside interest in

16
overcoming some of their limitations. Another key focus to this objective is to develop
a compact supercontinuum source using the generated mode-locked pulses.
5. Investigating the use of deposited graphene as saturable absorber for single
longitudinal mode fiber laser
The fifth objective of this research is to explore the possibility, capability and
superiority of graphene as a saturable absorber in generating the single longitudinal
mode (SLM) operation of a fiber laser. This subsequently aims to improve the
weakness of the current design in SLM fiber laser generation. Another key focus to
this objective is to develop a compact radio frequency (RF) generation from the
generated SLM fiber laser.
1.5 Thesis Overview
The overall presentation of this thesis consists of the literature review of different
types of saturable absorber previously used in the field of short pulse generation, the
theoretical description underpinning this work, the experimental work on graphene
deposition by various methods, further experimental work on graphene as saturable
absorber for Q-switching, mode locking and single longitudinal mode operation, as well
as respective experimental results and analysis by applying the graphene deposited in this
work.
Chapter 2 of this thesis highlights the theoretical aspects of this work, including
the atomic rate equation of erbium doped fiber (EDF) as the gain medium, and the four
possible modes of laser operation with saturable absorber; continuous wave, Q-switching,
mode-locking and Q-switched mode locking. More focus will be given on mode locking

17
since many factors govern mode locked generation. This chapter also will briefly
describe, with theoretical equations, the important parameters of the mode locked output.
Chapter 3 outlines a summary of the optical properties, including saturable
absorption properties, of graphene based on a literature review, and several methods of
graphene deposition onto the fiber ferrule that are experimentally carried out in this work;
these methods include optical deposition, sandwiching graphene thin film between the
fiber ferrules, and adhering graphene flakes onto the fiber ferrule using index matching
gel. Performance of the graphene deposition is verified through Raman spectroscopy. The
measurement of the saturable absorption properties of the deposited graphene such as
modulation depth, saturation intensity and non saturable absorption for each different
method are also carried out experimentally, with data then analysed and presented in this
chapter.
The experimental setup, procedures, experimental results taken, and data analyses
are covered in Chapter 4. Taking advantage of the unique properties of graphene, the
graphene deposited in this work is demonstrated as the saturable absorber for Q-switching
operation in various setup configurations; from basic setup of a simple ring cavity of
Erbium doped fiber laser (EDFL) to a more advance configuration which enables for the
wavelength tunability by employing different wavelength selective elements including
the tunable bandpass filter (TBF), arrayed waveguide gratings (AWG) and fiber Bragg
gratings (FBG). An analytical comparison is undertaken on the Q-switching output
performance using the different wavelength selective elements. In addition, graphene Q-
switched EDFL based on distributed Bragg reflector (DBR) cavity configuration, and
multiwavelength graphene Q-switched based on Brillouin-erbium fiber laser, is also
presented in Chapter 4, with the advantages of each approach scrutinized. Furthermore, a

18
Q-switched EDFL based on graphene oxide as the saturable absorber with a simple
deposition method is also introduced and presented in this chapter.
Apart from Q-switching, mode-locking generation based on graphene saturable
absorber is also being demonstrated and investigated using a simple ring cavity EDFL.
The experimental setup, procedures, experimental results taken, and data analysed related
to mode locking based on graphene saturable absorber are presented in Chapter 5. To
provide the wavelength tunability of the mode locked EDFL, a TBF is inserted into the
cavity as the tuning mechanism. Further investigation on the graphene based mode locked
fiber laser is carried out with an exotic and highly doped Zirconia-erbium doped fiber
(Zr-EDF) as the gain medium. It is interesting to observe harmonic mode locking takes
place beyond a particular pump power. In addition, incorporation of a Mach Zehnder filter
into the cavity has been amply demonstrated for achieving spectrum tunability of the
mode locked Zr-EDFL. Further development of this graphene based Zr-EDFL is carried
out with a demonstration as a pulse source for supercontinuum (SC) generation, and
taking into consideration the advantage of low cost due to a short length of single mode
fiber (SMF) being required as the nonlinear medium.
Chapter 6 describes the experimental work and results on the demonstration of
graphene as saturable absorber for suppressing noise and multimode oscillations in the
laser cavity; the key enablers for producing the single longitudinal mode (SLM) operation
in the EDFL. A tunable radio frequency generation can be realized by heterodyning this
SLM laser output and an external tunable laser source (TLS) at a photodetector.
19
References
1. Kashiwagi, K., & Yamashita, S. (2010). Optical Deposition of Carbon Nanotubes
for Fiber-based Device Fabrication.
2. Shank, C. V., & Ippen, E. P. (1974). Subpicosecond kilowatt pulses from a mode‐
locked cw dye laser. Applied Physics Letters, 24(8), 373-375.
3. Ruddock, I. S., & Bradley, D. J. (1976). Bandwidth‐limited subpicosecond pulse
generation in mode‐locked cw dye lasers. Applied Physics Letters, 29(5), 296-297.
4. Fork, R. L., Greene, B. I., & Shank, C. V. (1981). Generation of optical pulses
shorter than 0.1 psec by colliding pulse mode locking. Applied Physics Letters,
38(9), 671-672.
5. Fermann, M. E., Galvanauskas, A., & Sucha, G. (Eds.). (2002). Ultrafast Lasers:
Technology and Applications (Vol. 80). CRC Press.
6. Mark, J., Liu, L. Y., Hall, K. L., Haus, H. A., & Ippen, E. P. (1989). Femtosecond
pulse generation in a laser with a nonlinear external resonator. Optics Letters, 14(1),
48-50.
7. Ippen, E. P., Haus, H. A., & Liu, L. Y. (1989). Additive pulse mode locking. JOSA
B, 6(9), 1736-1745.
8. Krausz, F., Spielmann, C., Brabec, T., Wintner, E., & Schmidt, A. J. (1990). Self-
starting additive-pulse mode locking of a Nd: glass laser. Optics Letters, 15(19),
1082-1084.
9. Haus, H. A., Fujimoto, J. G., & Ippen, E. P. (1991). Structures for additive pulse
mode locking. JOSA B, 8(10), 2068-2076.

20
10. Goodberlet, J., Jacobson, J., Fujimoto, J. G., Schulz, P. A., & Fan, T. Y. (1990).
Self-starting additive-pulse mode-locked diode-pumped Nd: YAG laser. Optics
Letters, 15(9), 504-506.
11. Spence, D. E., Kean, P. N., & Sibbett, W. (1991). 60-fsec pulse generation from a
self-mode-locked Ti: sapphire laser. Optics Letters, 16(1), 42-44.
12. Brabec, T., Spielmann, C., Curley, P. F., & Krausz, F. (1992). Kerr lens mode
locking. Optics Letters, 17(18), 1292-1294.
13. Cerullo, G., Silvestri, S. D., & Magni, V. (1994). Self-starting Kerr-lens mode
locking of a Ti: sapphire laser. Optics Letters, 19(14), 1040-1042.
14. Morgner, U., Kärtner, F. X., Cho, S. H., Chen, Y., Haus, H. A., Fujimoto, J. G.,
Ippen, E. P., Scheuer, V., Angelow, G., & Tschudi, T. (1999). Sub-two-cycle pulses
from a Kerr-lens mode-locked Ti: sapphire laser. Optics Letters, 24(6), 411-413.
15. Bouma, B. E., & Fujimoto, J. G. (1996). Compact Kerr-lens mode-locked
resonators. Optics Letters, 21(2), 134-136.
16. Bouma, B. E., Tearney, G. J., Bilinsky, I. P., Golubovic, B., & Fujimoto, J. G.
(1996). Self-phase-modulated Kerr-lens mode-locked Cr: forsterite laser source for
optical coherence tomogrphy. Optics Letters, 21(22), 1839-1841.
17. Cho, S. H., Bouma, B. E., Ippen, E. P., & Fujimoto, J. G. (1999). Low-repetition-
rate high-peak-power Kerr-lens mode-locked Al2O3 laser with a multiple-pass
cavity. Optics Letters, 24(6), 417-419.
18. Liu, H., Nees, J., & Mourou, G. (2001). Diode-pumped Kerr-lens mode-locked
Yb:KY(WO4)2 laser. Optics Letters, 26(21), 1723-1725.
19. Cho, S. H., Kärtner, F. X., Morgner, U., Ippen, E. P., Fujimoto, J. G., Cunningham,
J. E., & Knox, W. H. (2001). Generation of 90-nJ pulses with a 4-MHz repetition-

21
rate Kerr-lens mode-locked Ti:Al2O3 laser operating with net positive and negative
intracavity dispersion. Optics Letters, 26(8), 560-562.
20. Durfee, C. G., Storz, T., Garlick, J., Hill, S., Squier, J. A., Kirchner, M., Taft, G.,
Shea, K., Kapteyn, H., Murnane, M., & Backus, S. (2012). Direct diode-pumped
Kerr-lens mode-locked Ti: sapphire laser. Optics Express, 20(13), 13677-13683.
21. Tolstik, N., Sorokin, E., & Sorokina, I. T. (2013). Kerr-lens mode-locked Cr: ZnS
laser. Optics Letters, 38(3), 299-301.
22. Keller, U., Miller, D. A. B., Boyd, G. D., Chiu, T. H., Ferguson, J. F., & Asom, M.
T. (1992). Solid-state low-loss intracavity saturable absorber for Nd: YLF lasers:
an antiresonant semiconductor Fabry–Perot saturable absorber. Optics Letters,
17(7), 505-507.
23. Keller, U., Weingarten, K. J., Kartner, F. X., Kopf, D., Braun, B., Jung, I. D., Fluck,
R., Honninger, C., Matuschek, N., & Aus der Au, J. (1996). Semiconductor
saturable absorber mirrors (SESAM's) for femtosecond to nanosecond pulse
generation in solid-state lasers. Selected Topics in Quantum Electronics, IEEE
Journal of, 2(3), 435-453.
24. Hasan, T., Sun, Z., Wang, F., Bonaccorso, F., Tan, P. H., Rozhin, A. G., & Ferrari,
A. C. (2009). Nanotube–polymer composites for ultrafast photonics. Advanced
Materials, 21(38‐39), 3874-3899.
25. Adams, L. E., Kintzer, E. S., Ramaswamy, M., Fujimoto, J. G., Keller, U., & Asom,
M. T. (1993). Mode locking of a broad-area semiconductor laser with a multiple-
quantum-well saturable absorber. Optics Letters, 18(22), 1940-1942.
22
26. Steinmeyer, G., Sutter, D. H., Gallmann, L., Matuschek, N., & Keller, U. (1999).
Frontiers in ultrashort pulse generation: pushing the limits in linear and nonlinear
optics. Science, 286(5444), 1507-1512.
27. Holmgren, S. J., Fragemann, A., Pasiskevicius, V., & Laurell, F. (2006). Active and
passive hybrid mode-locking of a Nd:YVO4 laser with a single partially poled KTP
crystal. Optics Express, 14(15), 6675-6680.
28. Lecaplain, C., Chédot, C., Hideur, A., Ortaç, B., & Limpert, J. (2007). High-power
all-normal-dispersion femtosecond pulse generation from a Yb-doped large-mode-
area microstructure fiber laser. Optics Letters, 32(18), 2738-2740.
29. Isomaki, A., Vainionpaa, A. M., Lyytikainen, J., & Okhotnikov, O. G. (2003).
Semiconductor mirror for optical noise suppression and dynamic dispersion
compensation. Quantum Electronics, IEEE Journal of, 39(11), 1481-1485.
30. Okhotnikov, O., Grudinin, A., & Pessa, M. (2004). Ultra-fast fibre laser systems
based on SESAM technology: new horizons and applications. New Journal of
Physics, 6(177), 1-22.
31. Burr, E., Pantouvaki, M., Fice, M., Gwilliam, R., Krysa, A., Roberts, J., & Seeds,
A. (2006). Signal stability in periodically amplified fiber transmission systems
using multiple quantum well saturable absorbers for regeneration. Journal of
Lightwave Technology, 24(2), 747.
32. Gong, M., Yu, H., Wushouer, X., & Yan, P. (2008). Passively mode-locked Nd:
YVO4 picosecond laser with oblique incidence on SESAM. Laser Physics Letters,
5(7), 514-517.
23
33. Li, L., Liu, 1. J., Liu, 1. M., Liu, S., Chen, F., Wang, W., & Wang, Y. (2009). 532
nm continuous wave mode‐locked Nd: GdVO4 laser with SESAM. Laser Physics
Letters, 6(2), 113-116.
34. Gomes, L. A., Orsila, L., Jouhti, T., & Okhotnikov, O. G. (2004). Picosecond
SESAM-based ytterbium mode-locked fiber lasers. Selected Topics in Quantum
Electronics, IEEE Journal of, 10(1), 129-136.
35. Cai, Y., Zhou, C., Zhang, M., Ren, L., Chen, L. L., Kong, W. P., Pang, D. Q., &
Zhang, Z. G. (2009). Femtosecond Er doped fiber laser using high modulation depth
SESAM based on metal/dielectric hybrid mirror. Laser Physics, 19(10), 2023-2026.
36. Song, R., Chen, H. W., Chen, S. P., Hou, J., & Lu, Q. S. (2011). A SESAM
passively mode-locked fiber laser with a long cavity including a band pass filter.
Journal of Optics, 13(3), 035201.
37. Liu, J., Xu, J., & Wang, P. (2012). High repetition-rate narrow bandwidth SESAM
mode-locked Yb-doped fiber lasers. Photonics Technology Letters, IEEE, 24(7),
539-541.
38. Miller, J. M. (2011). Optimizing and Applying Graphene as a Saturable Absorber
for Generating Ultrashort Pulses (Doctoral dissertation, University of Colorado).
39. Wood, R. M. (2003). Laser-induced Damage of Optical Materials. CRC Press.
40. Yamashita, S. (2012). A tutorial on nonlinear photonic applications of carbon
nanotube and graphene. Lightwave Technology, Journal of, 30(4), 427-447.
41. Keller, U. (2003). Recent developments in compact ultrafast lasers. Nature,
424(6950), 831-838.
42. Xiang, N., Guina, M. D., Vainionpaa, A. M., Lyytikainen, J., Suomalainen, S.,
Saarinen, M. J., Okhotnikov, O., Sajavaara, T., & Keinonen, J. (2002). Broadband

24
semiconductor saturable absorber mirrors in the 1.55-μm wavelength range for
pulse generation in fiber lasers. Quantum Electronics, IEEE Journal of, 38(4), 369-
374.
43. Grawert, F. J., Gopinath, J. T., Ilday, F. Ö., Shen, H. M., Ippen, E. P., Kaertner, F.
X., Akiyama, S., Liu, J., Wada, K., & Kimerling, L. C. (2005). 220-fs erbium-
ytterbium: glass laser mode locked by a broadband low-loss silicon/germanium
saturable absorber. Optics Letters, 30(3), 329-331.
44. Popa, D., Sun, Z., Hasan, T., Torrisi, F., Wang, F., & Ferrari, A. C. (2011).
Graphene Q-switched, tunable fiber laser. Applied Physics Letters, 98(7), 073106-
073106.
45. Wang, F., Rozhin, A. G., Scardaci, V., Sun, Z., Hennrich, F., White, I. H., Milne,
W. I., & Ferrari, A. C. (2008). Wideband-tuneable, nanotube mode-locked, fibre
laser. Nature Nanotechnology, 3(12), 738-742.
46. Guo, T., Nikolaev, P., Thess, A., Colbert, D. T., & Smalley, R. E. (1995). Catalytic
growth of single-walled manotubes by laser vaporization. Chemical Physics
Letters, 243(1), 49-54.
47. Dai, H., Rinzler, A. G., Nikolaev, P., Thess, A., Colbert, D. T., & Smalley, R. E.
(1996). Single-wall nanotubes produced by metal-catalyzed disproportionation of
carbon monoxide. Chemical Physics Letters, 260(3), 471-475.
48. Journet, C., Maser, W. K., Bernier, P., Loiseau, A., De La Chapelle, M. L., Lefrant,
D. L. S., Loiseau, A., Deniard, P., Lee, R., & Fischer, J. E. (1997). Large-scale
production of single-walled carbon nanotubes by the electric-arc technique. Nature,
388(6644), 756-758.

25
49. Satishkumar, B. C., Govindaraj, A., Sen, R., & Rao, C. N. R. (1998). Single-walled
nanotubes by the pyrolysis of acetylene-organometallic mixtures. Chemical Physics
Letters, 293(1), 47-52.
50. Yamashita, S., Inoue, Y., Maruyama, S., Murakami, Y., Yaguchi, H., Jablonski, M.,
& Set, S. Y. (2004). Saturable absorbers incorporating carbon nanotubes directly
synthesized onto substrates and fibers and their application to mode-locked fiber
lasers. Optics Letters, 29(14), 1581-1583.
51. Sakakibara, Y., Rozhin, A. G., Kataura, H., Achiba, Y., & Tokumoto, M. (2005).
Carbon nanotube-poly (vinylalcohol) nanocomposite film devices: Applications for
femtosecond fiber laser mode lockers and optical amplifier noise suppressors.
Japanese Journal of Applied Physics, 44(4), 1621-1625.
52. Rozhin, A. G., Sakakibara, Y., Namiki, S., Tokumoto, M., Kataura, H., & Achiba,
Y. (2006). Sub-200-fs pulsed erbium-doped fiber laser using a carbon nanotube-
polyvinylalcohol mode locker. Applied Physics Letters, 88(5), 051118-051118.
53. Scardaci, V., Sun, Z., Wang, F., Rozhin, A. G., Hasan, T., Hennrich, F., White, I.
H., Milne, W. I., & Ferrari, A. C. (2008). Carbon nanotube polycarbonate
composites for ultrafast lasers. Advanced Materials, 20(21), 4040-4043.
54. Gerosa, R. M., Steinberg, D., Rosa, H. G., Barros, C., de Matos, C. J. S., & de
Souza, E. A. T. (2013). CNT Film Fabrication for Mode-Locked Er-Doped Fiber
Lasers: The Droplet Method. IEEE Photonics Technology Letters, 25(11), 1007-
1010.
55. Nicholson, J. W., Windeler, R. S., & DiGiovanni, D. J. (2007). Optically driven
deposition of single-walled carbon-nanotube saturable absorbers on optical fiber
end-faces. Optics Express, 15(15), 9176-9183.
26
56. Martinez, A., Fuse, K., Xu, B., & Yamashita, S. (2010). Optical deposition of
graphene and carbon nanotubes in a fiber ferrule for passive mode-locked lasing.
Optics Express, 18(22), 23054-23061.
57. Set, S. Y., Yaguchi, H., Tanaka, Y., & Jablonski, M. (2004). Ultrafast fiber pulsed
lasers incorporating carbon nanotubes. Selected Topics in Quantum Electronics,
IEEE Journal of, 10(1), 137-146.
58. Set, S. Y., Yaguchi, H., Tanaka, Y., & Jablonski, M. (2004). Laser mode locking
using a saturable absorber incorporating carbon nanotubes. Journal of Lightwave
Technology, 22(1), 51-56.
59. Jost, O., Gorbunov, A. A., Pompe, W., Pichler, T., Friedlein, R., Knupfer, M.,
Reibold, M., Bauer, H. D., Dunsch, L., Golden, M. S., & Fink, J. (1999). Diameter
grouping in bulk samples of single-walled carbon nanotubes from optical
absorption spectroscopy. Applied Physics Letters, 75(15), 2217-2219.
60. Zheng, M., Jagota, A., Strano, M. S., Santos, A. P., Barone, P., Chou, S. G., Diner,
B. A., Dresselhaus, M. S., McLean, R. S., Onoa, G. B., Samsonidze, G. G., Semke,
E. D., Usrey, M., & Walls, D. J. (2003). Structure-based carbon nanotube sorting
by sequence-dependent DNA assembly. Science, 302(5650), 1545-1548.
61. Kataura, H., Kumazawa, Y., Maniwa, Y., Umezu, I., Suzuki, S., Ohtsuka, Y., &
Achiba, Y. (1999). Optical properties of single-wall carbon nanotubes. Synthetic
Metals, 103(1), 2555-2558.
62. Sun, Z., Hasan, T., Torrisi, F., Popa, D., Privitera, G., Wang, F., Bonaccorso, F.,
Basko, D. M., & Ferrari, A. C. (2010). Graphene mode-locked ultrafast laser. Acs
Nano, 4(2), 803-810.

27
63. Going, R., Popa, D., Torrisi, F., Sun, Z., Hasan, T., Wang, F., & Ferrari, A. C.
(2012). 500 fs wideband tunable fiber laser mode-locked by nanotubes. Physica E:
Low-Dimensional Systems and Nanostructures, 44(6), 1078-1081.
64. Chamorovskiy, A. Y., Marakulin, A. V., Kurkov, A. S., & Okhotnikov, O. G.
(2012). Tunable Ho-doped soliton fiber laser mode-locked by carbon nanotube
saturable absorber. Laser Physics Letters, 9(8), 602-606.
65. Qin, G., Suzuki, T., & Ohishi, Y. (2010). Widely tunable passively mode-locked
fiber laser with carbon nanotube films. Optical Review, 17(3), 97-99.
66. Zhang, H., Tang, D., Knize, R. J., Zhao, L., Bao, Q., & Loh, K. P. (2010). Graphene
mode locked, wavelength-tunable, dissipative soliton fiber laser. Applied Physics
Letters, 96(11), 111112-111112.
67. Wallace, P. R. (1947). The band theory of graphite. Physical Review, 71(9), 622-
634.
68. Novoselov, K. S., Geim, A. K., Morozov, S. V., Jiang, D., Zhang, Y., Dubonos, S.
V., Grigorieva, I. V., & Firsov, A. A. (2004). Electric field effect in atomically thin
carbon films. Science, 306(5696), 666-669.
69. Bonaccorso, F., Sun, Z., Hasan, T., & Ferrari, A. C. (2010). Graphene photonics
and optoelectronics. Nature Photonics, 4(9), 611-622.
70. Bao, Q., Zhang, H., Wang, Y., Ni, Z., Yan, Y., Shen, Z. X., Loh, K. P., & Tang, D.
Y. (2009). Atomic‐layer graphene as a saturable absorber for ultrafast pulsed lasers.
Advanced Functional Materials, 19(19), 3077-3083.
71. Kumar, S., Anija, M., Kamaraju, N., Vasu, K. S., Subrahmanyam, K. S., Sood, A.
K., & Rao, C. N. R. (2009). Femtosecond carrier dynamics and saturable absorption
in graphene suspensions. Applied Physics Letters, 95(19), 191911-191911.

28
72. Sun, Z., Popa, D., Hasan, T., Torrisi, F., Wang, F., Kelleher, E. J., Travers, J. C.,
Nicolosi, V., & Ferrari, A. C. (2010). A stable, wideband tunable, near transform-
limited, graphene-mode-locked, ultrafast laser. Nano Research, 3(9), 653-660.
73. Lee, C. C., Schibli, T. R., Acosta, G., & Bunch, J. S. (2010). Ultra-short optical
pulse generation with single-layer graphene. Journal of Nonlinear Optical Physics
& Materials, 19(04), 767-771.
74. Vasko, F. T. (2010). Saturation of interband absorption in graphene. Physical
Review B, 82(24), 245422.
75. Xing, G., Guo, H., Zhang, X., Sum, T. C., & Huan, C. H. A. (2010). The Physics
of ultrafast saturable absorption in graphene. Optics Express, 18(5), 4564-4573.
76. Zhang, H., Tang, D. Y., Zhao, L. M., Bao, Q. L., Loh, K. P., Lin, B., & Tjin, S. C.
(2010). Compact graphene mode‐locked wavelength‐tunable erbium‐doped fiber
lasers: from all anomalous dispersion to all normal dispersion. Laser Physics
Letters, 7(8), 591-596.
77. Zhang, H., Tang, D. Y., Zhao, L. M., Bao, Q. L., & Loh, K. P. (2009). Large energy
mode locking of an erbium-doped fiber laser with atomic layer graphene. Optics
Express, 17(20), 17630-17635.
78. Song, Y. W., Jang, S. Y., Han, W. S., & Bae, M. K. (2010). Graphene mode-lockers
for fiber lasers functioned with evanescent field interaction. Applied Physics
Letters, 96(5), 051122-051122.
79. Geim, A. K., & Novoselov, K. S. (2007). The rise of graphene. Nature materials,
6(3), 183-191.

29
80. Bao, Q., Zhang, H., Ni, Z., Wang, Y., Polavarapu, L., Shen, Z. X., Xu, Q. H., Tang,
D. Y., & Loh, K. P. (2011). Monolayer graphene as a saturable absorber in a mode-
locked laser. Nano Research, 4(3), 297-307.
81. Zhao, L. M., Tang, D. Y., Zhang, H., Wu, X., Bao, Q., & Loh, K. P. (2010).
Dissipative soliton operation of an ytterbium-doped fiber laser mode locked with
atomic multilayer graphene. Optics Letters, 35(21), 3622-3624.
82. Seibert, K., Cho, G. C., Kütt, W., Kurz, H., Reitze, D. H., Dadap, J. I., Ahn, H.,
Downer, M. C., & Malvezzi, A. M. (1990). Femtosecond carrier dynamics in
graphite. Physical Review B, 42(5), 2842.
83. Sun, D., Wu, Z. K., Divin, C., Li, X., Berger, C., de Heer, W. A., First, P. N., &
Norris, T. B. (2008). Ultrafast relaxation of excited Dirac fermions in epitaxial
graphene using optical differential transmission spectroscopy. Physical Review
Letters, 101(15), 157402.
84. Breusing, M., Ropers, C., & Elsaesser, T. (2009). Ultrafast carrier dynamics in
graphite. Physical Review Letters, 102(8), 086809.
85. Casiraghi, C., Hartschuh, A., Lidorikis, E., Qian, H., Harutyunyan, H., Gokus, T.,
Novoselov, K. S., & Ferrari, A. C. (2007). Rayleigh imaging of graphene and
graphene layers. Nano Letters, 7(9), 2711-2717.
86. Nair, R. R., Blake, P., Grigorenko, A. N., Novoselov, K. S., Booth, T. J., Stauber,
T., Peres, N. M. R., & Geim, A. K. (2008). Fine structure constant defines visual
transparency of graphene. Science, 320(5881), 1308-1308.
87. Dawlaty, J. M., Shivaraman, S., Chandrashekhar, M., Rana, F., & Spencer, M. G.
(2008). Measurement of ultrafast carrier dynamics in epitaxial graphene. Applied
Physics Letters, 92, 042116.

30
88. Kumar, S., Anija, M., Kamaraju, N., Vasu, K. S., Subrahmanyam, K. S., Sood, A.
K., & Rao, C. N. R. (2009). Femtosecond carrier dynamics and saturable absorption
in graphene suspensions. Applied Physics Letters, 95(19), 191911-191911.
89. Popa, D., Sun, Z., Hasan, T., Torrisi, F., Wang, F., & Ferrari, A. C. (2011).
Graphene Q-switched, tunable fiber laser. Applied Physics Letters, 98(7), 073106-
073106.
90. Cao, W. J., Wang, H. Y., Luo, A. P., Luo, Z. C., & Xu, W. C. (2012). Graphene-
based, 50 nm wide-band tunable passively Q-switched fiber laser. Laser Physics
Letters, 9(1), 54-58.
91. Zhou, D. P., Wei, L., & Liu, W. K. (2012). Tunable graphene Q-switched erbium-
doped fiber laser with suppressed self-mode locking effect. Applied Optics, 51(14),
2554-2558.
92. Cao, W. J., Wang, H. Y., Luo, A. P., Luo, Z. C., & Xu, W. C. (2012). Graphene-
based, 50 nm wide-band tunable passively Q-switched fiber laser. Laser Physics
Letters, 9(1), 54-58.
93. Ahmad, H., Zulkifli, M. Z., Muhammad, F. D., Zulkifli, A. Z., & Harun, S. W.
(2013). Tunable graphene-based Q-switched erbium-doped fiber laser using fiber
Bragg grating. Journal of Modern Optics, 60(3), 202-212.
94. Novoselov, K. S., Jiang, D., Schedin, F., Booth, T. J., Khotkevich, V. V., Morozov,
S. V., & Geim, A. K. (2005). Two-dimensional atomic crystals. Proceedings of the
National Academy of Sciences of the United States of America, 102(30), 10451-
10453.

31
95. Obraztsov, A. N., Obraztsova, E. A., Tyurnina, A. V., & Zolotukhin, A. A. (2007).
Chemical vapor deposition of thin graphite films of nanometer thickness. Carbon,
45(10), 2017-2021.
96. Reina, A., Jia, X., Ho, J., Nezich, D., Son, H., Bulovic, V., Dresselhaus, M. S., &
Kong, J. (2008). Large area, few-layer graphene films on arbitrary substrates by
chemical vapor deposition. Nano Letters, 9(1), 30-35.
97. Vlassiouk, I., Fulvio, P., Meyer, H., Lavrik, N., Dai, S., Datskos, P., & Smirnov, S.
(2013). Large scale atmospheric pressure chemical vapor deposition of graphene.
Carbon, 54, 58–67.
98. Zhang, Y., Zhang, L., & Zhou, C. (2013). Review of Chemical Vapor Deposition
of Graphene and Related Applications. Accounts of chemical research.
99. Hernandez, Y., Nicolosi, V., Lotya, M., Blighe, F. M., Sun, Z., De, S., McGovern,
I. T., Holland, B., Byrne, M., Gun'Ko, Y. K., Boland, J. J., Niraj, P., Duesberg, G.,
Krishnamurthy, S., Goodhue, R., Hutchison, J., Scardaci, V., Ferrari, A. C., &
Coleman, J. N. (2008). High-yield production of graphene by liquid-phase
exfoliation of graphite. Nature Nanotechnology, 3(9), 563-568.
100. Lotya, M., Hernandez, Y., King, P. J., Smith, R. J., Nicolosi, V., Karlsson, L. S.,
Blighe, F. M., De, S., Wang, Z., McGovern, I. T., Duesberg, G. S., & Coleman, J.
N. (2009). Liquid phase production of graphene by exfoliation of graphite in
surfactant/water solutions. Journal of the American Chemical Society, 131(10),
3611-3620.
101. BittoloáBon, S. (2011). High concentration few-layer graphene sheets obtained by
liquid phase exfoliation of graphite in ionic liquid. Journal of Materials Chemistry,
21(10), 3428-3431.
32
102. Choucair, M., Thordarson, P., & Stride, J. A. (2008). Gram-scale production of
graphene based on solvothermal synthesis and sonication. Nature Nanotechnology,
4(1), 30-33.
103. Eigler, S., Enzelberger‐Heim, M., Grimm, S., Hofmann, P., Kroener, W., Geworski,
A., Dotzer, C., Röckert, M., Xiao, J., Papp, C., Lytken, O., Steinrück, H. P., Müller,
P., & Hirsch, A. (2013). Wet chemical synthesis of graphene. Advanced Materials,
25(26), 3583–3587.
104. Bonaccorso, F., & Sun, Z. (2014). Solution processing of graphene, topological
insulators and other 2d crystals for ultrafast photonics. Optical Materials
Express, 4(1), 63-78.
105. Sun, Z., Hasan, T., & Ferrari, A. C. (2012). Ultrafast lasers mode-locked by
nanotubes and graphene. Physica E: Low-dimensional Systems and
Nanostructures, 44(6), 1082-1091.
106. Martinez, A., & Sun, Z. (2013). Nanotube and graphene saturable absorbers for
fibre lasers. Nature Photonics, 7(11), 842-845.

33
CHAPTER 2
A REVIEW ON FIBER LASER PHOTONICS
2.1 Introduction
This chapter begins with a brief overview of the historical and theoretical
background on erbium doped fiber (EDF) as the gain medium used in this work. The
theoretical part includes the basic equations for spontaneous and stimulated emission
and will cover the basic atomic rate equation of EDF as an important aspect of optical
amplification in laser generation. Experimental analysis of the EDF gain measurement
is also presented in this chapter. This chapter also discusses four possible modes of laser
operation using saturable absorber; continuous wave (CW) operating in single
longitudinal mode operation, Q-switching, mode-locking and Q-switched mode locking.
Enhanced focus is given to mode locking since there are many factors governing the
mode locked generation. A description and theoretical equation pertaining to the
important parameters of the mode locked output will also be briefly covered in this
chapter.
2.2 Erbium doped fiber
Erbium doped fiber (EDF) has emerged as a strong candidate for employment as
the gain medium in a fiber ring laser, with particular desirable properties such as large
gain bandwidth of typically tens of nanometers due to lack of sharpness in its energy
level. Exciting the constituent Erbium ions allows EDF to provide amplification of
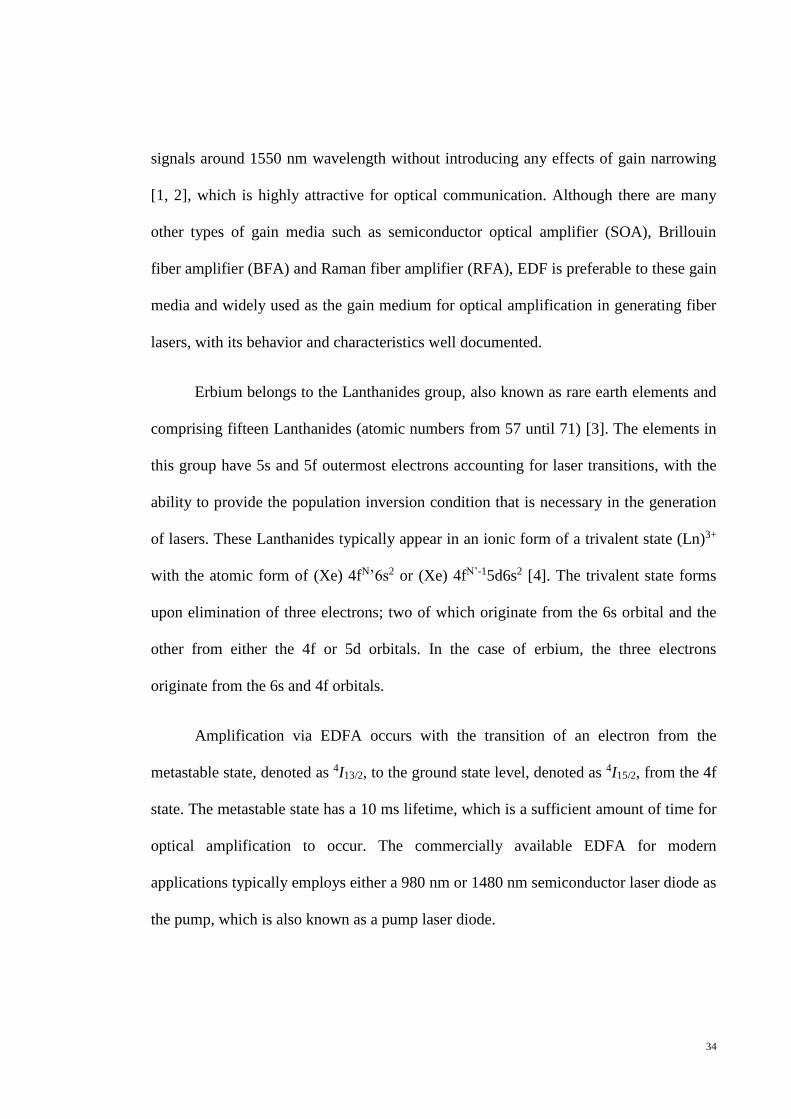
34
signals around 1550 nm wavelength without introducing any effects of gain narrowing
[1, 2], which is highly attractive for optical communication. Although there are many
other types of gain media such as semiconductor optical amplifier (SOA), Brillouin
fiber amplifier (BFA) and Raman fiber amplifier (RFA), EDF is preferable to these gain
media and widely used as the gain medium for optical amplification in generating fiber
lasers, with its behavior and characteristics well documented.
Erbium belongs to the Lanthanides group, also known as rare earth elements and
comprising fifteen Lanthanides (atomic numbers from 57 until 71) [3]. The elements in
this group have 5s and 5f outermost electrons accounting for laser transitions, with the
ability to provide the population inversion condition that is necessary in the generation
of lasers. These Lanthanides typically appear in an ionic form of a trivalent state (Ln)3+
with the atomic form of (Xe) 4fN’6s2 or (Xe) 4fN’-15d6s2 [4]. The trivalent state forms
upon elimination of three electrons; two of which originate from the 6s orbital and the
other from either the 4f or 5d orbitals. In the case of erbium, the three electrons
originate from the 6s and 4f orbitals.
Amplification via EDFA occurs with the transition of an electron from the
metastable state, denoted as 4I13/2, to the ground state level, denoted as 4I15/2, from the 4f
state. The metastable state has a 10 ms lifetime, which is a sufficient amount of time for
optical amplification to occur. The commercially available EDFA for modern
applications typically employs either a 980 nm or 1480 nm semiconductor laser diode as
the pump, which is also known as a pump laser diode.
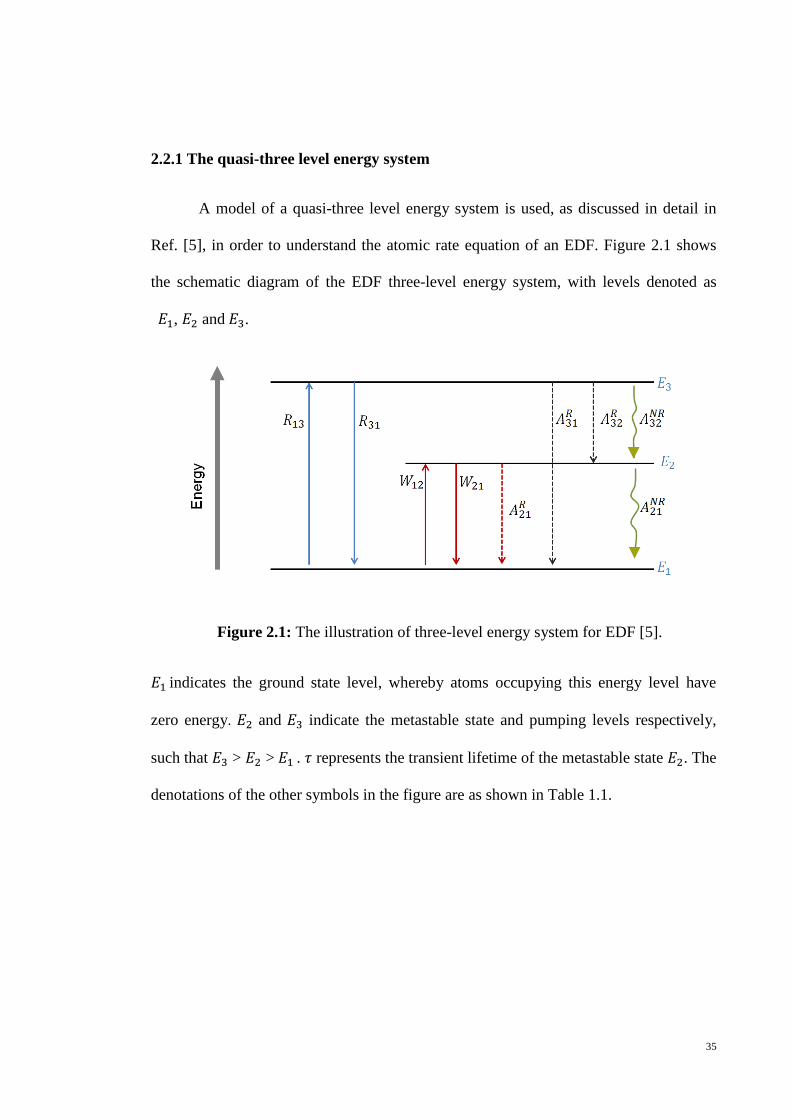
35
2.2.1 The quasi-three level energy system
A model of a quasi-three level energy system is used, as discussed in detail in
Ref. [5], in order to understand the atomic rate equation of an EDF. Figure 2.1 shows
the schematic diagram of the EDF three-level energy system, with levels denoted as
𝐸1, 𝐸2 and 𝐸3.
Figure 2.1: The illustration of three-level energy system for EDF [5].
𝐸1 indicates the ground state level, whereby atoms occupying this energy level have
zero energy. 𝐸2 and 𝐸3 indicate the metastable state and pumping levels respectively,
such that 𝐸3 > 𝐸2 > 𝐸1 . 𝜏 represents the transient lifetime of the metastable state 𝐸2. The
denotations of the other symbols in the figure are as shown in Table 1.1.

36
Table 2.1: The symbols in the atomic rate equation
and their respective denotations
Symbols Denotations
𝑅13 Rate of pumping from 𝐸1 to 𝐸3
𝑅31 Rate of stimulated emission from 𝐸3 to 𝐸1
W12 Absorption rates
W21 Stimulated emission rates
𝐴21𝑅 Spontaneous radiative decay/emission rate
from 𝐸2 to 𝐸1
𝐴31𝑅 Spontaneous radiative decay/emission rate
from 𝐸3 to 𝐸1
𝐴32𝑅 Spontaneous radiative decay/emission rate
from 𝐸3 to 𝐸2
𝐴32𝑁𝑅 Spontaneous nonradiative decay/emission rate
from 𝐸3 to 𝐸2
𝐴21𝑁𝑅 Spontaneous nonradiative decay/emission rate
from 𝐸2 to 𝐸1
For the case of unstable excitation at level 𝐸3, the unstable electrons will undergo
either radiative or nonradiative decay immediately following their excitation. Assuming
that the nonradiative transition from 𝐸3 to 𝐸2, denoted as 𝐴32𝑁𝑅, is the largest contributor
of decay from level 𝐸3, it can be expressed 𝐴32𝑁𝑅 ≫ 𝐴3
𝑅, where 𝐴3𝑅 = 𝐴32
𝑅 + 𝐴31𝑅 and
the emission from level 𝐸3 to 𝐸2 is denoted as 𝐴32𝑁𝑅 for simplicity.
However, a different process takes place in the case of the transition from 𝐸2 to
𝐸1, whereby the most dominant transition is the spontaneous radiative emission 𝐴21𝑅
rather than the spontaneous nonradiative emission 𝐴21𝑁𝑅 i.e. 𝐴21
𝑅 ≫ 𝐴21𝑁𝑅. For the
fluorescence lifetime 𝜏, 𝐴21𝑅 =
1
𝜏. Assigning 𝑁1, 𝑁2 and 𝑁3 as the number of ions at
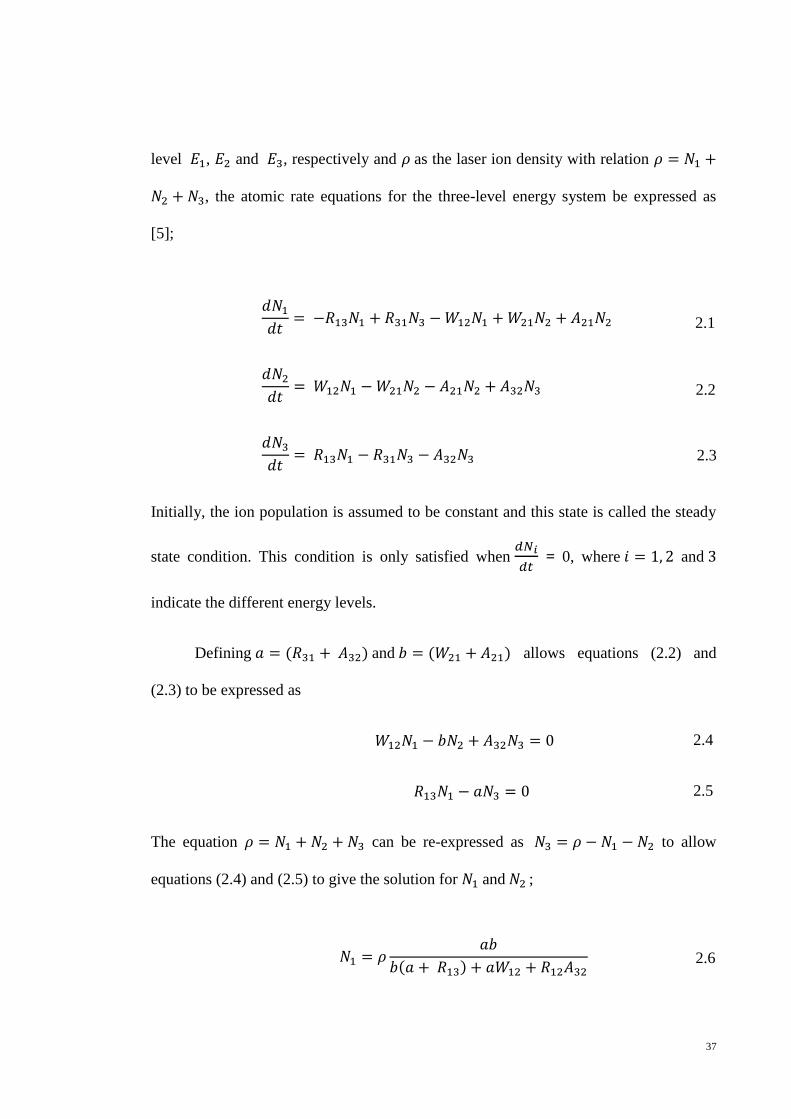
37
level 𝐸1, 𝐸2 and 𝐸3, respectively and 𝜌 as the laser ion density with relation 𝜌 = 𝑁1 +
𝑁2 + 𝑁3, the atomic rate equations for the three-level energy system be expressed as
[5];
𝑑𝑁1
𝑑𝑡= −𝑅13𝑁1 + 𝑅31𝑁3 − 𝑊12𝑁1 + 𝑊21𝑁2 + 𝐴21𝑁2
𝑑𝑁2
𝑑𝑡= 𝑊12𝑁1 − 𝑊21𝑁2 − 𝐴21𝑁2 + 𝐴32𝑁3
𝑑𝑁3
𝑑𝑡= 𝑅13𝑁1 − 𝑅31𝑁3 − 𝐴32𝑁3
2.1
Initially, the ion population is assumed to be constant and this state is called the steady
state condition. This condition is only satisfied when 𝑑𝑁𝑖
𝑑𝑡 = 0, where 𝑖 = 1, 2 and 3
indicate the different energy levels.
Defining 𝑎 = (𝑅31 + 𝐴32) and 𝑏 = (𝑊21 + 𝐴21) allows equations (2.2) and
(2.3) to be expressed as
𝑊12𝑁1 − 𝑏𝑁2 + 𝐴32𝑁3 = 0 2.4
𝑅13𝑁1 − 𝑎𝑁3 = 0 2.5
The equation 𝜌 = 𝑁1 + 𝑁2 + 𝑁3 can be re-expressed as 𝑁3 = 𝜌 − 𝑁1 − 𝑁2 to allow
equations (2.4) and (2.5) to give the solution for 𝑁1 and 𝑁2 ;
𝑁1 = 𝜌𝑎𝑏
𝑏(𝑎 + 𝑅13) + 𝑎𝑊12 + 𝑅12𝐴32
2.2
2.3
2.6

38
𝑁2 = 𝜌
𝑅13𝐴32 + 𝑎𝑊12
𝑏(𝑎 + 𝑅13) + 𝑎𝑊12 + 𝑅13𝐴32
2.7
Using the definitions for 𝑎 and 𝑏 along with factorising 𝐴21 and 𝐴23 results in
𝑁1 = 𝜌(1 + 𝑊21𝜏)(1 +
𝑅13
𝐴32)
(1 + 𝑊21𝜏) (1 +𝑅13 + 𝑅31
𝐴32) + 𝑊12𝜏 (1 +
𝑅31
𝐴32) + 𝑅13𝜏
𝑁2 = 𝜌𝑅13𝜏 + 𝑊12𝜏(1 +
𝑅13
𝐴32)
(1 + 𝑊21𝜏) (1 +𝑅13 + 𝑅31
𝐴32) + 𝑊12𝜏 (1 +
𝑅31
𝐴32) + 𝑅13𝜏
Assuming 𝐴32 ≫ 𝑅13 and 𝐴32 ≫ 𝑅31, it can be deduced that 𝑅13,31
𝐴32 ≈ 0. From the
initial assumption that non-radiative decay rate is dominant, equations (2.8) and (2.9)
become
𝑁1 = 𝜌1 + 𝑊21𝜏
1 + 𝑅𝜏 + 𝑊12𝜏 + 𝑊21𝜏
𝑁2 = 𝜌𝑅𝜏 + 𝑊12𝜏
1 + 𝑅𝜏 + 𝑊21𝜏 + 𝑊12𝜏
where 𝑅 = 𝑅13. From equation (2.10) and (2.11), it can be inferred that 𝑁3 = 𝜌 − 𝑁1 −
𝑁2 = 0. This means that the pump level population is neglected by the major
contribution of the non-radiative decay (𝐴32) from energy level of 𝐸3 to 𝐸2, which is
the metastable level. These equations provide the basic conditions for occurrence of
amplified stimulated emission, which is the key enabler for the generation of lasers. The
next subsection covers experimental analysis of the EDFA gain measurement.
2.10
2.11
2.8
2.9
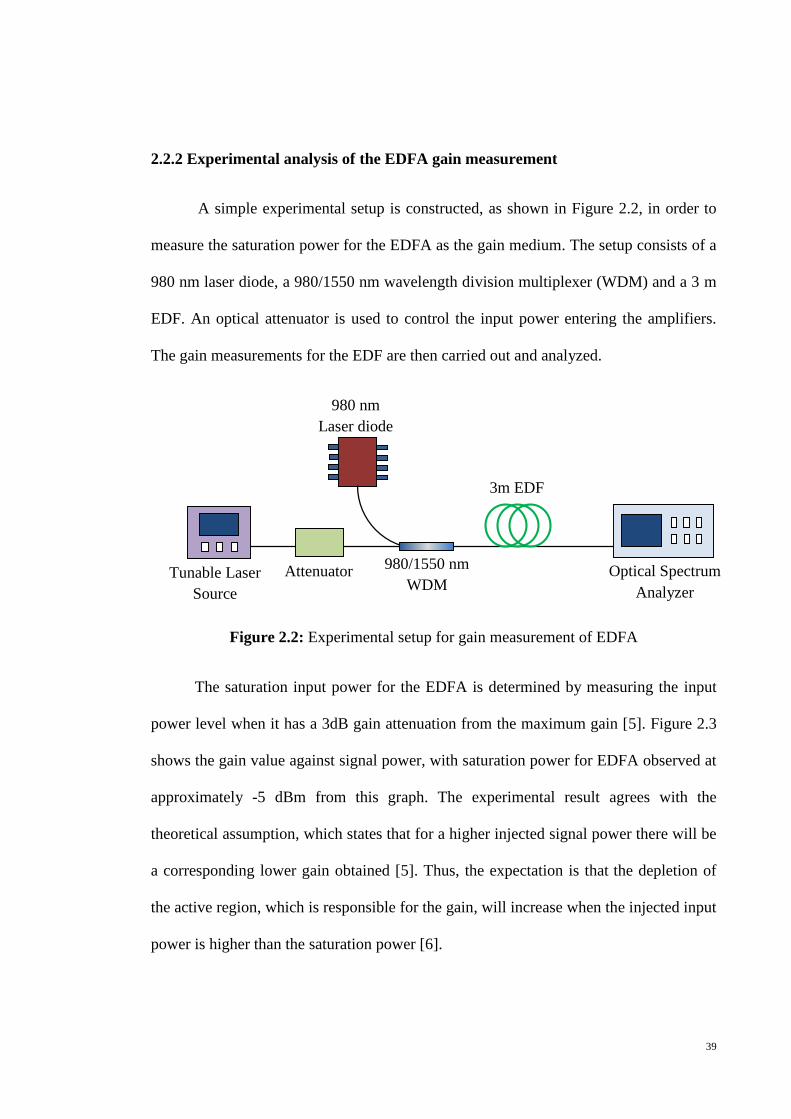
39
2.2.2 Experimental analysis of the EDFA gain measurement
A simple experimental setup is constructed, as shown in Figure 2.2, in order to
measure the saturation power for the EDFA as the gain medium. The setup consists of a
980 nm laser diode, a 980/1550 nm wavelength division multiplexer (WDM) and a 3 m
EDF. An optical attenuator is used to control the input power entering the amplifiers.
The gain measurements for the EDF are then carried out and analyzed.
Figure 2.2: Experimental setup for gain measurement of EDFA
The saturation input power for the EDFA is determined by measuring the input
power level when it has a 3dB gain attenuation from the maximum gain [5]. Figure 2.3
shows the gain value against signal power, with saturation power for EDFA observed at
approximately -5 dBm from this graph. The experimental result agrees with the
theoretical assumption, which states that for a higher injected signal power there will be
a corresponding lower gain obtained [5]. Thus, the expectation is that the depletion of
the active region, which is responsible for the gain, will increase when the injected input
power is higher than the saturation power [6].
Tunable Laser
Source
Attenuator
980 nm
Laser diode
980/1550 nm
WDM
3m EDF
Optical Spectrum
Analyzer

40
Figure 2.3: Experimental result for gain measurement of the EDFA
2.3 Modes of laser operation with saturable absorber
Four different general modes of laser operation exist: CW, Q-switching, mode
locking, and Q-switched mode locking. Saturable absorbers are mainly used for
generating passive mode locking and Q-switching, being determined by the laser cavity
design as well as the saturable absorption properties of the saturable absorber. Aside
from Q-switching and mode locking, saturable absorbers at a different angle and by a
different approach can also be used for generating single longitudinal mode (SLM)
operation in a CW laser. However, it must be noted that the saturable absorbers work in
a different way for either the pulse or the SLM generation; the saturable absorber
operates in time domain for pulse generation, whereas the saturable absorber operates in
frequency domain for SLM generation. The following subsection describes each
possible type of mode of laser operation that could be generated with the saturable
absorber.
-5
0
5
10
15
20
25
-45 -35 -25 -15 -5 5 15
Input power (dBm)
Gai
n (
dB
)3 dB

41
2.3.1 Single-mode continuous wave
A single frequency laser, or more precisely the single longitudinal mode laser,
can be defined as a laser operating on a single mode of its resonator, with a very narrow
laser linewidth output of typically a few kilohertz. Such output is far below the
longitudinal mode spacing of the resonator and many orders of magnitude below the
gain bandwidth. Single longitudinal mode lasers can potentially attain a very low
intensity noise since the mode distribution noise has been eliminated. On the other hand,
the linewidth for the multimode oscillation is formed by a multiple of the mode spacing
(free spectral range) of the resonator. Single-frequency operation is important for
coherent beam combining of laser outputs, nonlinear frequency conversion and many
other applications. A list of these applications includes high-resolution spectroscopy,
interferometry, optical fiber communications, optical data storage, optical sensor,
temperature measurement, atmospheric pollution monitoring, wind speed measurements
with Doppler LIDAR, optical metrology, and also applications where the intensity noise
must be very low. Some of the applications require a particular characteristic of the
single longitudinal mode output. For example, a narrow spectral width of the output is
necessary in spectroscopy, while other cases such as in optical data storage require a
low intensity noise of the output.
The linewidth value of the single longitudinal output is theoretically limited by
the Schawlow-Townes linewidth [7], which is based on the Schawlow–Townes
equation that can be expressed as
∆𝜐 laser = 4𝜋 ℎ𝜈 (∆𝜐c )
2
𝛲out
2.12

42
where hv is the photon energy, Δνc is the resonator bandwidth (half width at half-
maximum, HWHM), and Pout is the output power. The estimated linewidth from this
equation is interpreted as a half width at half-maximum. Nevertheless, it is very difficult
to reach the Schawlow–Townes limit in most cases due to influences from thermal
fluctuations and acoustic noise.
Melvin Lax [8] proposes that the linewidth should be two times smaller than
derived by Schawlow and Townes, which in turn leads to the following equation
∆𝜐 laser =𝜋 ℎ𝜈 (∆𝜐c )
2
𝛲out
where the laser linewidth and the cavity linewidth are now at the full width at half
maximum (FWHM).
In ref. [9] and [10], a more general form of the equation has been derived and
expressed as follows
∆𝜐 laser = ℎ𝑣 𝜃 𝑙tot 𝑇oc
4 𝜋 𝑇rt 2 𝑃out
where θ is the spontaneous emission factor, ltot is the total cavity losses, Toc is the output
coupler transmission, and Trt is the cavity round-trip time.
Single longitudinal mode oscillation can usually be achieved if the net gain
bandwidth is smaller than the frequency spacing of the resonator modes. Multiple axial
modes might oscillate in the cavity for the case of larger net gain bandwidth than the
axial mode spacing. Several longitudinal modes can exist even though the laser is
oscillating in a single transverse mode operation as it propagates through a single mode
fiber (SMF), with these modes manifested as ‘beatings’ or multiple peaks when
2.14
2.13
43
observed through the radio frequency spectrum analyzer as indicating the noise of the
fiber laser. Conversely, SLM operation allows for only one longitudinal mode
oscillation in the laser cavity. This consequently provides a high spectral purity of the
fiber laser. Several approaches have been taken in realizing the single longitudinal mode
operation, such as by incorporating the optical filters in the cavity in order to decrease
the gain bandwidth or by constructing a very short laser cavity in order to increase the
mode spacing. A short laser cavity can be realized in ring laser cavity configurations by
employing a highly doped fiber as the gain medium. Single longitudinal mode operation
in a linear cavity configuration can be achieved by using either a distributed feedback
(DFB) or a distributed Bragg reflector (DBR) laser cavity configuration. Reduced mode
competition is generally the factor that prevents a laser from achieving single
longitudinal mode oscillation. One example source of reduced mode competition is the
inhomogeneous gain saturation through spatial hole burning.
Although most single longitudinal mode lasers operate in CW regime, it is also
possible for them to operate in Q-switched regime. A Q-switched single longitudinal
mode laser has a very clean Q-switched pulse shape and very low noise due to no mode
beating in the laser oscillation.
2.3.2 Q-switching
Q-switching can be defined as a technique to produce high energy laser pulses
by introducing an intracavity loss to modulate the quality factor Q of the resonator. Ref.
[11], expresses the Q-factor as a product of 2π and the ratio of stored energy in the

44
resonator 𝐸𝑠 to the lost energy per resonator cycle 𝐸𝑙. This relationship is shown in
equation 2.15
𝑄 =2𝜋𝐸𝑠
𝐸𝑙
Hence, the lower the loss energy per resonator cycle, the higher the Q-factor of the
resonator. The process in generating Q-switching pulse begins with the buildup of the
laser pumping to create an elevated population inversion inside a laser cavity, while
simultaneously eliminating the cavity feedback or keeping the laser within the cavity
from oscillating in such a way that the cavity loss is greatly increased. In other words,
the stimulated emission in the gain medium is temporarily suspended by means of
introducing a transmission loss inside the laser cavity so the population inversion in the
gain medium can significantly build up. Once a large inversion has been achieved, the
cavity Q is switched back to its usual large value whereupon the stored energy is
discharged by a suitable rapid modulation method. The outcome is a very short, intense
burst of laser output representing all the accumulated population inversion dumped in a
single short laser pulse [12] of typically microseconds pulse duration. Generation of
high energy pulsed laser that is invoked by Q-switching has importance for applications
in laser processing, medicine, environmental sensing, range finding,
telecommunications, reflectometry, remote sensing and material processing [13-19].
Figure 2.4 shows the schematic diagram of the Q-switched pulse formation.
2.15

45
As illustrated in the figure, the cavity loss in the laser cavity is initially set at
some artificially high value while the population inversion, and hence the gain in the
laser medium, is largely built up by pumping process to be far in excess of that normally
present in the oscillating laser. Essentially, the oscillation build up is prevented while
the pumping process builds up the population inversion over some period of time to a
larger than normal value. As lasing cannot occur at such a time, the energy fed into
the gain medium by the pumping mechanism will accumulate to the extent that the
stored energy can be a multiple of the saturation energy. After some period, the cavity
loss is suddenly reduced or “switched” to a small value using either active or passive
technique i.e. the cavity Qc parameter abruptly increases with the result that the round-
trip gain after switching is much larger than the cavity loss. The initial spontaneous
emission or noise level in the laser cavity then immediately begins to build up at an
unusually rapid rate and soon develops into a rapidly rising and intense burst, or “giant
pulse” of laser oscillation. The pulse peak is reached when the gain is equal to the
remaining cavity loss. The rapid oscillation burst becomes sufficiently powerful that it
begins to saturate or deplete the inverted atomic population, i.e. “burn up” the inverted
atoms, within a very short time. The population at the higher energy level is
Figure 2.4: Schematic diagram of the
Q-switched pulse formation.
Loss
Gain
Laser pulse
Giant pulse
laser action
takes place
46
simultaneously being consumed, or used up, by the stimulated emission during the
formation or growth of the giant pulse. The oscillation signal in fact rapidly drives the
inversion well below the new cavity loss level, after which the oscillation signal in the
cavity dies out nearly as rapidly as it rose [12]. The oscillation build-up interval and
particularly the output pulse duration are generally much shorter than the pumping time
during which the population inversion was created. The inversion build up during a long
pumping time is thus dumped over very short pulse duration. The peak power in the Q-
switched giant pulse can be three to four orders of magnitude more intense than the CW
long pulse oscillation level that would be created in the same laser using the same
pumping rate [12].
The output performances of Q-switching are analysed based on several
parameters such as pulse repetition rate, pulse duration, pulse energy and peak power.
The Q-switched pulse repetition rate is usually in the kHz range and pulse duration in
the µs range. Q-switching has relatively much longer pulse duration and much lower
pulse repetition rate in comparison to mode locking, which corresponds to the time
taken between two successive pulses to restore the emitted energy and is dependent on
the lifetime of the electron in the excited state within the gain medium. The several ms
lifetime of erbium-doped fiber is not short enough to yield ultimately high repetition
rate in Q-switching, although this can be achieved by the mode locking operation after
satisfying specific conditions [20]. Nevertheless, Q-switching has certain advantages
over mode locking, and is easier to accomplish on account of no requirement for
controlling and attaining an equilibrium between the dispersion and nonlinearity of the
intracavity medium in contrast to mode-locking [20].
47
Either active or passive approaches can be used to modulate the Q-factor of the
resonator in order to realize Q-switched laser operation. Active Q-switching involves
the modulation of the Q-factor from the external equipment, or of components
implemented in the laser cavity such as electro-optic modulator [21], acousto-optic
modulator [22,23] and mechanical rotating chopper. Passive Q-switching incorporates a
saturable absorber that is inserted within the laser cavity. In this case, the saturable
absorber would initially provide a loss that is sufficiently high to inhibit lasing.
Excitation of electrons to the higher energy level can consequently achieve an extremely
large population inversion. With the increase of the population at the upper energy
level, the gain continues to rise until the additional loss originating from the saturable
absorber has been overcome. The saturable absorber is finally bleached by the generated
photons [24,25], and a similar process to that explained earlier then takes place for Q-
switched pulse formation. Active Q-switching is generally easier to trigger than passive
Q-switching. Otherwise, passive Q-switching approach is more desirable and more
rapidly investigated than active Q-switching due to its advantages of simpler
configuration, higher reliability, low cost and compactness. Active Q-switching requires
additional mechanisms integrated in the laser cavity that will result in a high insertion
loss and increase in the complexity of the cavity.
2.3.2.1 Rate equation for passive Q-switched
The simplest model for a passively Q-switched laser is described in Ref. [12] as
consisting of a laser cavity mode with cavity photon number n(t), a saturable gain
medium with population difference Ng(t) and coupling coefficient Kg, and a saturable

48
absorbing medium with population difference Na(t) and coupling coefficient Ka. The
elementary rate equations describing this system can be expressed as
𝑑𝑛(𝑡)
𝑑𝑡 = [KgNg(t) − KaNa(t) − γc] n(t),
For the gain medium, the usual rate equation can be written as
𝑑𝑁𝑔(𝑡)
𝑑𝑡 = Rp − γ2gNg(t) − KgNg(t)n(t),
In the case of a saturable absorber, a similar rate equation can be written as
𝑑𝑁𝑎(𝑡)
𝑑𝑡 = − γ2a [Na(t) − Na0] − KaNa(t)n(t).
γ2g and γ2a now mean the population recovery rates for the gain and the saturable
absorber respectively. The saturable absorber is assumed to relax towards an
unsaturated value Na0 with a time constant τa = 1/γ2a.
The solutions to these equations are even more strongly nonlinear for the
passively Q-switched laser than for an actively Q-switched laser, since the Q-switching
process itself is controlled by the signal build up in the laser. There is one relatively
simple analytical criterion for good passive Q-switching behavior that can be derived
from these equations as follows. First suppose the laser pump power is turned on and
begins to pump up the laser gain medium until the laser gain exceeds the cavity loss
plus the unsaturated absorber losses. The photon density n(t) in the cavity will then start
to build up from noise, and after a certain time the photon density n(t) will become large
enough that it begins to saturate the saturable absorber. Let t = 0 be the point where the
2.16
2.17
2.18

49
saturable absorber just begins to saturate and the Q-switched pulse just starts to develop,
and laser inversion just at this point be represented by Ng0.
In most Q-switched lasers, the pumping and relaxation times for the gain
medium are long compared to the Q-switching buildup and decay time. Thus the gain
medium equation during the Q-switching interval can be simplified to
𝑑𝑁𝑔(𝑡)
𝑑𝑡 ≈ − KgNg(t)n(t),
which has a formal solution expressed as:
Ng(t) = Ng0 exp [−𝐾𝑔 ∫ 𝑛(𝑡′)𝑑𝑡′𝑡
0]
The physical significance of this approximation is that the gain is depleted by the
integrated or cumulative effect of the photon flux n(t) which passes through the gain
medium, rather than by the instantaneous intensity in the cavity.
Recovery time τa for saturable absorbers is usually short (in the range of
nanoseconds to picoseconds) compared to the Q-switched pulse widths τp in practical
lasers (which are typically tens to hundreds of nanoseconds). An absorber’s population
difference is then given by the steady state solution of the absorber rate equation to a
good approximation, or
Na(t) ≈ 𝑁𝑎0
1 + (𝐾𝑎𝛾2𝑎
) 𝑛(𝑡)
This relationship implies that the saturable absorber will saturate in an essentially
instantaneous fashion during the Q-switched pulse.
The initial growth rate for the cavity photon number immediately prior to
saturation of either absorber or amplifier is then given by
2.19
2.20
2.21

50
𝑑𝑛(𝑡)
𝑑𝑡 ≈ [KgNg0 − KaNa0 − γc] n(t) = γg0 n(t)
where γg0 ≡ KgNg0 − KaNa0 − γc is the initial growth rate for the photon number before
any Q-switching has occurred.
In the next subsection, a brief theoretical description is presented on mode
locking, a different mode of laser operation from Q-switching, and includes the factors
governing the mode locked generation and the important parameters of the mode locked
output.
2.3.3 Mode locking
In a laser system, a mode locking technique is primarily applied for the
generation of pulses with very short duration, particularly within the picoseconds and
femtoseconds regimes. Basically, mode locking is achieved by inducing all the multiple
longitudinal modes to oscillate in a fixed phase relationship and fixed mode spacing
with each other. Interference between the multiple modes in the cavity will then take
place and facilitate the formation of a stationary waveform in time and space, which is
observed as a pulses train from the oscilloscope. Generation of mode-locked fiber laser
has always become a competitive race among the researchers around the world owing to
its significance in various fields, including telecommunications, range finding,
biomedical research, manufacturing, and material processing [26-29]. Similarly to Q-
switching, mode locking can be generated by using either an active or passive approach.
Active mode locking involves the usage of external equipment or devices such as
amplitude modulators and RF signal generators, whereas passive mode locking involves
2.22

51
the usage of saturable absorbers, which favors the generation of a train of short pulses
against other modes of operation such as CW emission. Passively mode-locked fiber
laser is preferable in comparison to the active approach due to its simplicity and easy
operation; the use of bulk active components in active mode locking would eventually
increase the complexity and the cost of the laser system.
The process of the pulse formation in mode locking by using the saturable
absorber is also important to be understood. Starting from a CW regime, the process
involves the saturable absorber favoring any small noise spikes with the consequence
that those small noise spikes can grow faster than the CW background. Once these noise
spikes contain a significant part of the circulating energy, they begin to saturate the gain
and cause the CW background to start to decay. Subsequently, the most energetic noise
spike, which experiences the least amount of saturable absorption, will eliminate all the
other spikes by saturating the gain to a level where these experience net loss in each
round trip. As a result, a single circulating pulse is obtained. Owing to the action of the
saturable absorber, which favors the peak over the wings of the pulse, the duration of
the pulse is then reduced further in each cavity round trip until broadening effects
induced by dispersion become strong enough to prohibit further pulse shortening. The
described start-up can be prevented if strong pulse-broadening effects are present in an
early phase.
In the next subsection, the characteristics of the mode-locked pulses in terms of
spectral bandwidth, pulse repetition rate, pulse width, peak power, time-frequency
relationship as well as the factors governing the mode locking behavior including the

52
group velocity dispersion (GVD), soliton mode locking, nonlinear Schrodinger equation
and self-phase modulation (SPM) are discussed and elaborated thoroughly.
2.3.3.1 Broad bandwidth
Broad spectral bandwidth is an essential property for short laser pulses. Since
the laser was invented, high spectral purity and extremely narrow spectral linewidths
(achieved simultaneously with high brightness and directionality) are generally
considered and taught as the hallmarks of laser technology, being the properties that
enable lasers to do things that cannot be done with more conventional light sources.
However, applications exist in which the broad spectral bandwidth of short laser pulses
is considered to be a valuable asset from the other aspects.
Not many pulsed lasers applications rely strictly on bandwidth. Indeed, scientists
(especially spectroscopists) very often express a desire for a laser that could violate the
uncertainty principle i.e. a laser that could generate laser pulses while somehow
simultaneously retaining the very narrow spectral bandwidth that make lasers so useful
for spectroscopic investigation. There have been demonstrations of the use of the broad
bandwidth of laser pulses for optical communication. For example, laser pulses may
well provide an economical solution as transmitters for broadband WDM optical access
systems [30,31].
A need therefore exists for a broad spectral bandwidth, as opposed to the usual
narrowband output of conventional lasers. Conventional broadband sources such as
light bulbs or other similar light source have insufficiently low brightness, whereas

53
broadband ultrafast lasers have higher brightness by many orders of magnitude. The
brightness is absolutely critical to applications that require tight focusing or high spatial
resolution alongside good signal-to-noise (SNR) ratio so that data or image acquisition
times remain reasonable.
2.3.3.2 High pulse repetition rate
The pulse repetition rate for a normal pulse train can be described as the number
of pulses produced in a second, or the inverse of pulse spacing in the time domain. The
most obvious property of mode locked pulses is high repetition rate. Fundamental pulse
repetition rate normally ranges from 10 to 100 MHz for a typical mode locked fiber
laser, though low repetition rate of less than 10 MHz as well as extremely high
repetition rate of more than 100 MHz are achievable depending on the mode-locking
technique. As pulse energy is inversely proportional to pulse repetition rate, the
corresponding pulse energy would be high for very low pulse repetition rate such as a
few MHz.
Theoretically, the fundamental pulse repetition rate for a passive mode locking in
a ring fiber laser can be estimated from equation 2.23.
f = 𝑐
𝑛𝐿
where f is the pulse repetition rate in Hz, c is the speed of light (3×10⁸ ms-1), n is the
refractive index of the medium, which is about 1.46 for silica-based fiber optics and L is
the total cavity length. From this equation, it can be inferred that the cavity length
2.23
54
determines the pulse repetition rate of a passive mode locking, and thus it can be
predicted that shorter cavity length will result in higher repetition rate and vice-versa.
2.3.3.3 Short pulse duration
Pulse duration is defined as the full width at half-maximum (FWHM) of the
optical power against time. For pulses in soliton regime, a duration parameter τ is
normally used, which is roughly determined by the FWHM duration divided by 1.76.
The temporal profile of soliton pulses is then estimated by multiplying a constant
with sech2 (t/τ) [32].
In mode-locking, very short output pulse duration is produced. For passively
mode locked fiber laser, the pulse duration is usually in the range of several
femtoseconds to hundreds of femtoseconds, but does not exceed a few tens of
picoseconds. Short pulse duration is an important criterion of mode-locked pulses,
which is critical for applications in time-resolving fast process, ultrafast optics research
and fast optical data transmission with high data rate.
Pulse durations in nanoseconds and microseconds regimes could maintain value
while propagating over long fiber distance, although ultrashort pulse duration can easily
experience changes due to various factors. For instance, an optical filter utilized in the
mode locking system will have the resulting spectral bandwidth restricted by the
bandwidth of the filter, which tends to become narrower than when no filter is in place
and thus leads to a temporal broadening effect or increasing of the pulse duration.
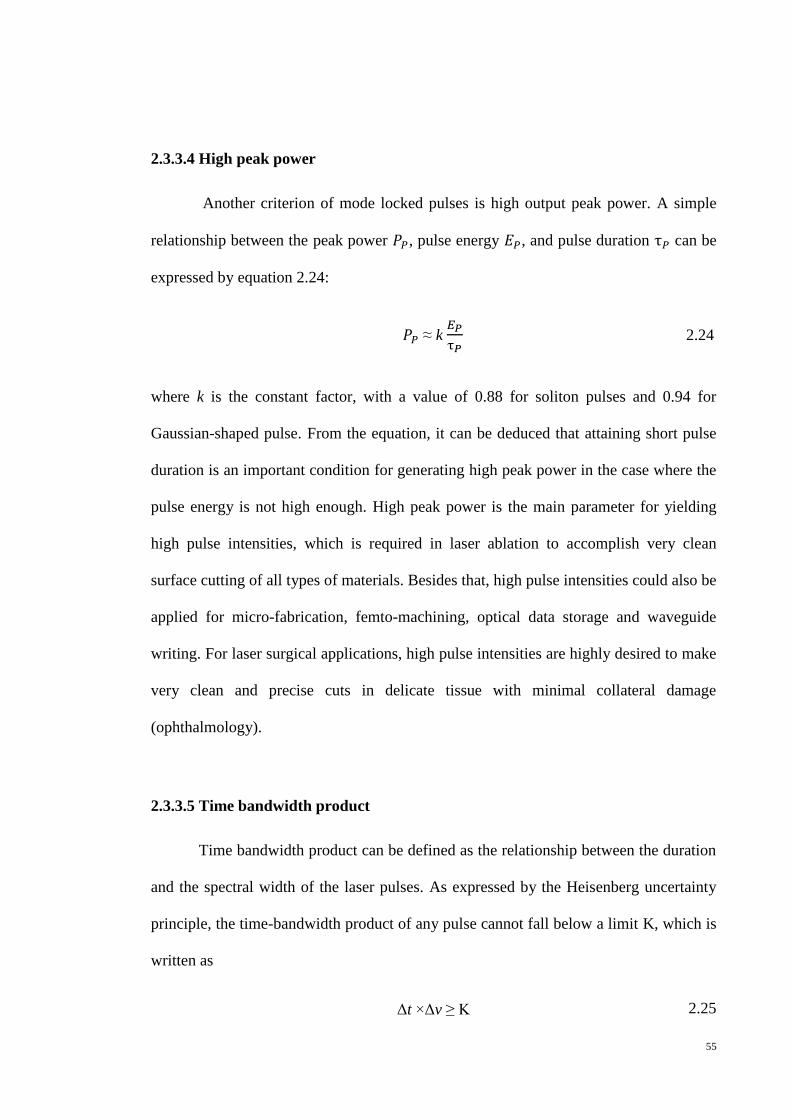
55
2.3.3.4 High peak power
Another criterion of mode locked pulses is high output peak power. A simple
relationship between the peak power 𝑃𝑃, pulse energy 𝐸𝑃, and pulse duration τ𝑃 can be
expressed by equation 2.24:
𝑃𝑃 ≈ k 𝐸𝑃
τ𝑃 2.24
where k is the constant factor, with a value of 0.88 for soliton pulses and 0.94 for
Gaussian-shaped pulse. From the equation, it can be deduced that attaining short pulse
duration is an important condition for generating high peak power in the case where the
pulse energy is not high enough. High peak power is the main parameter for yielding
high pulse intensities, which is required in laser ablation to accomplish very clean
surface cutting of all types of materials. Besides that, high pulse intensities could also be
applied for micro-fabrication, femto-machining, optical data storage and waveguide
writing. For laser surgical applications, high pulse intensities are highly desired to make
very clean and precise cuts in delicate tissue with minimal collateral damage
(ophthalmology).
2.3.3.5 Time bandwidth product
Time bandwidth product can be defined as the relationship between the duration
and the spectral width of the laser pulses. As expressed by the Heisenberg uncertainty
principle, the time-bandwidth product of any pulse cannot fall below a limit K, which is
written as
Δt ×Δv ≥ K 2.25
56
where Δt is the temporal width of the pulse in seconds and Δv is the is the spectral width
of the pulse in hertz (frequency domain), both measured at full width at half-maximum
(FWHM), since half-maximum quantities are experimentally easier to measure. K is a
number that depends on the details of the pulse shape, as summarized in Table 2.2. By
taking the spectral width in the wavelength domain, the time bandwidth product can be
expressed as
∆𝑡 ×∆𝜆𝑐
(𝜆0 )2 ≥ K
where Δλ is the spectral bandwidth at FWHM, c is the speed of light and λ0 is the central
wavelength of the output spectrum. From both equations 2.25 and 2.26, the minimum
pulse duration achievable for a given spectral width can also be estimated. Attaining the
equality condition of the equation via substituting it with an experimental value means
that a Fourier-transform-limited pulse or simply a transform-limited pulse has been
achieved. In general, a broad spectral bandwidth of the mode locked output spectrum is
necessary to produce ultrashort pulses. The time duration of femtosecond pulses is
usually measured by using an auto-correlator, with the auto-correlation function
depends on the assumed shape of the pulse. The pulse shape can be represented
intuitively by a bell-shaped function, which consists of Gaussian, secant hyperbolic, and
Lorentz pulse shape, depending on the mode locked characteristic, including the output
spectrum and the total cavity dispersion.
2.26

57
Table 2.2: Different types of pulse shapes, the constant K for the transform limited
pulse and the conversion factors for determining the pulse duration (at FHWM).
For a stretched pulse laser with a net zero cavity dispersion or close to zero
cavity dispersion, the pulse shape is fitted with the Gaussian shape. A soliton mode
locked laser with a total negative cavity dispersion (also known as anomalous
dispersion) will have the pulse shape fitted with the sech2 shape. The dispersion of the
fiber as well as the total cavity dispersion is explained and discussed in the next section.
2.3.3.6 Energy fluctuations and timing jitter
In mode locking, the energy fluctuations and timing jitter are two important
parameters used for evaluating the quality and stability of the generated pulses. The
energy fluctuations, which is defined as the change of the output pulse energy over
average output energy, can be estimated by using the following equation [33,34]
Pulse shape
I(t)
K i.e. time-
bandwidth
product Δ𝒗.Δ𝒕
∆𝝉
∆𝒕
Gaussian
exp (−4𝑙𝑛2𝑡2
∆𝑡2)
0.441
√2
Secant hyperbolic
sech2 (1.76𝑡
∆𝑡)
0.315
1.55
Lorentz
1 (1 + 2𝑡
∆𝑡)⁄
2
0.221
2

58
∆ 𝐸
𝐸= √ ∆ 𝑃 ×
∆ 𝑓
∆ 𝑓𝑅𝑒𝑠
where ∆P is the power ratio between the central spike at f1 and the peak of the noise
band, and ∆f (Hz) is the frequency width of the noise component. Both values of ∆P and
∆f are obtained experimentally through radio frequency spectrum analysis. ∆fRes.(Hz) in
the equation represents the resolution bandwidth of the spectrum analyzer. Timing jitter
value can be estimated by using the following equation in the case of low amplitude
noise [34,35]
∆ 𝑡
𝑇=
1
2 𝜋𝑛[ ∆ 𝑃𝑛 ∆ 𝑓
∆ 𝑓Res. ]
1/2
where T is the cavity period, and n is the harmonic order. A low energy fluctuation and
a low timing jitter indicate good quality and high stability of the generated mode locked
pulses.
2.3.3.7 Group velocity dispersion (GVD)
Signal transmission in any waveguide, including optical fiber, normally will
experience some distortion while propagating over a significant distance [36]. This
unavoidable distortion normally originates from the dispersion occurring in the optical
fiber, and represents an optical phenomenon that causes an optical signal to get
dispersed as it passes through the fiber. Dispersion can be caused by two main factors,
which are the intramodal dispersion and intramodal delay effects. The intramodal
dispersion can be divided into material and waveguide dispersions. Material dispersion
occurs as a result of the refractive index change of the fiber core towards the
2.27
2.28

59
wavelength change. Waveguide dispersion, which is also denoted as chromatic
dispersion, normally takes place in fibers with small effective mode area such as single
mode fibers. Waveguide dispersion occurs because some portion of the optical power is
not confined to the core of the fiber and leaks into the cladding. The pulse travelling in
the core and pulse travelling in the cladding experience different velocities. As a result,
the pulse propagating through the fiber becomes spread out or gets broadened. Such
effects can be quantified by considering the group velocities of the guided modes. The
speed at which the energy in a pulse travels along the fiber is called as the group
velocity, which can be expressed as [36]
𝑉g = 𝑑𝜔
𝑑𝑘′
which is also known as the velocity of the envelope wave. In an optical medium the
velocity depends on the refractive index, which sequentially depends on the frequency
(wavelength) of the wave. The velocity (phase velocity) of a wave is written as
𝜔 𝑘 ⁄ = 𝜈 = 𝑐 𝑛 ⁄
where c is the velocity of the wave in vacuum and n is the refractive index of the
medium. It can be assumed that each spectral component of the signal travels
independently through the fiber and experiences a time delay per unit wavelength. The
propagation time over a distance L for a given group velocity Vg can be defined as
𝜏 = 𝐿 𝑉g⁄
If the spectral width of the pulse is not wide, it may be approximated that the delay
difference per unit wavelength along the propagation path is given by
2.30
2.31
2.29

60
d𝜏 d𝜆⁄
If the wavelengths of spectral components are spread over a wavelength range 𝛿𝜆, the
total delay difference 𝛿𝜏 over a distance L is given by
𝛿𝜏 = d𝜏
d𝜆𝛿𝜆 = −
𝐿
𝑐𝜆
d²𝑛
d𝜆²𝛿𝜆
Thus the spread in arrival times depends on
(d2𝑛 d𝜆2⁄ )
This implies that the pulse will be dispersedly broadened as it travels through the fiber
owing to the different phase velocities of the different component waves that form the
pulse. This occurrence is referred as the Group Velocity Dispersion (GVD), which can
be defined as the propagation of different frequency components at different velocities
through a dispersive medium and resulting in the pulse broadening. This phenomenon
occurs because of the wavelength-dependent index of refraction of the dispersive
material. The GVD parameter, β2 or also known as the GVD coefficient can be written
as [36]
𝛽2 = d𝛽1
d𝜔=
𝜆3
2𝜋𝑐02
d²𝑛
d𝜆2
This GVD coefficient, β2 is related to another quantity widely used in the
literature known as the dispersion parameter D which can be expressed through
equation 2.36:
𝐷𝜆 = d𝛽1
d𝜆 = −
2𝜋𝑐
𝜆2𝛽2
2.32
2.35
2.36
2.33
2.34

61
From equation 2.36, it can be inferred that Dλ would also increase as λ increases,
and at a wavelength around 1310 nm, which is known as zero dispersion wavelength λD,
Dλ would be diminished. If λ is greater than λD, 𝛽2 would be less than 0 and thus the
fiber is said to possess an anomalous dispersion. On the other hand, if λ is less than λD,
𝛽2 would be greater than 0 and thus the fiber is said to possess a normal dispersion. The
high frequency components (blue shifted) of an optical pulse would move faster than
the low frequency components (red shifted) in the fiber with anomalous dispersion.
Fiber with normal dispersion experiences the high frequency components of the optical
pulse moving slower than the low frequency components. In nonlinear fiber optics, the
anomalous regime is predominantly crucial in generating highly stable solitons.
Table 2.3 summarizes the type of fiber dispersion based on the sign of the
dispersion parameter of the fiber and the corresponding sign of the GVD coefficient.
Table 2.4 summarizes the mode locked operation regime and the corresponding pulse
shape fitting based on the sign of the total GVD of the cavity.
Table 2.3: Type of fiber dispersion based on the sign of the
dispersion parameter of the fiber and the corresponding sign
of the GVD coefficient
Dispersion
parameter,
D [ps/nm.km]
GVD
coefficient,
β2 (ps2/km)
Type of fiber dispersion
Dλ < 0 𝛽2 > 0 Normal dispersion
Dλ > 0 𝛽2 < 0 Anomalous dispersion
Dλ ≈ 0 𝛽2 ≈ 0 Near zero dispersion

62
Table 2.4: Different regimes of the mode locked operation and the corresponding pulse
shape fitting based on the sign of the total GVD of the cavity
Total cavity GVD (ps2) Mode locked operation regime Pulse shape fitting
> 0 = Normal dispersion Dissipative soliton mode locking Secant
hyperbolic/Gaussian
< 0 = Anomalous dispersion Soliton mode locking Secant hyperbolic
≈ 0 = Near zero dispersion Stretched pulse mode locking Gaussian
2.3.3.8 Soliton mode locking
The presence of solitons in nonlinear optical fibres was experimentally proven in
1980, 7 years after their prediction by Hasegawa and Tappert [36]. This subject has
since attracted much interest among the researchers owing to multipurpose applications.
Generally, the formation of optical solitons is facilitated by the interplay of group
velocity dispersion and self-phase modulation [36] in the anomalous dispersion regime.
The nonlinear Schrodinger (NLS) equation also plays an important role as the governing
wave equation in the soliton formation. Solitons generally can be described as highly
stable localized solutions of certain nonlinear partial differential equations describing
physical phenomena [36]. This novel idea was discovered in 1834 by a Scottish Naval
Architect John Scott Russell, who termed it as solitary wave; at the moment when his
boat was suddenly stopped during travel across the Union Canal, he noticed that there
was a lump of water moving away from the barge of the boat with the speed and the
shape of the water remaining unchanged over a distance of 2 miles. Solitons were later
detected experimentally and analytically in various fields of science. In the field of
optics, the term soliton implies a condition where the light beam or pulse maintains its

63
velocity and shape upon propagating through a nonlinear optical medium. Even though
the dispersion in the medium leads to pulse spreading or broadening, the pulse will then
be compressed again due to the compensation process induced by the nonlinear
dependence of the refractive index on the amplitude. There are many significant
applications of solitons in nonlinear optical fibers, including optical switching, optical
computing and also communication systems. A distinct feature of the output spectrum
of the soliton mode-locked fiber laser is the existence of Kelly sidebands structure,
which is specifically formed in the case of a short soliton period. The next section
elaborates on soliton formation and important criteria of soliton mode locked laser.
2.3.3.8.1 Soliton formation
If a pulse propagates through a medium with group delay dispersion (GDD),
also known as second-order dispersion, and also a Kerr nonlinearity, the two effects can
interact in complicated ways. A special case is that the intensity has a sech2 temporal
profile, which is expressed as [30]
P(t) = Pp sech2 (𝑡
𝜏𝑠) =
𝑃𝑝
cosh2
( 𝑡𝜏𝑠)
with the peak power Pp and the FWHM pulse duration 𝜏FWHM ≈ 1.76 𝜏S. If such pulse is
unchirped and fulfills the condition as expressed in equation 2.38 [30]:
𝜏S = 2|𝐺𝐷𝐷|
|𝛾SPM|𝐸𝑃
where GDD and 𝛾SPM have opposite signs and are calculated for the same propagation
distance, and
2.37
2.38

64
Ep ≈ 1.13 Pp 𝜏FWHM
is the pulse energy [30], then we have a so-called fundamental soliton. Such a pulse
propagates in a medium with constant temporal and spectral shape and acquires only an
overall nonlinear phase shift. Higher order solitons, where the peak power is higher by a
factor that is the square of an integral number, do not preserve their temporal and
spectral shape but evolve in such a way that the original shape is restored after a certain
propagation distance, the so-called soliton period in the case of a second-order soliton.
Solitons are remarkably stable against various kinds of distortions. In particular,
stable soliton-like pulses can be formed in a laser cavity even through dispersion and
Kerr nonlinearity occur in discrete amounts and the pulse energy varies due to
amplification in the gain medium and loss in other elements. As long as the soliton
period amounts to many (at least about five to ten) cavity round trips, the soliton simply
“sees” the average GDD and Kerr nonlinearity, and this “average soliton” behaves in a
same way as in a homogeneous medium. The soliton period in terms of the number of
cavity round trip is expressed as [30]
NS = (𝜋𝜏𝑆2) / 2|GDD| ≈ 𝜏FWHM
2 / 2|GDD|
where GDD is calculated for one cavity round trip. NS is typically quite large in lasers
with pulse durations of >100 fs, so the average soliton is a good approximation. Once
NS becomes less than about 10, the soliton is significantly disturbed by the changes of
dispersion and nonlinearity during a round trip, and this may lead to pulse break-up. In
cases with very large values of NS it can be beneficial to decrease NS by increasing both
|GDD| and 𝛾SPM because stronger soliton shaping can stabilize the pulse shape and
spectrum and make the pulse less dependent on other influences.
2.40
2.39

65
2.3.3.8.2 Soliton area theorem
In the soliton area theorem [37,38], the averaged cavity soliton can be expressed
as
𝐴0𝜏 = √ 2|𝐷|
𝛿 with 𝐷 ≡
1
2𝛽2,ave 𝐿, 𝛿 = 𝛾ave𝐿
where A0 is the peak amplitude, τ is the pulse duration at 1/e, β2,ave is the average cavity
dispersion, L is the cavity length, and γave is the average nonlinear parameter. By
squaring both sides, equation 2.41 can be expressed as the well-known fundamental
soliton condition as follows:
𝑃𝜏2 = 𝑃 (𝑇FWHM
1.7627)
2≈
𝑎
1.76272 𝐸𝑇FWHM =
|𝛽2,ave|
𝛾ave
where P is the peak power, α is the peak-power conversion factor (0.88 for sech2), and
TFWHM is the pulse duration at full-width at half maximum. Decreasing the average
cavity dispersion of the laser therefore causes the average soliton energy to be lowered
for transform-limited pulses with fixed optical spectrum bandwidth. Although this
concept was previously applied in passive harmonic mode locking to obtain higher
repetition rates [37,39,40], there has been no systematic investigation to optimize the
laser cavity condition.
2.3.3.8.3 Soliton length
The soliton length, which is defined as the propagation distance of the
accumulated nonlinear phase delay can be expressed as [35,41]
2.41
2.42
66
𝑍sol. = 𝜋
2
𝜏02
|𝛽2|
where τ0 (s) is the pulse duration and β2 (s2/m) is the group velocity dispersion (GVD)
parameter. In the case where the soliton length is much longer than the cavity length,
the typical Kelly’s sidebands would normally be absent, even though the mode locked
laser is operating in negative cavity dispersion with soliton-like pulses. Normally, the
minimum soliton length that can be sustained is estimated from the following equation
Z0 > L/2,
where L is the cavity length. In the case of very short pulse duration, Z0 turns out to be
too short. A drawback of having such short L is the difficulty in compensating the
dispersion and nonlinearity in the cavity [41].
2.3.3.9 Nonlinear Schrodinger equation
As one of the main factors that governs the soliton mode locked laser operation,
it is important to study and understand the nonlinear Schrodinger equation. This
equation, derived from Maxwell’s equations, is referred to the wave propagation of
optical pulses through an optical fiber and can be described by [36]
𝑖𝜕𝐴
𝜕𝑧−
𝛽2
2
𝜕2𝐴
𝜕𝑇2+ 𝛾 |𝐴|2𝐴 = 0
The equation provides an expression for the propagation of an optical pulse in the z-
direction through an optical fiber, where A (z; T) is the slowly varying amplitude of the
pulse envelope, whereas the second and the third term represents dispersion and the
nonlinearity of the fiber respectively. As has been stated earlier, β2 is the GVD
2.43
2.44
2.45

67
parameter and the parameter γ is a measure of the third order nonlinearity of the
medium. GVD and SPM are exhibited through this equation, whereby both dispersive
and nonlinear effects have an impact on the shape and spectrum. Other effects such as
absorption, higher order nonlinearities, higher order dispersion, SRS, and SBS are not
taken into account. Aside from being a fundamental equation in soliton theory, the
nonlinear Schrodinger equation is also important in many other branches of science.
2.3.3.10 Fiber nonlinearities
Non-linear optics was discovered after the invention of lasers in the 1960s and
constitutes another important branch of optics. In principle, the non-linear effect arises
from the harmonic motion of bounded electron under the influence of applied
electromagnetic field [42]. Subsequently, the polarization P from the electric dipoles is
not linear with respect to the electric field E. A medium is said to be nonlinear when the
polarizability of a medium depends on higher powers of the electric field strength.
Consequently, the polarizability of a nonlinear medium can be written as [36]
𝑃 = 𝜖0 (𝜒(1) 𝐸 + 𝜒(2)𝐸2 + 𝜒(3)𝐸3 + … . . )
where 𝜖0 is the vacuum permittivity and 𝜒(j) (j = 1,2,3,…) is the jth order susceptibility
tensor. The linear susceptibility 𝜒(1) contains the dominant contribution to P. The second
order susceptibility 𝜒(2) is responsible for second harmonic and sum frequency
generation. Nevertheless, this second order susceptibility 𝜒(2) is absence in the medium
with an inversion symmetry at the molecular level, including silica glass since SiO2 is a
symmetric molecule. Thus, second order nonlinear effects are not usually exhibited by
optical fibers. The third order susceptibility 𝜒(3), on the other hand is responsible for
2.46
68
nonlinear refraction, four-wave mixing and third harmonic generation. For a nonlinear
medium, the relation between the susceptibility and the refractive index can be
expressed as:
𝑛 = (1 + 𝜒(1) + 𝜒(2)𝐸 + 𝜒(3)𝐸2 + … … )1
2
Whereas for an optical fiber, the relation between the susceptibility and the refractive
index takes the form
𝑛 = (1 + 𝜒(1) + 𝜒(3)𝐸2)12 = 𝑛0 +
1
2 𝜒(3)𝐸2 = 𝑛0 + 𝑛2𝐼
From this equation, it can be inferred that the refractive index of the medium is
influenced by the intensity of light propagating through it.
In general, the non-linearity in silica-based fiber can be categorized into two
groups, namely nonlinear refraction and stimulated scattering. Non-linear refraction
refers to the intensity dependence of the refractive index that results in a number of
interesting non-linear effects, such as Self Phase Modulation (SPM) and Cross Phase
Modulation (XPM). On the other hand, as for the second category of the nonlinear
effects, the stimulated scattering occurs when there is an energy transfer from the
optical filed to the SMF. Examples of the stimulated scaterring effects are Stimulated
Raman Scattering (SRS) and Stimulated Brillouin Scattering (SBS), which are created
as a result of the vibrational excitation modes of silica.
The nonlinear processes occurring in the fiber, including SPM, SRS and SBS,
limits the transmission length of an optical pulse through the optical fiber. In
communication system, these nonlinear processes are the limiting aspect of the
maximum information transfer rate achievable. These nonlinear processes are useful in
2.48
2.47
69
other applications e.g. SPM and SRS can be used for pulse compression and can act as
the source of new tunable radiations.
2.3.3.11 Self phase modulation (SPM)
SPM is a nonlinear effect that induces an additional phase shift in the optical
pulse propagating in an optical fiber by means of intensity dependent refractive index.
In contrast to GVD, the effect of SPM is spectral compression. The magnitude of the
phase shift can be estimated from the following equation:
𝜑 = 2𝜋
𝜆𝑛𝐿 =
2𝜋
𝜆(𝑛0 + 𝑛2𝐼)𝐿
where L is the distance traveled by the optical pulse through an optical fiber, (2𝜋/λ) 𝑛2I
L is the intensity dependent nonlinear shift induced by the SPM. Since I is time
dependent, 𝜑 is also time dependent. Consequently, an additional frequency term 𝜔 =
d𝜑/dt is introduced into the dynamics of the optical pulse, which causes a modification
in the frequency spectrum. This frequency modification is known as SPM. Through the
SPM effect, a pulse can be either broadened or compressed under certain conditions. As
such, if the initial frequency of the pulse is 𝜔0, the instantaneous frequency of the pulse
due to the SPM effect will become 𝜔′ = 𝜔0 + d𝜑/dt = 𝜔0 − (2𝜋/λ) z𝑛2 (d𝐼/dt), by
assuming that the pulse is travelling in the positive z-direction through a distance z. At
the leading edge of the pulse (d𝐼/dt) > 0 while at the trailing edge of the pulse (d𝐼/dt) <
0. The pulse is classed as chirped when the frequency differs across the pulse. In
general, GVD and SPM are two independent phenomena occurring in nonlinear optical
fibers that would independently distort the shape of the optical pulse. Nevertheless,
under appropriate conditions, it is found that these two phenomena can become rivals to
2.49

70
each other such that the effect due to one can be canceled out by the effect due to the
other. This will result in a situation where the optical pulse travelling through a
nonlinear optical medium does not experience any distortion. This type of optical pulse
is called as an optical soliton.
2.3.4 Q-switching instabilities (Q-switched mode locking)
Q-switching instabilities, also called Q-switched mode locking, is an undesirable
phenomenon relating to the vigorous instability caused by the undamped relaxation
oscillation whereby the intracavity pulse energy are oscillating between extreme values
or undergoing intensely large fluctuations. This phenomenon can only occur in a
passively mode-locked laser, which may originate from the reduced damping process in
the relaxation oscillations of a saturable absorber.
As a consequence, the laser will produce bunches of mode locked pulse, which
can be either in the form of stable or unstable Q-switching envelopes. Gain saturation
might be necessary in order to stabilize the pulse energy. Unlike CW mode locking, the
Q-switched mode locking usually exhibits irregular pulses energy, duration and shape.
Figure 2.5 shows some examples of pulse train with Q-switching instabilities captured
from the oscilloscope.
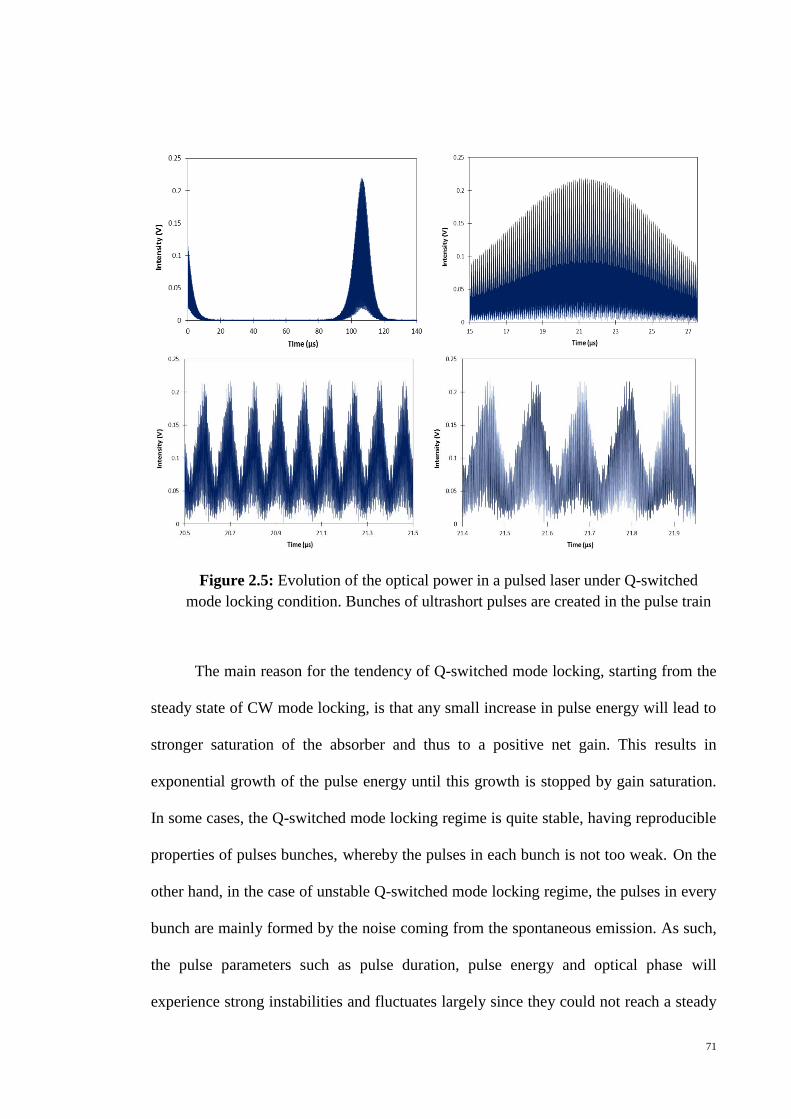
71
Figure 2.5: Evolution of the optical power in a pulsed laser under Q-switched
mode locking condition. Bunches of ultrashort pulses are created in the pulse train
The main reason for the tendency of Q-switched mode locking, starting from the
steady state of CW mode locking, is that any small increase in pulse energy will lead to
stronger saturation of the absorber and thus to a positive net gain. This results in
exponential growth of the pulse energy until this growth is stopped by gain saturation.
In some cases, the Q-switched mode locking regime is quite stable, having reproducible
properties of pulses bunches, whereby the pulses in each bunch is not too weak. On the
other hand, in the case of unstable Q-switched mode locking regime, the pulses in every
bunch are mainly formed by the noise coming from the spontaneous emission. As such,
the pulse parameters such as pulse duration, pulse energy and optical phase will
experience strong instabilities and fluctuates largely since they could not reach a steady

72
state, with the end result as a noisy operation. Q-switched mode locking is thus
generally unnecessary in most applications.
The transition between the regimes of CW mode locking and Q-switched mode
locking has been investigated in detail in Ref. [43, 44] for slow saturable absorbers. If
the absorber is fully saturated and fully recovered between two cavity round-trips, a
condition for stable CW mode locking without Q-switched mode locking behavior
above a certain Q-switched mode locking threshold can be developed. The simple
condition for the stable CW mode locking can be expressed as [43]:
𝐸p2 > 𝐸sat,g 𝐸sat,a ∆𝑅
where Ep is the intracavity (not output) pulse energy and Esat,g, Esat,a are the gain medium
and saturable absorber saturation energies respectively, ΔR is the modulation depth of
the absorber. This can be rewritten using the saturation parameter S = Ep /Esat,a to obtain
𝐸p > 𝐸sat,g
∆𝑅
𝑆
This explains why passively mode locked lasers often exhibit Q-switched mode
locking when weakly pumped, and stable CW mode locking for higher pump powers.
Mode locking is normally fairly stable even for operation only slightly above the Q-
switched mode-locking threshold, so there is no need for operation far above this
threshold. The Q-switched mode locking threshold is high when Esat,g is large (laser
medium with small laser cross section or large mode area in the gain medium, which is,
for instance, enforced by poor pump beam quality), and also when Ep cannot be made
large (limited power of pump source, high repetition rate or large intracavity losses), or
when a high value of ∆R is needed for some reason [30]. In this regards, Q-switched
2.50
2.51

73
mode locking can be avoided or suppressed by several prescriptions such as by using a
gain medium with small saturation fluence or with small mode areas. Besides that, Q-
switched mode locking can also be suppressed by minimizing the cavity losses so that
high intracavity pulse energy can be achieved, or by using a long resonator with low
losses to obtain high intracavity power and low repetition rate. In addition, a modulation
depth ∆R of the saturable absorber that is larger than necessary should not be used in
order to avoid the Q-switched mode locking. If the pulse laser is operating under an
extreme parameter regime, such as very high repetition rate or output power,
suppressing the Q-switching instabilities may require compromises such as getting
poorer laser efficiency, wider pulse durations, or a high thermal load on the SA.
In soliton mode locked lasers, it is interesting to note that the minimum
intracavity pulse energy for a stable CW mode locking is lower by typically a factor of
the order of 4 [43]. The reason for this is that a soliton acquires additional bandwidth if
its energy increases for some reason. This reduces the effective gain, so that a negative
feedback mechanism is attained and tends to stabilize the pulse energy. Thus the use of
soliton formation in a laser can help not only to generate shorter pulses but also to avoid
Q-switched mode locking [30].
74
References
1. Mahad, F. D., & Abu, S. (2009). EDFA gain optimization for WDM
System. Elektrika, 11(1), 34-37.
2. Becker, P. C., Olsson, N. A., & Simpson, J. R. (1999). Erbium-Doped Fiber
Amplifiers: Fundamentals and Technology. Elsevier Science.
3. Emsley, J. (2011). Nature's Building Blocks: An AZ Guide to the Elements.
Oxford University Press.
4. Becker, P. C., Olsson, N. A., & Simpson, J. R. (1999). Erbium-Doped Fiber
Amplifiers: Fundamentals and Technology. Elsevier Science.
5. Desurvire, E. (1994). Erbium-Doped Fiber Amplifiers. Canada: John Wiley and
Sons, Inc. 770.
6. Siegman, A.E. (1986). Lasers. University Science Books.
7. Schawlow, A. L., & Townes, C. H. (1958). Infrared and optical masers. Physical
Review, 112(6), 1940-1949.
8. Lax, M. (1967). Classical noise. V. Noise in self-sustained oscillators. Physical
Review, 160(2), 290-307. 9. Paschotta, R. Derivation of the Schawlow–Townes linewidth. RP Photonics.
Retrieved from www.rp-photonics.com/Schawlow-Townes_linewidth.pdf 10. Paschotta, R., Telle, H. R., & Keller, U. (2007). Noise of solid state lasers. In A.
Sennaroglu (Eds.), Solid-State Lasers and Applications (pp. 473–510). Boca
Raton, FL: CRC Press. 11. Svelto, O. (1998). Principles of Lasers (4th ed.). New York: Plenum Press. 12. Siegman, A.E. (1986). Lasers (1st ed.). University Science Books.

75
13. Garnov, S. V., Konov, V. I., Kononenko, T., Pashinin, V. P., & Sinyavsky, M. N.
(2004). Microsecond laser material processing at 1.06 µs. Laser Physics, 14(6),
910-915. 14. Siniaeva, M. L., Siniavsky, M. N., Pashinin, V. P., Mamedov, A. A., Konov, V. I.,
& Kononenko, V. V. (2009). Laser ablation of dental materials using a
microsecond Nd: YAG laser. Laser Physics, 19(5), 1056-1060. 15. Shangguan, H. Q., Casperson, L. W., Shearin, A., Gregory, K. W., & Prahl, S. A.
(1996). Drug delivery with microsecond laser pulses into gelatin. Applied Optics,
35(19), 3347-3357. 16. Nikolaev, S. V., Pozhar, V. V., & Dzyubenko, M. I. (2006). Generation of
microsecond laser pulses in polyurethane matrices doped with dyes. Quantum
Electronics, 36(8), 758-762. 17. Shangguan, H. Q., Casperson, L. W., & Prahl, S. A. (1996). Microsecond laser
ablation of thrombus and gelatin under clear liquids: Contact versus noncontact.
Selected Topics in Quantum Electronics, IEEE Journal of, 2(4), 818-825. 18. Kracht, D., & Brinkmann, R. (2004). Green Q-switched microsecond laser pulses
by overcoupled intracavity second harmonic generation. Optics
Communications, 231(1), 319-324. 19. Watanabe, S., Anderson, R. R., Brorson, S., Dalickas, G., Fujimoto, J. G., &
Flotte, T. J. (1991). Comparative studies of femtosecond to microsecond laser
pulses on selective pigmented cell injury in skin. Photochemistry and
Photobiology, 53(6), 757-762.

76
20. Popa, D., Sun, Z., Hasan, T., Torrisi, F., Wang, F., & Ferrari, A. C. (2011).
Graphene Q-switched, tunable fiber laser. Applied Physics Letters, 98(7), 073106-
073106. 21. Williams, R. J., Jovanovic, N., Marshall, G. D., & Withford, M. J. (2010). All-
optical, actively Q-switched fiber laser. Optics Express, 18(8), 7714-7723. 22. Sun, Q., Mao, Q. H., Chen, X. D., Feng, S. J., Liu, W. Q., & Lit, J. W. Y. (2010).
Influences of ASE on the performances of Q-switched ytterbium-doped fiber
lasers. Laser Physics, 20(6), 1438-1448. 23. Villegas, I. L., Cuadrado-Laborde, C., Díez, A., Cruz, J. L., Martínez-Gámez, M.
A., & Andrés, M. V. (2011). Yb-doped strictly all-fiber laser actively Q-switched
by intermodal acousto-optic modulation. Laser Physics, 21(9), 1650-1655. 24. Kimmelma, O. (2009). Passively Q-switched Nd:YAG lasers and their use in UV
light generation (Doctoral dissertation, Faculty of Electronics, Communications
and Automation, Helsinki University of Technology). Retrieved from
http://lib.tkk.fi/Diss/2009/isbn9789522480743/ 25. Kalisky, Y. (2004). Cr4+-doped crystals: their use as lasers and passive Q-
switches. Progress in Quantum Electronics, 28(5), 249-303. 26. Sun, Z., Hasan, T., Torrisi, F., Popa, D., Privitera, G., Wang, F., Bonaccorso, F.,
Basko, D. M., & Ferrari, A. C. (2010). Graphene mode-locked ultrafast laser. ACS
Nano, 4(2), 803-810. 27. Wang, F., Rozhin, A. G., Scardaci, V., Sun, Z., Hennrich, F., White, I. H., Milne,
W. I., & Ferrari, A. C. (2008). Wideband-tuneable, nanotube mode-locked, fibre
laser. Nature Nanotechnology, 3(12), 738-742.
77
28. Keller, U. (2003). Recent developments in compact ultrafast lasers. Nature,
424(6950), 831-838.
29. Okhotnikov, O., Grudinin, A., & Pessa, M. (2004). Ultra-fast fibre laser systems
based on SESAM technology: new horizons and applications. New Journal of
Physics, 6(177), 1-22.
30. Fermann, M. E., Galvanauskas, A., & Sucha, G. (Eds.). (2002). Ultrafast Lasers:
Technology and Applications. New York: Marcel Dekker, Inc, CRC Press.
31. Collings, B. C., Mitchell, M. L., Boivin, L., & Knox, W. H. (2000). A 1021
channel WDM system. Optics and Photonics News, 11(3), 31-35.
32. Paschotta, R. Pulse Duration. RP Photonics. Retrieved from http://www.rp-
photonics.com/pulse_duration.html 33. Sun, Z., Hasan, T., Wang, F., Rozhin, A. G., White, I. H., & Ferrari, A. C. (2010).
Ultrafast stretched-pulse fiber laser mode-locked by carbon nanotubes. Nano
Research, 3(6), 404-411. 34. Von der Linde, D. (1986). Characterization of the noise in continuously operating
mode-locked lasers. Applied Physics B, 39(4), 201-217. 35. Zhang, M., Kelleher, E. J. R., Torrisi, F., Sun, Z., Hasan, T., Popa, D., Wang, F.,
Ferrari, A. C., Popov, S. V., & Taylor, J. R. (2012). Tm-doped fiber laser mode-
locked by graphene-polymer composite. Optics Express, 20(22), 25077-25084. 36. Kuriakose, V. C., & Porsezian, K. (2010). Elements of optical solitons: An
overview. Resonance, 15(7), 643-666. 37. Jun, C. S., Choi, S. Y., Rotermund, F., Kim, B. Y., & Yeom, D. I. (2012). Toward
higher-order passive harmonic mode-locking of a soliton fiber laser. Optics
Letters, 37(11), 1862-1864.
78
38. Nelson, L. E., Jones, D. J., Tamura, K., Haus, H. A., & Ippen, E. P. (1997).
Ultrashort-pulse fiber ring lasers. Applied Physics B: Lasers and Optics, 65(2),
277-294. 39. Zhou, S., Ouzounov, D. G., & Wise, F. W. (2006). Passive harmonic mode-
locking of a soliton Yb fiber laser at repetition rates to 1.5 GHz. Optics Letters,
31(8), 1041-1043. 40. Ortaç, B., Hideur, A., Martel, G., & Brunel, M. (2005). 2-GHz passive
harmonically mode-locked Yb-doped double-clad fiber laser. Applied Physics B,
81(4), 507-509. 41. Popa, D., Sun, Z., Hasan, T., Cho, W. B., Wang, F., Torrisi, F., & Ferrari, A. C.
(2012). 74-fs nanotube-mode-locked fiber laser. Applied Physics Letters, 101(15),
153107-153107. 42. Sauter, E. G. (1996). Nonlinear optics (Vol. 44). Wiley Series in Microwave &
Optical Engineering. 43. Hönninger, C., Paschotta, R., Morier-Genoud, F., Moser, M., & Keller, U. (1999).
Q-switching stability limits of continuous-wave passive mode locking. JOSA
B, 16(1), 46-56. 44. Kartner, F. X., & Keller, U. (1995). Stabilization of soliton-like pulses with a slow
saturable absorber. Optics Letters, 20(1), 16-18.

79
CHAPTER 3
GRAPHENE DEPOSITION AND CHARACTERIZATION
3.1 Graphene: the wondrous material
Graphene has been considered as an extraordinary and wondrous material by
virtue of both uniquely linear and nonlinear optical properties, as well as outstanding
thermal, mechanical and electronic properties. In addition to this, graphene also has
been discovered to have an excellent saturable absorption property with ultrafast
recovery time [1, 2]. Graphene is unlike any other material on earth in that it has no
band gap energy, with the consequence that electrons are able to migrate from valence
band to unoccupied conduction band freely. This is attributed to the cone-shaped
electronic band structure in graphene, as shown in Figure 3.1, whereby the conduction
and the valence bands are represented by two cones, known as “Dirac cones”.
Figure 3.1: Fermi surface showing the Dirac Cones
that meet at the Dirac point, indicating zero-gap
nature of graphene [3]

80
Dirac cones imply constant density of states, constant group velocity similar to
photon or neutrino behavior and most importantly symmetry of electrons and holes. The
upper Dirac cone corresponds to the conduction band whereas the lower Dirac cone
corresponds to the valence bands. Both peaks of the cones intersect with each other at a
same point, or in other words, the cones’ points cross linearly at a point, known as
“Dirac point”, which is also called the K point. The Dirac point lies in the vicinity of
Brillouin Zone edge, which is responsible for determining the optical properties of
graphene [3]. Brillouin zone refers to the cell of reciprocal lattice of wave vectors K set
that yields periodic plane waves. At particular symmetry points in a Brillouin Zone
(Dirac point), graphene valence and conduction bands have linear dispersion. It is at this
point that the top of the valence band encounters the bottom of the conduction band,
whereupon the value of Fermi energy EF is equal to zero. Dirac points in general signify
the positions in the 2D honeycomb lattice at which energy bands from adjacent atoms
link together, and π electrons in bands can spread across the lattice via these intersection
points. In graphene these electrons travel so fast that their effective mass is considered
as zero and they obey the Dirac massless equation. In this regards, the band structure of
graphene is recognized as linear Dirac band structure, which means that Dirac electrons
in graphene are linearly dispersed. The equation for the dispersion of electrons (holes) at
the K point can be expressed as [3]
E(k) = ± ћ𝑣𝐹|𝑘| 3.1
where k is the is the wavevector with (kx,ky) components and 𝑣𝐹 = √3𝛾0𝑎/2ћ ≈ 106 ms-1
is Fermi velocity in graphene. Thus, it can be deduced that near the K point, the
dispersion of electrons in graphene is a linear function of the wavevector k. This linear
dispersion of the Dirac electrons establishes that there will always be an electron–hole

81
pair in resonance for any excitation of the electron [4]. In regards to this linear function
as well as the unique cone shape band structure of graphene, the interband optical
transitions in graphene can occur at all photon frequencies [5]. Thus the linear
dispersion of Dirac electrons and zero bandgap energy in graphene are responsible for
providing a wide operational wavelength range of saturable absorption in graphene as
well as an optical response in a broadband region. In Ref. [6], a continuously resonate
optical response of graphene has been reported in a broadband spectral region, which
ranges from the visible to the near infrared (>2500 nm). This is attributed to the linear
dispersion between energy and momentum of the Dirac electrons in graphene near the
Dirac point [7].
The dispersion of the conduction and valence bands in the tight-binding
approximation can be described by equation 3.2 [3, 5]
𝐸(𝑘𝑥 𝑘𝑦) = ± 𝛾0√1 + 4 cos (√3
2𝑘𝑥𝑎) cos (
1
2𝑘𝑥𝑎) + 4 cos ² (
1
2𝑘𝑦𝑎)
where k = (kx,ky) is the 2D electron wavevector measured with respect to the Γ-point
(the centre of the Brillouin Zone), “+” and “-” indicate holes and electrons respectively,
γ0 ≈ 3 eV is the nearest-neighbor hopping energy and a = 2.46 Å is the lattice constant.
In terms of light absorption in graphene, experiments [8] and theory [9] prove
that single layer graphene exhibits wavelength independent linear optical absorption,
with an incident light absorption of πα ≈ 2.3 % per graphene layer for low light
intensity, where α is the fine structure constant which is equal to e2/ ћc = 1/137. This
feature indicates that light absorption of graphene is proportional to its number of layers
[9]. A prediction of the number of graphene layers can be made by examination of the
3.2

82
variation of absorption spectra due to graphene linear optical absorption. The light
absorption of graphene is constant across the wavelength range, provided that there is
no optical absorption by the electrons in the middle of the Brillouin Zone [3].
Another advantageous property of graphene - influenced by the cone-shape of its
band structure - is that it has an outstandingly high optical nonlinearity of third and
higher orders χ(3,…n) [10], which is significant for four-wave mixing [4], generation of
high harmonics [11] and saturable absorption [12]. It has been reported in Ref. [13] that
the effective nonlinear susceptibility |χ(3)| in graphene flakes has a very large value of
10-7 esu, which is experimentally obtained through a four-wave mixing experiment.
Graphene also possesses a facile saturation of absorption, with the saturable
absorption process in graphene being related to the Pauli exclusion principle that states
electrons can be excited only when excited state “space” is available. The Pauli
exclusion principle forbids two electrons to occupy the same state. As a result, the
absorbance of graphene decreases on a time scale of the carrier relaxation. Absorption
saturates when pumping of electrons in the excited state is quicker than the rate at which
they relax. This saturating is known as “Pauli blocking” and results in easily saturable
absorption of light. The schematic of this process is shown in Figure 3.2. In addition,
graphene also exhibits ultrafast carrier dynamics due to the ultrafast carrier-carrier
scattering and carrier-phonon scattering [7]. Reports indicate the relaxation time due to
carrier-carrier scattering in graphene ranges from about 10 to 50 femtoseconds [14–17].

83
Figure 3.2: Schematic of light absorption process in graphene [2]
3.2. Parameters of a saturable absorber
It is important to select a suitable saturable absorber for attaining a desired
output laser operation with specific requirements i.e. desirable properties of a saturable
absorber are determined by the required performance of the output laser. Required
saturable absorber parameters for mode locking are different from those of Q-switching
for example. The saturable absorber parameters additionally have a large influence in
determining the output performance of mode locking or Q-switching. The fundamental
parameters of saturable absorbers include modulation depth, saturation intensity,
saturation energy, saturation fluence, and non-saturable absorption, which are discussed
Optical interband transition of electron
from valence to conduction band as
indicated by the arrow
An equlibrium electron and hole distribution is
achieved through intraband phonon
scaterring and electron-hole recombination
At high enough excitation intensity, the photogenerated carriers cause the states near the edge of the conduction and valence band to fill,
blocking further absorption

84
in detail in this section. These parameters can be found in the two level saturable
absorber model presented in the following subsection.
3.2.1 Two level saturable absorber model
As has been explained in Chapter 1, saturable absorption is a phenomenon
occurring in a certain material or device where the degree of light absorption depends
on the optical intensity of the incident light, such that it declines with increasing light
intensity. In the case of high incident light intensity, the upper energy levels are
occupied and the light absorption consequently saturates, or in other words, the light
transmittance increases. The excited carrier density and the nonlinear absorption are
directly interrelated to each other. The nonlinear process in graphene can be described
by using a simple two-level saturable absorption model, which can be used to determine
the important parameters of a saturable absorber. The two-level saturable absorption
model is expressed as [18, 19]:
𝛼(𝐼) = 𝛼0
1 + 𝐼 𝐼𝑠𝑎𝑡⁄ + 𝛼𝑛𝑠
where α(I) is the intensity-dependent absorption coefficient, α0 is the linear limit of
saturable absorption (modulation depth), αns is the non-saturable absorption and Isat is
the saturation intensity.
3.2.2 Saturable absorption (Modulation depth)
Saturable absorption, otherwise known as the modulation depth of a saturable
absorber, is usually measured by using power-dependent absorption measurements.
3.3

85
These measurements involve an optical pulse source at a certain wavelength being
transmitted into the saturable absorber, and the maximum possible change in the
induced optical loss is measured as the modulation depth. Modulation depth is thus the
modulation amplitude of the absorption or reflectivity. The modulation depth of a
saturable absorber has a large influence in determining the performance or
characteristics of the passive mode-locked pulses.
In order to obtain a stable mode locking operation, a saturable absorber with
high modulation depth typically in excess of 10% is mostly desirable [20-22]. In
addition, strong pulse shaping can be induced by a saturable absorber with large
modulation depth, and this is essential for mode-locked self-starting and for producing a
short pulse duration. The only drawback that occurs with high modulation depth of
saturable absorber is a tendency towards Q-switching instabilities. In the context of
graphene as saturable absorber, a higher concentration of graphene, at the expense of
increasing the insertion loss, can increase the modulation depth value.
3.2.3 Non-saturable loss
An undesirable portion of the losses is the non-saturable loss, which is unable to
saturate and most likely originates from defects in the saturable absorber. It is therefore
necessary to have low non-saturable losses of the saturable absorber, for both passive
mode locking and Q-switching, in order to maximize the efficiency and output power of
the laser as well as reducing the power losses.
86
3.2.4 Saturation intensity
Saturation intensity can be defined as the optical peak intensity that corresponds
to a 50% reduction of the saturated part of its absorption. Most saturable absorbers are
prone to damage if kept saturated throughout extended periods since they are never
activated in the steady state. It is thus desirable to have a low saturation intensity of the
saturable absorber. Graphene exhibits this property to such an extent it therefore can be
considered an ideal saturable absorber. A simple relation of saturation intensity
multiplied by the mode area yields the saturation power.
3.2.5 Saturation energy
Saturation energy of a saturable absorber refers to a measure of the incident
optical pulse energy needed to reduce the initial value to 1/e (≈ 37%) of its initial value,
representing a significant saturation of an absorber. The saturation parameter of a
saturable absorber is the ratio of the incident pulse energy to the saturation energy of the
saturable absorber. The saturation parameter is one of the most important design
parameters of a passively mode-locked laser, as it determines the extent of saturation by
a single pulse. A pulse experiences a strong saturation if the incident optical energy is
higher than the saturation energy of the saturable absorber. As such, both the mode area
on the saturable absorber in the laser cavity and the saturation energy of the absorber
determines the value of the saturation parameter. The saturation energy per unit area is
called the saturation fluence. For both passive Q-switching and mode locking, a low
saturation fluence of the saturable absorber is necessary to minimize the power losses.
For mode locking, a saturation fluence several times lower than the pulse fluence under
normal operation conditions is necessary. Saturation energy is important for
87
determining the required pulse energy to extort the stored energy maximally from the
gain medium. Output pulse energy can only be slightly higher than the saturation energy
for a Q-switched laser, excluding the case of very high gain. Besides that, the saturation
energy for passive Q-switching in principle has a large influence on the pulse repetition
rate and the pulse energy.
3.2.6 Recovery time
Recovery time can be defined as the decay time of the pulse after its excitation
state. The optimum recovery time of a saturable absorber is different for dissimilar type
of applications. In the case of passive Q-switching for example, the recovery time of the
saturable absorber does not need to be too short but also should not be too long, with the
ideal case to have the recovery time not shorter than the pulse duration. This situation is
not always necessary, and in some cases a recovery time longer than the cavity round-
trip time is acceptable and applicable. Pulse duration in Q-switching mainly depends on
the time required to deplete the gain after the saturable absorber has been saturated [23 -
25].
On the other hand, the case of mode locking has a different requirement whereby
the recovery time of the saturable absorber usually needs to be very short in order to
attain short pulses. However, this also depends on the laser cavity design and the mode
locking mechanism used. Pulse duration shorter than the recovery time of the saturable
absorber is still possible to be achieved based on the laser cavity design [14, 26 - 28], as
the final pulse width is largely determined by the laser cavity design [14]. A suitable
example for this case is the soliton mode locked fiber laser reported in Ref. [28],

88
whereby the saturable absorber used in the cavity only plays the role in stabilizing the
pulse. Furthermore, Ref. [27] reports that the pulse duration still can remain short even
without soliton effects, giving a value about 30 times shorter than the recovery time of
the saturable absorber. It can be deduced that it is not impossible to generate pulse with
shorter duration than the recovery time of the saturable absorber.
There are two general types of saturable absorbers, these being fast and slow
types. A saturable absorber is considered to be fast if the recovery time is well below
the pulse duration. If the recovery time is well above than the pulse duration, the
saturable absorber is said to be a slow saturable absorber. This implies that the same
device can either be a slow absorber or a fast absorber, determined by the pulse that it is
used. However, it cannot be inferred that a fast saturable absorber is more suitable for
passive mode locking, as a slow saturable absorber is reliable for achieving the self-
starting of the mode locked pulses. A saturable absorber with long recovery time (low
saturation intensity) is therefore most effective for fast self-starting mode locking,
although a short recovery time may allow the generation of shorter pulses.
In the following section, different methods carried out in this work for
depositing graphene onto fiber ferrule are demonstrated and discussed. Characterization
of the deposited graphene as well as experimental measurement of its saturable
absorption properties is discussed thoroughly, since the following chapters in this thesis
will be focusing on the applications of the deposited graphene as saturable absorber in
fiber laser system, including for Q-switching, mode locking and single longitudinal
mode operation.

89
3.3 Graphene deposition onto fiber ferrule
Various conventional approaches for depositing graphene onto fiber ferrule have
been introduced in previous reported works, such as by sandwiching a graphene-
polyvinyl alcohol composite film [29] or graphene–polymer nanocomposite thin-film
[1,30,31] between two fiber connectors, by spraying graphene suspension onto the flat
surface of a side-polished fiber for evanescent field interaction [32], by transferring
graphene onto the ferrule using a PMMA foil [33], by optical deposition technique [34-
36] and by coating graphene on a reflective mirror [37,38]. In this research work,
different methods carried out for depositing graphene onto fiber ferrule include the
optical deposition method, graphene thin film embedment and graphene adhered by
index matching gel. The experimental procedures for each method as well as the
characterization of the deposited graphene by each method are presented in the
following section.
3.3.1 Optical deposition method
The conventional optical deposition method for depositing graphene onto the
fiber ferrule has been reported in many research papers [34-36,39], and similarly carried
out in this work as one of the techniques used in depositing graphene onto the fiber
ferrule. Figure 3.3 shows the optical deposition method setup, consisting of an amplified
spontaneous emission (ASE) source, an optical circulator (OC), an optical power meter
(OPM), a fiber pigtail and graphene solution. The graphene is obtained from Graphene
Research Ltd. in the form of an aqueous solution consisting of graphene flakes with an
average flake thickness of 0.35 nm and an average lateral particle size of 550 nm (150–

90
3000) nm. These graphene flakes are suspended in an N-methyl Pyrrolidone solution, as
in a similar case to that of [40] and [41]. The ASE with an average power of about 15
dBm is injected into the pigtailed optical fiber through the OC, with the fiber ferrule end
slightly immersed in the graphene solution.
Figure 3.3: Optical deposition of graphene
Formation of the graphene layer occurs through the induced process of
thermophoresis by optical radiation along the fiber, whereby the graphene layer will be
automatically deposited onto the fiber ferrule. Thermophoresis, also called
thermodiffusion, is a phenomenon observed in mixtures of mobile particles where the
different particle types exhibit different responses to a force invoked by a temperature
gradient. The basis for the thermophoresis application is that the force can separate
particle types after they have been mixed together, as different particle types move
differently under such a temperature gradient force. For the case of optical deposition
through the process of light injection into an optical fiber, the fiber core at the end of the
fiber ferrule eventually has a higher temperature compared to its surrounding
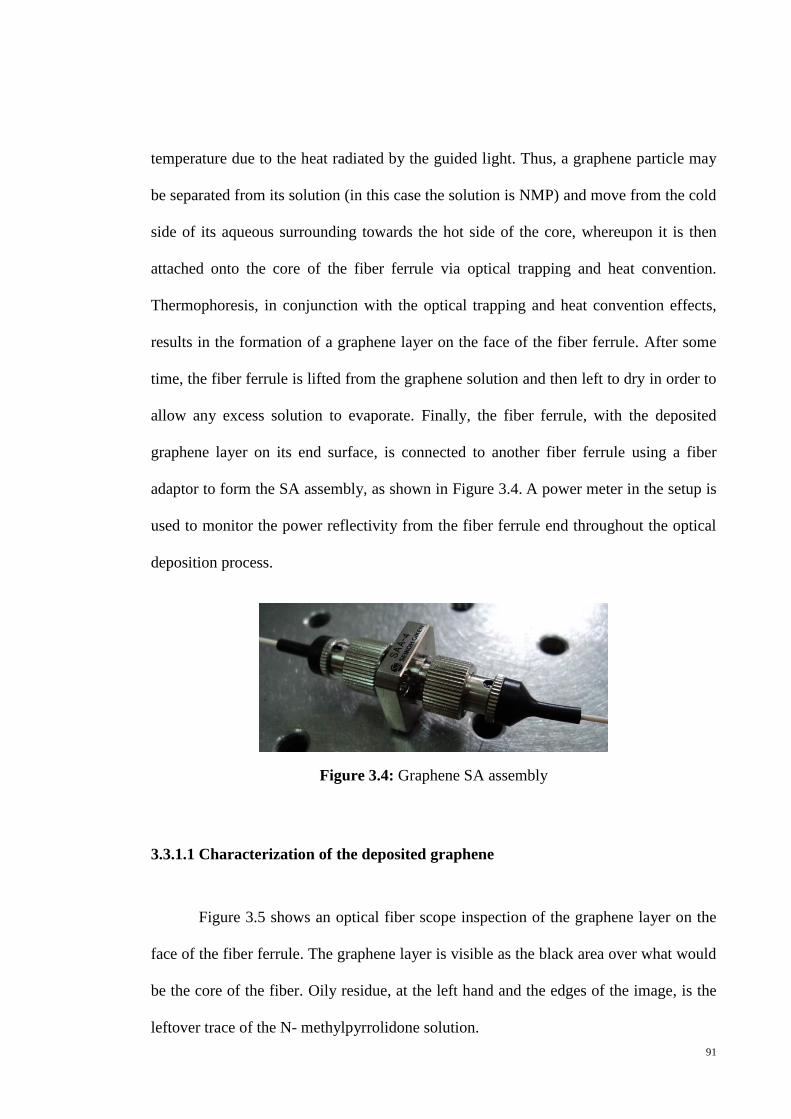
91
temperature due to the heat radiated by the guided light. Thus, a graphene particle may
be separated from its solution (in this case the solution is NMP) and move from the cold
side of its aqueous surrounding towards the hot side of the core, whereupon it is then
attached onto the core of the fiber ferrule via optical trapping and heat convention.
Thermophoresis, in conjunction with the optical trapping and heat convention effects,
results in the formation of a graphene layer on the face of the fiber ferrule. After some
time, the fiber ferrule is lifted from the graphene solution and then left to dry in order to
allow any excess solution to evaporate. Finally, the fiber ferrule, with the deposited
graphene layer on its end surface, is connected to another fiber ferrule using a fiber
adaptor to form the SA assembly, as shown in Figure 3.4. A power meter in the setup is
used to monitor the power reflectivity from the fiber ferrule end throughout the optical
deposition process.
Figure 3.4: Graphene SA assembly
3.3.1.1 Characterization of the deposited graphene
Figure 3.5 shows an optical fiber scope inspection of the graphene layer on the
face of the fiber ferrule. The graphene layer is visible as the black area over what would
be the core of the fiber. Oily residue, at the left hand and the edges of the image, is the
leftover trace of the N- methylpyrrolidone solution.

92
Figure 3.5: Graphene layer
on the core of fiber ferrule
as observed from fiber scope
The deposited graphene layer is further examined microscopically under Raman
spectroscopy by a Renishaw InVia Raman spectrometer to measure the Raman
spectrum of the sample. Raman spectroscopy is a spectroscopic technique based on
inelastic scattering of monochromatic light, whereby the frequency of photons in
monochromatic light will be changed upon the interaction with a sample.
For this experiment, the Raman spectrum is acquired by a laser excitation at 532
nm (2.33 eV) with an exposure time of 10 s using a grating value of 1800 lines / mm,
and incident power and the depth of field are set to be 5 mW and 1 μm respectively. The
detector used in this Raman spectroscopy is a charge-coupled device (CCD) camera. A
spot size, defined as the diameter of the laser spot on the sample, of 0.5 μm is obtained
using a 100× objective lens with a numerical aperture NA of 0.85.
The Raman spectrum of the deposited graphene is shown in Figure 3.6 as
exhibiting the intensity peaks at Raman shift of approximately 1350, 1580, and 2700
cm-1. In general, the most intense features in standard Raman spectrum for graphene are
the two prominent peaks, one located around the Raman shift of 1580 cm-1, commonly
called the G peak, and the other one located around the Raman shift of 2700 cm-1,
namely 2-D peak [42], [43]. It can be observed from Figure 3.6 that the obtained peak
93
profile of the Raman spectrum matches the specified Raman spectrum peak profile for
graphene reported previously [42 - 44]. Such observations of this work indicate that
graphene is well deposited on the fiber ferrule.
Figure 3.6: Raman spectrum of the deposited graphene
In addition, Raman spectroscopy can be used to characterize the crystal
structure, disorder, and defects in graphene-based materials. In defected graphene, an
additional peak named the D peak will be observed around the Raman shift of 1350 cm-
1, and its relative signal strength (compared with the G peak) depends strongly on the
amount of disorder in the graphitic material, which originates from the graphene edge
[43]. A clear indication of defected graphene is shown by a peak around Raman shift of
1350 cm-1 in the figure.
It is also possible to estimate the thickness of graphene layer from the Raman
spectrum. For example, the width of the 2-D peak can be used to determine the number
of graphene layers since width increases with an increasing number of graphene layers.
This effect reflects the change in the electron bands through a double resonant Raman
0
1000
2000
3000
4000
5000
6000
1100 1500 1900 2300 2700
Raman shift (cm¯¹)
Inte
nsi
ty (
CC
D c
ou
nts
)
D (1350 cm-1)
G (1580 cm-1)
2D (2700 cm-1)

94
process based on the electronic structure and the phonon dispersion [42, 43]. Another
way to distinguish the single layer graphene from multilayer graphene is by calculating
the intensity ratio of G peak over 2-D peak. Single-layer graphene is indicated by an
intensity ratio of G/2-D which is generally lower than 0.5, whereas multilayer graphene
is identified by a higher intensity ratio of G/2-D typically larger than or close to 1 [44].
In this work, the calculated intensity ratio of G/2-D is 1.55 from Figure 3.6, signifying
that the deposited graphene is multilayer. The estimated thickness of the graphene layer
is approximately about 1.07 nm based on the above ratio value. Thus, it can be
concluded that the multilayer graphene is successfully and properly deposited on the
fiber ferrule. Figure 3.7 presents the spot image of the deposited layer graphene viewed
under Raman spectroscopy. The shiny and crystal-like structure in the figure represents
the deposited graphene on the core surface of the fiber ferrule.
Figure 3.7: Spot image of the deposited
layer graphene viewed under
Raman spectroscopy
Graphene

95
An in-situ optical reflectometry is another important measurement carried out in
this work. Figure 3.8 shows the data series of the in-situ optical reflectometry measured
by the OPM which describe the deposition process of graphene layer onto the fiber
ferrule end, taken right after the ASE source is turned on. This measurement is carried
out for 80 seconds. This optical reflectometry measurement allows for detection of the
starting time of graphene deposition onto the fiber ferrule as well as for the evaluation
of the homogeneity and consistency of the in-situ layer formation. As can be seen from
the data series in the figure, during the initial phase of the process (after the ASE is
switched on), the reflected power maintains at around -40 dBm. This low value of
power reflectivity of -40 dBm could probably be due to the small refractive index
difference between the NMP solution and the fiber. However, after 22 seconds, there is
a drastic increase in the power reflectivity, from -40 dBm to about -17 dBm, giving a
power difference of about 23 dB from the initial reflected power. The reason for this
drastic change is due to high index contrast between graphene and silica-glass of the
ferrule’s end. Thus, it can be said that deposition of graphene layer onto the fiber ferrule
starts at this point. Also, it can be deduced that graphene deposition does not directly
start right after the light injection - after the ASE is switched on - since it takes some
(albeit short) time to get the graphene particle to flow to the fiber end, become trapped
and deposited.

96
Figure 3.8: Data series of optical reflectometry
of graphene deposition process
Throughout the deposition process, it is observed that there is only slight fluctuation of
the power reflectivity, indicating the uniformity of graphene deposition. The effect from
the solution flow on the power reflectivity reduces when graphene deposition is
uniform. In the optical deposition method, achieving an appropriate graphene deposition
power requires consideration of optimization of the injected light, which is an important
parameter. Monitoring of the power reflectivity provides the detection capability of the
starting time of graphene deposition onto the ferrule’s end.
In order to measure the saturable absortion properties of graphene, such as the
modulation depth, saturation intensity and non saturable absortion, a power-dependent
transmission measurement is performed. The power-dependent transmission
measurement employs a ‘‘home-made’’ single wall carbon nanotubes (SWCNT)-based
mode-locked fiber laser as a source of pulsed laser with an output pulse width of 850
femtoseconds at a repetition rate of 29 MHz and a center wavelength of 1,560 nm. The
-50
-40
-30
-20
-10
0
0 10 20 30 40 50 60 70 80
Re
fle
cte
d p
ow
er (
dB
m)
Deposition starts
Time (s)

97
graphene SA assembly, which is sandwiched between two fiber connectors, is coupled
to the “home made” optical pulse source through the 10% port of a 90:10 output coupler
used in the pulsed laser cavity. A power meter is used to monitor the input power before
entering the graphene SA assembly and consecutively measure the output power after
passing through the graphene SA assembly. The power dependent measurement is done
by varying the input power to the graphene SA assembly while measuring the
corresponding output power after passing through the graphene SA assembly. Figure 3.9
shows the measurement of the modulation depth and saturation intensity of the graphene
SA from the power dependent transmission data, which are observed to be around 7.1 %
and 42 MW / cm2 respectively. The maximum optical transmission is about 43.4% at
peak intensity of ~ 87 MW / cm2. The insertion loss of the graphene SA assembly is
about ∼ 2.3 dB. The obtained modulation depth is only slightly lower than the
modulation depth value of 9-10% that is reported in [20]. A stable operation of mode-
locked fiber laser will have desirably a high modulation depth of typically more than
10% [20]. Higher modulation depth can be achieved by increasing the concentration of
graphene, though this comes at the expense of increasing its insertion loss.
Figure 3.9: Power dependent transmission data
of the deposited graphene

98
Further investigation on this optical deposition method involved the variation of
deposition time at five different periods of 5, 30, 60, 180 and 600 seconds respectively.
The results summarized in Table 3.1 consist of Raman spectrum of the deposited
graphene for each different deposition period as well as the measured reflected power
after the respective period of deposition.
As can be seen from the table, although most of the deposition periods shows
that multilayer graphene has been successfully deposited except for deposition period of
600 seconds (10 minutes) as indicated by the Raman spectrum, there is no significant
pattern or relation between the deposition period and the reflected power taken after the
deposition process at each different period. Similarly, the measured Raman spectrum
also shows no significant relation in terms of the ratio G/2D peak and the width of the
2D peak for each respective deposition period.
Thus, it can be deduced that graphene deposited by optical deposition method
based on the variation of the deposition period is a random process i.e. the number or
thickness of the graphene layer deposited cannot be simply controlled by varying the
period of deposition.

99
Table 3.1: Reflected power and Raman spectrum of deposited graphene for different
deposition period
Deposition
period
Reflected power after
graphene deposition
Raman spectrum of deposited graphene on the
fiber ferrule
5 seconds
0.03 mW
(0.25% of transmitted
light)
30 seconds
0.025 mW
(0.21% of transmitted
light)
1 minute
0.006 mW
(0.05% of transmitted
light)

100
3.3.1.2 Obstacles and challenges in depositing single layer graphene
Depositing single layer graphene on the fiber ferrule using the standard optical
deposition method is not an easy task. Difficulty arises due to a force, known as the van
der Waals force, existing for a small separation between two adjacent graphene layers.
This force causes graphene sheets to tend to clump together with each other and result
in the formation of multilayer or thick layer of graphene on the fiber ferrule. The effect
impedes efforts in controlling the number of graphene layers deposited on the fiber
ferrule by using the standard optical deposition method. As derived in [45], the solution
for the van der Waals force between two adjacent graphene layers is expressed as
3 minutes
0.47 mW
(3.95% of transmitted
light)
10 minutes
0.1 mW
(0.84% of transmitted
light)
101
𝑉(𝑑) = ℏ
(2𝜋)²
1
𝑑3∫ ∫ 𝑑𝜔𝑑𝑞 𝑞 ln {1 − exp (−2𝑞) [
𝛼0(𝑞, 𝑖𝜔)
1 + 𝛼0(𝑞, 𝑖𝜔) ] ²}
∞
0
∞
0
where 𝑉(𝑑) is the interaction potential between two graphene sheets, ℏ is the reduced
Planck constant, 𝑑 is the separation length between two graphene sheets, 𝑞 is the
induced carrier charge, 𝜔 is the angular frequency of the induced carrier and 𝛼0(𝑞, 𝜔) is
the polarizability of a virgin graphene sheet. From equation 3.4, it can be inferred that
the potential varies with separation as d-3 and the force as d-4. In order to realize the
deposition of single layer graphene on the fiber ferrule, an alternative way has to be
developed such as improvement to the former optical deposition method for overcoming
the issue of graphene sheets clumping together due to the van der waals force. A new
method for single layer graphene deposition on fiber ferrule, the so-called ferule-to-
ferule method, is introduced and proposed in the next section.
3.3.1.3 Improved and modified optical deposition method for single layer graphene
deposition.
The optical deposition method for depositing graphene onto the fiber ferrule by
means of optical trapping and heat convention effect has been conventionally used and
reported in many research papers. In order to realize the deposition of a thin layer or
single layer graphene by this method, an appropriate type and concentration level of the
graphene solution as well as the accurate power of the laser source need to be fully
optimized. Optimization remains a challenging task due to the presence of strong van
der Waals force between the graphene layers at small separation that gives rise to the
tendency of the graphene sheets to clump together with each other. This will in turn
3.4

102
result in multilayer or a thick layer of graphene deposited on the fiber ferrule instead of
the desired single layer or thin layer of graphene. Even after the graphene has been
deposited onto the fiber ferrule, there would still be some liquid residue left covering
the surface of the fiber ferrule. Particular types of solvent evaporate very slowly or
hardly at all, which reduces the effectiveness of graphene in exhibiting its optical
properties as an SA in the laser cavity, in addition to increasing the transmission loss of
the graphene SA assembly.
A new and improved technique of the standard optical deposition method for
depositing a single or a thin layer of graphene is introduced in this work, namely the
ferrule-to-ferrule method, which involves the transfer of graphene from one fiber ferrule
to another fiber ferrule by means of optical extraction during the laser operation in order
to remove the excess graphene deposited on the fiber ferrule.
In this technique, forming the graphene SA first requires the graphene layer to
be deposited onto the face of a fiber ferrule using the former optical deposition process.
Similarly, as has been described earlier, the fiber ferrule with the attached graphene
layer is lifted out from the solution after the deposition process. Normally a thick layer
of graphene is formed at this point. The next step is to carry out the ferrule-to-ferrule
method and the schematic diagram for this method is shown in Figure 3.10. The fiber
ferrule with the deposited graphene, designated as FP1, is then connected to one end of
another fiber ferrule, designated as FP2, using a fiber connector. The TLS is used to
supply the laser signal that propagates through the graphene sandwiched between the
two fiber ferrules. As the laser propagates along the fiber, a portion of the graphene
layer from FP1 will be extracted and transferred to FP2. Subsequently the two ferrules
are disconnected from each other by removing the connector of FP2 from the adapter.
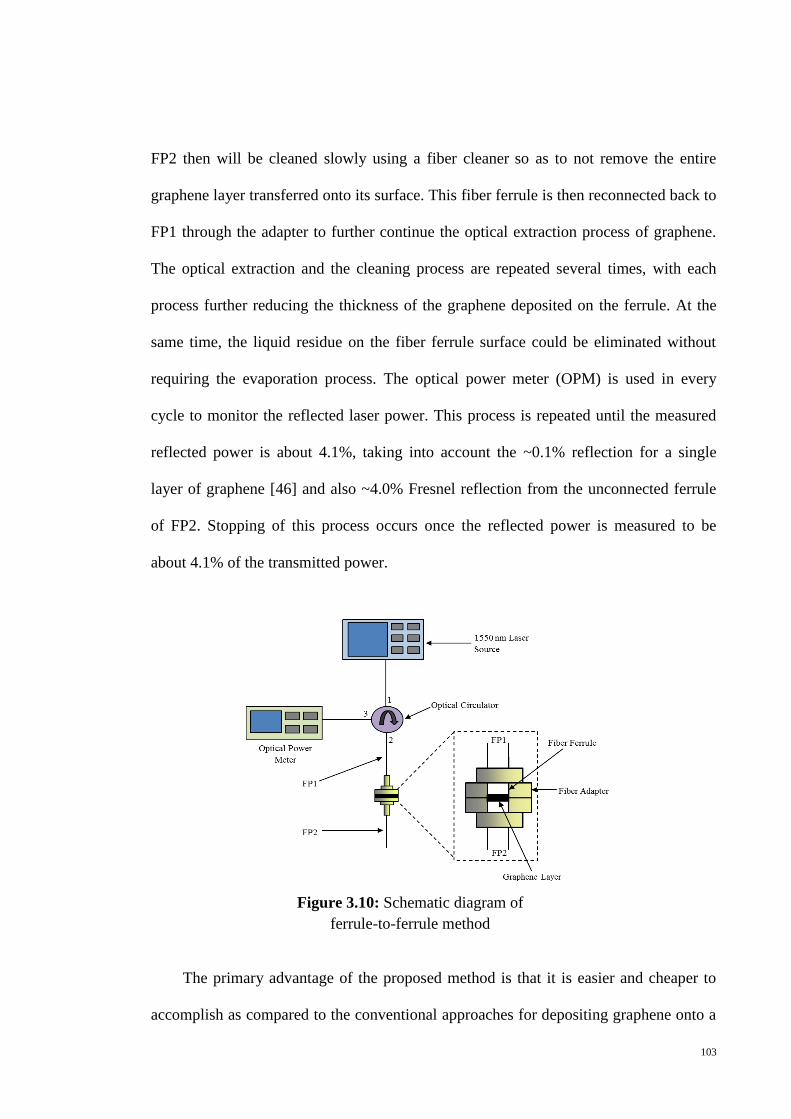
103
FP2 then will be cleaned slowly using a fiber cleaner so as to not remove the entire
graphene layer transferred onto its surface. This fiber ferrule is then reconnected back to
FP1 through the adapter to further continue the optical extraction process of graphene.
The optical extraction and the cleaning process are repeated several times, with each
process further reducing the thickness of the graphene deposited on the ferrule. At the
same time, the liquid residue on the fiber ferrule surface could be eliminated without
requiring the evaporation process. The optical power meter (OPM) is used in every
cycle to monitor the reflected laser power. This process is repeated until the measured
reflected power is about 4.1%, taking into account the ~0.1% reflection for a single
layer of graphene [46] and also ~4.0% Fresnel reflection from the unconnected ferrule
of FP2. Stopping of this process occurs once the reflected power is measured to be
about 4.1% of the transmitted power.
The primary advantage of the proposed method is that it is easier and cheaper to
accomplish as compared to the conventional approaches for depositing graphene onto a
Figure 3.10: Schematic diagram of
ferrule-to-ferrule method

104
fiber ferrule. The proposed method is also more reliable as compared to the basic optical
deposition technique, such that it allows the deposited graphene to be used immediately
after the deposition process, without any further drying or evaporation process needed.
In addition, the number of graphene layer deposited can be roughly controlled based on
the power reflectivity by using this technique.
The Raman spectrum of the deposited graphene is shown in Figure 3.11, which
exhibits the two intensity peaks at 1597 cm-1 and 2684 cm-1. The peak at 1597 cm-1
corresponds closely to the expected G peak for graphene, which is usually at 1580 cm-1.
Similarly, the intense peak at 2684 cm-1 corresponds to the 2D peak for graphene, which
is typically at 2700 cm-1, indicating the desired graphene layer is present on the face of
the fiber ferrule. Furthermore, the ratio of G over 2D does not exceed 1, thus indicating
that a nearly single layer of graphene has been deposited, whereas multiple layers of
graphene is indicated by a G to 2D ratio of more than 1.
Figure 3.11: Raman spectrum of the deposited graphene
0
1500
3000
4500
6000
7500
9000
1400 1600 1800 2000 2200 2400 2600 2800
Raman shift (cm¯¹)
Inte
nsi
ty (
CC
D C
ou
nts
)
G peak
(1597 cm-1)
2D peak
(2684 cm-1)

105
The result for the power dependent transmission measurement of the deposited
graphene is shown in Figure 3.12. As can be deduced from this figure, the nonlinear
optical transmittance rises from about 28.1% to 33.2% at saturation, giving a
modulation depth of about 5.1%. The saturation intensity and the maximum optical
transmission at peak intensity of ~ 85 MW/cm2 is about 45 MW/cm2 and 33.4%
respectively. The insertion loss of the graphene SA assembly is about ∼ 1.8 dB.
Figure 3.12: Power dependent transmission data
of the deposited graphene
3.3.2 Graphene adhered by index matching gel
In addition to the optical deposition method, another method investigated in this
work is graphene deposition via employment of index matching gel to adhere graphene
flakes onto the surface of the fiber ferrule. The index matching gel used has an index of
refraction that closely approximates to that of the silica optical fiber, which has a value
of 1.463. Normally in fiber optics works, the index matching gel is used to reduce
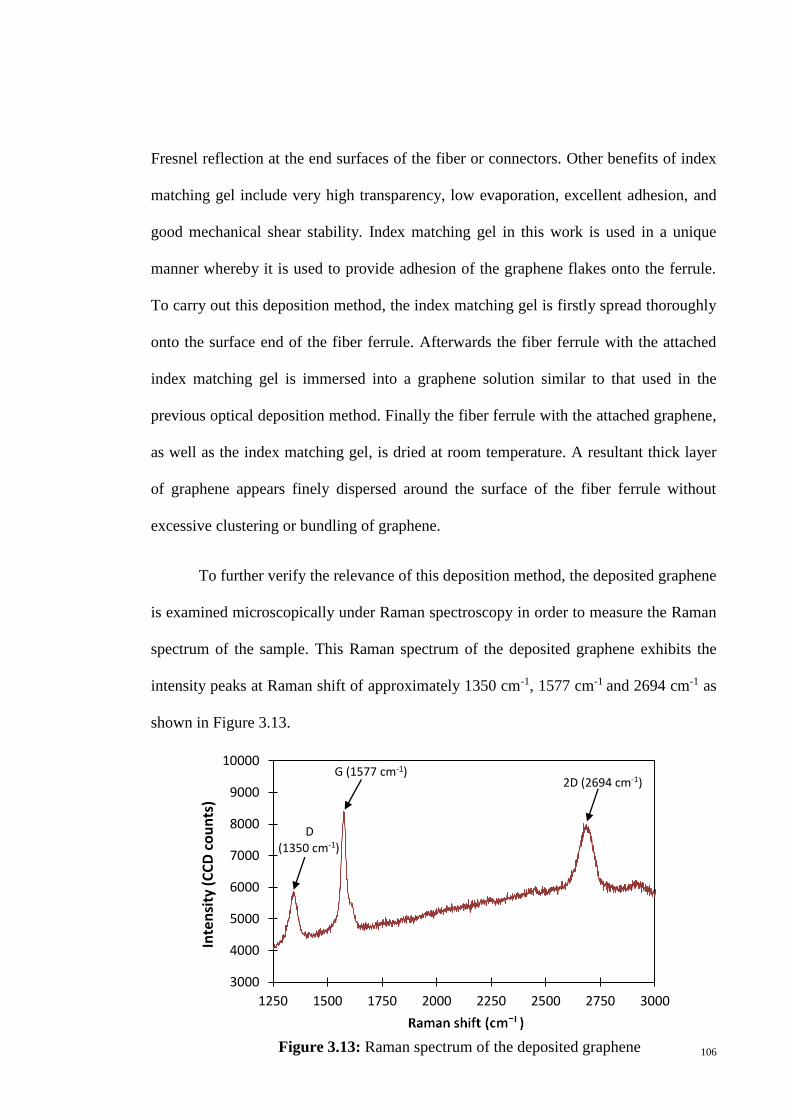
106
Fresnel reflection at the end surfaces of the fiber or connectors. Other benefits of index
matching gel include very high transparency, low evaporation, excellent adhesion, and
good mechanical shear stability. Index matching gel in this work is used in a unique
manner whereby it is used to provide adhesion of the graphene flakes onto the ferrule.
To carry out this deposition method, the index matching gel is firstly spread thoroughly
onto the surface end of the fiber ferrule. Afterwards the fiber ferrule with the attached
index matching gel is immersed into a graphene solution similar to that used in the
previous optical deposition method. Finally the fiber ferrule with the attached graphene,
as well as the index matching gel, is dried at room temperature. A resultant thick layer
of graphene appears finely dispersed around the surface of the fiber ferrule without
excessive clustering or bundling of graphene.
To further verify the relevance of this deposition method, the deposited graphene
is examined microscopically under Raman spectroscopy in order to measure the Raman
spectrum of the sample. This Raman spectrum of the deposited graphene exhibits the
intensity peaks at Raman shift of approximately 1350 cm-1, 1577 cm-1 and 2694 cm-1 as
shown in Figure 3.13.
3000
4000
5000
6000
7000
8000
9000
10000
1250 1500 1750 2000 2250 2500 2750 3000
Inte
nsi
ty (
CC
D c
ou
nts
)
G (1577 cm-1)
D (1350 cm-1)
2D (2694 cm-1)
Figure 3.13: Raman spectrum of the deposited graphene

107
This peak profile of the Raman spectrum matches the specified peak profile of
Raman spectrum for graphene, which is located at Raman shift of 1580 cm-1 and 2700
cm-1 as mentioned earlier. These results indicate that graphene deposition by this
technique is applicable and easily achievable. The D peak, which is observed around the
Raman shift of 1350 cmˉˡ, indicates some defects or disorder originating from the
graphene edge. The calculated intensity ratio of G/2D from the figure exceeds the value
of 1 and thus signifies a multilayer structure for the deposited graphene. The noise in
the Raman spectrum, which is indicated by the increasing level of the intensity shown in
the figure, is most probably attributed by the Raman shift originating from the index
matching gel.
A spot image of the deposited multilayer graphene viewed under Raman
spectroscopy is presented in Figure 3.14. The advantage of this deposition method is its
low complexity and cost effectiveness since this technique requires no other optical,
chemical or electrical methods. The index matching gel also has the additional
advantage of having minimal optical loss, as proven experimentally by checking the
power loss using a TLS (a patchcord with index matching gel applied onto its ferrule
end and an optical power meter). Moreover, by using this method, a very thick graphene
layer can be deposited at a time.
Figure 3.14: The spot image of the
deposited graphene under
Raman spectroscopy

108
3.3.3 Graphene thin film embedment
Graphene thin film used in this work is obtained from Cambridge University in
the form of graphene-polyvinyl alcohol (PVA) composite. To integrate this graphene-
PVA thin film onto the fiber ferrule, this graphene thin film is firstly cut into a small
piece with sufficient size to just cover the core of the fiber ferrule as shown in Figure
3.15. The fiber ferrule is rubbed with a little index matching gel before placing the
graphene thin film on top of it as to adhere the film onto the fiber ferrule.
Figure 3.15: Graphene-PVA thin film
on the fiber ferrule
Similar to previous procedures carried out in characterizing graphene, this
graphene-PVA thin film is also examined under Raman microscopy with results shown
in Figure 3.16.
2000
3000
4000
5000
6000
7000
8000
1100 1600 2100 2600 3100
Raman shift (cm¯¹)
Inte
nsi
ty (
CC
D C
ou
nts
)
D G
D’
2D
D+D’
Figure 3.16: Raman spectrum of the graphene-PVA thin film

109
As can be seen from the figure, apart from G and 2 D peaks that normally exist
in a standard graphene sample, there are also other peaks observed at D’ and D+D’
regions. The high intensity of D+D’ peak originates from the PVA, such that the Raman
spectrum of the graphene-PVA composite is a superposition of Raman spectrum from
graphene and from the PVA, whereby the molecular structure of both graphene and
PVA are still preserved [47]. The growth of the D’ peak in the spectrum is due to the
Double Resonance effect which occurs when two points from the same cone around K
or K’ are connected. Neither D nor D’ peaks in the spectrum exhibit a broad spectral
width, and so indicate that there is only a small amount structural defects. This notion is
further verified by the separation of G and D’ peaks whereby no merging with each
other occurs [48]. Both the D and D’ peaks can be reasonably assigned as the edges of
the sub-micrometer flakes [49].
Figure 3.17 shows the power dependent transmission data for this graphene-
PVA thin film, whereby the nonlinear optical transmittance can be observed to rise from
about 25.8% to 28.2% at saturation. This implies that the optical transmission increases
by about 2.4% when this graphene saturable absorber saturates at Ipeak of about 75
MW/cm2, giving a modulation depth of about 2.4%. The obtained modulation depth is
comparable and almost similar to those reported in [18, 47, 50, 51]. The average
saturation intensity is about 45 MW/cm2 together with a maximum optical transmission
of 28.3% at peak intensity of ~80 MW/cm2. The insertion loss of the graphene SA
assembly is about ∼4.9 dB when also taking in to account the loss from the PVA.

110
Figure 3.17: Power dependent transmission data
of the graphene-PVA thin film
3.3.4 Optical deposition of graphene oxide with a simple technique
Graphene oxide can possess similar behavior to graphene as it has a
comparatively strong saturable absorption and a fast energy relaxation of hot carriers in
common with graphene [52, 53]. Graphene oxide (GO) is a 2D network of mixed sp2
and sp3 carbon bonding, which also possesses similar mechanical, thermal, electrical,
and optical properties to those exhibited by graphene. A major difference between
graphene and graphene oxide is that graphene oxide possesses a bandgap energy
generated via isolated nanoscale sp2 domains in the sp3 matrix [7]. Graphene oxide is
generally obtained by the oxidization of naturally occurring graphite, and typically is
fabricated by either the Brodie [54], Staudenmaier [55], or Hummers [56] methods or
some variation thereof. In graphene fabrication, chemical reduction method is one of the
methods used for mass production of graphene [57], whereby natural graphite is

111
oxidized to form graphene oxide that will then be reduced into graphene using
reductants. Thus, it can be said that graphene oxide acts as the graphene precursor [52].
This provide a good opportunity for graphene oxide to be directly used as a saturable
absorber, which potentially becomes a favorable alternative to graphene with the
advantage of simpler fabrication process in comparison to graphene. Oxygen functional
groups in graphene oxide eliminate the gapless linear dispersion of Dirac electron that is
found in graphene [58], with the result of inhibiting the graphene oxide from conducting
electricity though not reducing its saturable absortion properties. Besides the chemical
reduction method, graphene can also be produced by chemical vapor deposition (CVD)
method in order to deposit the graphene film onto a glass plate or fiber ferrule.
Graphene preparation by this latter technique requires skillful operation and highly
precise instrumentation, thereby making the fabrication process difficult.
Furthermore, graphene unfortunately has a shortcoming in terms of its
insolubility in many organic solvents [7] regardless of its superiority as a saturable
absorber. Although the optical deposition method for depositing graphene onto the fiber
ferrule has been conventionally used, one drawback of this technique is that the type of
solvent used for dissolving graphene, such as N-methyl Pyrrolidone (NMP) solution,
usually remains on the fiber ferrule after the deposition process and takes a very long
time to evaporate. This consequently would reduce the effectiveness of graphene as the
SA in the laser cavity, besides increasing the transmission loss of the graphene SA
assembly.
Graphene oxide possesses oxygen-containing functional groups that do not exist
in graphene; these groups create an intense hydrophilic feature in graphene oxide [58]
and provide graphene oxide with an essential advantage over graphene. Consequently

112
graphene oxide is highly soluble in water in contrast to graphene. Distilled water can
become a suitable alternative solvent for graphene oxide, and so ease the fabrication of
the graphene-oxide SA through the optical deposition method. Furthermore, there would
be no issue of having the water residue on the surface of fiber ferrule after the optical
deposition process since water can evaporate naturally within a short duration.
In this experiment, a commercially available graphene oxide is used in the form
of a dry nanopowder obtained from Graphene Research Ltd. In fabricating the
graphene-based all-fiber SA, the graphene oxide nanopowder is first dissolved in
approximately 0.25 ml of water and then made to undergo ultrasonification for 30
minutes so as to ensure that the graphene oxide particulates are well dispersed in water.
A similar procedure in the optical deposition method for depositing graphene as
described earlier is carried out in order to generate the layer of graphene oxide on the
face of the fiber ferrule. Likewise, as a result of the thermophoresis effect, a layer of
graphene oxide will be formed on the face of the fiber ferrule. The fiber ferrule is then
lifted from the graphene oxide and water solution and left to dry at room temperature
for about 30 minutes to allow any excess water to evaporate. It can be observed from
the fiberscope that the water residue on the fiber ferrule is completely evaporated after
about 30 minutes. Finally, the fiber ferrule including the graphene layer is connected to
another fiber ferrule to form the SA.
The Raman spectrum of the graphene oxide formed on the face of the fiber
ferrule in shown in Figure 3.18. Graphene oxide will establish two main peaks, D and
G, in Raman spectroscopy [59], corresponding to 1354 cm-1 (D) and 1582 cm-1 (G) in
the figure. The peaks measured are similar to those in [60], whereby the graphene oxide
and reduced graphene oxide have D and G peaks within this region. Above 1760 cm-1 is

113
the broad spectrum that arises due to the fluorescence effect. In the case of this work,
the graphene oxide in its powder form is mixed with water and the trace therefore is not
attributed to any other material than graphene oxide.
Figure 3.18: Raman trace of graphene oxide
that is formed on the face of the fiber ferrule.
Figure 3.19 shows the power dependent transmission data for the deposited
graphene-oxide. As can be observed from the figure, the nonlinear optical transmittance
rises from about 24.2% to 37.6% at saturation. This implies that the optical transmission
increases by about 13.4% when this graphene-oxide saturable absorber saturates at Ipeak
of about 85 MW/cm2 and thus gives a modulation depth of about 13.4%. The average
saturation intensity and the maximum optical transmission are about 47.5 MW/cm2 and
37.8%, respectively. The insertion loss of the graphene-oxide SA assembly is about 2.3
dB.
23000
28000
33000
38000
1180 1580 1980 2380 2780
Raman shift
Inte
nsi
ty(C
CD
co
un
ts)
D
G

114
Figure 3.19: Power dependent transmission data
of the deposited graphene oxide
Compared to optical deposition of graphene, the deposition of graphene oxide is
more conveniently done due to the easier dissolution of graphene oxide in water. The
process is also inexpensive and significantly faster in comparison to using graphene.
The results obtained prove that graphene oxide deposited by this method gives desirable
properties and suitable usage as a saturable absorber.
115
References
1. Sun, Z., Hasan, T., Torrisi, F., Popa, D., Privitera, G., Wang, F., Bonaccorso, F.,
Basko, D. M., & Ferrari, A. C. (2010). Graphene mode-locked ultrafast laser. ACS
Nano, 4(2), 803-810.
2. Bao, Q., Zhang, H., Wang, Y., Ni, Z., Yan, Y., Shen, Z. X., Loh, K. P., & Tang,
D. Y. (2009). Atomic‐layer graphene as a saturable absorber for ultrafast pulsed
lasers. Advanced Functional Materials, 19(19), 3077-3083.
3. Obraztsov, P. (2011). Nonlinear optical phenomena in graphene based materials
(Doctoral dissertation, Department of Physics and Mathematics, University of
Eastern Finland). Retrieved from http://epublications.uef.fi/pub/urn_isbn_978-
952-61-0550-5/urn_isbn_978-952-61-0550-5.pdf
4. Bonaccorso, F., Sun, Z., Hasan, T., & Ferrari, A. C. (2010). Graphene photonics
and optoelectronics. Nature Photonics, 4(9), 611-622.
5. Hendry, E., Hale, P. J., Moger, J., Savchenko, A. K., & Mikhailov, S. A. (2010).
Coherent nonlinear optical response of graphene. Phys. Rev. Lett, 105(9), 097401-
097405.
6. Geim, A. K., & Novoselov, K. S. (2007). The rise of graphene. Nature materials,
6(3), 183-191.
7. Wang, J., Chen, Y., Li, R., Dong, H., Zhang, L., Lotya, M., Coleman, J. N., &
Blau, W. J. (2011). Nonlinear optical properties of graphene and carbon nanotube
composites. In S. Yellampalli (Eds.), Carbon Nanotubes - Synthesis,
Characterization, Applications. InTech.

116
8. Saito, R., Dresselhaus, G., & Dresselhaus, M. S. (1998). Physical Properties of
Carbon Nanotubes. London: Imperial College Press.
9. Nair, R. R., Blake, P., Grigorenko, A. N., Novoselov, K. S., Booth, T. J., Stauber,
T., Peres, N. M. R., & Geim, A. K. (2008). Fine structure constant defines visual
transparency of graphene. Science, 320(5881), 1308-1308.
10. Kuzmenko, A. B., Van Heumen, E., Carbone, F., & Van Der Marel, D. (2008).
Universal optical conductance of graphite. Physical Review Letters, 100(11),
117401-117405.
11. Margulis, V. A., & Sizikova, T. A. (1998). Theoretical study of third-order
nonlinear optical response of semiconductor carbon nanotubes. Physica B:
Condensed Matter, 245(2), 173-189.
12. Strano, M. S. (2003). Probing chiral selective reactions using a revised Kataura
plot for the interpretation of single-walled carbon nanotube spectroscopy. Journal
of the American Chemical Society, 125(51), 16148-16153.
13. Hendry, E., Hale, P. J., Moger, J., Savchenko, A. K., & Mikhailov, S. A. (2010).
Coherent nonlinear optical response of graphene. Phys. Rev. Lett, 105(9), 097401.
14. Popa, D., Sun, Z., Hasan, T., Cho, W. B., Wang, F., Torrisi, F., & Ferrari, A. C.
(2012). 74-fs nanotube-mode-locked fiber laser. Applied Physics Letters, 101(15),
153107-153107.
15. Lui, C. H., Mak, K. F., Shan, J., & Heinz, T. F. (2010). Ultrafast
photoluminescence from graphene. Physical Review Letters, 105(12), 127404.
16. Bucklew, V., Wysocki, B., & Pollock, C. (2012). Femtosecond carrier dynamics
in photoexcited highly ordered pyrolytic graphite films. Optical Materials, 34(8),
1299-1302.
117
17. Breusing, M., Ropers, C., & Elsaesser, T. (2009). Ultrafast carrier dynamics in
graphite. Physical Review Letters, 102(8), 086809.
18. Wang, F., Rozhin, A. G., Scardaci, V., Sun, Z., Hennrich, F., White, I. H., Milne,
W. I., & Ferrari, A. C. (2008). Wideband-tunable, nanotube mode-locked, fibre
laser. Nature Nanotechnology, 3(12), 738-742.
19. Xing, G., Guo, H., Zhang, X., Sum, T. C., & Huan, C. H. A. (2010). The Physics
of ultrafast saturable absorption in graphene. Opt. Express, 18(5), 4564-4573. 20. Going, R., Popa, D., Torrisi, F., Sun, Z., Hasan, T., Wang, F., & Ferrari, A. C.
(2012). 500fs wideband tunable fiber laser mode-locked by nanotubes. Physica E:
Low-Dimensional Systems and Nanostructures, 44(6), 1078-1081.
21. Rozhin, A. G., Sakakibara, Y., Namiki, S., Tokumoto, M., Kataura, H., & Achiba,
Y. (2006). Sub-200-fs pulsed erbium-doped fiber laser using a carbon nanotube-
polyvinylalcohol mode locker. Applied Physics Letters, 88(5), 051118-051118.
22. Herda, R., Okhotnikov, O. G., Rafailov, E. U., Sibbett, W., Crittenden, P., &
Starodumov, A. (2006). Semiconductor quantum-dot saturable absorber mode-
locked fiber laser. Photonics Technology Letters, IEEE, 18(1), 157-159.
23. Popa, D., Sun, Z., Hasan, T., Torrisi, F., Wang, F., & Ferrari, A. C. (2011).
Graphene Q-switched, tunable fiber laser. Applied Physics Letters, 98(7), 073106-
073106.
24. Svelto, O. (1998). Principles of Lasers (4th ed.). New York: Plenum Press. 25. Keller, U., Weingarten, K. J., Kärtner, F. X., Kopf, D., Braun, B., Jung, I. D.,
Fluck, R., Honninger, C., Matuschek, N., & der Au, J. A. (1996). Mode-locking
ultrafast solid-state lasers with saturable Bragg reflectors. IEEE J. Sel. Top.
Quantum Electron, 2, 435-453.

118
26. Okhotnikov, O., Grudinin, A., & Pessa, M. (2004). Ultra-fast fibre laser systems
based on SESAM technology: new horizons and applications. New Journal of
Physics, 6(177), 1-22. 27. Paschotta, R., & Keller, U. (2001). Passive mode locking with slow saturable
absorbers. Applied Physics B, 73(7), 653-662. 28. Kartner, F. X., Jung, I. D., & Keller, U. (1996). Soliton mode-locking with
saturable absorbers. Selected Topics in Quantum Electronics, IEEE Journal of,
2(3), 540-556.
29. Sun, Z., Popa, D., Hasan, T., Torrisi, F., Wang, F., Kelleher, E. J. R., Travers, J.
C., Nicolosi, V., & Ferrari, A. C. (2010). A stable, wideband tunable, near
transform-limited, graphene-mode-locked, ultrafast laser. Nano Research, 3(9),
653-660.
30. Zhang, H., Tang, D. Y., Zhao, L. M., Bao, Q. L., Loh, K. P., Lin, B., & Tjin, S. C.
(2010). Compact graphene mode‐locked wavelength‐tunable erbium‐doped fiber
lasers: from all anomalous dispersion to all normal dispersion. Laser Physics
Letters, 7(8), 591-596.
31. Stankovich, S., Dikin, D. A., Dommett, G. H., Kohlhaas, K. M., Zimney, E. J.,
Stach, E. A., Piner, R. D., Nguyen, S. T., & Ruoff, R. S. (2006). Graphene-based
composite materials. Nature, 442(7100), 282-286.
32. Song, Y. W., Jang, S. Y., Han, W. S., & Bae, M. K. (2010). Graphene mode-
lockers for fiber lasers functioned with evanescent field interaction. Applied
Physics Letters, 96(5), 051122-051122.

119
33. Villegas, I. L., Cuadrado-Laborde, C., Díez, A., Cruz, J. L., Martínez-Gámez, M.
A., & Andrés, M. V. (2011). Yb-doped strictly all-fiber laser actively Q-switched
by intermodal acousto-optic modulation. Laser Physics, 21(9), 1650-1655.
34. Martinez, A., Fuse, K., Xu, B., & Yamashita, S. (2010). Optical deposition of
graphene and carbon nanotubes in a fiber ferrule for passive mode-locked
lasing. Optics Express, 18(22), 23054-23061.
35. Cao, W. J., Wang, H. Y., Luo, A. P., Luo, Z. C., & Xu, W. C. (2012). Graphene-
based, 50 nm wide-band tunable passively Q-switched fiber laser. Laser Physics
Letters, 9(1), 54-58.
36. Luo, Z., Zhou, M., Weng, J., Huang, G., Xu, H., Ye, C., & Cai, Z. (2010).
Graphene-based passively Q-switched dual-wavelength erbium-doped fiber
laser. Optics Letters, 35(21), 3709-3711.
37. Liu, J., Wu, S., Yang, Q. H., & Wang, P. (2011, May). High-energy all-normal-
dispersion graphene mode-locked Yb-doped fiber laser. In The European
Conference on Lasers and Electro-Optics. Optical Society of America.
38. Xu, J., Liu, J., Wu, S., Yang, Q. H., & Wang, P. (2012). Graphene oxide mode-
locked femtosecond erbium-doped fiber lasers. Optics Express, 20(14), 15474-
15480.
39. Nicholson, J. W. (2007, May). Optically assisted deposition of carbon nanotube
saturable absorbers. In Conference on Lasers and Electro-Optics. Optical Society
of America.
40. Hernandez, Y., Nicolosi, V., Lotya, M., Blighe, F. M., Sun, Z., De, S., McGovern,
I. T., Holland, B., Byrne, M., Gun’Ko, Y. K., Boland, J. J., Niraj, P., Duesberg,
G., Krishnamurthy, S., Goodhue, R., Hutchison, J., Scardaci, V., Ferrari, A. C., &
120
Coleman, J. N. (2008). High-yield production of graphene by liquid-phase
exfoliation of graphite. Nature Nanotechnology, 3(9), 563-568.
41. Hasan, T., Torrisi, F., Sun, Z., Popa, D., Nicolosi, V., Privitera, G., Bonaccorso,
F., & Ferrari, A. C. (2010). Solution‐phase exfoliation of graphite for ultrafast
photonics. physica status solidi (b), 247(11‐12), 2953-2957.
42. Ferrari, A. C., Meyer, J. C., Scardaci, V., Casiraghi, C., Lazzeri, M., Mauri, F.,
Piscanec, S., Jiang, D., Novoselov & Geim, A. K. (2006). Raman spectrum of
graphene and graphene layers. Physical Review Letters, 97(18), 187401-1–
187401-4.
43. Graf, D., Molitor, F., Ensslin, K., Stampfer, C., Jungen, A., Hierold, C., & Wirtz,
L. (2007). Spatially resolved Raman spectroscopy of single-and few-layer
graphene. Nano Letters, 7(2), 238-242.
44. Chen, S., Brown, L., Levendorf, M., Cai, W., Ju, S. Y., Edgeworth, J., Li, X.,
Magnusson, C. W., Velamakanni, A., Piner, R. D., Kang, J., Park, J., & Ruoff, R.
S. (2011). Oxidation resistance of graphene-coated Cu and Cu/Ni alloy. ACS
Nano, 5(2), 1321-1327.
45. Retrieved from http://www.ifm.liu.se/courses/TFYY67/Graphene.pdf
46. Bonaccorso, F., Sun, Z., Hasan, T., & Ferrari, A. C. (2010). Graphene photonics
and optoelectronics. Nature Photonics, 4(9), 611-622.
47. Popa, D., Sun, Z., Torrisi, F., Hasan, T., Wang, F., & Ferrari, A. C. (2010). Sub
200 fs pulse generation from a graphene mode-locked fiber laser. Applied Physics
Letters, 97(20), 203106-203106.
48. Ferrari, A. C., & Robertson, J. (2000). Interpretation of Raman spectra of
disordered and amorphous carbon. Physical Review B, 61(20), 14095.

121
49. Casiraghi, C., Hartschuh, A., Qian, H., Piscanec, S., Georgi, C., Fasoli, A.,
Novoselov, K. S., Basko, D. M., & Ferrari, A. C. (2009). Raman spectroscopy of
graphene edges. Nano Letters, 9(4), 1433-1441.
50. Sun, Z., Rozhin, A. G., Wang, F., Hasan, T., Popa, D., ONeill, W., & Ferrari, A.
C. (2009). A compact, high power, ultrafast laser mode-locked by carbon
nanotubes. Applied Physics Letters, 95(25), 253102-253102.
51. Scardaci, V., Sun, Z., Wang, F., Rozhin, A. G., Hasan, T., Hennrich, F., White, I.
H., Milne, W. I., & Ferrari, A. C. (2008). Carbon nanotube polycarbonate
composites for ultrafast lasers. Advanced Materials, 20(21), 4040-4043.
52. Loh, K. P., Bao, Q., Eda, G., & Chhowalla, M. (2010). Graphene oxide as a
chemically tunable platform for optical applications. Nature Chemistry, 2(12),
1015-1024.
53. Zhao, X., Liu, Z. B., Yan, W. B., Wu, Y., Zhang, X. L., Chen, Y., & Tian, J. G.
(2011). Ultrafast carrier dynamics and saturable absorption of solution-
processable few-layered graphene oxide. Applied Physics Letters, 98(12), 121905-
121905.
54. Brodie, B. C. (1860). Sur le poids atomique du graphite. Ann. Chim. Phys, 59(7),
466-472.
55. Staudenmaier, L. (1898). Verfahren zur darstellung der graphitsäure. Berichte der
deutschen chemischen Gesellschaft, 31(2), 1481-1487.
56. Hummers, W. S., & Offeman, R. E. (1958). Preparation of graphitic oxide.
Journal of the American Chemical Society, 80(6), 1339-1339.
57. Stankovich, S., Dikin, D. A., Piner, R. D., Kohlhaas, K. A., Kleinhammes, A., Jia,
Y., Wu, Y., Nguyen, S. T., & Ruoff, R. S. (2007). Synthesis of graphene-based

122
nanosheets via chemical reduction of exfoliated graphite oxide. Carbon, 45(7),
1558-1565.
58. Xu, J., Liu, J., Wu, S., Yang, Q. H., & Wang, P. (2012). Graphene oxide mode-
locked femtosecond erbium-doped fiber lasers. Optics Express, 20(14), 15474-
15480.
59. Jorio, A., Dresselhaus, M. S., Saito, R., & Dresselhaus, G. (2011). Raman
spectroscopy in graphene related systems. Weinheim, Germany: Wiley.
60. Sobon, G., Sotor, J., Jagiello, J., Kozinski, R., Zdrojek, M., Holdynski, M.,
Paletko, P., Boguslawski, J., Lipinska, L., & Abramski, K. M. (2012). Graphene
Oxide vs. Reduced Graphene Oxide as saturable absorbers for Er-doped passively
mode-locked fiber laser. Optics Express, 20(17), 19463-19473.
123
CHAPTER 4
GRAPHENE FOR Q-SWITCHED FIBER LASERS
4.1 Introduction
As has been described in Chapter 2, Q-switching is an enabling technique for
pulsed laser operation with high output pulse energy; lasing is inhibited in the beginning
of the pumping process of the gain medium by a small Q factor, and switching to a high
Q factor allows lasing to take place and results in the discharge of the stored energy in
the form of pulse output with pulse duration ranging from microseconds to nanoseconds
[1, 2]. Q-switching when compared to mode-locking has a relatively much longer pulse
duration and much lower repetition rate (usually in the kHz range), which corresponds
to the inverse of the time taken between two successive pulses to restore the emitted
energy and is dependent on the lifetime of the electron in the excited state inside the
gain medium. For instance, the electron lifetime of approximately several milliseconds
in erbium-doped fibers is not short enough to yield a high repetition rate in Q-switching,
though such a repetition rate can be reached by the mode-locking operation after
satisfying specific conditions. Nevertheless, Q-switching has certain advantages over
mode-locking in terms of being comparatively easier to accomplish because there is no
requirement for a careful design of the cavity parameters in order to attain the
equilibrium between the dispersion and nonlinearity of the intra-cavity medium as
needed by mode-locking for achieving stable operation. Furthermore, Q-switching is
able to produce higher pulse energies, higher operation efficiency, and is more cost

124
effective than mode-locking [1]. Q-switching laser operation can be realized either
actively or passively. Active Q-switching involves the modulation of the Q-factor by
external equipment or components applied in the laser cavity such as electro-optic
modulators [3], acousto-optic modulators [4,5] and mechanical rotating choppers.
Passive Q-switching is realized by incorporating a saturable absorber within the laser
cavity, whereupon the amount of the photon absorption is determined based on the light
intensity passing through the saturable absorber. Generally, passive Q-switching is more
difficult to trigger than active Q-switching. In spite of this, the passive Q-switching
approach is more desirable and more intensely investigated than active Q-switching due
to its advantages of simpler configuration, ease of operation, higher reliability, low cost,
and compactness. In contrast, for active Q-switching, the additional mechanisms
integrated in the laser cavity will result in a high insertion loss and increase of
complexity for the cavity. Thus, compared to active techniques, passively Q-switched
fiber lasers are preferable as they are easier to operate and do not require bulky active
components.
In conjunction with the need of creating a simple and compact passively Q-
switched fiber laser, there has been recent great interest in graphene candidature as
saturable absorbers (SAs) for passive Q-switching application in fiber laser. Unlike the
predominantly used saturable absorber such as SESAM, which unfortunately has the
drawback of complex fabrication and narrow tuning range, graphene-based SAs have
made significant advances in the development of compact Q-switched fiber lasers
capable of generating wideband wavelength tunability.
Taking advantage of the unique properties of graphene, the graphene deposited
in this work by optical deposition method is demonstrated for Q-switching operation in

125
various setup configurations. This chapter covers the experimental setup, procedures,
results obtained, and analysis of data from the demonstration of graphene for Q-
switching operation in a simple ring cavity of Erbium doped fiber laser (EDFL).
Coverage extends to subsequent development of a more advanced configuration that
enables wavelength tenability, which is achieved by employing different wavelength
selective elements including the tunable bandpass filter (TBF), arrayed waveguide
gratings (AWG) and fiber Bragg gratings (FBG). Comparison on the Q-switching
output performance using the different wavelength selective elements is also analyzed.
In addition, this chapter contains demonstration and presentation of graphene Q-
switched EDFL based on distributed Bragg reflector (DBR) cavity configuration and
multiwavelength graphene Q-switched based on Brillouin-erbium fiber, with the
specific advantages of each approach described. Furthermore, experimental result and
analysis on graphene-oxide based saturable absorber for Q-switched operation by using
the graphene oxide deposited in this work - as described earlier in Chapter 3 - is also
included in this chapter.
4.2 Graphene Q-switched erbium doped fiber laser
Figure 4.1 presents the schematic of the experimental setup for the graphene-
based Q-switched erbium doped fiber laser (EDFL) in a ring cavity configuration. The
setup consists of a 3 m EDF (MetroGain-12) as the gain medium, pumped by a 980 nm
Laser Diode (LD) through a 980 nm port of a fused 980/1550 nm Wavelength Division
Multiplexer (WDM).
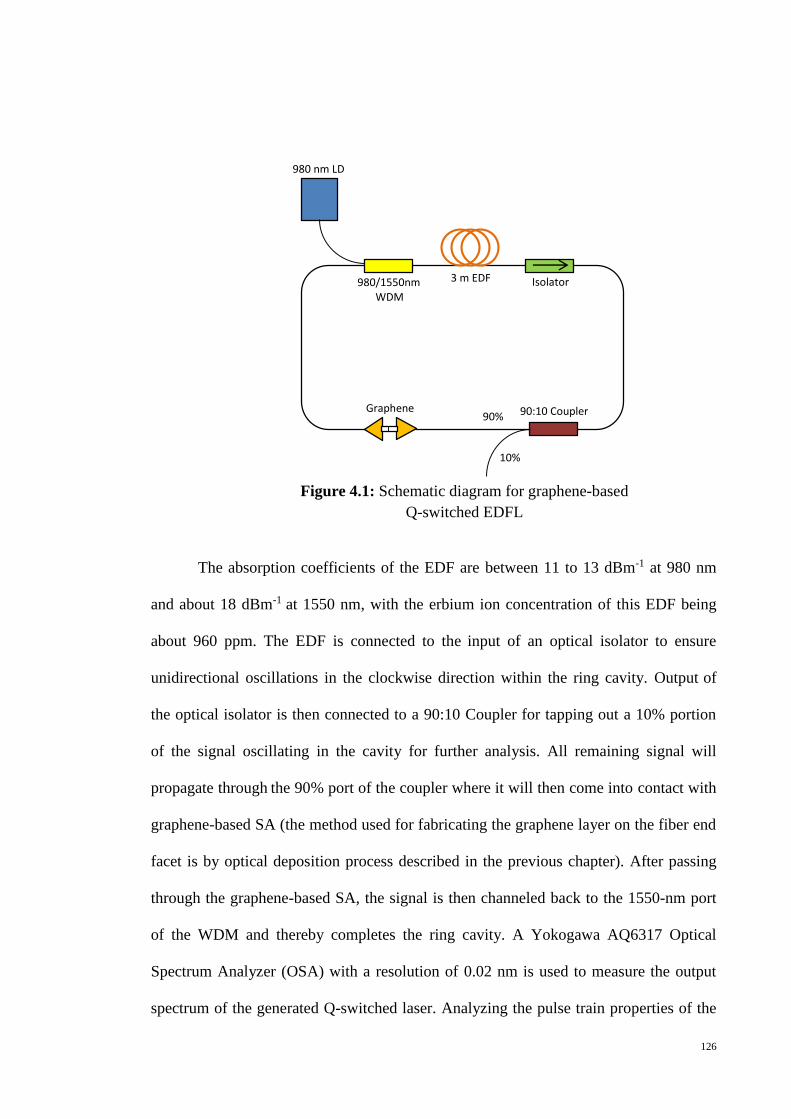
126
The absorption coefficients of the EDF are between 11 to 13 dBm-1 at 980 nm
and about 18 dBm-1 at 1550 nm, with the erbium ion concentration of this EDF being
about 960 ppm. The EDF is connected to the input of an optical isolator to ensure
unidirectional oscillations in the clockwise direction within the ring cavity. Output of
the optical isolator is then connected to a 90:10 Coupler for tapping out a 10% portion
of the signal oscillating in the cavity for further analysis. All remaining signal will
propagate through the 90% port of the coupler where it will then come into contact with
graphene-based SA (the method used for fabricating the graphene layer on the fiber end
facet is by optical deposition process described in the previous chapter). After passing
through the graphene-based SA, the signal is then channeled back to the 1550-nm port
of the WDM and thereby completes the ring cavity. A Yokogawa AQ6317 Optical
Spectrum Analyzer (OSA) with a resolution of 0.02 nm is used to measure the output
spectrum of the generated Q-switched laser. Analyzing the pulse train properties of the
980 nm LD
980/1550nm WDM
3 m EDF Isolator
90:10 Coupler 90% Graphene
10%
Figure 4.1: Schematic diagram for graphene-based
Q-switched EDFL

127
Q-switched pulses makes use of an oscilloscope (LeCroy 352A) together with an
Agilent 83440C Lightwave Detector for optical to electrical conversion in place of the
OSA.
The input-output characterization of this graphene-based Q-switched EDFL is
firstly carried out to investigate the relationship between the average output power and
the pump power of the 980 nm LD. The pump power of the 980 nm LD is adjusted by
incrementally increasing its drive current. Average output power is measured using an
integrating sphere that collectively gathers all the proposed laser outputs, and the result
is plotted in Figure 4.2. After reaching the lasing threshold of about 9.3 mW, the
average output power increases linearly with respect to the pump power, having a
gradient of 0.015 and with an increment of about 0.3 mW for every 10 mW rise in pump
power. In the initial stages of operation, the system operates in the CW mode below a
pump power of about 18.4 mW and functions as a Q-switched pulsed fiber laser above
this power level. The maximum average output power is approximately 1.5 mW, which
is obtained at the highest pump power of 100.4 mW. It can be seen from the plotted
graph that no pump saturation is observed even if the pump power is increased to
100.44 mW, leading to the prediction that increasing the pump power above 100.4 mW
can further increase the output power. However, due to the limitation of the pump laser,
the output power characteristics for the pump power exceeding 100.4 mW is not
demonstrated.
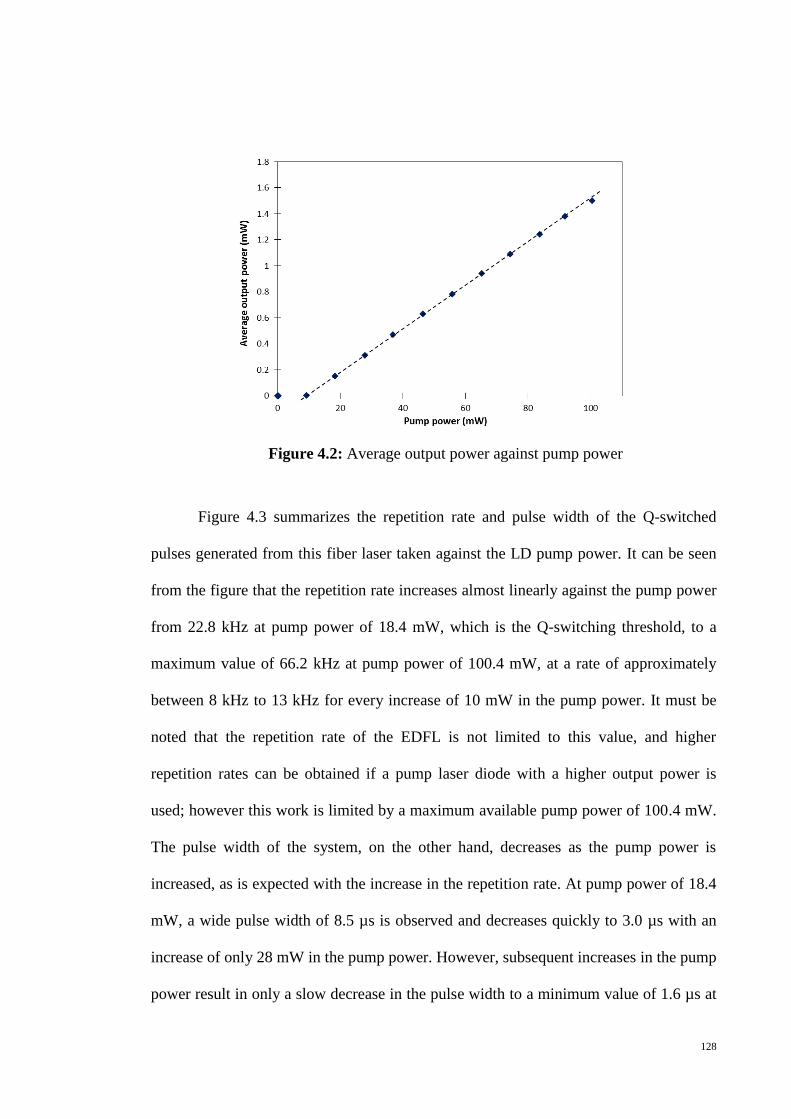
128
Figure 4.2: Average output power against pump power
Figure 4.3 summarizes the repetition rate and pulse width of the Q-switched
pulses generated from this fiber laser taken against the LD pump power. It can be seen
from the figure that the repetition rate increases almost linearly against the pump power
from 22.8 kHz at pump power of 18.4 mW, which is the Q-switching threshold, to a
maximum value of 66.2 kHz at pump power of 100.4 mW, at a rate of approximately
between 8 kHz to 13 kHz for every increase of 10 mW in the pump power. It must be
noted that the repetition rate of the EDFL is not limited to this value, and higher
repetition rates can be obtained if a pump laser diode with a higher output power is
used; however this work is limited by a maximum available pump power of 100.4 mW.
The pulse width of the system, on the other hand, decreases as the pump power is
increased, as is expected with the increase in the repetition rate. At pump power of 18.4
mW, a wide pulse width of 8.5 µs is observed and decreases quickly to 3.0 µs with an
increase of only 28 mW in the pump power. However, subsequent increases in the pump
power result in only a slow decrease in the pulse width to a minimum value of 1.6 µs at

129
a rate of less than 0.6 µs for every increase of 10 mW in the pump power, with respect
to the change of pump power from ~46.5 mW to ~100.4 mW.
Figure 4.3: Pulse repetition rate and pulse width against pump power
Figure 4.4 shows the output spectrum of the graphene based Q-switched EDFL
taken from the OSA with a spectral resolution of 0.02 nm at pump power of 100.4 mW.
As can be seen from the figure, the laser spectrum has a considerably broad laser
bandwidth, covering the wavelength range from approximately 1554 nm to 1562 nm at -
50 dBm output power level. The peak wavelength of the spectrum is at about 1558.7
nm, having an output power of about -20.4 dBm. The 3 dB bandwidth of the output
spectrum is 1.8 nm. The factors that probably contribute to the broad laser bandwidth
obtained in this work are due to the multimode oscillations and also the emission of
photons at long wavelength [6]. Besides that, it has been reported that the extremely
large normal dispersion of graphene is also a contributing factor to the broadening of the
laser bandwidth [7].
0
2
4
6
8
10
15
25
35
45
55
65
75
10 30 50 70 90 110
RepetitionratePulse width
Rep
etti
on
rat
e (k
Hz)
Pu
lse
wid
th (
µs)
Pump power (mW)

130
Figure 4.5 shows the train of laser pulses as taken from the oscilloscope,
operating at the same pump power of 100.4 mW, with the repetition rate value of 66.2
kHz. This corresponds to a time interval of 15 µs between the pulses in the pulse train.
Δt in the figure denotes the pulse width value obtained at 100.4 mW pump power,
which is about 1.6 µs. The intensity of the peaks is almost constant at 7.7 mV,
indicating that the output of the laser is adequately stable.
Figure 4.5: Output pulse train of the graphene-based Q-switched EDFL
Figure 4.4: Output spectrum of the graphene-based Q-switched EDFL
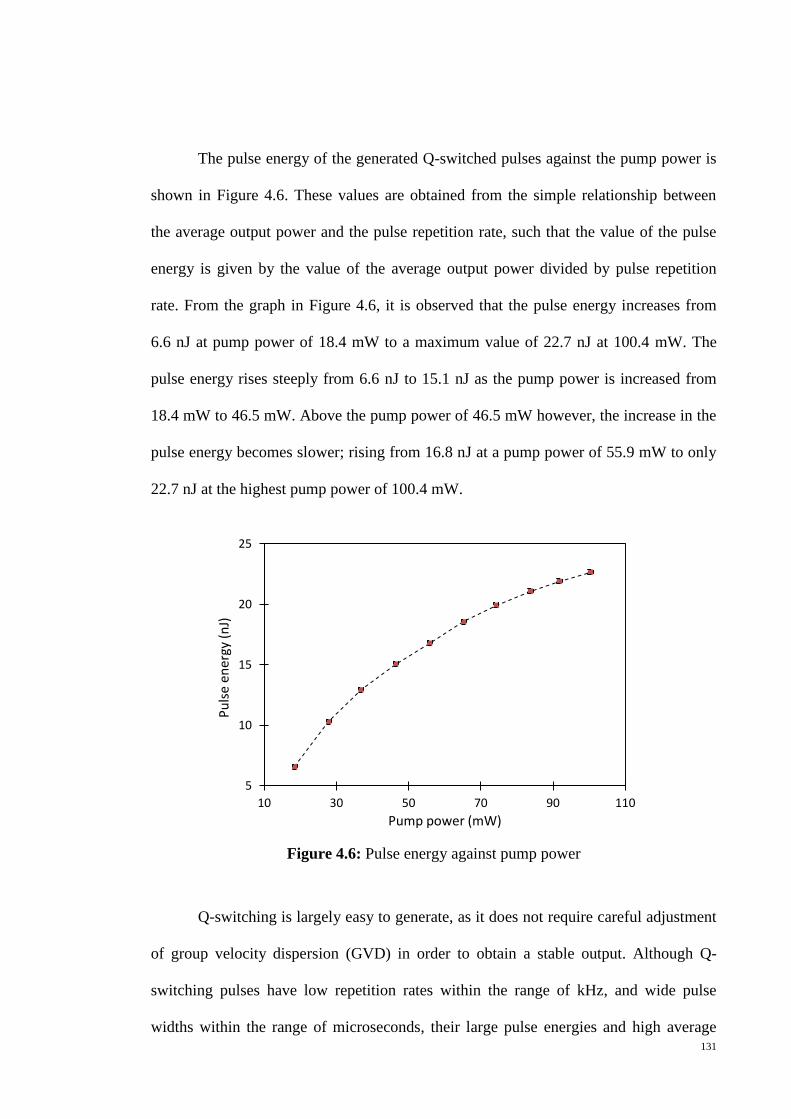
131
The pulse energy of the generated Q-switched pulses against the pump power is
shown in Figure 4.6. These values are obtained from the simple relationship between
the average output power and the pulse repetition rate, such that the value of the pulse
energy is given by the value of the average output power divided by pulse repetition
rate. From the graph in Figure 4.6, it is observed that the pulse energy increases from
6.6 nJ at pump power of 18.4 mW to a maximum value of 22.7 nJ at 100.4 mW. The
pulse energy rises steeply from 6.6 nJ to 15.1 nJ as the pump power is increased from
18.4 mW to 46.5 mW. Above the pump power of 46.5 mW however, the increase in the
pulse energy becomes slower; rising from 16.8 nJ at a pump power of 55.9 mW to only
22.7 nJ at the highest pump power of 100.4 mW.
Figure 4.6: Pulse energy against pump power
Q-switching is largely easy to generate, as it does not require careful adjustment
of group velocity dispersion (GVD) in order to obtain a stable output. Although Q-
switching pulses have low repetition rates within the range of kHz, and wide pulse
widths within the range of microseconds, their large pulse energies and high average
5
10
15
20
25
10 30 50 70 90 110
Pu
lse
ener
gy (
nJ)
Pump power (mW)

132
output powers make them suitable for applications that do not require ultrafast pulses,
such as laser range-finding, materials processing, and optical time-domain
reflectometry.
4.3 Tunable graphene Q-switched EDFLs by employing different wavelength
selective elements
As can be seen from Figure 4.4, a Q-switched fiber laser with no wavelength
selective element produces a broad output laser spectrum. Besides that, the random
selection of the lasing wavelength for a configuration without a selective element would
not fix the lasing wavelength at a certain value, as the output laser will shift to any
wavelength with the lowest threshold power. Two factors influence the wavelength of
the generated laser; the EDF’s gain profile, and the laser threshold power, which is
normally lower at longer wavelength region. If the gain profile of the EDF is consistent
throughout the whole spectrum, the threshold power will be the lowest at the longest
wavelength region. This can be attributed to the fact that the laser generation at longer
wavelengths needs a lower accumulation of energy as compared to that at shorter
wavelength. However, as the homogeneous gain broadening profile in EDF gives the
highest gain at 1539 nm, there is also a possibility for the shorter wavelength region to
have a lower lasing threshold. Therefore, a laser cavity without any wavelength
selective element will possibly generate lasing at any wavelength, depending on the
length of the EDF, the pump power and the portion of the coupler as a feedback used in
the setup. Thus, in order to have the laser operating in the desirable wavelength, a
wavelength selective element has to be inserted inside the laser cavity for controlling
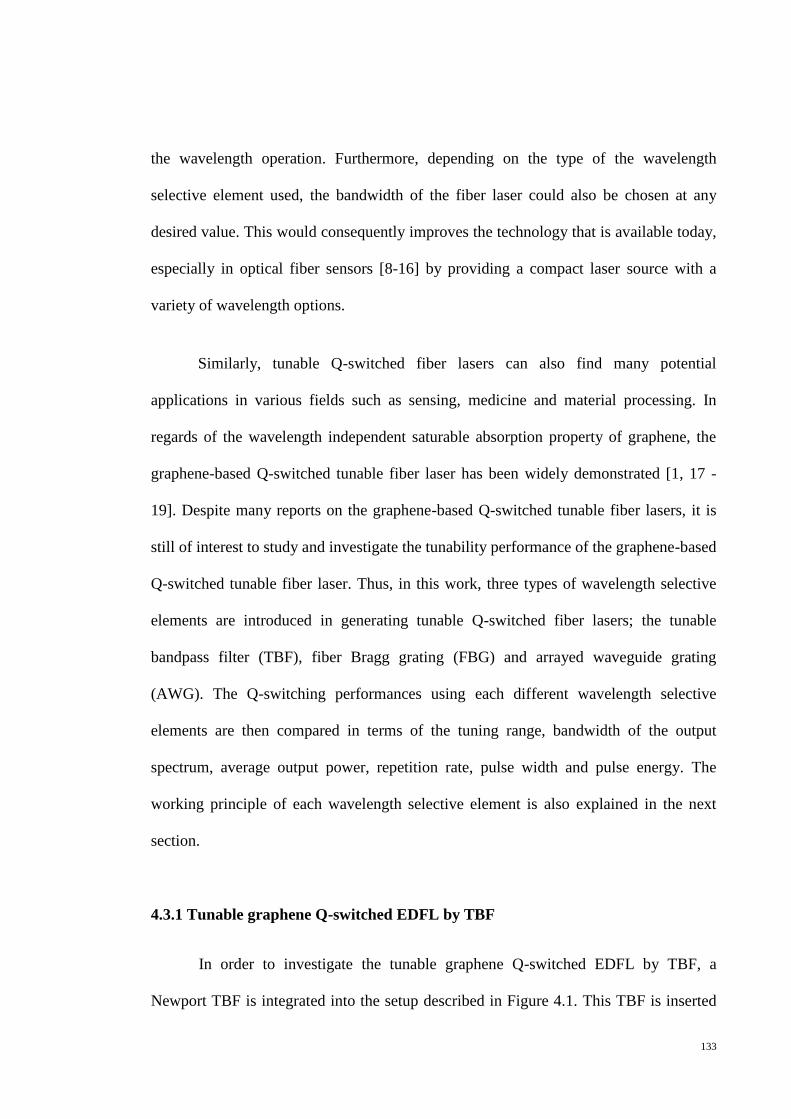
133
the wavelength operation. Furthermore, depending on the type of the wavelength
selective element used, the bandwidth of the fiber laser could also be chosen at any
desired value. This would consequently improves the technology that is available today,
especially in optical fiber sensors [8-16] by providing a compact laser source with a
variety of wavelength options.
Similarly, tunable Q-switched fiber lasers can also find many potential
applications in various fields such as sensing, medicine and material processing. In
regards of the wavelength independent saturable absorption property of graphene, the
graphene-based Q-switched tunable fiber laser has been widely demonstrated [1, 17 -
19]. Despite many reports on the graphene-based Q-switched tunable fiber lasers, it is
still of interest to study and investigate the tunability performance of the graphene-based
Q-switched tunable fiber laser. Thus, in this work, three types of wavelength selective
elements are introduced in generating tunable Q-switched fiber lasers; the tunable
bandpass filter (TBF), fiber Bragg grating (FBG) and arrayed waveguide grating
(AWG). The Q-switching performances using each different wavelength selective
elements are then compared in terms of the tuning range, bandwidth of the output
spectrum, average output power, repetition rate, pulse width and pulse energy. The
working principle of each wavelength selective element is also explained in the next
section.
4.3.1 Tunable graphene Q-switched EDFL by TBF
In order to investigate the tunable graphene Q-switched EDFL by TBF, a
Newport TBF is integrated into the setup described in Figure 4.1. This TBF is inserted
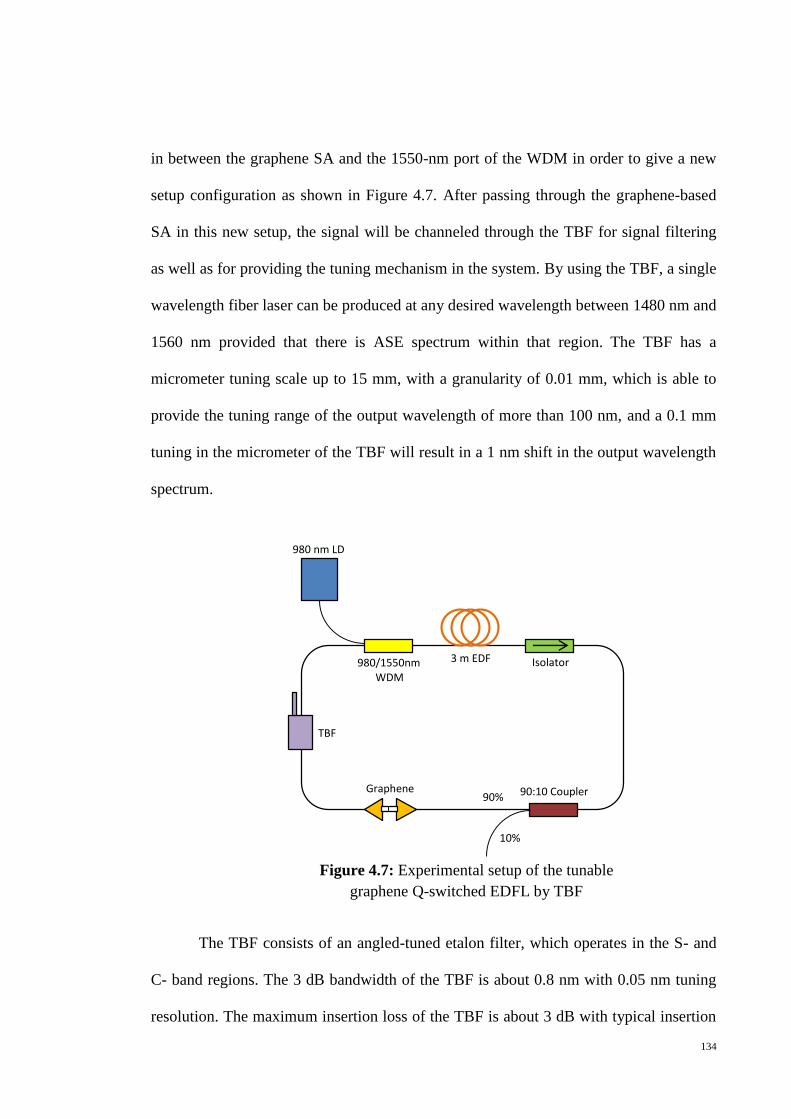
134
in between the graphene SA and the 1550-nm port of the WDM in order to give a new
setup configuration as shown in Figure 4.7. After passing through the graphene-based
SA in this new setup, the signal will be channeled through the TBF for signal filtering
as well as for providing the tuning mechanism in the system. By using the TBF, a single
wavelength fiber laser can be produced at any desired wavelength between 1480 nm and
1560 nm provided that there is ASE spectrum within that region. The TBF has a
micrometer tuning scale up to 15 mm, with a granularity of 0.01 mm, which is able to
provide the tuning range of the output wavelength of more than 100 nm, and a 0.1 mm
tuning in the micrometer of the TBF will result in a 1 nm shift in the output wavelength
spectrum.
The TBF consists of an angled-tuned etalon filter, which operates in the S- and
C- band regions. The 3 dB bandwidth of the TBF is about 0.8 nm with 0.05 nm tuning
resolution. The maximum insertion loss of the TBF is about 3 dB with typical insertion
980 nm LD
980/1550nm WDM
3 m EDF
10%
Isolator
Figure 4.7: Experimental setup of the tunable
graphene Q-switched EDFL by TBF
90:10 Coupler 90%
TBF
Graphene

135
loss of 1.5 dB, and the back reflection is about -50 dB. These characteristics make the
TBF a reliable wavelength selector. A schematic diagram of the fiber-coupled TBF is
shown in Figure 4.8 (a). The beam from a single mode fiber (SMF) firstly passes
through a collimator, and next travels through a free space region where it encounters a
Fabry-Perot etalon that acts as a filter. The propagating beam is then recoupled into the
second collimator before entering the second SMF. The Fabry-Perot etalon filter is
mounted on a rotational stage. The incident angle of the propagating beam can be
adjusted by rotating the Fabry-Perot etalon, thus allowing for the selection of particular
wavelength. In this regards, any desired wavelength within the operation region of the
TBF can be selected by tuning the high precision micrometer of the TBF that in turn
will rotate the Fabry-Perot etalon.
Figure 4.8: (a) An illustrative layout of the fiber coupled angle-tuned Fabry-Perot
etalon and (b) propagation of light through the Fabry-Perot etalon
(a)
(b)
Fabry-Perot etalon
SMF SMF
Rotation stage
Collimated
beam lensed
connector
Collimated
beam lensed
connector

136
Figure 4.8 (b) shows the illustration of the propagating light into the Fabry-Perot
etalon filter. The working principle of the TBF is adapted from the concept of Fabry-
Perot interferometer as explained by Frankel et. al [20]. Changing the incident angle of
the beam allows wavelength selection, and this can be obtained by the following
expression [20]
λ = (2𝑛𝐿
𝑚) (cos 𝜃)
where L is the thickness of the etalon filter, m is an integer, n is the refractive index of
the etalon, λ is the wavelength of interest and 𝜃 is the angle between the incident beam
and the normal axis.
Figure 4.9 (a) shows the output spectra of the wavelength tunable graphene-
based Q-switched EDFL for 13 tuned wavelengths at the wavelength interval of 5 nm
taken from the OSA at the pump power of ~100.4 mW. The tuning range of the laser
output carrying the Q-switching pulses covers a wide wavelength range of 58 nm, which
spans from 1512.5 nm to 1570.5 nm and this is not limited as the tuning range of the
TBF can exceed 100 nm. However, the wavelength tuning of the laser output is also
limited as a result of the limitation of the ASE spectrum of the EDF itself. Ref. [1]
reported a wideband-tunable Q-switched fiber laser exploiting a graphene saturable
absorber, within the wavelength range of 1522 to 1555 nm (33 nm wavelength tuning).
Ref. [17] demonstrated a tunable range from 1522 nm to 1568 nm (46 nm wavelength
tuning). Ref. [18] achieved wider band tunability with passively graphene-based Q-
switched fiber laser that covers a wavelength range of about 50.6 nm. Ref. [19] in
contrast only obtained a tuning range of 10 nm, covering the wavelength range from
1547.66 nm to 1557.66 nm. Thus, the tuning range achieved in this experiment is much
4.1
137
wider compared to the tuning range achieved in those reported works. The maximum
output power of -6.9 dBm is observed at the wavelength of 1570.5 nm whereas the
minimum output power of -13.9 dBm is observed at the wavelength of 1512.5 nm, with
an output power difference of about 7 dB. The dashed blue trace in the figure indicates
the output spectrum without the TBF inside the cavity, with a peak wavelength of
1558.7 nm and an output power of -20.4 dBm. Figure 4.9 (b) shows the zoom in view of
the output spectra taken at a wavelength interval of 1 nm. A 0.1 mm tuning in the TBF
scale will result in a 1 nm shift in the output wavelength spectrum. As the TBF can be
tuned manually from the smallest scale of 0.01 mm, the wavelength shift is dependent
on the user. By careful tuning of the TBF, a smaller wavelength shift of less than 0.5 nm
could be attained.
-75
-65
-55
-45
-35
-25
-15
-5
1500 1510 1520 1530 1540 1550 1560 1570 1580
1570.5 nm
1567.5 nm
1562.5 nm
1557.5 nm
1552.5 nm
1547.5 nm
1542.5 nm
1537.5 nm
1532.5 nm
1527.5 nm
1522.5 nm
1517.5 nm
1512.5 nm
Ou
tpu
t p
ow
er (
dB
m)
Wavelength (nm)
(a)

138
Figure 4.9: (a) Output spectra of the wavelength tunable graphene-based
Q-switched EDFL taken at a wavelength interval of 5 nm,
(b) the zoom in view of the output spectra taken at interval of 1 nm
The variation of the repetition rate at different wavelengths by tuning the TBF is
also investigated in this work, with the pump power fixed at 100.4 mW. The result is as
shown in Figure 4.10. Corresponding to the wavelength range of the output spectrum
with the Q-switched pulse operation as shown in Figure 4.9 (a), the repetition rate of the
graphene-based Q-switched pulses is measured from the wavelength of 1512.5 nm to
1570.5 nm. From Figure 4.9, it can be seen that graphene-based SA could provide the
Q-switched pulse operation over a wide wavelength range. From the figure, it can also
be seen that the relationship between the repetition rate and the wavelength follows the
pattern of the ASE spectrum of the EDF itself. Ref. [18] explained that the gain
difference of the EDF as well as the insertion loss of the filter vary across the
wavelength, which will consequently cause a change in the repetition rate at different
-63
-53
-43
-33
-23
-13
-3
1544 1546 1548 1550 1552 1554
1552.5 nm
1551.5 nm
1550.5 nm
1549.5 nm
1548.5 nm
1547.5 nm
1546.5 nm
1545.5 nm
Wavelength (nm)
Ou
tpu
t p
ow
er (
dB
m)
(b)
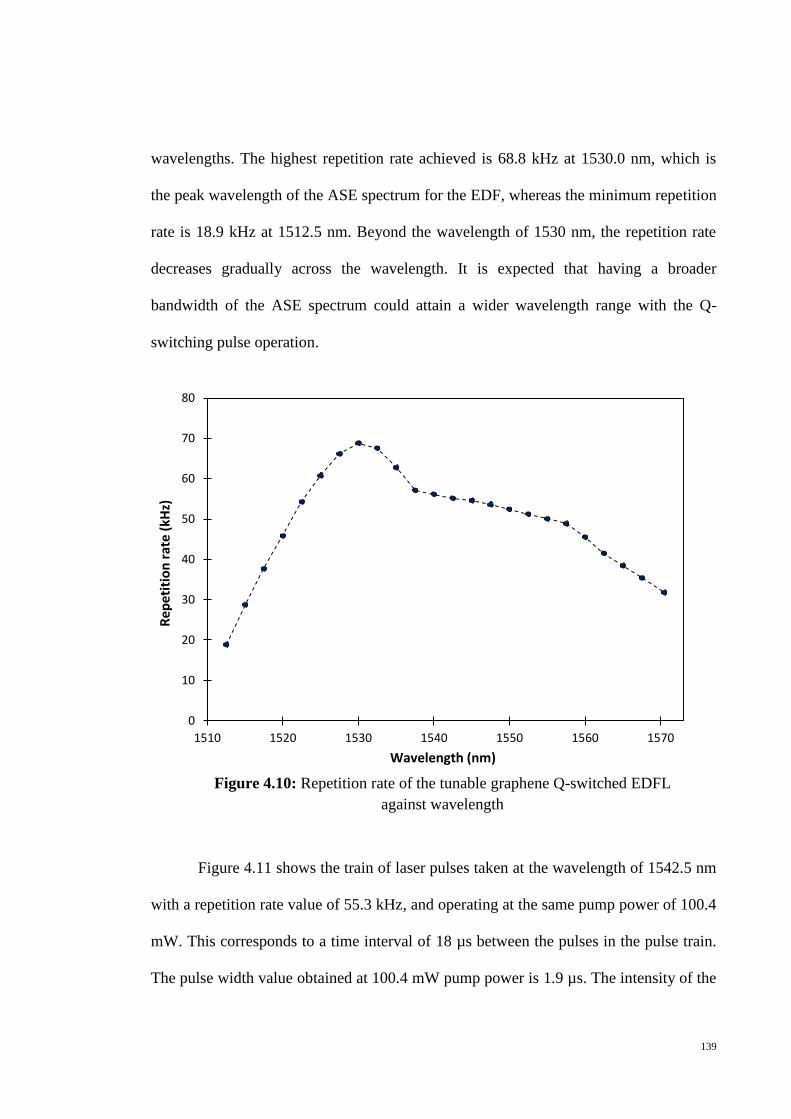
139
wavelengths. The highest repetition rate achieved is 68.8 kHz at 1530.0 nm, which is
the peak wavelength of the ASE spectrum for the EDF, whereas the minimum repetition
rate is 18.9 kHz at 1512.5 nm. Beyond the wavelength of 1530 nm, the repetition rate
decreases gradually across the wavelength. It is expected that having a broader
bandwidth of the ASE spectrum could attain a wider wavelength range with the Q-
switching pulse operation.
Figure 4.11 shows the train of laser pulses taken at the wavelength of 1542.5 nm
with a repetition rate value of 55.3 kHz, and operating at the same pump power of 100.4
mW. This corresponds to a time interval of 18 µs between the pulses in the pulse train.
The pulse width value obtained at 100.4 mW pump power is 1.9 µs. The intensity of the
0
10
20
30
40
50
60
70
80
1510 1520 1530 1540 1550 1560 1570
Re
pe
titi
on
rate
(kH
z)
Wavelength (nm)
Figure 4.10: Repetition rate of the tunable graphene Q-switched EDFL
against wavelength

140
peaks is almost constant at 8.2 mV, indicating that the output of the laser is adequately
stable.
4.3.2 Tunable graphene Q-switched EDFL by AWG
The AWG, a silica-based waveguide, is also possible to be engaged as the
wavelength selective element as mentioned earlier, and is employed in this work to
produce the tunable graphene Q-switched EDFL. The experimental setup for the tunable
graphene Q-switched EDFL by AWG is shown in Figure 4.12, which has a similar
configuration and components as in the previous setup shown in Figure 4.7 except that
the TBF now is being replaced with the AWG together with an optical channel selector
(OCS). This AWG and the OCS are inserted in between the graphene SA and the 1550-
nm port of the WDM. The AWG consists of 24 channels, which slice the ASE into 24
‘components’ with an inter-channel spacing value of 0.8 nm. The tuning technique is
realized by connecting the AWG to the OCS with the former functioning as a
Figure 4.11: Output pulse train with repetition rate
of 55.3 kHz at 100.4 mW pump power
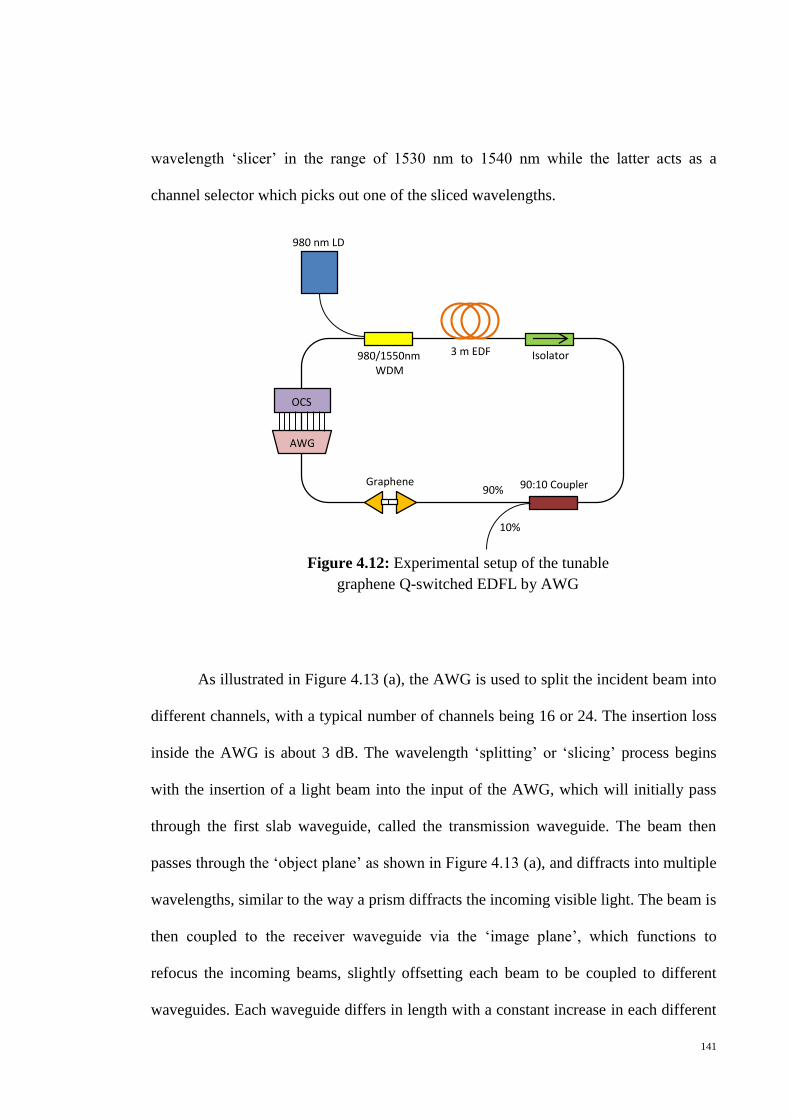
141
wavelength ‘slicer’ in the range of 1530 nm to 1540 nm while the latter acts as a
channel selector which picks out one of the sliced wavelengths.
As illustrated in Figure 4.13 (a), the AWG is used to split the incident beam into
different channels, with a typical number of channels being 16 or 24. The insertion loss
inside the AWG is about 3 dB. The wavelength ‘splitting’ or ‘slicing’ process begins
with the insertion of a light beam into the input of the AWG, which will initially pass
through the first slab waveguide, called the transmission waveguide. The beam then
passes through the ‘object plane’ as shown in Figure 4.13 (a), and diffracts into multiple
wavelengths, similar to the way a prism diffracts the incoming visible light. The beam is
then coupled to the receiver waveguide via the ‘image plane’, which functions to
refocus the incoming beams, slightly offsetting each beam to be coupled to different
waveguides. Each waveguide differs in length with a constant increase in each different
Figure 4.12: Experimental setup of the tunable
graphene Q-switched EDFL by AWG
980 nm LD
980/1550nm WDM
3 m EDF Isolator
90:10 Coupler 90% Graphene
10%
AWG
OCS
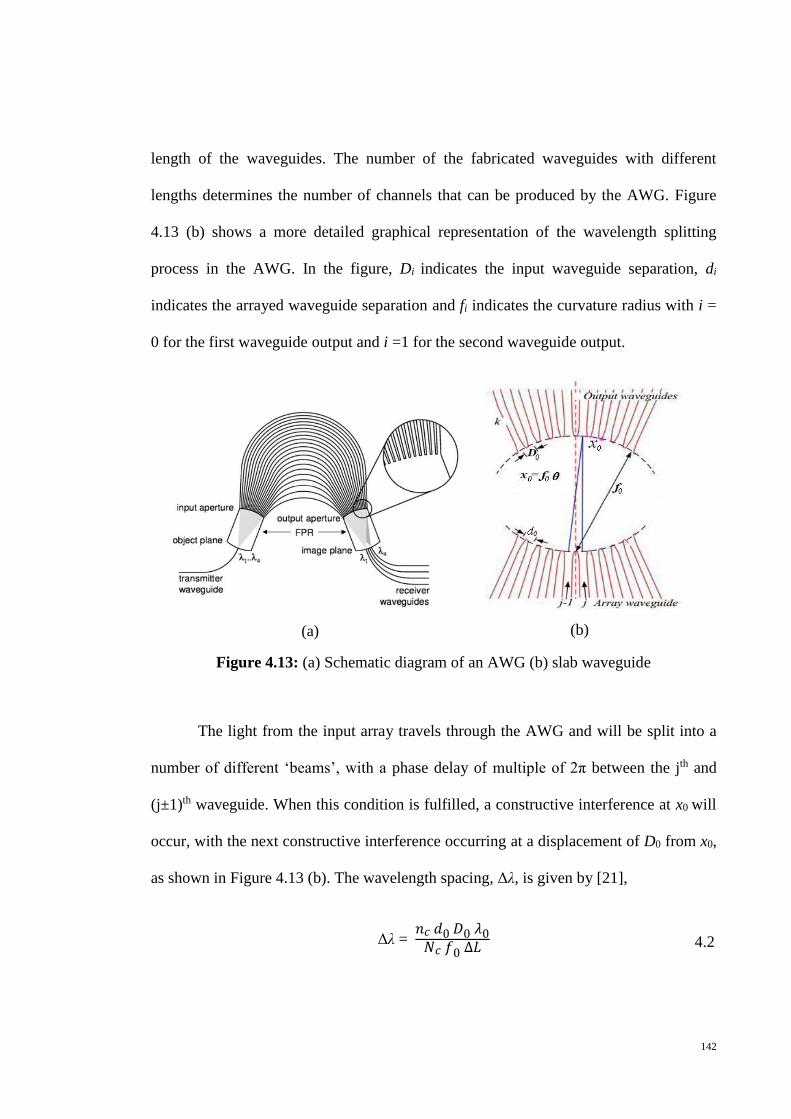
142
length of the waveguides. The number of the fabricated waveguides with different
lengths determines the number of channels that can be produced by the AWG. Figure
4.13 (b) shows a more detailed graphical representation of the wavelength splitting
process in the AWG. In the figure, Di indicates the input waveguide separation, di
indicates the arrayed waveguide separation and fi indicates the curvature radius with i =
0 for the first waveguide output and i =1 for the second waveguide output.
Figure 4.13: (a) Schematic diagram of an AWG (b) slab waveguide
The light from the input array travels through the AWG and will be split into a
number of different ‘beams’, with a phase delay of multiple of 2π between the jth and
(j±1)th waveguide. When this condition is fulfilled, a constructive interference at x0 will
occur, with the next constructive interference occurring at a displacement of D0 from x0,
as shown in Figure 4.13 (b). The wavelength spacing, Δλ, is given by [21],
Δλ = 𝑛𝑐 𝑑0 𝐷0 𝜆0
𝑁𝑐 𝑓0 ∆𝐿
4.2
(a) (b)

143
where Nc is the group index and nc is the core refractive index inside the arrayed
waveguide. From equation 4.2, it can be deduced that the larger the length difference,
ΔL between each neighboring waveguide, the smaller the wavelength spacing that can
be produced by the AWG.
Figure 4.14 (a) shows the output spectra of the tunable graphene Q-switched
EDFL by AWG for 7 tuned wavelengths at the wavelength interval of approximately 3
nm taken from the OSA at the pump power of ~100.4 mW, whereas Figure 4.14 (b)
shows the zoom in view of the output spectra. The tuning range of the laser output
carrying the Q-switching pulses spans from 1527.4 nm, which is taken at the 1st channel
of the AWG to 1545.5 nm, which is taken at the 24th channel of the AWG. This gives a
wavelength tuning range of 18.1 nm. In this case, the number of channels available in
the AWG limits the wavelength selection of the laser output. The maximum output
power of -3.1 dBm is observed at the wavelength of 1532.9 nm whereas the minimum
output power of -3.9 dBm is observed at the wavelength of 1527.4 nm, with an output
power difference of only 0.8 dB.

144
Figure 4.14: (a) Output spectra of the tunable graphene Q-switched
EDFL by AWG taken at wavelength interval of ~ 3 nm,
(b) the zoom in view of the output spectra.
Figure 4.15 shows the variation of the repetition rate at different wavelengths by
selecting different channels of the AWG with the pump power fixed at 100.4 mW. The
repetition rate is measured from the wavelength of 1527.4 nm (1st channel of AWG) to
-75
-65
-55
-45
-35
-25
-15
-5
5
1500 1510 1520 1530 1540 1550 1560 1570 1580
1527.4 nm
1529.7 nm
1532.9 nm
1536.0 nm
1539.2 nm
1542.3 nm
1545.5 nm
Wavelength (nm)
Ou
tpu
t p
ow
er (
dB
m)
-62
-52
-42
-32
-22
-12
-2
8
1525 1529 1533 1537 1541 1545
1527.4 nm
1529.7 nm
1532.9 nm
1536.0 nm
1539.2 nm
1542.3 nm
1545.5 nm
Wavelength (nm)
Ou
tpu
t p
ow
er
(dB
m)
(a)
(b)

145
1545.5 nm (24th channel of AWG). From the graph, it can be seen that the relationship
between the repetition rate and the wavelength follows the pattern of the ASE spectrum
of the EDF, similar to the graph obtained by using the FBG as shown in Figure 4.10.
The other factor influencing the variation of the repetition rate across the wavelength is
the variation of the insertion loss of the filter at different wavelengths. The highest
repetition rate achieved is 63.4 kHz at 1531.4 nm, which is the peak wavelength of the
ASE spectrum for the EDF, whereas the minimum repetition rate is 48.3 kHz at 1545.5
nm.
Figure 4.16 shows the train of laser pulses taken at the wavelength of 1542.4 nm,
operating at the same pump power of 100.4 mW, with the repetition rate and pulse
width value of 49.8 kHz and 3.2 µs respectively. The time interval between the pulses in
the pulse train is 20 µs. The intensity of the peaks is almost constant at 22 mV,
indicating that the output of the laser is adequately stable.
30
35
40
45
50
55
60
65
70
75
80
1525 1530 1535 1540 1545
Re
pe
titi
on
rate
(kH
z)
Wavelength (nm)
Figure 4.15: Repetition rate of the tunable graphene Q-switched
by AWG against wavelength

146
4.3.3 Tunable graphene Q-switched EDFL by FBG
Besides TBF and AWG, another type of wavelength selective element that is
mentioned earlier and used in this work is FBG. The experimental setup for the tunable
graphene Q-switched EDFL by FBG is shown in Figure 4.17. In this setup, the FBG is
inserted in between the graphene SA and the 1550 nm port of the WDM through an
optical circulator (OC), such that Port 1 of the OC is connected to the output of the
graphene SA, Port 2 of the OC is connected to the FBG, and Port 3 of the OC is
connected back to the 1550 nm port of the WDM. The wavelength tuning is realized by
applying mechanical stress or compression to the FBG, so as to shift the reflected
wavelength of the FBG.
Figure 4.16: Output pulse train with repetition rate
of 49.8 kHz at 100.4 mW pump power

147
Figure 4.17: Experimental setup of the tunable graphene
Q-switched EDFL by FBG
An FBG is a fiber based device with a series of periodic variations of the
effective refractive index in the core of an optical fiber, such that a wavelength specific
dielectric mirror is generated. This mirror allows the FBG to act as an optical filter or as
a wavelength-specific reflector [22, 23]. The length of the periodic variation in the FBG
is typically a few millimeters or centimeters. The basic equation that gives the central
wavelength of the FBG can be expressed as [24]
𝜆𝐵 = 2 𝑛𝑒𝑓𝑓 𝛬
where λB is the central wavelength or the reflected wavelength of the FBG, which is also
called Bragg wavelength, neff is the effective refractive index of the fiber core and Λ is
the grating period. Thus, from this equation, it can be deduced that the central
wavelength reflected by the FBG is determined by the grating period Λ of the FBG.
4.3
980 nm LD
980/1550nm WDM
3 m EDF Isolator
90:10 Coupler 90% Graphene
10%
TFBG
OC
1
2 3

148
In general, the reflectivity of the FBG is typically between 80% and 99%. The
illustration of the FBG with the periodic gratings is shown in Figure 4.18.
Figure 4.18: An illustration of the gratings inside the FBG [24]
To create the wavelength tuning mechanism of the FBG, one of the approaches
that can be taken is to apply some physical change to the FBG as to allow for the change
of the grating period. FBGs can be bent and compressed by virtue of their structure as
fibers. The central reflected frequency of the FBG can be tuned by inducing stresses on
the fiber, either via compression or contraction. This will then induce a change on the
axial strain 𝜀Z across the grating with the shift in the reflected wavelength of the FBG
given by [25, 26]
∆ 𝜆 = (1 − 𝜌𝑒)𝜀𝑧𝜆𝐵
where ρe = 0.22 is the photo-elastic coefficient and λB is the Bragg wavelength without
any stress induction. The strain given to the FBGs can be predicted by the equation [25]
𝜀𝑧(𝑅) = ± 𝑑
𝑅
PT
PB
PI
4.4
4.5

149
where R is the hybrid material bending radius. The negative and positive signs represent
the compression and traction mode respectively, while d is the length between the
epicenter axes of the substrate to the FBG. Applying different compressive or tensile
force to the gratings changes the grating period of the FBG accordingly, and thereby
provide different wavelength shifts. A shift changes the reflected wavelength and
effectively confers tunability to the system. This is illustrated in Figure 4.19 [27]
Figure 4.19: Schematic of wavelength shift
by applying strain to the FBG [27]
In order to control the tuning operation, the FBG has to be mounted on a hybrid
material, which, in this case, is comprised of Perspex, a material with a low Young’s
modulus, and a spring made of steel, a material with a high Young’s modulus. This
design allows for the increase in the efficiency of the bending moment, since a single
solid substrate has a higher bending moment [25]. Utilizing materials with two different
Young’s modulus allows the ability to increase the capability of tuning the length
between the epicenter axes of the substrate to the FBG. The design is as illustrated in
Figure 4.20.

150
Figure 4.20: An FBG embedded on a Hybrid-material substrate [25].
The mounted FBG on the hybrid-material substrate is then integrated into a
movable block, which is specially designed for providing the tuning mechanism of the
FBG. By rotating the screw of the movable block, a compressive strain will be induced
on the FBG as illustrated in Figure 4.21. In this way, the grating period of the FBG will
experience some change and hence result in a wavelength shift of the reflected
wavelength of the FBG.
Figure 4.22 shows the output spectra of the tunable graphene Q-switched EDFL
by FBG for 11 tuned wavelengths at the wavelength interval of approximately 1 nm
taken from the OSA at pump power of ~100.4 mW. The tuning range of the laser output
carrying the Q-switching pulses covers a wavelength range of 10 nm, which spans from
1547.4 nm to 1557.4 nm. In this case, the wavelength tuning of the laser output is
limited by the tuning design of the FBG. The maximum output power of -6.0 dBm is
(a) (b)
Figure 4.21: Schematic layout of the tunable FBGs (a) in normal conditions, i.e.
without induced stress and, (b) when stress is induced by rotating the screw

151
observed at the wavelength of 1551.4 nm whereas the minimum output power of -6.9
dBm is observed at the wavelength of 1547.4 nm, with an output power difference of
only 0.9 dB.
Figure 4.22: Output spectra of the tunable graphene Q-switched EDFL
by FBG at wavelength interval of ~1 nm
Figure 4.23 shows the variation of the repetition rate at different wavelengths
from 1547.4 nm to 1557.4 nm by tuning the FBG with the pump power fixed at 100.4
mW. It can be seen from the figure that the repetition rate becomes lower as the
wavelength is tuned towards the longer wavelengths. The highest repetition rate
obtained is 43.2 kHz at the wavelength of 1547.4 nm and this rate decreases gradually
across the wavelength range to a value of 39.5 kHz at the wavelength of 1557.4 nm. As
reported in [18], the gain difference of the EDF as well as the insertion loss in the cavity
varies with wavelength, which will affect the cavity loss and consequently causes the
change in the repetition rate at different wavelengths.
-56.5
-46.5
-36.5
-26.5
-16.5
-6.5
1546.5 1548.5 1550.5 1552.5 1554.5 1556.5 1558.5
1547.4 nm
1548.4 nm
1549.4 nm
1550.4 nm
1551.4 nm
1552.4 nm
1553.4 nm
1554.5 nm
1555.4 nm
1556.4 nm
1557.4 nm
Ou
tpu
t p
ow
er(d
Bm
)
Wavelength (nm)

152
Figure 4.24 shows the train of laser pulses taken at the wavelength of 1551.4 nm,
operating at the same pump power of 100.4 mW, with the repetition rate value of 42.4
kHz. This corresponds to a time interval of 23.6 µs between the pulses in the pulse train.
The pulse width value obtained at 100.4 mW pump power is 2.3 µs. The intensity of the
peaks is almost constant at 17.5 mV, indicating that the output of the laser is adequately
stable.
37
38
39
40
41
42
43
44
45
1545 1547 1549 1551 1553 1555 1557 1559
Re
pet
itio
nra
te (
kHz)
Wavelength (nm)
Figure 4.24: Output pulse train with repetition rate of
42.4 kHz at 100.4 mW pump power
Figure 4.23: Repetition rate of the tunable graphene Q-switched
by FBG against wavelength

153
4.3.4 Comparison of the Q-switched output performance between different
wavelength selective elements
Figure 4.25 shows the combined graph of repetition rate against wavelength for
different wavelength selective elements described in the previous section, together with
the device lacking a wavelength selective element for comparison purposes. As can be
seen from the figure, the widest tuning range of 58 nm is achieved by using the TBF as
the wavelength selective element, followed by the AWG and FBG respectively, with the
respective wavelength range of about 18 nm and 10 nm. Within the same wavelength
range, the highest repetition rate value is also acquired by using the TBF compared to
that of the AWG and the FBG.
0
10
20
30
40
50
60
70
80
1510 1520 1530 1540 1550 1560 1570
WithoutfilterFBG
AWG
TBFRe
pet
itio
nra
te (
kHz)
Wavelength (nm)
Figure 4.25: Combined graph of repetition rate against wavelength
for different wavelength selective elements

154
Figure 4.26 shows the Q-switched output spectra for every wavelength selective
element used in this work, which are combined in a single graph for comparison
purpose in terms of the bandwidth, signal-to-noise ratio (SNR) and peak power. As can
be seen from the figure, the TBF gives the widest output bandwidth, with a 3 dB
bandwidth of about 0.13 nm, followed by FBG and AWG, with the respective 3 dB
bandwidth of 0.09 nm and 0.04 nm. On the other hand, the SNR value of 57.2 dB
acquired using the AWG outperforms the other elements, whereas for the TBF and the
FBG, the SNR values are 52.5 dB and 49.4 dB respectively. As for the case of peak
power, the highest value of -3.2 dBm is obtained by using AWG, followed by FBG and
TBF with peak power values of about -6.0 dBm and -8.8 dBm respectively.
Figure 4.26: Combined graph of the Q-switched output spectrum
for different wavelength selective elements
-65
-55
-45
-35
-25
-15
-5
1541.1 1541.5 1541.9 1542.3 1542.7 1543.1 1543.5
AWG
FBG
TBF
Ou
tpu
t p
ow
er (
dB
m)
Wavelength (nm)

155
Figure 4.27 shows the average output power against the pump power for all the
wavelength selective elements used, together with the device results when not
employing a wavelength selective element. All graphs show a similar linear relationship
between the average output power and pump power, which only differ in terms of the
slope efficiency. As such, the highest slope efficiency with a value of 1.65% is obtained
by not employing any optical filter, followed by using the TBF with the slope efficiency
of 1.59 %, the AWG with the slope efficiency of 1.53 % and the FBG with the slope
efficiency of 1.49 %. By using the TBF, the maximum average output power achievable
is 1.43 mW, which is slightly higher than that of the AWG and FBG with maximum
average output powers of 1.34 and 1.28 mW respectively. As for the lasing threshold,
the values given by using the TBF, AWG and FBG are about 11.0 mW, 13.3 mW and
14.5 mW respectively.
Figure 4.27: Combined graph of average output power against pump power
0
0.2
0.4
0.6
0.8
1
1.2
1.4
1.6
1.8
0 20 40 60 80 100
FBG
AWG
TBF
Withoutfilter
Pump power (mW)
Ave
rage
ou
tpu
t p
ow
er (
mW
)
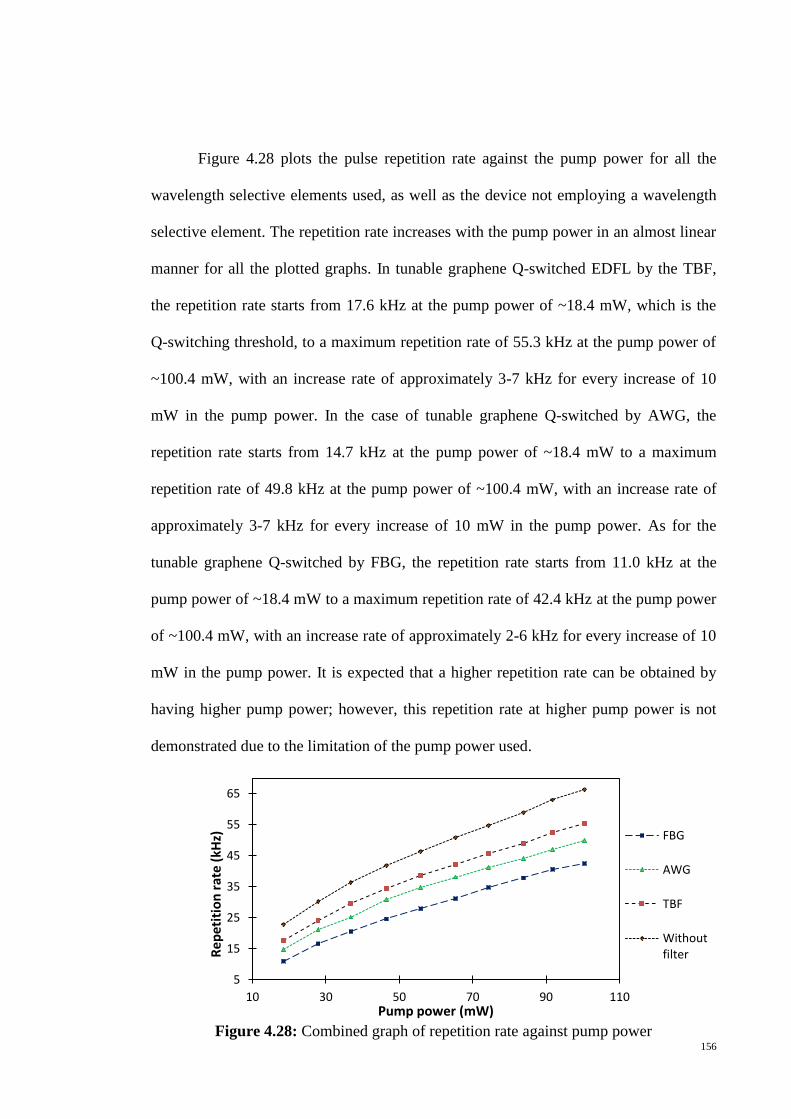
156
Figure 4.28 plots the pulse repetition rate against the pump power for all the
wavelength selective elements used, as well as the device not employing a wavelength
selective element. The repetition rate increases with the pump power in an almost linear
manner for all the plotted graphs. In tunable graphene Q-switched EDFL by the TBF,
the repetition rate starts from 17.6 kHz at the pump power of ~18.4 mW, which is the
Q-switching threshold, to a maximum repetition rate of 55.3 kHz at the pump power of
~100.4 mW, with an increase rate of approximately 3-7 kHz for every increase of 10
mW in the pump power. In the case of tunable graphene Q-switched by AWG, the
repetition rate starts from 14.7 kHz at the pump power of ~18.4 mW to a maximum
repetition rate of 49.8 kHz at the pump power of ~100.4 mW, with an increase rate of
approximately 3-7 kHz for every increase of 10 mW in the pump power. As for the
tunable graphene Q-switched by FBG, the repetition rate starts from 11.0 kHz at the
pump power of ~18.4 mW to a maximum repetition rate of 42.4 kHz at the pump power
of ~100.4 mW, with an increase rate of approximately 2-6 kHz for every increase of 10
mW in the pump power. It is expected that a higher repetition rate can be obtained by
having higher pump power; however, this repetition rate at higher pump power is not
demonstrated due to the limitation of the pump power used.
Figure 4.28: Combined graph of repetition rate against pump power
5
15
25
35
45
55
65
10 30 50 70 90 110
FBG
AWG
TBF
Withoutfilter
Pump power (mW)
Re
pet
itio
nra
te (
kHz)
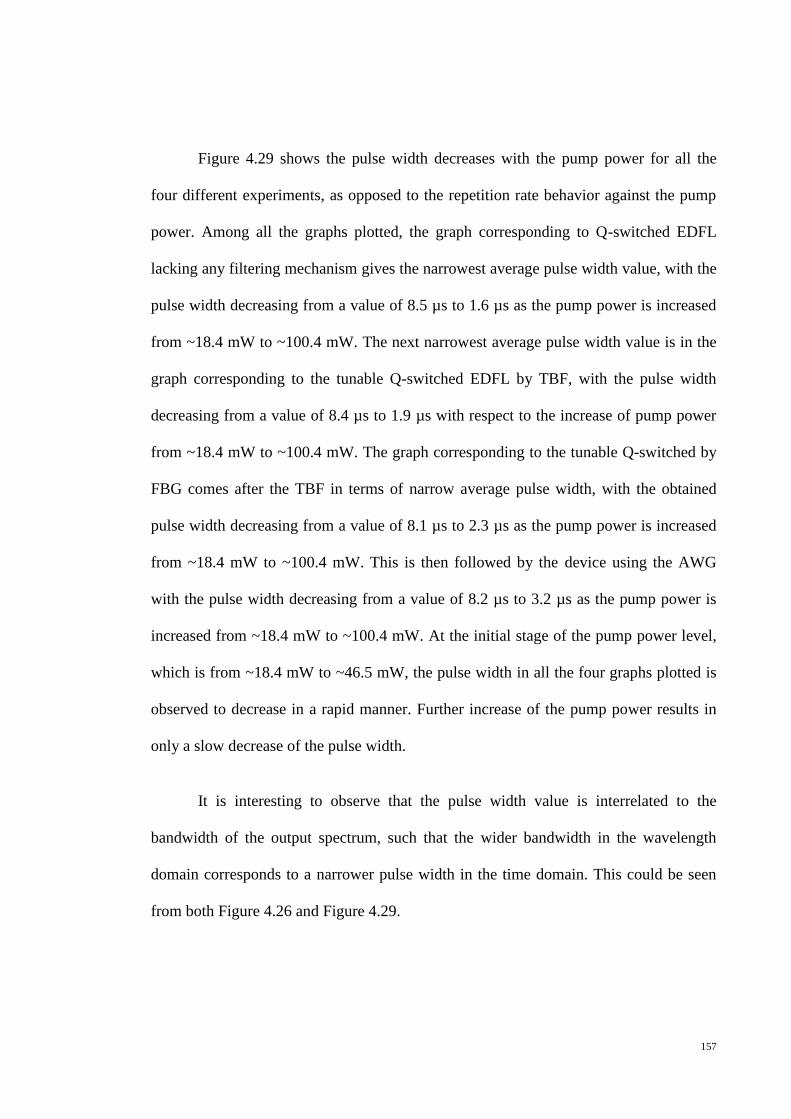
157
Figure 4.29 shows the pulse width decreases with the pump power for all the
four different experiments, as opposed to the repetition rate behavior against the pump
power. Among all the graphs plotted, the graph corresponding to Q-switched EDFL
lacking any filtering mechanism gives the narrowest average pulse width value, with the
pulse width decreasing from a value of 8.5 µs to 1.6 µs as the pump power is increased
from ~18.4 mW to ~100.4 mW. The next narrowest average pulse width value is in the
graph corresponding to the tunable Q-switched EDFL by TBF, with the pulse width
decreasing from a value of 8.4 µs to 1.9 µs with respect to the increase of pump power
from ~18.4 mW to ~100.4 mW. The graph corresponding to the tunable Q-switched by
FBG comes after the TBF in terms of narrow average pulse width, with the obtained
pulse width decreasing from a value of 8.1 µs to 2.3 µs as the pump power is increased
from ~18.4 mW to ~100.4 mW. This is then followed by the device using the AWG
with the pulse width decreasing from a value of 8.2 µs to 3.2 µs as the pump power is
increased from ~18.4 mW to ~100.4 mW. At the initial stage of the pump power level,
which is from ~18.4 mW to ~46.5 mW, the pulse width in all the four graphs plotted is
observed to decrease in a rapid manner. Further increase of the pump power results in
only a slow decrease of the pulse width.
It is interesting to observe that the pulse width value is interrelated to the
bandwidth of the output spectrum, such that the wider bandwidth in the wavelength
domain corresponds to a narrower pulse width in the time domain. This could be seen
from both Figure 4.26 and Figure 4.29.

158
Figure 4.29: Combined graph of pulse width against pump power
Another important characteristic of a Q-switched fiber laser is the pulse energy,
which is calculated based on a simple correlation between the average output power and
the pulse repetition rate. The result of the pulse energy against the pump power for all
four different experiments in this work is shown in Figure 4.30. As can be seen from the
figure, the highest average pulse energy is shown by the graph corresponding to the
tunable Q-switched EDFL by FBG, followed by the one using the AWG, TBF and
without using any optical filter. As the pump power is increased from 18.4 mW to 100.4
mW, the pulse energy increases from 7.3 to 30.2 nJ, 6.1 to 26.9 nJ, 6.8 to 25.8 nJ, and
6.6 to 22.7 nJ for the FBG, AWG, TBF and the one without the optical filter
respectively, with the increment rate getting smaller as the pump power becomes higher.
0
2
4
6
8
10
10 30 50 70 90 110
FBG
AWG
TBF
Withoutfilter
Pump power (mW)
Pu
lse
wid
th (
µs)

159
Figure 4.30: Combined graph of pulse energy against pump power
Table 4.1 summarizes the result of the output performance of the tunable
graphene-based Q-switched EDFL by the TBF, AWG and FBG, as well as the
graphene-based Q-switched EDFL without employing the wavelength selective
element, by considering only the important characteristics of the output laser taken at
the highest pump power of 100.4 mW.

160
Table 4.1: Summarized result of the Q-switched output performance for the different
wavelength selective elements used
Without
filtering
device
Tunable
Bandpass Filter
(TBF)
Arrayed
waveguide
gratings
(AWG)
Tunable Fiber
Bragg gratings
(FBG)
Tuning range
-
58 nm
18 nm
10 nm
Number of
wavelength
options
-
Any
wavelength
within range
24 wavelengths
with 0.8 nm of
adjacent
channel spacing
Any
wavelength
within range
Wavelength
selection
preciseness
-
Moderate
Easy
Moderate
3 dB bandwidth
1.8 nm
0.13 nm
0.04 nm
0.09 nm
Average output
power
1.50 mW
1.43 mW
1.34 mW
1.28 mW
Lasing threshold
9.3 mW
11.0 mW
13.3 mW
14.5 mW
Repetition rate
66.2 kHz
55.3 kHz
49.8 kHz
42.4 kHz
Pulse width
1.6 µs
1.9 µs
3.2 µs
2.3 µs
Pulse energy
22.7 nJ
25.8 nJ
26.9 nJ
30.2 nJ

161
4.4 Graphene Q-switched distributed Bragg reflector (DBR) EDFL
A distributed Bragg reflector (DBR), also known as the Bragg mirror, is a light-
reflecting device based on Bragg reflection from a periodic structure. Correspondingly,
for a DBR fiber laser, the laser resonator is made with at least one distributed Bragg
reflector (DBR) outside the gain medium. In this regard, fiber lasers constructed by the
DBR [28 - 32] are of great interest as compact sources for various applications due to a
short cavity and simple configuration, which enable them to yield a narrow linewidth
laser output [33, 34]. Unlike a distributed feedback (DFB) laser whereby the whole
active medium is embedded in a single distributed reflector structure, the DBR fiber
laser consists of a physically separated gain medium and distributed reflector which
results in a longer laser resonator, though with an advantage of having a robust single-
frequency operation. In addition, Q-switched pulse generation in DBR laser
configuration can also provide a better Q-switching output performance than that of a
DFB fiber laser as it can overcome the problems of laser output instabilities associated
with the grating wavelength drifts which is normally experienced by the DFB lasers due
to the integration of the gain medium and the wavelength selective grating. Compared to
the ordinary Q-switched fiber ring laser that usually has a relatively long cavity, the
short cavity of the DBR fiber laser could also contribute to the generation of stable Q-
switched pulse output due to less multimode noises oscillation in the laser cavity.
Whilst limited reports are available on the generation of Q-switched pulses in DBR
fiber lasers, the technique has remarkable potential for many applications. Ref. [35]
reports a Q-switched pulse generation from a tapered DBR laser, although this approach
is quite difficult and complex, and is not reliable with the recent fiber laser technology
162
and development. In this regard, the application of graphene as a saturable absorber
(SA) will be a very interesting option in the development of a simpler and more
compact Q-switched DBR fiber laser. Such a development also would be of significant
interest in the generation of pulsed fiber lasers for applications that require narrow
linewidth in a simple cavity configuration. A Q-switched erbium doped distributed-
Bragg-reflector DBR fiber laser using graphene as the saturable absorber is developed
and presented in this chapter.
Figure 4.31 shows the experimental setup for the proposed graphene-based Q-
switched DBR laser. The EDF absorption coefficients are between 11 and 13 dBm−1 at
980 nm and about 18 dBm−1 at 1550 nm, with an erbium ion concentration of 960 ppm.
A 980-nm laser diode (LD) is used as the fiber laser pump source and is connected to
the 980-nm port of a wavelength division multiplexer (WDM). The common output of
the WDM is connected to the input port of the FBG, with central wavelength of 1557
nm and reflectivity of about 70%, which is part of the DBR laser cavity and acts as the
‘front mirror’. The FBG output is then connected to the graphene-based SA, which is
formed by using the optical deposition method as described in Chapter 3. In turn, the
output of the graphene-based SA is connected to the 2.7-m-long EDF (Metrogain-12),
which acts as a gain medium for the proposed laser. The other end of the EDF is
connected to a Faraday rotating mirror (FRM), which serves as the ‘back mirror’ for the
linear cavity. The laser will then oscillate in the cavity formed by FBG and FRM, and
the filtered output is extracted through the WDM via the 1550 nm port. The output from
the 1550 nm port is equally split into two parts by a 3 dB coupler. One of these parts is
analyzed using an optical spectrum analyzer (OSA) (AQ6317, YOKOGAWA) for the
generated spectrum, whereas the other part is used in the analysis of the laser output

163
pulse characteristics by means of a photodetector connected to a LeCroy 352A
oscilloscope.
Figure 4.31: Experimental setup of the graphene-based
Q-switched DBR fiber laser
Figure 4.32 shows the output spectra of the graphene based Q-switched DBR
fiber laser taken from the OSA, with a spectral resolution of 0.02 nm at five different
pump powers of 9 mW, 14 mW, 18 mW, 28 mW, and 74 mW respectively. As shown in
Figure 4.32, lasing is not initiated until the pump power reaches 14 mW. Continuous
wave (CW) laser operation in the fiber laser is first observed at 18 mW pump power,
which means that the lasing threshold is totally overcome around this pump power. This
observation is deduced from the figure 4.33 plot of the average output power against
pump power. Above the threshold value, the spectrum linewidth narrows down and
produces a FWHM of less than 0.05 nm at a 1557 nm center wavelength. The inset in
WDM
980 nm pump laser
1557 nm FBG
2.7 m EDF
Mirror
OSA
Graphene
between two
fiber ferrules 3dB coupler
Oscilloscope with
photodetector

164
Figure 4.32 provides an expanded scan for the same trace. The change in pump power
significantly varies the output power amplitude, with the highest output power measured
to be roughly –8 dBm at 74 mW pump power. These measurements are taken with the
graphene SA already in place. Interplay emerges between the gain (in the gain medium)
and the loss (in the cavity) due to the SA. During the initial stage, a low-power ASE
output will be produced as the population inversion builds up, and is blocked by the SA.
This process allows a rapid population inversion build-up in higher states, and a sudden
release of energy from this state to a lower state will then saturate the SA and allow a Q-
switched pulse to be generated in the oscillating cavity.
Figure 4.32: Laser output spectrum with respect to different pump power
Figure 4.33 shows the average output power against the pump power. From the
figure, the lasing threshold power can be deduced to be approximately 18 mW. After the
lasing threshold, the average output power increases almost linearly with the pump
-80
-70
-60
-50
-40
-30
-20
-10
1554.5 1555.5 1556.5 1557.5 1558.5 1559.5
~ 74 mW
~ 28 mW
~ 18 mW
~ 14 mW
~ 9 mW
Ou
tpu
t p
ow
er
(dB
m)
Wavelength (nm)
-80
-70
-60
-50
-40
-30
-20
-10
1556.7 1556.8 1556.9 1557 1557.1 1557.2
~ 74 mW
~ 28 mW
~ 18 mW
~ 14 mW
~ 9 mW

165
power. The laser output slope efficiency above the threshold value is about 0.7%. Even
at the maximum pump power of 74 mW, the measured output power is already about
0.4 mW, whereas it still does not reach a saturation level. This result indicates that
higher output powers are achievable within this system. However, this concept cannot
be demonstrated in the current setup due to the graphene layer damage threshold.
Nonetheless, this issue could be solved if the graphene sample preparation is further
optimized.
Figure 4.34 shows the variations in the repetition rate and pulse width of the
system against different 980 nm pump powers. As shown in the figure, the repetition
rate increases with increasing pump power, starting from 10.4 kHz at a pump power of
28 mW (Q-switching threshold) to a maximum value of 18.0 kHz at a pump power of
74 mW. This result indicates that the pulse repetition rate of this graphene-based Q-
switched DBR can be tuned to over 8.0 kHz by changing the pump power. Furthermore,
the Q-switching threshold (28 mW) in this system is much lower than those achieved by
using graphene as SA in a ring EDF laser (EDFL) as reported in Refs. [1, 18] with Q-
0
0.1
0.2
0.3
0.4
0.5
0 20 40 60 80
Ave
rage
ou
tpu
t p
ow
er
(mW
)
Input power (mW)
Figure 4.33: Average output power against pump power
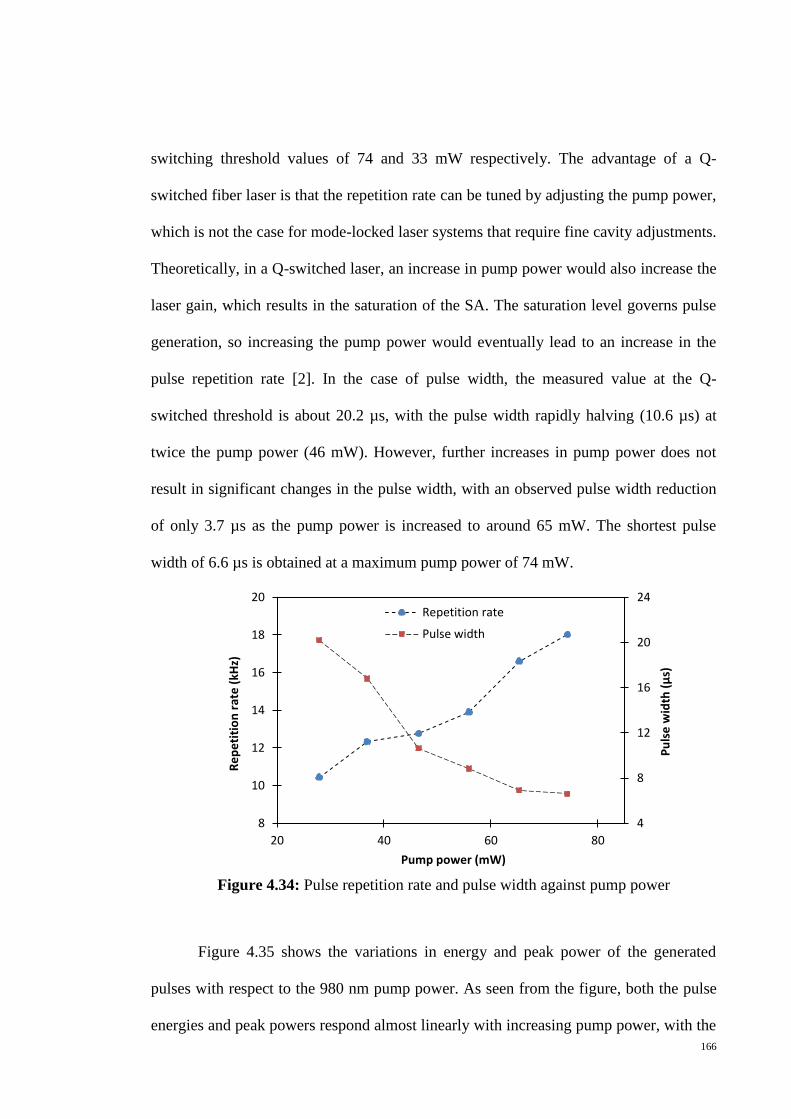
166
switching threshold values of 74 and 33 mW respectively. The advantage of a Q-
switched fiber laser is that the repetition rate can be tuned by adjusting the pump power,
which is not the case for mode-locked laser systems that require fine cavity adjustments.
Theoretically, in a Q-switched laser, an increase in pump power would also increase the
laser gain, which results in the saturation of the SA. The saturation level governs pulse
generation, so increasing the pump power would eventually lead to an increase in the
pulse repetition rate [2]. In the case of pulse width, the measured value at the Q-
switched threshold is about 20.2 µs, with the pulse width rapidly halving (10.6 µs) at
twice the pump power (46 mW). However, further increases in pump power does not
result in significant changes in the pulse width, with an observed pulse width reduction
of only 3.7 µs as the pump power is increased to around 65 mW. The shortest pulse
width of 6.6 µs is obtained at a maximum pump power of 74 mW.
Figure 4.34: Pulse repetition rate and pulse width against pump power
Figure 4.35 shows the variations in energy and peak power of the generated
pulses with respect to the 980 nm pump power. As seen from the figure, both the pulse
energies and peak powers respond almost linearly with increasing pump power, with the
4
8
12
16
20
24
8
10
12
14
16
18
20
20 40 60 80
Repetition rate
Pulse width
Re
pe
titi
on
rat
e (
kHz)
Pu
lse
wid
th (
µs)
Pump power (mW)

167
lowest pulse energy of 6.5 nJ obtained at the Q-switching threshold of 28 mW.
Increasing the 980 nm pump power results in an increase in pulse energy until the
highest pulse energy value of 22.2 nJ is obtained at the maximum pump power of the
system. The pulse energies obtained in this setup is comparatively larger than those
reported in Ref. [36], wherein graphene is used as a SA in a ring EDFL with the highest
pulse energy of 16.7 nJ obtained at a pump power greater than 80 mW. Similarly, the
peak power of each generated pulse is lowest at the Q-switching threshold, with an
average peak power of 0.3 mW. Increasing the pump power results in a corresponding
increase in the peak power of the pulses, with the maximum peak power of 3.4 mW
obtained at a 74 mW pump power.
Figure 4.35: Pulse energy and peak power versus pump power
Figure 4.36 shows the output pulse trains obtained from the proposed Q-
switched DFB laser at different pump powers. All the generated pulse trains are clean
and exhibit a smooth and uniform pulse. This observation confirms that the proposed
fiber laser is free from any self-mode locking effect.
0
1
2
3
4
5
6
0
5
10
15
20
25
20 30 40 50 60 70 80
Pulse energyPeak power
Pu
lse
en
erg
y (n
J)
Pump power (mW)
Pe
akp
ow
er
(mW
)
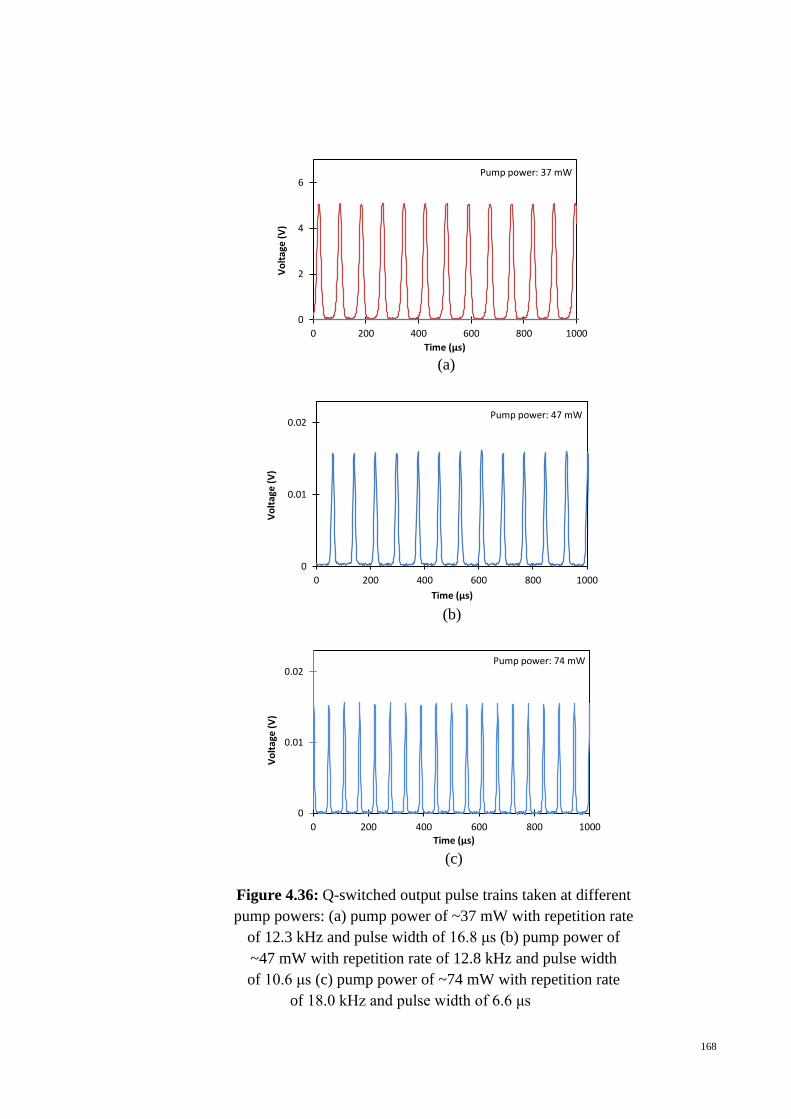
168
Figure 4.36: Q-switched output pulse trains taken at different
pump powers: (a) pump power of ~37 mW with repetition rate
of 12.3 kHz and pulse width of 16.8 μs (b) pump power of
~47 mW with repetition rate of 12.8 kHz and pulse width
of 10.6 μs (c) pump power of ~74 mW with repetition rate
of 18.0 kHz and pulse width of 6.6 μs
0
2
4
6
0 200 400 600 800 1000
Pump power: 37 mW
Vo
ltag
e (
V)
Time (µs)
0
0.01
0.02
0 200 400 600 800 1000
Pump power: 47 mW
Vo
ltag
e (
V)
Time (µs)
0
0.01
0.02
0 200 400 600 800 1000
Pump power: 74 mW
Vo
ltag
e (
V)
Time (µs)
(c)
(a)
(b)

169
In conclusion, a graphene-based Q-switched DBR-based fiber laser with end
mirrors formed from FBG and FRM has been successfully demonstrated yielding a
stable Q-switched output. The laser output has a CW threshold of 18 mW and a Q-
switching threshold of 28 mW, with a slope efficiency of 0.7%. The output spectrum
has less than 0.05 nm FWHM at the wavelength of 1557 nm. As the pump power is
varied from 28 to 74 mW, the repetition rate of the generated pulses also changes from
10.4 to 18.0 kHz. The pulse width also varies with pump power from 20.2 to 6.6 µs over
a similar range. At the maximum pump power, the highest output pulse energy is about
22.2 nJ, whereas the maximum peak power is 3.4 mW. The generated pulse trains are
clean with a smooth and uniform pulse. Thus, they can have potential applications in the
fields of communications and sensor sources.
4.5 Graphene Q-switched multiwavelength Brillouin erbium-doped fiber laser
Research on multiwavelength fiber lasers (MWFLs) is a topic of contemporary
interest due to its potential applications in dense wavelength division multiplexed
(DWDM) optical communication systems besides other attractive applications in areas
as diverse as optical fiber sensors, optical instrument testing, optical metrology,
photonics true-time-delay (TTD) beam-forming systems, and photonic component
characterization [37-41]. Various approaches have been taken to realize the
multiwavelength oscillation such as by introducing the frequency-shifted feedback laser
operation with the use of an acousto-optic modulator (AOM) and all-fiber phase
modulator (PZT cylinder) [42], or by introducing the nonlinear effect to the fiber laser
based on four-wave-mixing (FWM) [43,44] and stimulated Brillouin scattering (SBS)

170
[45-51]. Apart from continuous wave (CW) MWFLs, pulsed MWFL by Q-switching is
also becoming an attractive platform for study and provides a strong basis and a good
source for the supercontinuum generation [52] and also for terahertz generation. The
conventional solid-state Q-switched laser that is generally used for the supercontinuum
generation is rather bulky and occupies a large volume. Therefore, all-fiber Q-switched
MWFL is becoming increasingly attractive. Generally, terahertz generation requires
multiwavelength lasers such as dual wavelength lasers with closely spaced lines, either
as a high-power continuous wave (CW) or pulse laser sources. An all-fiber Q-switched
MWFL reported in [53] exploits an electronically scanned Fabry–Perot (FP) filter for Q-
switching and wavelength selection. However, relatively high insertion loss and
complexity of the system are issues that need to be addressed for real-world utilization.
An application of graphene for obtaining a multiwavelength Q-switched fiber laser
based on four-wave mixing (FWM) is already demonstrated by Luo et al. [54] with a
minimum pulse duration of 2.5 µs and maximum pulse repetition rate of 63.0 kHz.
Another interesting approach for creating the pulsed multiwavelength fiber laser is
based on stimulated Brillouin scattering (SBS), as it offers passive all-fiber solution
with the potential to yield low-cost supercontinuum generation [52]. Besides that, the
pulsed multiwavelength fiber laser based on SBS is compatible for nonlinear fiber
application, provided that nanosecond pulses could be generated [52]. SBS-based
multiwavelength fiber lasers are usually formed by combining Brillouin and erbium-
doped fiber (EDF) gains in tandem to form Brillouin erbium-doped fiber laser
(BEDFL), by exploiting the broad-gain spectrum of the EDF which would assist in the
formation of the multiwavelength fiber laser [55]. Thus, this work investigates and
demonstrates the unique properties of graphene as saturable absorber via realization of

171
pulsed output from a multiwavelength BEDFL by incorporating graphene as the SA for
generating the Q-switched pulse.
Figure 4.37 shows the experimental setup for the graphene-based Q-switched
multiwavelength BEDFL that is constructed in a linear cavity geometry, with a pair of
optical circulators connected at the end of both sides of the cavity. The Q-switched
multiwavelength BEDFL uses a 7.7-km dispersion compensating fiber (DCF) with an
effective mode area (Aeff) of 15 µm2 as the nonlinear medium for generating the
multiwavelength output through the SBS process. A tunable laser source (TLS) (ANDO
AQ8203), giving an output power of 10.9 dBm at a wavelength of 1550.1 nm, is used as
the Brillouin pump (BP) source and is injected into the linear cavity through a 3-dB
coupler placed just before the 7.7-km DCF. The BP signal is used to generate the first
Stokes wave in the DCF, which travels in the opposite direction of the BP towards the
graphene layer and then towards a 1 m highly doped EDF (LIEKKI Er80-8/125), which
has a mode field diameter of 9.5 µm at 1550 nm, as well as core absorption coefficients
of 41 and 80 dB/m at 980 and 1530 nm, respectively. The EDF is pumped by a 980 nm
laser diode through a wavelength division multiplexing (WDM) coupler, with the other
port connected to Port 2 of the optical circulator OC2. Port 3 of OC2 is connected to
Port 1 through a 90:10 optical coupler and acts as a “mirror” for the linear cavity. The
10% port of the optical coupler is connected to another 3 dB coupler, and the outputs of
this 3 dB coupler are connected to an optical spectrum analyzer (OSA) and an opto-
electronic (OE) converter, together with an oscilloscope for the purpose of measuring
pulse characteristics of the generated output. The other end of the DCF is connected to
Port 2 of another optical circulator, OC1, which is routed by connecting Port 3 to Port 1
to act as the second “mirror” in the linear cavity. The working mechanism of the cavity
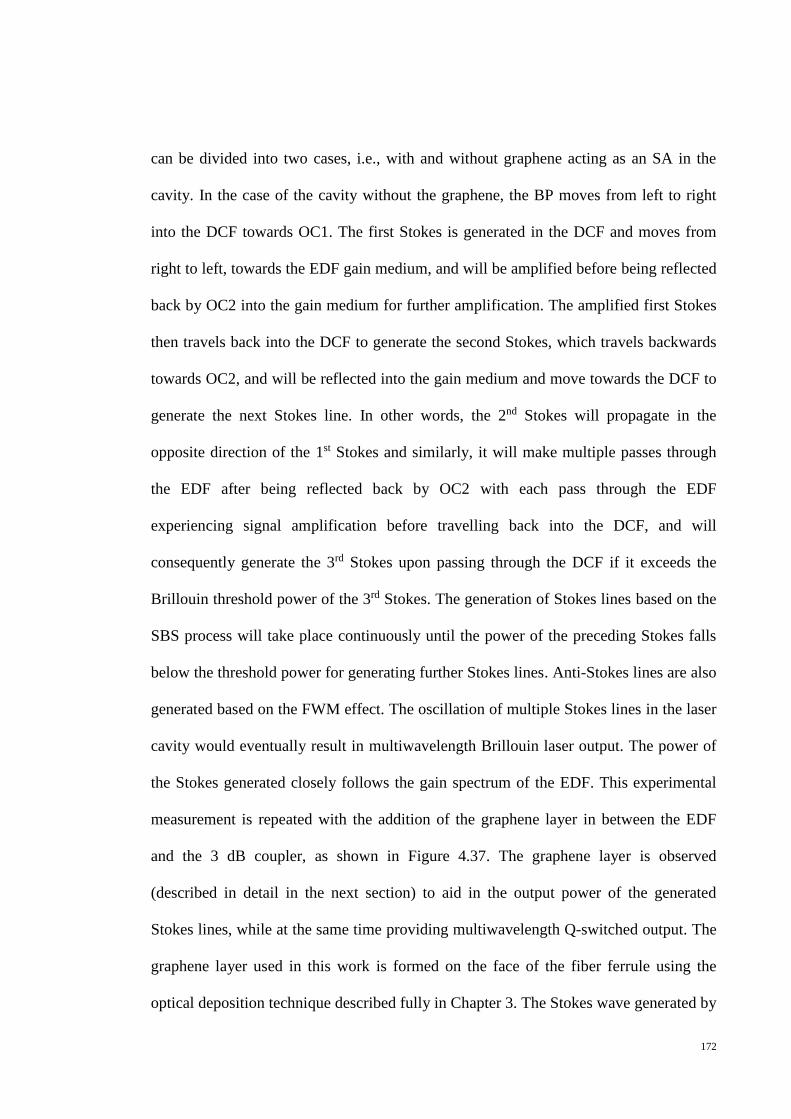
172
can be divided into two cases, i.e., with and without graphene acting as an SA in the
cavity. In the case of the cavity without the graphene, the BP moves from left to right
into the DCF towards OC1. The first Stokes is generated in the DCF and moves from
right to left, towards the EDF gain medium, and will be amplified before being reflected
back by OC2 into the gain medium for further amplification. The amplified first Stokes
then travels back into the DCF to generate the second Stokes, which travels backwards
towards OC2, and will be reflected into the gain medium and move towards the DCF to
generate the next Stokes line. In other words, the 2nd Stokes will propagate in the
opposite direction of the 1st Stokes and similarly, it will make multiple passes through
the EDF after being reflected back by OC2 with each pass through the EDF
experiencing signal amplification before travelling back into the DCF, and will
consequently generate the 3rd Stokes upon passing through the DCF if it exceeds the
Brillouin threshold power of the 3rd Stokes. The generation of Stokes lines based on the
SBS process will take place continuously until the power of the preceding Stokes falls
below the threshold power for generating further Stokes lines. Anti-Stokes lines are also
generated based on the FWM effect. The oscillation of multiple Stokes lines in the laser
cavity would eventually result in multiwavelength Brillouin laser output. The power of
the Stokes generated closely follows the gain spectrum of the EDF. This experimental
measurement is repeated with the addition of the graphene layer in between the EDF
and the 3 dB coupler, as shown in Figure 4.37. The graphene layer is observed
(described in detail in the next section) to aid in the output power of the generated
Stokes lines, while at the same time providing multiwavelength Q-switched output. The
graphene layer used in this work is formed on the face of the fiber ferrule using the
optical deposition technique described fully in Chapter 3. The Stokes wave generated by

173
the SBS has a down-shifted frequency with respect to the frequency of input signal [56].
The advantage of multiwavelength generation based on SBS process is that it can
generate multiwavelength laser output with narrow linewidth, consistent channel
spacing and constant peak power [56].
Figure 4.37: Experimental setup of the graphene-based Q-switched
multiwavelength BEDFL
Figure 4.38 shows the output spectrum of the multiwavelength BEDFL with and
without incorporation of graphene as an SA within its linear cavity. The BP power and
wavelength is set at 10.9 dBm and 1550.1 nm respectively, while the 980 nm pump is
operated at an optical output power of 267.25 mW. About 11 lasing wavelengths with
flat and stable output powers of approximately -14 dBm are obtained under these
conditions, with wavelengths spanning from 1550.1 to 1550.9 nm. It can be observed
from Figure 4.38 that the BEDFL spectrum is similar for both cases, i.e., with and
without graphene, although a higher output power is obtained when the graphene layer
is present in the cavity for the first 12 Stokes, after which the system without graphene
has a higher peak power. This latter effect is explained by the output power being low at

174
the low gain area of the EDF, and some absorption occurs in the graphene layer that in
turn lowers the output power. The same case can be made for the anti-Stokes, whereby
the low gain area causes absorption by the graphene layer that in turn lowers the output
power. The anti-Stokes waves generated are based on the FWM effect; the first anti-
Stokes arises from the interaction between the BP and the first Stokes, the second anti-
Stokes results from the FWM interaction between the BP and the second Stokes, and
this process continues. This mechanism thus generates the anti-Stokes lines, as observed
in the figure.
Figure 4.39 (a) and (b) shows the output spectrum of the multiwavelength
BEDFL for different 980 nm pump power with graphene and without graphene
respectively as the SA in the cavity, whereby BP power is fixed at 10.9 dBm. 1st
-70
-60
-50
-40
-30
-20
-10
0
1549.5 1549.75 1550 1550.25 1550.5 1550.75 1551 1551.25 1551.5
WithoutgrapheneWithgraphene
Wavelength (nm)
Ou
tpu
t p
ow
er
(dB
m)
1st Stokes2nd StokesBP
1st Anti-Stokes
11th Stokes
Figure 4.38: Output spectrum of the multiwavelength BEDFL
with and without graphene respectively

175
Brillouin Stokes line is generated at the same pump power of 42.87 mW for both
conditions, as can be seen from the figure. Also, it can be seen from both figures that as
the pump power is increased from 42.87 mW to 267.25 mW, the number of generated
Stokes also increases, with up to 11 Brillouin Stokes being obtained at the highest pump
power. No significant difference is observed on the increment patterns of Brillouin
Stokes lines with respect to different pump powers between both the conditions of
graphene presence or absence; this indicates the utility of integrating graphene as SA in
a BEDFL layout without perturbing the multiwavelength behavior of the BEDFL.
Figure 4.39: Output spectrum of the BEDFL for different 980 nm pump power;
(a) with graphene and (b) without graphene as the SA in the cavity
(a)
(a)
(b)

176
Figure 4.40 (a) – (e) shows the output spectrum taken from the OSA, as well as
the corresponding pulses obtained from the OE converter, which is connected to a 500-
MHz oscilloscope in order to provide the pulse width and repetition rate. The BP is kept
constant at 1550.1 nm at a power of 10.9 dBm, while the EDF pump power is increased
from 42.87 mW to 267.25 mW. In the case of the lowest pump power of 42.87 mW,
only a single Stokes line is generated at 1550.2 nm as shown in Figure 4.40 (a). At this
point, the pulse repetition rate measured is about 36.91 kHz with a pulse width of 12.17
µs. Figure 4.40 (b) shows that as the pump power is increased to 131.51 mW, the
number of Stokes lines obtained also increases to four lines. The corresponding pulse
generated has a repetition rate of 56.64 kHz and a pulse width of 5.96 µs. Figure 4.40
(c) shows the multiwavelength spectrum obtained at a pump power of 165.67 mW,
which gives seven Stokes lines and pulse repetition rate of 100.60 kHz, as well as a
pulse width of 4.79 µs. Further increase in the pump power to 200.64 mW also gives an
increase in the number of Stokes lines generated, in this case giving nine Stokes as
shown in Figure 4.40 (d). The Q-switched pulses obtained at this power have a
repetition rate of 124.90 kHz and a pulse width of 1.72 µs. At the maximum available
pump power of 267.25 mW, 11 Stokes lines are generated with a fairly flat top output
power of about -14 dBm, although there are many other lines also generated at lower
peak powers. The corresponding pulses are observed from the oscilloscope and shown
in Figure 4.40 (e) to have a repetition rate of 152.40 kHz and a pulse width of 1.67 µs.
The fluctuations in the Y-axis of the right-hand graph of Figure 4.40 (e) could be
attributed to the increase of the number of Stokes lines generated. Since the output port
is common, some interactions are possible between the Stokes lines, which may cause
fluctuations.
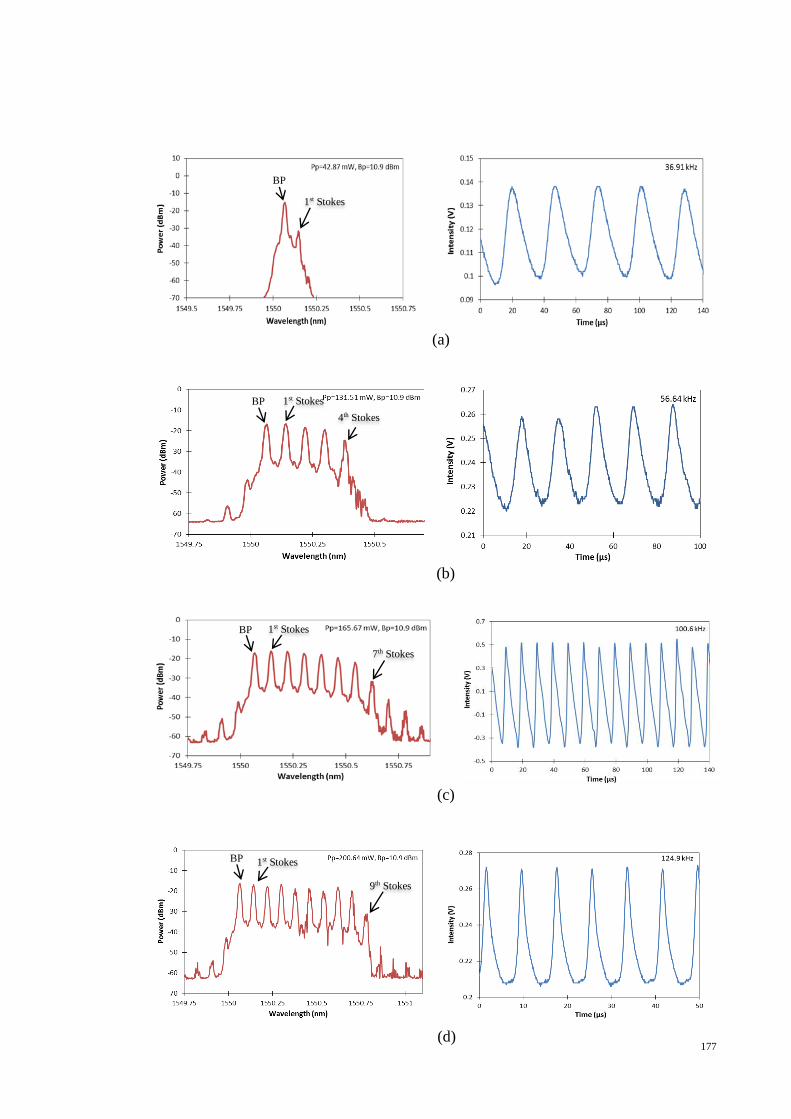
177
BP
BP
1st Stokes
4th Stokes
1st Stokes
BP
BP
7th Stokes
1st Stokes
9th Stokes
1st Stokes
(a)
(d)
(b)
(c)

178
Figure 4.40 (a) - (e): Optical spectrum of the Stokes lines and the corresponding pulse
spectrum for different 980 nm pump powers. (a) Left: Observed optical spectrum as
taken from the OSA that shows the BP as well as the first Stokes generated. Right: The
generated Q-switched pulses as taken from the oscilloscope, giving a pulse repetition
rate of 39.61 kHz and a pulse width of 12.17 µs. Both measurements are taken at a laser
pump power to the EDF at 42.87 mW. (b) Left: Observed optical spectrum as taken
from the OSA that shows the BP as well as the 1st, 2nd, 3rd and 4th Stokes generated.
Right: The generated Q-switched pulses as taken from the oscilloscope, giving a pulse
repetition rate of 56.64 kHz and a pulse width of 5.96 µs. Both measurements are taken
at a laser pump power to the EDF at 131.51 mW. (c) Left: Observed optical spectrum as
taken from the OSA which shows the BP as well as the 1st to 7th well defined Stokes,
and 3 smaller Stokes generated. Right: The generated Q-switched pulses as taken from
the oscilloscope, giving a pulse repetition rate of 100.60 kHz and a pulse width of 4.79
µs. Both measurements are taken at a laser pump power to the EDF at 165.67 mW. (d)
Left: Observed optical spectrum as taken from the OSA which shows the BP as well as
the 1st to 9th well defined Stokes. Right: The generated Q-switched pulses as taken from
the oscilloscope, giving a pulse repetition rate of 124.90 kHz and a pulse width of 1.72
µs. Both measurements are taken at a laser pump power to the EDF at 200.64 mW. (e)
Left: Observed optical spectrum as taken from the OSA which shows the BP as well as
the 1st to 11th well-defined Stokes. Right: The generated Q-switched pulses as taken
from the oscilloscope, giving a pulse repetition rate of 152.40 kHz and a pulse width of
1.67 µs. Both measurements are taken at a laser pump power to the EDF at 267.25 mW.
As a summary, the number of Stokes lines generated against the 980 nm pump
power to the EDF is shown in Figure 4.41. From the figure, it can be seen that the
number of Stokes lines increases almost linearly with increased pump power, from only
one Stokes line at a pump power of 42.87 mW to 11 Stokes lines at the maximum pump
power of 267.25 mW. Using the curve-fitting method, a simple correlation can be made,
BP 1st Stokes 11th Stokes
(e)
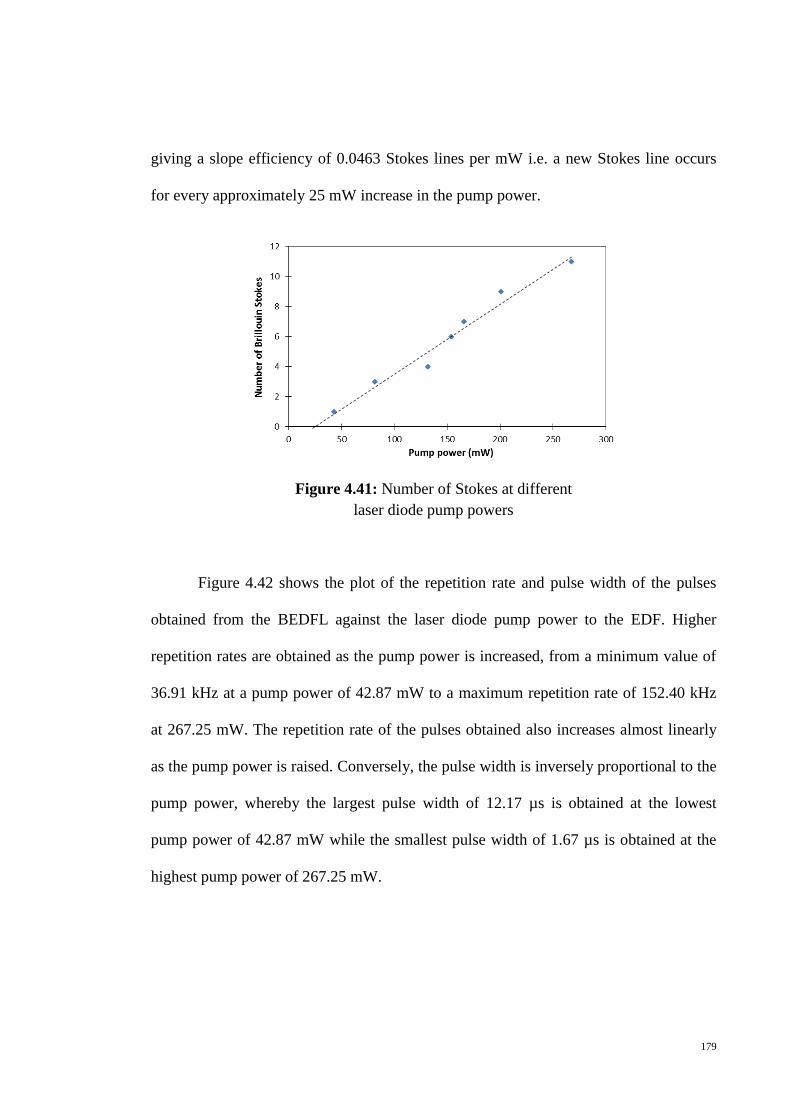
179
giving a slope efficiency of 0.0463 Stokes lines per mW i.e. a new Stokes line occurs
for every approximately 25 mW increase in the pump power.
Figure 4.41: Number of Stokes at different
laser diode pump powers
Figure 4.42 shows the plot of the repetition rate and pulse width of the pulses
obtained from the BEDFL against the laser diode pump power to the EDF. Higher
repetition rates are obtained as the pump power is increased, from a minimum value of
36.91 kHz at a pump power of 42.87 mW to a maximum repetition rate of 152.40 kHz
at 267.25 mW. The repetition rate of the pulses obtained also increases almost linearly
as the pump power is raised. Conversely, the pulse width is inversely proportional to the
pump power, whereby the largest pulse width of 12.17 µs is obtained at the lowest
pump power of 42.87 mW while the smallest pulse width of 1.67 µs is obtained at the
highest pump power of 267.25 mW.

180
In conclusion, a passively Q-switched BEDFL using graphene as an SA has been
successfully realized. This device allows simultaneous control of the pulse repetition
rate and the number of generated Brillouin Stokes through variation in the pump power,
with up to 11 Stokes lines, a repetition rate as high as 152.40 kHz and a pulse width as
small as 1.67 µs being obtained at the maximum pump power of 267.25 mW. The
results obtained in this work also confirm the utility of integrating graphene as SA in a
BEDFL layout to yield a multi-wavelength pulsed fiber laser without perturbing the
multi-wavelength behavior of the BEDFL. The proposed BEDFL has potential
application as a source for generating terahertz signals, whereby closely spaced lines are
required, which normally considers as desirable a laser output with a tunable spacing
operating in a pulse mode (given the necessary peak power in this case). These lines are
emitted simultaneously with a channel spacing of 0.08 nm, which is due to the SBS
effect. Individual channels can be retrieved using a fiber Bragg grating (FBG) with a 3
dB reduced bandwidth as small as 0.04 nm [57] to filter a two-wavelength output from
the other channels. Alternatively, the extraction of the wavelengths can also be
Figure 4.42: Repetition rate and pulse width
of the BEDFL against pump power

181
accomplished using a phase-shift FBG with full width at half-maximum (FWHM)
bandwidth of about 0.026 nm, which can be commercially acquired from companies
such as O/E Land Inc. [58].
4.6 Graphene oxide Q-switched EDFL
As mentioned in Chapter 3, graphene oxide has oxygen-containing functional
groups that do not exist in graphene [59]. An essential advantage of having such
oxygen-containing functional groups is that an intense hydrophilic feature appears in
graphene oxide [59], making the material highly soluble in water and in turn easing the
fabrication process of graphene-oxide SA through optical deposition method.
Fortunately, graphene oxide also has a comparatively strong saturable absorption and
fast energy relaxation of hot carriers in common with graphene [60, 61]. Oxygen
functional groups in graphene oxide eliminate the gapless linear dispersion of Dirac
electron and thus inhibit graphene oxide from conducting electricity [59], though its
saturable absorption properties are retained. Graphene oxide has been successfully
demonstrated as saturable absorber for generating mode locked fiber laser in previous
works [59, 62, 63]. However, there are limited reports on graphene oxide based
saturable absorber for Q-switching. Although several papers have reported on graphene
oxide for Q-switching in solid state laser [64,65], it should be noted that a drawback of
the solid state laser system - besides a bulky setup - is the necessary high power
consumption, in the range of Watt, as well as high Q-switching threshold which is up to
several Watts [64,65]. Graphene-oxide based saturable absorber for Q-switching in
EDFL fiber laser is demonstrated and investigated in this work.
182
The presence of graphene oxide prepared by the optical deposition method has
been confirmed by Raman spectroscopy, as presented and described in Chapter 3. The
fiber ferrule with the graphene oxide layer is connected to another fiber ferrule to form
the graphene oxide SA assembly and placed in the optical circuit. An experimental
setup of the proposed graphene oxide Q-switched EDFL is given in Figure 4.43. The
gain medium of the EDFL is a 3-m-long MetroGain-12-type EDF, which has absorption
coefficients of between 11 to 13 dBm-1 at 980 nm and about 18 dBm-1 at 1550 nm with
an erbium ion concentration of 960 ppm. A 980 nm laser diode with a maximum output
power of about 100 mW is used as the pumping source for the EDFL and is connected
to the 980-nm port of a wavelength-division multiplexer (WDM). The common output
of the WDM is connected to the 3 m long EDF, which in turn is connected to the input
of an optical isolator to ensure unidirectional oscillations within the ring cavity. The
output of the optical isolator is connected to a 90:10 coupler, which is used to extract a
portion (10%) of the signal oscillating in the cavity for further analysis. The remaining
signal is channeled through the 90% port of the tap coupler where it will come into
contact with the graphene oxide SA and undergo Q-switching. The output of the SA is
connected to the 1550-nm port of the WDM, thereby completing the ring cavity. The
10% port of the 90:10 coupler is connected to a 1 x 2 (3 dB) coupler, which splits the
extracted signal evenly into two portions. One portion is guided into a Yokogawa
AQ6370B optical spectrum analyzer (OSA) with a resolution of 0.02 nm and is
analyzed to determine the spectral properties of the generated signal. The other portion
is directed into a photodetector, which is connected to a LeCroy 352A oscilloscope,
having a bandwidth of 500 MHz, for the analysis of the pulse characteristics of the
extracted signal.
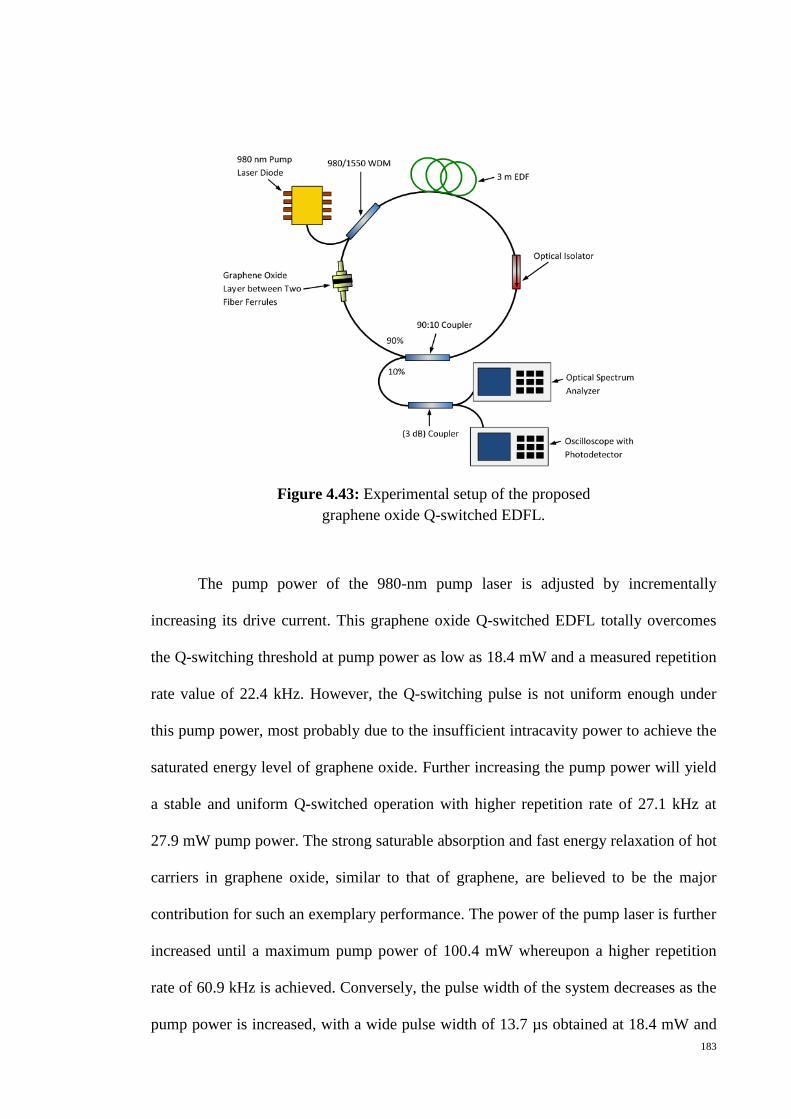
183
Figure 4.43: Experimental setup of the proposed
graphene oxide Q-switched EDFL.
The pump power of the 980-nm pump laser is adjusted by incrementally
increasing its drive current. This graphene oxide Q-switched EDFL totally overcomes
the Q-switching threshold at pump power as low as 18.4 mW and a measured repetition
rate value of 22.4 kHz. However, the Q-switching pulse is not uniform enough under
this pump power, most probably due to the insufficient intracavity power to achieve the
saturated energy level of graphene oxide. Further increasing the pump power will yield
a stable and uniform Q-switched operation with higher repetition rate of 27.1 kHz at
27.9 mW pump power. The strong saturable absorption and fast energy relaxation of hot
carriers in graphene oxide, similar to that of graphene, are believed to be the major
contribution for such an exemplary performance. The power of the pump laser is further
increased until a maximum pump power of 100.4 mW whereupon a higher repetition
rate of 60.9 kHz is achieved. Conversely, the pulse width of the system decreases as the
pump power is increased, with a wide pulse width of 13.7 µs obtained at 18.4 mW and

184
decreasing to a narrower value of 6.6 µs at pump power of 100.4 mW. The Q-switched
traces at different pump powers and repetition rates are provided in Figure 4.44.
Figure 4.44: Q-switched output pulse trains taken at different pump powers:
(a) pump power of 36.82mW with repetition rate of 31.01 kHz and pulse width
of 7.87 μs (b) pump power of 65.29mW with repetition rate of 43.32 kHz and
pulse width of 6.71 μs (c) pump power of 74.31mW with repetition rate of
46.29 kHz and pulse width of 6.39 μs, and (d) pump power of 91.8mW
with repetition rate of 56.05 kHz and pulse width of 6.38 μs.
Figure 4.45 summarizes the repetition rate and pulse width of the Q-switched
pulses generated from this fiber laser when taken against the laser diode pump power to
the EDF. It can be seen from the figure that the repetition rate increases almost linearly
against the pump power, at a rate of approximately 5 kHz for every increase of 10 mW
in the pump power. As such, the repetition rate increases from 22.4 kHz at pump power
0
0.02
0.04
0.06
0.08
0 25 50 75 100 125 150 175 200
Inte
nsi
ty(V
)
Time delay (µs)
P=36.82mW, f=31.01kHz
7.87 μs
0
0.02
0.04
0.06
0.08
0 25 50 75 100 125 150 175 200
Inte
nsi
ty (
V)
Time delay (µs)
6.71 μs
0
0.02
0.04
0.06
0.08
0 25 50 75 100 125 150 175 200
Inte
nsi
ty (
V)
Time delay (µs)
P=74.31mW, f=46.29kHz6.39 μs
0
0.02
0.04
0.06
0.08
0 25 50 75 100 125 150 175 200
Inte
nsi
ty (
V)
Time delay (µs)
P=91.8mW, f=56.05kHz6.38 μs
P=65.29mW, f=43.32kHz
(a) (b)
(c) (d)

185
of 18.4 mW, which is the Q-switching threshold, to a maximum value of 60.9 kHz at
pump power of 100.4 mW. This indicates that the pulse repetition rate of this graphene
oxide based Q-switched EDFL can be tuned over 37 kHz by changing the pump power.
It must be noted that the repetition rate of the EDFL is not limited to this value, and
higher repetition rates can be obtained if a pump laser diode with a higher output power
is used. Additionally, the repetition rate of the pulses obtained being almost constant
over time indicates that the system is stable and the graphene-oxide based SA can
sustain Q-switching operation at higher pump powers. On the other hand, pulse width of
the system decreases as the pump power is increased, as is expected with the increase in
the repetition rate. At a low pump power of 18.4 mW, a wide pulse width of 13.7 µs is
observed and decreases quickly to 7.9 µs with an increase of only 18.4 mW. However,
subsequent increases in the pump power result in only a slow decrease in the pulse
width to a minimum value of 6.1 µs at a pump power of 83.8 mW. Above this pump
power, the pulse width becomes wider again, reaching a value of 6.6 µs at a maximum
pump power of 100.4 mW.
4
6
8
10
12
14
16
10
20
30
40
50
60
70
0 10 20 30 40 50 60 70 80 90 100 110
Repetition rate
Pulse width
Re
pe
titi
on
rate
(kH
z)
Pump power (mW)
Pu
lse
wid
th (
µs)
Figure 4.45: Repetition rate and pulse width
against pump power
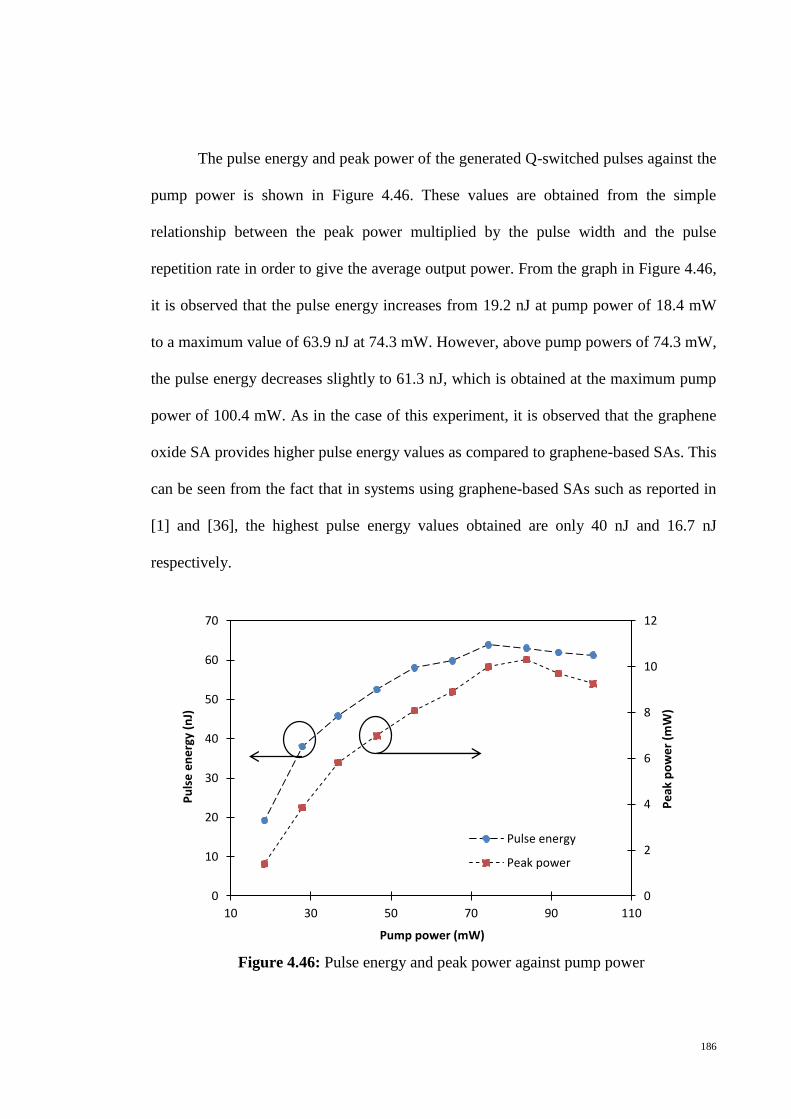
186
The pulse energy and peak power of the generated Q-switched pulses against the
pump power is shown in Figure 4.46. These values are obtained from the simple
relationship between the peak power multiplied by the pulse width and the pulse
repetition rate in order to give the average output power. From the graph in Figure 4.46,
it is observed that the pulse energy increases from 19.2 nJ at pump power of 18.4 mW
to a maximum value of 63.9 nJ at 74.3 mW. However, above pump powers of 74.3 mW,
the pulse energy decreases slightly to 61.3 nJ, which is obtained at the maximum pump
power of 100.4 mW. As in the case of this experiment, it is observed that the graphene
oxide SA provides higher pulse energy values as compared to graphene-based SAs. This
can be seen from the fact that in systems using graphene-based SAs such as reported in
[1] and [36], the highest pulse energy values obtained are only 40 nJ and 16.7 nJ
respectively.
0
2
4
6
8
10
12
0
10
20
30
40
50
60
70
10 30 50 70 90 110
Pulse energy
Peak power
Pu
lse
en
erg
y (n
J)
Pe
ak p
ow
er
(mW
)
Pump power (mW)
Figure 4.46: Pulse energy and peak power against pump power

187
The peak power of the Q-switched pulses has a similar pattern to that of the
energy per pulse, increasing from 1.4 mW to 10.3 mW as the pump power is raised
from 18.4 mW to 83.8 mW before dropping to 9.3 mW as the pump power is raised
further to the maximum value of 100.4 mW. The decreases in the peak power and
energy per pulse, as well as the increase in the pulse width as shown in Figure 4.45
above a pump power of 83.8 mW, is due to the system exceeding its optimal operating
point. There is a possibility that other nonlinear effects may take place above a certain
intracavity power level, resulting in more average loss and thus a decrease in the
performance of the system. It is also possible that the graphene oxide layer may suffer
light damage at this point. However, similar results were obtained when the above
measurements were repeated, which indicates that the damage could be reversible. The
threshold for possible damage of the graphene oxide at peak power of 10.3 mW, with a
mode field diameter or core size of 6.2 µm, results into a power intensity of 341
MW/m2.
The relationship between the average output power and the pump power for this
graphene oxide based Q-switched EDFL is plotted in Figure 4.47. After reaching the
lasing threshold of 9.3 mW, it can be seen that the average output power increases
almost linearly with the pump power, with the maximum average output power of 3.7
mW achieved at the highest pump power of 100 mW. The slope efficiency of the graph
is 4%, which is 2 times higher than the one achieved by similar system using graphene-
based SA [1]. It can be observed from the plotted graph, the average output power still
does not reach its saturation value at the maximum pump power of 100.44 mW.
Therefore, a prediction arises in that increasing the pump power above 100.44 mW can
further increase the average output power. However, the average output power at pump

188
power exceeding 100.44 mW is not demonstrated due to the limitation of the pump
laser. In the initial stages of operation, corresponding to a pump power below 18.4 mW,
the system operates in the CW mode. However, the EDFL operates as a Q-switched
pulsed fiber laser above this pump power.
Figure 4.48 displays the optical spectra of the output of the Q-switched EDFL,
whereby these output spectra are obtained from the OSA at pump powers of 28 mW, 37
mW, and 100 mW with a spectral resolution of 0.02 nm. As can be seen from the figure,
the laser spectrum at each different pump power has a considerably broad laser
bandwidth at the base of the laser spectrum, covering the wavelength range from
approximately 1558 nm to 1570 nm, and thereby enter the beginning edge of the L-band
region. The spectrum exhibits a modulation structure due to cavity perturbations and
multimode oscillations. The is due to the homogenous linewidth of the erbium laser,
which can support the lasing modes of the laser as well as the broad ASE spectrum
generated by the cavity at the same time. It is also observed that the output power
Figure 4.47: Average output power as a function of pump power

189
amplitude near the peak of the spectrum, measured to be roughly -14 dBm at
wavelengths between 1563.8 nm and 1564.4 nm, does not change with the pump power.
It can thus be inferred that at this point, the power spectral density is not dependent on
the pump power. From the above results, it can be seen that graphene oxide can provide
a good alternative as an SA in producing stable Q-switched pulses. The average output
power of the EDFL is higher, at 3.7 mW, as compared to similar systems using
graphene-based SAs taken at the same pump power of about 100 mW, having an
average output power of 1.7 mW [1], 0.8 mW [66], and about 1.1 mW [36].
Figure 4.48: Output spectrum of the graphene-oxide Q-switched EDFL
From the experimental results, it can be inferred that the output of this graphene
oxide-based Q-switched EDFL is stable, with a higher average output power as
compared to similar systems using graphene as the saturable absorber. It is also
observed that graphene oxide based Q-switched fiber laser could provide higher pulse
energy and higher power slope efficiency compared to those normally achieved by
190
graphene-based Q-switched fiber lasers. This could be of interest for applications that
require large pulse energies in a compact fiber-based system.

191
References
1. Popa, D., Sun, Z., Hasan, T., Torrisi, F., Wang, F., & Ferrari, A. C. (2011).
Graphene Q-switched, tunable fiber laser. Applied Physics Letters, 98(7), 073106-
073106.
2. Svelto, O. (1998). Principles of Lasers (4th ed.). New York: Plenum Press. 3. Williams, R. J., Jovanovic, N., Marshall, G. D., & Withford, M. J. (2010). All-
optical, actively Q-switched fiber laser. Optics Express, 18(8), 7714-7723.
4. Sun, Q., Mao, Q. H., Chen, X. D., Feng, S. J., Liu, W. Q., & Lit, J. W. Y. (2010).
Influences of ASE on the performances of Q-switched ytterbium-doped fiber
lasers. Laser Physics, 20(6), 1438-1448.
5. Villegas, I. L., Cuadrado-Laborde, C., Díez, A., Cruz, J. L., Martínez-Gámez, M.
A., & Andrés, M. V. (2011). Yb-doped strictly all-fiber laser actively Q-switched
by intermodal acousto-optic modulation. Laser Physics, 21(9), 1650-1655.
6. Li, X. L., Xu, J. L., Wu, Y. Z., He, J. L., & Hao, X. P. (2011). Large energy laser
pulses with high repetition rate by graphene Q-switched solid-state laser. Optics
Express, 19(10), 9950-9955.
7. Bao, Q., Zhang, H., Wang, Y., Ni, Z., Yan, Y., Shen, Z. X., Loh, K. P., & Tang,
D. Y. (2009). Atomic-layer graphene as a saturable absorber for ultrafast pulsed
lasers. Advanced Functional Materials, 19(19), 3077-3083.
8. Tanaka, S., Yokosuka, H., Ogawa, T., & Takahashi, N. (2004, October).
Wavelength-switchable fiber laser for thermally stabilized fiber Bragg grating
vibration sensor array. In Sensors, 2004. Proceedings of IEEE (pp. 1301-1304).
IEEE.

192
9. Liu, S., Gao, L., Yin, Z., Shi, Y., Zhang, L., Chen, X., & Cheng, J. (2011). Simple
hybrid wire–wireless fiber laser sensor by direct photonic generation of beat
signal. Applied Optics, 50(12), 1792-1797.
10. Wei, X., Wei, T., Xiao, H., & Lin, Y. S. (2008). Nano-structured Pd-long period
fiber gratings integrated optical sensor for hydrogen detection. Sensors and
Actuators B: Chemical, 134(2), 687-693.
11. Chan, C. C., Gong, J. M., Jin, W., & Demokan, M. S. (2000). Investigation of
unwanted interferometric signals in a fiber Bragg grating sensor using a tunable
laser and a first derivative interrogation technique. Optics Communications,
173(1), 203-210.
12. Shemshad, J., Aminossadati, S. M., & Kizil, M. S. (2012). A review of
developments in near infrared methane detection based on tunable diode laser.
Sensors and Actuators B: Chemical, 171, 77-92.
13. Fu, Z., Yang, D., Ye, W., Kong, J., & Shen, Y. (2009). Widely tunable compact
erbium-doped fiber ring laser for fiber-optic sensing applications. Optics & Laser
Technology, 41(4), 392-396.
14. Yao, C. L., Lee, S. L., Hung Jr, Y., Pan, Y. T., Jeng, J. L., & Wang, H. C. (2009).
Novel tunable laser sources with 1.5-μm and 1.57-μm cascaded DFB reflectors for
in situ gas monitoring applications. Sensors and Actuators B: Chemical, 140(2),
371-377.
15. Changchun, L., Zuhong, L., & Fei, L. (2000). Measurement of absolute strain
based on a tunable cw semiconductor laser. Sensors and Actuators A:
Physical, 80(1), 31-34.

193
16. Gladyshev, A. V., Belovolov, M. I., Vasiliev, S. A., Dianov, E. M., Medvedkov,
O. I., Nadezhdinskii, A. I., Ershov, O. V., Beresin, A. G., Duraev, V. P., &
Nedelin, E. T. (2004). Tunable single-frequency diode laser at wavelength λ =
1.65 μm for methane concentration measurements. Spectrochimica Acta Part A:
Molecular and Biomolecular Spectroscopy, 60(14), 3337-3340.
17. Zhou, D. P., Wei, L., & Liu, W. K. (2012). Tunable graphene Q-switched erbium-
doped fiber laser with suppressed self-mode locking effect. Applied
Optics, 51(14), 2554-2558.
18. Cao, W. J., Wang, H. Y., Luo, A. P., Luo, Z. C., & Xu, W. C. (2012). Graphene-
based, 50 nm wide-band tunable passively Q-switched fiber laser. Laser Physics
Letters, 9(1), 54-58.
19. Ahmad, H., Zulkifli, M. Z., Muhammad, F. D., Zulkifli, A. Z., & Harun, S. W.
(2013). Tunable graphene-based Q-switched erbium-doped fiber laser using fiber
Bragg grating. Journal of Modern Optics, 60(3), 202-212.
20. Frenkel, A., & Lin, C. (1989). Angle-tuned etalon filters for optical channel
selection in high density wavelength division multiplexed systems. Journal of
Lightwave Technology, 7(4), 615-624.
21. Hibino, Y. (2000). An array of photonic filtering advantages: Arrayed-waveguide-
grating multi/demultiplexers for photonic networks. Circuits and Devices
Magazine, IEEE, 16(6), 21-27.
22. Erdogan, T. (1997). Fiber grating spectra. Journal of Lightwave Technology,
15(8), 1277-1294.

194
23. Lin, C. Y., Chern, G. W., & Wang, L. A. (2001). Periodical corrugated structure
for forming sampled fiber Bragg grating and long-period fiber grating with
tunable coupling strength. Journal of Lightwave Technology, 19(8), 1212-1220.
24. Hill, K. O., & Meltz, G. (1997). Fiber Bragg grating technology fundamentals and
overview. Journal of Lightwave Technology, 15(8), 1263-1276.
25. Goh, C. S., Set, S. Y., & Kikuchi, K. (2002). Widely tunable optical filters based
on fiber Bragg gratings. Photonics Technology Letters, IEEE, 14(9), 1306-1308.
26. Chong, S. S., Ahmad, H., Zulkifli, M. Z., Latif, A. A., Chong, W. Y., & Harun, S.
W. (2012). Synchronous tunable wavelength spacing dual-wavelength SOA fiber
ring laser using Fiber Bragg grating pair in a hybrid tuning package. Optics
Communications, 285(6), 1326-1330.
27. Retrieved from http://www.fbgs.com/technology/fbg-principle/
28. Loh, W. H., Samson, B. N., Dong, L., Cowle, G. J., & Hsu, K. (1998). High
performance single frequency fiber grating-based erbium: ytterbium-codoped
fiber lasers. Journal of Lightwave Technology, 16(1), 114.
29. Bonfrate, G., Vaninetti, F., & Negrisolo, F. (1998). Single-frequency MOPA Er3+
DBR fiber laser for WDM digital telecommunication systems. Photonics
Technology Letters, IEEE, 10(8), 1109-1111.
30. Pradhan, S., Town, G. E., & Grant, K. J. (2006). Dual-wavelength DBR fiber
laser. Photonics Technology Letters, IEEE, 18(16), 1741-1743.
31. Chung, W. H., Tam, H. Y., Demokan, M. S., Wai, P. K. A., & Lu, C. (2001).
Frequency stabilization of DBR fiber grating laser using interferometric
technique. Photonics Technology Letters, IEEE, 13(9), 951-953.

195
32. Lu, W., Guo, T., Wong, A. C., Tam, H. Y., & He, S. (2010). Highly sensitive
bending sensor based on Er3+-doped DBR laser. Optics Express, 18(17), 17834-
17840.
33. Slavik, R., Castonguay, I., LaRochelle, S., & Doucet, S. (2004). Short
multiwavelength fiber laser made of a large-band distributed Fabry-Pe´ rot
structure. Photonics Technology Letters, IEEE, 16(4), 1017-1019.
34. Ball, G. A., & Morey, W. W. (1992). Continuously tunable single-mode erbium
fiber laser. Optics Letters, 17(6), 420-422.
35. Xia, M., Kwok, C. H., Penty, R. V., White, I. H., Hasler, K. H., Sumpf, B., &
Erbert, G. (2009, May). Single-mode Q-switched pulse generation from a tapered
DBR laser. In Conference on Lasers and Electro-Optics. Optical Society of
America.
36. Luo, Z., Zhou, M., Weng, J., Huang, G., Xu, H., Ye, C., & Cai, Z. (2010).
Graphene-based passively Q-switched dual-wavelength erbium-doped fiber
laser. Optics Letters, 35(21), 3709-3711.
37. Chen, Z., Ma, S., & Dutta, N. K. (2009). Multiwavelength fiber ring laser based
on a semiconductor and fiber gain medium. Optics Express, 17(3), 1234-1239.
38. Al-Mansoori, M. H., & Mahdi, M. A. (2009). Multiwavelength L-band Brillouin–
Erbium comb fiber laser utilizing nonlinear amplifying loop mirror. Lightwave
Technology, Journal of, 27(22), 5038-5044.
39. Al-Mansoori, M. H., Mahdi, M. A., & Premaratne, M. (2009). Novel
multiwavelength L-band Brillouin–erbium fiber laser utilizing double-pass
Brillouin pump preamplified technique. Selected Topics in Quantum Electronics,
IEEE Journal of, 15(2), 415-421.

196
40. Yang, J., Tjin, S. C., & Ngo, N. Q. (2007). Multiwavelength actively mode-locked
fiber laser with a double-ring configuration and integrated cascaded sampled fiber
Bragg gratings. Optical Fiber Technology, 13(3), 267-270.
41. Shahabuddin, N. S., Harun, S. W., Zulkifli, M. Z., Thambiratnam, K., & Ahmad,
H. (2008). Bismuth-based Brillouin/erbium fiber laser. Journal of Modern Optics,
55(8), 1345-1351. 42. Jun, C. S., & Kim, B. Y. (2011). Mode-locking and Q-switching in multi-
wavelength fiber ring laser using low frequency phase modulation. Optics
Express, 19(7), 6290-6295. 43. Ahmad, H., Parvizi, R., Dimyati, K., Tamjis, M. R., & Harun, S. W. (2010).
FWM-based multi-wavelength erbium-doped fiber laser using Bi-EDF. Laser
Physics, 20(6), 1414-1417. 44. Han, Y. G., Tran, T. V. A., & Lee, S. B. (2006). Wavelength-spacing tunable
multiwavelength erbium-doped fiber laser based on four-wave mixing of
dispersion-shifted fiber. Optics Letters, 31(6), 697-699. 45. Al-Mansoori, M. H., Abd-Rahman, M. K., Mahamd Adikan, F. R., & Mahdi, M.
A. (2005). Widely tunable linear cavity multiwavelength Brillouin-Erbium fiber
lasers. Optics Express, 13(9), 3471-3476. 46. Yamashita, S., & Cowle, G. J. (1998). Bidirectional 10-GHz optical comb
generation with an intracavity fiber DFB pumped Brillouin/erbium fiber laser.
Photonics Technology Letters, IEEE, 10(6), 796-798. 47. Cowle, G. J., & Stepanov, D. Y. (1996). Hybrid Brillouin/erbium fiber laser.
Optics Letters, 21(16), 1250-1252.

197
48. Harun, S. W., & Ahmad, H. (2002). Multiwavelength laser comb in L-band region
with dual-cavity Brillouin/erbium fiber laser. Japanese Journal of Applied
Physics, 41(11A), L1234-L1236. 49. Lim, D. S., Lee, H. K., Kim, K. H., Kang, S. B., Ahn, J. T., & Jeon, M. Y. (1998).
Generation of multiorder Stokes and anti-Stokes lines in a Brillouin erbium-fiber
laser with a Sagnac loop mirror. Optics Letters, 23(21), 1671-1673. 50. Al‐Mansoori, M. H., Bouzid, B., Saharudin, S., Ali, B. M., Abdullah, M. K., &
Mahdi, M. A. (2004). Low‐threshold characteristics of a linear‐cavity
multiwavelength Brillouin/Erbium fiber laser. Microwave and Optical Technology
letters, 41(2), 114-117. 51. Lim, D. S., Lee, H. K., Kim, K. H., Kang, S. B., Ahn, J. T., Chang, D. I., & Jeon,
M. Y. (1998). Figure-of-eight Brillouin/erbium fibre lasers. Electronics
Letters, 34(25), 2406-2407. 52. Fotiadi, A. A., & Mégret, P. (2006). Self-Q-switched Er-Brillouin fiber source
with extra-cavity generation of a Raman supercontinuum in a dispersion-shifted
fiber. Optics Letters, 31(11), 1621-1623. 53. Sousa, J. M., & Okhotnikov, O. G. (1999). Multiple wavelength Q-switched fiber
laser. Photonics Technology Letters, IEEE, 11(9), 1117-1119. 54. Luo, Z., Zhou, M., Wu, D., Ye, C., Weng, J., Dong, J., Xu, H., Cai, Z., & Chen, L.
(2011). Graphene-induced nonlinear four-wave-mixing and its application to
multiwavelength Q-switched rare-earth-doped fiber lasers. Lightwave Technology,
Journal of, 29(18), 2732-2739.
198
55. Abd-Rahman, M. K., Abdullah, M. K., & Ahmad, H. (2000). Multiwavelength,
bidirectional operation of twin-cavity Brillouin/erbium fiber laser. Optics
Communications, 181(1), 135-139. 56. Ahmad, H., Zulkifli, M. Z., Norizan, S. F., Jemangin, M. H., & Harun, S. W.
(2011). S-band multiwavelength Brillouin Raman fiber laser. Optics
Communications, 284(20), 4971-4974. 57. Komukai, T., Tamura, K., & Nakazawa, M. (1997). An efficient 0.04-nm
apodized fiber Bragg grating and its application to narrow-band spectral filtering.
Photonics Technology Letters, IEEE, 9(7), 934-936. 58. [Online]. Available: http://www.o-eland.com/ 59. Xu, J., Liu, J., Wu, S., Yang, Q. H., & Wang, P. (2012). Graphene oxide mode-
locked femtosecond erbium-doped fiber lasers. Optics Express, 20(14), 15474-
15480. 60. Loh, K. P., Bao, Q., Eda, G., & Chhowalla, M. (2010). Graphene oxide as a
chemically tunable platform for optical applications. Nature chemistry, 2(12),
1015-1024. 61. Zhao, X., Liu, Z. B., Yan, W. B., Wu, Y., Zhang, X. L., Chen, Y., & Tian, J. G.
(2011). Ultrafast carrier dynamics and saturable absorption of solution-
processable few-layered graphene oxide. Applied Physics Letters, 98(12), 121905. 62. Sobon, G., Sotor, J., Jagiello, J., Kozinski, R., Zdrojek, M., Holdynski, M.,
Paletko, P., Boguslawski, J., Lipinska, L., & Abramski, K. M. (2012). Graphene
oxide vs. reduced graphene oxide as saturable absorbers for Er-doped passively
mode-locked fiber laser. Optics Express, 20(17), 19463-19473.

199
63. Liu, Z. B., He, X., & Wang, D. N. (2011). Passively mode-locked fiber laser
based on a hollow-core photonic crystal fiber filled with few-layered graphene
oxide solution. Optics Letters, 36(16), 3024-3026. 64. Li, X., Li, G. Q., Zhao, S. Z., Wang, X. M., Yin, L., Huang, H., & Ma, X. M.
(2012). Diode-pumped Nd:YVO4 laser passively Q-switched with graphene oxide
spin coated on ITO substrate. Laser Physics, 22(4), 673-677. 65. Wang, Y. G., Chen, H. R., Wen, X. M., Hsieh, W. F., & Tang, J. (2011). A highly
efficient graphene oxide absorber for Q-switched Nd: GdVO4 lasers.
Nanotechnology, 22(45), 455203. 66. Zhang, L. Q., Zhuo, Z., Wang, J. X., & Wang, Y. Z. (2012). Passively Q-switched
fiber laser based on graphene saturable absorber. Laser Physics, 22(2), 433-436.

200
CHAPTER 5
GRAPHENE FOR MODE LOCKED FIBER LASERS
5.1 Introduction
As has been described in Chapter 2, mode-locking is the technique enabling
pulse laser with very short pulse duration, typically ranging from tens of picosecond to
sub-10 femtoseconds. Unlike Q-switching, the pulse in mode locking is generated from
the interference of multiple modes in the cavity, which causes a fixed phase relationship
of the cavity modes. The mode locked laser generation also relies on many aspects, such
as dispersion and nonlinearity of the cavity, which must be well and carefully balanced
to acquire a stable operation. In addition, the repetition rate in mode locking is
equivalent to the inverse of the cavity round-trip time, which is not pertainable in Q-
switching.
Recently, compact ultrafast fiber lasers have become the focus of substantial
research efforts due to their significant applications. Ultrafast fibers are usually enabled
by active modulation techniques. While these systems are able to generate the desired
ultrafast pulses with advantages such as low timing jitters and high repetition rates, they
are typically complex and costly and thus not particularly suited for deployment in
compact systems or high-density networks. Furthermore, this technique has a higher
risk of instability due to external perturbations and large supermode noises. On the other
hand, passive modulation techniques such as the use of semiconductor saturable
absorber mirrors (SESAMs) or non-polarization rotation reduce these issues. However,

201
these approaches can be difficult to implement, requiring fine adjustments to the cavity
design, or incurring varying degrees of cost and complexity, thereby limiting their usage
as well as rendering the development of a compact ultrafast fiber laser unfeasible. An
interesting way in realizing the passively mode-locked fiber laser is by incorporating a
broadband saturable absorber (SA) within the laser cavity, such that tunability can be
provided over a wide wavelength range. In this regard, passively mode-locked fiber
lasers based on graphene SA are seen as a viable alternative towards the former
systems, with high potential for practical, real-world applications. Used as a saturable
absorber (SA), graphene can generate the desired mode-locked pulses without
complexity and costs. With its advantage over SESAMs in terms of the cost, tuning
range and ease of fabrication, graphene has been widely accepted to replace the usage of
SESAM. Another carbon allotrope known as carbon nanotubes (CNT) has also been
well demonstrated as the SA for mode-locking. However, the operational wavelength
range of CNT is quite limited due to the absence of the gapless behavior of the atomic
layer as possessed by graphene. Furthermore, graphene-based SAs possess impressive
optical characteristics such as ultrafast recovery times and a very wide operational
wavelength range, due to the gapless behavior of the graphene atomic layer, giving
them a significant advantage over other techniques used for passive modulation in fiber
lasers.
This chapter starts with the demonstration of graphene-based mode locked in a
simple ring cavity EDFL. Further development of the setup is done by inserting a
tunable bandpass filter (TBF) into the mode-locked laser cavity to produce a tunable
graphene-based mode locked EDFL. A highly doped zirconia-erbium doped fiber (Zr-
EDF) is then introduced as the gain medium for generating a graphene-based mode
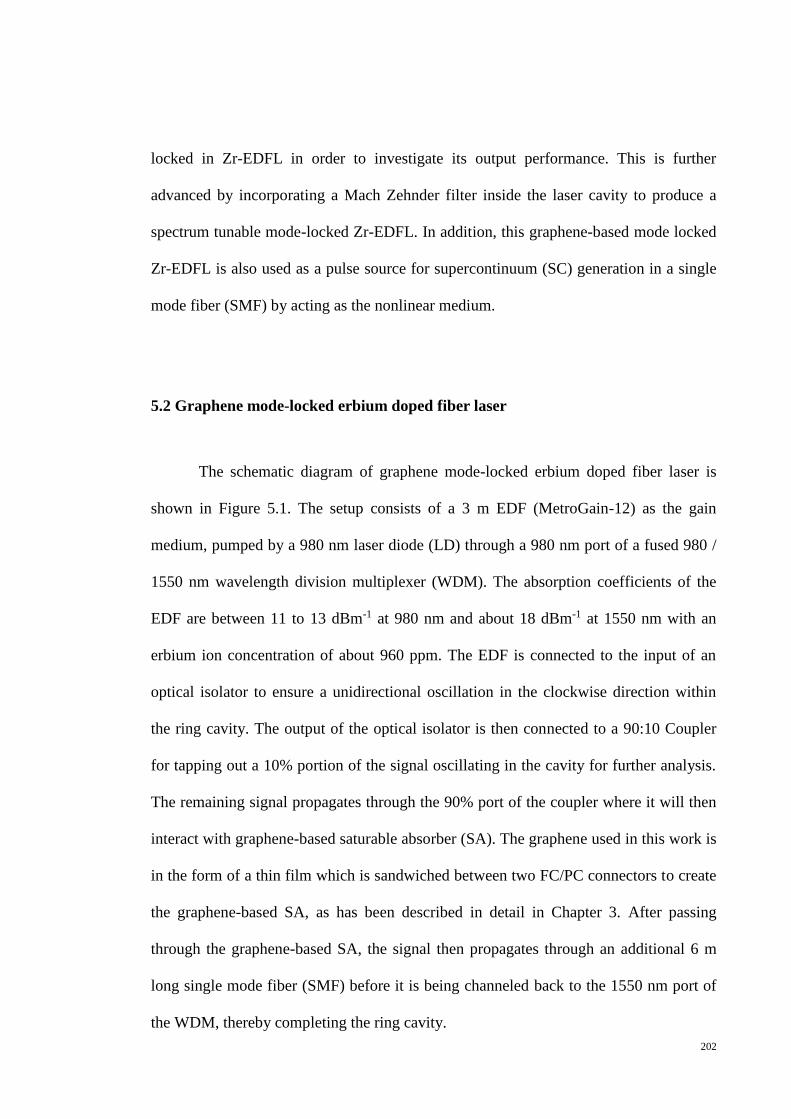
202
locked in Zr-EDFL in order to investigate its output performance. This is further
advanced by incorporating a Mach Zehnder filter inside the laser cavity to produce a
spectrum tunable mode-locked Zr-EDFL. In addition, this graphene-based mode locked
Zr-EDFL is also used as a pulse source for supercontinuum (SC) generation in a single
mode fiber (SMF) by acting as the nonlinear medium.
5.2 Graphene mode-locked erbium doped fiber laser
The schematic diagram of graphene mode-locked erbium doped fiber laser is
shown in Figure 5.1. The setup consists of a 3 m EDF (MetroGain-12) as the gain
medium, pumped by a 980 nm laser diode (LD) through a 980 nm port of a fused 980 /
1550 nm wavelength division multiplexer (WDM). The absorption coefficients of the
EDF are between 11 to 13 dBm-1 at 980 nm and about 18 dBm-1 at 1550 nm with an
erbium ion concentration of about 960 ppm. The EDF is connected to the input of an
optical isolator to ensure a unidirectional oscillation in the clockwise direction within
the ring cavity. The output of the optical isolator is then connected to a 90:10 Coupler
for tapping out a 10% portion of the signal oscillating in the cavity for further analysis.
The remaining signal propagates through the 90% port of the coupler where it will then
interact with graphene-based saturable absorber (SA). The graphene used in this work is
in the form of a thin film which is sandwiched between two FC/PC connectors to create
the graphene-based SA, as has been described in detail in Chapter 3. After passing
through the graphene-based SA, the signal then propagates through an additional 6 m
long single mode fiber (SMF) before it is being channeled back to the 1550 nm port of
the WDM, thereby completing the ring cavity.

203
The additional 6 m long SMF in between the SA and the 1550 nm port of the
WDM changes the total group velocity dispersion (GVD) of the cavity. This is
significant for attaining the balance between the dispersion and nonlinearity of the
cavity in order to get a stable mode-locked operation. In addition, the cavity length
needs to be long enough to achieve an adequate nonlinear phase shift for the mode-
locked pulse generation. The total cavity length is about 10.4 m, with a total SMF
length of approximately 7.4 m, taking into account the remaining SMF lengths in the
cavity apart from the additional 6 m long SMF. The dispersion parameter D of the EDF
is approximately -61.9 ps/nm.km, giving a group velocity dispersion (GVD) coefficient
of around +32 ps2/km. On the other hand, the dispersion coefficient of the SMF-28 is
about +17 ps/nm.km, giving a GVD coefficient of -22.02 ps2/km. The total GVD for the
entire cavity is -0.07 ps2, thereby putting the operation of the laser in the anomalous
dispersion regime and allowing the laser to operate in a soliton mode-locking regime. A
Yokogawa AQ6317 optical spectrum analyzer (OSA) with a resolution of 0.02 nm is
used to measure the output spectrum of the generated mode-locked laser, while the
mode-locked time characteristics are measured using an Alnair HAC-200 auto-
correlator. A LeCroy 352A oscilloscope, together with an Agilent 83440C lightwave
detector for optical to electrical conversion, is used to analyze the mode locked pulse
train properties. The radio frequency spectrum of the mode locked pulses is also
observed by using an Anritsu MS2683A radio frequency spectrum analyzer (RFSA).
For the additional measurement of the mode-locked time characteristics, an Alnair
HAC-200 auto-correlator is used.

204
Figure 5.1: Experimental setup of graphene mode-locked EDFL
Soliton mode-locking operation is self-started at a threshold pump power of 60
mW. This mode locking threshold value outperforms several other reported threshold
achieved by graphene-based mode locked EDFL such as reported in [1, 2]. The
threshold pump power is dependent on the cavity losses and also the quality of the
graphene layer. As such, graphene with a relatively high ratio of saturable to non-
saturable absorption is desirable for achieving low threshold power [3]. All subsequent
measurements in this experiment are taken at the pump power of 60 mW. Figure 5.2
shows the optical spectrum of the mode-locked pulses, which spans from 1522 to 1594
980 nm LD
980/1550 nm WDM
3 m EDF
Isolator
PC
90:10 Coupler
Graphene
based SA
90%
10%
OSA or OE Converter
with Oscilloscope
6 m SMF inserted for mode locking operation

205
nm with a 3 dB spectral bandwidth of about 11.6 nm at a central wavelength at 1558
nm. The 3 dB bandwidth obtained in this work is comparable with the one reported in
other related research works [1, 4, 5] which use graphene as the saturable absorber.
Multiple Kelly’s sidebands or sub-sidebands are also observed, indicating the
system is operating in the soliton regime. As can be seen from the figure, no crease
patterns or continuous wave (CW) lasing peaks are observed at the midpoint or at any
other part of the output spectrum. This situation is desirable in mode-locking system, as
the presence of a CW component will slightly affect the mode-locking stability. For an
ideal case, all CW components are supposed to be suppressed with the existence of a
saturable absorber in the cavity [6]. The formation of the Kelly’s sidebands as observed
in the figure is due to the periodical perturbation of the intracavity [7], which confirms
the attainment of the anomalous dispersion, soliton-like mode-locking operation.
Dispersion and nonlinearity of the intracavity medium are two main laser cavity
parameters interrelating with each other, and which are responsible for the formation of
the soliton-like pulse in the laser [8]. A total dispersion of anomalous cavity will result
in the formation of soliton mode-locked pulse and will produce much shorter pulse
duration compared to the time constant of absorption recovery after a saturating pulse,
known as the saturable absorber’s recovery time [9].
In general, besides the cavity dispersion and non-linearity, there are several other
parameters of laser cavity that could influence the mode-locking performance of fiber
lasers. These parameters include laser gain, output coupler ratio, cavity loss associated
with the components used such as insertion loss, and most essentially the saturable
absorber properties [10]. In fact, the main function of saturable absorber is for initiating

206
the self-starting of mode locked operation as well as maintaining the stability of the
generated pulse [9,10].
The working mechanism of saturable absorber for providing the self-starting
effect can be described in such a way that it contributes to the growth of noise
fluctuations produced by the spontaneous emission in the gain medium. In this manner,
the CW laser operation will be changed to the pulsed laser operation [11]. To attain such
pulsed laser operation, the saturable absorber, which in this case is the graphene thin
film, is the key enabler for triggering the pulse shaping. Once the pulse shaping has
been formed, the saturable absorber then plays the role of sustaining the pulse stability.
In theory, the self-starting efficiency and the stabilization efficiency of the single
pulse operation are determined by the modulation depth of the saturable absorber, such
that a higher modulation depth of the saturable absorber will result in a more operative
self-starting and stabilization of the single pulse oscillation [11]. Nevertheless, it is
reported that a higher nonsaturable to saturable absorption ratio is normally found in a
higher modulation depth of saturable absorber, which will consequently increase the
cavity loss and thus exhibit a poorer laser operation [12]. Hence, it is crucial to wisely
regulate the absorption of the saturable absorber [11]. In the case of mode locked pulse
generation based on the nonlinear polarization rotation (NPR) technique, self-phase
modulation (SPM) and cross phase modulation (XPM) occur in the fiber, along with
some uncontrolled birefringence [13]. The working mechanism of a saturable absorber,
on the other hand, is by providing the intensity dependent loss that is responsible for
mode-locked pulse generation.

207
To investigate and verify the stability of the mode locked operation in this
research work, a short-term stability measurement of the output spectrum at the pump
power of 60 mW is carried out over 60 minutes observation time and the result is shown
in Figure 5.3. The central wavelength of 1558 nm with the output power of
approximately -36.7 dBm as well as the side bands shows no significant variation in
terms of output power and wavelength within the observation time, as can be seen from
the figure. The mode locking performance could be maintained without the need to
control the PC. This proves that the output stability of this graphene-based mode locked
EDFL is well maintained over time.
-80
-70
-60
-50
-40
-30
1520 1530 1540 1550 1560 1570 1580 1590
Ou
tpu
tp
ow
er (
dB
m)
Wavelength (nm)
Figure 5.2: Output spectrum of the mode-locked laser
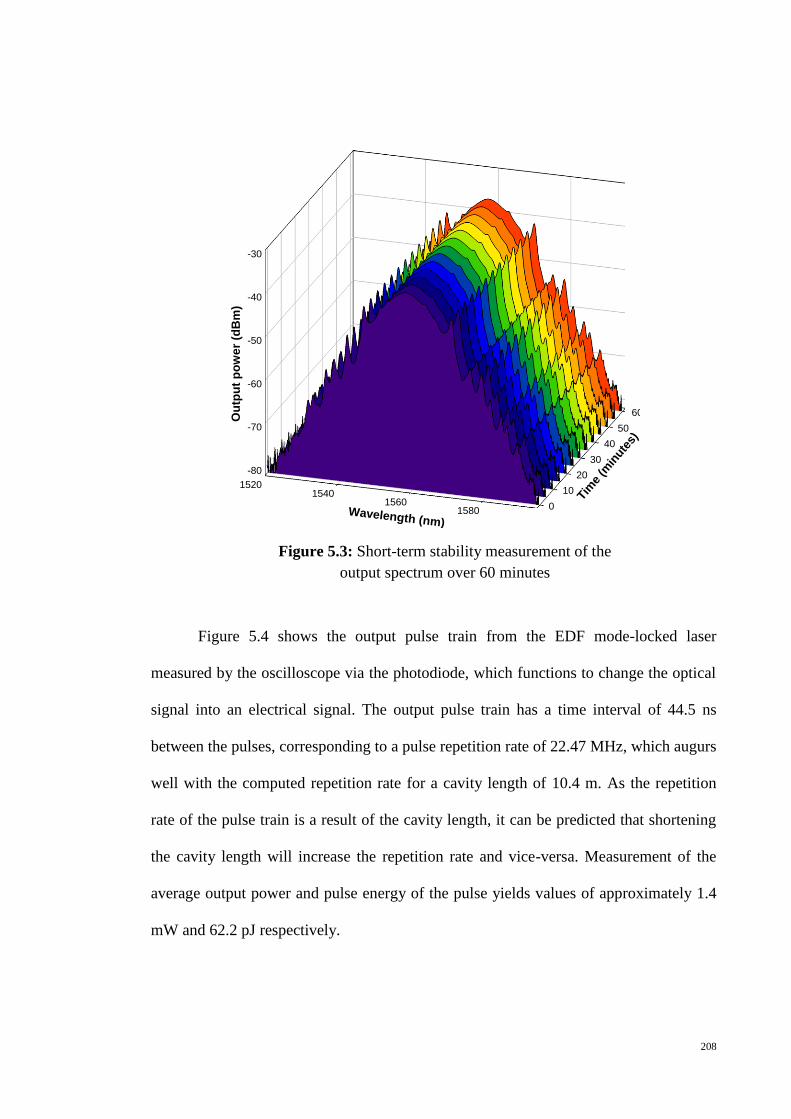
208
-80
-70
-60
-50
-40
-30
15201540
15601580 0
10
20
30
40
50
60
Ou
tpu
t p
ow
er
(dB
m)
Wavelength (nm)
Tim
e (m
inut
es)
Figure 5.4 shows the output pulse train from the EDF mode-locked laser
measured by the oscilloscope via the photodiode, which functions to change the optical
signal into an electrical signal. The output pulse train has a time interval of 44.5 ns
between the pulses, corresponding to a pulse repetition rate of 22.47 MHz, which augurs
well with the computed repetition rate for a cavity length of 10.4 m. As the repetition
rate of the pulse train is a result of the cavity length, it can be predicted that shortening
the cavity length will increase the repetition rate and vice-versa. Measurement of the
average output power and pulse energy of the pulse yields values of approximately 1.4
mW and 62.2 pJ respectively.
Figure 5.3: Short-term stability measurement of the
output spectrum over 60 minutes
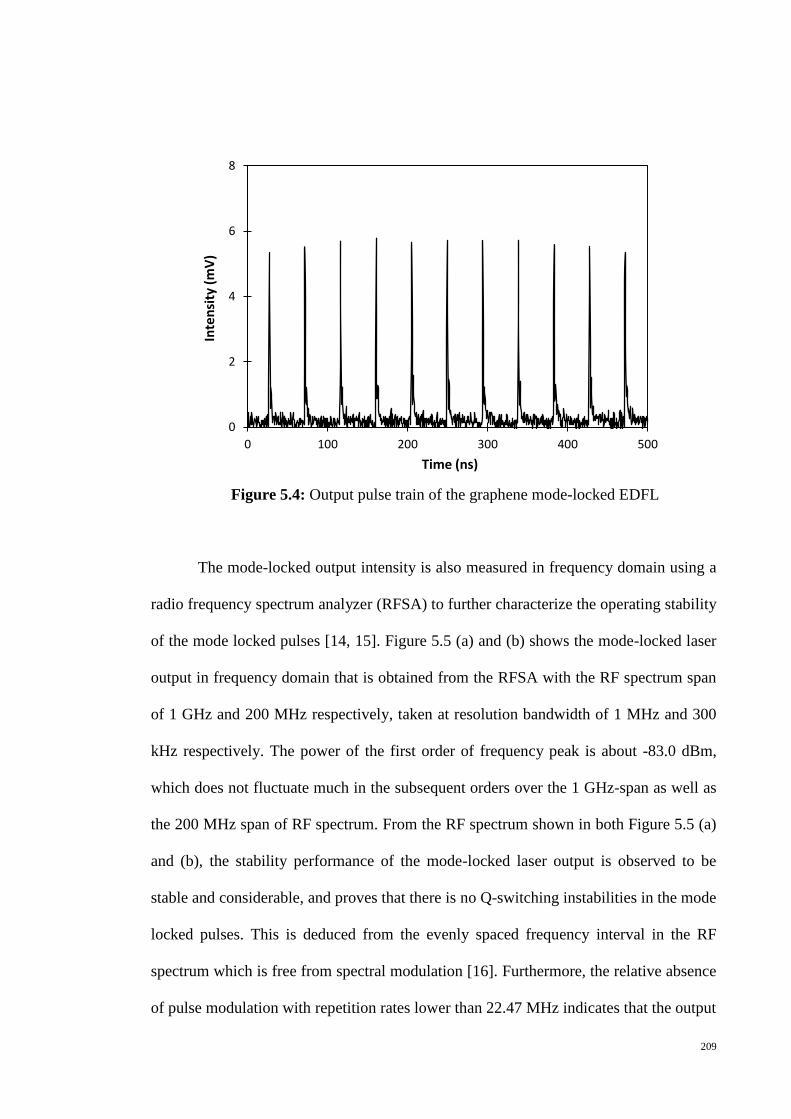
209
The mode-locked output intensity is also measured in frequency domain using a
radio frequency spectrum analyzer (RFSA) to further characterize the operating stability
of the mode locked pulses [14, 15]. Figure 5.5 (a) and (b) shows the mode-locked laser
output in frequency domain that is obtained from the RFSA with the RF spectrum span
of 1 GHz and 200 MHz respectively, taken at resolution bandwidth of 1 MHz and 300
kHz respectively. The power of the first order of frequency peak is about -83.0 dBm,
which does not fluctuate much in the subsequent orders over the 1 GHz-span as well as
the 200 MHz span of RF spectrum. From the RF spectrum shown in both Figure 5.5 (a)
and (b), the stability performance of the mode-locked laser output is observed to be
stable and considerable, and proves that there is no Q-switching instabilities in the mode
locked pulses. This is deduced from the evenly spaced frequency interval in the RF
spectrum which is free from spectral modulation [16]. Furthermore, the relative absence
of pulse modulation with repetition rates lower than 22.47 MHz indicates that the output
0
2
4
6
8
0 100 200 300 400 500
Inte
nsi
ty (
mV
)
Time (ns)
Figure 5.4: Output pulse train of the graphene mode-locked EDFL

210
pulse is operating in entirely CW mode-locking regime, and is therefore not susceptible
to pulses with low-repetition rate modulation that arise from relaxation oscillations
[17,18]. The RF spectrum provides a frequency interval reading of approximately 22.4
MHz, which indicates that the repetition rate value of this mode-locked pulse is around
22.4 MHz, auguring well with the measurements of pulse repetition rate value obtained
from the oscilloscope.
-130
-120
-110
-100
-90
-80
-70
0 0.2 0.4 0.6 0.8 1
Frequency (GHz)
Po
we
r (d
Bm
)
-130
-120
-110
-100
-90
-80
-70
-60
0 50 100 150 200
Frequency (MHz)
Po
wer
(d
Bm
)
(a)
Figure 5.5: RF spectrum of the mode-locked pulses at
(a) 1 GHz span, (b) 200 MHz span
(b)

211
Figure 5.6 (a) plots the fundamental cavity round-trip frequency observed at
22.47 MHz in the RF spectrum, which is measured with about 550 kHz frequency span
and 300 Hz resolution. The measured RF spectrum indicates that the mode-locked laser
output works in its fundamental regime, which is similar to the repetition rate measured
from the pulse train in Figure 5.4. The estimated peak-to-background ratio, obtained
from the intensity ratio of the frequency peak to the pedestal extinction, is estimated to
be approximately 56 dB, which is of a comparable value to that as reported in [3 - 5].
This implies low amplitude noise fluctuations, good mode-locking stability as well as
low timing jitter [14, 15]. The energy fluctuation, defined as the change of output pulse
energy per average output energy, ΔE/E [19] of the laser, can be estimated from
Equation 2.27 [14, 15, 19]. For the case of low amplitude noise fluctuation, the timing
jitter value can be estimated as well by using Equation 2.28 [15, 19]. Figure 5.6 (b) plots
the tenth harmonic frequency of the RF spectrum, which has a clearly defined pulse
peak-to-noise ratio of about 51 dB, thus further validating the low timing jitter and good
mode-locking stability of the mode locked laser. From both Figure 5.6 (a) and (b), it can
be seen that the RF spectrum exhibits no sidebands, signifying no Q-switching
instabilities and good stability of the pulse-train [19], as has been proven by the spectral
sweep over 1 GHz and 200 MHz as shown in Figure 5.5 (a) and (b) respectively.
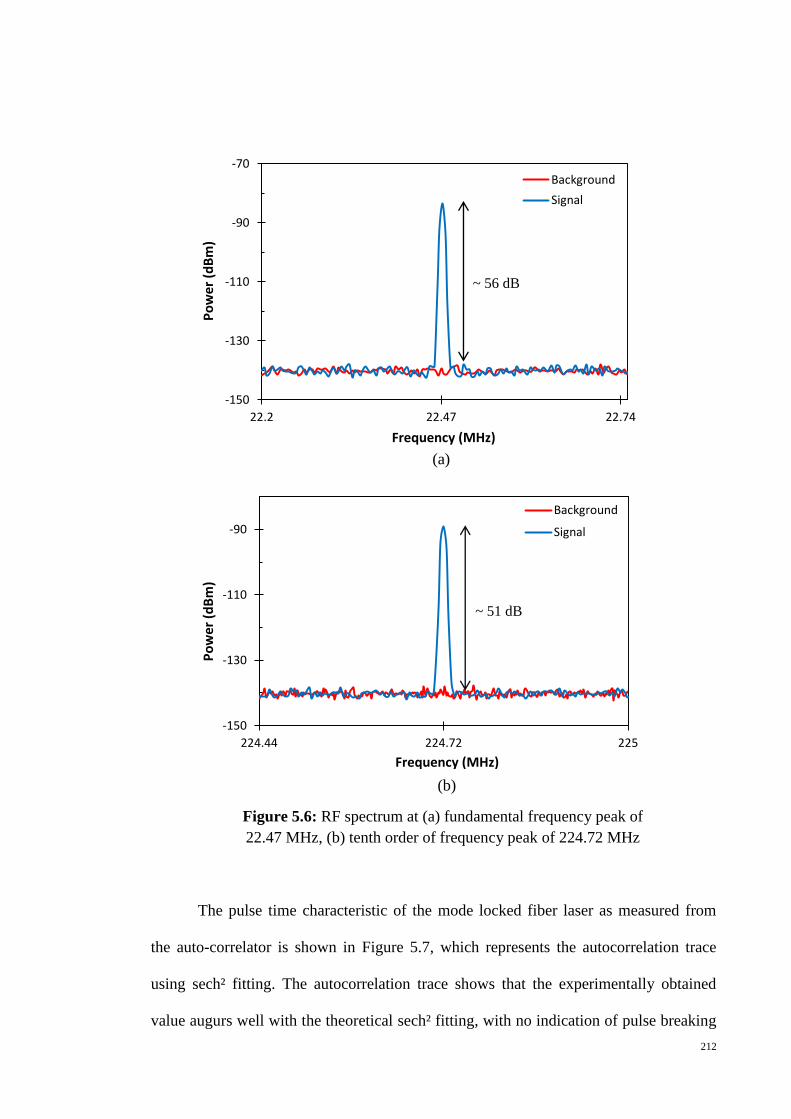
212
The pulse time characteristic of the mode locked fiber laser as measured from
the auto-correlator is shown in Figure 5.7, which represents the autocorrelation trace
using sech² fitting. The autocorrelation trace shows that the experimentally obtained
value augurs well with the theoretical sech² fitting, with no indication of pulse breaking
-150
-130
-110
-90
-70
22.2 22.47 22.74
Background
SignalP
ow
er (
dB
m)
Frequency (MHz)
~ 56 dB
-150
-130
-110
-90
224.44 224.72 225
Background
Signal
Po
we
r (d
Bm
)
Frequency (MHz)
~ 51 dB
(a)
Figure 5.6: RF spectrum at (a) fundamental frequency peak of
22.47 MHz, (b) tenth order of frequency peak of 224.72 MHz
(b)

213
or pulse pair generation, giving an estimated full-width half maximum (FWHM) pulse
duration of 300 fs by assuming the sech2 pulse shape, and thus confirming soliton-like
operation [8, 20]. The pulse duration obtained in this work is comparatively shorter than
previously reported pulse duration in graphene mode-locked EDFL [4-6,8]. A time
bandwidth pulse (TBP) of 0.43 is obtained from the product of the 3 dB bandwidth of
the optical spectrum (11.6 nm or 1.43 THz) and the pulse duration at FWHM. The
obtained TBP value shows minor deviation from the expected transform-limited sech2
pulse of 0.315 [20], which is equivalent to the shortest pulse duration for a given
spectral width [8, 17, 20]. Taking the case of a transform limit, the measured pulse
width is expected to be in the region of 220 fs. The slightly longer pulse obtained from
experiment, which in turn gives a slightly higher TBP, is attributed to the presence of
minor chirping in the pulse [20] which most probably originates from the remaining
dispersion in the laser cavity [21], or more specifically termed as uncompensated high
order dispersion [20, 22]. This uncompensated high order dispersion would cause the
distortion of the intracavity pulse [14, 23], hence restricting the minimum pulse duration
that could be achieved in a system [14, 20, 24]. It is of interest to further explain that for
small intracavity group velocity dispersion GVD, the uncompensated high order
dispersion comes from the third order dispersion [22, 24]. Differing from second order
dispersion such as the GVD, third order dispersion on the other hand has a positive
value for both standard SMF [25] and EDF [22], which indicates that the sign of the
third order dispersion for both fibers does not oppositely change from that of their
dispersion, as occurs in GVD. This leaves the third order dispersion uncompensated and
being accumulated with the cavity length [22]. By reducing the fiber length, shorter
pulses could likely be achieved as a result of the intracavity third order dispersion being
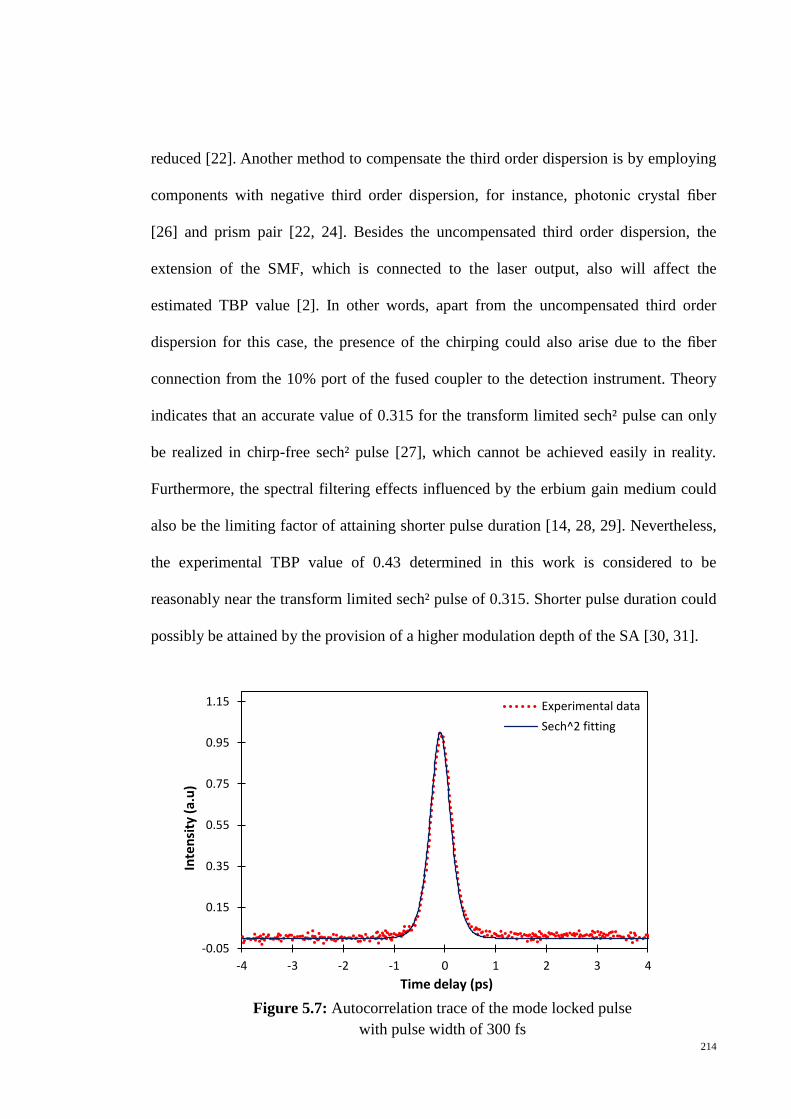
214
reduced [22]. Another method to compensate the third order dispersion is by employing
components with negative third order dispersion, for instance, photonic crystal fiber
[26] and prism pair [22, 24]. Besides the uncompensated third order dispersion, the
extension of the SMF, which is connected to the laser output, also will affect the
estimated TBP value [2]. In other words, apart from the uncompensated third order
dispersion for this case, the presence of the chirping could also arise due to the fiber
connection from the 10% port of the fused coupler to the detection instrument. Theory
indicates that an accurate value of 0.315 for the transform limited sech² pulse can only
be realized in chirp-free sech² pulse [27], which cannot be achieved easily in reality.
Furthermore, the spectral filtering effects influenced by the erbium gain medium could
also be the limiting factor of attaining shorter pulse duration [14, 28, 29]. Nevertheless,
the experimental TBP value of 0.43 determined in this work is considered to be
reasonably near the transform limited sech² pulse of 0.315. Shorter pulse duration could
possibly be attained by the provision of a higher modulation depth of the SA [30, 31].
-0.05
0.15
0.35
0.55
0.75
0.95
1.15
-4 -3 -2 -1 0 1 2 3 4
Experimental data
Sech^2 fitting
Time delay (ps)
Inte
nsi
ty (
a.u
)
Figure 5.7: Autocorrelation trace of the mode locked pulse
with pulse width of 300 fs
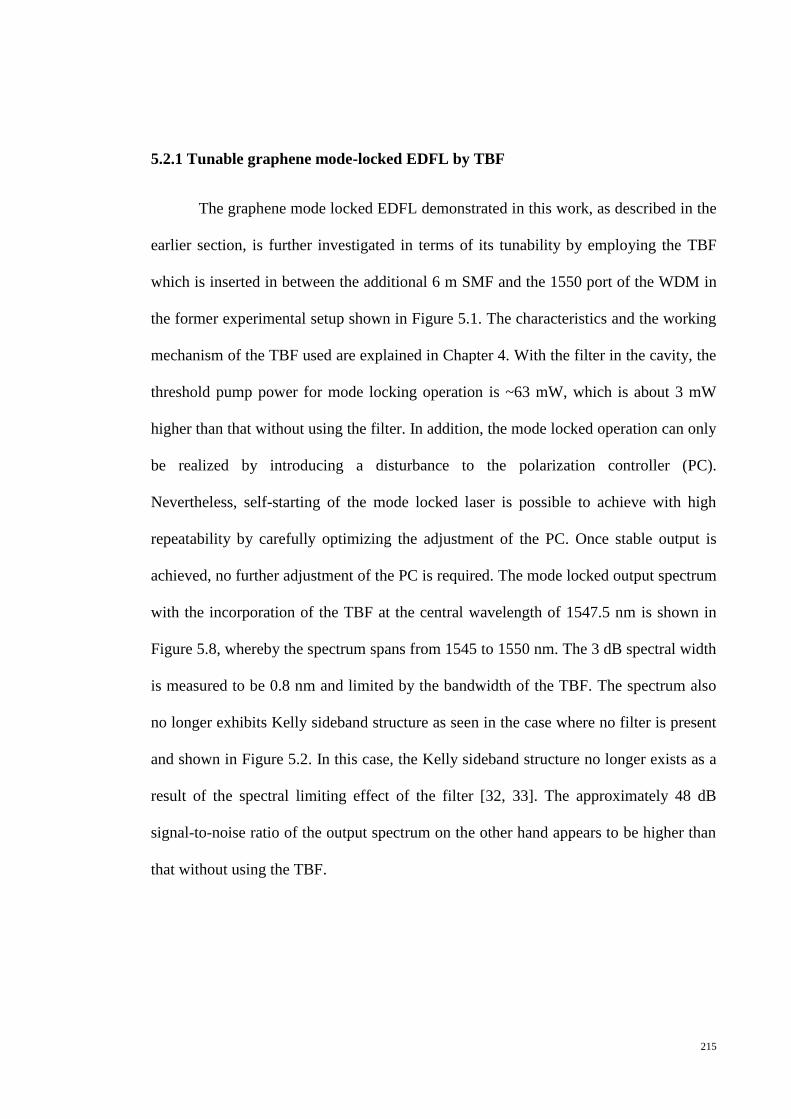
215
5.2.1 Tunable graphene mode-locked EDFL by TBF
The graphene mode locked EDFL demonstrated in this work, as described in the
earlier section, is further investigated in terms of its tunability by employing the TBF
which is inserted in between the additional 6 m SMF and the 1550 port of the WDM in
the former experimental setup shown in Figure 5.1. The characteristics and the working
mechanism of the TBF used are explained in Chapter 4. With the filter in the cavity, the
threshold pump power for mode locking operation is ~63 mW, which is about 3 mW
higher than that without using the filter. In addition, the mode locked operation can only
be realized by introducing a disturbance to the polarization controller (PC).
Nevertheless, self-starting of the mode locked laser is possible to achieve with high
repeatability by carefully optimizing the adjustment of the PC. Once stable output is
achieved, no further adjustment of the PC is required. The mode locked output spectrum
with the incorporation of the TBF at the central wavelength of 1547.5 nm is shown in
Figure 5.8, whereby the spectrum spans from 1545 to 1550 nm. The 3 dB spectral width
is measured to be 0.8 nm and limited by the bandwidth of the TBF. The spectrum also
no longer exhibits Kelly sideband structure as seen in the case where no filter is present
and shown in Figure 5.2. In this case, the Kelly sideband structure no longer exists as a
result of the spectral limiting effect of the filter [32, 33]. The approximately 48 dB
signal-to-noise ratio of the output spectrum on the other hand appears to be higher than
that without using the TBF.
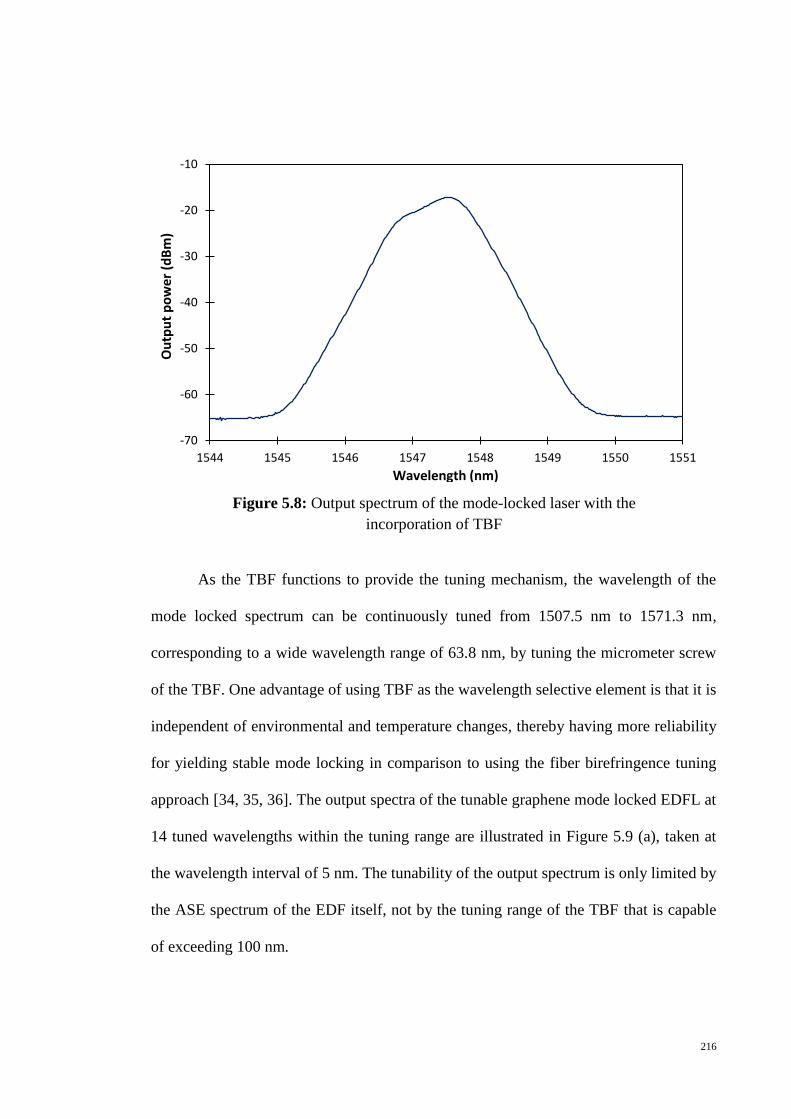
216
As the TBF functions to provide the tuning mechanism, the wavelength of the
mode locked spectrum can be continuously tuned from 1507.5 nm to 1571.3 nm,
corresponding to a wide wavelength range of 63.8 nm, by tuning the micrometer screw
of the TBF. One advantage of using TBF as the wavelength selective element is that it is
independent of environmental and temperature changes, thereby having more reliability
for yielding stable mode locking in comparison to using the fiber birefringence tuning
approach [34, 35, 36]. The output spectra of the tunable graphene mode locked EDFL at
14 tuned wavelengths within the tuning range are illustrated in Figure 5.9 (a), taken at
the wavelength interval of 5 nm. The tunability of the output spectrum is only limited by
the ASE spectrum of the EDF itself, not by the tuning range of the TBF that is capable
of exceeding 100 nm.
-70
-60
-50
-40
-30
-20
-10
1544 1545 1546 1547 1548 1549 1550 1551
Wavelength (nm)
Ou
tpu
t p
ow
er (
dB
m)
Figure 5.8: Output spectrum of the mode-locked laser with the
incorporation of TBF
217
Figure 5.9 (b) shows the corresponding autocorrelation traces of the different
wavelength spectra given in Figure 5.9 (a). As can be seen from the figure, no low-
intensity backgrounds (also known as pedestals) can be detected from the
autocorrelation traces at each different wavelength, which denotes that the mode locked
laser is operating in single pulse oscillation with no reflection occurring in the cavity
[20]. Concerning the GVD of this cavity with a total of anomalous dispersion, the
output pulses are thus predicted to be well fitted by a sech2 line shape [17,20]. This
prediction is proven correct and appropriate by the results obtained in Figure 5.9 (b) that
assume the sech2 pulse shape , which gives a distribution of pulse duration at the Full-
Width Half Maximum (FWHM) of between 3.9 ps to 6.6 ps at different wavelengths
within the tuning range. The measured average output power at 1547.5 nm is about 0.75
-70
-60
-50
-40
-30
-20
-10
1500 1510 1520 1530 1540 1550 1560 1570 1580
1571.3 nm1567.5 nm1562.5 nm1557.5 nm1552.5 nm1547.5 nm1542.5 nm1537.5 nm1532.5 nm1527.5 nm1522.5 nm1517.5 nm1512.5 nm1507.5 nm
Wavelength (nm)
Ou
tpu
t p
ow
er (
dB
m)
Figure 5.9 (a): Output spectra of the tunable graphene mode locked EDFL
at 14 tuned wavelengths at wavelength interval of 5 nm

218
mW, having a small variation across the tuning range. The corresponding pulse energy
is estimated to be about 58 pJ.
In agreement with the new total cavity length after the insertion of the TBF, the
measured repetition rate now gives a reading of 12.9 MHz, which decreases by about
9.5 MHz from the case without incorporating the TBF. This repetition rate value
corresponds to a pulse spacing of around 77.5 ns in the pulse train, as shown in Figure
5.10.
-0.05
0.15
0.35
0.55
0.75
0.95
1.15
-25 -20 -15 -10 -5 0 5 10 15 20 25
1571.3 nm
1567.5 nm
1562.5 nm
1557.5 nm
1552.5 nm
1547.5 nm
1542.5 nm
1537.5 nm
1532.5 nm
1527.5 nm
1522.5 nm
1517.5 nm
1512.5 nm
1507.5 nm
Time delay (ps)
Inte
nsi
ty(a
.u)
Time delay (ps)
Inte
nsi
ty(a
.u)
Time delay (ps)
Inte
nsi
ty(a
.u)
Time delay (ps)
Inte
nsi
ty(a
.u)
Time delay (ps)
Inte
nsi
ty(a
.u)
Time delay (ps)
Inte
nsi
ty(a
.u)
Time delay (ps)
Inte
nsi
ty(a
.u)
Time delay (ps)
Inte
nsi
ty(a
.u)
Time delay (ps)
Inte
nsi
ty(a
.u)
Time delay (ps)
Inte
nsi
ty(a
.u)
Time delay (ps)
Inte
nsi
ty(a
.u)
Time delay (ps)
Inte
nsi
ty(a
.u)
Time delay (ps)
Inte
nsi
ty(a
.u)
Time delay (ps)
Inte
nsi
ty(a
.u)
Time delay (ps)
Inte
nsi
ty(a
.u)
Time delay (ps)
Inte
nsi
ty(a
.u)
Time delay (ps)
Inte
nsi
ty(a
.u)
Time delay (ps)
Inte
nsi
ty(a
.u)
Time delay (ps)
Inte
nsi
ty(a
.u)
Time delay (ps)
Inte
nsi
ty(a
.u)
Time delay (ps)
Inte
nsi
ty(a
.u)
Time delay (ps)
Inte
nsi
ty(a
.u)
Time delay (ps)
Inte
nsi
ty(a
.u)
Time delay (ps)
Inte
nsi
ty(a
.u)
Time delay (ps)
Inte
nsi
ty(a
.u)
Time delay (ps)
Inte
nsi
ty(a
.u)
Time delay (ps)
Inte
nsi
ty(a
.u)
Time delay (ps)
Inte
nsi
ty(a
.u)
Time delay (ps)
Inte
nsi
ty(a
.u)
Time delay (ps)
Inte
nsi
ty(a
.u)
Time delay (ps)
Inte
nsi
ty(a
.u)
Time delay (ps)
Inte
nsi
ty(a
.u)
Time delay (ps)
Inte
nsi
ty(a
.u)
Time delay (ps)
Inte
nsi
ty(a
.u)
Time delay (ps)
Inte
nsi
ty(a
.u)
Time delay (ps)
Inte
nsi
ty(a
.u)
Time delay (ps)
Inte
nsi
ty(a
.u)
Time delay (ps)
Inte
nsi
ty(a
.u)
Time delay (ps)
Inte
nsi
ty(a
.u)
Time delay (ps)
Inte
nsi
ty(a
.u)
Time delay (ps)
Inte
nsi
ty(a
.u)
Time delay (ps)
Inte
nsi
ty(a
.u)
Time delay (ps)
Inte
nsi
ty(a
.u)
Time delay (ps)
Inte
nsi
ty(a
.u)
Time delay (ps)
Inte
nsi
ty(a
.u)
Time delay (ps)
Inte
nsi
ty(a
.u)
Time delay (ps)
Inte
nsi
ty(a
.u)
Time delay (ps)
Inte
nsi
ty(a
.u)
Time delay (ps)
Inte
nsi
ty(a
.u)
Time delay (ps)
Inte
nsi
ty(a
.u)
Time delay (ps)
Inte
nsi
ty(a
.u)
Time delay (ps)
Inte
nsi
ty(a
.u)
Time delay (ps)
Inte
nsi
ty(a
.u)
Time delay (ps)
Inte
nsi
ty(a
.u)
Time delay (ps)
Inte
nsi
ty(a
.u)
Time delay (ps)
Inte
nsi
ty(a
.u)
Time delay (ps)
Inte
nsi
ty(a
.u)
Time delay (ps)
Inte
nsi
ty(a
.u)
Time delay (ps)
Inte
nsi
ty(a
.u)
Time delay (ps)
Inte
nsi
ty(a
.u)
Time delay (ps)
Inte
nsi
ty(a
.u)
Time delay (ps)
Inte
nsi
ty(a
.u)
Time delay (ps)
Inte
nsi
ty(a
.u)
Time delay (ps)
Inte
nsi
ty(a
.u)
Time delay (ps)
Inte
nsi
ty(a
.u)
Time delay (ps)
Inte
nsi
ty(a
.u)
Time delay (ps)
Inte
nsi
ty(a
.u)
Time delay (ps)
Inte
nsi
ty(a
.u)
Time delay (ps)
Inte
nsi
ty(a
.u)
Time delay (ps)
Inte
nsi
ty(a
.u)
Time delay (ps)
Inte
nsi
ty(a
.u)
Time delay (ps)
Inte
nsi
ty(a
.u)
Time delay (ps)
Inte
nsi
ty(a
.u)
Time delay (ps)
Inte
nsi
ty(a
.u)
Time delay (ps)
Inte
nsi
ty(a
.u)
Time delay (ps)
Inte
nsi
ty(a
.u)
Time delay (ps)
Inte
nsi
ty(a
.u)
Time delay (ps)
Inte
nsi
ty(a
.u)
Time delay (ps)
Inte
nsi
ty(a
.u)
Time delay (ps)
Inte
nsi
ty(a
.u)
Time delay (ps)
Inte
nsi
ty(a
.u)
Time delay (ps)
Inte
nsi
ty(a
.u)
Time delay (ps)
Inte
nsi
ty(a
.u)
Time delay (ps)
Inte
nsi
ty(a
.u)
Inte
nsi
ty(a
.u)
Inte
nsi
ty(a
.u)
Inte
nsi
ty(a
.u)
Inte
nsi
ty(a
.u)
Inte
nsi
ty(a
.u)
Inte
nsi
ty(a
.u)
Inte
nsi
ty(a
.u)
Inte
nsi
ty(a
.u)
Inte
nsi
ty(a
.u)
Inte
nsi
ty(a
.u)
Inte
nsi
ty(a
.u)
Inte
nsi
ty(a
.u)
Inte
nsi
ty(a
.u)
Inte
nsi
ty(a
.u)
Inte
nsi
ty(a
.u)
Inte
nsi
ty(a
.u)
Inte
nsi
ty(a
.u)
Inte
nsi
ty(a
.u)
Inte
nsi
ty(a
.u)
Inte
nsi
ty(a
.u)
Inte
nsi
ty(a
.u)
Inte
nsi
ty(a
.u)
Inte
nsi
ty(a
.u)
Inte
nsi
ty(a
.u)
Inte
nsi
ty(a
.u)
Inte
nsi
ty(a
.u)
Inte
nsi
ty(a
.u)
Inte
nsi
ty(a
.u)
Inte
nsi
ty(a
.u)
Inte
nsi
ty(a
.u)
Inte
nsi
ty(a
.u)
Inte
nsi
ty(a
.u)
Inte
nsi
ty(a
.u)
Inte
nsi
ty(a
.u)
Inte
nsi
ty(a
.u)
Inte
nsi
ty(a
.u)
Inte
nsi
ty(a
.u)
Inte
nsi
ty(a
.u)
Inte
nsi
ty(a
.u)
Inte
nsi
ty(a
.u)
Inte
nsi
ty(a
.u)
Inte
nsi
ty(a
.u)
Inte
nsi
ty(a
.u)
Inte
nsi
ty(a
.u)
Inte
nsi
ty(a
.u)
Inte
nsi
ty(a
.u)
Inte
nsi
ty(a
.u)
Inte
nsi
ty(a
.u)
Inte
nsi
ty(a
.u)
Inte
nsi
ty(a
.u)
Inte
nsi
ty(a
.u)
Inte
nsi
ty(a
.u)
Inte
nsi
ty(a
.u)
Inte
nsi
ty(a
.u)
Inte
nsi
ty(a
.u)
Inte
nsi
ty(a
.u)
Inte
nsi
ty(a
.u)
Inte
nsi
ty(a
.u)
Inte
nsi
ty(a
.u)
Inte
nsi
ty(a
.u)
Figure 5.9 (b): Autocorrelation traces corresponding to different
wavelength spectra in Figure 5.9 (a)

219
Figure 5.11 shows the comparison of the 3 dB bandwidth and pulse width of the
14 different output wavelengths within the tuning range. Across the entire tuning range,
the 3 dB bandwidth of the spectra and the pulse width are observed to fluctuate from 0.5
to 0.8 nm and from 3.86 ps to 6.57 ps respectively. The largest 3 dB bandwidth is
obtained at 1547.5 nm, corresponding to the shortest pulse width obtained. On the other
hand, the smallest 3 dB bandwidth is observed at 1512.5 nm, corresponding to the
longest measured pulse width, as expected. Overall, the pulse width outside the
wavelength range of 1547.5 to 1567.5 nm is found to be slightly longer than that within
the wavelength range, with values above 5 ps. This finding possibly relates to the loss of
the TBF which is higher at a certain wavelength, resulting in a longer pulse width at that
particular wavelength [34]. Due to the wavelength dependent loss of the TBF, it is thus
0
0.002
0.004
0.006
0.008
0 200 400 600 800 1000 1200
Time (ns)
Vo
ltag
e (V
)
Figure 5.10: Output pulse train with a repetition rate of 12.9 MHz

220
difficult to maintain the pulse width at a constant value across the entire wavelength
range.
Based on the 3 dB bandwidth and the pulse width values as shown in Figure
5.11, the corresponding time-bandwidth product (TBP) values of this system can be
estimated. The variation of the TBP values against different wavelength within the
tuning range is thus investigated and the result is shown in Figure 5.12. As can be seen
from the figure, the TBP generally varies in a random manner across the wavelength
range, with the lowest TBP value of 0.34 obtained at 1567.5 nm and the highest TBP
value of 0.46 obtained at 1507.5 nm, giving quite a large difference of 0.12. However,
there is only a slight variation of the TBP, which has an average value of 0.38, in the
wavelength range between 1532.5 nm and 1562.5 nm. The average TBF value within
that wavelength range appears to be slightly higher than the lowest value achievable for
0
1
2
3
4
5
6
7
8
0.3
0.5
0.7
0.9
1.1
1.3
1.5
1500 1510 1520 1530 1540 1550 1560 1570 1580
3 dB bandwidth (nm)
Pulse width (ps)
Pu
lse wid
th (p
s)
Wavelength (nm)
3 d
B b
and
wid
th (
nm
)
Figure 5.11: 3 dB bandwidth and pulse width against wavelengths
within the tuning range
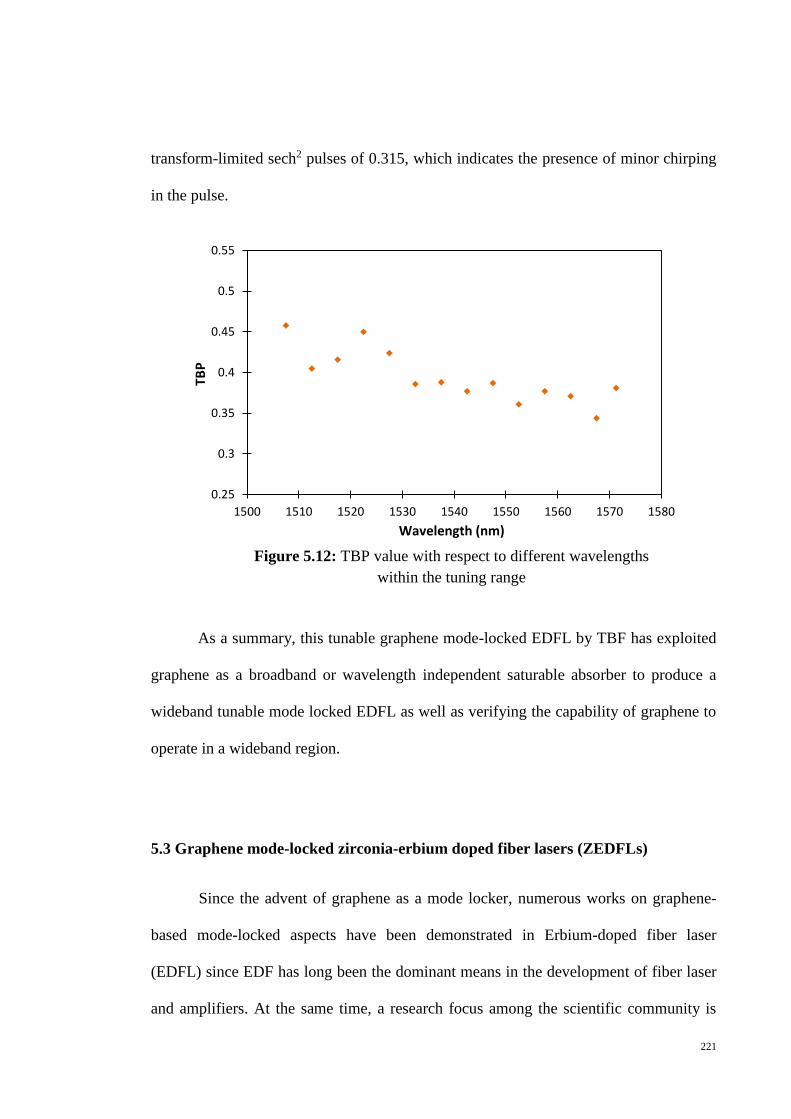
221
transform-limited sech2 pulses of 0.315, which indicates the presence of minor chirping
in the pulse.
As a summary, this tunable graphene mode-locked EDFL by TBF has exploited
graphene as a broadband or wavelength independent saturable absorber to produce a
wideband tunable mode locked EDFL as well as verifying the capability of graphene to
operate in a wideband region.
5.3 Graphene mode-locked zirconia-erbium doped fiber lasers (ZEDFLs)
Since the advent of graphene as a mode locker, numerous works on graphene-
based mode-locked aspects have been demonstrated in Erbium-doped fiber laser
(EDFL) since EDF has long been the dominant means in the development of fiber laser
and amplifiers. At the same time, a research focus among the scientific community is
0.25
0.3
0.35
0.4
0.45
0.5
0.55
1500 1510 1520 1530 1540 1550 1560 1570 1580
TB
P
Wavelength (nm)
Figure 5.12: TBP value with respect to different wavelengths
within the tuning range
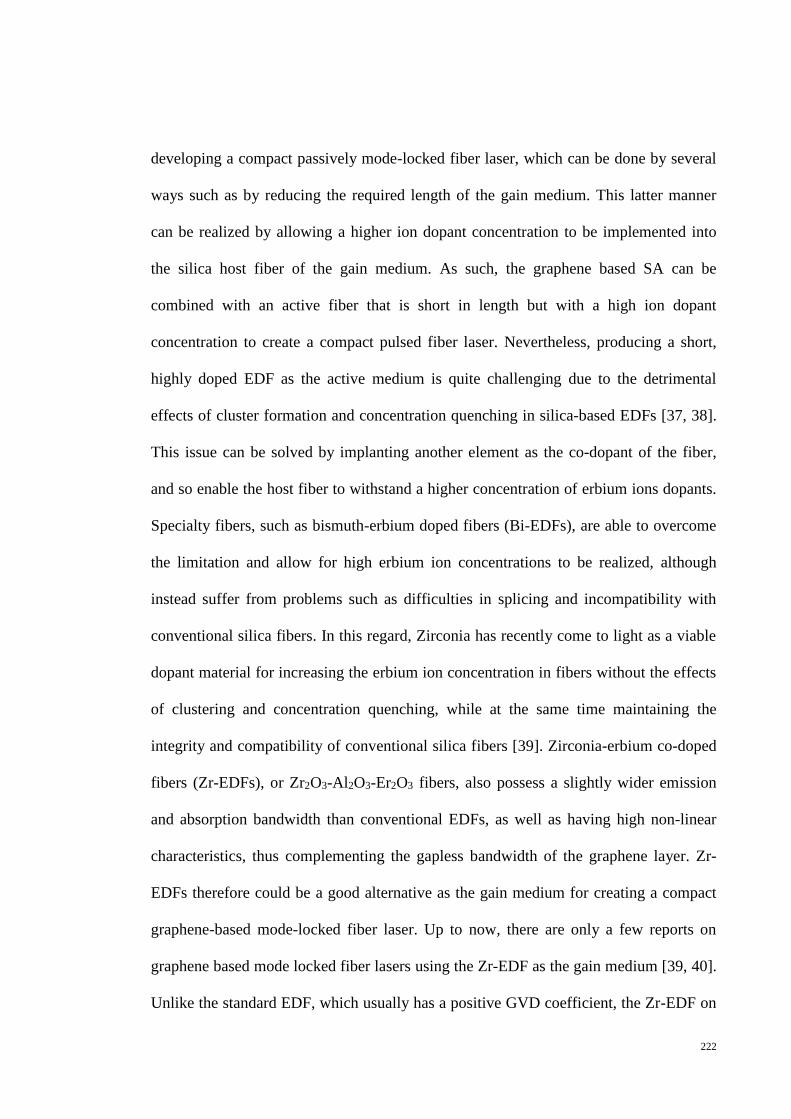
222
developing a compact passively mode-locked fiber laser, which can be done by several
ways such as by reducing the required length of the gain medium. This latter manner
can be realized by allowing a higher ion dopant concentration to be implemented into
the silica host fiber of the gain medium. As such, the graphene based SA can be
combined with an active fiber that is short in length but with a high ion dopant
concentration to create a compact pulsed fiber laser. Nevertheless, producing a short,
highly doped EDF as the active medium is quite challenging due to the detrimental
effects of cluster formation and concentration quenching in silica-based EDFs [37, 38].
This issue can be solved by implanting another element as the co-dopant of the fiber,
and so enable the host fiber to withstand a higher concentration of erbium ions dopants.
Specialty fibers, such as bismuth-erbium doped fibers (Bi-EDFs), are able to overcome
the limitation and allow for high erbium ion concentrations to be realized, although
instead suffer from problems such as difficulties in splicing and incompatibility with
conventional silica fibers. In this regard, Zirconia has recently come to light as a viable
dopant material for increasing the erbium ion concentration in fibers without the effects
of clustering and concentration quenching, while at the same time maintaining the
integrity and compatibility of conventional silica fibers [39]. Zirconia-erbium co-doped
fibers (Zr-EDFs), or Zr2O3-Al2O3-Er2O3 fibers, also possess a slightly wider emission
and absorption bandwidth than conventional EDFs, as well as having high non-linear
characteristics, thus complementing the gapless bandwidth of the graphene layer. Zr-
EDFs therefore could be a good alternative as the gain medium for creating a compact
graphene-based mode-locked fiber laser. Up to now, there are only a few reports on
graphene based mode locked fiber lasers using the Zr-EDF as the gain medium [39, 40].
Unlike the standard EDF, which usually has a positive GVD coefficient, the Zr-EDF on
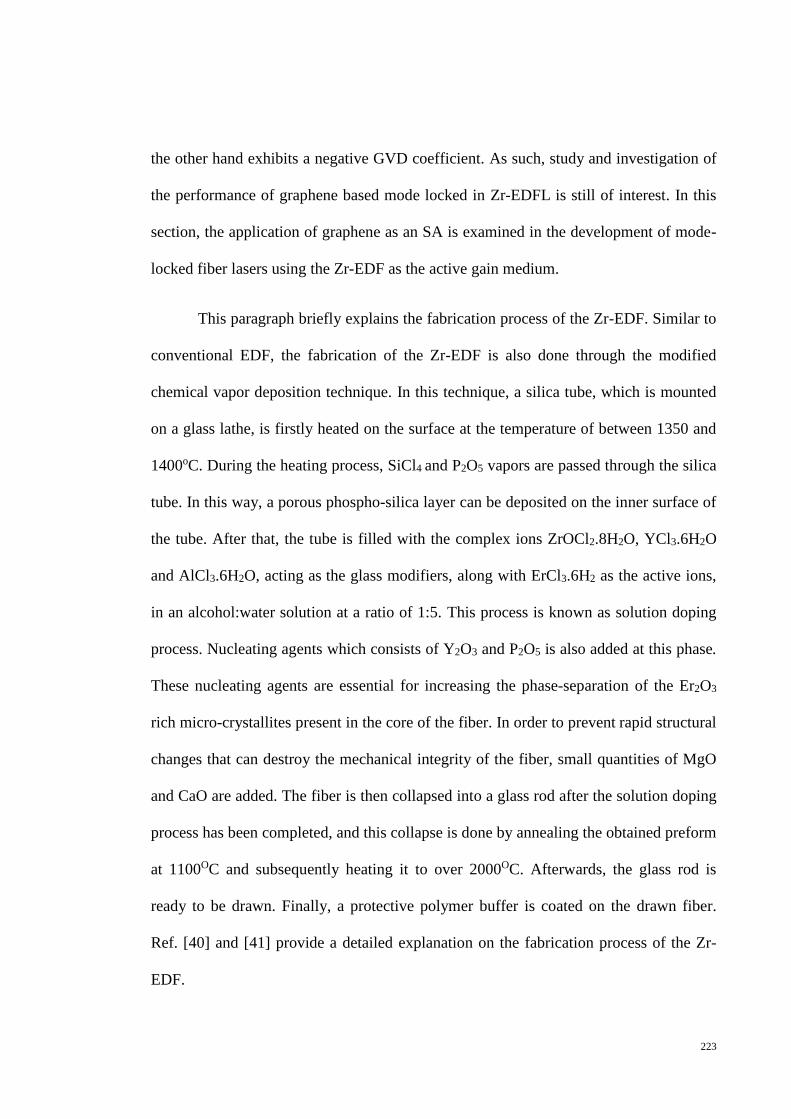
223
the other hand exhibits a negative GVD coefficient. As such, study and investigation of
the performance of graphene based mode locked in Zr-EDFL is still of interest. In this
section, the application of graphene as an SA is examined in the development of mode-
locked fiber lasers using the Zr-EDF as the active gain medium.
This paragraph briefly explains the fabrication process of the Zr-EDF. Similar to
conventional EDF, the fabrication of the Zr-EDF is also done through the modified
chemical vapor deposition technique. In this technique, a silica tube, which is mounted
on a glass lathe, is firstly heated on the surface at the temperature of between 1350 and
1400oC. During the heating process, SiCl4 and P2O5 vapors are passed through the silica
tube. In this way, a porous phospho-silica layer can be deposited on the inner surface of
the tube. After that, the tube is filled with the complex ions ZrOCl2.8H2O, YCl3.6H2O
and AlCl3.6H2O, acting as the glass modifiers, along with ErCl3.6H2 as the active ions,
in an alcohol:water solution at a ratio of 1:5. This process is known as solution doping
process. Nucleating agents which consists of Y2O3 and P2O5 is also added at this phase.
These nucleating agents are essential for increasing the phase-separation of the Er2O3
rich micro-crystallites present in the core of the fiber. In order to prevent rapid structural
changes that can destroy the mechanical integrity of the fiber, small quantities of MgO
and CaO are added. The fiber is then collapsed into a glass rod after the solution doping
process has been completed, and this collapse is done by annealing the obtained preform
at 1100OC and subsequently heating it to over 2000OC. Afterwards, the glass rod is
ready to be drawn. Finally, a protective polymer buffer is coated on the drawn fiber.
Ref. [40] and [41] provide a detailed explanation on the fabrication process of the Zr-
EDF.

224
The experimental setup of the graphene based mode locked Zr-EDFL is shown
in Figure 5.13. A 2 m long Zr-EDF is used as the active gain medium for the ring fiber
laser, and is pumped by a 980 nm laser diode (LD) with a maximum operating power of
approximately 100 mW. The Zr-EDF has an erbium ion concentration of about 4320
ppm and absorption coefficient of 22.0 dB/m at 987 nm, and about 58.0 dB/m at 1550
nm. The 980 nm LD is configured to pump the Zr-EDF in a forward-pumping scheme,
and is connected to the 980 nm port of a 980 / 1550 nm wavelength division multiplexer
(WDM). The common output of the WDM is connected one end of the Zr-EDF. The
other end of the Zr-EDF is connected to an optical isolator, which is used to force signal
propagation in the clockwise direction only. The output of the isolator is then connected
to a polarization controller (PC), which serves to control the polarization state of the
propagating signal so as to optimize the signal output level. The PC is connected to a
90:10 fused coupler, with the 90% port connected to the graphene SA assembly, which
is responsible for generating the mode locked pulses. Similar to the one that is used in
graphene mode locked EDFL as demonstrated earlier, the graphene SA in this work is
also in the form of a thin film sandwiched between two FC/PC connectors, as has been
described in detail in Chapter 3. The output of the graphene SA is then connected to an
additional 11 m SMF in order to change the total GVD of the cavity, for the same
reason as has been described earlier. The dispersion parameter D of the Zr-EDF is
approximately +28.45 ps.nm-1.km-1 [39], giving the cavity a GVD coefficient of -36.86
ps2/km. On the other hand, the dispersion coefficient of the SMF-28 is +17 ps.nm-1.km-
1, giving a GVD coefficient of -22.02 ps2/km. With the additional 11 m long SMF, the
total length of SMF is about 13.8 m, taking into account the remaining SMF lengths
from the components in the cavity. The total GVD for the entire cavity is now –0.37 ps2.
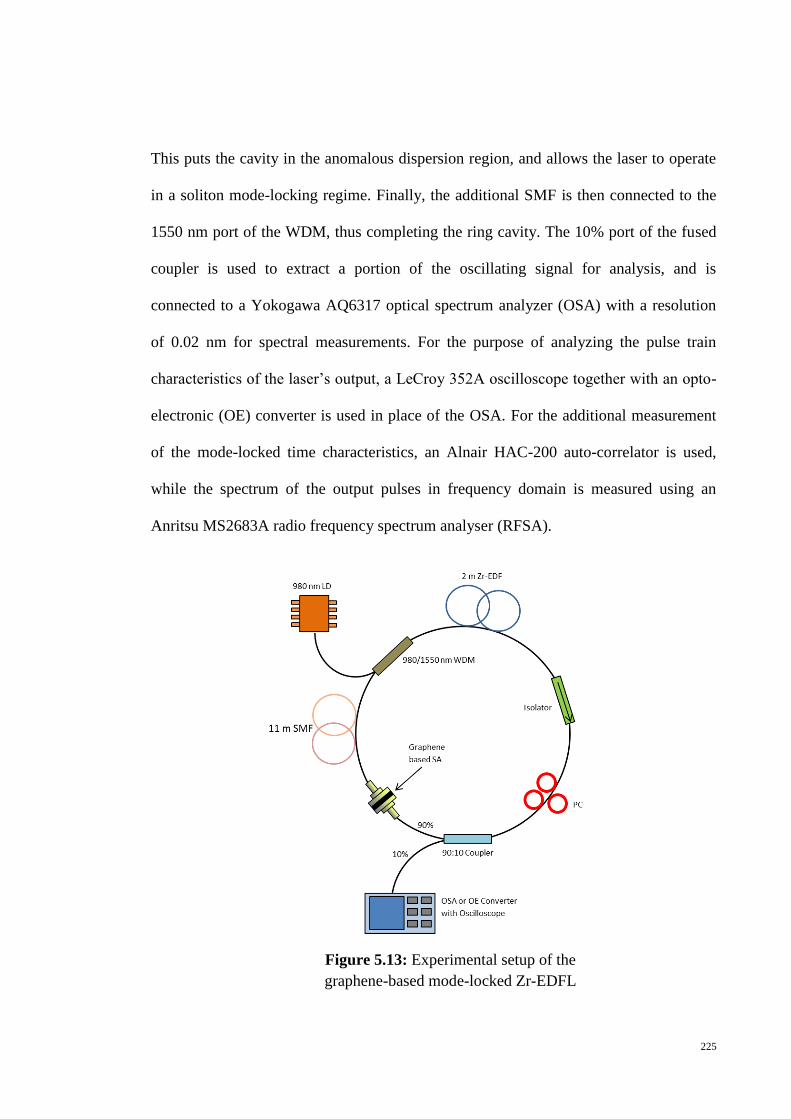
225
This puts the cavity in the anomalous dispersion region, and allows the laser to operate
in a soliton mode-locking regime. Finally, the additional SMF is then connected to the
1550 nm port of the WDM, thus completing the ring cavity. The 10% port of the fused
coupler is used to extract a portion of the oscillating signal for analysis, and is
connected to a Yokogawa AQ6317 optical spectrum analyzer (OSA) with a resolution
of 0.02 nm for spectral measurements. For the purpose of analyzing the pulse train
characteristics of the laser’s output, a LeCroy 352A oscilloscope together with an opto-
electronic (OE) converter is used in place of the OSA. For the additional measurement
of the mode-locked time characteristics, an Alnair HAC-200 auto-correlator is used,
while the spectrum of the output pulses in frequency domain is measured using an
Anritsu MS2683A radio frequency spectrum analyser (RFSA).
Figure 5.13: Experimental setup of the
graphene-based mode-locked Zr-EDFL

226
Experimental results shows that the Zr-EDF laser starts to generate the soliton
mode-locking behavior at a threshold pump power of 50 mW. As such, all subsequent
measurements are taken at a pump power of 50 mW. Figure 5.14 shows the optical
spectrum of the mode-locked pulses, which spans from 1540 to 1585 nm taken at output
power level of -70 dBm. The spectrum has a 3 dB bandwidth of 5.8 nm at a central
wavelength at 1563 nm. Multiple Kelly sidebands are also observed, confirming that the
system is operating in the soliton regime. As can be seen from the figure, no crease
patterns or CW lasing peaks are observed at the midpoint or at any other part of the
output spectrum, further confirming that the laser is operating in the stable mode-
locking regime. As discussed earlier, the formation of the Kelly sidebands is attributed
to the periodical perturbation of the intracavity, which confirms the attainment of the
anomalous dispersion, soliton-like mode locking operation. At this power, the mode-
locked pulses have an average output power of 1.6 mW and a pulse energy of 146.8 pJ.
The repetition rate is 10.9 MHz, which is the fundamental cavity round trip frequency,
corresponding to a pulse spacing of around 91.7 ns in the pulse train. This is shown in
Figure 5.15.
-75
-65
-55
-45
-35
1540 1550 1560 1570 1580
Wavelength (nm)
Ou
tpu
t p
ow
er (
dB
m)
Figure 5.14: Output spectrum of the graphene-based
mode-locked Zr-EDFL

227
Figure 5.16 shows the fundamental harmonic frequency of the mode-locked
laser output at 10.9 MHz as measured from the RFSA with an 80 kHz frequency span
and a resolution of 300 Hz. The measured RF spectrum indicates that the mode-locked
laser output works in its fundamental regime, with the estimated peak-to-pedestal ratio
being about 67 dB.
0
2
4
6
8
0 100 200 300 400 500
Inte
nsi
ty (
mV
)
Time (ns)
-115
-100
-85
-70
-55
-40
-25
10 10.45 10.9 11.35 11.8
Po
wer
(dB
m)
Frequency (MHz)
~ 67 dB
Figure 5.15: Output pulse train of the graphene-based
mode-locked Zr-EDFL
Figure 5.16: RF spectrum of fundamental frequency at 10.9 MHz

228
Figure 5.17 shows the autocorrelation trace, with estimated pulse duration of 680
fs at the full-width half maximum (FWHM) point. The autocorrelation trace shows that
the experimentally obtained value augurs well with the theoretical sech² fitting, with no
indication of pulse breaking or pulse pair generation. A time-bandwidth product of 0.45
is calculated from the product of 3 dB bandwidth (in Hertz) of the optical spectrum and
the FWHM of the pulse. The obtained value is slightly higher than the expected
transform limit of 0.315 for a sech² pulse. The generated pulses are stable and
consistent, thus giving this graphene based mode locked Zr-EDF laser a multitude of
uses for practical applications.
5.3.1 Harmonically mode-locked ZEDFL with graphene
A limitation to the fundamentally mode-locked lasers is its maximum achievable
pulse repetition rate, which is normally only up to several MHz. In order to achieve high
repetition rate of the mode locked pulses at the fundamental cavity frequency, an
-0.05
0.15
0.35
0.55
0.75
0.95
1.15
-15 -10 -5 0 5 10 15
Experimental result
Sech^2 fitting
Inte
nsi
ty (
a.u
)
Time (ps)
Figure 5.17: Autocorrelation trace of the mode-locked pulse,
with pulse width of 680 fs
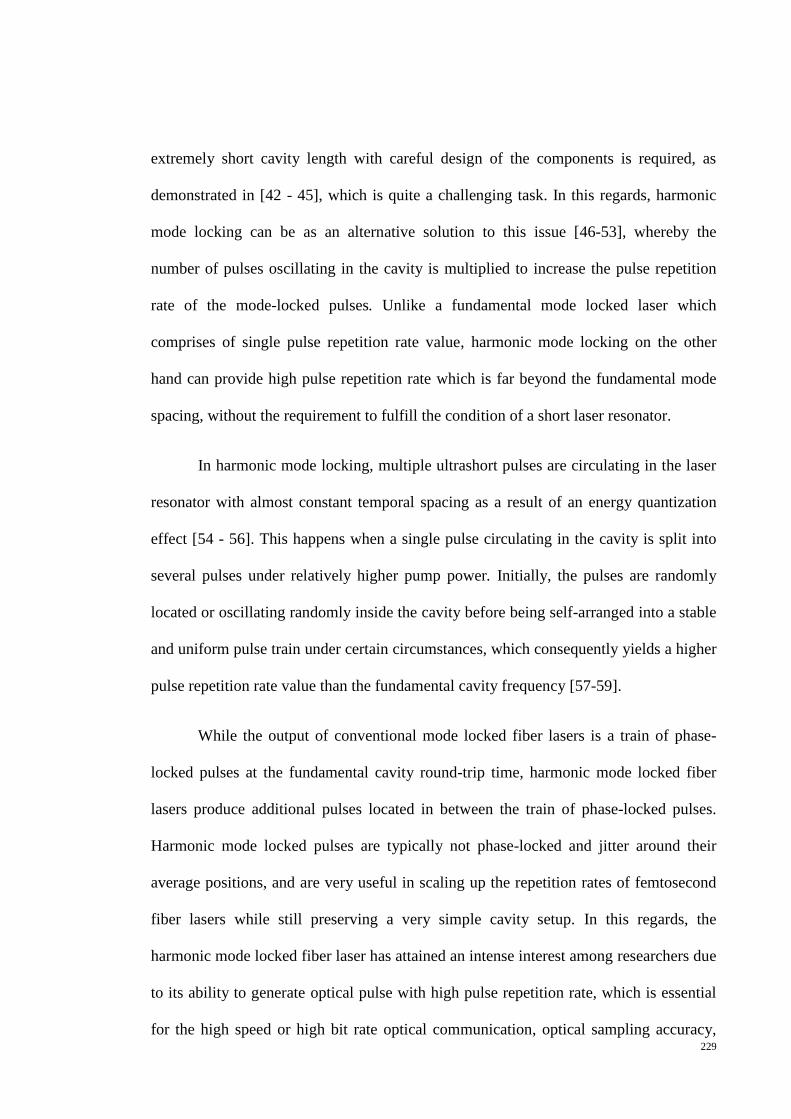
229
extremely short cavity length with careful design of the components is required, as
demonstrated in [42 - 45], which is quite a challenging task. In this regards, harmonic
mode locking can be as an alternative solution to this issue [46-53], whereby the
number of pulses oscillating in the cavity is multiplied to increase the pulse repetition
rate of the mode-locked pulses. Unlike a fundamental mode locked laser which
comprises of single pulse repetition rate value, harmonic mode locking on the other
hand can provide high pulse repetition rate which is far beyond the fundamental mode
spacing, without the requirement to fulfill the condition of a short laser resonator.
In harmonic mode locking, multiple ultrashort pulses are circulating in the laser
resonator with almost constant temporal spacing as a result of an energy quantization
effect [54 - 56]. This happens when a single pulse circulating in the cavity is split into
several pulses under relatively higher pump power. Initially, the pulses are randomly
located or oscillating randomly inside the cavity before being self-arranged into a stable
and uniform pulse train under certain circumstances, which consequently yields a higher
pulse repetition rate value than the fundamental cavity frequency [57-59].
While the output of conventional mode locked fiber lasers is a train of phase-
locked pulses at the fundamental cavity round-trip time, harmonic mode locked fiber
lasers produce additional pulses located in between the train of phase-locked pulses.
Harmonic mode locked pulses are typically not phase-locked and jitter around their
average positions, and are very useful in scaling up the repetition rates of femtosecond
fiber lasers while still preserving a very simple cavity setup. In this regards, the
harmonic mode locked fiber laser has attained an intense interest among researchers due
to its ability to generate optical pulse with high pulse repetition rate, which is essential
for the high speed or high bit rate optical communication, optical sampling accuracy,

230
characterization of the optical communication system, arbitrary wave form generation,
biological imaging, clocking, spectroscopy, and precision metrology [60 - 71]. The
main issue that arises in harmonic mode locking generation is regarding the relatively
high timing jitter of the pulse. This high pulse timing jitter possibly originates from
supermode noise, pulse dropouts and pulse energy fluctuations. The timing jitter, as
well as the phase noise of the harmonically mode-locked lasers, is potentially reduced
with the elimination of these effects, although it is quite challenging to suppress all
those effects. Though the timing jitter of harmonic mode locked fiber lasers is relatively
high and consequently making their use in nonlinear optical devices problematic, some
applications may be able to tolerate this amount of timing jitter. Furthermore, the
repetition rate of the pulse in harmonic mode locked fiber lasers can be adjusted by
simply changing the pump power [52, 72 - 74].
Grudinin et al. first observed passive harmonic mode locking in an erbium-
doped fiber laser in 1993 [75], and this discovery was subsequently widely implemented
as a technique to generate pulses with extremely high repetition rate. To date, harmonic
mode locking generation is mostly dominated by nonlinear polarization rotation (NPR)
technique [59, 76 - 79]. A 1.3 GHz repetition rate, which corresponds to the 31st
harmonic, has been demonstrated by Zhou et al. [76] in a Yb-doped fiber laser at pump
power of 400 mW using the NPR technique. In Ref. [79], Sobon et al. have reported a
10 GHz pulse repetition rate at pump power of 7 W in Er/Yb-doped double-clad fiber
laser, which is the highest repetition rate ever reported in passively mode-locked fiber
ring laser and corresponding to the 634th harmonic. A 322nd harmonic of the mode
locked fundamental frequency has also been achieved at pump power of 6 W by using
the same NPR technique, as reported in Ref. [59]. Nevertheless, those reported

231
harmonic mode locking based on NPR technique use very high pump powers and this
technique is also environmentally unstable. A promising alternative to avoid this
problem is to use a real saturable absorber such as single-walled carbon nanotubes
(SWCNTs) and graphene in order to generate a real passive mode locking mechanism.
The use of SWCNT-based saturable absorber has been reported to generate up to 943.16
MHz pulse repetition rate, corresponding to 34th harmonic at pump power of 195 mW
[80], and also up to 328.44 MHz pulse repetition rate, corresponding to 23rd harmonic,
in other reported research work [81]. Several papers have been reported for graphene-
based SA for harmonic mode locking as well [2, 47 - 49, 82 - 84], with the highest
repetition rate of 2.22 GHz, corresponding to 21st harmonic being achieved by Sobon et.
al. [49]. In another reported work of graphene-based harmonic mode locking, a
repetition rate of 340 MHz has been achieved by Castellani et al. [84] using Raman
mode locked laser, but at the expense of very high pump power of up to a few Watt
required, as well as longer pulse duration generation of up to hundreds of picoseconds.
In this regards, interest is retained for investigation and improvement of harmonic mode
locking generation based on graphene as saturable absorber.
In this work, it is observed that harmonic mode locking occurs in the earlier
demonstrated graphene mode-locked Zr-EDFL when the pump power is increased more
than the mode-locking threshold of 50 mW. Pulse breaking is firstly observed at about
55 mW, forming the multipulse oscillation in a disordered manner. Only after a certain
period and by careful adjustment of the polarization controller, self-stabilization of the
pulse occurs. This results in a stable pulse repetition rate of 21.8 MHz, which is the
second order of the fundamental repetition rate of 10.9 MHz for the graphene mode-
locked Zr-EDFL. As the pump power is further increased, the repetition rate also

232
increases, whereby at 60 mW, the 3rd order of harmonic is obtained with the repetition
rate value of 32.7 MHz. This continues until the pump power is raised up to the
maximum value of about 100 mW, giving a repetition rate value of 119.9 MHz, which
corresponds to the 11th order of harmonic.
Figure 5.18 (a) - (d) shows the pulse train of the harmonic mode locked as taken
from the oscilloscope at the fundamental repetition rate, 5th order, 7th order and 11th
order of harmonic, with the corresponding repetition rate value of 10.9 MHz, 54.3 MHz,
76.3 MHz and 119.9 MHz respectively. The inset shows the output spectrum as taken
from the OSA at the respective order of harmonic, and is taken simultaneously with the
output pulse train. The zoomed-in view of the 11th order of harmonic pulse train with
the highest repetition rate of 119.9 MHz is shown in Figure 5.18 (e).
In general, passive harmonic mode locking is observed in soliton fiber lasers
with an overall negative group velocity dispersion or anomalous dispersion [75] at
sufficiently high intracavity power, and in turn produces a burst of pulse train with
multiple pulses. In soliton mode-locking the pulse energy and the pulse width is limited
to a certain level, and observed to obey the fundamental soliton condition [85] that
requires the balance between the cavity dispersion and nonlinearity to be achieved. As a
consequence of this peak power-limiting effect as explained by the soliton area theorem
[86] in Chapter 2, formation of multiple pulsing of quantized soliton per round trip is
being triggered by increasing the pump power [50,75,87]. An equidistant harmonic
mode-locking will be formed when the forward pulse drift caused by time-dependent
gain depletion is stabilized by the amount of recovered population inversion between
pulses [88]. Thus, it can be deduced that harmonic mode-locking can provide
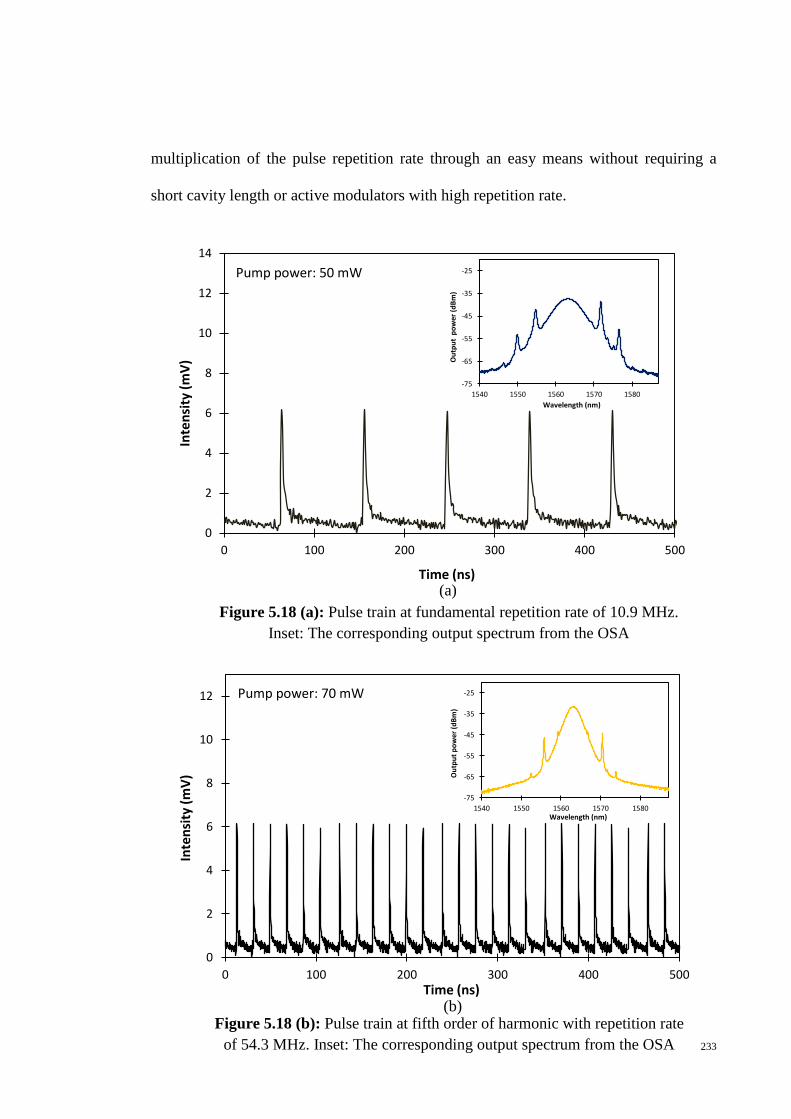
233
multiplication of the pulse repetition rate through an easy means without requiring a
short cavity length or active modulators with high repetition rate.
Pp: 50 mW
0
2
4
6
8
10
12
0 100 200 300 400 500
Inte
nsi
ty (
mV
)
Time (ns)
-75
-65
-55
-45
-35
-25
1540 1550 1560 1570 1580Wavelength (nm)
Ou
tpu
t p
ow
er (
dB
m)
Pump power: 70 mW
(b)
0
2
4
6
8
10
12
14
0 100 200 300 400 500
Inte
nsi
ty (
mV
)
Time (ns)
-75
-65
-55
-45
-35
-25
1540 1550 1560 1570 1580
Wavelength (nm)
Ou
tpu
tp
ow
er (
dB
m)
Pump power: 50 mW
Figure 5.18 (a): Pulse train at fundamental repetition rate of 10.9 MHz.
Inset: The corresponding output spectrum from the OSA
(a)
Figure 5.18 (b): Pulse train at fifth order of harmonic with repetition rate
of 54.3 MHz. Inset: The corresponding output spectrum from the OSA
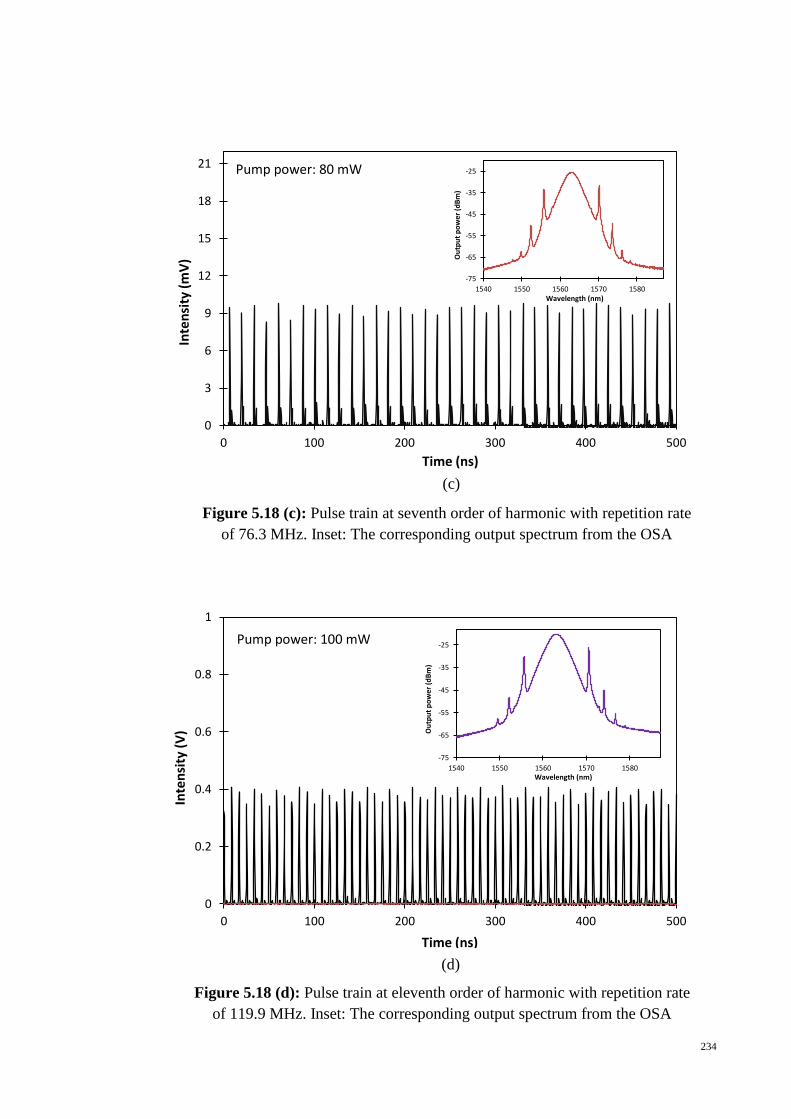
234
0
0.2
0.4
0.6
0.8
1
0 100 200 300 400 500
Inte
nsi
ty(V
)
Time (ns)
-75
-65
-55
-45
-35
-25
1540 1550 1560 1570 1580Wavelength (nm)
Ou
tpu
t p
ow
er (
dB
m)
Pump power: 100 mW
0
3
6
9
12
15
18
21
0 100 200 300 400 500
Inte
nsi
ty (
mV
)
Time (ns)
-75
-65
-55
-45
-35
-25
1540 1550 1560 1570 1580Wavelength (nm)
Ou
tpu
t p
ow
er (
dB
m)
Pump power: 80 mW
(c)
(d)
Figure 5.18 (c): Pulse train at seventh order of harmonic with repetition rate
of 76.3 MHz. Inset: The corresponding output spectrum from the OSA
Figure 5.18 (d): Pulse train at eleventh order of harmonic with repetition rate
of 119.9 MHz. Inset: The corresponding output spectrum from the OSA
235
Figure 5.19 (a) and (b) shows the example of multipulse bunches formation in
the output pulse train before being self-arranged or self-stabilized into stable and
uniform harmonic mode-locked pulses. The inset of each figure shows the
corresponding output spectrum as taken from the OSA. The disordered multipulse or
multipulse bunching are actually not an unexpected or rare phenomena, since it is
common to have distributed multipulse modes in the cavity [89]. The issue that needs to
be addressed is in relation to the mechanism that enables self-organizing of the pulses in
the cavity under the harmonic mode-locking regime. A number of different processes or
mechanisms have been suggested that lead to the self-stabilization of the pulse trains in
passively harmonically mode locked fiber lasers, such as depletion and relaxation of the
gain and phase modulation of the intracavity field [90, 91]. The phase modulation of the
intracavity field usually can be provided by the saturable absorber (SA) which is
capable of retiming the pulses and stabilizing the repetition rate. In this regards, SA-
based harmonic mode-locking typically can operate in any degree of stability. It has also
-0.05
0.15
0.35
0.55
0.75
0.95
0 20 40 60 80 100
Inte
nsi
ty(V
)
Time (ns)(e)
Figure 5.18 (e): Zoomed-in view of the 11th order of
harmonic pulse train (119.9 MHz)
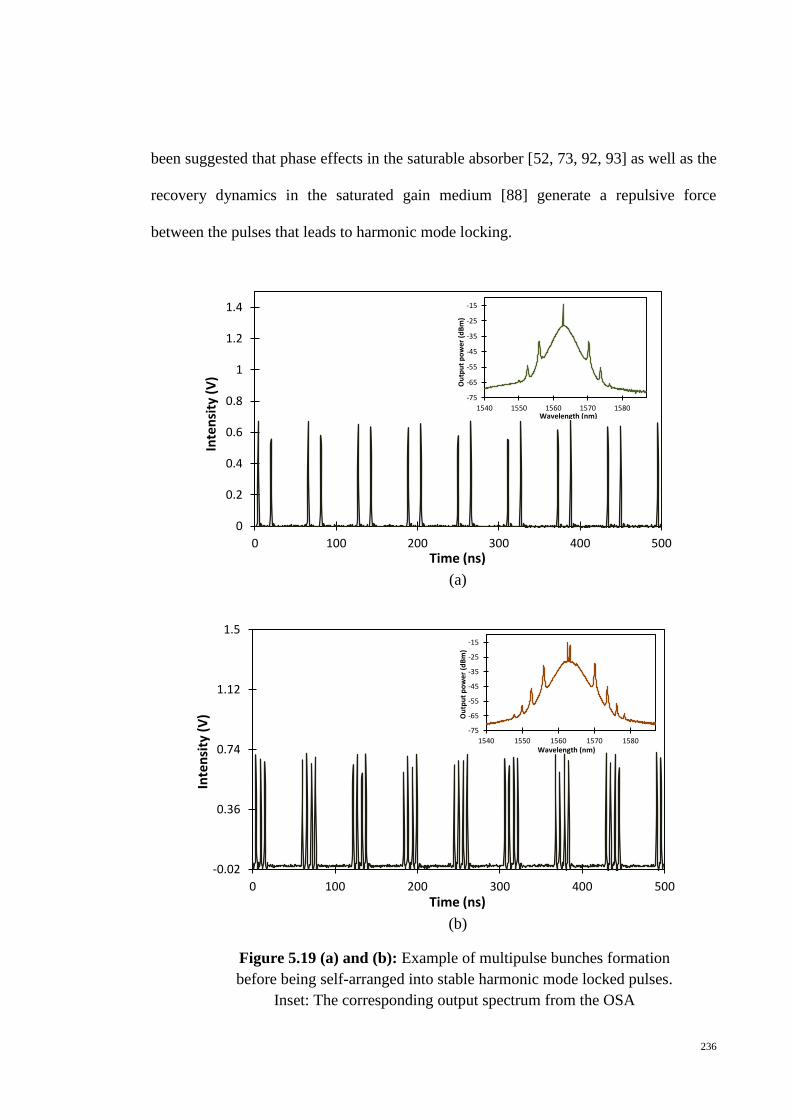
236
been suggested that phase effects in the saturable absorber [52, 73, 92, 93] as well as the
recovery dynamics in the saturated gain medium [88] generate a repulsive force
between the pulses that leads to harmonic mode locking.
-0.02
0.36
0.74
1.12
1.5
0 100 200 300 400 500
Inte
nsi
ty(V
)
Time (ns)
-75
-65
-55
-45
-35
-25
-15
1540 1550 1560 1570 1580Wavelength (nm)
Ou
tpu
t p
ow
er (
dB
m)
0
0.2
0.4
0.6
0.8
1
1.2
1.4
0 100 200 300 400 500
Inte
nsi
ty(V
)
Time (ns)
-75
-65
-55
-45
-35
-25
-15
1540 1550 1560 1570 1580Wavelength (nm)
Ou
tpu
t p
ow
er (
dB
m)
Figure 5.19 (a) and (b): Example of multipulse bunches formation
before being self-arranged into stable harmonic mode locked pulses.
Inset: The corresponding output spectrum from the OSA
(b)
(a)

237
Apart from those processes, it has been reported moreover that the repulsive and
attractive forces between pulses can also arise from an interaction of the soliton pulses
with the small oscillating continuum in the cavity [52]. This has been experimentally
proven by the results obtained in this work, such that there is a CW peak laser at about
the middle of the mode locked spectrum as can be seen from Figure 5.19 (a) and (b).
This is an important observation due to the suggestion by J. Du et al. [48] that the
interaction between the CW component and the pulses is responsible for triggering the
self-stabilization of the pulses to form the uniform distribution of harmonic mode
locked pulses inside the cavity. As the normally unstable CW laser component is
properly adjusted, phase locking between the unstable CW laser component and one of
the dynamical modes of the solitons will automatically take place. In this manner, the
phases of all the solitons in the laser cavity can be synchronized to that of the CW laser
component except for an arbitrary phase constant. Self-stabilization of harmonic mode-
locked pulses will occur under these conditions.
It has also been analysed theoretically in Ref. [52] that the nonsoliton component
that exists in soliton mode locked laser can serve as a buffer. This nonsoliton
component is created when the number of circulating pulses, which is equal to the ratio
of the stored intracavity energy to the soliton energy, does not give an integer value. In
other terms, any excess of the stored intracavity energy will be transformed into the
nonsoliton component. The excess of the stored intracavity energy might be caused by
small fluctuations of pump power for instance. Perturbation theory implies that when
there is multipulse bunches oscillation in the cavity, the interaction force for all solitons
within a soliton bunch will turn into repulsive force provided that the phase difference
between the solitons and the non soliton component satisfies a certain value. This will
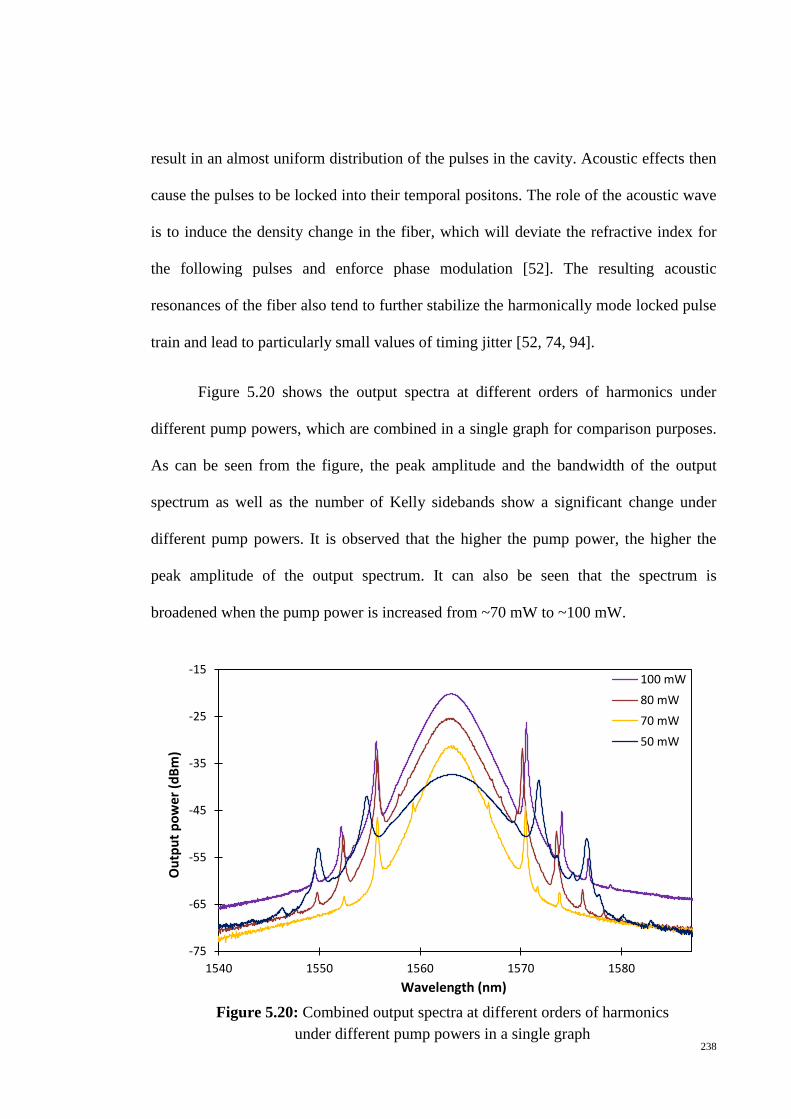
238
result in an almost uniform distribution of the pulses in the cavity. Acoustic effects then
cause the pulses to be locked into their temporal positons. The role of the acoustic wave
is to induce the density change in the fiber, which will deviate the refractive index for
the following pulses and enforce phase modulation [52]. The resulting acoustic
resonances of the fiber also tend to further stabilize the harmonically mode locked pulse
train and lead to particularly small values of timing jitter [52, 74, 94].
Figure 5.20 shows the output spectra at different orders of harmonics under
different pump powers, which are combined in a single graph for comparison purposes.
As can be seen from the figure, the peak amplitude and the bandwidth of the output
spectrum as well as the number of Kelly sidebands show a significant change under
different pump powers. It is observed that the higher the pump power, the higher the
peak amplitude of the output spectrum. It can also be seen that the spectrum is
broadened when the pump power is increased from ~70 mW to ~100 mW.
-75
-65
-55
-45
-35
-25
-15
1540 1550 1560 1570 1580
100 mW
80 mW
70 mW
50 mW
Wavelength (nm)
Ou
tpu
t p
ow
er (
dB
m)
Wavelength (nm)Wavelength (nm)Wavelength (nm)Wavelength (nm)Wavelength (nm)Wavelength (nm)Wavelength (nm)
Figure 5.20: Combined output spectra at different orders of harmonics
under different pump powers in a single graph
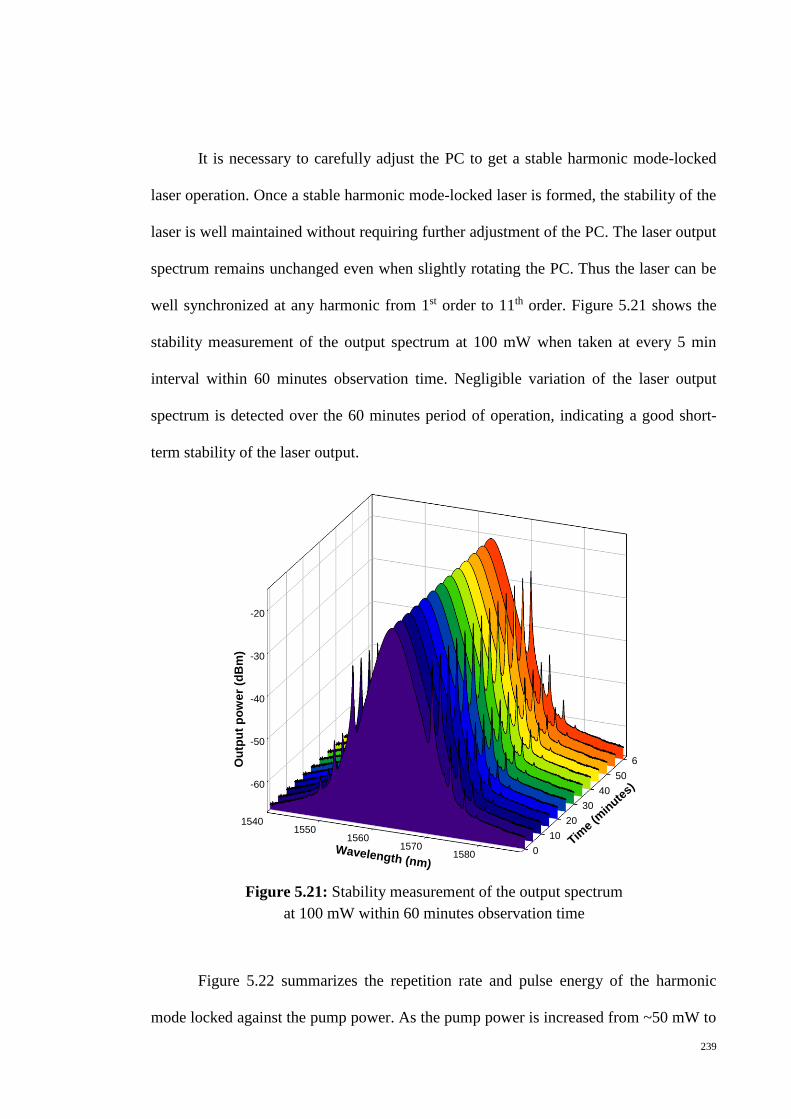
239
It is necessary to carefully adjust the PC to get a stable harmonic mode-locked
laser operation. Once a stable harmonic mode-locked laser is formed, the stability of the
laser is well maintained without requiring further adjustment of the PC. The laser output
spectrum remains unchanged even when slightly rotating the PC. Thus the laser can be
well synchronized at any harmonic from 1st order to 11th order. Figure 5.21 shows the
stability measurement of the output spectrum at 100 mW when taken at every 5 min
interval within 60 minutes observation time. Negligible variation of the laser output
spectrum is detected over the 60 minutes period of operation, indicating a good short-
term stability of the laser output.
-60
-50
-40
-30
-20
15401550
15601570
1580 0
10
20
30
40
50
60Ou
tpu
t p
ow
er
(dB
m)
Wavelength (nm)
Time
(min
utes)
Figure 5.22 summarizes the repetition rate and pulse energy of the harmonic
mode locked against the pump power. As the pump power is increased from ~50 mW to
Figure 5.21: Stability measurement of the output spectrum
at 100 mW within 60 minutes observation time
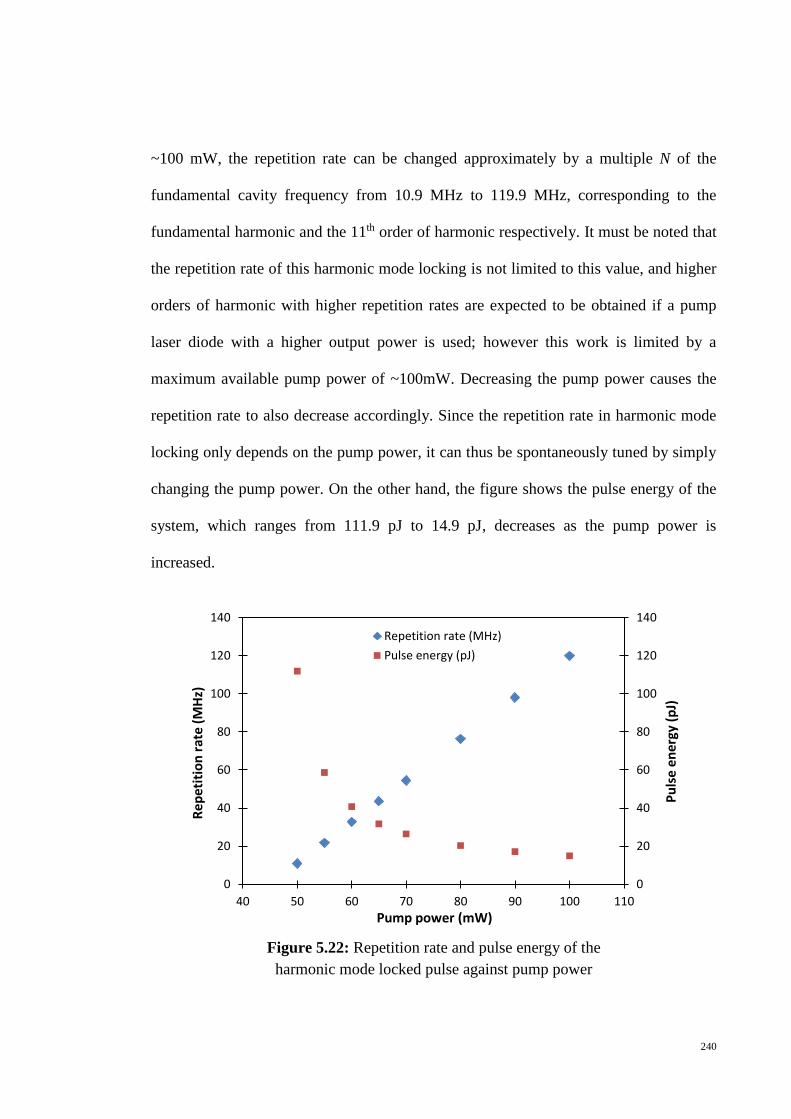
240
~100 mW, the repetition rate can be changed approximately by a multiple N of the
fundamental cavity frequency from 10.9 MHz to 119.9 MHz, corresponding to the
fundamental harmonic and the 11th order of harmonic respectively. It must be noted that
the repetition rate of this harmonic mode locking is not limited to this value, and higher
orders of harmonic with higher repetition rates are expected to be obtained if a pump
laser diode with a higher output power is used; however this work is limited by a
maximum available pump power of ~100mW. Decreasing the pump power causes the
repetition rate to also decrease accordingly. Since the repetition rate in harmonic mode
locking only depends on the pump power, it can thus be spontaneously tuned by simply
changing the pump power. On the other hand, the figure shows the pulse energy of the
system, which ranges from 111.9 pJ to 14.9 pJ, decreases as the pump power is
increased.
0
20
40
60
80
100
120
140
0
20
40
60
80
100
120
140
40 50 60 70 80 90 100 110
Repetition rate (MHz)
Pulse energy (pJ)
Pump power (mW)
Re
pet
itio
nra
te (
MH
z)
Pu
lse
ener
gy (
pJ)
Figure 5.22: Repetition rate and pulse energy of the
harmonic mode locked pulse against pump power

241
The relation between the order of harmonic and pump power is shown in Figure
5.23. As can be seen from the figure, the order of harmonic mode locking can be
adjusted up to 11th order by increasing the pump power from ~50 mW to ~100 mW.
Having higher pump power allows the possibility of further increasing the order of
harmonics.
Figure 5.24 shows the pulse widths under different pumping power, which
corresponds to the various order of harmonics ranging from the fundamental mode-
locked to the 11th order of harmonic mode-locked frequency. As can be seen from the
graph, the pulse widths slightly vary from 0.68 ps to 0.73 ps across different pumping
powers. For soliton mode-locked operation, parameters of the laser cavity such as cavity
length and intracavity dispersion are crucial in determining the output pulse width [52].
As such, the intracavity dispersion will be altered by changing the cavity length in
soliton mode locked lasers, which will consequently result in the change of the output
0
2
4
6
8
10
12
40 50 60 70 80 90 100 110
Pump power (mW)
Ord
er o
f h
arm
on
ic
Figure 5.23: Graph of order of harmonic against pump power
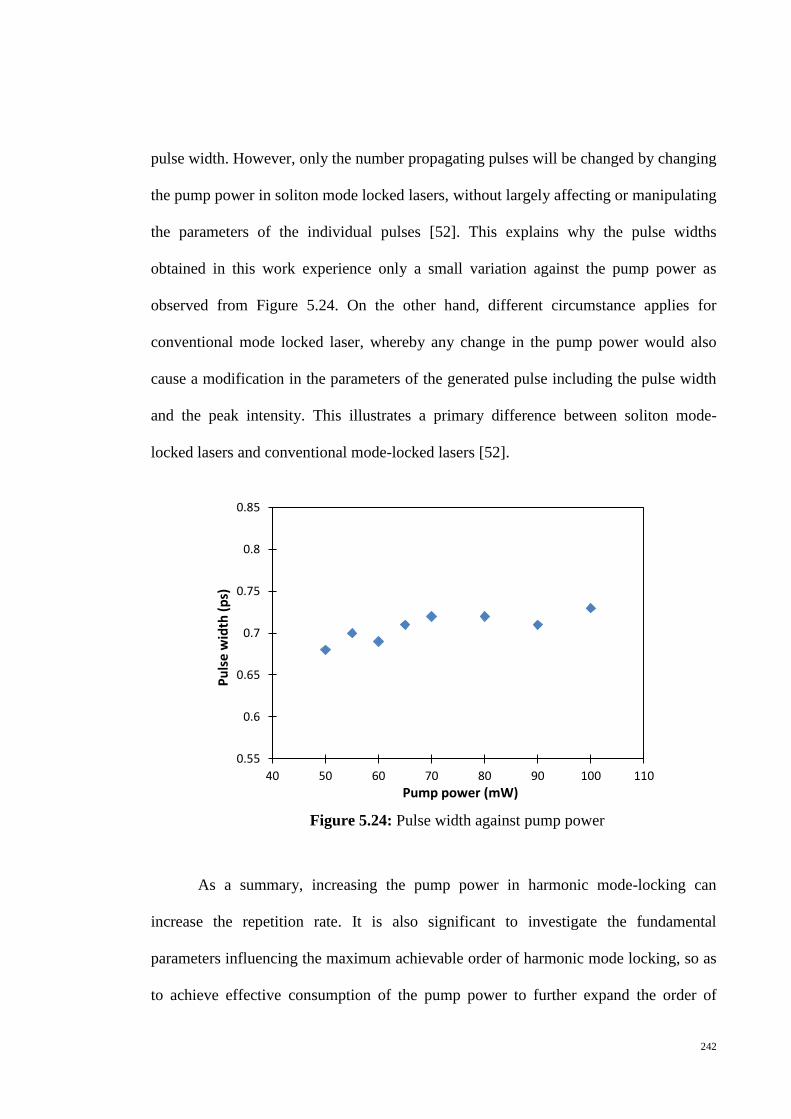
242
pulse width. However, only the number propagating pulses will be changed by changing
the pump power in soliton mode locked lasers, without largely affecting or manipulating
the parameters of the individual pulses [52]. This explains why the pulse widths
obtained in this work experience only a small variation against the pump power as
observed from Figure 5.24. On the other hand, different circumstance applies for
conventional mode locked laser, whereby any change in the pump power would also
cause a modification in the parameters of the generated pulse including the pulse width
and the peak intensity. This illustrates a primary difference between soliton mode-
locked lasers and conventional mode-locked lasers [52].
As a summary, increasing the pump power in harmonic mode-locking can
increase the repetition rate. It is also significant to investigate the fundamental
parameters influencing the maximum achievable order of harmonic mode locking, so as
to achieve effective consumption of the pump power to further expand the order of
0.55
0.6
0.65
0.7
0.75
0.8
0.85
40 50 60 70 80 90 100 110
Pump power (mW)
Pu
lse
wid
th (
ps)
Figure 5.24: Pulse width against pump power

243
harmonics. For example, the total cavity loss, including the insertion loss of graphene
SA assembly, is a possible factor that limits the system from attaining higher order of
harmonic, such that the higher the insertion loss, the lower the order of harmonic
achievable for the same pump power. The cavity loss thus should be reduced to achieve
the higher repetition rate. Furthermore, it is expected that higher pulse repetition rate
could possibly be achieved by optimizing the cavity length and dispersion.
5.3.2 Spectrum tunable graphene mode-locked ZEDFL by Mach Zehnder filter
The generation of simple and compact ultrafast passively mode-locked fiber
laser with spectral tunability has continuously drawn widespread and significant
attention among researchers, owing to its significance in various application fields,
including telecommunications, spectroscopy, material processing and biomedical
research [17, 34, 36, 95]. Most graphene and CNT-based wavelength tunable mode
locked fiber lasers are demonstrated by using TBF as the tuning mechanism [17, 34],
considering that TBF is easily available and inexpensive. Nevertheless, the bandwidth
of the TBF is quite limited. Employing the TBF in the soliton mode-locking regime
with Kelly sidebands causes the Kelly sidebands to be eventually eliminated or
suppressed due to the spectral limiting effect of the filter [17, 33]. Besides that, the
usage of the TBF would also restrict the bandwidth of the mode-locked spectrum, which
consequently increases the mode locked pulse width. Thus it is necessary to find a
suitable element to act as a filter while conserving the original shape of the mode locked
spectrum, as well as maintaining the bandwidth and the pulse width of the mode locked

244
pulses. TMZF can be a useful candidate for this purpose, and also serves as a suitable
alternative over the TBF to overcome the problem. Although there have already been
numerous reports on graphene-based tunable mode locked fiber lasers, there are no
reports on graphene based mode locked fiber lasers by using the Mach Zehnder filter as
the wavelength selective mechanism thus far. Therefore it is still of interest to study and
investigate the performance of tunable mode locked fiber laser by using the Mach
Zehnder filter as the wavelength selective mechanism. A graphene-based mode-locked,
spectrum tunable fiber laser using Mach Zehnder filter is demonstrated in this work and
the results are presented in this section.
Essentially, the working mechanism of the Mach Zehnder filter is adapted from
the Mach Zehnder interferometer. In a Mach Zehnder interferometer, two output light
beams originating from a single light source are produced after propagating through two
separate beam splitters (BS) which function to split and recombine the beams. A
schematic diagram of the Mach Zehnder interferometer is shown in Figure 5.25. There
are two design possibilities of the optical path lengths of the interferometer; it may be
constructed with nearly identical two arms, as shown in the figure, or two different
arms, for example by inserting an extra delay line. The distribution of optical powers at
the two outputs depends on the precise difference in optical arm lengths and on the
wavelength (optical frequency). The path length difference can be adjusted by several
ways, such as by slightly moving one of the mirrors, provided that the interferometer is
well aligned. In this way, the total power for a particular optical frequency will go into
one of the outputs. In the case of misaligned beams, for example, some fringe patterns
will be created in both outputs by slightly tilting one mirror, and when the path length

245
difference is adjusted, the shapes of these interference patterns will be mainly affected,
whereas the distribution of total powers on the outputs may not change very much [96].
On the other hand, the Mach Zehnder optical filter, which is usually integrated in
an optical fiber system, is constructed by using two tunable couplers which are
connected to each other by two waveguide paths with different lengths, as shown in
Figure 5.26.
This configuration is the analogy to the Mach Zehnder interferometer as shown
previously in Figure 5.25. Practically, the Mach Zehnder filter yields a sinusoidal shape
transmittance with a period that is determined by the length difference of the two paths
[97]. For instance, in Ref. [97], the center wavelength of the filter transmittance is tuned
by using a phase shifter made of a Cr heater attached to one of the waveguide paths.
Besides that, the phase shifter can be used to externally control the transmittance ratio
of the coupler [97].
Tunable coupler 1 Tunable coupler 2
Figure 5.26: Configuration of Mach Zehnder filter used as tunable filter
Input Output
Figure 5.25: Schematic diagram of
the Mach Zehnder interferometer
Light source
BS
BS

246
The Mach Zehnder filter used in this work is obtained from Photonic
Technologies (Model: AFL-1550-32-TU-1) and possesses two tuning knobs, which are
the wavelength and the extinction knobs. Tuning of the filter can be achieved by
adjusting these two knobs. The direct transmission spectrum of the filter is firstly
characterized using a white light source, which is inserted at the input of the filter
whereas the output of the filter is connected to the OSA as shown in Figure 5.27.
The loss of the filter is measured to be approximately 1.2 dB for a 1550 nm laser
wavelength, while a TBF experiences a loss of approximately 2.0 dB under similar
conditions. Figure 5.28 (a) shows the transmission spectrum of the filter by tuning the
wavelength knob, which is indicated by Trace 2 to Trace 4. Trace 1 is the reference
signal, which is the output of the white light source, taken directly without the Mach
Zehnder filter. Trace 2 shows the multiple peaks at 1520.4 nm, 1552.1 nm and 1583.7
nm obtained by propagating the signal from the white light source through the Mach
Zehnder filter. Similarly, for Trace 3, the peak wavelengths are at 1514.5 nm, 1546.1
nm and 1578.0 nm, which is obtained after tuning the wavelength knob. Further tuning
of the wavelength knob results in a larger shift of the spectrum, as indicated by Trace 4,
with the peak wavelengths observed at 1507.8 nm, 1539.9 nm and 1572.1 nm. From this
figure, it can be seen that when the knob is turned, the output peak wavelength shifted
Figure 5.27: Setup for measuring the transmission spectrum of the
Mach Zehnder filter
OSA
White light
source Mach Zehnder filter

247
accordingly, giving the tunability with wavelength spacing of about 32 nm between the
adjacent peaks. The peak wavelength in Trace 4 differs by about 11 nm from that of in
Trace 2, and this is not limited as the wavelength knob can be further tuned.
Figure 5.28 (b) shows the transmission spectrum of the Mach Zehnder filter
when the extinction knob of the filter is adjusted. It can be seen from the figure that the
shape of the graph changes in respect of the originally shallow troughs becoming deeper
as the extinction ratio knob is tuned.
(a)
(b)
Figure 5.28 (b): Transmission spectrum of the MZ filter by
adjusting the extinction knob
Figure 5.28 (b): Transmission spectrum of the MZ filter by
adjusting the wavelength knob

248
In order to investigate the output performance of the graphene mode locked
tunable fiber laser based on Mach Zehnder filter as the tuning mechanism, a setup
configuration is constructed as shown in Figure 5.29. A 2m Zr-EDF is used as the gain
medium. The specifications of the Zr-EDF has been described in detail in the earlier
section. The Zr-EDF is pumped by a 980 nm Laser Diode (LD) through a 980 nm port
of a fused 980/1550 nm WDM.
The Zr-EDF is then connected to the input port of an optical isolator as to ensure uni-
directional oscillation in the clockwise direction within the ring cavity, and
subsequently connected to a PC that is in turn attached to a 90:10 fused coupler. A 10%
portion of the signal is extracted for further analysis, while the remaining 90% is
connected to the SA formed by sandwiching graphene thin film between two FC/PC
connectors. After passing through the graphene-based SA, the propagating signal is then
Graphene SA
10%
Figure 5.29: Experimental setup for the tunable
mode-locked fiber laser using Mach Zehnder filter
980 nm LD
980/1550nm WDM
2 m Zr-EDF Isolator
90:10 Coupler 90%
Mach Zehnder
filter
PC

249
channeled through the Mach Zehnder filter (Photonics Technologies). This Mach
Zehnder filter acts as the tuning mechanism of the system, and provides either
wavelength tuning or extinction ratio tuning. The output from the filter is then
connected back to the 1550 nm port of the WDM, thereby completing the ring cavity.
The total cavity length is about 17.5 m, with a total SMF length of approximately 15.5
m. The dispersion coefficient of the Zr-EDF is approximately +28.45 ps/nm.km, giving
a GVD coefficient of -36.86 ps2/km. On the other hand, the dispersion coefficient of the
SMF-28 is about +17 ps/nm.km, giving a GVD coefficient of -22.02 ps2/km. The total
GVD for the entire cavity is -0.415 ps2, thereby putting the operation of the laser in the
anomalous dispersion regime. A Yokogawa AQ6317 optical spectrum analyzer (OSA)
with a resolution of 0.02 nm is used to measure the output spectrum of the generated
mode-locked laser, while the mode-locked time characteristics are measured using an
Alnair HAC-200 auto-correlator. A LeCroy 352A oscilloscope, together with an Agilent
83440C lightwave detector, is used to analyze the mode locked pulse train properties.
The radio frequency spectrum of the mode locked pulses is also observed by using an
Anritsu MS2683A RFSA.
Mode-locked pulses can be observed at a threshold pump power of about 55
mW, with the obtained optical spectrum as seen from the OSA giving a very wide-band
output, together with multiple side-bands present. These sidebands confirm that the
system is operating in the soliton regime. The central wavelength of the generated mode
locked pulse can be tuned from 1551 nm to 1570 nm, giving the system a tuning range
of approximately 19 nm, by simultaneously adjusting the extinction ratio and the
wavelength knobs of the filter. The mode-locked spectrum is shown in Figure 5.30 (a)
to (c). The central wavelength of the mode locked pulses as measured from the OSA is

250
initially obtained at 1551.6 nm, as shown in Figure 5.30 (a), while Figure 5.30 (b) and
5.30 (c) show the central wavelengths of 1561.7 nm and 1564.0 nm that are obtained by
adjusting the knobs. As can be inferred from the figure, the spectral width of Figure
5.30 (a), 5.30 (b) and 5.30 (c) are approximately 3.5 nm, 3.6 nm and 3.6 nm
respectively.
Figure 5.30 (a) - (c): The mode-locked output spectrum as taken from the OSA for
different transmission bands of the TMZF
For comparison purposes, the above spectra for different transmission bands of
the Mach Zehnder filter are combined in a single graph as shown in Figure 5.31. From
this figure, it can be inferred that the peak of the output spectrum can be adjusted
accordingly by the tunable filter.
(a) (b) (c)
Figure 5.31: The combined mode locked spectrum for different
transmission bands of the TMZF

251
Figure 5.32 illustrates a similar profile as in Figure 5.31 for a wavelength range
between 1552 nm and 1564 nm for the tuned Mach Zehnder filter, and attests the
existence of mode-locked sidebands. It can be seen that the overall shape of the mode-
locked spectra remain unchanged even as the central wavelength shifts. The 3 dB
bandwidth of the spectra is about 3.5 nm. It is also prudent to note that Kelly sidebands
are visible in this spectrum, unlike tunable mode-locking obtained when using a
conventional TBF such as that reported in [17]. No Kelly sideband structures are
detected when using this TBF, which is a result of the filter spectral limit [33]. This
circumstance will affect the time pulse width of the mode locked pulses, whereupon an
increase in its value occurs.
Figure 5.32: Output spectra of the mode locked pulses at 13 different central
wavelengths with conserved Kelly sidebands structures
Figure 5.33 gives the autocorrelation traces of each of the different wavelength
spectra in Figure 5.32. The estimated pulse durations at the FWHM point varies

252
between 730 and 780 fs by assuming the sech2 pulse shape for the case of anomalous
dispersion.
Figure 5.34 shows the comparison of the 3 dB bandwidth, pulse width and
corresponding time-bandwidth products (TBP) of the 13 different wavelength outputs
obtained from the system. The 3 dB bandwidth of the spectra and the pulse width vary
slightly, from between 3.4 nm to 3.6 nm and 0.73 ps to 0.78 ps respectively. The TBP
values show significantly less variance over the wavelength range, ranging between
0.32 and 0.33 only. The TBP values are only slightly higher than the lowest value
achievable for the transform-limited sech2 pulses, which is approximately 0.315. This is
attributed to the presence of minor chirping in the pulse, which in turn can be taken to
originate from the remaining dispersion of the laser cavity. This is further validated
whereupon theoretical models provide the most accurate value of the TBP as 0.315,
under the condition that the transform-limited sech² pulse can only be realized in chirp-
Figure 5.33: Autocorrelation traces of the laser output at 13 different
central wavelengths, corresponding to the central wavelengths of the
output spectrum in Figure 5.32
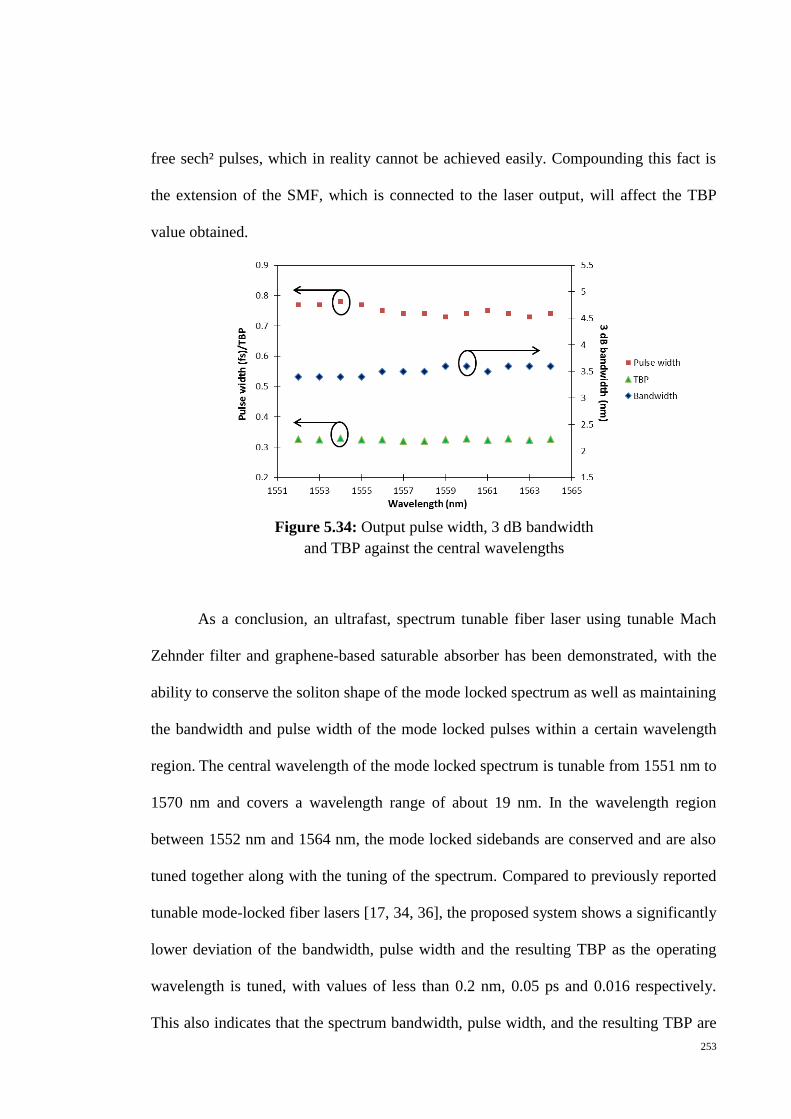
253
free sech² pulses, which in reality cannot be achieved easily. Compounding this fact is
the extension of the SMF, which is connected to the laser output, will affect the TBP
value obtained.
As a conclusion, an ultrafast, spectrum tunable fiber laser using tunable Mach
Zehnder filter and graphene-based saturable absorber has been demonstrated, with the
ability to conserve the soliton shape of the mode locked spectrum as well as maintaining
the bandwidth and pulse width of the mode locked pulses within a certain wavelength
region. The central wavelength of the mode locked spectrum is tunable from 1551 nm to
1570 nm and covers a wavelength range of about 19 nm. In the wavelength region
between 1552 nm and 1564 nm, the mode locked sidebands are conserved and are also
tuned together along with the tuning of the spectrum. Compared to previously reported
tunable mode-locked fiber lasers [17, 34, 36], the proposed system shows a significantly
lower deviation of the bandwidth, pulse width and the resulting TBP as the operating
wavelength is tuned, with values of less than 0.2 nm, 0.05 ps and 0.016 respectively.
This also indicates that the spectrum bandwidth, pulse width, and the resulting TBP are
Figure 5.34: Output pulse width, 3 dB bandwidth
and TBP against the central wavelengths

254
almost constant across the wavelength range. Furthermore, the pulse durations are
relatively shorter; values are relatively closer to the transform limited sech2 pulse of
0.315 with the TBP.
5.3.3 Supercontinuum generation from graphene mode-locked Zr-EDFL
Developing broadband sources has drawn interest due to attractive applications
in spectroscopy, as sensors for gas and liquid properties, as well as sources for optical
component system testing. Broadband wavelength coverage spans from the visible
region until the infrared regions, and their generation comprises of many approaches
such as Xenon lamps, Super Luminescence Emitting Diodes (SLEDs) and others.
Besides these, supercontinuum generation based on mode-locked lasers injected into
various optical fiber types is also an interesting option.
Supercontinuum (SC) can be defined as the formation of wide-ranging
continuous light spectra due to the nonlinear process acting upon the propagation of
high power pulses through the nonlinear media. Research and development associated
with SC generation has been in a rapid progress since its early demonstration over the
last four decades by S. L. Shapiro and R. R. Alfano in crystals and glasses by using a
frequency doubled Nd:Glass mode-locked laser [98]. Investigation on SC behavior has
subsequently caused much interest among researchers, owing to its significance in
creating a light source with a tremendously strong nonlinear spectral broadening as well
as low temporal coherence while the spatial coherence remains high.

255
The SC generation originating from laser pulses finds many beneficial
applications in a variety of fields, such as frequency metrology [99], optical
communications [100, 101], optical coherence tomography [102 - 104], sensing [105,
106], spectroscopy [107], characterization of devices [108] and fluorescence lifetime
imaging microscopy [109]. In the imaging microscopy for example, the optical
properties characteristics of a component as well as the spectral signature of numerous
species or compounds are able to be ascertained and distinguished using the SC source
[110] by means of the spectral broadening effect [111].
The physical processes behind SC generation in fibers may involve the
interaction of various nonlinear effects including the self-phase modulation (SPM),
cross phase modulation (XPM), stimulated Raman scattering (SRS), soliton fission, four
wave mixing (FWM) and modulation instability [112-114], depending particularly on
the characteristics of the laser pulses as well as the characteristics of the nonlinear
medium. For instance, in the case of using the pulsed laser from normal dispersion
regime, the spectral broadening is dominantly caused by self-phase modulation (SPM)
that can be controlled by the pump power [113].
On the other hand, the SC generation using the pulsed laser from the anomalous
dispersion regime is initiated by the higher order solitons [113, 115, 116]. These higher-
order solitons could then spilt-up into multiple fundamental solitons through a process
known as soliton fission. Whereas for long pulses such as nanosecond pulses, the
combination of the two different nonlinear effects, which are stimulated Raman
scattering (SRS) and four-wave mixing (FWM), plays an essential role in realizing the
SC generation.
256
In previous works, the majority of SC generation in the nonlinear fibers has been
focused on the micro-structured fiber [112, 117-120], highly nonlinear dispersion
shifted fibers [121-124], and also tapered fibers [125, 126], either in theoretical or
experimental aspect, or both.
Of particular interest, besides having SC spectra that have very wide spans, there
are also current interests to have SC spectra that are more focused towards the near
infrared region (NIR), which can provide sources for applications such as in the area of
molecular spectroscopy including H2O, C2H2 and C2H4 band stretching studies.
Although there have been many reports based on SC generation that can comply to the
above-mentioned wavelength region, these require exotic and expensive fibers which
are at times very challenging to handle e.g. the difficulty of splicing PCFs to standard
single mode fibers (SMFs) or the extreme cost of HNLFs. Regarding this issue, there is
a need to have a low cost SC source operating in a range of about 1400 nm to 1700 nm
or longer. In addition, the reduced optical damage threshold in those fine core fibers
restricts the highest pulse energy which can be achieved by the SC pulses. This is not
reliable for applications that require high pulse energy.
SMF has recently emerged as a candidate to be employed as the nonlinear
medium for the SC generation, as demonstrated in [110, 114, 127, 128]. Most of these
SC generations in the SMF are reported in the NIR. An interesting feature of SMFs is a
higher optical damage threshold, resulting in a sufficiency to generate high-pulse-
energy. In addition, the spatial beam profile of the SC spectra in the SMF is
significantly improved from that of the non-circular symmetry SC spectra usually
obtained by using the PCF [110].

257
There are still very limited reports to date on the use of the SMF as a medium for
SC generation, in spite of its high availability, low cost, and high convenience to be
spliced with the standard optical fiber. Thus, SC generation in SMF is demonstrated in
this work using the pulsed laser source from the previously demonstrated graphene-
based mode-locked Zr-EDFL, and the results are presented in this section.
The experimental setup of the proposed SC generation in the SMF is shown in
Figure 5.35. Graphene mode-locked Zr-EDFL, which has been demonstrated
previously, is used as the pulsed laser source for the SC generation. The mode-locked
output pulse which is extracted from the 10% port of the 90 / 10 coupler in the previous
setup of graphene mode-locked Zr-EDFL with an average output power of ~1.8 mW,
pulse width of 0.73 ps and pulse energy of ~15 pJ is then being amplified by a ~0.14 W
EDFA. This results in amplified mode-locked pulses with average output power and
pulse energy of ~90.0 mW and ~0.8 nJ respectively.
Figure 5.35: Experimental setup of the proposed SC generation in the SMF
980 nm LD
980/1550nm WDM
EDFA SMF OSA
Zr-EDF mode
locked output
10 m EDF
Isolator

258
The amplified mode-locked pulses are then made to travel into a 200 m SMF to
generate the SC by connecting the output of the amplified mode-locked pulses to the
SMF as the medium for the SC generation. The core size and the cladding diameter of
the SMF is about 9 μm and 125 μm respectively. The 200 m SMF is next replaced by a
500 m SMF and then by a 100 m HNLF consecutively for comparison purpose. A
Yokogawa AQ6317 Optical Spectrum Analyzer (OSA) with a resolution of 0.02 nm is
used to analyze the spectral properties of the generated SC spectrum.
Figure 5.36 shows the measured SC spectra generated in the 200 m SMF. As can
be seen from the figure, the SC spectrum obtained from the 200 m SMF spans from
1500 nm to about 1680 nm. The spectrum also has a large bandwidth of 142 nm at the -
40 dBm level, ranging from ~1522 to ~1664 nm. Generally, there is no definitive
explanation of how much broadening represents a SC although researchers have
published work claiming a SC constitutes as little as 60 nm of broadening [129]. It can
also be inferred that the SC spectrum is relatively flat over the wavelength range from
approximately 1588 to 1631 nm, with an output power within -24 to -26 dBm. X. M.
Liu et. al [111] reported SC generation in SMF using a nanosecond-pulse laser to obtain
a light spectrum covering the wavelength range over 180 nm, which spans from 1555 to
1735 nm. However, this approach is quite complex with a relatively long total oscillator
length (~720 m) and requiring high Raman pump power (~1 to ~5 W) for the
amplification of the output pulses as well as the use of 10 km SMF as the medium for
the SC generation. Ref. [130] reports SC generation demonstrated in SMF with a length
of 10 km, by employing the high-energy wave-breaking-free pulse in a compact all-
fiber laser system, with the SC spectrum spanning from about 1550 to 1700 nm.

259
Figure 5.36: The SC spectrum in 200 m SMF
The result obtained from this experiment shows in comparison an improvement
to the previously reported SC generation in SMF, since using a relatively lower pump
power in this work means only a short length of SMF is required to produce a
considerably similar span of the SC spectrum as reported in previous works.
Another measurement of interest is the Amplified Spontaneous Emission (ASE)
spectrum from the EDFA itself, which is measured by directly connecting it to the OSA,
with the SMF being removed from the setup and the EDFA being disconnected from the
10% port of the output coupler in the mode locked laser setup. The spectrum is shown
in Figure 5.37 when it is pumped by a 370 mW LD at 980 nm connected to the WDM in
the EDFA. The purpose of this ASE spectrum is to provide a comparison with the SC
spectrum generated. The generated ASE spectrum spans from about 1525 to 1570 nm at
a reference level of -50 dBm, with a peak power of approximately –22 dBm at 1531 nm.
-70
-60
-50
-40
-30
-20
1500 1520 1540 1560 1580 1600 1620 1640 1660 1680
Ou
tpu
t p
ow
er (
dB
m)
Wavelength (nm)
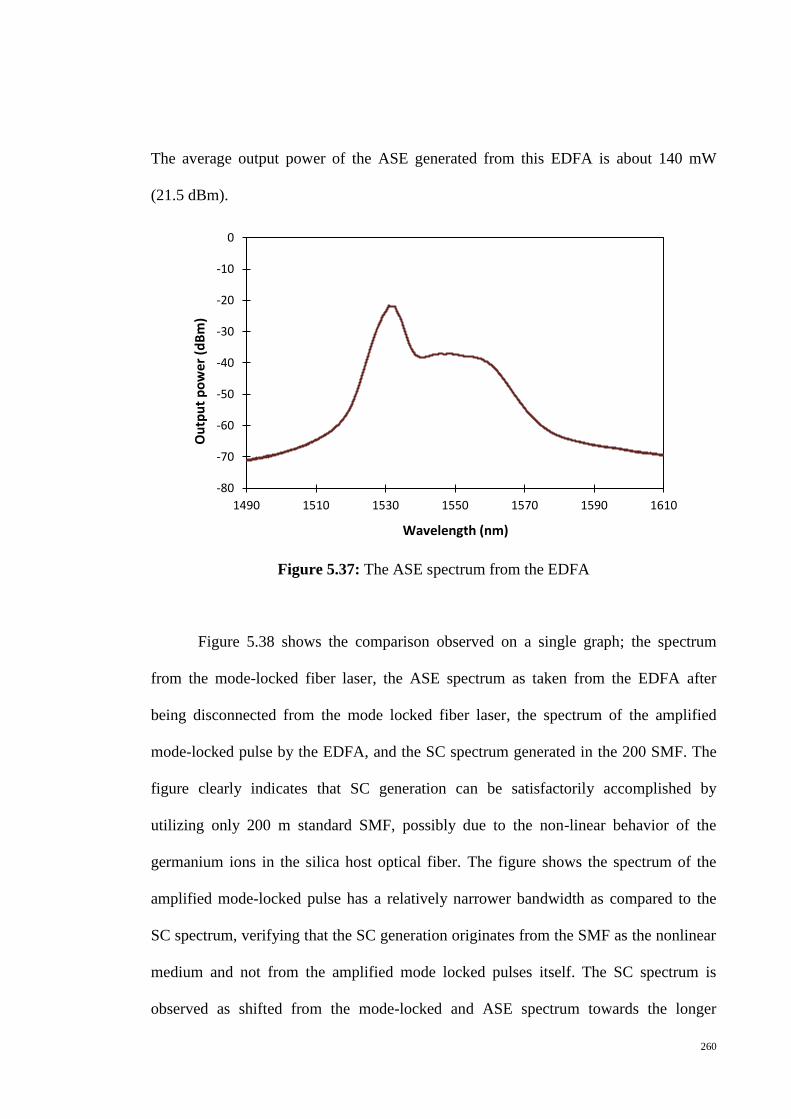
260
The average output power of the ASE generated from this EDFA is about 140 mW
(21.5 dBm).
Figure 5.37: The ASE spectrum from the EDFA
Figure 5.38 shows the comparison observed on a single graph; the spectrum
from the mode-locked fiber laser, the ASE spectrum as taken from the EDFA after
being disconnected from the mode locked fiber laser, the spectrum of the amplified
mode-locked pulse by the EDFA, and the SC spectrum generated in the 200 SMF. The
figure clearly indicates that SC generation can be satisfactorily accomplished by
utilizing only 200 m standard SMF, possibly due to the non-linear behavior of the
germanium ions in the silica host optical fiber. The figure shows the spectrum of the
amplified mode-locked pulse has a relatively narrower bandwidth as compared to the
SC spectrum, verifying that the SC generation originates from the SMF as the nonlinear
medium and not from the amplified mode locked pulses itself. The SC spectrum is
observed as shifted from the mode-locked and ASE spectrum towards the longer
-80
-70
-60
-50
-40
-30
-20
-10
0
1490 1510 1530 1550 1570 1590 1610
Ou
tpu
t p
ow
er (
dB
m)
Wavelength (nm)

261
wavelength. The system can be configured as a compact SC generator using a short
length of SMF with a simple design of a passively mode-locked fiber laser as the pulse
source.
Figure 5.38: The output spectra from the mode-locked fiber laser, ASE of
the EDFA, amplified mode-locked pulse by EDFA, and SC in 200 m SMF
The pulse width measurement of the SC output from the 200 m SMF, as
measured by the autocorrelator, gives the autocorrelation trace shown in Figure 5.39.
This measurement is taken using an attenuator with about 19 dB attenuation so as to
limit the input power to be less than 1 mW, which is the power input limit of the
autocorrelator. The pulse width has a FWHM of about 630 fs using the hyperbolic
secant squared (sech2) technique, indicating a reduction from the mode locked pulse
width of 730 fs that is mainly due to the pulse compression. This situation is commonly
observed for the case of pulses in the anomalous dispersion regime [131].

262
In the case of 500 m long SMF, the SC spectrum generated shows a similar
wide-band emission characteristic to that of the 200 m SMF, stretching from 1500 nm to
more than 1690 nm. However, is has a slightly longer bandwidth at the -40 dBm level,
which ranges from 1524 to 1682 nm, giving a value of about 158 nm. This is shown in
Figure 5.40. Compared to the bandwidth obtained in 200 m SMF at the same output
power level, the bandwidth obtained in the 500 m SMF is broader by about 16 nm. It
can also be observed that the SC spectrum is relatively flat over the wavelength range
from approximately 1585 to 1661 nm, with an output power of within -24 to -29 dBm.
-0.05
0.2
0.45
0.7
0.95
1.2
-6 -4 -2 0 2 4 6
ExperimentalresultSech^2 fitting
Time delay (ps)
Inte
nsi
ty (
a.u
)
Figure 5.39: Autocorrelation trace of the SC output,
with the measured pulse width of 630 fs

263
Figure 5.41 on the other hand shows the pulse width of the SC output from the
500 m SMF. In this case, the pulse width has a FWHM of about 530 fs, which is slightly
shorter than the one obtained from the 200 m SMF.
-70
-60
-50
-40
-30
-20
1500 1550 1600 1650
Ou
tpu
t p
ow
er (
dB
m)
Wavelength (nm)
Figure 5.40: The SC spectrum in 500 m SMF
Figure 5.41: Autocorrelation trace of the SC output

264
The SC spectrum generated in the case of 100 m long HNLF stretches from
1150 nm to more than 1700 nm, exceeding the range of the OSA used, with a wider
bandwidth at the -40 dBm level which ranges from 1300 to more than 1700 nm and
gives a value of about 400 nm. The SC spectrum comparison observed on a single graph
is shown in Figure 5.42, and corresponds to the 200 m SMF, 500 m SMF, and 100 m
HNLF respectively.
Aside from the current demand to develop a simple and inexpensive approach
for SC generation e.g. by using the SMF as the non-linear medium, there is also a
necessity to generate a high efficiency for the SC output. In general, the efficiency of
the SC generation in optical fiber depends on two important parameters; the intensity of
the laser pulses and the nonlinearity of the non-linear medium. Physically, the
nonlinearity of the non-linear medium increases with the increase of its length, or with
the decrease of its core diameter, which leads to the increase of the light intensity per
mode area propagating through it. In this regards, it is an advantage to have a small core
Figure 5.42: SC spectrum from the 200 m SMF, 500 m SMF
and 100 m HNLF, combined in a single graph

265
diameter of fiber as the non-linear medium for the SC generation, with the potential to
reduce the power and the length of the nonlinear medium required for generating a
given spectral range of the SC. Although early works are based on high-energy laser
pulses, it is of interest now to use strong spatial confinement of lower energy pulses
within a suitable nonlinear waveguide. Further investigation of SC generation in this
work uses a narrow core SMF (Fibercore SM1500) with a mode-field diameter (4.2 μm)
of SMF and a cladding diameter of approximately 125 μm. The length of the SMF used
is only 100 m.
Figure 5.43 shows the measured SC spectra generated in the 100 m narrow core
SMF. The SC spectra generated spans from 1450 to more than 1700 nm, exceeding the
range of the OSA used, taking the case of output power reference level of around -70 to
-60 dBm. The spectrum also has a large bandwidth of 164 nm at the -40 dBm output
power level, and ranging from ~1487 to ~1651 nm. Although the performance of SC
generation in the SMF in this work is worse in terms of SC spectra wavelength range
than for previously reported SC generation in the SMF [110, 128], there is a possibility
to improve the performance of this proposed system by having more intense laser
pulses.
Figure 5.43: The SC spectra in the 100 m narrow core SMF

266
The pulse width measurement of the SC output from the 100 m SMF, which is
measured by using an autocorrelator, yields the autocorrelation trace as shown in Figure
5.44. The pulse width of the SC output has a FWHM of about 120 fs using the sech2
fitting, indicating a reduction of about 6 times from the mode locked pulse width of 730
fs, and this reduction can be mainly attributed to the pulse compression.
From the experimental results, it can be summarized that as in the case of the
narrow core SMF with a mode-field diameter of 4.2 μm, a short length of 100 m SMF is
able to generate an SC spectrum that has a bandwidth of about 164 nm, although a
standard SMF with mode-field diameter of 9 μm would require a longer length of fiber
in excess of about 500 m to achieve the same span. From the above results, it can
inferred that the SMF with a smaller mode-field diameter is capable of performance on
par with much longer SMF possessing a larger mode-field diameter, thus allowing for a
compact SC generator to be realized. The proposed SC source can be used as a
relatively simple and low cost optical source for applications in NIR spectroscopy of
Time delay (ps)
Inte
nsi
ty (
a.u
)
Figure 5.44: Autocorrelation trace of the SC output,
with a FWHM of 120 fs

267
molecular gases, testing optical components in the S, C- and L- bands, and is especially
useful for Wavelength Division Multiplexing-Passive Optical Network (WDM-PON)
systems. The proposed source is also useful in applications that do not require a very
wide SC bandwidth, so can therefore serve as a lower cost alternative due to its use of
relatively easily obtainable and inexpensive components.
268
References
1. Zhang, H., Tang, D. Y., Zhao, L. M., Bao, Q. L., & Loh, K. P. (2009). Large
energy mode locking of an erbium-doped fiber laser with atomic layer graphene.
Optics Express, 17(20), 17630-17635.
2. Choi, S. Y., Cho, D. K., Song, Y. W., Oh, K., Kim, K., Rotermund, F., & Yeom,
D. I. (2012). Graphene-filled hollow optical fiber saturable absorber for efficient
soliton fiber laser mode-locking. Optics Express, 20(5), 5652-5657.
3. Martinez, A., Fuse, K., Xu, B., & Yamashita, S. (2010). Optical deposition of
graphene and carbon nanotubes in a fiber ferrule for passive mode-locked
lasing. Optics Express, 18(22), 23054-23061.
4. Sobon, G., Sotor, J., Pasternak, I., Grodecki, K., Paletko, P., Strupinski, W.,
Jankiewicz, Z., & Abramski, K. M. (2012). Er-doped fiber laser mode-locked by
CVD-graphene saturable absorber. Journal of Lightwave Technology, 30(17),
2770-2775. 5. Sobon, G., Sotor, J., Pasternak, I., Strupinski, W., Krzempek, K., Kaczmarek, P.,
& Abramski, K. M. (2013). Chirped pulse amplification of a femtosecond Er-
doped fiber laser mode-locked by a graphene saturable absorber. Laser Physics
Letters, 10(3), 035104. 6. Sobon, G., Sotor, J., & Abramski, K. M. (2012). All-polarization maintaining
femtosecond Er-doped fiber laser mode-locked by graphene saturable absorber.
Laser Physics Letters, 9(8), 581-586.
269
7. Dennis, M. L., & Duling III, I. N. (1994). Experimental study of sideband
generation in femtosecond fiber lasers. IEEE Journal of Quantum Electronics,
30(6), 1469-1477. 8. Sun, Z., Hasan, T., Torrisi, F., Popa, D., Privitera, G., Wang, F., Bonaccorso, F.,
Basko, D. M., & Ferrari, A. C. (2010). Graphene mode-locked ultrafast laser. ACS
Nano, 4(2), 803-810. 9. Kartner, F. X., Jung, I. D., & Keller, U. (1996). Soliton mode-locking with
saturable absorbers. IEEE Journal of Selected Topics in Quantum Electronics,
2(3), 540-556. 10. Okhotnikov, O., Grudinin, A., & Pessa, M. (2004). Ultra-fast fibre laser systems
based on SESAM technology: new horizons and applications. New Journal of
Physics, 6(177), 1-22. 11. Rozhin, A. G., Sakakibara, Y., Namiki, S., Tokumoto, M., Kataura, H., & Achiba,
Y. (2006). Sub-200-fs pulsed erbium-doped fiber laser using a carbon nanotube-
polyvinylalcohol mode locker. Applied Physics Letters, 88(5), 051118. 12. Jung, I. D., Kärtner, F. X., Henkmann, J., Zhang, G., & Keller, U. (1997). High-
dynamic-range characterization of ultrashort pulses. Applied Physics B: Lasers
and Optics, 65(2), 307-310. 13. Ahmad, H., Awang, N. A., Zulkifli, M. Z., Thambiratnam, K., Paul, M. C., Das,
S., & Harun, S. W. (2012). Supercontinuum from Zr-EDF using Zr-EDF mode-
locked fiber laser. Laser Physics Letters, 9(1), 44-49. 14. Sun, Z., Hasan, T., Wang, F., Rozhin, A. G., White, I. H., & Ferrari, A. C. (2010).
Ultrafast stretched-pulse fiber laser mode-locked by carbon nanotubes. Nano
Research, 3(6), 404-411.
270
15. Von der Linde, D. (1986). Characterization of the noise in continuously operating
mode-locked lasers. Applied Physics B, 39(4), 201-217. 16. Hönninger, C., Paschotta, R., Morier-Genoud, F., Moser, M., & Keller, U. (1999).
Q-switching stability limits of continuous-wave passive mode locking. JOSA
B, 16(1), 46-56. 17. Wang, F., Rozhin, A. G., Scardaci, V., Sun, Z., Hennrich, F., White, I. H., Milne,
W. I., & Ferrari, A. C. (2008). Wideband-tuneable, nanotube mode-locked, fibre
laser. Nature Nanotechnology, 3(12), 738-742. 18. Keller, U., Weingarten, K. J., Kartner, F. X., Kopf, D., Braun, B., Jung, I. D.,
Fluck, R., Honninger, C., Matuschek, N., & Aus der Au, J. (1996). Semiconductor
saturable absorber mirrors (SESAM's) for femtosecond to nanosecond pulse
generation in solid-state lasers. Selected Topics in Quantum Electronics, IEEE
Journal of, 2(3), 435-453. 19. Zhang, M., Kelleher, E. J. R., Torrisi, F., Sun, Z., Hasan, T., Popa, D., Wang, F.,
Ferrari, A. C., & Taylor, J. R. (2012). Tm-doped fiber laser mode-locked by
graphene-polymer composite. Optics Express, 20(22), 25077-25084. 20. Agrawal, G. P. (2001). Applications of nonlinear fiber optics. San Diego, CA:
Academic press. 21. Kashiwagi, K., & Yamashita, S. (2009). Deposition of carbon nanotubes around
microfiber via evanascent light. Optics Express, 17(20), 18364-18370. 22. Popa, D., Sun, Z., Hasan, T., Cho, W. B., Wang, F., Torrisi, F., & Ferrari, A. C.
(2012). 74-fs nanotube-mode-locked fiber laser. Applied Physics Letters, 101(15),
153107.

271
23. Tamura, K., Nelson, L. E., Haus, H. A., & Ippen, E. P. (1994). Soliton versus
nonsoliton operation of fiber ring lasers. Applied Physics Letters, 64(2), 149-151. 24. Spielmann, C., Curley, P. F., Brabec, T., & Krausz, F. (1994). Ultrabroadband
femtosecond lasers. Quantum Electronics, IEEE Journal of, 30(4), 1100-1114. 25. Hammani, K., Kibler, B., Finot, C., Morin, P., Fatome, J., Dudley, J. M., &
Millot, G. (2011). Peregrine soliton generation and breakup in standard
telecommunications fiber. Optics Letters, 36(2), 112-114. 26. Russell, P. (2003). Photonic Crystal Fibers. Science, 299(5605), 358-362. 27. Set, S. Y., Yaguchi, H., Tanaka, Y., & Jablonski, M. (2004). Laser mode locking
using a saturable absorber incorporating carbon nanotubes. Journal of Lightwave
Technology, 22(1), 51-56. 28. Fermann, M. E., Galvanauskas, A., Sucha, G., & Harter, D. (1997). Fiber-lasers
for ultrafast optics. Applied Physics B: Lasers and Optics, 65(2), 259-275. 29. Tamura, K., Ippen, E. P., Haus, H. A., & Nelson, L. E. (1993). 77-fs pulse
generation from a stretched-pulse mode-locked all-fiber ring laser. Optics
Letters, 18(13), 1080-1082. 30. Popa, D., Sun, Z., Torrisi, F., Hasan, T., Wang, F., & Ferrari, A. C. (2010). Sub
200 fs pulse generation from a graphene mode-locked fiber laser. Applied Physics
Letters, 97(20), 203106. 31. Keller, U. (2003). Recent developments in compact ultrafast lasers. Nature,
424(6950), 831-838. 32. Ahmad, H., Muhammad, F. D., Zulkifli, M. Z., & Harun, S. W. (2013). Graphene-
based mode-locked, spectrum tunable fiber laser using Mach Zehnder filter. IEEE
Photonics Journal, 5(5), 501709.

272
33. Tamura, K., Doerr, C. R., Haus, H. A., & Ippen, E. P. (1994). Soliton fiber ring
laser stabilization and tuning with a broad intracavity filter. Photonics Technology
Letters, IEEE, 6(6), 697-699. 34. Sun, Z., Popa, D., Hasan, T., Torrisi, F., Wang, F., Kelleher, E. J. R., Travers, J.
C., & Ferrari, A. C. (2010). A stable, wideband tunable, near transform-limited,
graphene-mode-locked, ultrafast laser. Nano Research, 3(9), 653-660. 35. Bao, Q., Zhang, H., Yang, J. X., Wang, S., Tang, D. Y., Jose, R., Ramakrishna, S.,
Lim, C. T., & Loh, K. P. (2010). Graphene–polymer nanofiber membrane for
ultrafast photonics. Advanced Functional Materials, 20(5), 782-791. 36. Zhang, H., Tang, D., Knize, R. J., Zhao, L., Bao, Q., & Loh, K. P. (2010).
Graphene mode locked, wavelength-tunable, dissipative soliton fiber laser.
Applied Physics Letters, 96(11), 111112. 37. Gill, D. M., McCaughan, L., & Wright, J. C. (1996). Spectroscopic site
determinations in erbium-doped lithium niobate. Physical Review B, 53(5), 2334-
2344. 38. Snoeks, E., Kik, P. G., & Polman, A. (1996). Concentration quenching in erbium
implanted alkali silicate glasses. Optical Materials, 5(3), 159-167. 39. Ahmad, H., Thambiratnam, K., Paul, M. C., Zulkifli, A. Z., Ghani, Z. A., &
Harun, S. W. (2012). Fabrication and application of zirconia-erbium doped
fibers. Optical Materials Express, 2(12), 1690-1701. 40. Paul, M. C., Sobon, G., Sotor, J., Abramski, K. M., Jagiello, J., Kozinski, R.,
Lipinska, L., & Pal, M. (2013). A graphene-based mode-locked nano-engineered
zirconia–yttria–aluminosilicate glass-based erbium-doped fiber laser. Laser
Physics, 23(3), 035110.

273
41. Ahmad, H., Paul, M. C., Awang, N. A., Harun, S. W., Pal, M., & Thambiratnam,
K. (2012). Four-wave-mixing in zirconia-yttria-aluminum erbium codoped silica
fiber. Journal of the European Optical Society-Rapid publications, 7(12011). 42. Song, Y. W., Yamashita, S., Goh, C. S., & Set, S. Y. (2007). Passively mode-
locked lasers with 17.2-GHz fundamental-mode repetition rate pulsed by carbon
nanotubes. Optics Letters, 32(4), 430-432. 43. Martinez, A., & Yamashita, S. (2011). Multi-gigahertz repetition rate passively
modelocked fiber lasers using carbon nanotubes. Optics Express, 19(7), 6155-
6163. 44. Panasenko, D., Polynkin, P., Polynkin, A., Moloney, J. V., Mansuripur, M., &
Peyghambarian, N. (2006). Er-Yb femtosecond ring fiber oscillator with 1.1-W
average power and GHz repetition rates. Photonics Technology Letters, IEEE,
18(7), 853-855. 45. Nicholson, J. W., & DiGiovanni, D. J. (2008). High-repetition-frequency low-
noise fiber ring lasers mode-locked with carbon nanotubes. Photonics Technology
Letters, IEEE, 20(24), 2123-2125. 46. Fu, B., Gui, L., Zhang, W., Xiao, X., Zhu, H., & Yang, C. (2013). Passive
harmonic mode locking in erbium-doped fiber laser with graphene saturable
absorber. Optics Communications, 286, 304-308. 47. Meng, Y. C., Zhang, S. M., Li, X. L., Li, H. F., Du, J., & Hao, Y. P. (2012).
Passive harmonically mode-locked fiber laser with low pumping power based on a
graphene saturable absorber. Laser Physics Letters, 9(7), 537-541.

274
48. Du, J., Zhang, S. M., Li, H. F., Meng, Y. C., Li, X. L., & Hao, Y. P. (2012). L-
Band passively harmonic mode-locked fiber laser based on a graphene saturable
absorber. Laser Physics Letters, 9(12), 896-900. 49. Sobon, G., Sotor, J., & Abramski, K. M. (2012). Passive harmonic mode-locking
in Er-doped fiber laser based on graphene saturable absorber with repetition rates
scalable to 2.22 GHz. Applied Physics Letters, 100(16), 161109-161109. 50. Jun, C. S., Choi, S. Y., Rotermund, F., Kim, B. Y., & Yeom, D. I. (2012). Toward
higher-order passive harmonic mode-locking of a soliton fiber laser. Optics
Letters, 37(11), 1862-1864. 51. Chen, H. R., Lin, K. H., Tsai, C. Y., Wu, H. H., Wu, C. H., Chen, C. H., Chi, Y.
C., Lin, G. R., & Hsieh, W. F. (2013). 12 GHz passive harmonic mode-locking in
a 1.06 μm semiconductor optical amplifier-based fiber laser with figure-eight
cavity configuration. Optics Letters, 38(6), 845-847. 52. Grudinin, A. B., & Gray, S. (1997). Passive harmonic mode locking in soliton
fiber lasers. JOSA B, 14(1), 144-154. 53. Zhu, P. F., Lin, Z. B., Ning, Q. Y., Cai, Z. R., Xing, X. B., Liu, J., Chen, W. C.,
Luo, Z. C., Luo, A. P., & Xu, W. C. (2013). Passive harmonic mode-locking in a
fiber laser by using a microfiber-based graphene saturable absorber. Laser Physics
Letters, 10(10), 105107. 54. Du, J., Zhang, S. M., Li, H. F., Meng, Y. C., Li, X. L., & Hao, Y. P. (2012). L-
Band passively harmonic mode-locked fiber laser based on a graphene saturable
absorber. Laser Physics Letters, 9(12), 896-900. 55. Grudinin, A. B., Richardson, D. J., & Payne, D. N. (1992). Energy quantisation in
figure eight fibre laser. Electronics Letters, 28(1), 67-68.

275
56. Hasegawa, A., & Tappert, F. (1973). Transmission of stationary nonlinear optical
pulses in dispersive dielectric fibers. I. Anomalous dispersion. Applied Physics
Letters, 23(3), 142-144. 57. Sobon, G., Sotor, J., & Abramski, K. M. (2013). Sub-picosecond graphene-based
harmonically mode-locked fiber laser with repetition rates up to 2.22 GHz. In EPJ
Web of Conferences (Vol. 41, p. 10001). EDP Sciences. 58. Sobon, G., Krzempek, K., Kaczmarek, P., Abramski, K. M., & Nikodem, M.
(2011). 10GHz passive harmonic mode-locking in Er–Yb double-clad fiber laser.
Optics Communications, 284(18), 4203-4206. 59. Amrani, F., Haboucha, A., Salhi, M., Leblond, H., Komarov, A., Grelu, P., &
Sanchez, F. (2009). Passively mode-locked erbium-doped double-clad fiber laser
operating at the 322nd harmonic. Optics Letters, 34(14), 2120-2122. 60. Chan, S. W., & Shu, C. (2002). Harmonically mode-locked fiber laser with
optically selectable wavelength. Photonics Technology Letters, IEEE, 14(6), 771-
773. 61. Usechak, N. G., Agrawal, G. P., & Zuegel, J. D. (2004). Tunable, high-repetition-
rate, harmonically mode-locked ytterbium fiber laser. Optics Letters, 29(12),
1360-1362. 62. Roth, J. M., Ulmer, T. G., Spellmeyer, N. W., Constantine, S., & Grein, M. E.
(2004). Wavelength-tunable 40-GHz picosecond harmonically mode-locked fiber
laser source. Photonics Technology Letters, IEEE, 16(9), 2009-2011. 63. Zeitouny, A., Parkhomenko, Y. N., & Horowitz, M. (2005). Stable operating
region in a harmonically actively mode-locked fiber laser. Quantum Electronics,
IEEE Journal of, 41(11), 1380-1387.

276
64. Harvey, G. T., & Mollenauer, L. F. (1993). Harmonically mode-locked fiber ring
laser with an internal Fabry–Perot stabilizer for soliton transmission. Optics
Letters, 18(2), 107-109. 65. Nakazawa, M., Tamura, K., & Yoshida, E. (1996). Supermode noise suppression
in a harmonically modelocked fibre laser by self phase modulation and spectral
filtering. Electronics Letters, 32(5), 461-463. 66. Fukuchi, Y., & Maeda, J. (2012). Characteristics of wavelength-tunable
harmonically mode-locked short-cavity fiber ring laser using a bismuth-oxide-
based erbium-doped fiber and a bismuth-oxide-based highly nonlinear
fiber. Quantum Electronics, IEEE Journal of, 48(7), 897-902. 67. Wey, J. S., Goldhar, J., Rush, D., Chbat, M. W., Carter, G. M., & Burdge, G. L.
(1995). Performance characterization of a harmonically mode-locked erbium fiber
ring laser. Photonics Technology Letters, IEEE, 7(2), 152-154. 68. Zhang, Z., Kuang, Q., & Sang, M. (2009, November). Passive harmonically
mode-locked erbium-doped fiber laser. In Asia Communications and Photonics,
Proc. Of SPIE-OSA-IEEE (pp. 76300O-76300O). International Society for Optics
and Photonics. 69. Schmeckebier, H., Fiol, G., Meuer, C., Arsenijević, D., & Bimberg, D. (2010).
Complete pulse characterization of quantum dot mode-locked lasers suitable for
optical communication up to 160 Gbit/s. Optics Express, 18(4), 3415-3425. 70. Yilmaz, T., DePriest, C. M., Turpin, T., Abeles, J. H., & Delfyett, P. J. (2002).
Toward a photonic arbitrary waveform generator using a modelocked external
cavity semiconductor laser. Photonics Technology Letters, IEEE, 14(11), 1608-
1610.

277
71. Chu, S. W., Chen, S. Y., Tsai, T. H., Liu, T. M., Lin, C. Y., Tsai, H. J., & Sun, C.
K. (2003). In vivo developmental biology study using noninvasive multi-
harmonic generation microscopy. Optics Express, 11(23), 3093-3099. 72. Collings, B. C., Bergman, K., & Knox, W. H. (1998). Stable multigigahertz pulse-
train formation in a short-cavity passively harmonic mode-locked
erbium/ytterbium fiber laser. Optics Letters, 23(2), 123-125. 73. Gray, S., & Grudinin, A. B. (1996). Soliton fiber laser with a hybrid saturable
absorber. Optics Letters, 21(3), 207-209. 74. Gray, S., Grudinin, A. B., Loh, W. H., & Payne, D. N. (1995). Femtosecond
harmonically mode-locked fiber laser with time jitter below 1 ps. Optics Letters,
20(2), 189-191. 75. Grudinin, A. B., Richardson, D. J., & Payne, D. N. (1993). Passive harmonic
modelocking of a fibre soliton ring laser. Electronics Letters, 29(21), 1860-1861. 76. Zhou, S., Ouzounov, D. G., & Wise, F. W. (2006). Passive harmonic mode-
locking of a soliton Yb fiber laser at repetition rates to 1.5 GHz. Optics Letters,
31(8), 1041-1043. 77. Ortaç, B., Hideur, A., Martel, G., & Brunel, M. (2005). 2-GHz passive
harmonically mode-locked Yb-doped double-clad fiber laser. Applied Physics B,
81(4), 507-509. 78. Panasenko, D., Polynkin, P., Polynkin, A., Moloney, J. V., Mansuripur, M., &
Peyghambarian, N. (2006). Er-Yb femtosecond ring fiber oscillator with 1.1-W
average power and GHz repetition rates. Photonics Technology Letters, IEEE,
18(7), 853-855.
278
79. Sobon, G., Krzempek, K., Kaczmarek, P., Abramski, K. M., & Nikodem, M.
(2011). 10GHz passive harmonic mode-locking in Er–Yb double-clad fiber laser.
Optics Communications, 284(18), 4203-4206. 80. Jun, C. S., Im, J. H., Yoo, S. H., Choi, S. Y., Rotermund, F., Yeom, D. I., & Kim,
B. Y. (2011). Low noise GHz passive harmonic mode-locking of soliton fiber
laser using evanescent wave interaction with carbon nanotubes. Optics
Express, 19(20), 19775-19780. 81. Jiang, K., Fu, S., Shum, P., & Lin, C. (2010). A wavelength-switchable passively
harmonically mode-locked fiber laser with low pumping threshold using single-
walled carbon nanotubes. Photonics Technology Letters, IEEE, 22(11), 754-756. 82. Sotor, J., Sobon, G., Krzempek, K., & Abramski, K. M. (2012). Fundamental and
harmonic mode-locking in erbium-doped fiber laser based on graphene saturable
absorber. Optics Communications, 285(13), 3174-3178. 83. Meng, Y., Zhang, S., Li, X., Li, H., Du, J., & Hao, Y. (2012). Multiple-soliton
dynamic patterns in a graphene mode-locked fiber laser. Optics Express, 20(6),
6685-6692. 84. Castellani, C. E. S., Kelleher, E. J. R., Luo, Z., Wu, K., Ouyang, C., Shum, P. P.,
Shen, Z., Popov, S. V., & Taylor, J. R. (2012). Harmonic and single pulse
operation of a Raman laser using graphene. Laser Physics Letters, 9(3), 223-228. 85. Agrawal, G. P. (2007). Nonlinear fiber optics (4th ed.). Academic Press. 86. Nelson, L. E., Jones, D. J., Tamura, K., Haus, H. A., & Ippen, E. P. (1997).
Ultrashort-pulse fiber ring lasers. Applied Physics B: Lasers and Optics, 65(2),
277-294.
279
87. Haus, H. A., Ippen, E. P., & Tamura, K. (1994). Additive-pulse modelocking in
fiber lasers. Quantum Electronics, IEEE Journal of, 30(1), 200-208.
88. Kutz, J. N., Collings, B. C., Bergman, K., & Knox, W. H. (1998). Stabilized pulse
spacing in soliton lasers due to gain depletion and recovery. Quantum Electronics,
IEEE Journal of, 34(9), 1749-1757. 89. Gong, Y. D., Shum, P., Tang, D. Y., Lu, C., Guo, X., Paulose, V., Man, W. S., &
Tam, H. Y. (2004). Regimes of operation states in passively mode-locked fiber
soliton ring laser. Optics & Laser Technology, 36(4), 299-307. 90. Sobon, G., Sotor, J., & Abramski, K. M. (2013, January). Passive harmonic mode-
locking in fiber lasers with graphene. In Tenth Symposium on Laser
Technology (pp. 87020H-87020H). International Society for Optics and
Photonics. 91. Komarov, A., Leblond, H., & Sanchez, F. (2006). Passive harmonic mode-locking
in a fiber laser with nonlinear polarization rotation. Optics
Communications, 267(1), 162-169. 92. Fermann, M. E., Galvanauskas, A., & Sucha, G. (Eds.). (2003). Ultrafast lasers:
Technology and applications. New York: Marcel Dekker, Inc. 93. Fermann, M. E., & Minelly, J. D. (1996). Cladding-pumped passive harmonically
mode-locked fiber laser. Optics Letters, 21(13), 970-972. 94. Pilipetskii, A. N., Golovchenko, E. A., & Menyuk, C. R. (1995). Acoustic effect
in passively mode-locked fiber ring lasers. Optics Letters, 20(8), 907-909. 95. Okhotnikov, O. G., Gomes, L., Xiang, N., Jouhti, T., & Grudinin, A. B. (2003).
Mode-locked ytterbium fiber laser tunable in the 980–1070-nm spectral range.
Optics Letters, 28(17), 1522-1524.

280
96. Retrieved from: http://www.rp-photonics.com/interferometers.html 97. Inoue, K., Kominato, T., & Toba, H. (1991). Tunable gain equalization using a
Mach-Zehnder optical filter in multistage fiber amplifiers. Photonics Technology
Letters, IEEE, 3(8), 718-720. 98. Alfano, R. R., & Shapiro, S. L. (1970). Observation of self-phase modulation and
small-scale filaments in crystals and glasses. Physical Review Letters, 24(11),
592-594. 99. Washburn, B. R., Diddams, S. A., Newbury, N. R., Nicholson, J. W., Yan, M. F.,
& Jrgensen, C. G. (2004). Phase-locked, erbium-fiber-laser-based frequency comb
in the near infrared. Optics Letters, 29(3), 250-252. 100. Mori, K., Sato, K., Takara, H., & Ohara, T. (2003). Supercontinuum lightwave
source generating 50 GHz spaced optical ITU grid seamlessly over S-, C-and L-
bands. Electronics Letters, 39(6), 544-546. 101. Dudley, J. M., Genty, G., & Coen, S. (2006). Supercontinuum generation in
photonic crystal fiber. Reviews of Modern Physics, 78(4), 1135-1184. 102. Hartl, I., Li, X. D., Chudoba, C., Ghanta, R. K., Ko, T. H., Fujimoto, J. G., Ranka,
J. K., & Windeler, R. S. (2001). Ultrahigh-resolution optical coherence
tomography using continuum generation in an air–silica microstructure optical
fiber. Optics Letters, 26(9), 608-610. 103. Hsiung, P. L., Chen, Y., Ko, T. H., Fujimoto, J. G., de Matos, C. J. S., Popov, S.
V., Taylor, J. R., & Gapontsev, V. P. (2004). Optical coherence tomography using
a continuous-wave, high-power, Raman continuum light source. Optics
Express, 12(22), 5287-5295.
281
104. Drexler, W., Morgner, U., Kärtner, F. X., Pitris, C., Boppart, S. A., Li, X. D.,
Ippen, E. P., & Fujimoto, J. G. (1999). In vivo ultrahigh-resolution optical
coherence tomography. Optics Letters, 24(17), 1221-1223.
105. Ere-Tassou, M., Przygodzki, C., Fertein, E., & Delbarre, H. (2003). Femtosecond
laser source for real-time atmospheric gas sensing in the UV–visible. Optics
Communications, 220(4), 215-221.
106. Sanders, S. T. (2002). Wavelength-agile fiber laser using group-velocity
dispersion of pulsed super-continua and application to broadband absorption
spectroscopy. Applied Physics B, 75(6-7), 799-802.
107. Shah, J. (1999). Ultrafast spectroscopy of semiconductors and semiconductor
nanostructures (Vol. 115). Springer.
108. Hanhijärvi, K., Kassamakov, I., Heikkinen, V., Aaltonen, J., Sainiemi, L.,
Grigoras, K., Franssila, S. & Hæggström, E. (2012). Stroboscopic supercontinuum
white-light interferometer for MEMS characterization. Optics Letters, 37(10),
1703-1705. 109. Dunsby, C., Lanigan, P. M. P., McGinty, J., Elson, D. S., Requejo-Isidro, J.,
Munro, I., Galletly, N., McCann, F., Treanor, B., Onfelt, B., Davis, D. M., Neil,
M. A. A., & French, P. M. W. (2004). An electronically tunable ultrafast laser
source applied to fluorescence imaging and fluorescence lifetime imaging
microscopy. Journal of Physics D: Applied Physics, 37(23), 3296. 110. Watt, R. S., Kaminski, C. F., & Hult, J. (2008). Generation of supercontinuum
radiation in conventional single-mode fibre and its application to broadband
absorption spectroscopy. Applied Physics B, 90(1), 47-53.

282
111. Alfano, R. R. (2006). The supercontinuum laser source (2nd ed.). New York:
Springer. 112. Harun, S. W., Akbari, R., Arof, H., & Ahmad, H. (2011). Supercontinuum
generation in photonic crystal fiber using femtosecond pulses. Laser Physics,
21(7), 1215-1218. 113. Moghaddam, M. R. A., Harun, S. W., Akbari, R., & Ahmad, H. (2011). Flatly
broadened supercontinuum generation in nonlinear fibers using a mode locked
bismuth oxide based erbium doped fiber laser. Laser Physics Letters, 8(5), 369-
375. 114. Liu, X. M., Wang, L. R., Mao, D., & Duan, L. N. (2012). Supercontinuum
generation in standard single-mode fiber pumped by a nanosecond-pulse laser.
Laser Physics, 22(1), 227-231. 115. Herrmann, J., Griebner, U., Zhavoronkov, N., Husakou, A., Nickel, D., Knight, J.
C., Wadsworth, W. J., Russell, P. S. J., & Korn, G. (2002). Experimental evidence
for supercontinuum generation by fission of higher-order solitons in photonic
fibers. Physical Review Letters, 88(17), 173901. 116. Husakou, A. V., & Herrmann, J. (2001). Supercontinuum generation of higher-
order solitons by fission in photonic crystal fibers. Physical Review Letters,
87(20), 203901-203901. 117. Shahabuddin, N. S., Awang, N. A., Ahmad, H., Arof, H., Dimyati, K., Yusoff, Z.,
& Harun, S. W. (2012). Supercontinuum generation using a passive mode-locked
stretched-pulse bismuth-based erbium-doped fiber laser. Optics & Laser
Technology, 44(4), 741-743.

283
118. Ranka, J. K., Windeler, R. S., & Stentz, A. J. (2000). Visible continuum
generation in air-silica microstructure optical fibers with anomalous dispersion at
800 nm. Optics Letters, 25(1), 25-27. 119. Buczynski, R., Pysz, D., Martynkien, T., Lorenc, D., Kujawa, I., Nasilowski, T.,
Berghmans, F., Thienpont, H., & Stepien, R. (2009). Ultra flat supercontinuum
generation in silicate dual core microstructured fiber. Laser Physics Letters, 6(8),
575-581. 120. Bozolan, A., de Matos, C. J., Cordeiro, C., Dos Santos, E. M., & Travers, J.
(2008). Supercontinuum generation in a water-core photonic crystal fiber. Optics
Express, 16(13), 9671-9676. 121. Abeeluck, A. K., Headley, C., & Jørgensen, C. G. (2004). High-power
supercontinuum generation in highly nonlinear, dispersion-shifted fibers by use of
a continuous-wave Raman fiber laser. Optics Letters, 29(18), 2163-2165. 122. Nicholson, J. W., Abeeluck, A. K., Headley, C., Yan, M. F., & Jørgensen, C. G.
(2003). Pulsed and continuous-wave supercontinuum generation in highly
nonlinear, dispersion-shifted fibers. Applied Physics B, 77(2-3), 211-218. 123. Hori, T., Nishizawa, N., Goto, T., & Yoshida, M. (2004). Experimental and
numerical analysis of widely broadened supercontinuum generation in highly
nonlinear dispersion-shifted fiber with a femtosecond pulse. JOSA B, 21(11),
1969-1980. 124. Nicholson, J., & Yan, M. (2004). Cross-coherence measurements of
supercontinua generated in highly-nonlinear, dispersion shifted fiber at 1550 nm.
Optics Express, 12(4), 679-688.

284
125. Cordeiro, C. M. B., Wadsworth, W. J., Birks, T. A., & Russell, P. S. J. (2005).
Engineering the dispersion of tapered fibers for supercontinuum generation with a
1064 nm pump laser. Optics Letters, 30(15), 1980-1982. 126. Teipel, J., Franke, K., Türke, D., Warken, F., Meiser, D., Leuschner, M., &
Giessen, H. (2003). Characteristics of supercontinuum generationin tapered fibers
using femtosecond laser pulses. Applied Physics B, 77(2-3), 245-251. 127. Bartula, R. J., Walewski, J. W., & Sanders, S. T. (2006). Generation of ultraviolet
broadband light in a single-mode fiber. Applied Physics B, 84(3), 395-400. 128. Walewski, J. W., Filipa, J. A., Hagen, C. L., & Sanders, S. T. (2006). Standard
single-mode fibers as convenient means for the generation of ultrafast high-pulse-
energy super-continua. Applied Physics B, 83(1), 75-79. 129. Takara, H., Ohara, T., Yamamoto, T., Masuda, H., Abe, M., Takahashi, H., &
Morioka, T. (2005). Field demonstration of over 1000-channel DWDM
transmission with supercontinuum multi-carrier source. Electronics Letters, 41(5),
270-271. 130. Wang, L. R., Liu, X. M., Gong, Y. K., Mao, D., & Duan, L. N. (2011).
Supercontinuum generation employing the high-energy wave-breaking-free pulse
in a compact all-fiber laser system. Laser Physics, 21(10), 1797-1803. 131. Ahmad, H., Awang, N. A., Zulkifli, M. Z., Thambiratnam, K., Paul, M. C., Das,
S., & Harun, S. W. (2012). Supercontinuum from Zr-EDF using Zr-EDF mode-
locked fiber laser. Laser Physics Letters, 9(1), 44-49.

285
CHAPTER 6
GRAPHENE FOR SINGLE LONGITUDINAL MODE LASERS AND THEIR
APPLICATION
6.1 Graphene based saturable absorber for single longitudinal mode EDFL
Chapter 2 describes in detail the desirable properties or characteristics of EDF
that lead to its wide acceptance as the gain medium in fiber laser. The experimental
result for the gain measurement of EDF is also included, further verifying its ability and
suitability to be employed as the gain medium in fiber laser. Nevertheless, there are still
some shortcomings of using EDF; ring lasers of EDF usually suffer from homogeneous
gain broadening, mode hopping, mode competition, and multimode oscillation [1].
Additionally, the issue of multimode output that rises from fiber ring laser due to mode
hopping, longer cavity length and very narrow longitudinal mode spacing restricts the
fiber lasers from obtaining single longitudinal mode (SLM) operation, which results in
the formation of noises in frequency domain [2]. It is still of interest to have the erbium
doped fiber laser (EDFL) operating in SLM regime due to advantages in various
applications such as fiber optic sensors, modern instrumentation, wavelength-division-
multiplexing (WDM) communications and microwave photonics system [3]. Thus,
research on SLM generation in EDFL is still rapidly developing and has been exploited
drastically in order to meet the important criteria needed for those applications. Many
past works pertaining to SLM generation have been demonstrated [4 - 13]; most employ
highly complex techniques such as multiple ring cavity structures [6, 14 - 16], tunable
ring resonators [17], external light injection [18], unidirectional loop mirrors [19],

286
acousto-optic tunable filters [20], fiber Fabry-Perot filter (FFPF) [21], ultra-narrow
transmission band FBG [22, 23] and short cavity design [24-26]. Simpler configurations
have also been demonstrated using unpumped EDFs as a saturable absorber [2, 27 - 30],
albeit at the cost of performance due to high insertion losses that necessitate high pump
powers. All these designs reduce the noise in the lasing system by suppressing the mode
fluctuations of densely spaced longitudinal modes around the operating wavelength.
This work uses an approach of employing graphene as a saturable absorber to
suppress noise and multimode oscillations in the laser cavity in order to realize the SLM
EDFL. Graphene is discussed earlier as being recognized for outstanding and unique
features such as good optical transparency and ultrawideband tunability that arises from
the zero bandgap energy. A tunable SLM EDFL taking advantage of these
characteristics is demonstrated using multilayer graphene adhered by index matching
gel as described in Chapter 3. The experimental setup for this graphene-based SLM
tunable EDFL is shown in Figure 6.1.
The setup contains a 1 m EDF (LIEKKI™ Er80-8/125), a highly doped large
mode area erbium fiber with core absorption coefficients of 41 and 80 dBm-1 for 980
and 1530 nm respectively. This type of fiber is ideal for medium peak power pulse
amplification as it has low splice loss, high doping and a large core, with a mode field
diameter of 9.5 μm at 1550 nm as well as core numerical aperture of 0.21. Its high
erbium concentration reduces the required application fiber length considerably, while
providing strong gain and reduced non-linear effects like four wave mixing (FWM),
stimulated Raman scattering (SRS) and stimulated Brillouin scattering (SBS). Besides
that, it also has excellent batch consistency of erbium peak absorption and spectral
shape. The length of the highly doped EDF is chosen such that it produces the optimum

287
gain in the fiber laser while also allowing the discharge of excess pump power to ensure
that the EDF is totally in a saturated condition.
Figure 6.1: Experimental setup for the graphene-based SLM
tunable EDFL
The fiber is pumped by a 980 nm laser diode at 143 mW through a 980 / 1550
wavelength division multiplexer (WDM), with the other end connected to Port 1 of an
optical circulator (OC). Port 2 of the OC is connected to the tunable fiber Bragg grating
(TFBG) in order to provide the tuned reflected wavelength. The TFBG provides the
tuning mechanism with a tuning range of more than 10 nm by means of applying
mechanical stress (extension or compression) to the FBG which results in the shift of
the Bragg resonance wavelength. Mechanical stress on the FBG is achieved by bending
a piece of Perspex of low Young modulus in an upward or downward direction with the
FBG being glued onto it. Details regarding this TFBG design and basic operation are
described in [31]. Port 3 of the OC is then connected to a 95:5 fused fiber coupler
(Coupler) with the 95% port connecting back to the 1550 nm port of the WDM and thus
980 nm LD
980/1550nm
WDM
1 m EDF
OC
95:5 Coupler 95%
Graphene SA
PC
TFBG
5%

288
creating a ring cavity. The 5% port of the coupler is connected to an optical spectrum
analyzer (OSA) and this serves as the output of the fiber laser. In between the 95% port
of the coupler and the 1550 port of the WDM, the fiber ferrule with graphene adhered
by index matching gel is employed as the saturable absorber to generate SLM output in
this fiber laser. As has been described in Chapter 2, saturable absorption in graphene is
observed as a consequence of Pauli blocking [32], and in fact Pauli blocking triggers the
facile saturation of absorption in graphene [33]. The saturable absorber is used to
suppress the multi longitudinal mode and noises in a fiber laser for achieving SLM laser
operation. In the case of incident low intensity light, photons are highly absorbed such
that valence band electrons are promoted to the conduction band of the saturable
absorber material. In the case of incident high intensity light, some photons are not
absorbed due to the occupation of electrons in the conduction band resulting from
excitation by photons from the low intensity light. Therefore, only high intensity light
can pass through the saturable absorber with very low loss and vice versa. In principle,
the optical absorption of graphene layers is proportional to the number of layers, with
each layer absorbing A ≈ 1−T ≈ π ≈ 2.3% over the visible spectrum [32]. Hence, it can
be concluded that the thicker the graphene deposited, the more optical absorption it
exhibits.
Figure 6.2 shows the experimental tunability of the SLM EDFL taken from the
OSA with a spectral resolution of 0.02 nm. The indicated tuning range of this fiber laser
spans from 1547 to 1560 nm, though these are not limitations since the tuning range can
exceed above 1560 nm and below 1547 nm. Tuning resolution can be further improved
by using a differential micrometer head on the TFBG [31]. The lasing wavelengths are
observed to be those of a SLM and can be tuned continuously over the desired

289
wavelength region. No mode hopping is observed when the wavelengths are tuned,
which is attributable to the single wavelength lasing allowed by the FBG.
In contrast to earlier works, the graphene based saturable absorber mechanism
used in this experiment experiences a lower insertion loss that results in higher and
stabilized output power. The figure shows there is a very low output power variation
over the entire wavelength range, with peak amplitudes ranging from -5.65 to -7.18
dBm. The maximum peak amplitude, which is about -5.6 dBm, is at 1553.88 nm,
varying slightly throughout all the other wavelengths in the figure. The figure 6.3 plot
displays the variation of the peak amplitude power against the tuned SLM wavelengths,
and the signal-to-noise ratio (SNR), which is a vital characteristic for a fiber laser, is
additionally shown in Figure 6.3. From the plot of the SNR against the tuned SLM
wavelength, it can be seen that the distribution of SNR is obtained between 66.0 and
68.3 dB. An excellent SNR profile is observed with the highest SNR value of 68.25 dB
at 1553.88 nm and corresponding output power of -5.65 dBm. The low deviation of the
Figure 6.2: Output spectra versus wavelengths in the tuning range of
1547.88 to 1559.88 nm
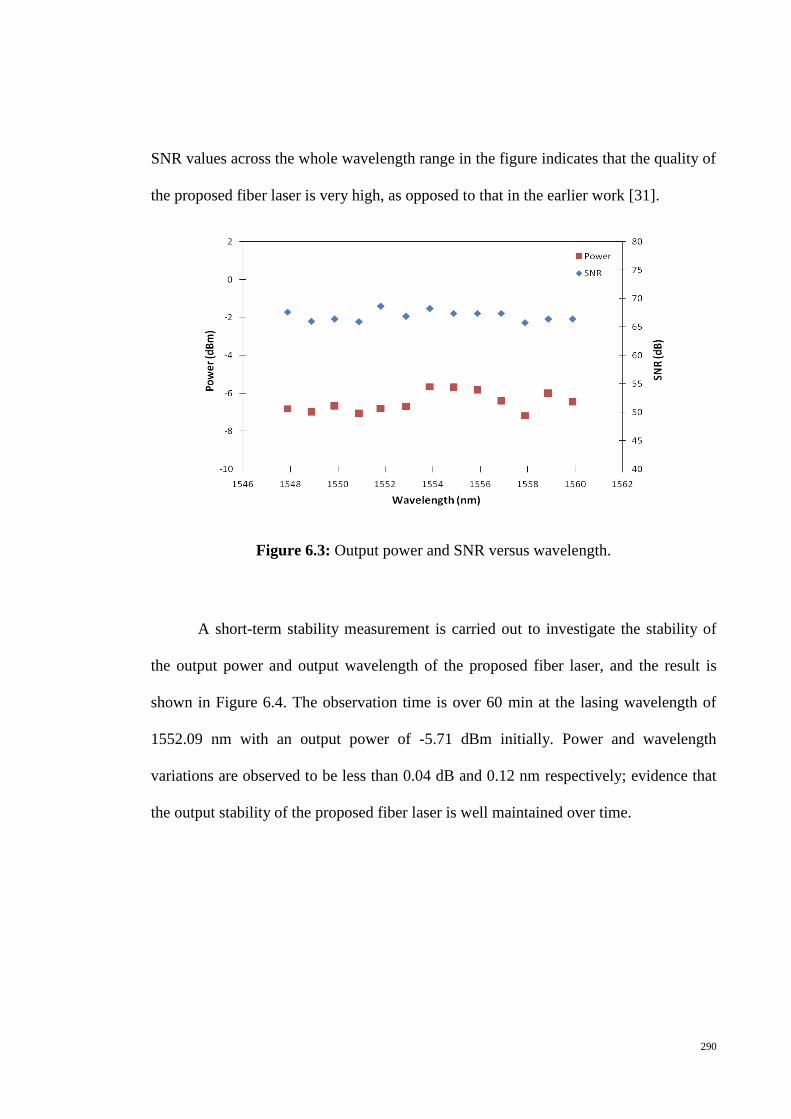
290
SNR values across the whole wavelength range in the figure indicates that the quality of
the proposed fiber laser is very high, as opposed to that in the earlier work [31].
Figure 6.3: Output power and SNR versus wavelength.
A short-term stability measurement is carried out to investigate the stability of
the output power and output wavelength of the proposed fiber laser, and the result is
shown in Figure 6.4. The observation time is over 60 min at the lasing wavelength of
1552.09 nm with an output power of -5.71 dBm initially. Power and wavelength
variations are observed to be less than 0.04 dB and 0.12 nm respectively; evidence that
the output stability of the proposed fiber laser is well maintained over time.
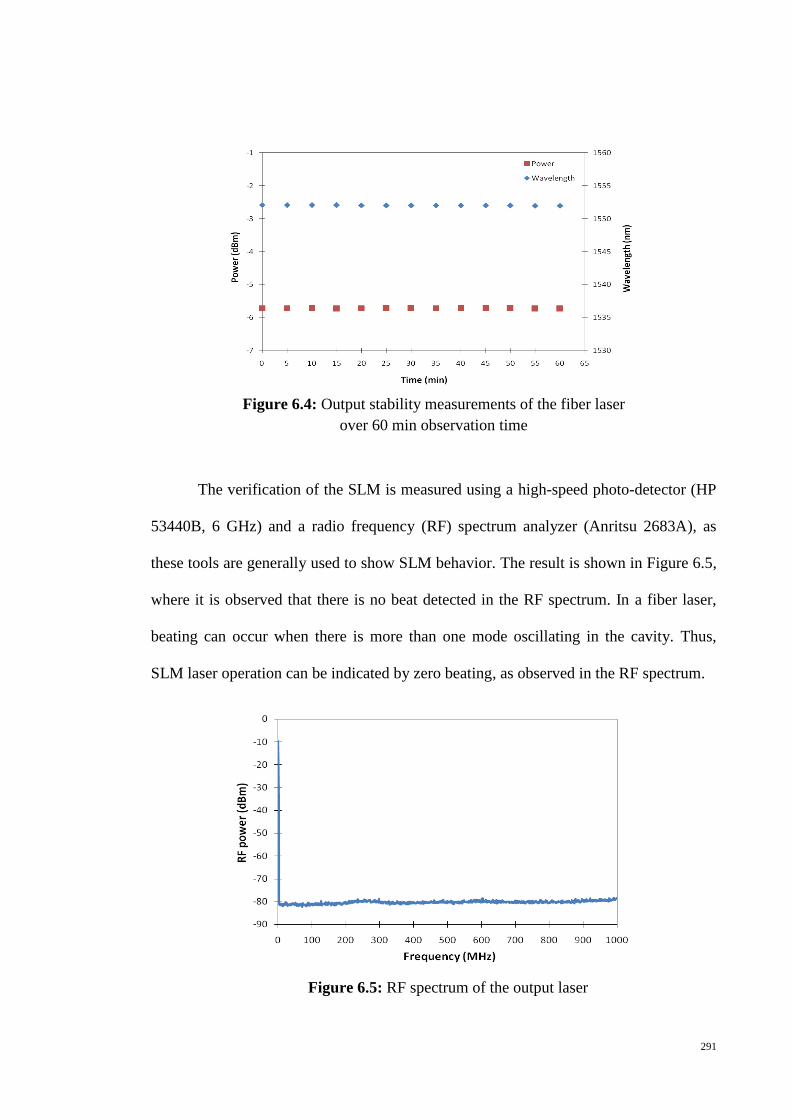
291
The verification of the SLM is measured using a high-speed photo-detector (HP
53440B, 6 GHz) and a radio frequency (RF) spectrum analyzer (Anritsu 2683A), as
these tools are generally used to show SLM behavior. The result is shown in Figure 6.5,
where it is observed that there is no beat detected in the RF spectrum. In a fiber laser,
beating can occur when there is more than one mode oscillating in the cavity. Thus,
SLM laser operation can be indicated by zero beating, as observed in the RF spectrum.
Figure 6.4: Output stability measurements of the fiber laser
over 60 min observation time
Figure 6.5: RF spectrum of the output laser
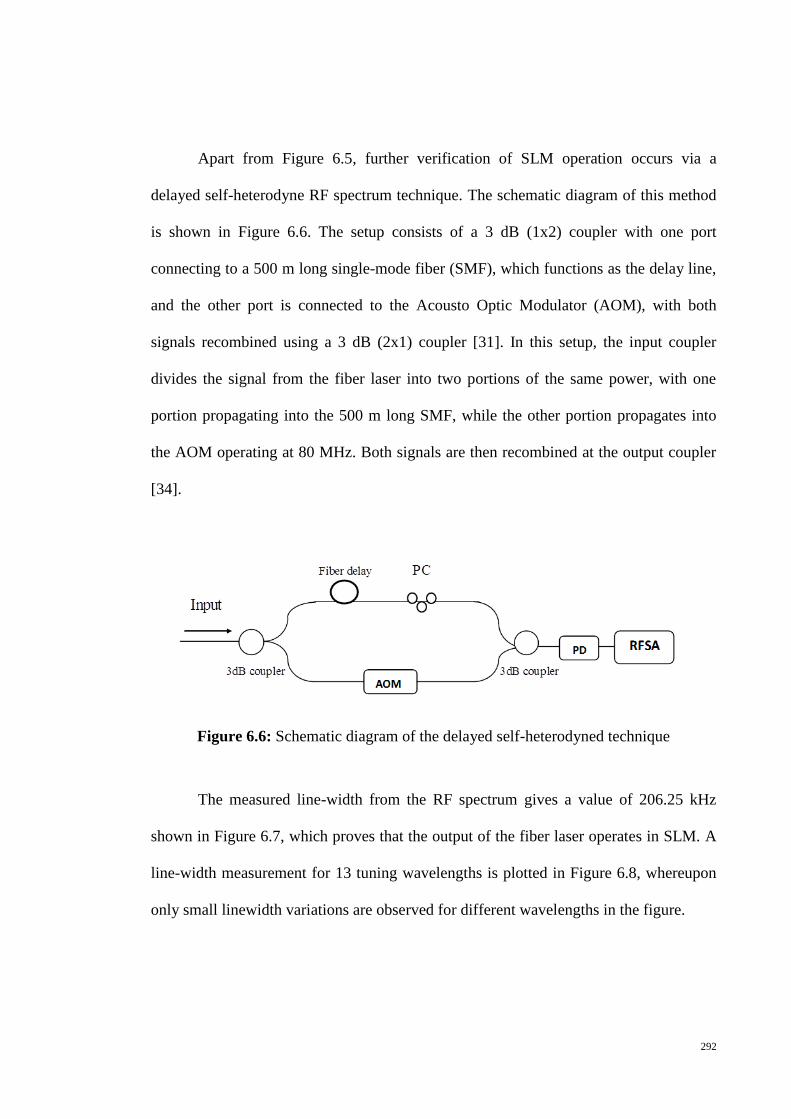
292
Apart from Figure 6.5, further verification of SLM operation occurs via a
delayed self-heterodyne RF spectrum technique. The schematic diagram of this method
is shown in Figure 6.6. The setup consists of a 3 dB (1x2) coupler with one port
connecting to a 500 m long single-mode fiber (SMF), which functions as the delay line,
and the other port is connected to the Acousto Optic Modulator (AOM), with both
signals recombined using a 3 dB (2x1) coupler [31]. In this setup, the input coupler
divides the signal from the fiber laser into two portions of the same power, with one
portion propagating into the 500 m long SMF, while the other portion propagates into
the AOM operating at 80 MHz. Both signals are then recombined at the output coupler
[34].
Figure 6.6: Schematic diagram of the delayed self-heterodyned technique
The measured line-width from the RF spectrum gives a value of 206.25 kHz
shown in Figure 6.7, which proves that the output of the fiber laser operates in SLM. A
line-width measurement for 13 tuning wavelengths is plotted in Figure 6.8, whereupon
only small linewidth variations are observed for different wavelengths in the figure.

293
From the results obtained, it can be deduced that a stable and inexpensive
tunable SLM EDF laser with a simple cavity design has been achieved based on
multilayer or thick layer graphene as the saturable absorber. The key to ensuring SLM
laser oscillation lies in the role of graphene as saturable absorber, which is contrary to
the commonly used unpumped erbium-doped fiber. This tunable SLM laser can be
tuned over 1547.88 - 1559.88 nm with very low variation in output power. The tuning
Figure 6.8: Linewidth measurement versus wavelength
Figure 6.7: RF spectrum of delayed self-heterodyne signal

294
range is determined by a tunable fiber Bragg grating (TFBG) that also functions to
restrict the lasing frequency. A spectral linewidth of 206.25 kHz is obtained using
delayed self-heterodyne method.
6.2 Tunable radio frequency generation using a graphene-based SLM EDFL
The interest of photonic generation of microwave signals has been exploited
drastically due to its advantages in various applications such as radio-over-fiber
networks, broadband wireless access, radar, fiber optic sensors and modern
instrumentation [2, 35 - 39]. There are many approaches for generating microwave
signals such as by using a ferroelectric cathode tube [40], optical domain microwave
frequency octupling [41], optical phase-lock loop [42-44], optical injection locking
[45,46], cross absorption modulation [47] and optical external modulation [48]. Apart
from those approaches, the wavelength-tunable dual-wavelength SLM fiber laser has
lately emerged as a strong candidate for the microwave photonic generation due to its
advantages of low power consumption, low phase noise, low cost, high reliability, low
system complexity, frequency tunability, lack of speed limitation, high output power
and narrow line-width production [49 - 54]. There are various techniques reported in
previous works for producing a dual-wavelength fiber laser via realizing the generation
of microwave signal, such as by using a delay interferometer [55], a fiber Bragg grating
pair [56], cascaded DFB fiber lasers [57,58] and arrayed waveguide grating (AWG) [59,
60]. The beneficial features that the microwave generation approach possesses lead it to
be a more desirable approach compared to any other approach. However, the technique
of beating the dual-wavelength has a disadvantage of difficulty in controlling the power

295
and the wavelength of the fiber laser, since the two beating laser modes share a common
cavity and gain medium that creates an inter-dependency between the two modes.
Furthermore, generation of the beating frequency requires this dual wavelength to
oscillate in SLM operation with a very low phase noise. Such a criterion usually needs
additional equipment or mechanisms to generate the SLM output, such as by using
hybrid gain medium [21] and unpumped erbium doped fibers as a saturable absorber
[27]. This in turn will exhibit a longer and more complex cavity besides introducing an
insertion loss that requires higher pump power. Therefore, a special device to produce a
simple and compact design for generating microwave signals is all the more necessary.
A compact tunable microwave generation is demonstrated in this experiment by
means of slightly modifying the previous setup of graphene-based tunable SLM EDFL.
This modification is achieved by heterodyning the output of the graphene-based SLM
EDFL and the output from an external tunable laser source (TLS) at a photodetector.
The TLS used has an SLM output and a constant output power and wavelength over
time. This approach enables the output power and output wavelength of the two laser
beams to be controlled easily since the two laser sources are independent, providing an
advantage to this system.
Figure 6.9 shows the experimental setup of the proposed tunable microwave
generation that composes of an SLM wavelength-tunable EDFL and an external TLS.
Both outputs of the two laser sources are combined at a 2x2 3 dB coupler. The 5% port
of the coupler from the SLM tunable EDFL is connected to Port 1 of the 2x2 3 dB
coupler and this serves as the output of the SLM tunable EDFL. The second SLM
signal, coming from the TLS, is connected through the second input, Port 2 of the 2x2 3
dB coupler, which combines the signal with the SLM tunable EDFL output to give an

296
equal output at Port 3 and 4. Port 3 is then connected to an OSA (AQ6317) with a
spectral resolution of 0.02 nm for spectral analysis, whereas Port 4 is connected to a
radio frequency spectrum analyzer (RFSA) via a 6 GHz PD (Lightwave detector), for
frequency spectrum analysis in frequency domain. A programmable optical attenuator
(Anritsu MN9610B) is inserted between the TLS and the 2x2 3 dB coupler for
providing attenuation to the TLS signals in order to equate them to the optical signal
coming from the ring SLM fiber laser, and thus producing a stable laser oscillation from
both outputs. Although, in this setup, an external TLS is used for convenience, similar
results can be obtained by having a dual-wavelength SLM fiber ring laser.
Figure 6.9: Experimental setup for tunable microwave generation
by beating two SLM wavelengths from an SLM tunable
fiber ring laser and an inserted external TLS
3 dB Coupler
980 nm LD
980/1550nm
WDM
OC
1 m EDF
95:5 Coupler
Graphene SA
TFBG
TLS
PC
95%
POA
OSA
RFSA

297
The OSA displays an optical spectrum of the two wavelengths mixing as shown
in Figure 6.10 (a), whereby a larger span of the spectra is shown in Figure 6.10 (b). The
wavelength of TLS is fixed at 1551.945 nm. Traces are superimposed to demonstrate
the tuning range of the SLM EDFL. As can be seen from Figure 6.10 (a), the first peak
is from the TLS with an output wavelength of 1551.945 nm and the other peaks are
from the tuned SLM EDFL, at the wavelengths of 1551.965, 1551.97, 1551.975,
1551.980, 1551.985, 1551.990 and 1551.995 nm. The tuning range of the ring fiber
laser (SLM EDFL) can span from 1547 to 1560 nm, as shown previously in Figure 6.2,
which is limited due to the design of the TFBG and can be further improved to provide
a wider tuning range. The output powers are observed to be reasonably constant across
the wavelength tuning range, with a value of between -9 and -10 dBm.
Figure 6.10 (a): The optical output spectra of the proposed system
(a)

298
Figure 6.10 (b): A larger span of the optical output spectra of the proposed system
The RF beating signals are generated by having the two wavelengths, one from
the TLS and the other from the tunable ring fiber laser (SLM EDFL), mixing at the 3dB
coupler with Port 3 connected to the OSA and Port 4 to the photodiode (PD) and then to
the RFSA. For instance, the two wavelengths mixing, with 1551.945 nm and the first
tuned peak at 1551.965 nm, will generate the RF beating signal at 2.40 GHz as given in
Figure 6.11 (a) and corresponding to a wavelength spacing of 0.020 nm between the two
wavelengths in the OSA. Similarly, the other tuned wavelengths of 1551.970, 1551.975,
1551.980, 1551.985, 1551.990, and 1551.995 nm, which corresponds to wavelength
spacing of 0.025, 0.030, 0.035, 0.040, 0.045 and 0.050 nm respectively, will generate an
RF beating signal at 3.35, 3.75, 4.40, 5.00, 5.60, and 5.90 GHz as shown in the same
figure 6.11 (a). Figure 6.11 (b) provides an expanded view of the trace at 5.00 GHz.
Furthermore, this system is possible for continuous microwave frequency generation as
the output from the tunable SLM fiber ring laser can be tuned from 1547 to 1560 nm.
(b)
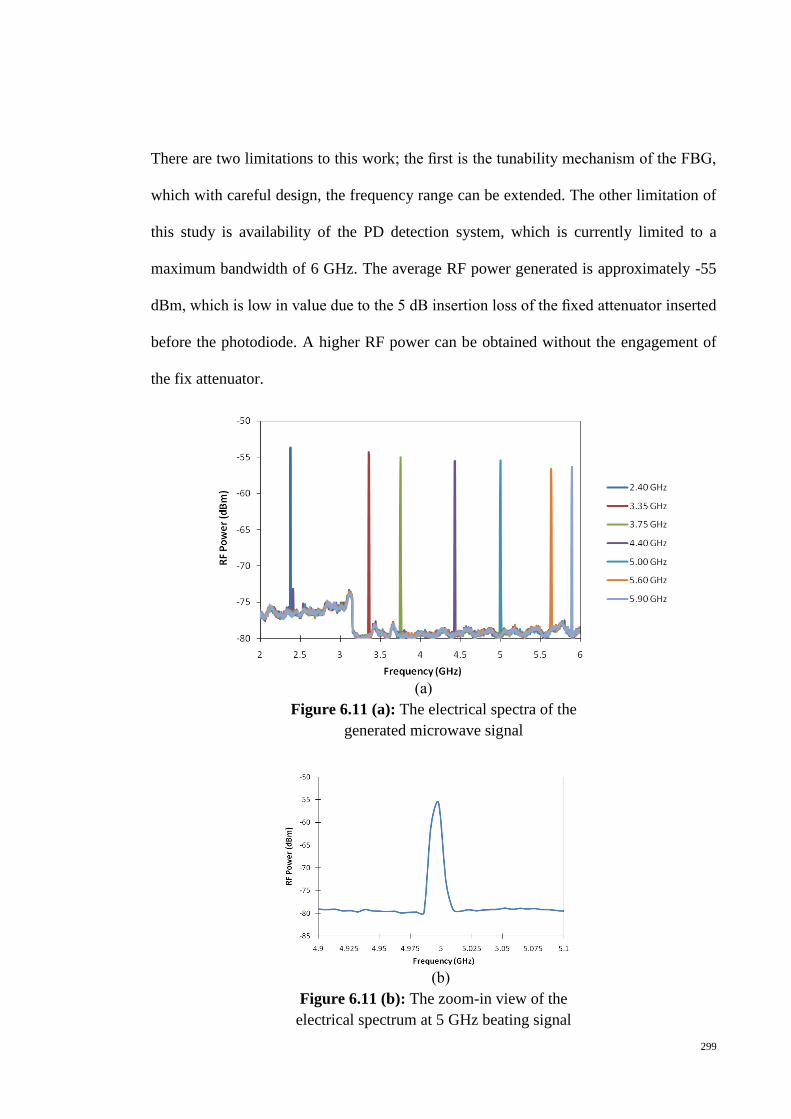
299
There are two limitations to this work; the first is the tunability mechanism of the FBG,
which with careful design, the frequency range can be extended. The other limitation of
this study is availability of the PD detection system, which is currently limited to a
maximum bandwidth of 6 GHz. The average RF power generated is approximately -55
dBm, which is low in value due to the 5 dB insertion loss of the fixed attenuator inserted
before the photodiode. A higher RF power can be obtained without the engagement of
the fix attenuator.
Figure 6.11 (a): The electrical spectra of the
generated microwave signal
Figure 6.11 (b): The zoom-in view of the
electrical spectrum at 5 GHz beating signal
(a)
(b)

300
The generated RF beating signal obtained from the experiment is compared with
the theoretical value expressed as [36]
𝑓(𝑅𝐹) =𝑐∆𝜆
𝜆²=2𝑐𝐵𝛬
𝜆²
where c is the speed of light (3×10⁸ msˉ1), λ is the mean of the lasing wavelengths, ∆λ is
the wavelength spacing between two wavelengths, B is the birefringence of the optical
fiber, and Λ is the grating period of the FBG.
Table 6.1 shows the comparison between the RF-generated beating frequencies
obtained experimentally and its calculated value from equation 6.1.
Table 6.1: Comparison of the beating frequency between experiment
and calculated value
The percentage of difference between the experimental and calculated values is
also given in the table to show the accuracy of the experimental. From the obtained
values, it can be inferred that the RF beating frequency obtained from the experiment
has only a very small percentage of difference with the estimated beating frequency.
Wavelength
spacing, ∆λ (nm)
Beat frequency
(experiment), GHz
Beat frequency
(calculation), GHz
Percentage of
difference (%)
0.020 2.40 2.49 3.61
0.025 3.35 3.11 7.72
0.030 3.75 3.74 0.27
0.035 4.40 4.36 0.92
0.040 5.00 4.98 0.40
0.045 5.60 5.60 0.00
0.050 5.90 6.23 5.30
6.1
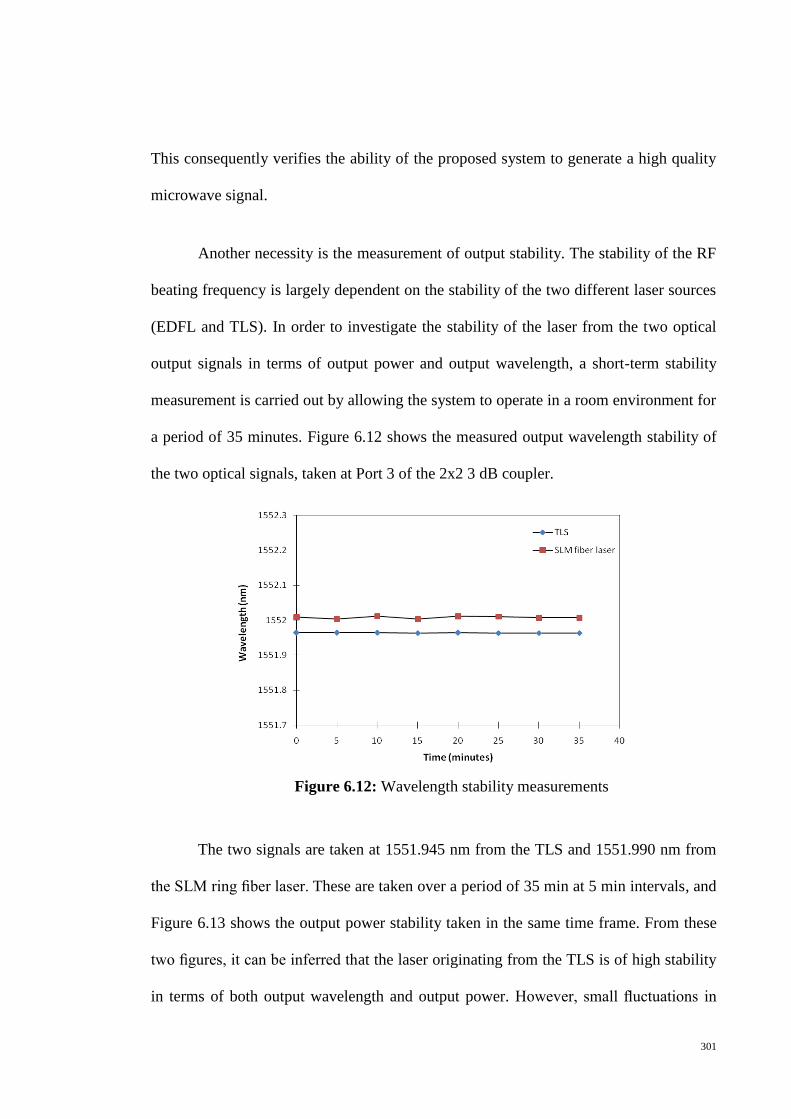
301
This consequently verifies the ability of the proposed system to generate a high quality
microwave signal.
Another necessity is the measurement of output stability. The stability of the RF
beating frequency is largely dependent on the stability of the two different laser sources
(EDFL and TLS). In order to investigate the stability of the laser from the two optical
output signals in terms of output power and output wavelength, a short-term stability
measurement is carried out by allowing the system to operate in a room environment for
a period of 35 minutes. Figure 6.12 shows the measured output wavelength stability of
the two optical signals, taken at Port 3 of the 2x2 3 dB coupler.
Figure 6.12: Wavelength stability measurements
The two signals are taken at 1551.945 nm from the TLS and 1551.990 nm from
the SLM ring fiber laser. These are taken over a period of 35 min at 5 min intervals, and
Figure 6.13 shows the output power stability taken in the same time frame. From these
two figures, it can be inferred that the laser originating from the TLS is of high stability
in terms of both output wavelength and output power. However, small fluctuations in

302
the output power and wavelength of the SLM EDFL can be observed in both Figure
6.12 and Figure 6.13, with wavelength variations of less than 0.008 nm (≈1GHz) and
output power variations of less than 0.6 dB. The wavelength perturbations in the output
of the SLM EDFL originate from the self-induced Bragg wavelength shift of the TFBG
being very sensitive to the changes in the surrounding environment.
Figure 6.13: Output power stability measurements
over 35 mins observation time
Figure 6.14 shows the stability measurement of the generated RF beating signal
at about 5.60 GHz, taken within the same period of the stability measurement in Figure
6.12, such that the generated RF corresponds to the beating of the two signals from the
TLS and SLM EDFL shown in Figure 6.12. Although there are slight variations in the
output wavelength of the SLM EDFL as shown in Figure 6.12, the measured RF output
shows a variation of 0.64 GHz from a maximum of 5.78 GHz to a minimum of 5.14
GHz. This frequency variation is largely due to the wavelength perturbations of the
signal from the EDFL, which results from the TFBG sensitivity towards changes in the
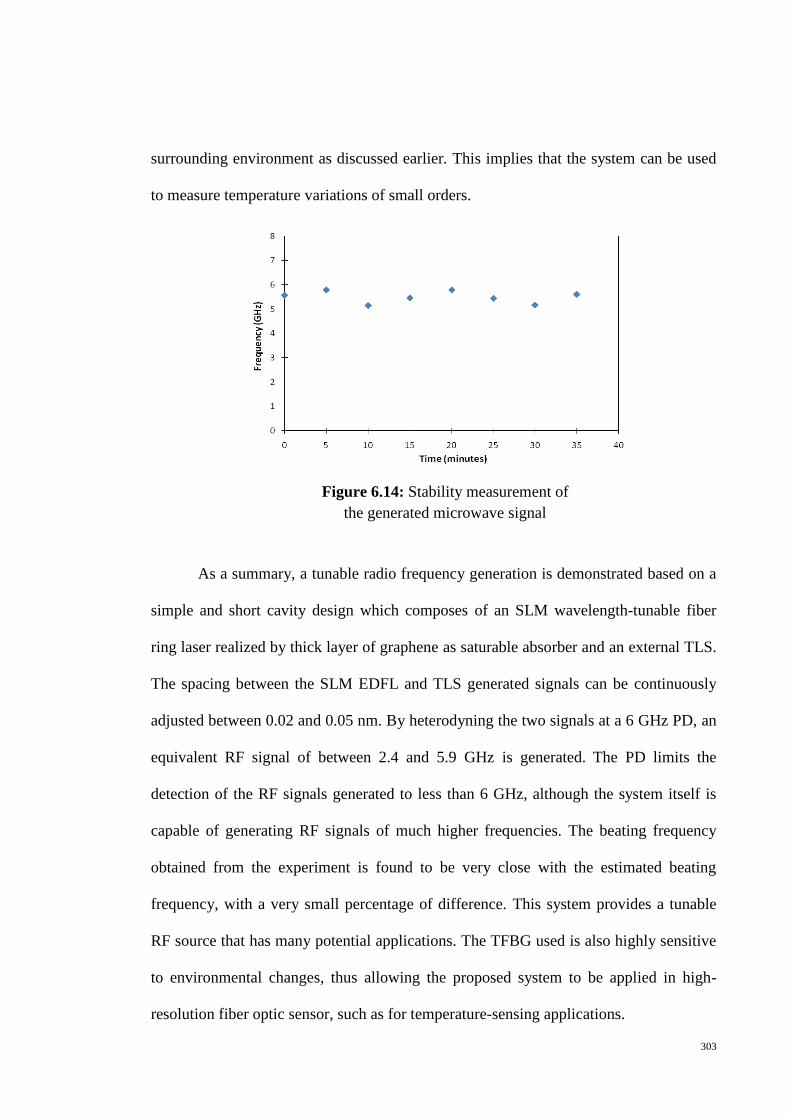
303
surrounding environment as discussed earlier. This implies that the system can be used
to measure temperature variations of small orders.
Figure 6.14: Stability measurement of
the generated microwave signal
As a summary, a tunable radio frequency generation is demonstrated based on a
simple and short cavity design which composes of an SLM wavelength-tunable fiber
ring laser realized by thick layer of graphene as saturable absorber and an external TLS.
The spacing between the SLM EDFL and TLS generated signals can be continuously
adjusted between 0.02 and 0.05 nm. By heterodyning the two signals at a 6 GHz PD, an
equivalent RF signal of between 2.4 and 5.9 GHz is generated. The PD limits the
detection of the RF signals generated to less than 6 GHz, although the system itself is
capable of generating RF signals of much higher frequencies. The beating frequency
obtained from the experiment is found to be very close with the estimated beating
frequency, with a very small percentage of difference. This system provides a tunable
RF source that has many potential applications. The TFBG used is also highly sensitive
to environmental changes, thus allowing the proposed system to be applied in high-
resolution fiber optic sensor, such as for temperature-sensing applications.
304
References
1. Zhang, K., & Kang, J. U. (2008). C-band wavelength-swept single-longitudinal
mode erbium-doped fiber ring laser. Optics Express, 16(18), 14173-14179.
2. Pan, S., & Yao, J. (2009). A wavelength-switchable single-longitudinal-mode
dual-wavelength erbium-doped fiber laser for switchable microwave generation.
Optics Express, 17(7), 5414-5419.
3. Yeh, C. H., Chow, C. W., & Chang, Y. C. (2010). Wavelength-selection erbium
fiber laser with single-mode operation using simple ring design. Laser Physics,
20(4), 830-833.
4. Ahmad, H., Zulkifli, M. Z., Latif, A. A., Jemangin, M. H., Chong, S. S., & Harun,
S. W. (2012). Tunable single longitudinal mode S-band fiber laser using a 3 m
length of erbium-doped fiber. Journal of Modern Optics, 59(3), 268-273.
5. Liu, J., Yao, J. P., Yao, J., & Yeap, T. H. (2004). Single longitudinal mode multi-
wavelength fiber ring lasers. IEEE Photonics Technology Letters, 16(4), 1020–
1022.
6. Zhang, J., Yue, C. Y., Schinn, G. G., Clements, W. R., & Lit, J. W. (1996). Stable
single-mode compound-ring erbium-doped fiber laser. Journal of Lightwave
Technology, 14(1), 104-109.
7. Chen, X., Yao, J., Zeng, F., & Deng, Z. (2005). Single-longitudinal-mode fiber
ring laser employing an equivalent phase-shifted fiber Bragg grating. IEEE
Photonics Technology Letters, 17(7), 1390-1392. 8. Cheng, X. P., Shum, P., Tse, C. H., Zhou, J. L., Tang, M., Tan, W. C., Wu, R. F.,
& Zhang, J. (2008). Single-longitudinal-mode erbium-doped fiber ring laser based
305
on high finesse fiber Bragg grating Fabry–Pérot etalon. Photonics Technology
Letters, IEEE, 20(12), 976-978. 9. Yeh, C. H., & Chow, C. W. (2010). Broadband wavelength-tunable single-
longitudinal-mode erbium-doped fiber ring laser using saturable-absorber filter.
Laser Physics Letters, 7(2), 158-163. 10. Song, Y. W., Havstad, S. A., Starodubov, D., Xie, Y., Willner, A. E., & Feinberg,
J. (2001). 40-nm-wide tunable fiber ring laser with single-mode operation using a
highly stretchable FBG. IEEE Photonics Technology Letters, 13(11), 1167-1169. 11. Yeh, C. H., & Chow, C. W. (2010). Single-longitudinal-mode erbium-doped fiber
laser with novel scheme utilizing fiber Bragg grating inside ring cavity. Laser
Physics, 20(2), 512-515. 12. Chen, D., Fu, H., & Liu, W. (2007). Single-longitudinal-mode erbium-doped fiber
laser based on a fiber Bragg grating Fabry-Perot filter. Laser Physics, 17(10),
1246-1248. 13. Dai, Z., Li, J., Zhang, X., Ou, Z., & Liu, Y. (2009). Stable single-longitudinal-
mode fiber laser using PM FBG FP etalon and PM fiber saturable absorber.
Optical and Quantum Electronics, 41(14-15), 1033-1040. 14. Yeh, C. H., Huang, T. T., Chien, H. C., Ko, C. H., & Chi, S. (2007). Tunable S-
band erbium-doped triple-ring laser with single-longitudinal-mode operation.
Optics Express, 15(2), 382-386. 15. Lee, C. C., Chen, Y. K., & Liaw, S. K. (1998). Single-longitudinal-mode fiber
laser with a passive multiple-ring cavity and its application for video
transmission. Optics Letters, 23(5), 358-360.

306
16. Tang, J., & Sun, J. (2010). Stable and widely tunable wavelength-spacing single
longitudinal mode dual-wavelength erbium-doped fiber laser. Optical Fiber
Technology, 16(5), 299-303. 17. Scrivener, P. L., Tarbox, E. J., & Maton, P. D. (1989). Narrow linewidth tunable
operation of Er 3+-doped single-mode fibre laser. Electronics Letters, 25(8), 549-
550. 18. Zhang, X., Zhu, N. H., Xie, L., & Feng, B. X. (2007). A stabilized and tunable
single-frequency erbium-doped fiber ring laser employing external injection
locking. Journal of Lightwave Technology, 25(4), 1027-1033. 19. Cochláin, C. Á., & Mears, R. J. (1992). Broadband tunable single frequency
diode-pumped erbium doped fibre laser. Electronics Letters, 28(2), 124-126. 20. Kang, M. S., Lee, M. S., Yong, J. C., & Kim, B. Y. (2006). Characterization of
wavelength-tunable single-frequency fiber laser employing acousto-optic tunable
filter. Journal of Lightwave Technology, 24(4), 1812-1823. 21. Pan, S., Zhao, X., & Lou, C. (2008, May). Switchable single-longitudinal-mode
dual-wavelength fiber ring laser using hybrid gain medium. In Conference on
Lasers and Electro-Optics (p. JThA42). Optical Society of America. 22. Liu, X. (2007). A novel ultra-narrow transmission-band fiber Bragg grating and
its application in a single-longitudinal-mode fiber laser with improved efficiency.
Optics Communications, 280(1), 147-152. 23. Chen, X., Yao, J., Zeng, F., & Deng, Z. (2005). Single-longitudinal-mode fiber
ring laser employing an equivalent phase-shifted fiber Bragg grating. IEEE
Photonics Technology Letters, 17(7), 1390-1392.
307
24. Jiang, M., Dinh, X. Q., Shum, P. P., Molin, S., Wu, Z. F., & Nouchi, P. (2012).
Investigation of axial strain effects on microwave signals from a PM-EDF short
cavity DBR laser for sensing applications. IEEE Photonics Journal, 4(5), 1530-
1535. 25. Lin, C., Burrus Jr, C. A., & Coldren, L. A. (1984). Characteristics of single-
longitudinal-mode selection in short-coupled-cavity (SCC) injection lasers.
Journal of Lightwave Technology, 2(4), 544-549. 26. Basnayaka, U., Fernando, X., & Gu, X. (2011). Single Step Generation of Micro
and Radio Wave Signals in a Short Cavity Fiber Laser. IEEE Photonics
Technology Letters, 23(20), 1445-1447. 27. He, X., Wang, D. N., & Liao, C. R. (2011). Tunable and switchable dual-
wavelength single-longitudinal-mode erbium-doped fiber lasers. Journal of
Lightwave Technology, 29(6), 842-849. 28. Moore, P. J., Chaboyer, Z. J., & Das, G. (2009). Tunable dual-wavelength fiber
laser. Optical Fiber Technology, 15(4), 377-379. 29. Yang, X. X., Zhan, L., Shen, Q. S., & Xia, Y. X. (2008). High-power single-
longitudinal-mode fiber laser with a ring Fabry–Perot resonator and a saturable
absorber. IEEE Photonics Technology Letters, 20(11), 879-881. 30. Chen, H., Babin, F., Leblanc, M., & Schinn, G. W. (2003). Widely tunable single-
frequency erbium-doped fiber lasers. IEEE Photonics Technology Letters, 15(2),
185-187. 31. Ahmad, H., Zulkifli, M. Z., Latif, A. A., Jemangin, M. H., Chong, S. S., & Harun,
S. W. (2012). Tunable single longitudinal mode S-band fiber laser using a 3 m
length of erbium-doped fiber. Journal of Modern Optics, 59(3), 268-273.

308
32. Bonaccorso, F., Sun, Z., Hasan, T., & Ferrari, A. C. (2010). Graphene photonics
and optoelectronics. Nature Photonics, 4(9), 611-622. 33. Bao, Q., Zhang, H., Wang, B., Ni, Z., Lim, C. H. Y. X., Wang, Y., Tang, D. Y., &
Loh, K. P. (2011). Broadband graphene polarizer. Nature Photonics, 5(7), 411-
415. 34. Derickson, D. (1998). Fiber optic test and measurement. Upper Saddle River, NJ:
Prentice Hall. 35. Williamson, R. C., & Esman, R. D. (2008). RF photonics. Journal of Lightwave
Technology, 26(9), 1145-1153. 36. Liu, W., Jiang, M., Chen, D., & He, S. (2009). Dual-wavelength single-
longitudinal-mode polarization-maintaining fiber laser and its application in
microwave generation. Journal of Lightwave Technology, 27(20), 4455-4459. 37. Capmany, J., & Novak, D. (2007). Microwave photonics combines two worlds.
Nature Photonics, 1(6), 319-330. 38. Hedekvist, P. O., Olsson, B. E., & Wiberg, A. (2004). Microwave harmonic
frequency generation utilizing the properties of an optical phase modulator.
Journal of Lightwave Technology, 22(3), 882-886. 39. Seeds, A. J., & Williams, K. J. (2006). Microwave photonics. Journal of
Lightwave Technology, 24(12), 4628-4641. 40. Drori, R., Einat, M., Shur, D., Jerby, E., Rosenman, G., Advani, R., Temkin, R. J.,
& Pralong, C. (1999). Demonstration of microwave generation by a ferroelectric-
cathode tube. Applied Physics Letters, 74(3), 335-337.

309
41. Li, W., & Yao, J. (2010). Microwave generation based on optical domain
microwave frequency octupling. IEEE Photonics Technology Letters, 22(1), 24-
26. 42. Fan, F. Z., & Dagenais, M. (1997). Optical generation of a megahertz-linewidth
microwave signal using semiconductor lasers and a discriminator-aided phase-
locked loop. Microwave Theory and Techniques, IEEE Transactions on, 45(8),
1296-1300. 43. Li, Z., Li, M., Chi, H., Zhang, X., & Yao, J. (2011). Photonic generation of phase-
coded millimeter-wave signal with large frequency tunability using a polarization-
maintaining fiber Bragg grating. Microwave and Wireless Components Letters,
IEEE, 21(12), 694-696. 44. Ramos, R. T., & Seeds, A. J. (1992). Fast heterodyne optical phase-lock loop
using double quantum well laser diodes. Electronics Letters, 28(1), 82-83. 45. Genest, J., Chamberland, M., Tremblay, P., & Têtu, M. (1997). Microwave
signals generated by optical heterodyne between injection-locked semiconductor
lasers. Quantum Electronics, IEEE Journal of, 33(6), 989-998. 46. Goldberg, L., Taylor, H. F., Weller, J. F., & Bloom, D. M. (1983). Microwave
signal generation with injection-locked laser diodes. Electronics Letters, 19(13),
491-493. 47. Wu, T. H., Wu, J. P., & Chiu, Y. J. (2010). Novel ultra-wideband (UWB)
photonic generation through photodetection and cross-absorption modulation in a
single electro-absorption modulator. Optics Express, 18(4), 3379-3384. 48. Qi, G., Yao, J., Seregelyi, J., Paquet, S., & Belisle, C. (2005). Generation and
distribution of a wide-band continuously tunable millimeter-wave signal with an

310
optical external modulation technique. Microwave Theory and Techniques, IEEE
Transactions on, 53(10), 3090-3097. 49. Yao, Y., Chen, X., Dai, Y., & Xie, S. (2006). Dual-wavelength erbium-doped
fiber laser with a simple linear cavity and its application in microwave generation.
Photonics Technology Letters, IEEE, 18(1), 187-189. 50. Chen, X., Deng, Z., & Yao, J. (2006). Photonic generation of microwave signal
using a dual-wavelength single-longitudinal-mode fiber ring laser. Microwave
Theory and Techniques, IEEE Transactions on, 54(2), 804-809. 51. Zhou, J. L., Xia, L., Cheng, X. P., Dong, X. P., & Shum, P. (2008). Photonic
generation of tunable microwave signals by beating a dual-wavelength single
longitudinal mode fiber ring laser. Applied Physics B, 91(1), 99-103. 52. Bauer, S., Brox, O., Kreissl, J., Sahin, G., & Sartorius, B. (2002). Optical
microwave source. Electronics Letters, 38(7), 334-335. 53. O'reilly, J. J., Lane, P. M., Heidemann, R., & Hofstetter, R. (1992). Optical
generation of very narrow linewidth millimetre wave signals. Electronics Letters,
28(25), 2309-2311. 54. Sun, J., Dai, Y., Chen, X., Zhang, Y., & Xie, S. (2006). Stable dual-wavelength
DFB fiber laser with separate resonant cavities and its application in tunable
microwave generation. Photonics Technology Letters, IEEE, 18(24), 2587-2589. 55. Chen, G., Huang, D., Zhang, X., & Cao, H. (2008). Photonic generation of a
microwave signal by incorporating a delay interferometer and a saturable
absorber. Optics Letters, 33(6), 554-556. 56. Chen, D., Fu, H., Liu, W., Wei, Y., & He, S. (2008). Dual-wavelength single-
longitudinal-mode erbium-doped fibre laser based on fibre Bragg grating pair and

311
its application in microwave signal generation. Electronics Letters, 44(7), 459-
461. 57. Villanueva, G. E., Palací, J., Cruz, J. L., Andrés, M. V., Martí, J., & Pérez-Millán,
P. (2010). High frequency microwave signal generation using dual-wavelength
emission of cascaded DFB fiber lasers with wavelength spacing tunability. Optics
Communications, 283(24), 5165-5168. 58. Wang, X., Mao, W., Al-Mumin, M., Pappert, S., Hong, J., & Li, G. (1999).
Optical generation of microwave/millimeter-wave signals using two-section gain-
coupled DFB lasers. Photonics Technology Letters, IEEE, 11(10), 1292-1294. 59. Ahmad, H., Zulkifli, M. Z., Latif, A. A., & Harun, S. W. (2009). Tunable dual
wavelength fiber laser incorporating AWG and optical channel selector by
controlling the cavity loss. Optics Communications, 282(24), 4771-4775. 60. Latif, A. A., Zulkifli, M. Z., Awang, N. A., Harun, S. W., & Ahmad, H. (2010). A
simple linear cavity dual-wavelength fiber laser using AWG as wavelength
selective mechanism. Laser Physics, 20(11), 2006-2010.

312
CHAPTER 7
CONCLUSION AND FUTURE WORKS
7.1 Introduction
In this chapter, a summary of the findings and results of this work is presented,
as well as the conclusions that can be drawn from the outcomes of this work. The next
section provides a summary of the findings of this research, which are matched to the
objectives set out in Chapter 1.
7.2 Summary
The first chapter details the background of the work, beginning with a brief history
on fiber lasers, followed by an overview of saturable absorbers (SAs) and the chronology
that drove the development of these SAs. In this chapter also the five main objectives of
this research are defined, these being:
1. Revisiting the EDF as the gain medium and the modes of laser operation with SA.
2. Depositing graphene onto the fiber ferrule by several methods.
3. Investigating the use of deposited graphene as SA for Q-switched fiber laser.
4. Investigating the use of deposited graphene as SA for mode-locked fiber laser.
5. Investigating the use of deposited graphene as SA for SLM fiber laser.

313
Each subsequent chapter is arranged in such a way to address one of these key objectives,
with the following chapter addressing the characteristics of EDF as the gain medium and
the modes of laser operation with saturable absorber.
7.2.1 Revisiting the EDF as the gain medium and the modes of laser operation with
saturable absorber
The first objective, which is to revisit the EDF as the gain medium and the modes
of laser operation with saturable absorber, is addressed in Chapter 2. The description of
the EDF as the gain medium begins with the discussion on the quasi-three level energy
system in EDF, and the four possible modes of laser operation with saturable absorber;
continuous wave, Q-switching, mode-locking and Q-switched mode locking. The factors
governing the mode-locked generation has been discussed in detail as well as the
important parameters of the mode locked output, such as broad bandwidth, high pulse
repetition rate, short pulse duration, high peak power, near transform limited time
bandwidth product and low energy fluctuations, with their respective theoretical
equations being explained as well.
7.2.2 Depositing graphene onto the fiber ferrule by several methods
Chapter 3 outlines a summary of the optical properties, including saturable
absorption properties, of graphene based on a literature review, and several methods of
graphene deposition onto the fiber ferrule that are experimentally carried out in this work;
these methods include optical deposition, sandwiching graphene thin film between the
fiber ferrules, and adhering graphene flakes onto the fiber ferrule using index matching

314
gel. Performance of the graphene deposition is verified through Raman spectroscopy. The
measurement of the saturable absorption properties of the deposited graphene such as
modulation depth, saturation intensity and non saturable absorption for each different
method have also been carried out experimentally. As presented in Chapter 3, the optical
deposition of graphene utilizes an ASE with an average power of about 15 dBm as the
optical source. The ASE output is injected into the pigtailed optical fiber through the
optical coupler (OC), with the fiber ferrule end slightly immersed in the graphene
solution. Formation of the graphene layer occurs through the induced process of
thermophoresis by optical radiation along the fiber, whereupon the graphene layer will be
automatically deposited onto the fiber ferrule. Raman spectrum of the deposited graphene
by this optical deposition method exhibits the intensity peaks at Raman shifts of
approximately 1350, 1580, and 2700 cm-1, which matches the specified Raman spectrum
peak profile for graphene located around the Raman shift of 1580 cm-1, commonly called
the G peak, and around the Raman shift of 2700 cm-1, namely 2-D peak. From the power-
dependent transmission measurement, the results show that the modulation depth and
saturation intensity of the deposited graphene are about 7.1 % and 42 MW/cm2
respectively. The insertion loss of the graphene SA assembly is about ∼ 2.3 dB. Variation
of the deposition period is observed as unrelated to the number or thickness of the
graphene layer deposited. A new and improved technique of the standard optical
deposition method for depositing a single or a thin layer of graphene has also been
introduced in this work, namely the ferrule-to-ferrule method, which involves the transfer
of graphene from one fiber ferrule to another fiber ferrule by means of optical extraction
during the laser operation in order to remove the excess graphene deposited on the fiber
ferrule. The Raman spectrum of the deposited graphene by this method proves that an
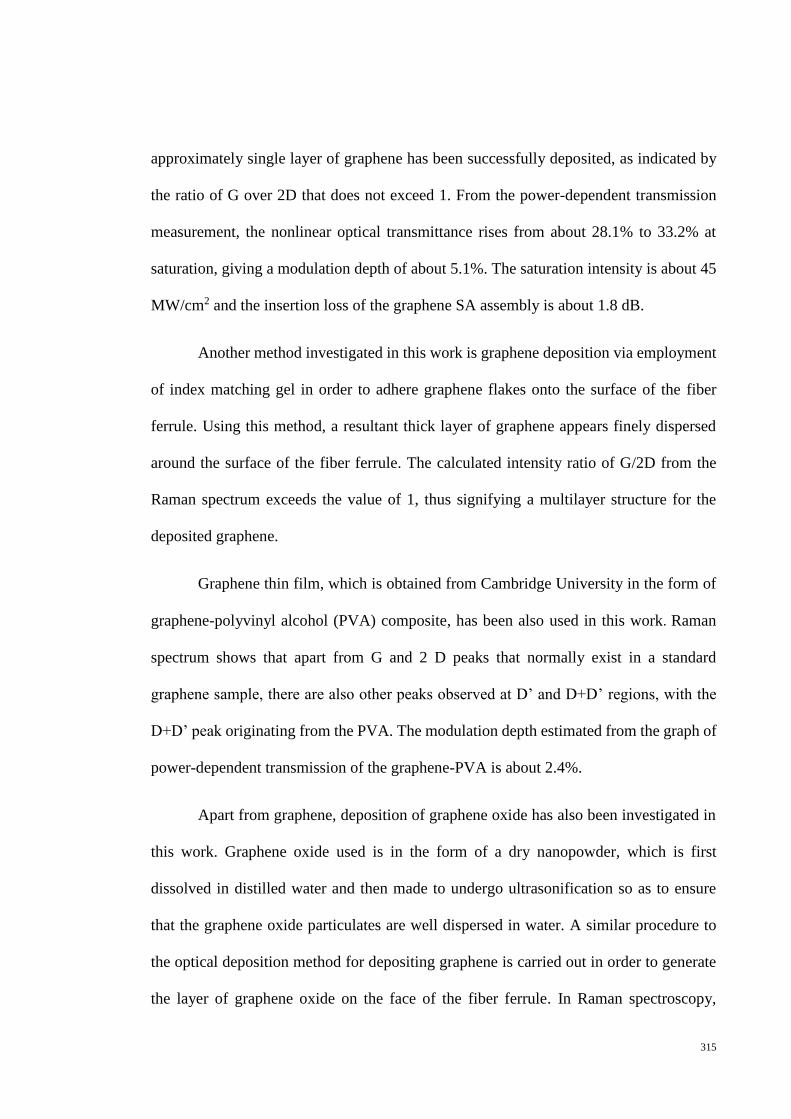
315
approximately single layer of graphene has been successfully deposited, as indicated by
the ratio of G over 2D that does not exceed 1. From the power-dependent transmission
measurement, the nonlinear optical transmittance rises from about 28.1% to 33.2% at
saturation, giving a modulation depth of about 5.1%. The saturation intensity is about 45
MW/cm2 and the insertion loss of the graphene SA assembly is about 1.8 dB.
Another method investigated in this work is graphene deposition via employment
of index matching gel in order to adhere graphene flakes onto the surface of the fiber
ferrule. Using this method, a resultant thick layer of graphene appears finely dispersed
around the surface of the fiber ferrule. The calculated intensity ratio of G/2D from the
Raman spectrum exceeds the value of 1, thus signifying a multilayer structure for the
deposited graphene.
Graphene thin film, which is obtained from Cambridge University in the form of
graphene-polyvinyl alcohol (PVA) composite, has been also used in this work. Raman
spectrum shows that apart from G and 2 D peaks that normally exist in a standard
graphene sample, there are also other peaks observed at D’ and D+D’ regions, with the
D+D’ peak originating from the PVA. The modulation depth estimated from the graph of
power-dependent transmission of the graphene-PVA is about 2.4%.
Apart from graphene, deposition of graphene oxide has also been investigated in
this work. Graphene oxide used is in the form of a dry nanopowder, which is first
dissolved in distilled water and then made to undergo ultrasonification so as to ensure
that the graphene oxide particulates are well dispersed in water. A similar procedure to
the optical deposition method for depositing graphene is carried out in order to generate
the layer of graphene oxide on the face of the fiber ferrule. In Raman spectroscopy,

316
graphene oxide establishes two main peaks, D and G, corresponding to Raman shift of
1354 cm-1 (D) and 1582 cm-1 (G). The nonlinear optical transmittance of the deposited
graphene oxide rises from about 24.2% to 37.6% at saturation, giving a modulation depth
of approximately 13.4%. The average saturation intensity and the maximum optical
transmission are around 47.5 MW/cm2 and 37.8%, respectively. The insertion loss of the
graphene-oxide SA assembly is about 2.3 dB.
7.2.3 Investigating the use of deposited graphene as SA for Q-switched fiber lasers
Chapter 4 discusses the experimental setup, procedures, experimental results
taken, and data analysis for Q-switching operation using the graphene deposited by
optical deposition method as the saturable absorber. Various setup configurations of the
Q-switched fiber laser have been demonstrated in this work, from basic setup of a simple
ring cavity of Erbium doped fiber laser (EDFL) to a more advanced configuration which
enables for the wavelength tunability by employing different wavelength selective
elements including the tunable bandpass filter (TBF), arrayed waveguide gratings (AWG)
and fiber Bragg gratings (FBG). An analytical comparison is undertaken on the Q-
switching output performance using the different wavelength selective elements, with the
summarized results shown in Table 7.1.
In addition, a graphene-based Q-switched EDFL, based on distributed Bragg
reflector (DBR) cavity configuration with end mirrors formed from FBG and FRM, has
been successfully demonstrated and presented in this chapter. The laser output has a CW
threshold of 18 mW and a Q-switching threshold of 28 mW, with a slope efficiency of
0.7%. The output spectrum has less than 0.05 nm FWHM at the wavelength of 1557 nm.
As the pump power is varied from 28 to 74 mW, the repetition rate of the generated pulses

317
also changes from 10.4 to 18.0 kHz. The pulse width also varies with pump power from
20.2 to 6.6 µs over a similar range. At the maximum pump power, the highest output
pulse energy is about 22.2 nJ, whereas the maximum peak power is 3.4 mW. The
generated pulse trains are clean with a smooth and uniform pulse. Thus, they can have
potential applications in the fields of communications and sensor sources.
Table 7.1: Summarized result of the Q-switched output performance for the different
wavelength selective elements used
Without
filtering
device
Tunable
Bandpass
Filter (TBF)
Arrayed
waveguide
gratings (AWG)
Tunable Fiber
Bragg gratings
(FBG)
Tuning range
-
58 nm
18 nm
10 nm
Number of
wavelength
options
-
Any
wavelength
within range
24 wavelengths
with 0.8 nm of
adjacent channel
spacing
Any
wavelength
within range
Wavelength
selection
preciseness
-
Moderate
Easy
Moderate
3 dB bandwidth
1.8 nm
0.13 nm
0.04 nm
0.09 nm
Average output
power
1.50 mW
1.43 mW
1.34 mW
1.28 mW
Lasing threshold
9.3 mW
11.0 mW
13.3 mW
14.5 mW
Repetition rate
66.2 kHz
55.3 kHz
49.8 kHz
42.4 kHz
Pulse width
1.6 µs
1.9 µs
3.2 µs
2.3 µs
Pulse energy
22.7 nJ
25.8 nJ
26.9 nJ
30.2 nJ

318
Furthermore, a passively Q-switched Brillouin-erbium doped fiber laser (BEDFL)
using the deposited graphene as an SA has been successfully realized. This proposed
system allows simultaneous control of the pulse repetition rate and the number of
generated Brillouin Stokes lines through variation in the pump power, with up to 11
Stokes lines, a repetition rate as high as 152.40 kHz and a pulse width as small as 1.67 µs
being obtained at the maximum pump power of 267.25 mW. The results obtained in this
work also confirm the utility of integrating graphene as SA in a BEDFL layout to yield a
multi-wavelength pulsed fiber laser without perturbing the multi-wavelength behaviour
of the BEDFL. The proposed BEDFL has potential application as a source for generating
terahertz signals, whereby closely spaced lines are required. These lines are emitted
simultaneously with a channel spacing of 0.08 nm, which is due to the SBS effect.
Individual channels can be retrieved using a fiber Bragg grating (FBG) with a 3 dB
reduced bandwidth as small as 0.04 nm to filter a two-wavelength output from the other
channels. Alternatively, the extraction of the wavelengths can also be accomplished using
a phase-shift FBG with full width at half-maximum (FWHM) bandwidth of about 0.026
nm, which can be commercially acquired from companies such as O/E Land Inc.
A Q-switched EDFL based on graphene oxide as the saturable absorber with a
simple deposition method has also been introduced and presented in this chapter. The
continuous-wave (CW) lasing threshold of this system is obtained at a pump power of ~
9 mW, with Q-switching behaviour observed at pump powers of ~ 18 mW and above. At
the maximum pump power of ~100 mW, the Q-switched pulses generated have a
repetition rate and pulse width of 61 kHz and 6.6 µs, respectively, along with an average
output power of about 3.7 mW. Additionally, at the maximum power, the energy per pulse
and peak power of the generated pulses are 61.3 nJ and 9.3 mW, respectively. From the

319
experimental results, it can be inferred that the output of this graphene oxide-based Q-
switched EDFL is stable, with a higher average output power as compared to similar
systems using graphene as the saturable absorber. It is also observed that graphene oxide
based Q-switched fiber laser could provide higher pulse energy and higher power slope
efficiency compared to those normally achieved by graphene-based Q-switched fiber
lasers. This could be of interest for applications that require large pulse energies in a
compact fiber-based system.
7.2.4 Investigating the use of deposited graphene as SA for mode-locked fiber lasers
Chapter 5 discusses the experimental setup, procedures, experimental results
taken, and data analysed for mode-locking operation using the graphene deposited by
sandwiching graphene thin film as the saturable absorber. Starting from the investigation
on a simple ring cavity EDFL with the graphene mode locker, this proposed system is
able to generate mode-locked solitons. The mode locked output spectrum spans from
1522 to 1594 nm with a 3 dB spectral bandwidth of about 11.6 nm at a central wavelength
at 1558 nm. The total group velocity dispersion (GVD) for the entire cavity is -0.07 ps2,
thereby putting the operation of the laser in the anomalous dispersion regime and allowing
the laser to operate in a soliton mode-locking regime. Soliton mode-locking operation is
self-started at a threshold pump power of 60 mW. The output pulse train has a time
interval of 44.5 ns between the pulses, corresponding to a pulse repetition rate of 22.47
MHz, which augurs well with the computed repetition rate for a cavity length of 10.4 m.
Measurement of the average output power and pulse energy of the pulse yields values of
approximately 1.4 mW and 62.2 pJ respectively. From the RF spectrum, the stability
performance of the mode-locked laser output is observed to be stable and considerable,

320
and proves that there is no Q-switching instabilities in the mode locked pulses. This is
deduced from the evenly spaced frequency interval in the RF spectrum which is free from
spectral modulation. The RF spectrum provides a frequency interval reading of
approximately 22.4 MHz, auguring well with the measurements of pulse repetition rate
value obtained from the oscilloscope. The autocorrelation trace gives an estimated full-
width half maximum (FWHM) pulse duration of 300 fs by assuming the sech2 pulse
shape. The time bandwidth pulse (TBP) of this system is 0.43.
Wavelength tunability of the mode locked EDFL has been achieved by inserting
a TBF into the cavity as the tuning mechanism. With the filter in the cavity, the threshold
pump power for mode locking operation is ~63 mW, which is about 3 mW higher than
that without using the filter. The output spectrum spans from 1545 to 1550 nm, with the
3 dB spectral width is measured to be 0.8 nm and limited by the bandwidth of the TBF.
The spectrum also no longer exhibits Kelly sideband structure that is seen in the case
where no filter is present, as a result of the spectral limiting effect of the filter. The
approximately 48 dB signal-to-noise ratio of the output spectrum on the other hand
appears to be higher than that without using the TBF. The wavelength of the mode locked
spectrum can be continuously tuned from 1507.5 nm to 1571.3 nm, corresponding to a
wide wavelength range of 63.8 nm. Within this tuning range, the autocorrelation trace
gives a distribution of pulse duration of between 3.9 ps to 6.6 ps at different wavelengths.
The measured average output power at 1547.5 nm is about 0.75 mW, having a small
variation across the tuning range. The measured repetition rate now gives a reading of
12.9 MHz, which decreases by about 9.5 MHz from the case without incorporating the
TBF. Across the entire tuning range, the TBP generally varies in a random manner, with
the lowest TBP value of 0.34 obtained at 1567.5 nm and the highest TBP value of 0.46

321
obtained at 1507.5 nm. As a summary, this tunable graphene mode-locked EDFL by TBF
has exploited graphene as a broadband or wavelength independent saturable absorber to
produce a wideband tunable mode locked EDFL as well as verifying the capability of
graphene to operate in a wideband region.
Further investigation on the graphene based mode locked fiber laser has been
carried out with an exotic and highly doped Zirconia-erbium doped fiber (Zr-EDF) as the
gain medium. The total GVD for the entire cavity is now –0.37 ps2. Experimental results
show that the Zr-EDF laser starts to generate the soliton mode-locking behavior at a
threshold pump power of 50 mW. The optical spectrum of the mode-locked pulses taken
at output power level of -70 dBm spans from 1540 to 1585 nm, with a 3 dB bandwidth of
5.8 nm at a central wavelength of 1563 nm. From the autocorrelation trace, the estimated
pulse width is about 680 fs. This gives a TBP value of 0.45. The mode-locked pulses have
an average output power of 1.6 mW and a pulse energy of 146.8 pJ. The repetition rate is
10.9 MHz, which is the fundamental cavity round trip frequency. It is interesting to
observe that harmonic mode locking occurs when the pump power is increased to more
than the mode-locking threshold of 50 mW. As the pump power is increased from ~50
mW to ~100 mW, the repetition rate can be changed approximately by a multiple N of
the fundamental cavity frequency from 10.9 MHz to 119.9 MHz, corresponding to the
fundamental harmonic and the 11th order of harmonic respectively. Across the different
pumping powers, the pulse widths slightly vary from 0.68 ps to 0.73 ps. A number of
different processes or mechanisms have been suggested that lead to the self-stabilization
of the pulse trains in harmonic mode locked fiber lasers, such as depletion and relaxation
of the gain and phase modulation of the intracavity field. The phase modulation of the
intracavity field usually can be provided by the SA which is capable of retiming the pulses

322
and stabilizing the repetition rate. In this regards, SA-based harmonic mode-locking
typically can operate in any degree of stability. It has also been suggested that phase
effects in the SA as well as the recovery dynamics in the saturated gain medium generate
a repulsive force between the pulses that leads to harmonic mode locking.
In addition, incorporation of a Mach Zehnder filter into the cavity has been amply
demonstrated for achieving spectrum tunability of the mode locked Zr-EDFL, with the
ability to conserve the soliton shape of the mode locked spectrum as well as maintaining
the bandwidth and pulse width of the mode locked pulses within a certain wavelength
region. The central wavelength of the mode locked spectrum is tunable from 1551 nm to
1570 nm, covering a wavelength range of about 19 nm. In the wavelength region between
1552 nm and 1564 nm, the mode locked sidebands are conserved and are also tuned
together along with the tuning of the spectrum. The 3 dB bandwidth of the spectra and
the pulse width vary slightly, from between 3.4 nm to 3.6 nm and 0.73 ps to 0.78 ps
respectively, resulting in a low variance of the TBP values between 0.32 and 0.33 over
the wavelength range. This indicates that the spectrum bandwidth, pulse width, and the
resulting TBP are almost constant across the wavelength range.
Further development of this graphene based Zr-EDFL has been carried out with a
demonstration as a pulse source for supercontinuum (SC) generation using 200 m single
mode fiber (SMF) as the non-linear medium. The obtained SC spectrum spans from 1500
nm to about 1680 nm, with a large bandwidth of 142 nm at the -40 dBm level. The system
can be configured as a compact SC generator using a short length of SMF with a simple
design of a passively mode-locked fiber laser as the pulse source. This experiment has
also been repeated by replacing the 200 m SMF with a 500 m SMF, a 100 m HNLF and
a 100 m narrow core SMF respectively for comparison purpose. In the case of 500 m long

323
SMF, the SC spectrum generated has a slightly longer bandwidth compared to that of
using 200 m SMF at the -40 dBm level, ranging from 1524 to 1682 nm, to give a value
of about 158 nm. The SC spectrum generated in the case of 100 m long HNLF stretches
from 1150 nm to more than 1700 nm, exceeding the range of the OSA used, with a wider
bandwidth at the -40 dBm level which ranges from 1300 to more than 1700 nm and gives
a value of about 400 nm. As in the case of 100 m narrow core SMF, the measured SC
spectra spans from 1450 to more than 1700 nm, with a large bandwidth of 164 nm at the
-40 dBm output power level. From the above results, it can be inferred that the SMF with
a smaller mode-field diameter is capable of performance on par with much longer SMF
possessing a larger mode-field diameter, thus allowing for a compact SC generator to be
realized. The proposed SC source can be used as a relatively simple and low cost optical
source for applications in NIR spectroscopy of molecular gases, testing optical
components in the S, C- and L- bands, and is especially useful for wavelength division
multiplexing-passive optical network (WDM-PON) systems. The proposed source is also
useful in applications that do not require a very wide SC bandwidth, so can therefore
serve as a lower cost alternative due to its use of relatively easily obtainable and
inexpensive components.
7.2.5 Investigating the use of deposited graphene as SA for SLM fiber lasers
Chapter 6 describes the experimental work and results on the demonstration of
graphene as saturable absorber for suppressing noise and multimode oscillations in the
laser cavity; the key enablers for producing the single longitudinal mode (SLM) operation
in the EDFL. A tunable SLM EDFL taking advantage of these characteristics is
demonstrated using multilayer graphene adhered by index matching gel as described in

324
Chapter 3. The tuning range is determined by a tunable fiber Bragg grating (TFBG) that
also functions to restrict the lasing frequency. The indicated tuning range of this fiber
laser spans from 1547 to 1560 nm with very low variation in output power. A linewidth
of 206.25 kHz is measured from the radio frequency spectrum analyser (RFSA) using
delayed self-heterodyne method. From the results obtained, it can be deduced that a stable
and inexpensive tunable SLM EDF laser with a simple cavity design has been realized.
The key to ensuring SLM laser oscillation lies in the role of graphene as saturable
absorber, which is contrary to the commonly used unpumped erbium-doped fiber.
By heterodyning this tunable SLM laser output and an external tunable laser
source (TLS) at a photodetector, a tunable radio frequency generation can be realized.
The spacing between the SLM EDFL and TLS generated signals can be continuously
adjusted between 0.02 and 0.05 nm, corresponding to an equivalent RF signal of between
2.4 and 5.9 GHz. The photodetector limits the detection of the RF signals generated to
less than 6 GHz, although the system itself is capable of generating RF signals of much
higher frequencies. The beating frequency obtained from the experiment is found to be
very close with the estimated beating frequency, with only a very small percentage of
difference. The TFBG used is also highly sensitive to environmental changes, thus
allowing the proposed system to be applied in high-resolution fiber optic sensor, such as
for temperature-sensing applications.
7.3 Conclusion
In conclusion, the research work has been able to achieve its primary objectives;
to obtain an in-depth understanding the EDF as the gain medium and the modes of laser
operation with saturable absorber, as well as the optical and saturable absorption
325
properties of graphene, to investigate and carry out several methods for graphene
deposition onto the fiber ferrule as well as examining the saturable absorption properties
of the deposited graphene, and to employ the deposited graphene as saturable absorber
for generating the Q-switched, mode-locked and SLM fiber laser as well as investigating
their output performance. Therefore, the objectives as have been described in Chapter 1
are met, thus this research has been successfully undertaken and completed.
7.4 Future Works
Up to this point of time, the objective of exploring and investigating graphene as
saturable absorber has been fulfilled. However, there are many other avenues in which
this research could be continued and expanded. One of them is to explore and investigate
the superiority of graphene oxide in place of graphene as the saturable absorber. Graphene
oxide can possess similar behavior to graphene as it has a comparatively strong saturable
absorption and a fast energy relaxation of hot carriers in common with graphene. In
graphene fabrication, chemical reduction method is one of the methods used for mass
production of graphene, whereby natural graphite is oxidized to form graphene oxide that
will then be reduced into graphene using reductants. Thus, it can be said that graphene
oxide acts as the graphene precursor. This provide a good opportunity for graphene oxide
to be directly used as a saturable absorber, which potentially becomes a favourable
alternative to graphene with the advantage of comparatively simple fabrication process.
Furthermore, graphene unfortunately has a shortcoming in terms of its insolubility in
many organic solvents regardless of its superiority as a saturable absorber. Graphene
oxide possesses oxygen-containing functional groups that do not exist in graphene; these
326
groups create an intense hydrophilic feature in graphene oxide and provide graphene
oxide with an essential advantage over graphene of high solubility in water.
The other key focus for future research is to expand the operation wavelength in
the L-band and the S-band region. In this research work, the SA based fiber laser has been
successfully presented in the C-band region by using the EDF as the gain medium.
Subsequently, this study can be extended to find the laser operation in other wavelength
regions, for example, by means of using depressed-cladding erbium doped fiber (DC-
EDF) as the gain medium for generating lasing wavelength in the S-band region, bismuth-
erbium doped fiber for generating lasing wavelength in the L-band region and thulium
doped fiber for generating wavelength in 2 microns region.
Another area of future work is in the further applications of the Q-switched, mode-
locked and SLM fiber laser, besides the supercontinuum and radio frequency generation
that have been demonstrated in this work. For example, the Q-switched multiwavelength
fiber laser retains great potential applications in Terahertz generations. Generally, for
terahertz generation, multiwavelength lasers such as dual-wavelength lasers with closely
spaced lines are required, either as a high-power continuous wave (CW) or pulse laser
sources. A big challenge in generating Terahertz radiation is that a very high quality beam
source is required for injections into the crystal, which would be an interesting topic to
be solved in the future works. Further research should also include Terahertz generation
for applications into the field of sensors, gyroscope and interferometry.


![IEEE JOURNAL OF SELECTED TOPICS IN QUANTUM ...nlo.eps.hw.ac.uk/sites/default/files/MaryJQE2014.pdflution for self-starting mode-locking [10], [11]. Semiconductor Saturable Absorber](https://static.documents.pub/doc/80x56/6065a6f780ef900c95775e42/ieee-journal-of-selected-topics-in-quantum-nloepshwacuksitesdefaultfiles.jpg)


