26
Cyrill Stachniss Graphical Model Basics This lecture is strongly influenced by Zoubin Ghahramani’s GM tutorials

Cyrill Stachniss
Graphical Model Basics
This lecture is strongly influenced by Zoubin Ghahramani’s GM tutorials
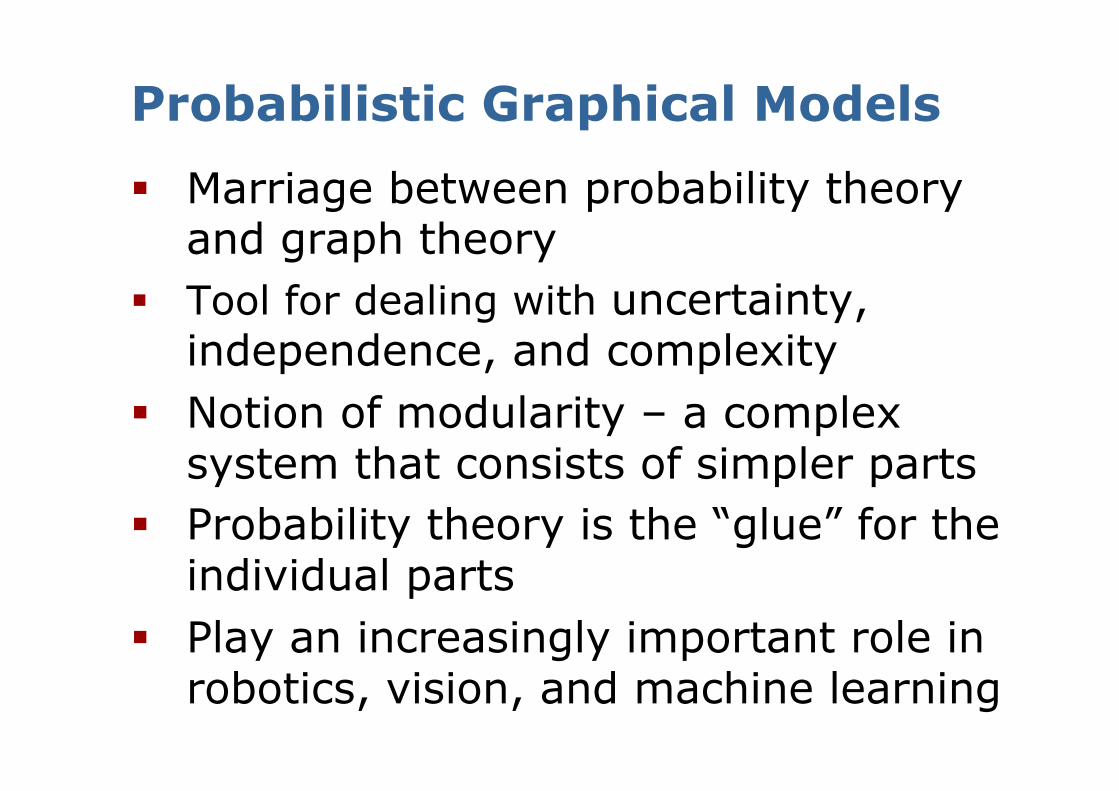
Probabilistic Graphical Models
§ Marriage between probability theory and graph theory
§ Tool for dealing with uncertainty, independence, and complexity
§ Notion of modularity – a complex system that consists of simpler parts
§ Probability theory is the “glue” for the individual parts
§ Play an increasingly important role in robotics, vision, and machine learning

Three Typical Graphical Models
§ Nodes represent random variables § Edges represent statistical dependencies
between these variables
A B
C
E D
factor graph
A B
C
E D
undirected graph
A B
C
E D
directed graph

Why Graphical Models?
§ Abstract out the conditional independence relationships between the variables from their parametric forms
§ Directly answer questions: “Is A dependent on B given we know the value of C?”
§ Allow to realize efficient message passing algorithms to do inference: “What is without enumerating all combination of variables?”

Conditional Independence
§ Conditional Independence
§ as well as
§ Conditional independence is different to the “normal”/marginal independence

Conditional Independence Examples
§ Speeding fine type of car speed § Lung cancer yellow teeth smoker § Ability of team A ability of Team B § NOT (ability of team A ability of Team B
outcome of A vs. B game)
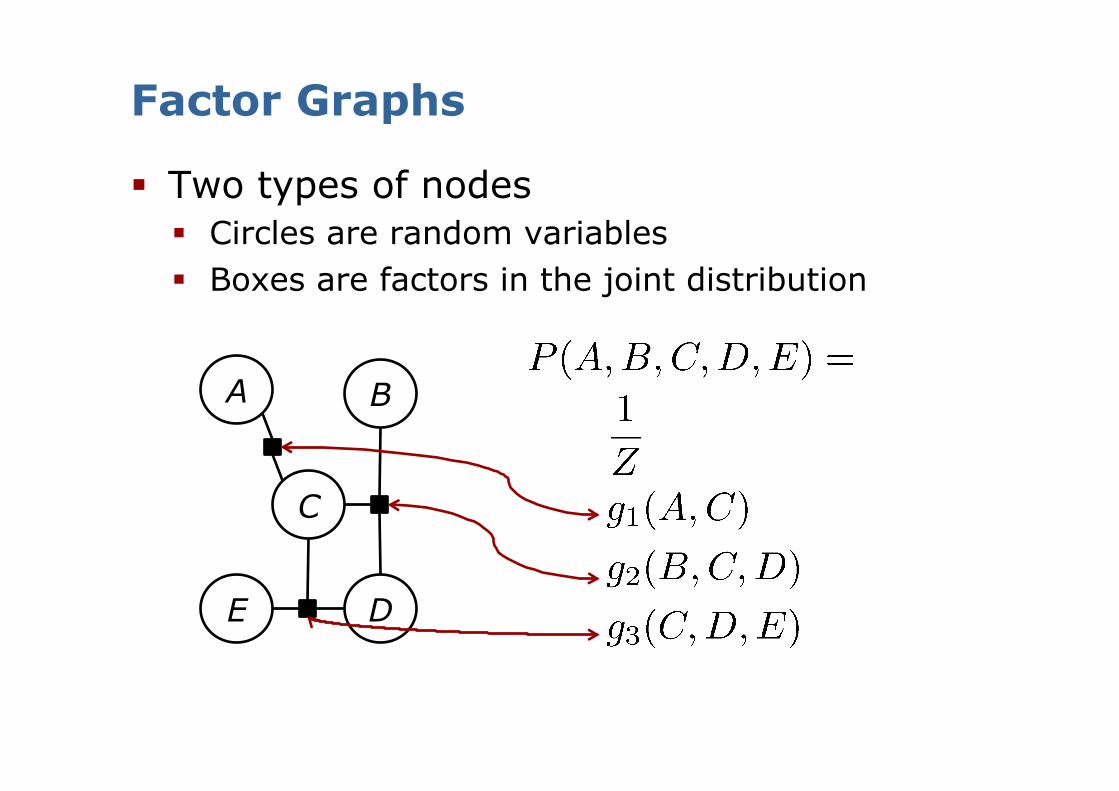
Factor Graphs
§ Two types of nodes § Circles are random variables § Boxes are factors in the joint distribution
A B
C
E D

Factors
§ Factors ( ) are non-negative functions § Two nodes are neighbors if they share a
common factor ( ) § The normalizer ensures that the sum/
integral over the joint equals to 1 § E.g.
A B
C
E D

Two Different Factor Graphs
A B
C
E D
A B
C
E D

Factor Graphs: Definitions and Facts
§ Two nodes are neighbors if they share a common factor
§ A path is a sequence of neighboring nodes § if every path between X and Y
contains some node § E.g., § Given the neighbors of ,
the variable X is conditionally independent of all other variables
A B
C
E D

Proving Cond. Independence (Idea)
§ Show: given the FC § CI: § Factor graph: § Summing over X:
§ Dividing results in
§ The r.h.s. does not depend on Y (but on V) § The factorization implies cond. independence
X YV
not dependent on Y
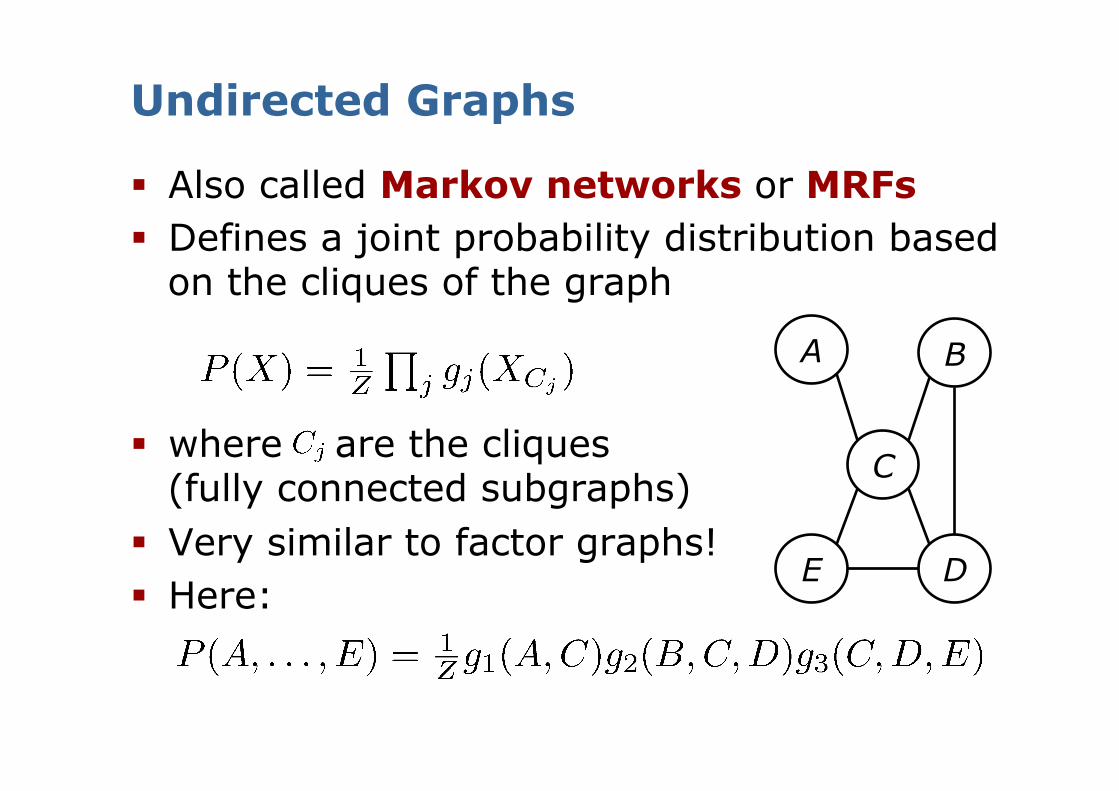
Undirected Graphs
§ Also called Markov networks or MRFs § Defines a joint probability distribution based
on the cliques of the graph
§ where are the cliques (fully connected subgraphs)
§ Very similar to factor graphs! § Here:
A B
C
E D

Cond. Independence
§ if every path between and contains some node
§ V is a Markov Blanket for iff for all
§ A minimal Markov Blanket is a Markov Boundary
§ For X, we have here § Markov Blanket(s): § Markov Boundary:
X V’’
V
Y V’

Markov Boundary
§ A minimal Markov Blanket is a Markov Boundary
§ For factor graphs and undirected graphical models, the Markov Boundary of X =

Factors Graphs vs. Undirected G.
§ The nodes always have the same neighbors § All graphs encode the same conditional
independence relations
A B
C
E D
A B
C
E D
A B
C
E D

Factors Graphs vs. Undirected G.
§ The nodes always have the same neighbors § All graphs encode the same conditional
independence relations § #3: encodes that only pairwise factors are
needed to model the joint distribution § Different complexities, cubic vs. quadratic!
A B
C
E D
A B
C
E D
A B
C
E D

Problems and Limitations
§ Often two variables are connected because some other variable depends on them
§ Many independencies are underrepresented
§ Difference between independence and conditional independence
Rain Sprinkler
Ground wet
Rain Sprinkler
Ground wet

Explaining Away
§ Rain and sprinkler are independent (given nothing), but conditionally dependent given the ground is wet
§ “Explaining Away”: Observing that the sprinkler is on, would explain away the observation that the ground was wet, making it less probable that it rained.
Rain Sprinkler
Ground wet
Rain Sprinkler
Ground wet

Directed Acyclic Graphs
§ Also called Bayesian networks § Arrows represent “influences” § Results in the joint distribution
§ In general Rain Sprinkler
Ground wet

Example
§ In general
A B
C
E D

D-Separation and Cond. Independence
§ if d-separates from § d-separates from if every undirected
path between and is blocked by § A path is blocked by if there is a node W
on the graph such that either: § W has converging arrows along the path
(→ W ←) and neither W nor its descendants are observed (in V), or
§ W does not have converging arrows along the path (→ W → or ← W →) and W is observed (W ).

D-Separation Examples
A B
C
E D
§ § not § § not
§ For Bayesian networks: Markov Boundary of X =

Expressiveness (1)
§ No directed acyclic graph can represent these any only these independencies
§ No matter how we direct the arrows there will always be two non-adjacent parents sharing a common child. This implies dependence in the directed graph but independence in undirected graph

Expressiveness (2)
§ No undirected graph of factor graph can represent these any only these independencies
§ Directed graphs are better at expressing causal generative models, undirected graphs are better at representing soft constraints between variables.

Plate Notation
§ A set of n random points generated by a Gaussian

Summary
§ Three typical graphical models § Factor graphs § Undirected graphs / Markov networks § Directed graphs / Bayesian networks
§ Independence and conditional independence § Markov boundaries and d-separation § Directed vs. undirected graphs
§ Directed graphs are better at expressing causal generative models
§ Undirected graphs are better at representing soft constraints between variables.


