21
Graphical Systems Modeling with UML / SysML State machine diagrams © Piotr Ciskowski

Graphical Systems Modeling
with UML / SysML
State machine diagrams
© Piotr Ciskowski
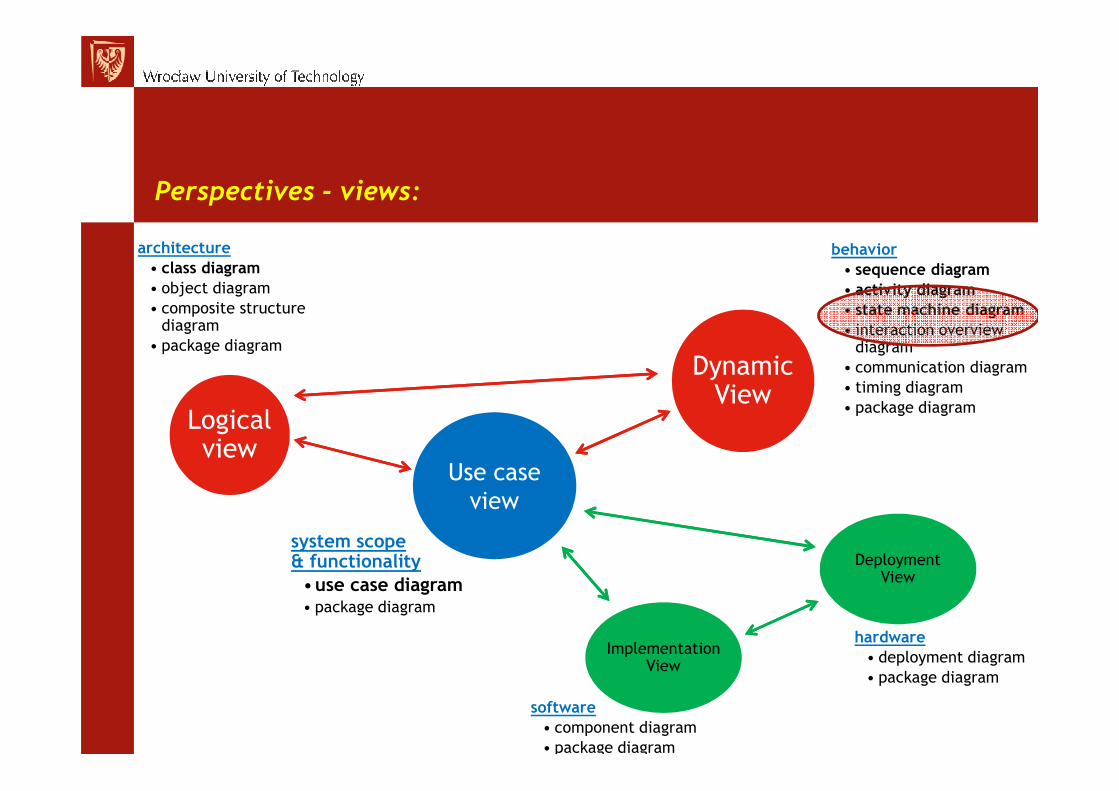
behavior
• sequence diagram
• activity diagram
• state machine diagram
• interaction overview diagram
• communication diagram
• timing diagram
• package diagram
Perspectives - views:
Use case
view
Logical view
architecture
• class diagram
• object diagram
• composite structure diagram
• package diagram
Dynamic View
Implementation View
Deployment View
system scope& functionality
•use case diagram• package diagram
software
• component diagram
• package diagram
hardware
• deployment diagram
• package diagram

State machine diagram
• state - a situation during which some condition holds
- static or dynamic
• state machine - behavior of a single object
- sequence of states it goes through - in reaction to events
• state machine diagram - graphical representation of states and transitions
- directed graph
� states
� transitions
� events
� actions
� guard conditions
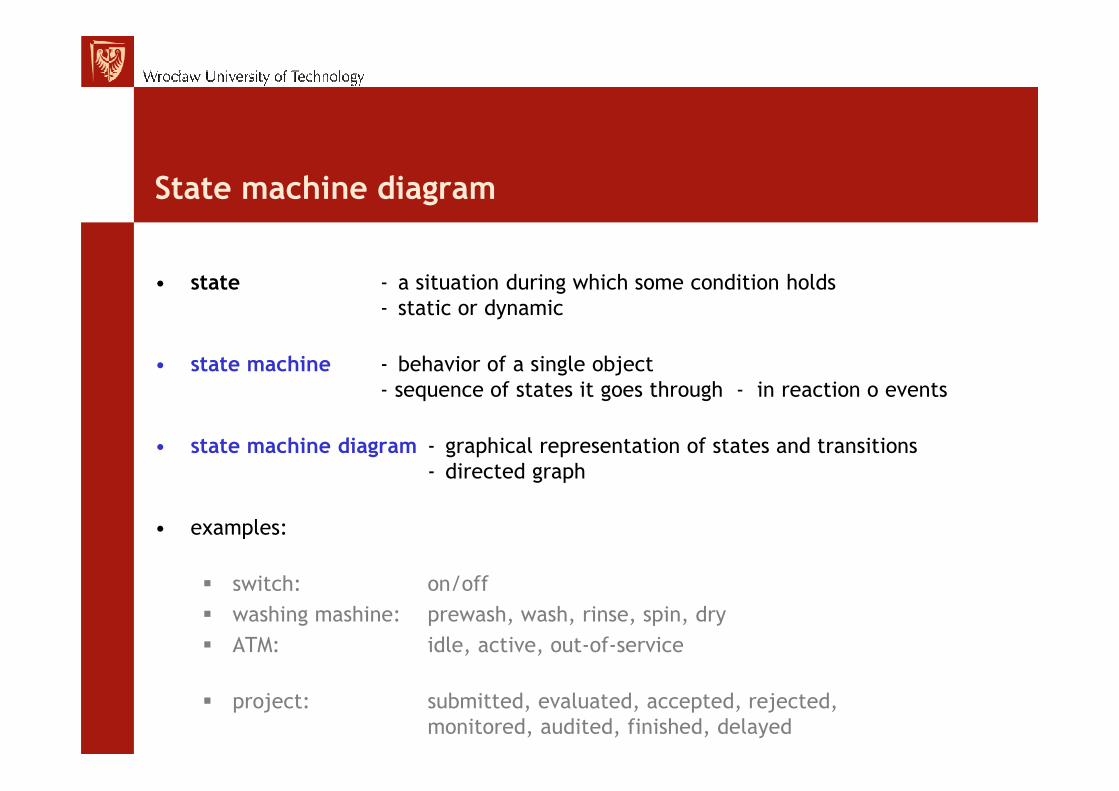
State machine diagram
• state - a situation during which some condition holds
- static or dynamic
• state machine - behavior of a single object
- sequence of states it goes through - in reaction o events
• state machine diagram - graphical representation of states and transitions
- directed graph
• examples:
� switch: on/off
� washing mashine: prewash, wash, rinse, spin, dry
� ATM: idle, active, out-of-service
� project: submitted, evaluated, accepted, rejected,
monitored, audited, finished, delayed
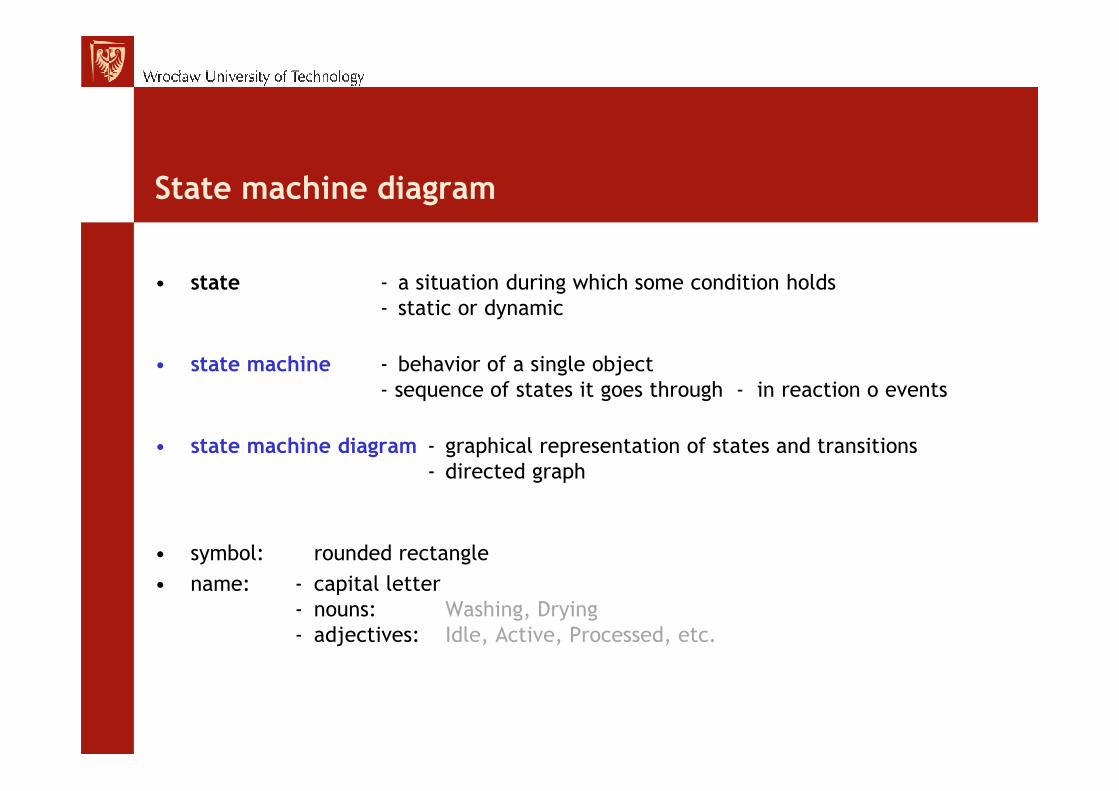
State machine diagram
• state - a situation during which some condition holds
- static or dynamic
• state machine - behavior of a single object
- sequence of states it goes through - in reaction o events
• state machine diagram - graphical representation of states and transitions
- directed graph
• symbol: rounded rectangle
• name: - capital letter
- nouns: Washing, Drying
- adjectives: Idle, Active, Processed, etc.

COMPARTMENTS
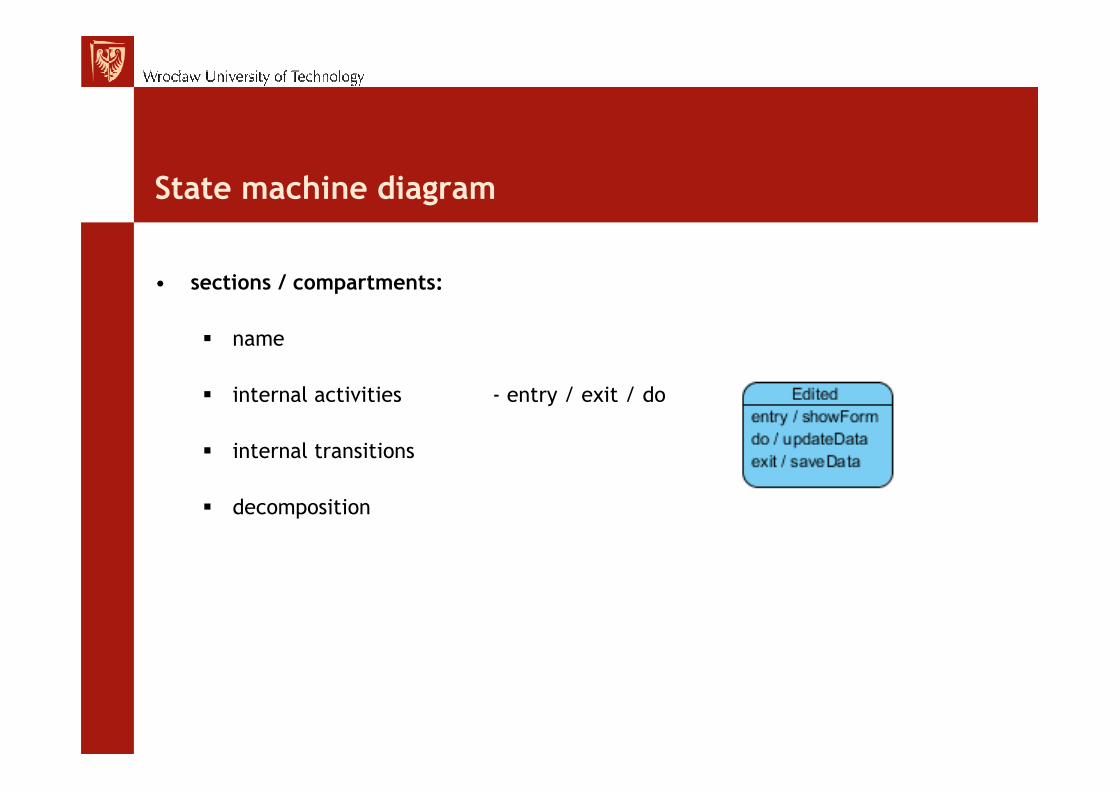
State machine diagram
• sections / compartments:
� name
� internal activities - entry / exit / do
� internal transitions
� decomposition

Example – fax machine
• state parameters
• entry / exit / do actions
• transition

Example – mobile phone
• composite states
• transitions
• guard conditions
Example – mobile phone
• composite states
• transitions
• guard conditions

Example – ATM
• high level behavioral diagram

STATES – SIMPLE & COMPOSITE

States
• simple - no sub-states
- no regions
• composite - divided into two or more substates – sequential or concurrent
• substates / submachine states

HISTORY

History
• shallow - come back to the most recent active substate
• deep - come back to the most recent active configuration
PSEUDOSTATES
Pseudostates
• abstract
• activity diagams → state machine diagrams
� forks / joins
� decisions
� junctions
� entry / exit points

TRANSITIONS
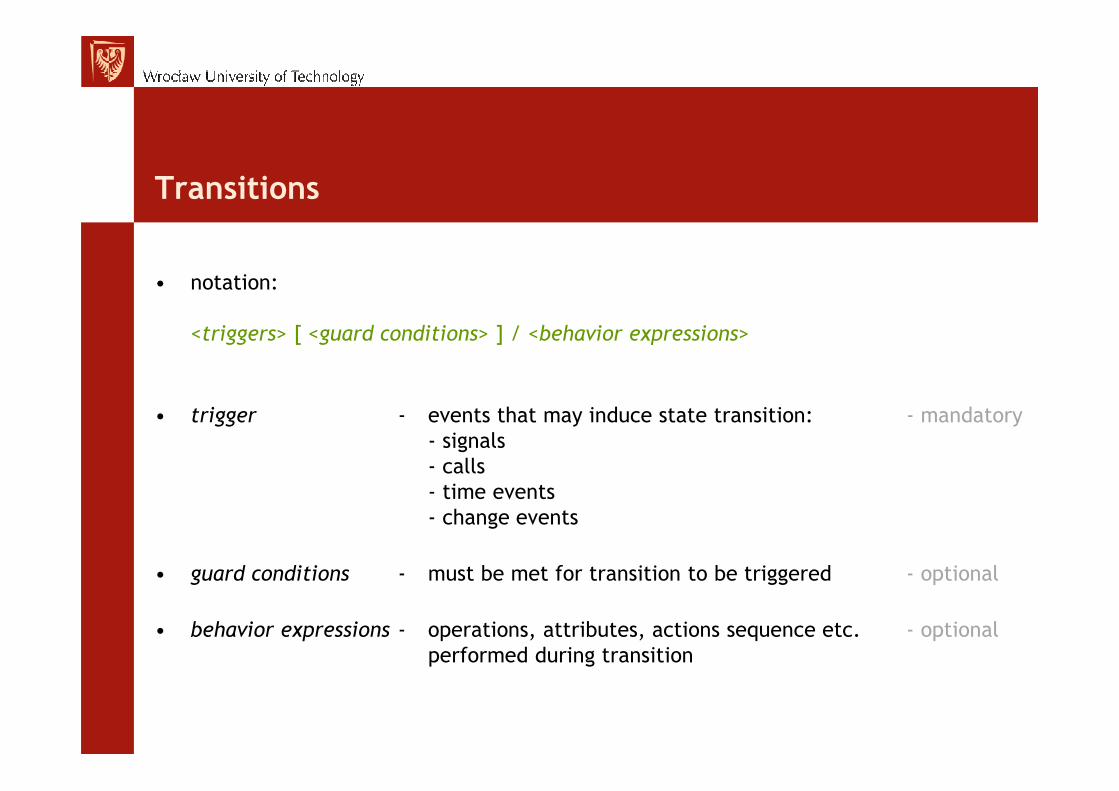
Transitions
• notation:
<triggers> [ <guard conditions> ] / <behavior expressions>
• trigger - events that may induce state transition: - mandatory
- signals
- calls
- time events
- change events
• guard conditions - must be met for transition to be triggered - optional
• behavior expressions - operations, attributes, actions sequence etc. - optional
performed during transition

SUMMARY
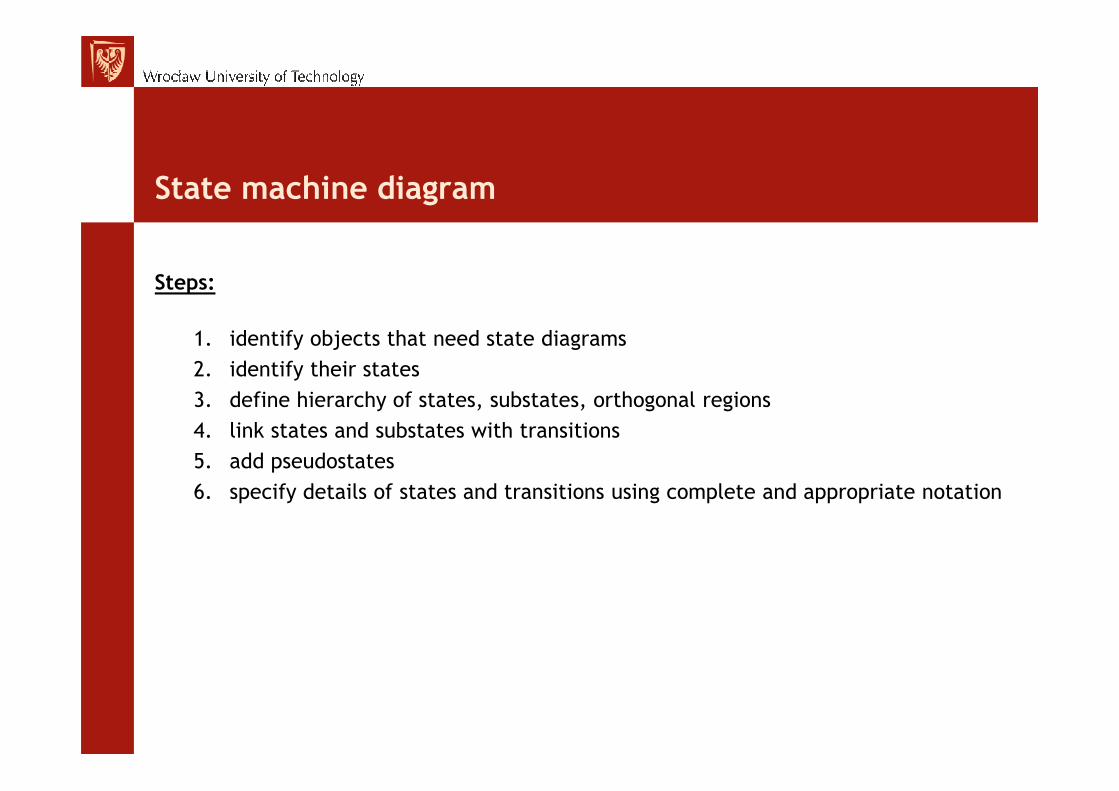
State machine diagram
Steps:
1. identify objects that need state diagrams
2. identify their states
3. define hierarchy of states, substates, orthogonal regions
4. link states and substates with transitions
5. add pseudostates
6. specify details of states and transitions using complete and appropriate notation


