Graphics Stability
Gershon ParentSoftware SwordsmanWGGTgershonp @ microsoft.comMicrosoft Corporation
Steve MorrowSoftware Design EngineerWGGTstevemor @ microsoft.comMicrosoft Corporation
Session OutlineSession Outline
Stability Benchmark History
CRASH (Comparative Reliability Analyzer for Software and Hardware)
The CRASH Tool
The CRASH Plan
The Experiments
CDER (Customer Driver Experience Rating)Program Background and Description
High-level Statistics of the Program
Factors Examined in the Crash Data
Normalized Ratings
Customer Experience and Loyalty
Stability Benchmark HistoryStability Benchmark History
WinHEC – May ‘04CRASH 1.0 released.
Web portal has 52 non-MS members from 16 companies
November ’04CRASH 1.1 released to the web. Includes DB backend
December ’04 Stability Benchmark components ship to 8,000 customers and normalizable OCA data begins flowing in
CRASH Lab completes first data collection pass
Web portal has over 60 non-MS members from 17 companies
CRASH ToolCRASH Tool
CRASH is new dynamic software loading tool designed to expose and easily reproduce reliability defects in drivers/hardware
Answers the call from IHVs and OEMs for more reliability test tools.
Enables wide range of endurance/load/stress testing
Configurable load profiles
Scheduled cycling (starting and stopping) of test applications
Replay-ability
Automatic failure cause determination
Scripting for multiple passes with different scenarios
Creation of a final “score”
X_ X_
CRASH DemoCRASH Demo
X_ X_
CRASH DemoCRASH Demo
X_ X_
CRASH DemoCRASH Demo
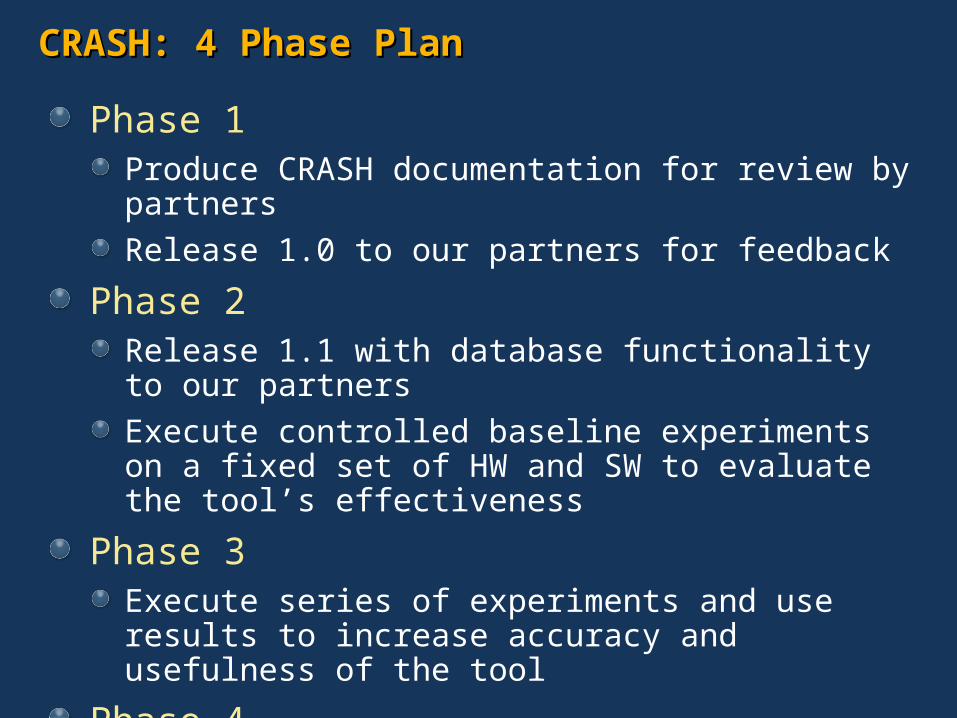
CRASH: 4 Phase PlanCRASH: 4 Phase Plan
Phase 1Produce CRASH documentation for review by partners
Release 1.0 to our partners for feedback
Phase 2Release 1.1 with database functionality to our partners
Execute controlled baseline experiments on a fixed set of HW and SW to evaluate the tool’s effectiveness
Phase 3Execute series of experiments and use results to increase accuracy and usefulness of the tool
Phase 4Create a CRASH-based tool for release to a larger audience
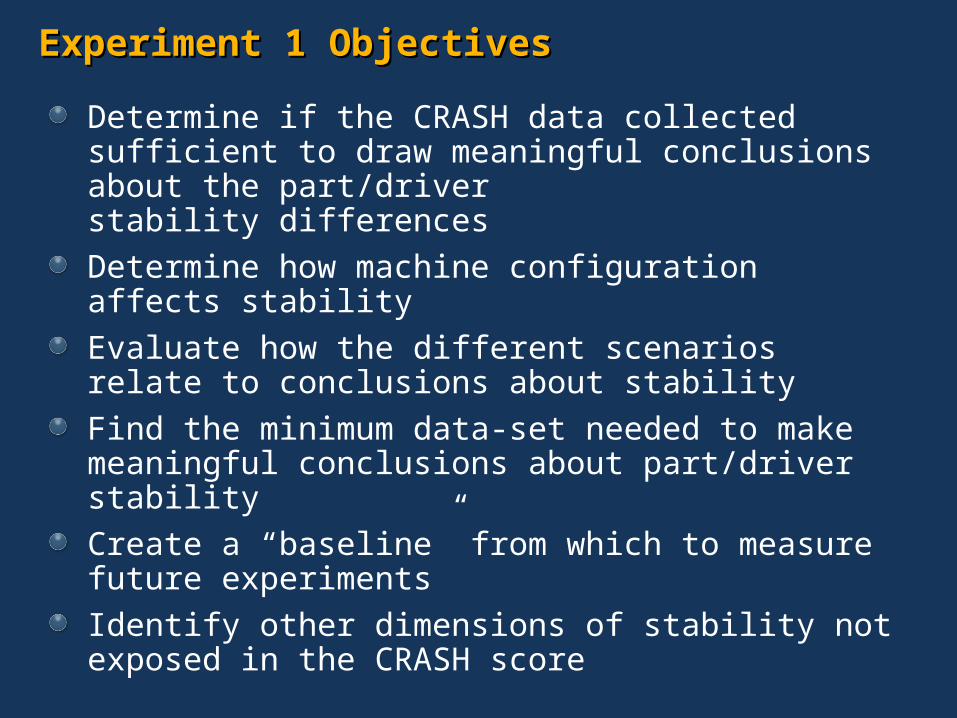
Experiment 1 ObjectivesExperiment 1 Objectives
Determine if the CRASH data collected sufficient to draw meaningful conclusions about the part/driver stability differences
Determine how machine configuration affects stability
Evaluate how the different scenarios relate to conclusions about stability
Find the minimum data-set needed to make meaningful conclusions about part/driver stability
Create a “baseline” from which to measure future experiments
Identify other dimensions of stability not exposed in the CRASH score
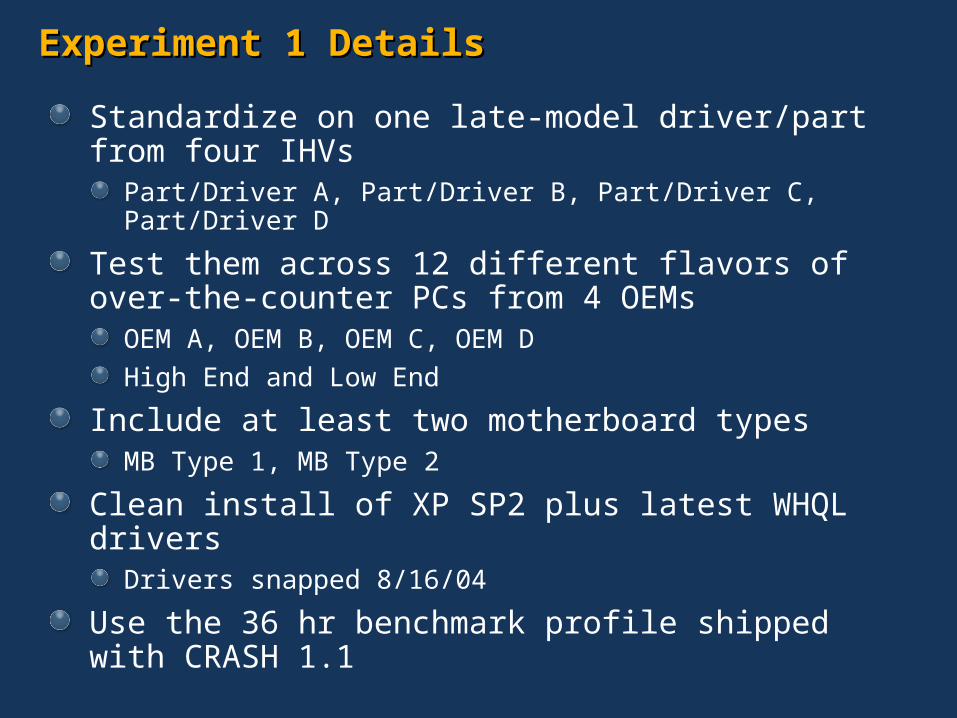
Experiment 1 DetailsExperiment 1 Details
Standardize on one late-model driver/part from four IHVsPart/Driver A, Part/Driver B, Part/Driver C, Part/Driver D
Test them across 12 different flavors of over-the-counter PCs from 4 OEMs
OEM A, OEM B, OEM C, OEM D
High End and Low End
Include at least two motherboard typesMB Type 1, MB Type 2
Clean install of XP SP2 plus latest WHQL driversDrivers snapped 8/16/04
Use the 36 hr benchmark profile shipped with CRASH 1.1
Important ConsiderationsImportant Considerations
Results apply only to these Part/Driver/System combinations only
Extrapolation of these results to other parts or drivers or systems is impossible with this data
CRASH TerminologyCRASH Terminology
ProfileRepresents a complete “run” of the Crash tool against a driver
Contains one or more scenarios
ScenarioDescribes a session of CRASH testing
Load intensity/profile
What tests will be used
How many times to run this scenario (loops)
ScoreScore is always a number that represents the percentage of the testing completed before a system failure (hang or kernel-break)
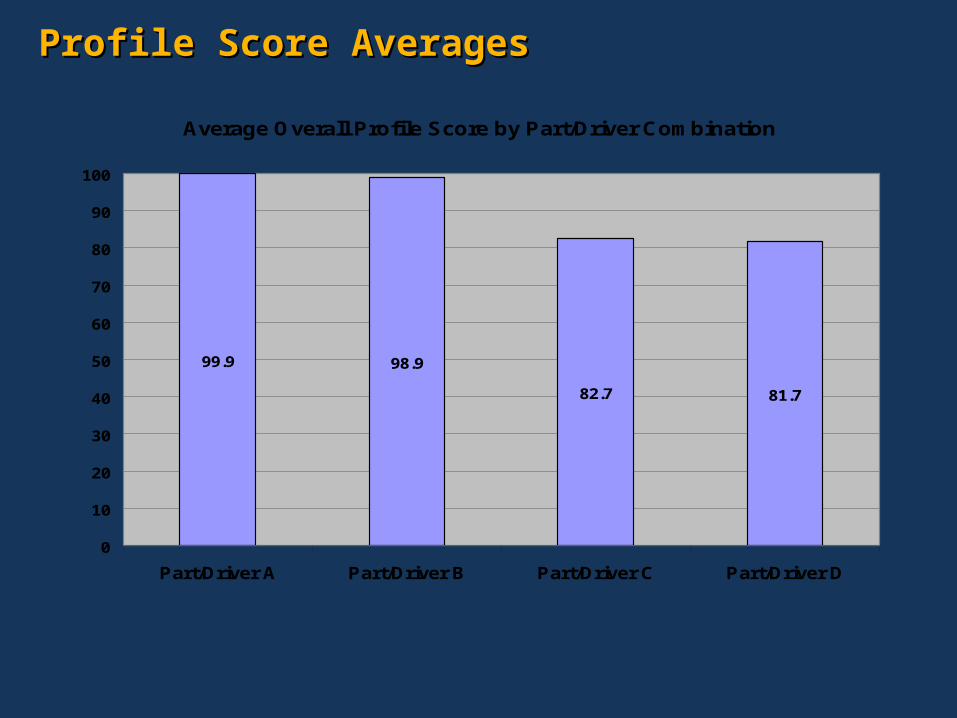
Profile Score AveragesProfile Score Averages
Average Overall Profile Score by Part/Driver Combination
99.9 98.9
82.7 81.7
0
10
20
30
40
50
60
70
80
90
100
Part/Driver A Part/Driver B Part/Driver C Part/Driver D
CRASH Terminology: FailuresCRASH Terminology: Failures
FailureHang
No minidump found and loop did not complete
Targeted FailureMinidump auto-analysis found failure was in the display driver
Non-Targeted FailureMinidump analysis found failure was not in display driver
Does not count against the score
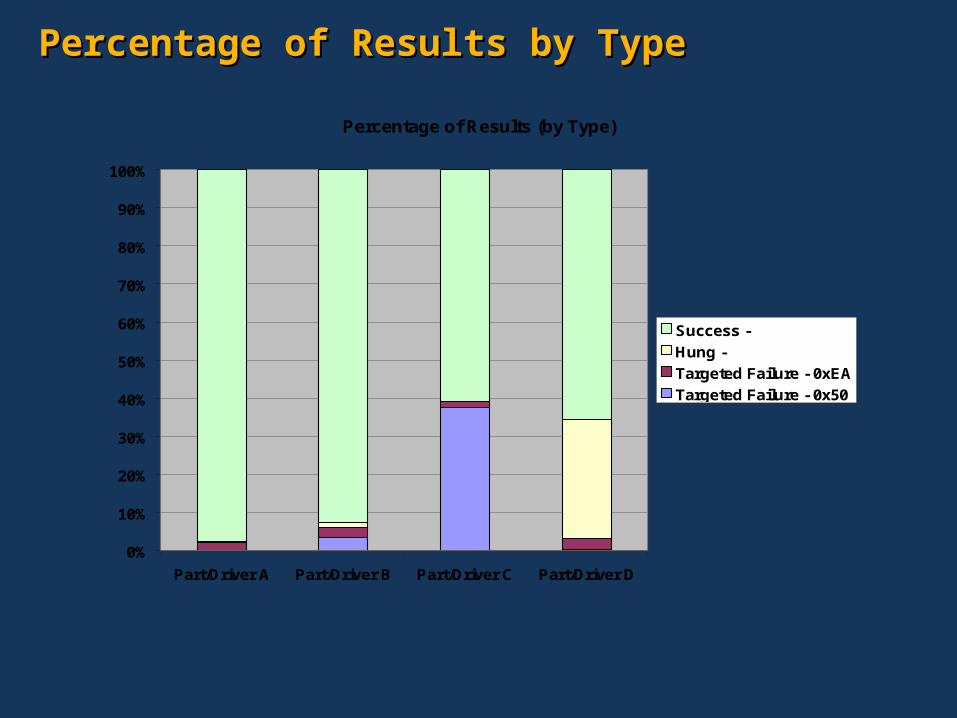
Percentage of Results by TypePercentage of Results by Type
Percentage of Results (by Type)
0%
10%
20%
30%
40%
50%
60%
70%
80%
90%
100%
Part/Driver A Part/Driver B Part/Driver C Part/Driver D
Success -
Hung -
Targeted Failure - 0xEA
Targeted Failure - 0x50
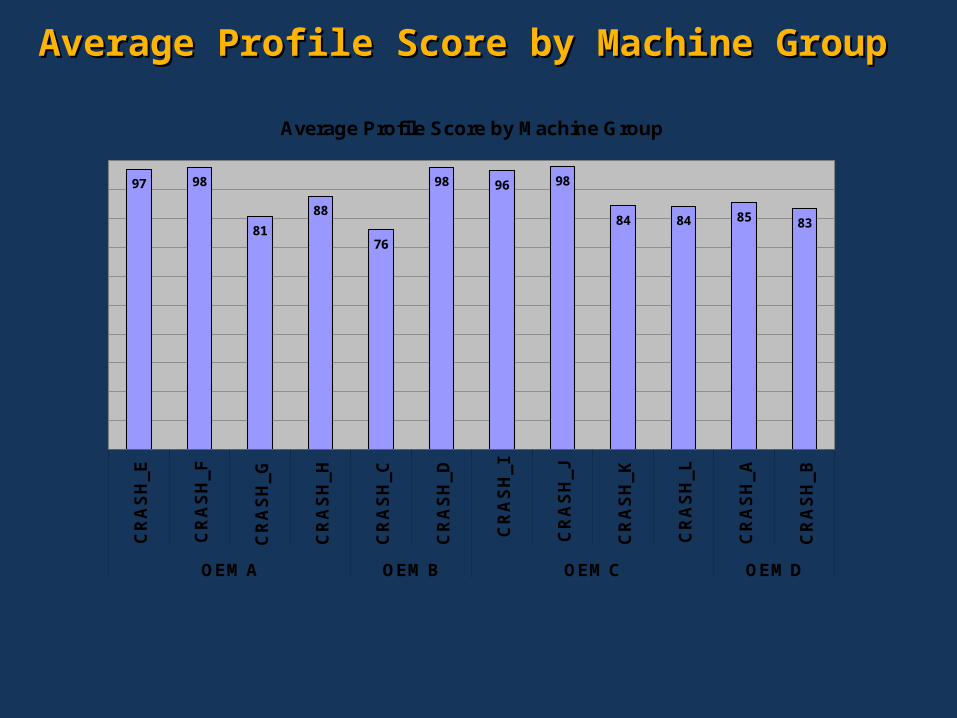
Average Profile Score by Machine GroupAverage Profile Score by Machine Group
Average Profile Score by Machine Group
97 98
81
88
76
98 96 98
84 84 85 83
CR
AS
H_
E
CR
AS
H_
F
CR
AS
H_
G
CR
AS
H_
H
CR
AS
H_
C
CR
AS
H_
D
CR
AS
H_
I
CR
AS
H_
J
CR
AS
H_
K
CR
AS
H_
L
CR
AS
H_
A
CR
AS
H_
B
OEM A OEM B OEM C OEM D
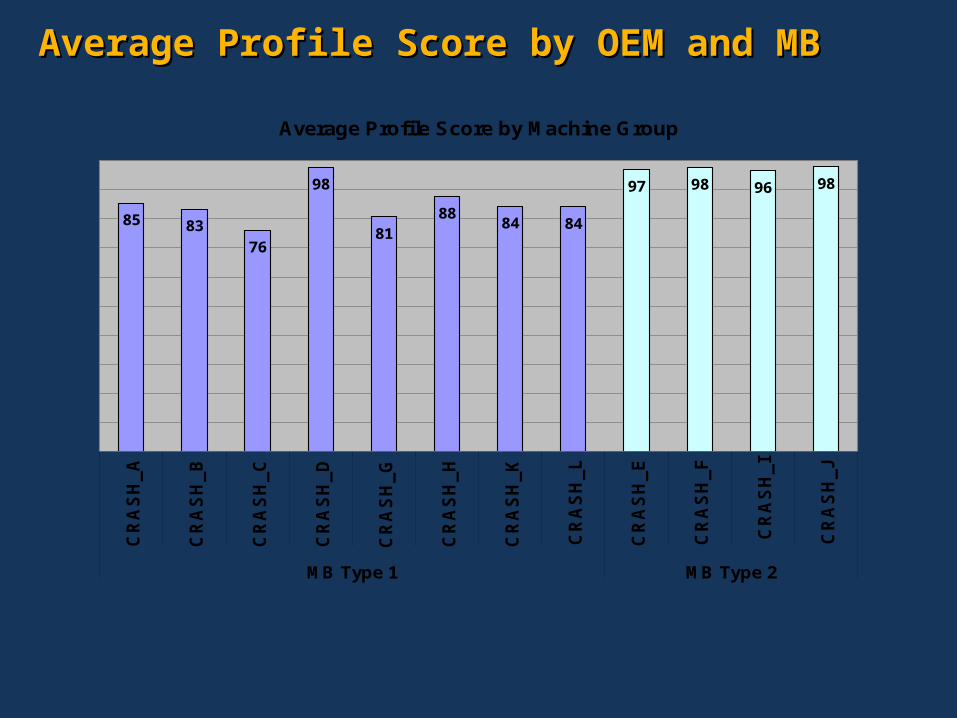
Average Profile Score by OEM and MBAverage Profile Score by OEM and MB
Average Profile Score by Machine Group
85 83
76
98
8188
84 84
97 98 96 98
CR
AS
H_
A
CR
AS
H_
B
CR
AS
H_
C
CR
AS
H_
D
CR
AS
H_
G
CR
AS
H_
H
CR
AS
H_
K
CR
AS
H_
L
CR
AS
H_
E
CR
AS
H_
F
CR
AS
H_
I
CR
AS
H_
J
MB Type 1 MB Type 2
Affect of MB Type on Profile ScoreAffect of MB Type on Profile Score
Average Profile Score for Part/Driver D & C by MB Type
74 77
100
92
Part/Driver C Part/Driver D
MB Type 1
MB Type 2
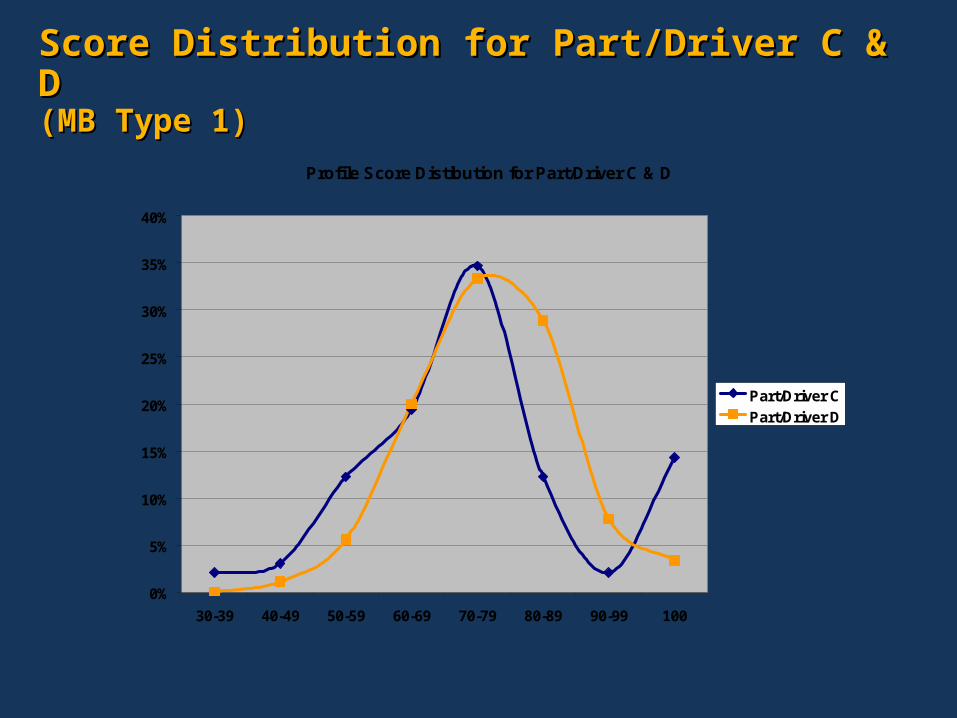
Score Distribution for Part/Driver C & DScore Distribution for Part/Driver C & D(MB Type 1)(MB Type 1)
Profile Score Distibution for Part/Driver C & D
0%
5%
10%
15%
20%
25%
30%
35%
40%
30-39 40-49 50-59 60-69 70-79 80-89 90-99 100
Part/Driver C
Part/Driver D
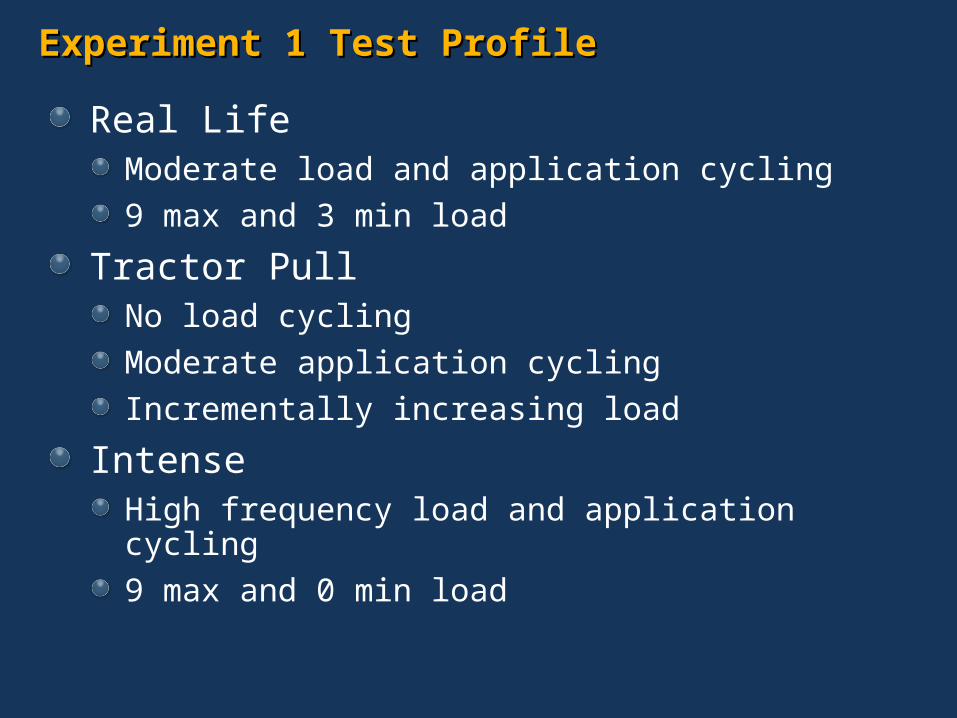
Experiment 1 Test ProfileExperiment 1 Test Profile
Real LifeModerate load and application cycling
9 max and 3 min load
Tractor PullNo load cycling
Moderate application cycling
Incrementally increasing load
IntenseHigh frequency load and application cycling
9 max and 0 min load
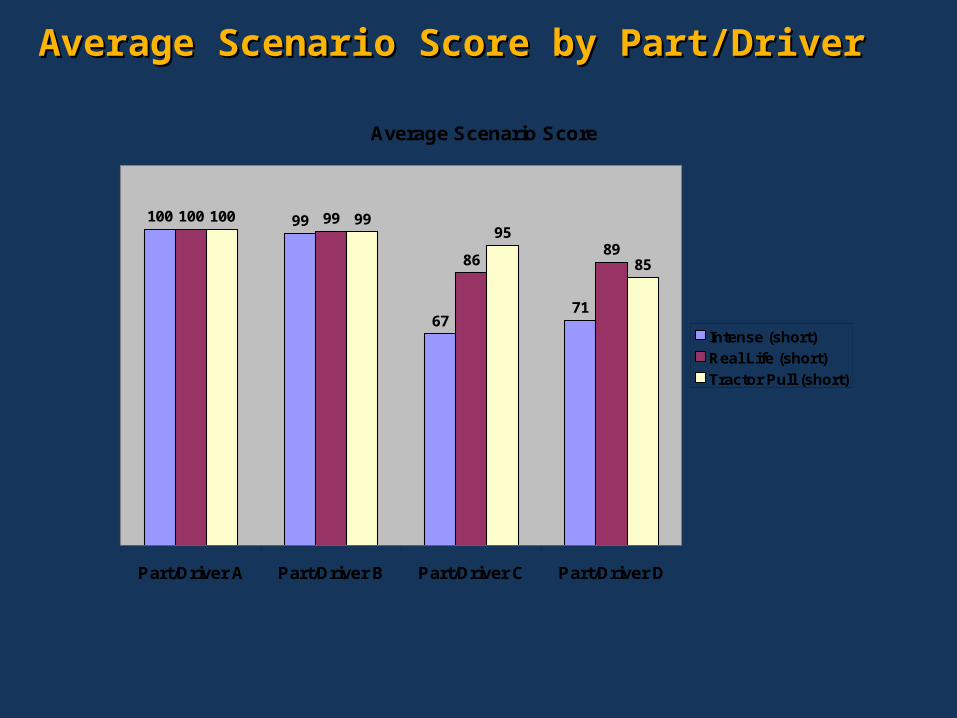
Average Scenario Score by Part/DriverAverage Scenario Score by Part/Driver
Average Scenario Score
100 99
6771
100 99
8689
10095
85
99
Part/Driver A Part/Driver B Part/Driver C Part/Driver D
Intense (short)
Real Life (short)
Tractor Pull (short)
Statistical Relevance QuestionsStatistical Relevance Questions
Question: How do I know that the difference between the averages of result set 1 and Result Set 2 are meaningful?
Question: How can I find the smallest result set size that will give me 95% confidence?
Answer: Use the “Randomization Test”
Randomization TestRandomization Test
Set 1Set 1 Set 2Set 2
Combination SetCombination Set
Random Set 2Random Set 2Random Set 1Random Set 1
Random test 10,000 times. If 95% of the time the Delta 1 is greater than Delta 2 then you are assured the difference is meaningful.
Try smaller sample sizes until the confidence drops below 95%. That is your minimum sample size.
Information on the “Randomization Test” can be found online at:http://www.uvm.edu/~dhowell/StatPages/Resampling/RandomizationTests.html
Delta 1
Delta 2
Scores and Confidence Intervals for Scores and Confidence Intervals for Part/Driver/MB CombinationsPart/Driver/MB Combinations
Part/Driver (MB) 1 Part/Driver (MB) 2 Confidence Samples
Part/Driver C (MB Type 1)
Part/Driver A (MB Type 1) 100% 4
Part/Driver D (MB Type 1)
Part/Driver A (MB Type 1) 100% 4
Part/Driver D (MB Type 2)
Part/Driver A (MB Type 2) 100% 4
Part/Driver C (MB Type 2)
Part/Driver D (MB Type 2) 100% 5
Part/Driver C (MB Type 2)
Part/Driver D (MB Type 1) 100% 5
Part/Driver D (MB Type 1)
Part/Driver B (MB Type 1) 100% 5
Part/Driver D (MB Type 1)
Part/Driver A (MB Type 2) 100% 5
Part/Driver D (MB Type 2)
Part/Driver A (MB Type 1) 100% 5
Part/Driver C (MB Type 1)
Part/Driver B (MB Type 1) 100% 6
Part/Driver C (MB Type 1)
Part/Driver A (MB Type 2) 100% 6
Part/Driver C (MB Type 1)
Part/Driver C (MB Type 2) 100% 6
Part/Driver D (MB Type 2)
Part/Driver B (MB Type 1) 100% 8
Part/Driver D (MB Type 1)
Part/Driver D (MB Type 2) 100% 9
Part/Driver C (MB Type 1)
Part/Driver D (MB Type 2) 100% 10
Part/Driver A (MB Type 2)
Part/Driver B (MB Type 1) 100% 19
Part/Driver C (MB Type 2)
Part/Driver B (MB Type 1) 100% 26
Part/Driver A (MB Type 1)
Part/Driver B (MB Type 1) 100% 39
Part/Driver C (MB Type 1)
Part/Driver D (MB Type 1) 80% -
Part/Driver A (MB Type 1)
Part/Driver A (MB Type 2) 73% -
Part/Driver C (MB Type 2)
Part/Driver A (MB Type 2) 66% -
Part/Driver C (MB Type 2)
Part/Driver A (MB Type 1) 51% -
Part/Driver (MB Type) Score
Part/Driver A (MB Type 2) 100
Part/Driver C (MB Type 2) 99.9
Part/Driver A (MB Type 1) 99.8
Part/Driver B (MB Type 1) 98.9
Part/Driver D (MB Type 2) 91.7
Part/Driver D (MB Type 1) 76.6
Part/Driver C (MB Type 1) 74.2
The Experiment MatrixThe Experiment Matrix
Clean Install OEM Image
Aug ’04 Driver Experiment 1 Experiment 3
Jan ’05 Driver Experiment 2
With three experiments completed, we can now compare:
One driver across two OS configurations
Two versions of one driver across a single OS configuration
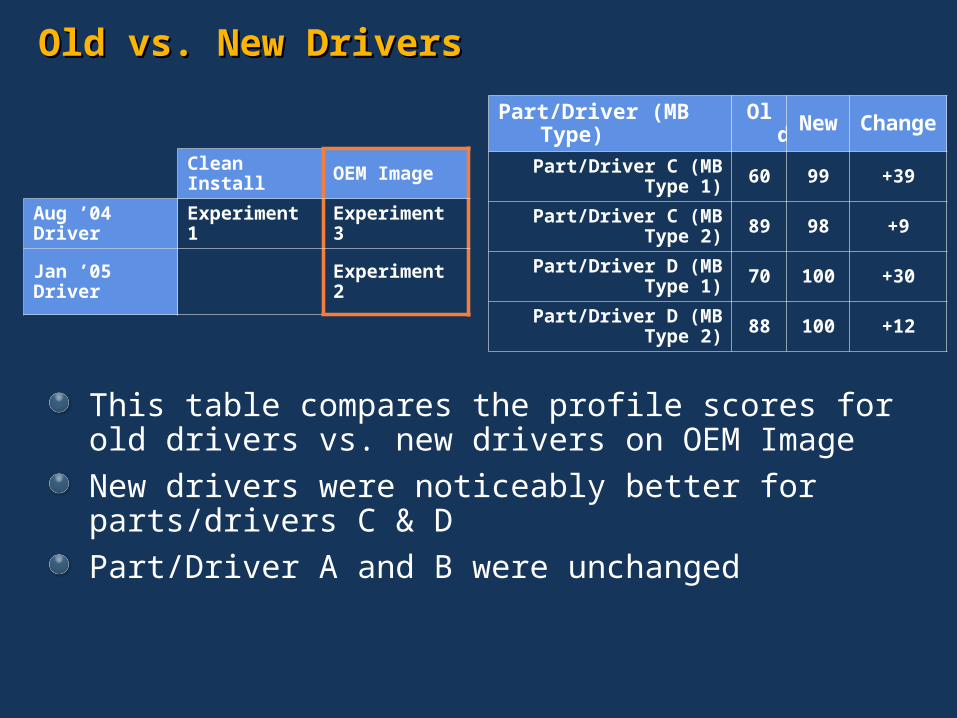
Old vs. New DriversOld vs. New Drivers
Clean Install OEM Image
Aug ’04 Driver Experiment 1 Experiment 3
Jan ’05 Driver Experiment 2
Part/Driver (MB Type) Old New Change
Part/Driver C (MB Type 1) 60 99 +39
Part/Driver C (MB Type 2) 89 98 +9
Part/Driver D (MB Type 1) 70 100 +30
Part/Driver D (MB Type 2) 88 100 +12
This table compares the profile scores for old drivers vs. new drivers on OEM Image
New drivers were noticeably better for parts/drivers C & D
Part/Driver A and B were unchanged
OEM Image vs. Clean InstallOEM Image vs. Clean Install
Part/Driver (MB Type) Clean OEM Change
Part/Driver C (MB Type 1) 74 60 -14
Part/Driver C (MB Type 2) 100 89 -11
Part/Driver D (MB Type 1) 77 71 -6
Part/Driver D (MB Type 2) 92 89 -3
This table compares profile scores for OEM Image vs. Clean Install with Old Drivers
Clean install scores universally better than OEM image for parts/drivers C and D
Part/Driver A and B were unchanged
Experiment 2Jan ’05 Driver
Experiment 3Experiment 1Aug ’04 Driver
OEM ImageClean Install
Future PlansFuture Plans
Collate with OCA dataCRASH failure to OCA bucket correlations
What buckets were fixed between 1st and 2nd driver versions?
Do our results match field data?customer machines have hardware that is typically several years old
Can we find the non-display failure discrepancy in the field?
Begin to tweak other knobsContent
Driver-versions
HW-versions
Windows codenamed “Longhorn” Test BenchPCIe cards
Suggested Future ExperimentsSuggested Future Experiments
Include more motherboard types
Newer drivers or use a “Control Group” driver. Reference Rasterizer?
Disabled AGP to isolate chipset errors from AGP errors
Driver-Verifier enabled
Add non-graphics stress tests to the mix
Modified Loop Times
IHV FeedbackIHV Feedback
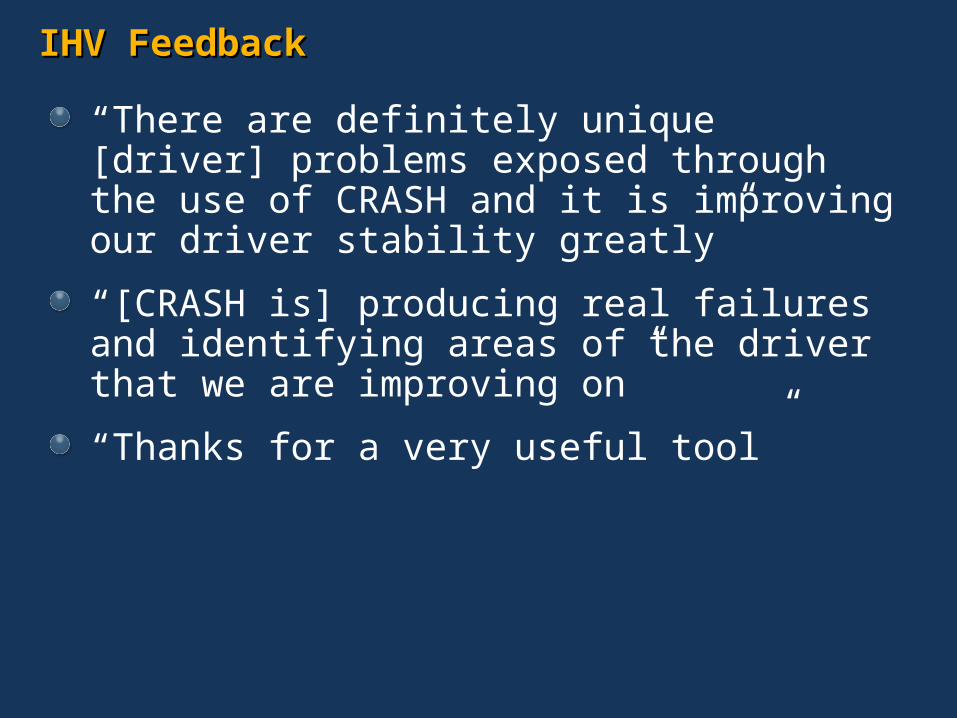
“There are definitely unique [driver] problems exposed through the use of CRASH and it is improving our driver stability greatly”
“[CRASH is] producing real failures and identifying areas of the driver that we are improving on”
“Thanks for a very useful tool”
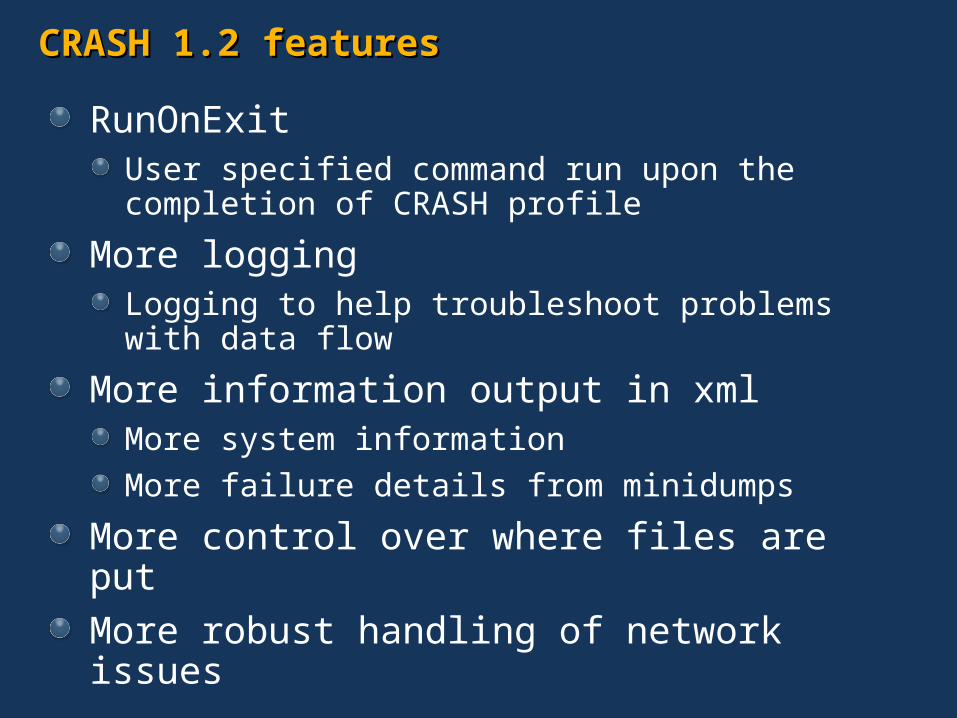
CRASH 1.2 features CRASH 1.2 features
RunOnExit User specified command run upon the completion of CRASH profile
More logging Logging to help troubleshoot problems with data flow
More information output in xml More system information
More failure details from minidumps
More control over where files are put
More robust handling of network issues
Customer Device Experience Rating (CDER) Customer Device Experience Rating (CDER) Program BackgroundProgram Background
Started from a desire to rate display driver stability based on OCA crashes
Controlled program addresses shortcomings of OCA data:
Unknown market share
Unknown crash reporting habits
Unknown info on non-crashing machines
This allows normalization of OCA data to be able to get accurate ‘number of crashes per machine’ stability rating
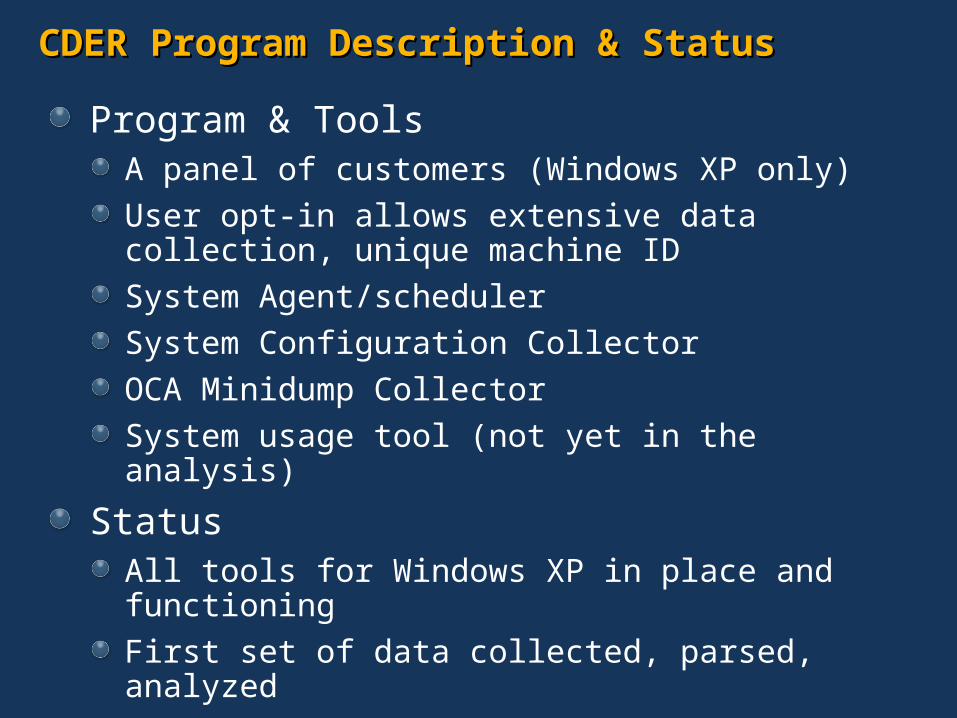
CDER Program Description & StatusCDER Program Description & Status
Program & ToolsA panel of customers (Windows XP only)
User opt-in allows extensive data collection, unique machine ID
System Agent/scheduler
System Configuration Collector
OCA Minidump Collector
System usage tool (not yet in the analysis)
StatusAll tools for Windows XP in place and functioning
First set of data collected, parsed, analyzed
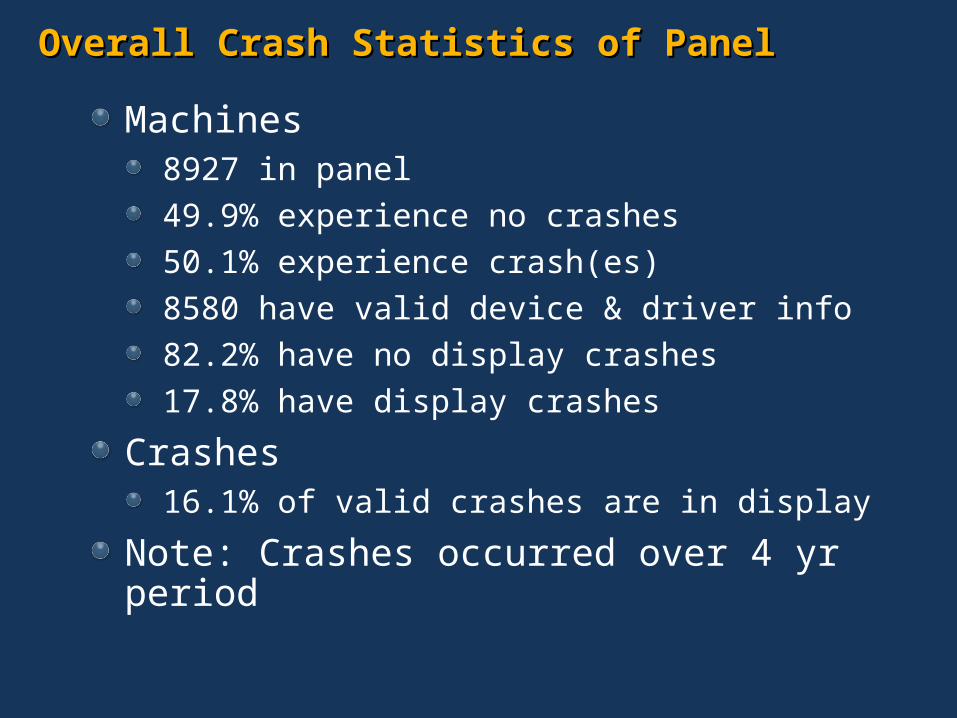
Overall Crash Statistics of PanelOverall Crash Statistics of Panel
Machines8927 in panel
49.9% experience no crashes
50.1% experience crash(es)
8580 have valid device & driver info
82.2% have no display crashes
17.8% have display crashes
Crashes16.1% of valid crashes are in display
Note: Crashes occurred over 4 yr period
Crash Analysis FactorsCrash Analysis Factors
Examined several factors which may have an impact on stability ratings
Processor
Display Resolution
Bit Depth
Monitor Refresh Rate
Display Memory
Note: Vendor & part naming does not correspond to that in CRASH presentation.
Note: Unless otherwise noted, data for these analyses were from the last 3 years
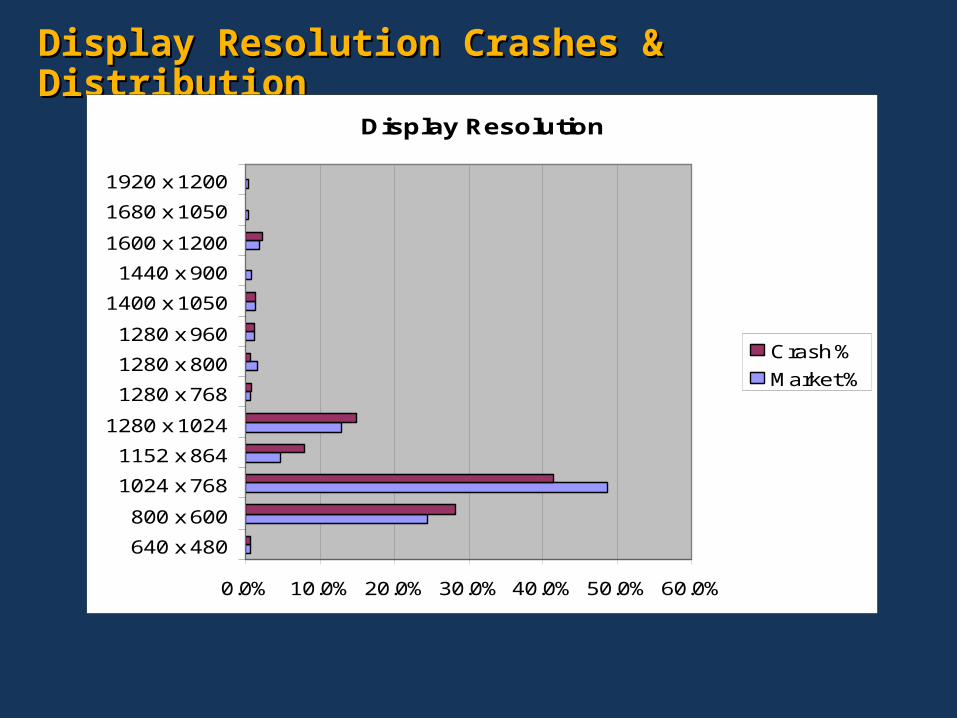
Display Resolution Crashes & DistributionDisplay Resolution Crashes & Distribution
Display Resolution
0.0% 10.0% 20.0% 30.0% 40.0% 50.0% 60.0%
640 x 480
800 x 600
1024 x 768
1152 x 864
1280 x 1024
1280 x 768
1280 x 800
1280 x 960
1400 x 1050
1440 x 900
1600 x 1200
1680 x 1050
1920 x 1200
Crash %
Market %
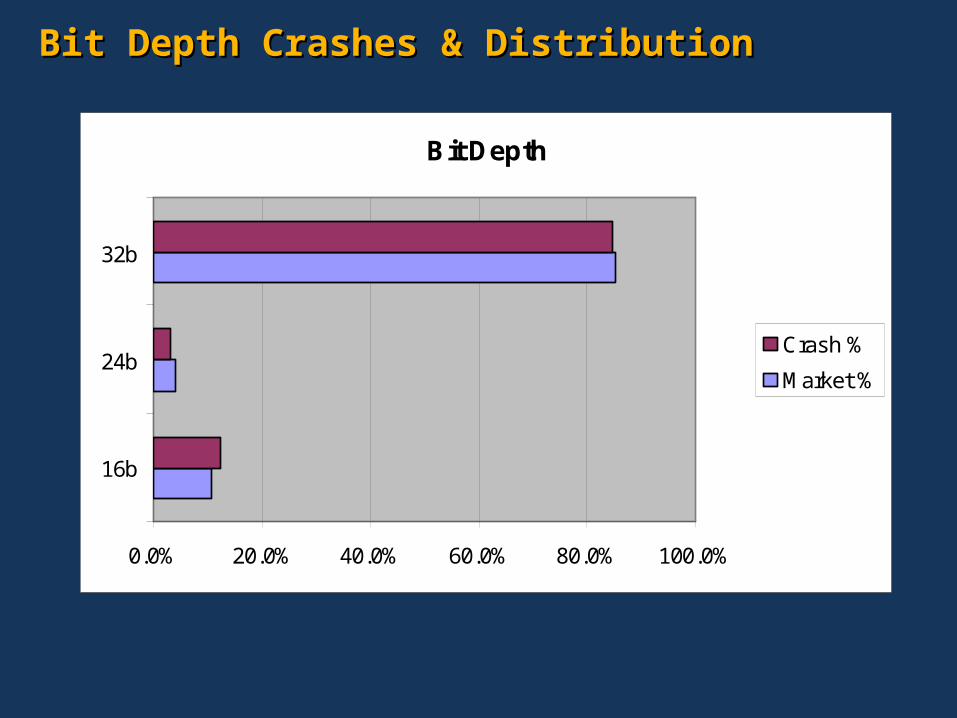
Bit Depth Crashes & DistributionBit Depth Crashes & Distribution
Bit Depth
0.0% 20.0% 40.0% 60.0% 80.0% 100.0%
16b
24b
32b
Crash %
Market %
Refresh Rate Crashes & DistributionRefresh Rate Crashes & Distribution
Monitor Refresh Rate
0.0% 20.0% 40.0% 60.0% 80.0%
60Hz
70Hz
72Hz
75Hz
85Hz
100Hz
Crash %
Market %
Display Memory Crashes & DistributionDisplay Memory Crashes & Distribution
Display Memory
0.0% 5.0% 10.0% 15.0% 20.0% 25.0% 30.0% 35.0%
4M
8M
16M
32M
64M
96M
128M
256M
Crash %
Market %
Display Crashes By Type (Over Last Year)Display Crashes By Type (Over Last Year)
Overall Breakdown of Crashes by Type
OLD_IMAGE28%
FIXED2%
0xEA35%
Other35%
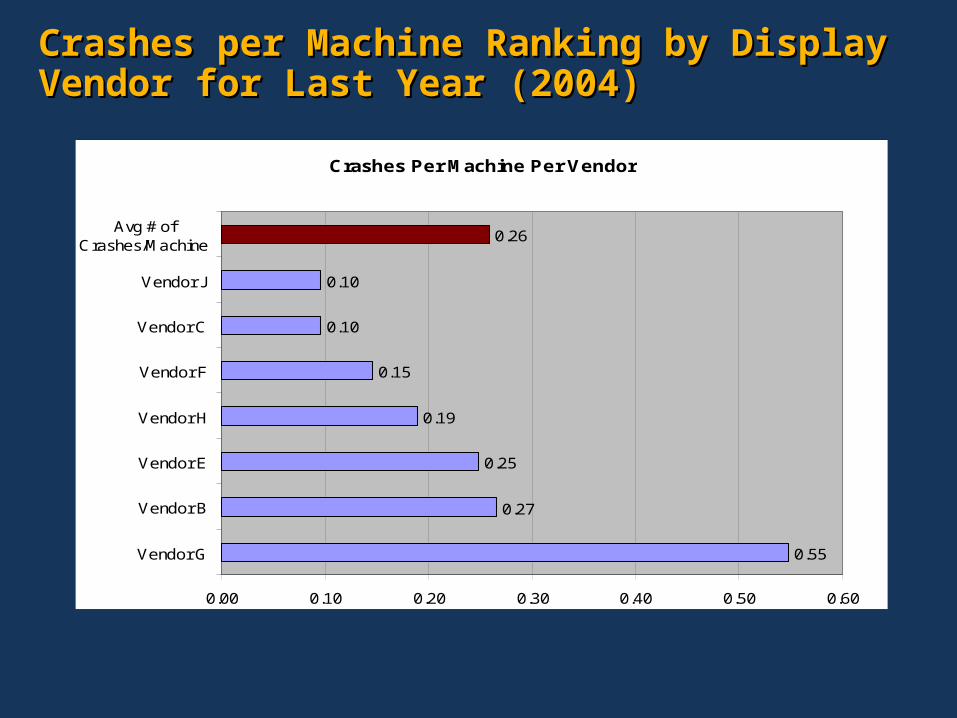
Normalized Crash DataNormalized Crash Data
The following data is normalized by program share of crashing and non-crashing machines
Crashes per Machine Ranking by Display Vendor Crashes per Machine Ranking by Display Vendor for Last Year (2004)for Last Year (2004)
Crashes Per Machine Per Vendor
0.55
0.27
0.25
0.19
0.15
0.10
0.10
0.26
0.00 0.10 0.20 0.30 0.40 0.50 0.60
Vendor G
Vendor B
Vendor E
Vendor H
Vendor F
Vendor C
Vendor J
Avg # ofCrashes/Machine
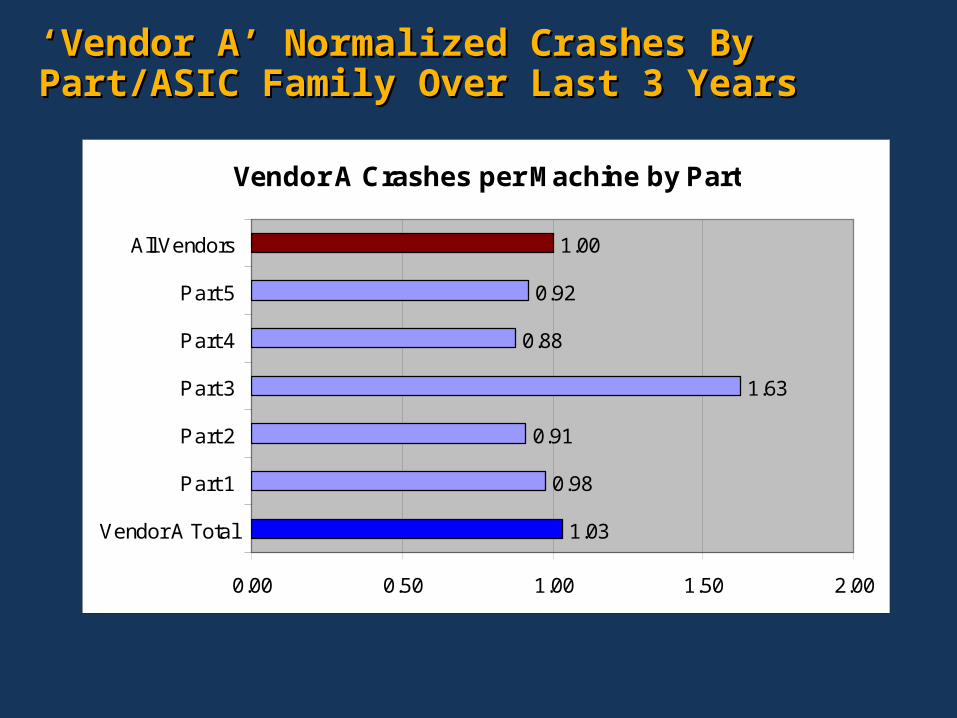
‘‘Vendor A’ Normalized Crashes By Part/ASIC Vendor A’ Normalized Crashes By Part/ASIC Family Over Last 3 YearsFamily Over Last 3 Years
Vendor A Crashes per Machine by Part
1.03
0.98
0.91
1.63
0.88
0.92
1.00
0.00 0.50 1.00 1.50 2.00
Vendor A Total
Part 1
Part 2
Part 3
Part 4
Part 5
All Vendors
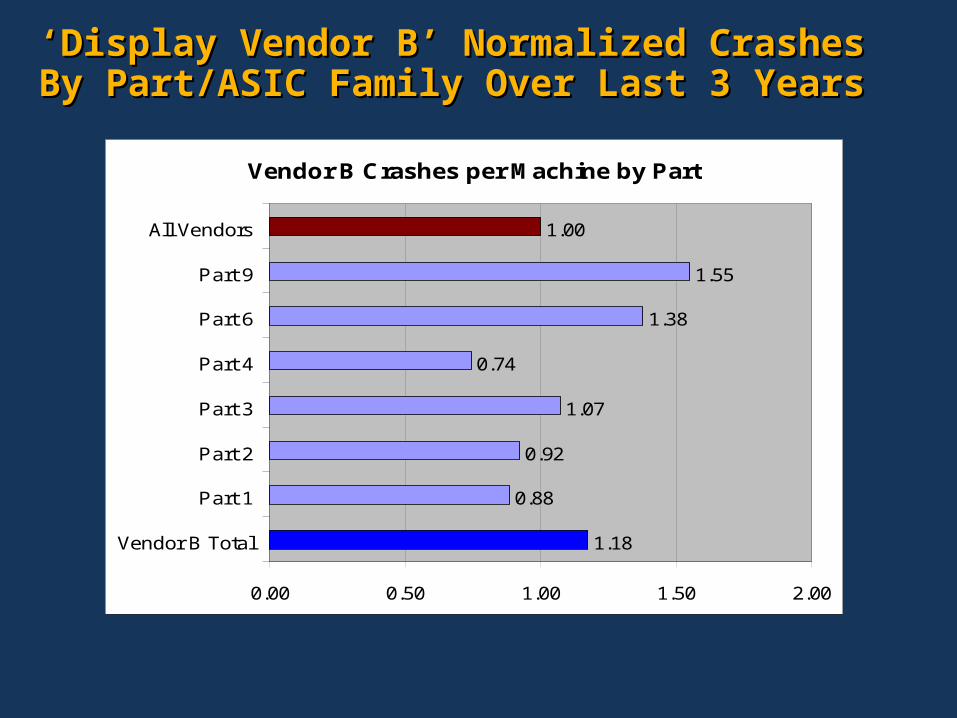
‘‘Display Vendor B’ Normalized Crashes By Display Vendor B’ Normalized Crashes By Part/ASIC Family Over Last 3 YearsPart/ASIC Family Over Last 3 Years
Vendor B Crashes per Machine by Part
1.18
0.88
0.92
1.07
0.74
1.38
1.55
1.00
0.00 0.50 1.00 1.50 2.00
Vendor B Total
Part 1
Part 2
Part 3
Part 4
Part 6
Part 9
All Vendors
‘‘Display Vendor C’ Normalized Crashes By Display Vendor C’ Normalized Crashes By Part/ASIC Family Over Last 3 YearsPart/ASIC Family Over Last 3 Years
Vendor C Crashes per Machine by Part
0.42
1.33
0.06
0.09
1.00
0.00 0.50 1.00 1.50 2.00
Vendor C Total
Part 1
Part 4
Part 6
All Vendors
Normalized Crashes Ranked by Part - 2004Normalized Crashes Ranked by Part - 2004
0.55
0.37
0.36
0.31
0.29
0.28
0.26
0.26
0.23
0.21
0.20
0.19
0.19
0.16
0.15
0.00
0.00
0.26
0.00 0.10 0.20 0.30 0.40 0.50 0.60
Vendor G (Part 1)
Vendor E (Part 6)
Vendor C (Part 1)
Vendor B (Part 3)
Vendor E (Part 9)
Vendor B (Part 2)
Vendor B (Part 1)
Vendor B (Part 5)
Vendor E (Part 3)
Vendor E (Part 1)
Vendor E (Part 4)
Vendor B (Part 4)
Vendor H (Part 1)
Vendor E (Part 2)
Vendor F (Part 1)
Vendor C (Part 4)
Vendor C (Part 6)
Avg # of Crashes/Machine
Ranking and Rating ConclusionsRanking and Rating Conclusions
This is a first lookNeed to incorporate system usage data
Need to continue collecting configuration data to track driver and hardware changes
Need more panelists, and a higher proportion of newer parts
With that said:This is solid data
This demonstrates our tools work as designed
It shows the viability of a crash-based rating program
Customer Experience & LoyaltyCustomer Experience & Loyalty
A closer look at segment of panelists who:Experienced display crashes, and
Switched or upgraded their display hardware or driver
Experience & Loyalty HighlightsExperience & Loyalty Highlights
19.4% of users who experienced display crashes upgraded their drivers, or hardware, or changed to a different display vendor
7.9% of users (nearly 41% of the 19.4%) who experienced display crashes switched to a competitor’s product
ALL users who switched to a competitor’s product had the same or better experience
Only 91.3% of those who upgraded had the same or better experience afterwards, based on crashes
Time clustering of crashes
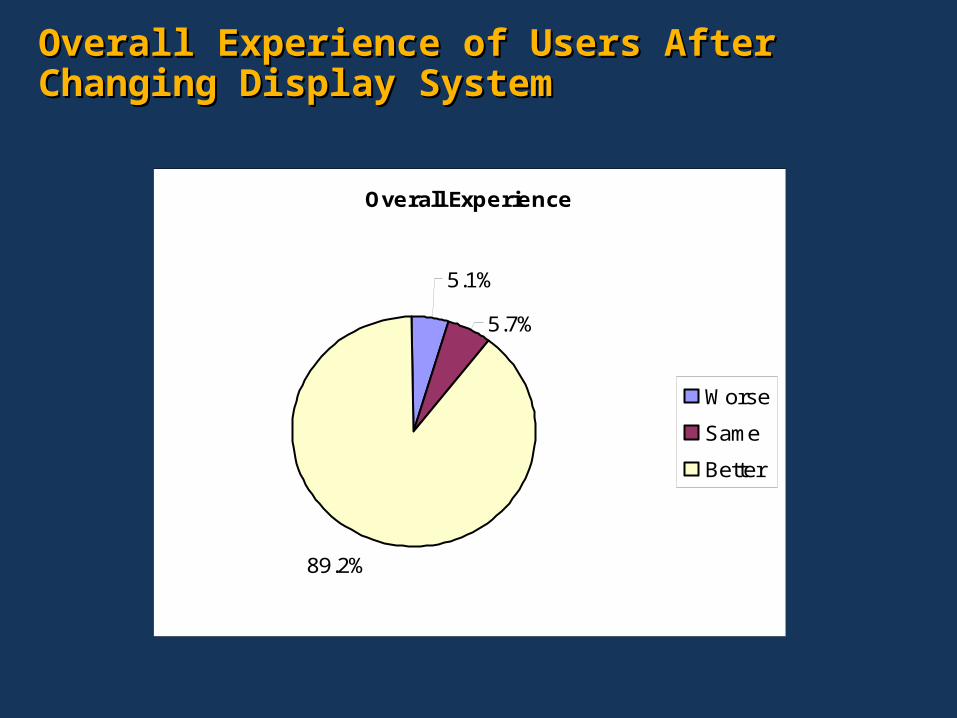
Overall Experience of Users After Changing Overall Experience of Users After Changing Display SystemDisplay System
Overall Experience
5.1%
5.7%
89.2%
Worse
Same
Better
Experience of Users After UpgradingExperience of Users After Upgrading
Experience of Those Who Upgraded
8.7%
4.8%
86.5%
Worse
Same
Better
Experience of Users After Switching Experience of Users After Switching Display VendorsDisplay Vendors
Experience of Those Who Switched
0.0%
6.9%
93.1%
Worse
Same
Better
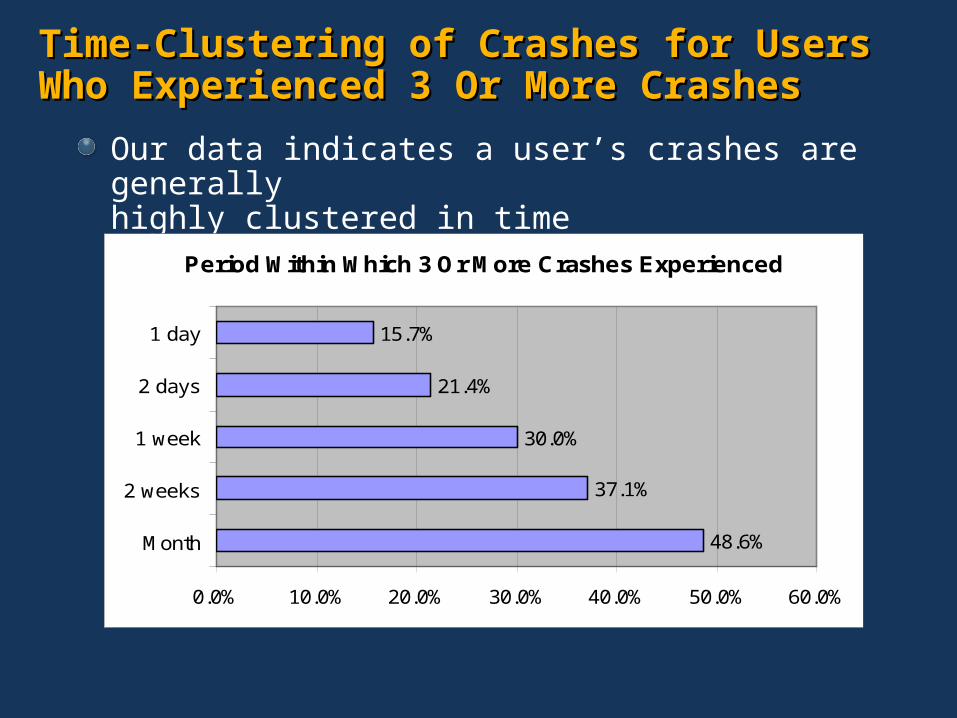
Time-Clustering of Crashes for Users Who Time-Clustering of Crashes for Users Who Experienced 3 Or More CrashesExperienced 3 Or More Crashes
Our data indicates a user’s crashes are generallyhighly clustered in time
Period Within Which 3 Or More Crashes Experienced
48.6%
37.1%
30.0%
21.4%
15.7%
0.0% 10.0% 20.0% 30.0% 40.0% 50.0% 60.0%
Month
2 weeks
1 week
2 days
1 day
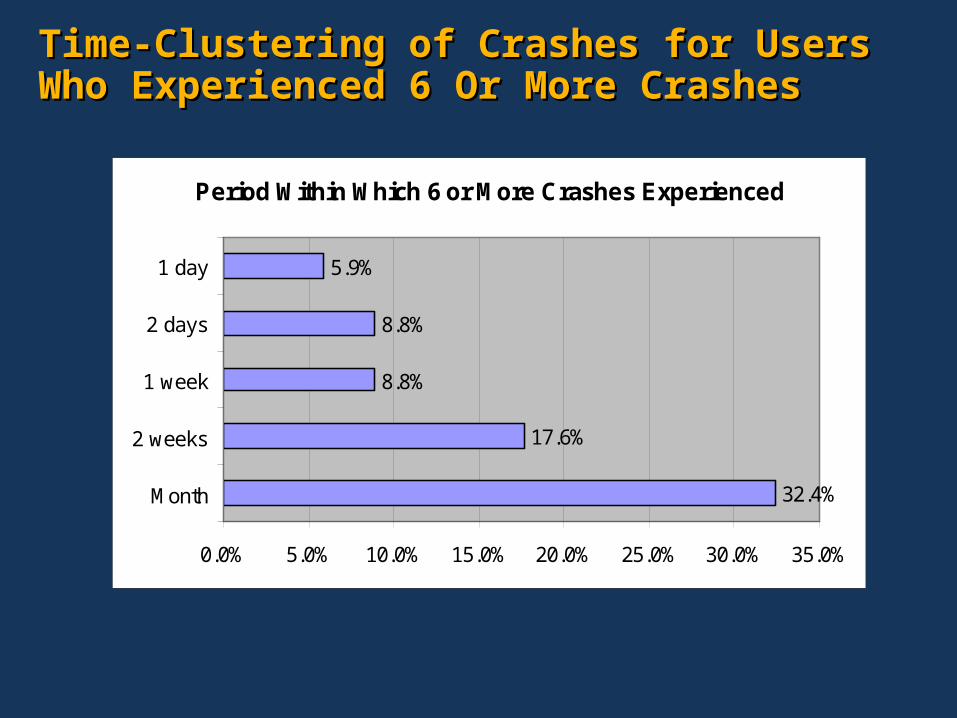
Time-Clustering of Crashes for Users Who Time-Clustering of Crashes for Users Who Experienced 6 Or More CrashesExperienced 6 Or More Crashes
Period Within Which 6 or More Crashes Experienced
32.4%
17.6%
8.8%
8.8%
5.9%
0.0% 5.0% 10.0% 15.0% 20.0% 25.0% 30.0% 35.0%
Month
2 weeks
1 week
2 days
1 day
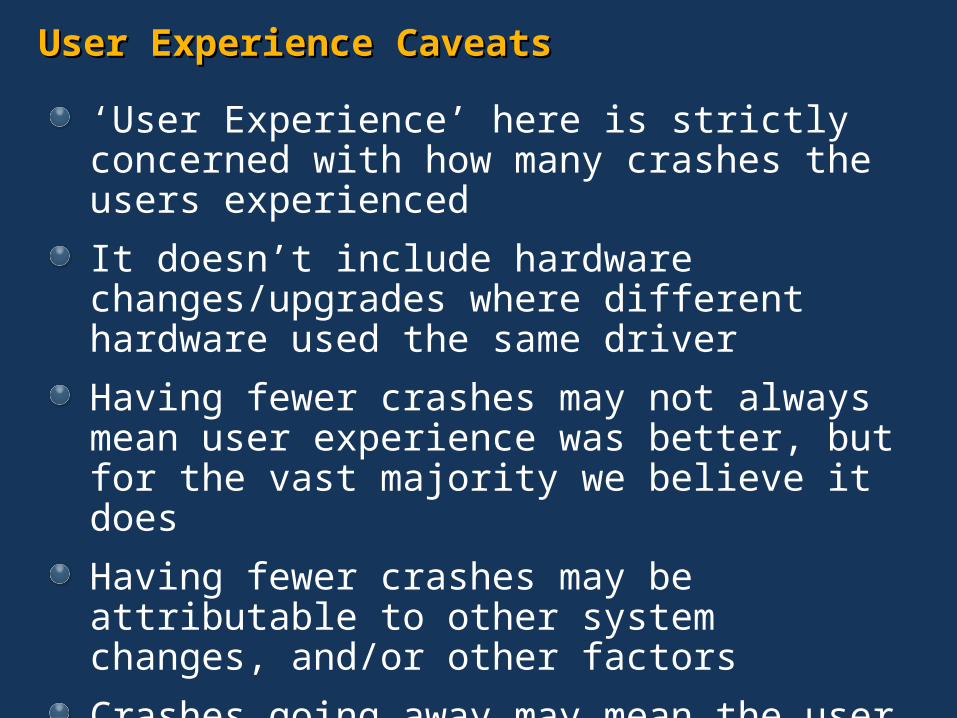
User Experience CaveatsUser Experience Caveats
‘User Experience’ here is strictly concerned with how many crashes the users experienced
It doesn’t include hardware changes/upgrades where different hardware used the same driver
Having fewer crashes may not always mean user experience was better, but for the vast majority we believe it does
Having fewer crashes may be attributable to other system changes, and/or other factors
Crashes going away may mean the user gave up using whatever was causing the crashes
Going ForwardGoing Forward
Current Program (Windows XP-based)Normalize by usage as data becomes available
Include periodic configuration data in analysis
Correlate with CRASH tool results
Continue to develop towards rating program
Planned for Longhorn/LDDMModify tools for Longhorn and new display driver model
Larger set of participants for Longhorn Beta1
Recruit more users with newer hardware
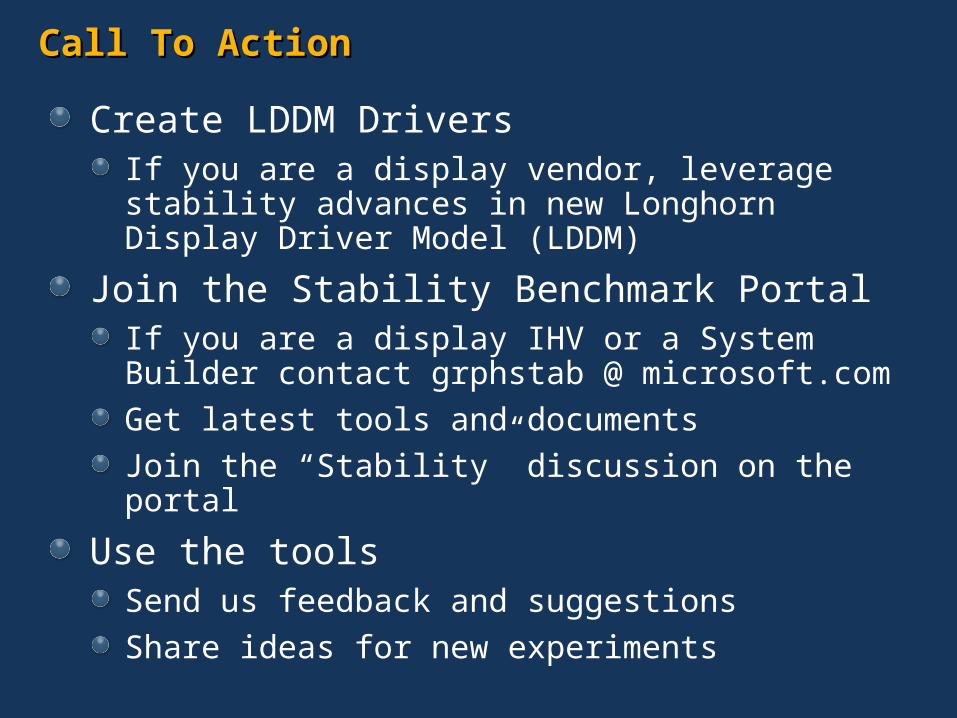
Call To Action Call To Action
Create LDDM Drivers If you are a display vendor, leverage stability advances in new Longhorn Display Driver Model (LDDM)
Join the Stability Benchmark PortalIf you are a display IHV or a System Builder contact grphstab @ microsoft.com
Get latest tools and documents
Join the “Stability” discussion on the portal
Use the toolsSend us feedback and suggestions
Share ideas for new experiments
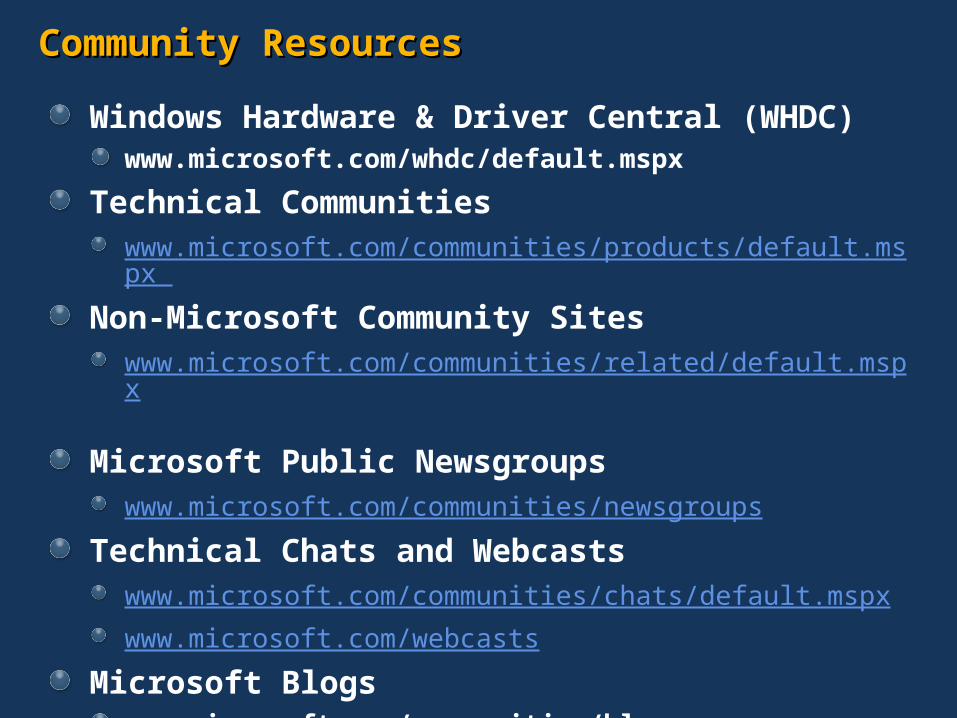
Community ResourcesCommunity Resources
Windows Hardware & Driver Central (WHDC)www.microsoft.com/whdc/default.mspx
Technical Communitieswww.microsoft.com/communities/products/default.mspx
Non-Microsoft Community Siteswww.microsoft.com/communities/related/default.mspx
Microsoft Public Newsgroupswww.microsoft.com/communities/newsgroups
Technical Chats and Webcastswww.microsoft.com/communities/chats/default.mspx
www.microsoft.com/webcasts
Microsoft Blogswww.microsoft.com/communities/blogs
Additional ResourcesAdditional Resources
Email grphstab @ microsoft.com
Related SessionsGraphics Stability: Part 2
WDK for Graphics: An Introduction
Longhorn Display Driver Model: Roadmap and Requirements
Longhorn Display Driver Model: Key Features