18
Gravity in the Fernley & Hazen Flat Areas Geol 492/692 Spring 2005 Melissa Edwards, Harmony Farnsworth, and Rich Redd
| Date post: | 30-Dec-2015 |
| Category: |
Documents |
| Upload: | nadine-beasley |
| View: | 21 times |
| Download: | 0 times |
Gravity in the Fernley & Hazen Flat Areas
Geol 492/692 Spring 2005
Melissa Edwards, Harmony Farnsworth, and Rich Redd

Locations—Fernley

Locations—Hazen

Methods—Gravimeter
• Used a LaCoste & Romberg Model G Gravimeter to measure gravity at each location– Before each trip to the field a base station measurement was taken
at UNR outside of SEM (Base 1)– At both the Fernley and Hazen sites a base station was established
and a gravity measurement was taken the morning, afternoon, and the evening of each trip (Base 2 & Base 3)
– The base station gravity measurements were all within 0.5 mGals of each other, indicating the gravimeter was working correctly
• A calibration correction for the reading for the gravimeter was made using one of the following formulas (depending on what the gravity reading was):– For 3100 reading: ((Gravimeter reading-3100)*1.02258)+3170.62– For 3200 reading: ((Gravimeter reading-3200)*1.0226)+3272.88

Methods—Trimble
• Used a Trimble XT GPS to measure elevation and lat/long at every location– Instrument was placed 10 ft or less away from the spot where a
gravity reading was taken, but at the same elevation level– Instrument was allowed to collect GPS points for 10 minutes or
120 points, which ever came first
• Data– Downloaded using GPS Pathfinder Office 3.0– Used the Reno airport as the reference for corrections to all the
GPS data collected from the Trimble since it had data for all the days we recorded.
– Horizontal error at least 6 cm.– 68% confident elevation is within 2 meters
• Amounts to a 0.3 to 0.6 mGal error in the Bouguer calculations
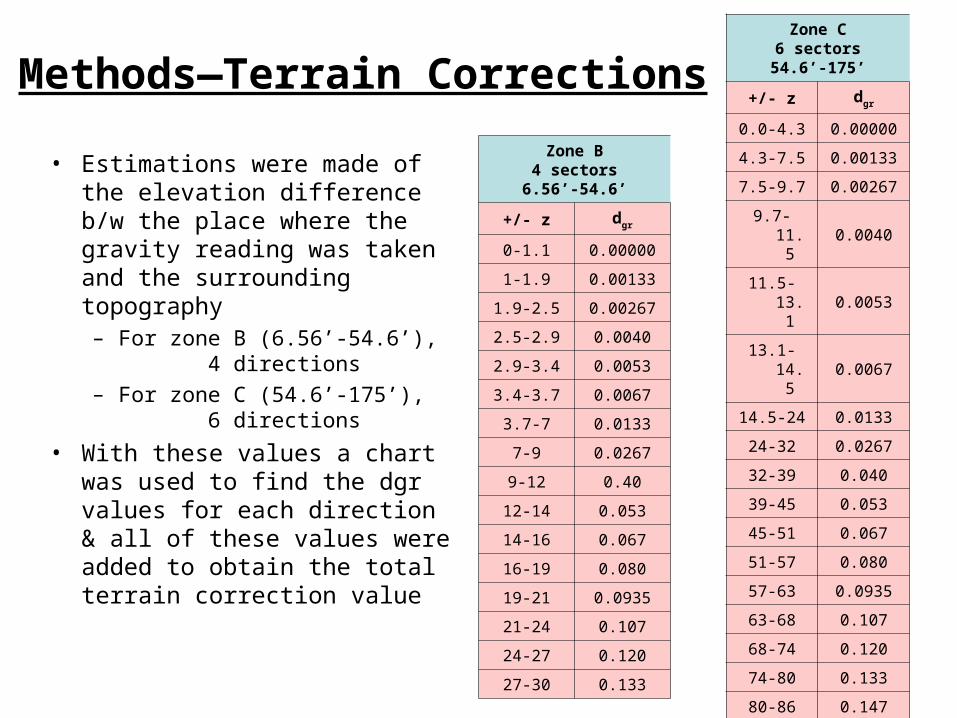
Methods—Terrain Corrections
• Estimations were made of the elevation difference b/w the place where the gravity reading was taken and the surrounding topography– For zone B (6.56’-54.6’), 4
directions– For zone C (54.6’-175’), 6
directions
• With these values a chart was used to find the dgr values for each direction & all of these values were added to obtain the total terrain correction value
Zone B4 sectors
6.56’-54.6’
+/- z dgr
0-1.1 0.00000
1-1.9 0.00133
1.9-2.5 0.00267
2.5-2.9 0.0040
2.9-3.4 0.0053
3.4-3.7 0.0067
3.7-7 0.0133
7-9 0.0267
9-12 0.40
12-14 0.053
14-16 0.067
16-19 0.080
19-21 0.0935
21-24 0.107
24-27 0.120
27-30 0.133
Zone C6 sectors
54.6’-175’
+/- z dgr
0.0-4.3 0.00000
4.3-7.5 0.00133
7.5-9.7 0.00267
9.7-11.5 0.0040
11.5-13.1 0.0053
13.1-14.5 0.0067
14.5-24 0.0133
24-32 0.0267
32-39 0.040
39-45 0.053
45-51 0.067
51-57 0.080
57-63 0.0935
63-68 0.107
68-74 0.120
74-80 0.133
80-86 0.147
86-91 0.160
91-97 0.174
97-104 0.187
104-110 0.200

Methods—Bouguer Correction
• Bouguer anomaly value calculations were made using the gravity readings from the gravimeter, the terrain corrections, the elevation/lat/long data downloaded from the Trimble, and the following formulas:– Free Air Correction = 0.3086 * elevation
– Bouguer Correction = 0.0419*density (used 2.67) * elevation
– Theoretical Gravity = 978.03185* (1 + (0.0053024 * sin2 (latitude)) – (0.0000058 * sin2 (2 * latitude))
– Bouguer Anomaly = (Observed Gravity + Free Air Correction – Bouguer Correction) – Theoretical Gravity

Methods & Results—Fernley Line 1• Gravimeter points were spaced 100 meters apart• Points S1-S19 were surveyed (plus Base 1 & Base 2)
Fernley Line 1
2548.6
2548.8
2549
2549.2
2549.4
2549.6
2549.8
2550
2550.2
2550.4
2550.6
4381000 4381500 4382000 4382500 4383000 4383500
Latitude (UTM)
Bo
ug
ue
r A
no
ma
ly (
mG
al)

Methods & Results—Fernley Line 2• Gravimeter points spaced 100 meters apart• Points S201-S221 were surveyed (plus Base 1 & Base 2)• Poor satellite coverage for S204 & S205 with the Trimble
Fernley Line 2
2549
2549.5
2550
2550.5
2551
2551.5
2552
2552.5
4379500 4380000 4380500 4381000 4381500 4382000 4382500 4383000 4383500
Latitude (UTM)
Bo
ug
ue
r A
no
ma
ly (
mG
al)

Methods & Results—Hazen • Gravimeter points were spaced 100 meters apart
– S128 was spaced 150 meters form S127– S131 was spaced 330 meters from S130
• Points S100-S131 were surveyed• Poor satellite coverage for S121 & S122 with the Trimble
Hazen Line
2555
2555.5
2556
2556.5
2557
2557.5
2558
2558.5
2559
2559.5
2560
4375500 4376000 4376500 4377000 4377500 4378000 4378500 4379000 4379500
Latitude (UTM)
Bo
ug
ue
r A
no
ma
ly (
mG
al)

Modeling—Bouguer Slab Depths
Where Δg= The computed Ganom value from grav2d
Δρ= -.35
The 0.0419 value is a constant Bouguer Slab Equation
(Telford et. Al.1990)
0419.
gh

Fernley 1 Fernley 1 Anomaly modeling tol=0.5 mGal
-3
-2.5
-2
-1.5
-1
-0.5
0
4381 4381.5 4382 4382.5 4383
UTM Y, km
Gra
vity
, m
Gal
Ganom
Gcalc
Blue lines indicate regional stresses. Red lines indicate shearing within the flower structure

Fernley Line 1
Fernley 1 Depth and Bouguer Slab Depth
0
0.2
0.4
0.6
4381 4381.2 4381.4 4381.6 4381.8 4382 4382.2 4382.4 4382.6 4382.8 4383
UTM Y, km
Mo
de
led
De
pth
, km
Depth
Mag Anomaly
Bouguer Slab Depth

Fernley 2
Fernley 2 anomaly modeling tol= .5 mGal
-4
-3.5
-3
-2.5-2
-1.5
-1
-0.5
0
4379.5 4380 4380.5 4381 4381.5 4382 4382.5 4383 4383.5
Ganom
Gcalc

Fernley 2
Fernley 2 Modeled Depth vs. Bouguer Depth
00.10.20.30.40.50.60.70.8
4379 4380 4381 4382 4383 4384
UTM Y, km
dept
h, k
m Depth
Bouguer Depth
Mag Anomaly

Hazen
Hazen Modeled Anomaly tol=.75 mGal
-6
-5
-4
-3
-2
-1
0
4375 4376 4377 4378 4379
UTM Y, km
Mod
eled
Gra
vity
, mG
al
Gcalc
Ganom

Hazen
Hazen Modeled Depth and Bouguer Slab Depth
0
0.2
0.4
0.6
0.8
1
4375 4376 4377 4378 4379
UTM Y, km
Mo
de
led
De
pth
, km
Depth
Bouguer Depth

The End . . . Questions?


