GRAYS HARBOR RESPONSE CAPACITY ANALYSIS JUNE 30, 2019 Tim Robertson, Sierra Fletcher, Alisha Chartier, and Matthew Trimberger Nuka Research and Planning Group, LLC Submitted to the Washington Department of Ecology Contract # C1900047 Publication 19-08-016
Transcript
GRAYS HARBOR RESPONSE CAPACITY ANALYSIS JUNE 30, 2019
Tim Robertson, Sierra Fletcher, Alisha Chartier, and Matthew Trimberger
Nuka Research and Planning Group, LLC Submitted to the Washington Department of Ecology
Contract # C1900047 Publication 19-08-016
Grays Harbor Oil Spill Response Capacity Analysis
ii
EXECUTIVE SUMMARY The Washington Department of Ecology contracted Nuka Research and Planning Group, LLC to conduct an oil spill response capacity analysis for Grays Harbor, Washington. The purpose of the study is to better understand response capacity for the area if all available resources were deployed for a major oil spill response. The study does not consider all aspects of a response, but instead applies the publicly available Response Options Calculator (ROC) developed by Genwest Systems, Inc. for the National Oceanic and Atmospheric Administration (NOAA, 2012; Genwest Systems, Inc., 2012) to model maximum potential response capacity for a base case spill. Additional scenarios are then modeled in the ROC to answer a series of research questions. The Grays Harbor Safety Committee and other stakeholders provided input to the development of the base case and research questions through workshops held in April and December 2018.
The ROC is a simplified model of an oil spill response. It first models the spread and weathering of a hypothetical oil spill based on the oil type, winds, and water temperature. Then it applies a set of information about a recovery system (the combination of vessels, skimmer, boom, and primary storage used together to recover oil) to determine the maximum potential oil recovery of system when applied to that oil slick. The ROC incorporates the time a system arrives on scene, skimming capacity, type of skimmer, speed of advance, swath width captured by the boom, throughput and recovery efficiencies, decanting (when used), and primary storage volume. Calculations are then made to determine how long the system would need to stop skimming in order to transit to and offload at offload secondary storage, when full, before skimming can begin again. Each scenario in this analysis considers the simultaneous use of multiple recovery systems and presents a maximum potential recovery for the combined response forces from Washington and Oregon that may respond to a major spill in Grays Harbor.
While the ROC provides a more complex way of modeling oil spill recovery than just a reduced pump rate alone (as used in regulations), it does not capture all the complexity of the real world. These other important factors include, but are not limited to, currents, waves or fog, responder availability and training, equipment malfunctions, or other issues that may slow down a response or otherwise reduce oil recovery. In Grays Harbor, the tidal fluctuations and currents would have a very strong impact any actual spill response and will change the recovery tactics used. On-water recovery could be impossible in some places or at some tide stages. It is also a very confined waterway and may be difficult or at times impossible for all the systems analyzed to operate simultaneously. Even as we acknowledge the limitations of the ROC, it can still provide a valuable piece of information to inform response planning along with an understanding of the operating environment and the conditions responders may encounter.
In this study, the base case is a spill of 1.5 million gallons of marine diesel at Terminal 1 in the Port of Grays Harbor. All Marine Spill Response Corporation and National Response Corporation systems assigned to a potential Grays Harbor response are used. The recovery system information and time of arrival was obtained from these organizations based on information
Grays Harbor Oil Spill Response Capacity Analysis
iii
provided to the Department of Ecology. Where additional inputs were needed, both organizations helpfully vetted the inputs related to their systems prior to the analysis.
RESEARCH QUESTIONS
Base Case
1. What is the maximum potential oil recovery for a 1.5 million-gallon diesel spill at Terminal 1?
Spill Context
2. How does changing the location of the spill within Grays Harbor affect maximum potential oil recovery?
3. How does changing the time of day of the spill affect maximum potential oil recovery?
4. How does changing the wind speed affect maximum potential oil recovery?
5. How does changing the amount of daylight affect maximum potential oil recovery?
6. How does changing the water temperature affect maximum potential oil recovery?
7. How do delays in response mobilization or deployment affect maximum potential oil recovery?
8. How does changing the oil type spilled affect maximum potential oil recovery?
9. How does changing the oil type and spill size affect maximum potential oil recovery?
Response Resources
10. How does adding a dedicated response barge to the area affect maximum potential oil recovery?
11. How does changing the response organization used affect maximum potential oil recovery?
12. How does using only protected water response systems affect maximum potential oil recovery?
The base case spill resulted in a maximum potential recovery of 82% during the 48-hour response period based on the ROC model and inputs used. Compared to this, response at different locations resulted in a decrease in maximum potential recovery (see Figure ES-1). This was primarily due to having farther to travel to offload primary storage (and thus more downtime in skimming). Several aspects of the spill context had minimal impact on the results: whether the spill occurred at 7am or noon and whether it occurred during Winter Solstice or Summer Solstice (with the shortest and longest periods of daylight, respectively) had minimal impact. Warmer water meant a slightly reduced maximum potential recovery.
Increasing the wind speed or significantly delaying the response (regardless of reason) had a much greater impact. Winds of 18 knots, which can occur throughout the year, resulted in more
Grays Harbor Oil Spill Response Capacity Analysis
iv
than 30% less maximum potential recovery than the base case. A delay of 24 hours would mean almost 50% less maximum potential recovery than the base case.
Because of the way the ROC shows IFO-380 weathering, changing from biodiesel to this common vessel fuel may result in a slight increase in maximum potential recovery at each of the three locations analyzed. This is due to the fact that this oil will emulsify, thus thickening the slick which increases how much oil is encountered.
The response was modeled with the addition of a hypothetical response barge to the region so that secondary storage would be immediately available at locations throughout Grays Harbor. The availability of secondary storage and the time it takes to travel to and from that storage are important factors in a response: if primary storage fills a system must stop recovery until it can offload collected fluids. In this case, however, there was not a significant gain made as compared to just offloading primary storage at the terminal.
Reducing the response systems used (either to only systems owned by one of the two main response organizations or only systems suited to protected waters) reduced the maximum potential recovery modeled.
The analysis shows that response capacity in Grays Harbor is significant. The success of any response – especially in a tide-dominated environment such as Grays Harbor – will depend on the ability to deploy resources as quickly as possible before the oil spreads or moves with the currents. The training of responders and vessel operators (including vessels of opportunity) in deploying on-water recovery tactics to be as effective as possible in high currents will also be critical. From this analysis, it does not appear that adding a barge to the region would provide a meaningful improvement to the system.
Finally, this analysis used diesel for the base case scenario because sufficient information about biodiesel properties was not available despite the Department of Ecology’s attempts to obtain the necessary laboratory results. Better information about biodiesel – and canola oil - would inform any future analysis of response capacity for the region.
Grays Harbor Oil Spill Response Capacity Analysis
v
Figure ES-1. Maximum potential recovery at 48 hours for spill scenarios modeled in ROC. Scenarios are compared to the base case.
Grays Harbor Oil Spill Response Capacity Analysis
vi
TABLE OF CONTENTS 1 Introduction ....................................................................................................................... 1
1.1 Scope and Approach .................................................................................................... 1 1.2 Stakeholder Input to Study ........................................................................................... 1
3 Methodology .................................................................................................................... 10 3.1 Overview of Approach ................................................................................................ 10 3.2 Use of the Response Options Calculator ...................................................................... 11 3.3 Research Questions ................................................................................................... 13 3.4 Variables and Response Scenarios .............................................................................. 13 3.5 Base Case Inputs Used .............................................................................................. 16
4.1 Oil Weathering .......................................................................................................... 22 4.2 Base Case Results ...................................................................................................... 23 4.3 Answers to Research Questions .................................................................................. 24
4.3.1 Location ........................................................................................................... 26 4.3.2 Time of Day ...................................................................................................... 27 4.3.3 Wind Speed ...................................................................................................... 27 4.3.4 Daylight ............................................................................................................ 30 4.3.5 Water Temperature ........................................................................................... 31 4.3.6 Delays .............................................................................................................. 31 4.3.7 Oil Type and Spill Size ....................................................................................... 32 4.3.8 Response Resources .......................................................................................... 35
5 Findings and Conclusion .................................................................................................... 39 6 References ....................................................................................................................... 41 Appendix A – Stakeholder Comments........................................................................................... 43 Appendix B – Lab Results for Biodiesel Sample ................................ Error! Bookmark not defined. Appendix C – Recovery System Specifications ............................................................................... 48 Appendix D – System Timing (Base Case) .................................................................................... 76
Grays Harbor Oil Spill Response Capacity Analysis
1
1 INTRODUCTION The Washington Department of Ecology contracted Nuka Research and Planning Group, LLC (Nuka Research) to conduct an oil spill response capacity analysis for Grays Harbor. The purpose of the study is to better understand response capacity for the area if all available were resources were deployed for a major oil spill response.
1.1 SCOPE AND APPROACH This analysis estimates the maximum potential on-water oil recovery through a series of modeled scenarios that compare the effect of different factors on recovery under idealized conditions.
Maximum potential on-water recovery is used as a proxy for overall spill response capacity. The protection of shorelines, cleanup of oiled shorelines, and wildlife response are also critical aspects of a spill response that are outside the scope of this study. In the Grays Harbor area, it is assumed that shoreline oiling would be inevitable and likely heavy, due to the significant tides.
This study does not evaluate the likelihood that an oil spill may occur, nor does it consider the consequences of an oil spill. This study is also not a policy or compliance analysis. While information from oil spill contingency planning and planning requirements in Washington was used to inform the analysis, this study does not evaluate any specific policy or regulation. It also does not in any way assess compliance with state or federal requirements.
1.2 STAKEHOLDER INPUT TO STUDY The project was initially formulated and discussed with the Grays Harbor Safety Committee in an April 2018 workshop convened by the Washington Department of Ecology. Following this, Nuka Research was contracted to conduct the analysis. In a December 2018 workshop, the Department of Ecology and Nuka Research met with Harbor Safety Committee members again to review the methodology and gain input on research questions and response scenarios. The three scenario locations, general research questions, and baseline scenario inputs were agreed to at this time. A final meeting was held in June 2019 to present the results and take questions and comments. The report was then distributed to Committee members and other stakeholders for comments on the draft prior to completion at the end of June. Appendix A lists the comments received.
Nuka Research and the Department of Ecology appreciate the time and input of those who participated in the process. We note that their participation does not represent an endorsement of the approach or the results, but that both are no doubt improved by the input received.
Grays Harbor Oil Spill Response Capacity Analysis
2
2 BACKGROUND Grays Harbor is located on Washington’s central coast. Figure 2-1 shows the area as depicted in a National Oceanic and Atmospheric Association (NOAA) chart (18502), which portrays the extensive tidal flats within the harbor area.
Figure 2-1. Grays Harbor, including shipping lane as depicted on NOAA chart
2.1 OPERATING ENVIRONMENT Excerpts from the 2018 Grays Harbor Vessel Traffic Risk Assessment (GHVTRA) (Inset 1) describe the operating environment and vessel traffic there. This is a confined waterway and highly tide-dependent environment.
Grays Harbor Oil Spill Response Capacity Analysis
3
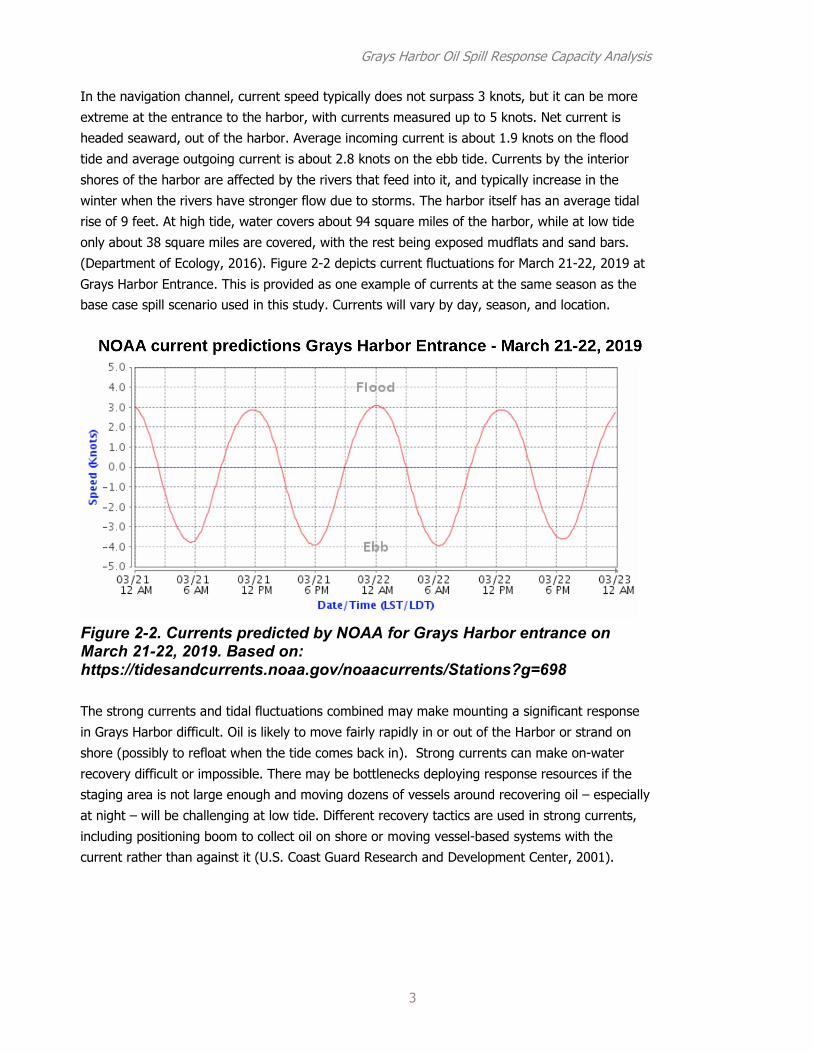
In the navigation channel, current speed typically does not surpass 3 knots, but it can be more extreme at the entrance to the harbor, with currents measured up to 5 knots. Net current is headed seaward, out of the harbor. Average incoming current is about 1.9 knots on the flood tide and average outgoing current is about 2.8 knots on the ebb tide. Currents by the interior shores of the harbor are affected by the rivers that feed into it, and typically increase in the winter when the rivers have stronger flow due to storms. The harbor itself has an average tidal rise of 9 feet. At high tide, water covers about 94 square miles of the harbor, while at low tide only about 38 square miles are covered, with the rest being exposed mudflats and sand bars. (Department of Ecology, 2016). Figure 2-2 depicts current fluctuations for March 21-22, 2019 at Grays Harbor Entrance. This is provided as one example of currents at the same season as the base case spill scenario used in this study. Currents will vary by day, season, and location.
Figure 2-2. Currents predicted by NOAA for Grays Harbor entrance on March 21-22, 2019. Based on: https://tidesandcurrents.noaa.gov/noaacurrents/Stations?g=698
The strong currents and tidal fluctuations combined may make mounting a significant response in Grays Harbor difficult. Oil is likely to move fairly rapidly in or out of the Harbor or strand on shore (possibly to refloat when the tide comes back in). Strong currents can make on-water recovery difficult or impossible. There may be bottlenecks deploying response resources if the staging area is not large enough and moving dozens of vessels around recovering oil – especially at night – will be challenging at low tide. Different recovery tactics are used in strong currents, including positioning boom to collect oil on shore or moving vessel-based systems with the current rather than against it (U.S. Coast Guard Research and Development Center, 2001).
Grays Harbor Oil Spill Response Capacity Analysis
4
As is the case anywhere, on-water recovery may also be impeded by wind, waves, or poor visibility. Fog can make vessel operations unsafe. If aircraft are used to track the oil, both fog and cloud ceiling are limiting.
Grays Harbor Oil Spill Response Capacity Analysis
5
Inset 1 - Description of Grays Harbor Excerpted from Grays Harbor Vessel Traffic R isk Assessment (2018)
The entrance to Grays Harbor is about one mile wide, but shoals extending from the north and the south of the entrance reduce the navigable channel to a width of less than half a mile. The bay comprising Grays Harbor extends east for approximately 15 miles to the mouth of the Chehalis River. The bay is filled with shoals and flats, some of which are bare at low water (NOAA, 2017).
As with other inlets on the California, Oregon, and Washington coasts, there is a bar at the entrance to Grays Harbor. These bars form where rivers and streams empty into the Pacific Ocean, causing the river runoff to slow and deposit sediment.
The tidal current at the bar can reach considerable velocity, especially when an ebb tide is reinforced by river runoff. Dangerous conditions can develop when a swift ebb current meets swells from the Pacific at the relatively shallow bar. The change in water depth and opposing forces of current, swell, and sometimes wind, can cause breaking waves and rough seas. Conditions can change rapidly and without warning. Additionally, the area where the effects of the bar are observed changes with conditions. The true bar at Grays Harbor is considered to be from midway between Buoys 2 and 4 to the south, extending northeast to Buoy 8 (Grays Harbor Safety Committee, 2014).
The average current velocity at the bar is about 1.9 knots on a flood tide and 2.8 knots on an ebb tide, but velocities can reach 5 knots. Currents in the vicinity of the bar are reported to be erratic. The U.S. Coast Guard Captain of the Port may restrict passage or close the bar to navigation based on weather conditions. The Grays Harbor Pilots may also suspend service to commercial vessels (Grays Harbor Safety Committee, 2014).
The Grays Harbor navigation channel is maintained by the U.S. Army Corps of Engineers. Twin jetties to the north and south secure the mouth of the harbor. The deep draft channel is 22 miles long from the Pacific Ocean to the city of Aberdeen. The channel is 1,000 feet wide over the Grays Harbor Bar and 350 feet wide eastward of the bar. (U.S. Army Corps of Engineers, 2018).
References:
Grays Harbor Safety Committee. (2014). Grays Harbor Safety Plan. Revised October 2016. Retrieved from Port of Grays Harbor website: http://www.portofgraysharbor.com/harborsafety/downloads/archive/Harbor-Safety-Plan_Grays-Harbor.pdf
National Oceanic and Atmospheric Administration. (2017). Coast Pilot 7 Pacific Coast: California, Oregon, Washington, Hawaii and Pacific Islands 2017 (49th edition). Retrieved from NOAA Office of Coast Survey website: https://www.nauticalcharts.noaa.gov/publications/coastpilot/index.html
U.S. Army Corps of Engineers. (2018). Grays Harbor navigation. Website. Retrieved on July 5, 2018 from USACE website: http://www.nws.usace.army.mil/Missions/Civil-Works/Navigation/Navigation-Projects/Grays-Harbor/
2.2 VESSEL TRAFFIC In 2017, the Department of Ecology documented 12 tanker transits and 97 cargo or passenger transits through Grays Harbor. (There were no tank barge or Articulated Tug and Barge movements) (Department of Ecology, 2018). The number of tanker transits has fluctuated in recent years. The number of cargo and passenger vessel transits also fluctuates, but has increased (Department of Ecology, 2008-2018). See Figure 2-3.
The only oil1 moved as cargo is non-petroleum biodiesel or canola oil from the Renewable Energy Group (REG) bio-refinery (Renewable Energy Group Inc., 2018) located at Terminal 1 of the Port of Grays Harbor. There is also a methanol and magnesium oxide terminal, as well as shipments of logs and other non-liquid cargoes.
2.3 OIL SPILL FATE AND BEHAVIOR Oil spilled into the marine environment will immediately begin to move with the tide, current, and wind. Oil will also begin to undergo physical and chemical changes through a process known as weathering. Oil movement and weathering will depend on the type of oil spilled and the characteristics of the marine environment at the time.
1 “Oil” under Washington law includes “biological oils and blends” (RCW 88.46.010).
Figure 2-3. Transits of cargo and passenger vessels and tankers in Grays Harbor based on Vessel Entries and Transit data from the Department of Ecology (2008-2018)
Grays Harbor Oil Spill Response Capacity Analysis
7
Spilled oil will:
• Spread horizontally across the water’s surface as the slick thins or is transported by tidal currents or winds,
• Evaporate,
• Disperse within the water column; and
• Submerge either partially or fully (ITOPF, 2012).
Physical and biological processes involved in oil weathering include spreading, evaporation, dispersion, dissolution, emulsification, photo-oxidation, sedimentation, and biodegradation as shown in Figure 2-4.
Oil transport and weathering vary depending on a number of factors, including the type of oil; mixing energy from current, waves, or winds; air and water temperature; and salinity (ITOPF, 2012).
Lighter, refined petroleum-based products such as gasoline, kerosene, or diesel tend to spread rapidly into silver or rainbow sheens, evaporate quickly, and leave minimal residue, if any (EPA, 2014). By contrast, heavier crude oils are more likely to emulsify and become viscous, especially if they contain asphaltenes and resins, eventually coating shorelines and sinking (ITOPF, 2012).
Figure 2-4. Oil weathering processes (NOAA, 2015)
Grays Harbor Oil Spill Response Capacity Analysis
8
2.4 OIL SPILL RESPONSE There are different approaches to oil spill response. This study focuses on the mechanical recovery of oil that is floating on the water, sometimes referred to as free-oil recovery. Mechanical recovery of free-floating oil is considered the preferred method to remove oil from the marine environment. This approach uses oil recovery systems – primarily containment boom, oil skimmers, pumps, hoses, and storage devices – to contain, recover, and store spilled oil. Oil may be contained on the water using different configurations of floating oil boom moved by vessels through the water. There are likewise many different types of skimming devices that recover the oil from the water’s surface (Potter, 2012). Skimmed oil and water (or other debris) are held in primary storage tanks. Once these tanks are full, the recovered fluids must be transferred to secondary storage tanks and the primary storage systems returned to service. These recovered liquids must eventually be transported to a shore-based facility for long-term storage, treatment, and disposal. Adequate storage is critical to on-water mechanical recovery operations. If storage runs out, recovery must cease. Decanting of the excess free water from the fluids recovered is a technique used during large spills to reduce the amount of storage required.
Figure 2-5 shows a generalized example of the process from containment to storage. Not pictured, but equally important, are the parts of the process that include finding or tracking the slick and managing the collected oily waste in accordance with state and federal law.
Mechanical oil spill response relies on being able to access oil floating on the surface of the water. Weathering, as described earlier, may also increase the oil viscosity (thickness) of the oil or emulsification (mixing with water). Both of these processes can also impact mechanical recovery. Oil that reaches shore may become stranded there and is thus no longer available for on-water mechanical recovery tactics. Oil that reaches the shoreline may re-mobilize or
Figure 1-5. Generalized on-water mechanical recovery from containment to storage
Grays Harbor Oil Spill Response Capacity Analysis
9
incorporate shoreline sediments. Re-mobilized oil is more likely to submerge or sink. Oiled shorelines may still be cleaned up, but adverse ecological impacts will occur as a result of the oiling, and the clean-up process can be very lengthy and labor-intense. (Shoreline protection and cleanup were not modeled as part of this study.)
The natural movement and weathering of an oil spill starts immediately after the spill and necessitates immediate response operations if any significant amount of oil is to be efficiently recovered from the surface of the water. There is general consensus among spill response professionals that the best window-of-opportunity for mechanical recovery of oil spills that remain floating is within the first 72 hours after the spill occurs (Dale et al., 2011; Nordvik, 1995). In some circumstances oil may be unrecoverable after just a few hours if it submerges, strands on shore, emulsifies significantly, or is otherwise spread rapidly due to strong wind or currents.
2.5 OIL SPILL RESPONSE PLANNING IN WASHINGTON All tankers and other vessels greater than 300 gross tons transiting Grays Harbor are required to meet both U.S. federal and Washington State oil spill contingency planning requirements. State-approved contingency plans must demonstrate that plan holders have available sufficient equipment to meet regional response planning standards. Planning standards refer both to equipment (boom, skimmers, and storage) and also the time it takes to get it there. Plans may draw on resources from around the state or beyond, but they are region-specific in terms of the assumptions regarding transit times and capacity needed (Department of Ecology, 2019). More information about Department contingency planning requirements as well as oil spill equipment staging locations can be found on the Department’s website.2
2 For an interactive map of spill equipment, see: https://apps.ecology.wa.gov/coastalatlas/storymaps/spills/spills_sm.html?CustomMap=y&BBox=-14262484,5490440,-13182582,6467610&Tab=nt7&Opacity=1&Basemap=esriLightGray. Contingency planning information is at: https://ecology.wa.gov/Regulations-Permits/Plans-policies/Contingency-planning-for-oil-industry
3 METHODOLOGY After ensuring that everyone is safe, the first priorities in an oil spill response are to control the spill at its source and contain and recover oil that has spilled before it reaches the shore or mixes into the water column.
This study used estimated maximum potential on-water recovery of free-oil as proxy for oil spill response system capacity. Maximum potential response capacity is expressed as the total amount of oil and the percentage of the oil spilled that could be recovered from a theoretical spill scenario in the marine environment. This information is obtained by inputting information about response resources and other parameters into a model called the Response Options Calculator (ROC).
Scenarios were modeled to examine the relative impacts of different factors on the estimated maximum potential amount of oil that could be recovered from the water’s surface. This section describes the study methodology.
3.1 OVERVIEW OF APPROACH Marine oil spills are complex phenomena shaped by the amount and type of oil spilled, as well as the environmental conditions at the time of the spill (currents, wind, sea state, temperature, and salinity). Oil spill recovery operations are also complex. Their effectiveness depends on the nature of the spill as noted above, type and capabilities of response equipment, proficiency of the responders, ability to locate and track the oil slick, logistical support to sustain the response, and ability to operate in weather or sea conditions at the time. In order to estimate maximum potential oil spill recovery, a model can be used to calculate the effects of some of the variables mentioned above. Some simplifications must be made in order to reduce the complexity of the system. Even the most intricate models have inherent inaccuracies and are unable to predict real world outcomes. However, a model such as the one used in this study can be useful to understand the relative effect of variables within a complex oil spill event and to estimate the maximum overall potential of a recovery capacity of a set of response systems.
This study applies the ROC, developed by Genwest Systems, Inc. for the National Oceanic and Atmospheric Administration (NOAA, 2012; Genwest Systems, Inc., 2012) to model how on-water oil spill response forces from Washington and Oregon could be applied to various spill scenarios in Grays Harbor, Washington. The ROC estimates the maximum potential oil recovery capacity based on oil properties, specific (and simplified) oil spill response forces, and specified (and simplified) environmental conditions. It allows for consideration of spill timing, seasonality (hours of daylight), simplified environmental conditions (wind speed, water temperature), oil properties, and deployment logistics to estimate maximum potential on-water oil recovery (Mattox et al.,
Grays Harbor Oil Spill Response Capacity Analysis
11
2014; Dale et al., 2011). This study builds on previous work that used the ROC or derivative models to estimate the response capacity of a given system (Nuka Research 2015, 2013, 2012a, 2012b; Genwest Systems, Inc., 2012).
The ROC combines previously developed NOAA models and adds new algorithms for slick spreading to: (1) model oil weathering based on the inputs used and (2) estimate the amount of oil affected by skimming operations (or in-situ burning or dispersant application) (Dale, 2011).
The analysis follows these steps:
1. Develop research questions (see Section 3.3).
2. Develop parameters for hypothetical response scenarios to answer research questions.
3. Define response systems based on response resource inventories and locations.
4. Define model inputs.
5. Model scenarios.
6. Present and interpret results.
Considerations for the use of the ROC are discussed in Section 3.2. Research questions are listed in Section 3.3. The base case against which scenarios are compared to answer research questions is described in Section 3.4.
3.2 USE OF THE RESPONSE OPTIONS CALCULATOR Modeling is necessarily dependent upon a series of assumptions. Assumptions inherent to the ROC are described in the ROC Technical Document (Genwest Systems Inc., 2012). General assumptions include:
• Weather and environmental conditions are conducive to safe response operations.
• Oil is accessible to recovery systems (it remains floating on the water’s surface and does not submerge or strand on shore).
• All equipment listed in inventories is available and operates without malfunction or failure. In addition, permission must be granted by the appropriate authorities to release the equipment from facilities in Washington where it is relied upon for contingency plan compliance, and from Oregon.
• The response proceeds safely, with no disruptions.
• All necessary personnel are adequately trained, proficient in their required skills, and available in a timely manner.
Grays Harbor Oil Spill Response Capacity Analysis
12
• Sufficient personnel are available to sustain operations for each on-water recovery system for 24-hours (for systems capable of night operations), and for all daylight hours (for daylight-only systems).
• All necessary logistical support is available and fully functioning.
• Spill tracking and surveillance is effective and responders are successfully directed to the slick.
• Skimming systems operate in oil slicks of the average thickness of the given oil for the age of the spill.
Figure 3-1 shows graphically how the use of optimistic assumptions leads to a best-case outcome. The real-world outcome will be worse: it will be determined by actual conditions and influenced by factors that are not incorporated in the model and cannot be accounted for.
It is not necessary to use a model to know that due to weather or other factors, it may be the case that no oil is recovered. As the purpose of the study is to understand the relative impacts of different factors or planning decisions on a hypothetical response, the model is most useful when assumptions are generally conducive to at least some oil recovery. While other models or analytical approaches may be used to estimate the likelihood of a spill, the potential for different spill volumes, the consequences of a spill, or the percentage of the time when no response is possible due to environmental conditions, these are outside the scope of this study.
Figure 2-1. Conceptual diagram depicting the influence of optimistic assumptions on ROC outputs (based on Mattox et al., 2014)
Grays Harbor Oil Spill Response Capacity Analysis
13
3.3 RESEARCH QUESTIONS This study models spill scenarios to answer the research questions listed below, which were developed with input from the Washington Department of Ecology and Grays Harbor Safety Committee. The research questions fall into three categories: (1) spill context and (2) response resources used. Section 4 describes the scenarios in more detail. The scenario used for Research Question #1 serves as the base case against which scenarios used to answer the subsequent research questions are compared.
Base Case 1. What is the maximum potential oil recovery for a 1.5 million-gallon diesel spill at Terminal 1? Spill Context 2. How does changing the location of the spill within Grays Harbor affect maximum potential oil recovery?
3. How does changing the time of day of the spill affect maximum potential oil recovery? 4. How does changing the wind speed affect maximum potential oil recovery?
5. How does changing the amount of daylight affect maximum potential oil recovery?
6. How does changing the water temperature affect maximum potential oil recovery? 7. How do delays in response mobilization or deployment affect maximum potential oil recovery?
8. How does changing the oil type spilled affect maximum potential oil recovery? 9. How does changing the oil type and spill size affect maximum potential oil recovery?
Response Resources 10. How does adding a dedicated response barge to the area affect maximum potential oil recovery? 11. How does changing the response organization used affect maximum potential oil recovery?
12. How does using only protected water response systems affect maximum potential oil recovery?
3.4 VARIABLES AND RESPONSE SCENARIOS The following variables were modified to answer the research questions. The inputs for each scenario and associated research question are shown in Table 3-1. These are discussed further in the explanation of the answers to the research questions in Section 4.3.
• Location within Grays Harbor
• Date (applicable to hours of daylight)
• Spill context (oil type, volume, time of day of the spill)
• Wind speed
• Water temperature
• Which response systems are used
• Response delays (regardless of cause)
Grays Harbor Oil Spill Response Capacity Analysis
13
Table 3-1. Research questions and scenarios used for ROC analysis Location Time
of Day
Oil Type
Spill Volume
(gall)
Day /Dark
(season)
Wind Speed (knots)
Water Temp.
(ºF)
Response Forces
Delay (Hours)
Transit Times
w/in GH
BASE CASE Terminal 1 Midnight Diesel 1.5 million Spring
Equinox 25th percentile for March - Bowerman Airport
48 MSRC and NRC
0 0.5
How does changing the location of the spill within Grays Harbor affect maximum potential oil recovery? Top of the Crossover (buoy 32-29)
Midnight Diesel 1.5 million Spring Equinox
25th percentile for March - Westport
48 MSRC and NRC
0 1
Submerged Jetty (response inside Harbor)
Midnight Diesel 1.5 million Spring Equinox
25th percentile for March - Westport
48 MSRC and NRC
0 3
How does changing the time of day of the spill affect maximum potential oil recovery? Terminal 1 First light (7
AM) Diesel 1.5 million Spring
Equinox 25th percentile for March - Bowerman Airport
48 MSRC and NRC
0 0.5
Terminal 1 Noon Diesel 1.5 million Spring Equinox
25th percentile for March - Bowerman Airport
48 MSRC and NRC
0 0.5
How does changing the wind speed affect maximum potential oil recovery? Terminal 1 Midnight Diesel 1.5 million Spring
Equinox 0 (calm) 48 MSRC and
NRC 0 0.5
Terminal 1 Midnight Diesel 1.5 million Spring Equinox
12 48 MSRC and NRC
0 0.5
Terminal 1 Midnight Diesel 1.5 million Spring Equinox
18 48 MSRC and NRC
0 0.5
How does changing the amount of daylight affect maximum potential oil recovery? Terminal 1 Midnight Diesel 1.5 million Winter
Solstice 25th percentile for March - Bowerman Airport
48 MSRC and NRC
0 0.5
Grays Harbor Oil Spill Response Capacity Analysis
14
Location Time of
Day
Oil Type
Spill Volume
(gall)
Day /Dark
(season)
Wind Speed (knots)
Water Temp.
(ºF)
Response Forces
Delay (Hours)
Transit Times
w/in GH
Terminal 1 Midnight Diesel 1.5 million Summer Solstice
25th percentile for March - Bowerman Airport
48 MSRC and NRC
0 0.5
How does changing the water temperature affect maximum potential oil recovery? Terminal 1 Midnight Diesel 1.5 million Spring
Equinox 25th percentile for March - Bowerman Airport
45.8 MSRC and NRC
0 0.5
Terminal 1 Midnight Diesel 1.5 million Spring Equinox
25th percentile for March - Bowerman Airport
57.7 MSRC and NRC
0 0.5
How do delays in response mobilization or deployment affect maximum potential oil recovery? Terminal 1 Midnight Diesel 1.5 million Spring
Equinox 25th percentile for March - Bowerman Airport
48 MSRC and NRC
2 0.5
Terminal 1 Midnight Diesel 1.5 million Spring Equinox
25th percentile for March - Bowerman Airport
48 MSRC and NRC
4 0.5
Terminal 1 Midnight Diesel 1.5 million Spring Equinox
25th percentile for March - Bowerman Airport
48 MSRC and NRC
6 0.5
Terminal 1 Midnight Diesel 1.5 million Spring Equinox
25th percentile for March - Bowerman Airport
48 MSRC and NRC
12 0.5
Terminal 1 Midnight Diesel 1.5 million Spring Equinox
25th percentile for March - Bowerman Airport
48 MSRC and NRC
24 0.5
How does changing the oil type spilled affect maximum potential oil recovery? Terminal 1 Midnight IFO-380 1.5 million Spring
Equinox 25th percentile for March - Bowerman Airport
48 MSRC and NRC
0 0.5
Top of the crossover (buoy 32-29)
Midnight IFO-380 1.5 million Spring Equinox
25th percentile for March - Westport
48 MSRC and NRC
0 1
Grays Harbor Oil Spill Response Capacity Analysis
15
Location Time of
Day
Oil Type
Spill Volume
(gall)
Day /Dark
(season)
Wind Speed (knots)
Water Temp.
(ºF)
Response Forces
Delay (Hours)
Transit Times
w/in GH
Submerged jetty (response inside Harbor)
Midnight IFO-380 1.5 million Spring Equinox
25th percentile for March - Westport
48 MSRC and NRC
0 3
How does changing the oil type and spill size affect maximum potential oil recovery? Terminal 1 Midnight IFO-380 500,000 Spring
Equinox 25th percentile for March - Bowerman Airport
48 MSRC and NRC
0 0.5
Terminal 1 Midnight IFO-380 1 million Spring Equinox
25th percentile for March - Bowerman Airport
48 MSRC and NRC
0 0.5
How does adding a dedicated response barge to the area affect maximum potential oil recovery? Terminal 1 Midnight Diesel Biodiesel Spring
Equinox 25th percentile for March - Bowerman Airport
48 MSRC and NRC
0 0.25
Top of the crossover (buoy 32-29)
Midnight Diesel 1.5 million Spring Equinox
25th percentile for March - Westport
48 MSRC and NRC
0 0.25
Submerged jetty (response inside Harbor)
Midnight Diesel 1.5 million Spring Equinox
25th percentile for March - Westport
48 MSRC and NRC
0 0.25
How does changing the recovery systems used affect the maximum potential oil recovery? Terminal 1 Midnight Diesel 1.5 million Spring
Equinox 25th percentile for March - Bowerman Airport
48 MSRC only 0 0.5
Terminal 1 Midnight Diesel 1.5 million Spring Equinox
25th percentile for March - Bowerman Airport
48 NRC only 0 0.5
Terminal 1 Midnight Diesel 1.5 million Spring Equinox
25th percentile for March - Bowerman Airport
48 Protected Water Only
0 0.5
Grays Harbor Oil Spill Response Capacity Analysis
16
3.5 BASE CASE INPUTS USED This section describes the key inputs used for the base case. Variable inputs used in the scenarios are described with scenario results in the next section.
All the ROC scenarios use an instantaneous spill (as opposed to a continuous release), the same basic response system attributes (e.g., skimming speed, skimmer efficiency, swath width), and the duration of the simulation (48 hours).
3.5.1 LOCATION, OIL TYPE, AND VOLUME
The base case scenario is at Terminal 1 in the Port of Grays Harbor. This is the terminal at which tankers are loaded from the REG facility. It is also assumed that recovery systems could offload at this facility when their primary storage fills.
The base case scenario used a 1.5 million gallon diesel spill. The only oils carried as cargo in Grays Harbor are canola oil and biodiesel processed at the REG facility.
The ROC includes a routine that models the spread and weathering of oil spilled to water. Users may draw from a library of oils with their necessary properties pre-loaded, or enter their own properties for oils that are not already included in the database. Because neither of the non-petroleum oil cargoes in Grays Harbor was already included in the available database, the Department of Ecology sought the necessary details about biodiesel properties both from the producing company and by sending a sample provided by the company for laboratory analysis (see results in Appendix B). However, the lab was unable to conduct the test for necessary high temperature distillate cuts needed to run the oil in ROC. Without this information, weathering in the model did not appear accurate: it estimated that the biodiesel would evaporate more rapidly than diesel. Biodiesel has very few light ends and it not expected to evaporate more rapidly than diesel. To ensure that we did not overestimate the evaporation in our model, for the purpose of this study, a pre-loaded marine diesel fuel already in the ROC was used as a more likely approximation of how biodiesel would spread and weather.
3.5.2 CONDITIONS (DAYLIGHT, WINDS, WATER TEMPERATURE)
The base case spill was assumed to occur during the Spring Equinox, with daylight (including hours of civil twilight) occurring from 6:48 am until 7:59 pm (Edwards Apps, Inc., 2019).
The wind speed used was 6.08 knots. This was the 25th percentile wind speed for spring from Bowerman Airport (meaning that 75% of the time, winds are higher than this and 25% of the time they are lower) based on data collected since 1949. This location was used because of its proximity to the base case spill location and the availability of decades of data from the National Weather Service. Wind speeds are further discussed in Section 4.3.3.
Grays Harbor Oil Spill Response Capacity Analysis
17
Sea surface temperatures were taken from NOAA satellite readings shown in Figure 3-2.3 The base case used the average for March (48 F).
Figure 3-2. Monthly average maximum and minimum surface water temperatures at Aberdeen, WA based on NOAA satellite data (from www.seatemperature.org) 3.5.3 RESPONSE RESOURCES
Response forces are recovery systems consisting of vessels, equipment, and personnel.4 All of the critical components of a recovery system must be in place and operational for the system to function. This analysis uses existing response resources (personnel, vessels, and equipment) based in Washington and Oregon.
Response contractors are required to provide information to the Department of Ecology describing their equipment and other resources. The Department of Ecology provided information from the Marine Spill Response Corporation (MSRC) and National Response Corporation (NRC) about resources that would be deployed in Grays Harbor for use in this analysis. Nuka Research used this information, filling in gaps needed for the analysis where necessary. Both organizations helpfully reviewed the specifications for their systems before the analysis was run.
3 Calculated monthly average minimum and maximum taken from https://www.seatemperature.org/north-america/united-states/aberdeen.htm. Website does not give the date range used for calculating averages. 4 For this analysis, we assume that personnel will be available to mobilize and deploy vessels and equipment.
Tables 3-2 and 3-3 list the response systems according to which organization owns the primary vessel (NRC or MSRC) and location of that vessel. Systems are often assembled from resources in different locations and sometimes different ownership.
The American Society for Testing and Materials established a classification system for oil spill response equipment based on the wave heights in which it can be expected to operate (ASTM, 2000). The systems used in this analysis are all categorized as either Protected Water (waves up to 3 feet with some whitecaps) or Open Water (waves up to 6 feet with frequent whitecaps). The category for each system is shown in Tables 3-2 and 3-3. They also indicate the Effective Daily Recovery Capacity (EDRC)5 and on-board storage volume.
Table 3-2. NRC response systems used in ROC analysis System Name On-Board
Storage (bbl) EDRC Location Waterbody
Classification
Marco/1C #1 268 3588 Seattle, WA Protected water Marco/1C #2 268 3588 Seattle, WA Protected water Lamor/FRV 6 246 6038 Aberdeen, WA Protected water Marco/IC 268 3588 Portland, OR Protected water Marco/I-I 30 3588 St. Helens, OR Protected water Speed Sweep R7 325 128 Seattle, WA Open water Jet 100 662 Portland, WA Open water Speed Sweep R12 438 3017 Port Angeles, WA Open water Cape Flattery 420 2427 Neah Bay, WA Open water Ironwood 238 1440 Astoria, OR Open water OSRV NRC 248 30783 24000 Port Angeles, WA Open water
5 Effective daily recovery capacity (EDRC) is a measure used by both federal regulators and the Department of Ecology to quantify the capability of skimming systems required under regulations. EDRC is a rate, typically expressed in barrels/day, and calculated as 20% of the manufacturer’s nameplate recovery rate for the equipment (Department of Ecology, 2013). EDRC measures how quickly the skimming pumps can take up fluid, with a standard reduction from the manufacturer-named rate to acknowledge losses of efficiency. Reductions in efficiency are not quantified beyond the 20% “derating,” but could result, for example, from the uptake of water or debris in addition to oil, or oil that escapes recovery or containment.
Grays Harbor Oil Spill Response Capacity Analysis
19
Table 3-3. MSRC response systems used in ROC analysis System Name On-Board
Storage (bbl)
EDRC Location Waterbody Classification
30-10 24 3588 Portland, OR Protected water PEREGRINE 28 3588 Everett, WA Protected water SANDPIPER 4 10764 Tacoma, WA Protected water OREGON RESPONDER 4000 10567 Astoria, OR Open water BUSTER #4 (A) 196 0 Neah Bay, WA Open water BUSTER #4 (B) 196 0 Everett, WA Open water BUSTER #4 (C) 196 0 Astoria, OR Open water MINI BARGE A 200 2477 Everett, WA Protected water MINI BARGE B 200 2477 Everett, WA Protected water MINI BARGE C 200 2477 Everett, WA Protected water ARCTIC TERN 276 15840 Neah Bay, WA Open water WC PARK RESPONDER 14000 10567 Port Angeles, WA Open water SHEARWATER 1362 12000 Port Angeles, WA Open water ROYAL TERN 276 6000 Anacortes, WA Open water OSRB 404 40000 0 Astoria, OR Open water OSRB 380 38000 0 Port Angeles, WA Open water
Grays Harbor does not have a dedicated secondary storage barge. Because Grays Harbor also does not have active bunkering (fueling) operations as seen in Puget Sound or the Columbia River, barges-of-opportunity are less likely to be available as secondary storage than in those other locations. Instead, this study assumes that response systems could offload recovered fluids at the REG Terminal or to a barge cascaded from another region. For one scenario, the ROC is used to understand whether maximum potential oil recovery would be changed if a dedicated storage barge was stationed in Grays Harbor and thus available immediately.
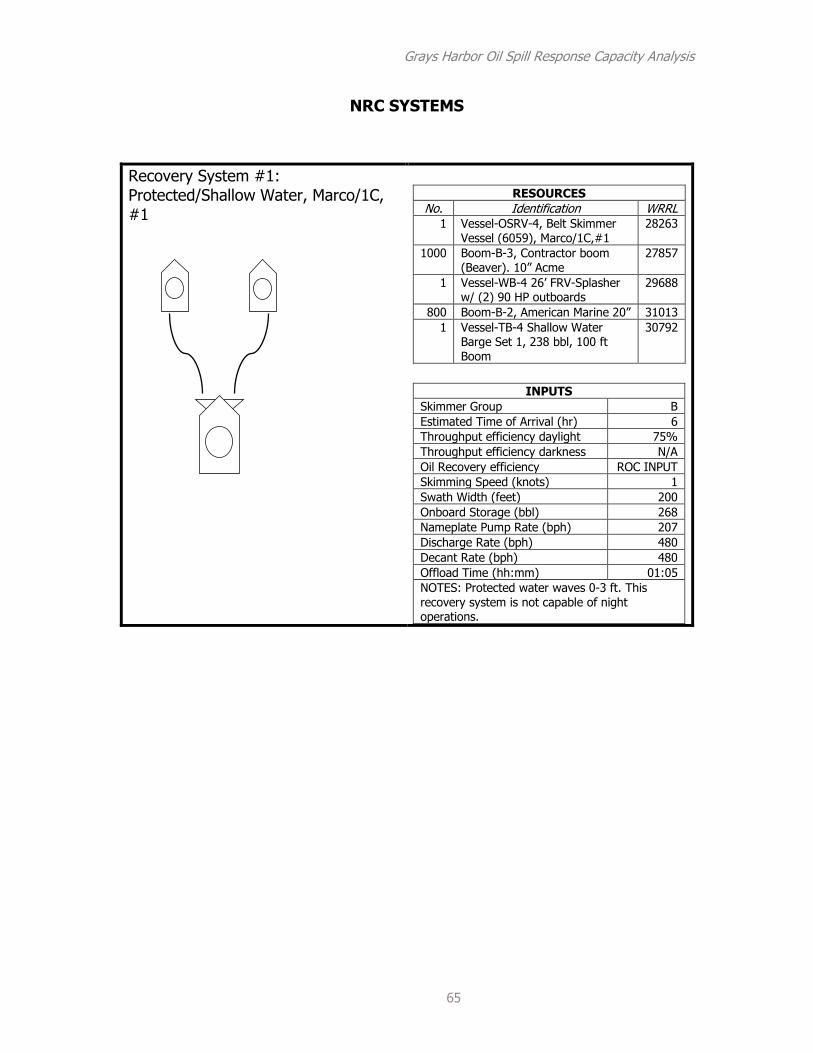
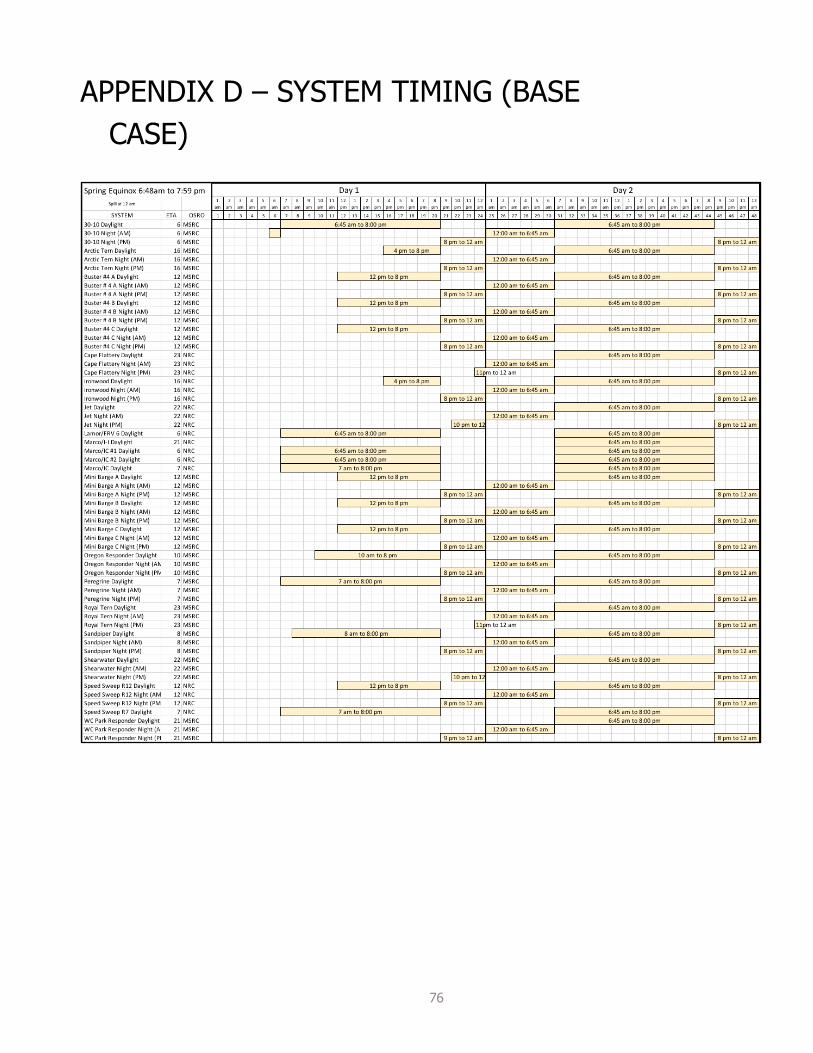
The ROC requires detailed inputs related to the operation and effectiveness of an on-water recovery system in order to estimate how quickly it will recover oil and how much oil (and water) can be recovered before off-loading to secondary storage. Inputs used for each response system analyzed are found in Appendix C. Appendix D shows the timing of each system’s deployment for the base case scenario. While most of the information on systems configurations, above, came from the spreadsheets provided to Ecology (and shared with Nuka Research), the information in Table 3-4, below, is drawn primarily from established assumptions in spill response planning manuals and literature.
Grays Harbor Oil Spill Response Capacity Analysis
20
Table 3-4. Inputs related to response system efficiency in encountering, recovering, and storing oil
FACTOR EXPLANATION VALUES USED Recovery Speed
Advancing speed for on-water response systems (vessels, boom, and skimmers). Speeds vary depending upon the strike team composition based on operating limits of skimming systems. Advancing speeds are important to effective containment of oil; at high speeds, oil will entrain (move under containment boom) and escape recovery.
0.65 knots for J-boom containment systems 1.0 knot for belt-type recovery systems with gated U-boom 2.5 knots for Enhanced Recovery (e.g., Current Buster) containment systems (Based on the ROC Technical Manual according to skimmer type)
Swath Width Swath width is the width of the area within the containment boom along which floating oil is swept. Swath widths vary depending upon the strike team configuration and the environmental conditions.6 Maintaining larger swaths becomes more difficult as wind, waves, and currents increase. For every foot of swath width, it is industry standard that three feet of containment boom are required.
Boom length is based on system specs. Swath width is (1/3) of entire combined boom length
Throughput Efficiency
Throughput efficiency is the proportion of the oil encountered that is recovered. Containment systems do not typically recover 100% of oil that could in theory encountered by a booming system due to a variety of limitations, the most significant being moving through the thickest portion of the slick and loss of contained oil through entrainment (loss of oil below the boom). When tracking and observation fail (such as at night), this is exacerbated by failure to effectively target oil, which results in increasingly sweeping thin, patchy oil or missing the slicks entirely.
75% daylight 35% when oil recovery occurs during darkness
Decant Efficiency
On-water skimming recovers a mix of oil and water. Some of the water collected will be emulsified with oil, and some will remain as free water. Free water may be removed from storage tanks and returned to the sea in process known as decanting. Decanting reduces the total volume of recovered fluids that must be stored. The decant efficiency is the percentage of recovered free water that is separated out from the total recovery volume.
Decanting efficiency will allow for removal of 80% of the free water recovered. Decanting of the relatively uncontaminated recovered water will not be allowed for drogues, bladders, or primary storage devices of less than 10,000 gallons. Unless otherwise specified, decanting rate is assumed to be 440 gal/minute.
Offload Time Offload time is the amount of time that strike teams must spend offloading recovered fluids from primary to secondary storage. During offloading, the strike team cannot actively recover oil.
Offload times are calculated from given values in the system specs. Onboard storage divided by discharge rate plus 30 minutes
Transit to-and-from Offloading
Transit time is the time required for a vessel to transit from the recovery site to an offload location. A 5-knot speed is assumed in this study.
Base case is 30 min, Top of the Crossover is 1hr, Submerged Jetty 3hrs. Based on 5 knot speed, though actual speeds would vary.
Recovery Efficiency
Recovery efficiency is the percentage of oil recovered relative to the total volume of fluids recovered. It varies by skimmer type, environmental conditions, and operator proficiency.
Calculated by the ROC based on skimmer type, wind speed, and oil viscosity. (ROC nominal default)
6 Based on standard oil spill response tactics guides.
Grays Harbor Oil Spill Response Capacity Analysis
21
3.6 LIMITATIONS The ROC is a useful tool because it allows for a more nuanced understanding of spill response capacity than just looking at equipment inventories or pump rates and provides an accessible way to explore the potential effects of some variables on a response. However, as with any model, the ROC’s limitations must be understood. These include the fact that it does not:
• Incorporate location-specific currents, tides, water depth/shoreline, salinity, particulates, debris, or other features which may impact oil slick spread and weathering or response operations.
• Model oil submergence or the impact of wind direction or sea state on slick behavior.
• Allow for variations in wind speed or water temperature during the modeled scenarios. (These are input at the start of the scenario. Different scenarios can be run with different wind speed or water temperature but these variables do not change during a single scenario.)
• Model all aspects of a response, such as the ability to track oil in daylight or darkness (though only systems equipped for operations in darkness are assumed to operate at night), responder skill level, or the impact of conditions such as poor visibility on a response.
In short, the ROC is not intended to predict what will happen in any given location or spill situation. It is an analytical tool to provide a simplified model of a response and thus afford the opportunity to examine the impact of a limited set of environmental conditions or response planning decisions on maximum potential response capacity.
Grays Harbor Oil Spill Response Capacity Analysis
22
4 RESULTS This section describes the results and underlying drivers of the way scenario results vary from the base case. First, oil weathering for the base case is described. Then the base case results are explained. A comparison of the results for each scenario are presented. Explanations are provided for the variation in modeled results.
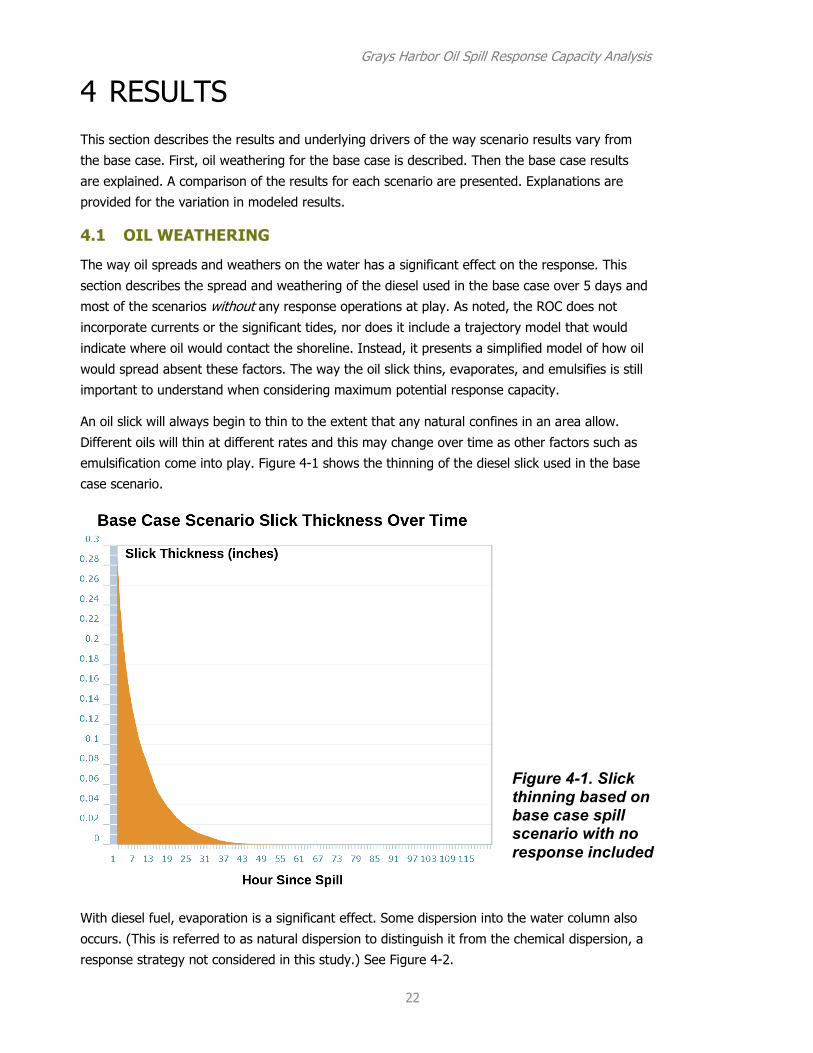
4.1 OIL WEATHERING The way oil spreads and weathers on the water has a significant effect on the response. This section describes the spread and weathering of the diesel used in the base case over 5 days and most of the scenarios without any response operations at play. As noted, the ROC does not incorporate currents or the significant tides, nor does it include a trajectory model that would indicate where oil would contact the shoreline. Instead, it presents a simplified model of how oil would spread absent these factors. The way the oil slick thins, evaporates, and emulsifies is still important to understand when considering maximum potential response capacity.
An oil slick will always begin to thin to the extent that any natural confines in an area allow. Different oils will thin at different rates and this may change over time as other factors such as emulsification come into play. Figure 4-1 shows the thinning of the diesel slick used in the base case scenario.
With diesel fuel, evaporation is a significant effect. Some dispersion into the water column also occurs. (This is referred to as natural dispersion to distinguish it from the chemical dispersion, a response strategy not considered in this study.) See Figure 4-2.
Figure 4-1. Slick thinning based on base case spill scenario with no response included
Grays Harbor Oil Spill Response Capacity Analysis
23
Figure 4-2. Modeled natural dispersion and evaporation based on base case spill scenario with no response included
4.2 BASE CASE RESULTS The base case scenario was a 1.5 million-gallon diesel spill at the Terminal 1 during the Spring Equinox. At 24 hours after the spill, the maximum potential recovery estimate was 47%. It reached 82% by 48 hours.
Figure 4-3 shows the estimated maximum volume recovered, along with the volumes evaporated, naturally dispersed, and remaining on the water at the end of 48 hours. Even as the slick thins and becomes harder to collect, maximum potential recovery ramps up as more systems come on-scene. The volume remaining on the water at the end of scenario ultimately thins to an unrecoverable amount.
Grays Harbor Oil Spill Response Capacity Analysis
24
4.3 ANSWERS TO RESEARCH QUESTIONS This section answers each research question using the ROC results from the scenarios applied to that question. It also discusses the inputs used for each scenario.
The following two figures show the maximum potential percent of the spill recovered in each of the scenarios as compared to the base case. The scenarios show the maximum potential percent recovered at 24 hours and 48 hours. As noted, the currents also likely mean that by the end of 48 hours, if not well before, most of the oil will have stranded on shore or left Grays Harbor.
Figure 4-3. Mass balance for base case showing the maximum potential oil recovery, estimated natural dispersion, estimated evaporation, and estimated amount remaining on water over the first 48 hours f ll i th ill
Grays Harbor Oil Spill Response Capacity Analysis
25
Figure 4-4. Maximum potential recovery for scenarios relative to the base case – at 24 hours
Figure 4-5. Maximum potential recovery for scenarios relative to the base case – at 48 hours
Grays Harbor Oil Spill Response Capacity Analysis
26
4.3.1 LOCATION
How does changing the location of the spill w ithin Grays Harbor affect maximum potential oil recovery?
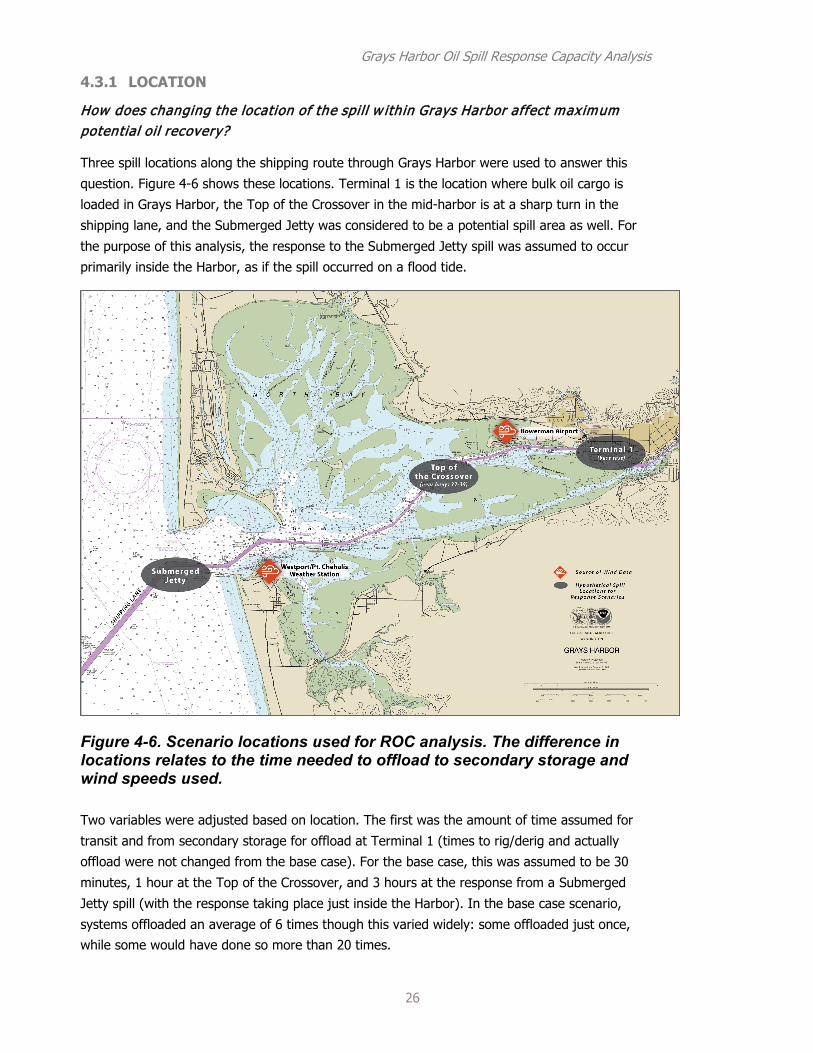
Three spill locations along the shipping route through Grays Harbor were used to answer this question. Figure 4-6 shows these locations. Terminal 1 is the location where bulk oil cargo is loaded in Grays Harbor, the Top of the Crossover in the mid-harbor is at a sharp turn in the shipping lane, and the Submerged Jetty was considered to be a potential spill area as well. For the purpose of this analysis, the response to the Submerged Jetty spill was assumed to occur primarily inside the Harbor, as if the spill occurred on a flood tide.
Figure 4-6. Scenario locations used for ROC analysis. The difference in locations relates to the time needed to offload to secondary storage and wind speeds used.
Two variables were adjusted based on location. The first was the amount of time assumed for transit and from secondary storage for offload at Terminal 1 (times to rig/derig and actually offload were not changed from the base case). For the base case, this was assumed to be 30 minutes, 1 hour at the Top of the Crossover, and 3 hours at the response from a Submerged Jetty spill (with the response taking place just inside the Harbor). In the base case scenario, systems offloaded an average of 6 times though this varied widely: some offloaded just once, while some would have done so more than 20 times.
Grays Harbor Oil Spill Response Capacity Analysis
27
The second variable was wind speed. At the terminal, the 25th percentile wind speed for spring from Bowerman Airport was used (meaning that 75% of the time, winds are higher than this and 25% of the time they are lower). This was a value of 6.08 knots. The other two locations used the 25th percentile wind speed from a land station in Westport, farther to the west near the mouth of Grays Harbor. This was a value of 7.15 knots. The locations of the weather stations used are shown in the map above. The effect of wind on the response is explored more thoroughly in Section 4.3.3.
Table 4-1. Maximum potential spill recovery at the REG Terminal, Top of the Crossover, and Submerged Jetty for 24 and 48 hours following the spill
4.3.2 TIME OF DAY
How does changing the time of day of the spill affect maximum potential oil recovery?
The results show that changing the time of day of the spill does not have a significant impact on maximum potential recovery, at least during the Spring Equinox used in the base case.
Table 4-2. Maximum potential spill recovery for spills at midnight, 7am, and 12 noon for 24 and 48 hours following the spill
4.3.3 WIND SPEED
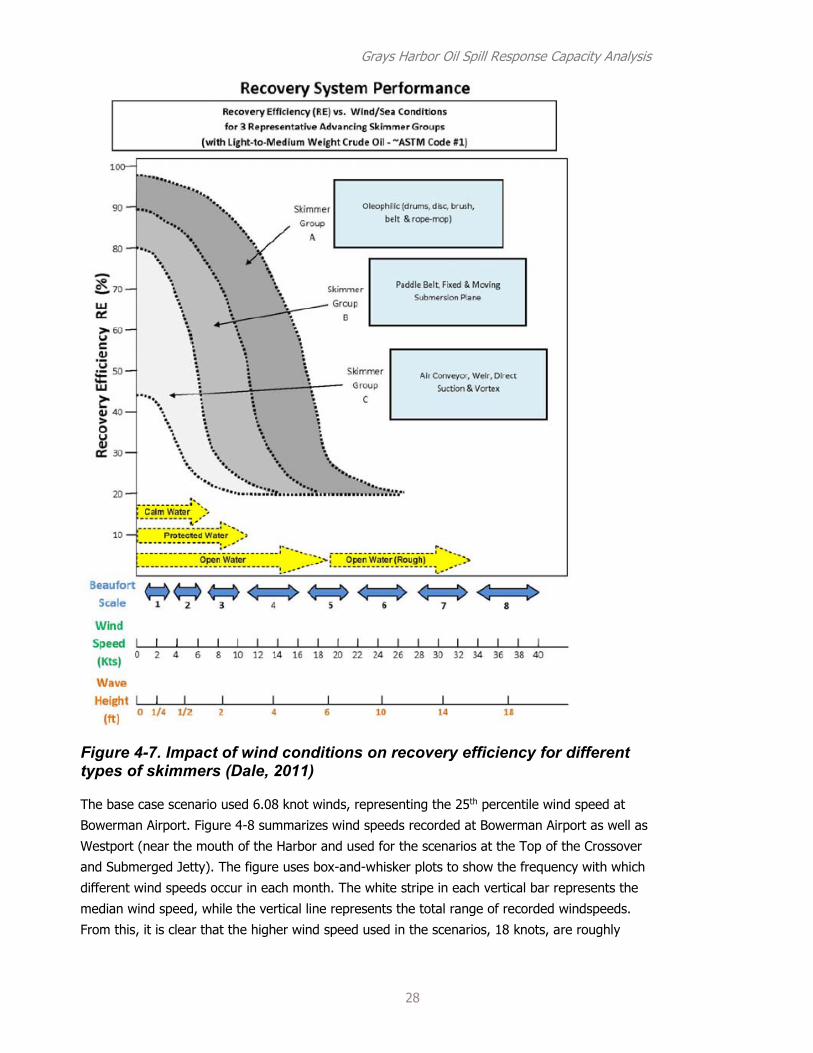
How does changing the w ind speed affect maximum potential oil recovery? Of the environmental conditions considered, the variation in wind speed had the greatest impact. Higher winds reduce the maximum potential volume of oil recovered because the slick spreads more quickly. Wind also affects skimming, though the effect is different for different types of skimmers as shown in Figure 4-7 from the ROC manual (Dale, 2011).
Parameter Transit Time to Secondary Storage Offload
Winds Maximum Potential Recovery (%)
24-hr 48-hr Terminal 1 (base
case) 30 minutes 25th percentile for Bowerman
(6.08 knots) 47 82
Top of the Crossover
1 hour 25th percentile at Westport (7.15 knots)
40 77
Submerged Jetty 3 hours 25th percentile at Westport (7.15 knots)
Figure 4-7. Impact of wind conditions on recovery efficiency for different types of skimmers (Dale, 2011)
The base case scenario used 6.08 knot winds, representing the 25th percentile wind speed at Bowerman Airport. Figure 4-8 summarizes wind speeds recorded at Bowerman Airport as well as Westport (near the mouth of the Harbor and used for the scenarios at the Top of the Crossover and Submerged Jetty). The figure uses box-and-whisker plots to show the frequency with which different wind speeds occur in each month. The white stripe in each vertical bar represents the median wind speed, while the vertical line represents the total range of recorded windspeeds. From this, it is clear that the higher wind speed used in the scenarios, 18 knots, are roughly
Grays Harbor Oil Spill Response Capacity Analysis
29
within the 75th percentile of wind speeds at both locations in the winter months. They are less likely in the summer.
Figure 4-8. Wind speeds for Bowerman Airport (left) and Westport (right). Wind speeds based on National Weather Service data from airport (April 1949-October 2018) and National Data Buoy Center for land-station at Westport (2008-September 2018).
Table 4-3 and Figure 4-9 present the impact of wind conditions on model results. While the difference between 0-6 knots was fairly minimal, winds of 12 knots had a greater impact on maximum potential recovery.
Table 4-3. Maximum potential spill recovery at 24 and 48 hours for different wind speeds
Parameter Maximum Potential Recovery (%) 24-hr 48-hr
0 knots 49 85 6.08 knots (base case) 47 82
12 knots 32 62 18 knots 24 49
Grays Harbor Oil Spill Response Capacity Analysis
30
Figure 4-9. Comparison of maximum potential recovery over 48 hours with different wind speeds
4.3.4 DAYLIGHT
How does changing the amount of daylight affect max imum potential oil recovery? Because recovery efficiencies are different during daylight and darkness, maximum potential recovery estimates are reduced during the winter solstice as compared to the Spring Equinox (base case) or Summer Solstice when daylight is longer. This effect occurs even though many of the systems analyzed in this study are assumed to conduct nighttime recovery operations, though would be much greater if night time operations were not possible. That said, the impact of hours of daylight on recovery operations is less pronounced than other factors, such as wind speed, with less than 10% difference between estimated maximum potential recovery percentages at the Winter Solstice compared to the Summer Solstice.
Table 4-4. Maximum potential spill recovery at 24 and 48 hours for different seasons (daylight/darkness only)
Parameter Notes Maximum Potential Recovery (%) 24-hr 48-hr Spring Equinox (base case) Equal amounts daylight/darkness 47 82
How does changing the water temperature affect max imum potential oil recovery? Colder waters slow slick spreading somewhat, allowing for slightly higher maximum potential recovery estimates when the water is colder, though the effect is minimal across the range of water temperatures analyzed. According to the data used (see Section 3.2), sea surface temperature in December (Winter Solstice) is less than in March (Spring Equinox used for base case), so the slight reduction in maximum potential recovery caused by the shorter days (Section 4.3.4) is offset by colder waters in December.
Table 4-5 shows the results for each of the scenarios related to this research question.
Table 4-5. Maximum potential spill recovery at 24 and 48 hours for different water temperatures
4.3.6 DELAYS
How do delays in response mobilization or deployment affect maximum potential oil recovery?
A response may be delayed by bad weather or planning failures (e.g., inadequate equipment or personnel). Because oil immediately begins to spread and weather when spilled on water, delays mean less oil will be recovered. In the scenarios modeled, even with a 24-hour delay all the recoverable oil would be collected according to model results. However, there is a significant difference from the base case in the maximum potential percentage recovered at 24 hours (two tidal cycles from the spill) and 48 hours (four tidal cycles) as shown in Table 4-6.
Table 4-6. Maximum potential spill recovery for spills with delays due to weather or planning for 24 and 48 hours following the spill
Figure 4-10 shows the mass balance for a scenario with a 2-hour response delay and a 24-hour delay, depicting the change in maximum potential recovery in the earlier hours of the spill and the impact on the maximum potential recovery by 48 hours.
Parameter Notes Maximum Potential Recovery (%) 24-hr 48-hr 48 F (base case) Monthly average for March
47 82
45.8 F Monthly average minimum recorded 48 83 57.7 F Monthly average maximum recorded 46 78
Parameter Maximum Potential Recovery (%) 24-hr 48-hr Base case 47 82 2-hr delay 37 79 4-hr delay 31 78 6-hr delay 27 75
12-hr delay 5 65 24-hr delay 2 33
Grays Harbor Oil Spill Response Capacity Analysis
32
Figure 4-10. Comparison of maximum potential oil recovery for base case and scenarios with response delayed up to 24 hours
4.3.7 OIL TYPE AND SPILL SIZE
Two research questions focused on the use of a different oil type. The base case uses diesel, as discussed previously. IFO-380 is a fuel commonly used by large commercial vessels. The first research question below explores the difference in maximum spill recovery potential with IFO-380 compared to diesel. The second also considers spill volume: because IFO-380 is carried only in vessel fuel tanks in Grays Harbor and not as cargo (in larger quantities), two smaller spill sizes were used.
How does changing the oil type spilled affect maximum potential oil recovery?
As shown in Figure 4-11, diesel evaporates much more quickly than IFO-380. At the same time, both oils will result in a slick that is about the same thickness until around hour 25 (Figure 4-12). After this, the IFO-380 begins to emulsify and thicken the slick. Although this emulsified slick includes water mixed with oil, it still thickens the slick and so increases recovery efficiency after the first 24 hours. This results in a higher maximum potential percentage of slick recovered for an IFO-380 spill at hour 48 compared to diesel.
Grays Harbor Oil Spill Response Capacity Analysis
33
Figure 4-11. Comparison of evaporation over 120 hours (5 days) for diesel and IFO-380 (assuming no response)
Figure 4-12. Comparison of slick thickness over 120 hours (5 days) for diesel and IFO-380 (assuming no response)
All else being equal, more IFO-380 may be recovered than diesel because of the way the two products spread and weather on water. This effect was evident, if very slight, at all three locations. See Table 4-7 and Figures 4-13 and 4-14.
Grays Harbor Oil Spill Response Capacity Analysis
34
Table 4-7. Maximum percent of spill potentially recovered at 24 and 48 hours for spills of IFO-380 compared to diesel at the three spill scenario locations
Figure 4-13. Maximum potential recovery at 24 hours for diesel and IFO-380 spills at each location
Parameter Maximum Potential Recovery (%)
24-hr 48-hr REG Terminal (base case)
Diesel (base case) 47 82 IFO-380 48 89
Top of the Crossover Diesel 40 77
IFO-380 40 82 Submerged Jetty
Diesel 31 72 IFO-380 32 73
Grays Harbor Oil Spill Response Capacity Analysis
35
Figure 4-14. Maximum potential recovery at 48 hours for diesel and IFO-380 spills at each location
How does changing the oil type and spill size affect maximum potential oil recovery?
IFO-380 scenarios were also modeled for 500,000 bbl and 1 million bbl in contrast to the 1.5 million spill used for the base case. The maximum potential percentage recovered is therefore higher since the recovery systems and other inputs are the same, but the spills are smaller. The increase in maximum potential volume recovered was minimal.
4.3.8 RESPONSE RESOURCES
Three research questions addressed response forces directly: the impact of adding a hypothetical storage barge to the area, the use of only one of the two main response contractors, and the use of only those resources suited to protected waters.
How does adding a dedicated response barge to the area affect maximum potential oil recovery?
Secondary storage is a critical component of on-water mechanical oil recovery. If systems do not have a place to offload their primary storage (either on board a vessel or a small storage device towed with the vessel), then recovery must stop until a system can be offloaded. Having secondary storage available when needed is a critical element of maximizing response capacity.
The base case scenario assumed primary storage would be off-loaded at Terminal 1, with a transit time from spill to the terminal 30 min each way (base-case). Offload time is based on primary storage tank size and the offload pump rate plus 30 min to rig/derig the offload set-up.
Grays Harbor Oil Spill Response Capacity Analysis
36
Transit time from the Top of the Crossover is 1 hour and from the Submerged Jetty is 3 hours, as noted in the location-focused scenarios.
With a response barge added, there was a slight increase in maximum potential recovery due to reduced transit times to offload. The impact was greater at the Submerged Jetty, which is farther from the Terminal, than at the base case spill site (at Terminal 1) or Top of the Crossover. These results are shown in Table 4-8 and Figures 4-15 and 4-16. The impact was also greater in the first 24 hours; the effect lessened by Hour 48.
Table 4-8. Maximum percent of spill potentially recovered at 24 and 48 hours for spills with and without an additional dedicated secondary storage barge at Terminal 1 (base case), Top of the Crossover, and Submerged Jetty
Parameter Maximum Potential Recovery (%) 24-hr 48-hr REG Terminal (base case) Current response forces (base case) 47 82
Barge added 50 83 Top of the Crossover Current response forces (base case) 40 77
Figure 4-14. Maximum potential recovery at 24 hours with and without the addition of a hypothetical response barge at each location
Figure 4-15. Maximum potential recovery at 48 hours with and without the addition of a hypothetical response barge at each location
How does changing the response organization used affect maximum potential oil recovery?
This study contemplates a response with both MSRC and NRC involved from the start because it is considering overall maximum potential response capacity for the region. However, companies are only required to have a contract with one contractor. Using only one organization’s resources will reduce the overall maximum potential response capacity because there will be fewer resources recovering oil. The maximum potential percentage of the spill recovered with only NRC resources (14% at 24 hours and 31% at 48 hours) is less than the maximum potential capacity with MSRC resources (36% at 24 hours and 75% at 48 hours). The reason for this is that MSRC has more large systems with a higher maximum potential recovery capacity than the NRC systems.
Table 4-9 shows the estimated time on-scene, hours recovering oil (accounting for time to offload), and estimated oil recovery for each system based on the base case scenario results. Results would be different with a different oil or other assumptions.
Grays Harbor Oil Spill Response Capacity Analysis
38
Table 4-9. Estimated maximum potential recovery by individual system for base case scenario, including estimated time of arrival (hour since the spill), response organization, time collecting, and maximum potential oil recovered.
Name Estimated Time of Arrival
Response Org. Time Collecting (hrs)
Maximum Potential Oil Recovered (bbl)
Waterbody Classification
Oregon Responder 10 MSRC 30.83 5893 Open water Shearwater 22 MSRC 26.00 2415 Open water
WC Park Responder 21 MSRC 27.00 2187 Open water Buster # 4 B 12 MSRC 29.00 2147 Open water Buster #4 C 12 MSRC 29.00 2147 Open water
Buster # 4 A 12 MSRC 30.75 1951 Open water Arctic Tern 16 MSRC 23.85 1092 Open water Royal Tern 23 MSRC 21.33 858 Open water
Mini Barge B 12 MSRC 25.28 732 Protected water Mini Barge A 12 MSRC 26.50 717 Protected water Mini Barge C 12 MSRC 26.50 717 Protected water
Peregrine 7 MSRC 10.86 561 Protected water 30-10 6 MSRC 13.21 422 Protected water
Sandpiper 8 MSRC 4.20 92 Protected water Marco/I-I 21 NRC 20.75 1520 Protected water
Marco/IC #1 6 NRC 20.75 1520 Protected water Marco/IC 7 NRC 21.98 1467 Protected water
Lamor/FRV 6 6 NRC 27.00 921 Protected water Speed Sweep R12 12 NRC 32.50 622 Open water
Ironwood 16 NRC 29.33 524 Open water Jet 22 NRC 19.95 522 Open water
Speed Sweep R7 7 NRC 30.50 360 Open water Marco/IC #2 6 NRC 7.69 207 Protected water
Cape Flattery 23 NRC 25.00 140 Open water
How does using only protected water systems affect maximum potential oil recovery?
Eleven of the 27 systems studied are Protected Water systems (as shown in Table 4-9). They tend to be smaller in size, including skimming capacity but also vessel draft. While there may be times when waves are too great for these systems, in a place like Grays Harbor they are also more likely to be able to maneuver as needed to follow the slick in a wider range of tide conditions than the larger systems which require deeper water. Using only Protected Water systems in the ROC yields results similar to using only NRC systems, with a maximum potential oil recovery of: 17% at 24 hours and 33% at 48 hours.
Grays Harbor Oil Spill Response Capacity Analysis
39
5 FINDINGS AND CONCLUSION Nuka Research provides the following overall findings related to the analysis and project:
• A better understanding of biodiesel and canola is needed. This study used diesel as a proxy for biodiesel because the necessary oil properties for biodiesel were not available, but studies of recovery of biodiesel in Grays Harbor or other places it is transported would benefit from having the correct specifications to inform the modeling of weathering and recovery.
• The impact of seasonal variations in daylight and water temperature on response are not significant. Winds, which vary seasonally but could reach 25 knots more any time of year, likely matter much more.
• Adding a response barge for immediate availability of secondary storage does not have a significant impact on maximum potential recovery. Transit times are not long enough from the spill locations analyzed to offloading at the terminal for a barge to make much difference in reducing skimming downtime.
The analysis indicates that if all the response systems are deployed on the timeline indicated in the planning documents under the favorable conditions studied, there is sufficient response capacity to recover more than 80% of a 1.5-million gallon diesel spill in Grays Harbor. This is a very large percentage when compared to actual performance in real spill situations. By contrast, a review of past spills by ITOPF, an industry association, finds that it is rare for more than 10% of spilled oil to be recovered directly from the sea surface (Wadsworth, 1995). This is supported by subsequent estimates of 7-8% oil recovery through skimming in the 1989 Exxon Valdez oil spill in Alaska (Skinner, 1989) and 3% in the 2010 Deepwater Horizon spill in the Gulf of Mexico (Kerr, 2010).
We suggest that future efforts should focus on validating the timing and assumptions that were inherent in the base case scenario rather than requiring more equipment. Of the factors studied, a delay in the timing of the response was demonstrated to have the most impact in maximum potential oil recovery. A delay of only a few hours can have significant impacts on oil recovery, so it is important to validate that this can be done in the time indicated in the scenarios. While this study did not analyze the following areas, we offer three potential areas to consider for further validation:
• Mobilization and Staging: The process of mobilization and staging necessary to get response forces deployed and operational is necessary to the successful timing of the response. Most of the response systems will be transported by road and launched from Grays Harbor. Ensuring that all these systems can be offloaded and launched in the timeline indicated will therefore be crucial.
Grays Harbor Oil Spill Response Capacity Analysis
40
• Responders: Twenty-five response systems will require a large number of trained responders. Even the day-light only systems will require two shifts of crew due to the long operational periods (17 hours of daylight in the base case scenario in this analysis). There can be no learning on the job or delays in arrival on-scene with all necessary gear. Responders must be experienced in operating the equipment which they are assigned including in a potentially high current environment.
• Offload to Secondary Storage: The analysis assumed that there would be no delays associated with waiting to offload recovered oil to secondary storage, but with 25 active skimming systems there will have to be multiple simultaneous offloads underway.
Response capacity with all systems involved is significant relative to the spill modeled. However, the actual window for recovery is likely very short due to the strong currents and tides. Even without accounting for these local factors, delays had the greatest effect of the variables used in the analysis. Acquiring new equipment is unlikely to make a significant difference; instead, any efforts to improve recovery in Grays Harbor should focus on ensuring that the resources which are available can be deployed as quickly as possible and training in fast current recovery operations.
Grays Harbor Oil Spill Response Capacity Analysis
41
6 REFERENCES ASTM. (2004). Standard practice for classifying water bodies for spill control systems. F-625-94
Dale, D. (2011). Response options calculator (ROC) users guide. Edmonds, WA: Genwest Systems, Inc. Retrieved from: http://www.genwest.com/ROC_User%20Guide.pdf
Dale, D., Allen, A., & Broje, V. (2011). The response options calculator (ROC). International Oil Spill Conference Proceedings, Issue 1 March 2011 pp. abs 179. Retrieved from: http://ioscproceedings.org/doi/pdf/10.7901/2169-3358-2011-1-179
Department of Ecology, State of Washington. Contingency Plans. (2019). Accessed June 10. Retrieved from: https://ecology.wa.gov/Regulations-Permits/Plans-policies/Contingency-planning-for-oil-industry/Spills-planning-standards
Department of Ecology, State of Washington. (2018). Grays Harbor Vessel Traffic Risk Assessment (GHVTRA). Publication Number: 18-08-017. Olympia, WA. Retrieved From: https://apps.ecology.wa.gov/publications/documents/1808017.pdf
Department of Ecology, State of Washington, & Hoquiam, City of. (2016). Westway Expansion Project: Final Environmental Impact Statement. Publication Number: 17-06-012. Hoquiam, WA. Retrieved From: https://apps.ecology.wa.gov/publications/documents/1706012.pdf
Department of Ecology, State of Washington. (2008-2018). Vessel Entries and Transits for Washington Waters. Olympia, WA.
Environmental Protection Agency (EPA). (2014). The fate of spilled oil. Retrieved from: http://www.epa.gov/emergencies/content/learning/oilfate.htm
Genwest Systems, Inc. (2012). Response options calculator (ROC). Online tool and technical manuals. Retrieved from: http://www.genwest.com/roc
International Tanker Owners Pollution Federation Limited (ITOPF). (2012). Fate of marine oil spills technical information paper. London, United Kingdom. Retrieved from: http://www.itopf.com/fileadmin/data/Documents/TIPS%20TAPS/TIP2FateofMarineOilSpills.pdf
Kerr, Richard A. (2010). "A Lot of Oil on the Loose, Not So Much to Be Found". Science. 329 (5993): 734–5. Retrieved from: https://school.judsonisd.org/webpages/ameeks/files/Science%20Around%20the%20World%208-16-2010.pdf
Mattox, A., DeCola, E., & Robertson, T. (2014). Estimating mechanical oil recovery with the response options calculator. International Oil Spill Conference Proceedings, Issue 1 May 2014, 1759-1771. Retrieved from: http://ioscproceedings.org/doi/abs/10.7901/2169-3358-2014.1.1759
National Oceanic and Atmospheric Administration (NOAA). (2015). Oil types. Retrieved from: http://response.restoration.noaa.gov/oil-and-chemical-spills/oil-spills/oil-types.html
National Oceanic and Atmospheric Administration (NOAA). (2012). Automated data inquiry for oil spills (ADIOS) tool. Retrieved from: http://response.restoration.noaa.gov/oil-and-chemical-spills/response-tools/adios.html
Nordvik, A. (1995). The technology windows-of-opportunity for marine oil spill response as related to oil weathering and operations. Spill Science & Technology Bulletin, Vol. 2, No. 1, 17-46. Retrieved from: http://www.sciencedirect.com/science/article/pii/135325619500013T
Nuka Research and Planning Group, LLC. (2015). San Juan County Oil Spill Response Evaluation. San Juan County. June 30.
Nuka Research and Planning Group, LLC. (2013). West coast spill response study, Volume 2: Vessel traffic study. Report to Ministry of Environment in Province of British Columbia. Retrieved from: http://www.env.gov.bc.ca/main/west-coast-spill-response-study/docs/WestCoastSpillResponse_Vol2_VesselTrafficStudy_130722.pdf
Nuka Research and Planning Group, LLC. (2012a). Oil spill response gap and response capacity analysis for proposed Northern Gateway tanker spills in open water and protected water operating environments. Report to Haisla National Council. Retrieved from: http://www.tc.gc.ca/media/documents/mosprr/Haisla_Nation_Council_Nuka_Report.pdf
Nuka Research and Planning Group, LLC. (2012b). Analysis of oil spill response capacity for Strait of Juan de Fuca and Cape Flattery, Washington. Report to Makah Tribal Council. Retrieved from: http://www.ecy.wa.gov/programs/spills/preparedness/cplan/MakahCombinedComments.pdf
Potter, S. (2012). World oil spill catalog. SL Ross Environmental Research. Ottawa.
Renewable Energy Group, Inc. (2018). Grays Harbor Biorefinery. Hoquiam, WA. Retrieved from: https://www.regi.com/find-fuel/production-facilities/grays-harbor
Skinner, Samuel K; Reilly, William K. (1989). The Exxon Valdez Oil Spill: A Report to the President.
U.S. Coast Guard Research and Development Center. (2001). Oil Spill Response in Fast Currents: A Field Guide. Final report, October. Report No. CG-D-01-02.
Wadsworth, Tim. (1995). Containment & Recovery of Oil Spills at Sea. Methods and Limitations. International Tanker Owners Pollution Federation Limited (ITOPF). London, United Kingdom. Retrieved from: https://www.itopf.org/knowledge-resources/documents-guides/document/containment-recovery-of-oil-spills-at-sea-methods-and-limitations/
APPENDIX A – STAKEHOLDER COMMENTS Comments made during the June 7, 2019 meeting are listed below with italics used to respond to comments. The only written comments submitted (following the meeting) were provided by the Washington Dungeness Crab Fishermen’s Association. That letter is included in full following the list of comments below. (Recommendations in the letter were included in the final version of the report.)
Comments from June 7, 2019 Grays Harbor Safety Committee Meeting/ Webinar
1. The region is severely impacted by tides and current, which are left out in the model. Acknowledged in report.
2. Why bother with the model if actual variables are not included? Report needs to give more qualifiers. Report draft released following this meeting with effort to include all necessary qualifiers regarding what the model does and does not include.
3. The description in the model is the best-case scenario, but it is inconsistent in that it doesn’t account for real life variables. How do you model spreading without trajectory modeling? Need more qualifiers, this model comes up short. Acknowledged in report.
4. This study defaults to modeling with diesel, but it is less evaporative [than biodiesel]. Are there any other expectations or characteristics you expect to be different modeling with diesel? The alternative is over approximating evaporation. Evaporation is the fundamental variable and the biggest piece that we expect to be different.
5. Questions about the best case scenario skimming capacity – what kind of water flow can they handle? The system we’re looking at has to handle all variables. What are the limits of the equipment? Conditions in Grays Harbor will range from calm, protected water to open water. We need to consider all of them. Different systems are optimized for all environments. A scenario modeling only the use of protected water systems was added.
6. Offload time is listed as 35 min in a table. How is this calculated? Calculations are based on volume of the primary storage and the pump rate.
7. How did you calculate the base case recovery efficiency with the ROC? Explained in report.
8. The model used does not factor in current speed in the harbor. How accurate can the results of the study be if skimmers are expected to collect oil in current conditions beyond their capabilities? How much of the total time used in recovery projections of the study will actually be viable for picking up oil with the current equipment? What is the point of conducting the study using conditions that are optimistic beyond reality? Different tactics are used in high currents: for example, a response system may be configured to drift with the oil rather than moving towards or through it, or the current may be used to channel oil to recovery points on shore.
Grays Harbor Oil Spill Response Capacity Analysis
44
The ROC model does, however, assume advancing skimming systems. The purpose is to understand what we can from the model about the system and the effect of different variables on that system, even if it does not predict the results of an actual response here.
9. How much space, in terms of area, would an oil spill of 1.5 million gallons look like on the water? How is this projection limited based on the actual conditions of the area and not a concentric spreading out as the study assumes? The ROC outputs area covered, but this is not included in the report because it assumes a concentric spreading which is not realistic in Grays Harbor.
10. Anything that says “Recovered Oil” should be “Maximum Potential Recovery Percent” to avoid confusion and be clear about what statistics are being shown. Checked throughout the draft.
11. There needs to be more clarity in what the percentages mean in the base case scenario mass balance diagram. Relates to consistent use of the terminology of maximum potential recovery as above.
12. Is there a minimum amount of oil that needs to be input into this model before it starts to break down? The model could be run with a very small amount of oil, but it would show that it is recovered quickly.
13. The model does not incorporate any picking up of sediment into its projections. There is a lot of sediment in the harbor, which is important information about the local area, and should be acknowledged in the report. Acknowledged in report.
14. Emulsion of oil and sedimentation can also cause sinking. This should be added to the qualifiers of the report. Acknowledged in report.
15. REG has 4 mini barges on site to respond to a spill during transfers at the dock – this will reduce the need for unloading the primary storage of the skimmer and increase the clean up capacity in the event of a spill. Informational item. The mini barges that are staged as an alternative planning standard during transfers at the dock were modeled in the scenarios.
16. How easy is it to cascade resources into the area in the event of a spill? How quickly can more skimmers be available? The analysis includes resources from around Washington and Oregon according to the timeframes provided by the response organizations. A map of oil spill response equipment locations can be accessed at Spills Equipment Map.
17. Can we use the shoreside tank at the terminal to store oil in the case of a spill? This is assumed in the analysis.
18. In the future, better information on the properties of biodiesel and canola oil for study should be available to get more accurate results. Noted in report. See Appendix B for details about oil properties.
19. Is it possible to get specific information about tides and currents in the area when conducting studies? They play an important role in the dynamics of the harbor and are not addressed well in the model. Some information from NOAA was included in the report, but yes, these dynamics would dominate a response in Grays Harbor.
20. The report should mention the potential impacts of the model limitations. (eg Oil collecting on the shore or in mud banks in the harbor). Acknowledged in report.
21. Mention what happens to boom when offloading primary storage of a skimmer. Skimming is stopped during offload.
22. Pre-booming in the area is difficult because of conditions in the harbor, and this is not a useful mitigation tool. Comment noted, but out of scope for this project. Pre-booming in the area is further detailed in the Grays Harbor Vessel Traffic Risk Assessment (GHVTRA) Report at: https://apps.ecology.wa.gov/publications/summarypages/1808017.html
23. REG has skimmers on hand during any over-water oil transfers in the case of a spill. Comment noted, but out of scope for this project.
RE: Comments on Draft Response Capacity Analysis conducted by Nuka Research by Larry Thevik commercial fishing representative to the Grays Harbor Safety Committee.
My name is Larry Thevik I am a lifetime resident of Washington State and have been a commercial fisher over 45 years. I am the President of the Washington Dungeness Crab Association (WDCFA), a member of the Washington Coastal Marine Advisory Council (WCMAC), the Washington Coastal Crab Advisory Board, the Grays Harbor Safety Committee (GHSC) and the Tri-State Crab Committee. During my fishing Career I have fished the Pacific Coast from California to the Gulf of Alaska. Many WDCFA members have been directly affected by past oil spills –the Exxon Valdez “crude oil” spill in Alaska, the Nestucca barge “bunker oil” spill off Grays Harbor, the 1999 New Carrisa ”bunker oil” spill off Oregon, and the Cosco Buson 2007 “bunker oil” spill in San Francisco Bay are some examples. Those members witnessed first-hand the difficult task of recovery of oil on water and shorelines. I lost a season to the Exxon Valdez and my boat was chartered to help document the estimated 56,000 seabird deaths from Nestucca.
I appreciated the opportunity to comment on the Nuka report on June 7th at the Port of Grays Harbor and again via this letter. The need to identify the response capacity for a an oil spill in Grays Harbor is critically important. The efforts to try to quantify that response capacity and identify the assets available is essential. To that end I recognize the value of this report. What I have previously expressed concern over and repeat in this letter is the potential for the public, stakeholders, and responders to confuse the "potential" for maximum recovery of spilled oil--whatever its type--to the real world expectations of recovery of oil spilled at sea. The Report does contain numerous references to the limited scope of "real world" factors included in this modeling and that those excluded factors will affect the recovery efforts and outcomes in a "real world" spill event.
The impact of water flows and tidal currents were not considered in the model of this Report and the Report states as much. The Report also states on page 9: "In the Grays Harbor area it is assumed that shoreline oiling will be inevitable and likely heavy due to significant tides." the Report further states on page 12: "Strong currents and tidal fluctuations combined that mounting a significant response in Grays Harbor will be difficult." Page 17: " in some circumstances oil may be unrecoverable after just a few hours if it submerges, strands on shore, it emulsifies significantly, or is otherwise spread rapidly due to strong wind or current" Page 20 Fig 3-1 "Shows graphically how use of optimistic assumptions leads to a best case outcome. The real world outcome will be worse: it will be determined by actual conditions and influenced by factors that are not incorporated in the model. It is not necessary to use model to know that due to weather or other factors it may be the case that no oil is recovered".
According to the International Tanker Owners Pollution Federation Limited (ITOPF) and the Governors Draft Oil Safety Study at sea recovery rarely results in the recovery of more than 10-15% of spilled oil. The majority of spilled oil will simply not be recovered.
Page 1
Grays Harbor Oil Spill Response Capacity Analysis
47
The Grays Harbor ebb tide “plume” commonly extends eight miles into the ocean. The Nestucca oil barge holed off of Grays Harbor in 1988 spilled “only” 231,000 gallons of “heavy fuel oil” yet that oil killed an estimated 56,000 seabirds, with a surface sheen that stretched from Oregon to the Straights of Juan de Fuca. Another large portion of that spill travelled over a hundred miles undetected under the surface of the Ocean and reappeared to heavily soil beaches on the North end of Vancouver Island about a week after the spill. Spilled oil in or near Grays Harbor will travel fast and it will travel far.
I appreciate that the Nuka report does include several qualifying statements regarding the fundamental difference between idealized "maximum potential recovery" percent in the ROC model and the expectations of recovery when an actual real world event occurs. I am additionally appreciative that the Report, although not the model, recognizes the heavy influence of strong water flows and tidal currents on expected oil spill response effectiveness in Grays Harbor.
Recommendations:
1. I request the report attempt to quantify the real world recovery results that past experience provides. Even if that expression is range of expectations such a clarification will better inform readers of the context and limitations of the model. I request it be included in the "Findings and Conclusion" section. A place holder for such a statement could be following the second sentence in the paragraph after the bullets.
2. I further request that the report be reviewed so that the description of "maximum potential recovery" is consistent throughout the report. I note at least two inconsistent uses: Under "Base Case" 4.2 page 33 and under "Answers to Research Questions" 4.3 page 34 (there may be additional inconsistencies that I overlooked).
I Thank you in advance for review of my letter and consideration of my recommendations.
1 Vessel-WB-4, Sea Hawk, 28' Union bay / twin 150hp
28561
1 Vessel-WB-4, Sea Falcon, 28' Union bay / twin 150hp
29783
1 Storage-PS-4, Bladder Tank, Canflex/DLE-4
28270
1 Storage-PS-4, Bladder Tank, Canflex/DLE-4
28271
1 Storage-PS-4, Bladder Tank, Canflex/DLE-4
28272
1 Storage-PS-4, Bladder Tank, Canflex/DLE-4
28273
1 Storage-PS-4, Bladder Tank, Canflex/DLE-4
28274
INPUTS
Skimmer Group C Estimated Time of Arrival (hr) 7 Throughput efficiency daylight 75% Throughput efficiency darkness N/A Oil Recovery efficiency ROC INPUT Skimming Speed (knots) 0.65 Swath Width (feet) 66.7 Onboard Storage (bbl) 325 Nameplate Pump Rate (bph) 75 Discharge Rate (bph) 2400 Decant Rate (bph) 2150 Offload Time (hh:mm) 00:45 NOTES Open water waves 0-6 ft. This recovery system is not capable of night operations.
1 Vessel-TB-4, Shallow Water Barge Set 5 238bbl, 100 ft boom
31803
INPUTS
Skimmer Group A Estimated Time of Arrival (hr) 22 Throughput efficiency daylight 75% Throughput efficiency darkness 35% Oil Recovery efficiency ROC INPUT Skimming Speed (knots) 0.65 Swath Width (feet) 200 Onboard Storage (bbl) 100 Nameplate Pump Rate (bph) 137.9 Discharge Rate (bph) 600 Decant Rate (bph) 600 Offload Time (hh:mm) 00:45 NOTES: Open water waves 0-6 ft. This storage system is capable of night operations using lighting and navigation equipment of VOO vessels.
1 Vessel-WB-2, Hawks Point, VOO/ 60-69, 1990, 400hp
33978
1 Vessel-WB-2, Eagle Point, VOO/ 60-69, 1992, Two diesels, 160hp
33977
1 Vessel-TB-4, Shallow Water Barge Set 2 238bbl, 100 ft boom
30267
1 Vessel-WB-4, Miss Annika, VOO/ 28', 1988 J&H Boal Works Gillnetter, 375hp inboard/outboard mercruiser
33987
INPUTS
Skimmer Group C Estimated Time of Arrival (hr) 12 Throughput efficiency daylight 75% Throughput efficiency darkness 35% Oil Recovery efficiency ROC INPUT Skimming Speed (knots) 0.65 Swath Width (feet) 33.3 Onboard Storage (bbl) 438 Nameplate Pump Rate (bph) 437 Discharge Rate (bph) 2400 Decant Rate (bph) 2150 Offload Time (hh:mm) 00:45 NOTES: Open water waves 0-6 ft. This storage system is capable of night operations using lighting and navigation equipment of VOO vessels.
Skimmer Group A Estimated Time of Arrival (hr) 23 Throughput efficiency daylight 75% Throughput efficiency darkness 35% Oil Recovery efficiency ROC INPUT Skimming Speed (knots) 0.65 Swath Width (feet) 40 Onboard Storage (bbl) 420 Nameplate Pump Rate (bph) 505.6 Discharge Rate (bph) 1980 Decant Rate (bph) 1980 Offload Time (hh:mm) 00:45 NOTES: Open water waves 0-6 ft. This recovery system is capable of night operations using vessel lighting and vessel-based X-band radar and thermal infrared camera.
Grays Harbor Oil Spill Response Capacity Analysis
74
NRC SYSTEMS, cont.
Recovery System #10: Open Water, Ironwood
RESOURCES
No. Identification WRRL 1 Skimmer-PS-3, Portable,
Ironwood, Coated Disc Skimmer, Crucial 13/30 Disk Skimmer
30322
1 Vessel-WB-1, Ironwood, VOSS, 180' Vessel of Opportunity Skimming System
175 Boom-B-1, Ironwood, Inflatable High Sprint, 59
30321
INPUTS
Skimmer Group A Estimated Time of Arrival (hr) 16 Throughput efficiency daylight 75% Throughput efficiency darkness 35% Oil Recovery efficiency ROC INPUT Skimming Speed (knots) 0.65 Swath Width (feet) 58.3 Onboard Storage (bbl) 238 Nameplate Pump Rate (bph) 171 Discharge Rate (bph) 214 Decant Rate (bph) 214 Offload Time (hh:mm) 01:40 NOTES: Open Water waves 0-6 ft. This recovery system is capable of night operations.
1 Vessel-OSRV-4, Barge, Belt Skimmer, Marco Class XI
32848
1 Vessel, TUG-2, LOI, >1,500 HP LOI
INPUTS
Skimmer Group B Estimated Time of Arrival (hr) 23 Throughput efficiency daylight 75% Throughput efficiency darkness 35% Oil Recovery efficiency ROC INPUT Skimming Speed (knots) 1 Swath Width (feet) 0 Onboard Storage (bbl) 30783 Nameplate Pump Rate (bph) 5000 Discharge Rate (bph) 5400 Decant Rate (bph) 5400 Offload Time (hh:mm) 06:15 NOTES: Open water waves 0-6 ft. This storage system is capable of night operations using onboard lighting.