52
Hilario P. Martinez 1
| Date post: | 07-Aug-2015 |
| Category: |
Government & Nonprofit |
| Upload: | hilario-martinez |
| View: | 87 times |
| Download: | 0 times |

Hilario P. Martinez 1

Hilario P. Martinez 2

A VISION, and
a SOLUTION as well
Imagine the Philippines with 17 vibrant
and competitive regions with metropolitan
capitals
Hilario P. Martinez 3

Contending factors in finding a strategic intervention
Hilario P. Martinez 4

Is the relationship a MYTH or a FACT?
Gross Regional Domestic Product (GRDP) Rate
Annual General Appropriation (by Region)
Hilario P. Martinez 5

Interesting or Unfair Sharing Schemes?
Share in the Gross Regional Domestic Product
Share in Government Funds and Resources
… other
Regions
Hilario P. Martinez 6
Legend: NCR = Metro-Manila CALABARZON = Region 4A Central Luzon = Region 3

METRO-MANILA, A NATIONAL CAPITAL REGION
A Benchmark?
An Unending Development Concern? or
A Key to a Strategic Solution?
Hilario P. Martinez 7

Metro-Manila = National Capital Region
Seat of National Government
Center of Industry, Finance and Commerce
Headquarters to Multinational and Large Enterprises
Center of Education and Training
The only political region composed of urbanized cities
Earns 1/3 share of GDP but with no Agriculture component
The most densely populated region
Most developed road, transportation and communication infrastructures
Highest density of motor vehicles
Highest number of micro-enterprises
Hilario P. Martinez 8
Peculiarities:
An
are
a 6
36
sq
uar
e k
ilom
ete
rs
in a co
un
try of 3
00
,00
0 sq
uare
kilom
eters

MAJOR CONCERNS OF METRO-MANILA
Hilario P. Martinez 9

Big-time Spending for an Area that is only 0.21% of the Philippines
Build an integrated metro wide commuter
train system
Build better flood control and warning
systems
Build more elevated
highways
Build more low-cost housing projects
Rehabilitate waterways and
drainage systems
Install state-of-the-art traffic management
system
Install a metro-wide electronic
surveillance system
Establish more & better garbage /waste disposal
systems
Construction of more high-rise condominiums & apartments
Hilario P. Martinez 10
Better health facilities and
services

The BIG Questions!!!
Hilario P. Martinez 11

GROSS REGIONAL DOMESTIC PRODUCT (GRDP)
A Sum-Total of Production serving as a mere indicator, or
A Key Factor in Infusing Social and Economic Equity?
Hilario P. Martinez 12
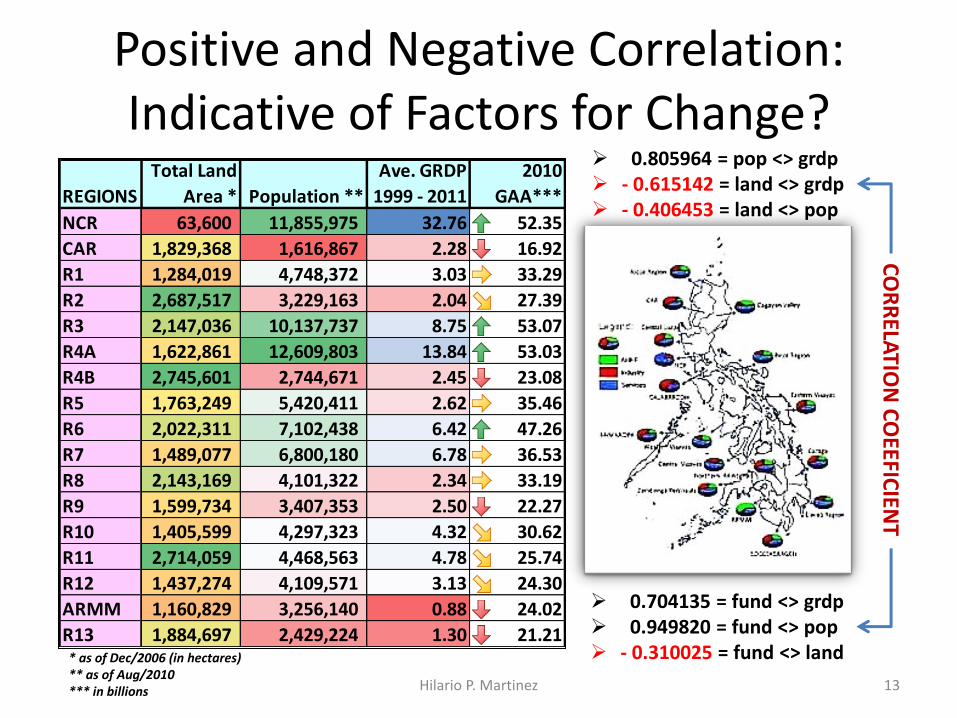
Positive and Negative Correlation: Indicative of Factors for Change?
Hilario P. Martinez 13
* as of Dec/2006 (in hectares) ** as of Aug/2010 *** in billions
0.805964 = pop <> grdp - 0.615142 = land <> grdp - 0.406453 = land <> pop
0.704135 = fund <> grdp 0.949820 = fund <> pop - 0.310025 = fund <> land
CO
RR
ELATIO
N C
OEEFIC
IENT
NCR 63,600 11,855,975 32.76 52.35
CAR 1,829,368 1,616,867 2.28 16.92
R1 1,284,019 4,748,372 3.03 33.29
R2 2,687,517 3,229,163 2.04 27.39
R3 2,147,036 10,137,737 8.75 53.07
R4A 1,622,861 12,609,803 13.84 53.03
R4B 2,745,601 2,744,671 2.45 23.08
R5 1,763,249 5,420,411 2.62 35.46
R6 2,022,311 7,102,438 6.42 47.26
R7 1,489,077 6,800,180 6.78 36.53
R8 2,143,169 4,101,322 2.34 33.19
R9 1,599,734 3,407,353 2.50 22.27
R10 1,405,599 4,297,323 4.32 30.62
R11 2,714,059 4,468,563 4.78 25.74
R12 1,437,274 4,109,571 3.13 24.30
ARMM 1,160,829 3,256,140 0.88 24.02
R13 1,884,697 2,429,224 1.30 21.21
2010
GAA***REGIONS
Total Land
Area * Population **
Ave. GRDP
1999 - 2011

GRDP 1999 – 2011* (Percent Distribution)
Hilario P. Martinez 14
Source: National Statistical Coordination Board * 1999-2008 in 1985 constant prices 2009-2011 in 2000 constant prices
REGIONS 1999 2000 2001 2002 2003 2004 2005 2006 2007 2008 2009 2010 2011
NCR 30.6 30.7 30.6 30.4 30.9 31.2 32 32.5 32.7 37 35.8 35.9 35.7
CAR 2.43 2.51 2.47 2.46 2.47 2.3 2.3 2.22 2.23 2 2.1 2.1 2.1
I 3.1 3.03 3.03 3.02 3.02 3 3 2.99 2.95 2.8 3.2 3.2 3.1
II 2.34 2.3 2.33 2.17 2.04 2.2 2 2 1.99 1.8 1.9 1.7 1.8
III 9.03 8.99 9.06 9.11 8.94 8.6 8.5 8.41 8.3 7.7 8.8 9 9.3
IV 15.4 15.3 15.3
IVA 13.1 13 12.7 12.4 12.3 12.1 10.8 17.1 17.6 17.4
IVB 2.73 3 2.8 2.8 2.69 2.76 2.2 1.9 1.8 1.8
V 2.82 2.76 2.84 2.85 2.88 2.8 2.8 2.77 2.79 2.6 2.1 2 2
VI 7.12 7.06 7.08 7.07 7.45 7.2 7.2 7.19 7.24 6.8 4.1 4 4
VII 6.87 7.03 7.15 7.01 7.02 7 7.1 7.07 7.18 6.8 5.7 6 6.2
VIII 2.37 2.3 2.32 2.26 2.27 2.2 2.2 2.2 2.12 2.2 2.8 2.6 2.6
IX 2.79 2.76 2.69 2.65 2.67 2.6 2.6 2.56 2.6 2.3 2.2 2.1 2
X 3.8 3.86 3.92 4.79 4.34 4.9 4.8 4.91 4.9 4.9 3.7 3.7 3.7
XI 6.19 6.35 6.26 4.54 4.52 4.6 4.6 4.53 4.5 4.5 3.9 3.8 3.8
XII 2.69 2.65 2.61 3.61 3.54 3.6 3.5 3.5 3.5 3.4 2.8 2.6 2.7
ARMM 1 0.95 0.94 0.94 0.87 0.9 0.9 0.88 0.9 0.8 0.8 0.8 0.8
XIII 1.48 1.46 1.46 1.4 1.16 1.3 1.3 1.29 1.3 1.3 1.1 1.1 1.2

Comparative GRDP shares – 1999 to 2011: NCR vs Major Island Groups
NCR is the only region without an agricultural component in its GRDP.
It takes the sum of GRDP share of the rest of Luzon to compare with NCR’s.
Not even the combined sum total shares of Mindanao and Visayas is comparable.
Hilario P. Martinez 15

Regions according to % share of GDP
Hilario P. Martinez 16
REGIONS
1999-2011
Average GRDP
Difference
from NCR's
NCR 32.76 0.00
IVA 13.84 18.91
III 8.75 24.01
VII 6.78 25.98
VI 6.42 26.33
XI 4.78 27.98
X 4.32 28.43
XII 3.13 29.63
I 3.03 29.72
V 2.62 30.14
IX 2.50 30.26
IVB 2.45 30.31
VIII 2.34 30.42
CAR 2.28 30.47
II 2.04 30.71
XIII 1.30 31.46
ARMM 0.88 31.87NCR – the only region without
an Agriculture sector

1999-2011 Average GRDP % share vs 2011* GRDP % share
1999-2011 Average GRDP % share
2011 GRDP % share
Hilario P. Martinez 17
XII = 3.13 IVA = 13.84 NCR = 32.76
I = 3.03 III = 8.75
V = 2.62 VII = 6.78
IX = 2.50 VI = 6.42
IVB = 2.45 XI = 4.78
VIII = 2.34 X = 4.32
CAR = 2.28
II = 2.04
XIII = 1.30
ARMM = 0.88
R
E
G
I
O
N
S
Group 3: 0.01 to
3.50 GRDP Rate
Group 2: 3.51-
15.0 GRDP Rate
Group 1: > 15.0
GRDP Rate
I = 3.10 III = 9.30 NCR = 35.70
XII = 2.70 VII = 6.20 IVA = 17.40
VIII = 2.60 VI = 4.00
CAR = 2.10 XI = 3.8
V = 2.00 X = 3.70
IX = 2.00
II = 1.80
IVB = 1.80
XIII = 1.20
ARMM = 0.80
Group 3: 0.01 to
3.50 GRDP Rate
Group 2: 3.51-
15.0 GRDP Rate
Group 1: > 15.0
GRDP Rate
R
E
G
I
O
N
S
This schedule records the summary (average) of changes in the share of GRDP; updated on a yearly basis – an iterative process
This schedule indicate changes in the GRDP % share based on latest developments. In this instance, NCR is joined by Region 4A in Group 1 category; changes in some regions are likewise noted, though some may not be positive when compared to the last recorded average • 2011 was the latest GRDP statistics available to
the Author as of the time of PPT design

THE ANNUAL APPROPRIATIONS OF THE PHILIPPINES
Department Funds and
Special Purpose Funds
Hilario P. Martinez 18

REGION 2000 2001 2002 2003 2004 2005 2006 2007 2008 2009 2010 2011 2012Nationwide 127.84 90.96 109.30 106.27 125.59 116.52 176.20 160.16 171.24 225.57 253.47 233.60 247.33
Central Ofc 48.33 66.76 69.13 69.05 75.71 68.24 39.80 87.06 101.07 104.68 117.71 109.48 114.89
NCR 26.39 35.12 30.23 27.43 25.18 23.21 25.20 27.51 29.42 32.12 33.04 29.66 29.83
CAR 5.93 9.17 6.78 7.49 5.69 6.20 6.21 6.34 8.61 12.88 8.96 9.50 9.80
R1 11.66 13.31 13.42 11.64 11.60 13.74 12.49 12.13 13.37 16.44 18.40 16.09 16.52
R2 6.73 9.24 8.32 7.55 7.57 7.85 7.99 8.74 9.74 12.52 12.88 11.79 12.25
R3 12.44 15.40 16.91 15.29 14.74 15.85 15.18 18.31 22.14 27.00 27.16 25.98 27.27
R4A* 17.53 22.36 22.79 19.96 19.43 16.32 12.89 15.56 19.77 23.05 24.70 26.37 22.43
R4B - - - - - 9.73 6.11 8.63 10.04 14.40 11.34 13.48 15.77
R5 10.78 13.40 12.71 11.73 11.37 12.39 11.91 13.96 15.37 18.95 18.69 17.83 18.51
R6 13.81 17.69 18.06 16.18 15.05 17.41 16.33 19.43 19.53 24.57 24.53 23.51 24.36
R7 9.51 12.24 11.39 10.20 10.20 11.54 11.24 12.62 14.80 17.92 17.72 17.03 17.75
R8 10.36 12.22 11.46 9.93 9.48 11.79 10.13 11.02 13.35 16.21 16.98 15.23 15.75
R9 7.25 10.49 9.60 8.25 7.86 8.60 7.46 8.77 10.38 13.55 11.18 11.30 11.62
R10 6.60 8.66 7.98 6.95 6.83 8.78 8.31 10.60 12.50 17.10 15.96 15.64 16.57
R11 10.10 13.11 12.72 9.50 9.25 8.55 7.87 8.71 12.04 13.58 12.89 11.35 11.45
R12 6.86 8.35 8.68 8.22 7.45 8.40 7.93 9.30 10.23 11.93 12.32 11.73 12.18
ARMM 6.17 9.26 5.20 6.29 6.27 7.29 8.78 9.23 8.83 10.15 10.08 10.27 10.66
R13 5.02 7.19 7.42 5.52 5.58 9.12 7.66 9.49 8.78 11.73 11.21 11.51 12.09
Total 343.30 374.92 382.11 357.46 374.86 381.54 399.66 457.57 511.23 624.36 659.22 621.33 647.02
FUND ALLOCATION OF DEPARTMENTS 2000 to 2010 (2011-2012**)
Hilario P. Martinez 19
Source: Department of Budget and Management • The split in budgetary system of Region 4 became effective 2005, thus 4A and 4B ** Projected figures based on trend were used for 2011 and 2012 in the absence of actual data with the same disaggregation. For illustration purposes only
(₱ in 000,000,000s) 2000 – 2010 Trend line

REGION 2000 2001 2002 2003 2004 2005 2006 2007 2008 2009 2010 2011 2012Nationwide 285.43 34.45 35.60 26.04 25.95 26.28 66.43 60.43 98.06 113.42 224.08 107.24 112.80
Central Ofc 16.61 161.87 212.54 270.24 316.26 345.02 411.90 414.03 398.71 414.25 386.09 511.52 580.59
NCR 0.68 12.07 11.75 13.18 10.77 13.07 14.00 15.69 17.51 20.26 19.31 21.74 24.50
CAR 0.13 8.65 4.58 4.55 8.34 4.74 5.17 5.76 6.42 8.18 7.96 8.16 8.92
R1 0.05 5.05 7.91 8.40 4.54 8.94 9.78 10.91 12.24 14.43 14.89 16.20 18.65
R2 0.56 7.42 7.38 7.60 7.56 8.03 8.84 9.92 11.50 13.48 14.52 14.93 16.97
R3 0.18 13.69 14.03 13.09 13.71 14.60 15.99 17.84 20.20 24.35 25.91 26.78 30.45
R4A* 0.14 19.69 20.63 21.51 20.88 15.21 16.81 18.89 21.23 26.70 28.33 30.95 33.74
R4B - - - - - 6.90 4.33 8.59 9.59 11.01 11.74 13.21 14.51
R5 0.14 8.81 8.95 9.48 9.45 10.04 10.99 12.25 13.75 16.07 16.77 17.90 20.33
R6 0.23 13.15 12.34 12.74 12.73 13.52 18.04 16.50 18.53 20.97 22.73 24.24 27.43
R7 0.08 11.63 11.52 10.58 10.54 11.20 12.24 13.66 15.35 18.08 18.81 19.73 22.25
R8 0.24 9.93 10.13 9.19 9.19 9.75 10.66 11.92 13.32 16.41 16.21 17.30 19.52
R9 0.39 7.05 7.07 7.06 6.19 6.56 7.50 8.01 9.00 10.38 11.09 11.44 12.82
R10 0.16 6.89 6.36 8.10 8.10 8.61 9.41 10.80 11.81 14.38 14.66 15.87 18.16
R11 2.53 10.06 9.78 7.18 7.10 7.56 8.27 9.24 10.38 12.19 12.85 12.50 13.72
R12 0.07 5.72 5.58 6.47 6.37 6.77 7.43 8.36 9.92 12.27 11.98 13.01 14.89
ARMM - 5.64 5.89 5.82 6.74 7.21 7.72 8.85 10.11 13.38 13.93 14.32 16.50
R13 0.09 8.33 6.67 5.49 5.49 5.83 6.37 7.11 8.13 10.43 10.01 10.35 11.56
Sub-Total 307.70 350.08 398.68 446.74 489.91 529.84 651.91 668.77 715.77 790.64 881.88 907.38 1,018.3
Debt Service Fund109.31 144.91 204.27 223.24 271.53 301.69 340.00 328.73 295.75 302.65 340.81 388.03 430.62
Net 198.38 205.17 194.41 223.51 218.38 228.15 311.91 340.03 420.02 487.99 541.07 519.35 587.68
SPECIAL PURPOSE FUNDS - 2000 to 2010 (2011-2012**)
Hilario P. Martinez 20
(₱ in 000,000,000s) 2000 – 2010 Trend line
Source: Department of Budget and Management • The split in budgetary system of Region 4 became effective 2005, thus 4A and 4B ** Projected figures based on trend were used for 2011 and 2012 in the absence of actual data with the same disaggregation. For illustration purposes only

REGION 2000 2001 2002 2003 2004 2005 2006 2007 2008 2009 2010 2011 2012Nationwide 413.28 125.41 144.90 132.31 151.54 142.80 242.63 220.58 269.30 338.98 477.55 340.84 360.13
Central Ofc 64.94 228.63 281.67 339.29 391.96 413.26 451.70 501.09 499.79 518.93 503.81 621.00 695.48
NCR 27.07 47.19 41.98 40.61 35.95 36.29 39.20 43.21 46.93 52.38 52.35 51.40 54.33
CAR 6.06 17.82 11.36 12.05 14.03 10.93 11.38 12.10 15.03 21.06 16.92 17.65 18.73
R1 11.71 18.36 21.33 20.04 16.14 22.68 22.27 23.04 25.61 30.88 33.29 32.28 35.17
R2 7.28 16.65 15.71 15.15 15.13 15.88 16.83 18.66 21.24 26.00 27.39 26.72 29.22
R3 12.62 29.09 30.94 28.38 28.46 30.46 31.17 36.15 42.34 51.36 53.07 52.76 57.71
R4A* 17.67 42.05 43.42 41.48 40.31 31.54 29.69 34.45 41.00 49.75 53.03 57.33 56.17
R4B - - - - - 16.64 10.43 17.22 19.63 25.41 23.08 26.69 30.28
R5 10.93 22.20 21.65 21.21 20.82 22.43 22.90 26.21 29.12 35.02 35.46 35.73 38.84
R6 14.03 30.84 30.40 28.92 27.78 30.93 34.37 35.94 38.07 45.55 47.26 47.75 51.78
R7 9.59 23.87 22.91 20.78 20.74 22.74 23.49 26.28 30.15 36.00 36.53 36.75 40.00
R8 10.60 22.15 21.58 19.12 18.66 21.53 20.79 22.94 26.67 32.62 33.19 32.53 35.27
R9 7.64 17.55 16.67 15.31 14.05 15.16 14.96 16.78 19.39 23.93 22.27 22.74 24.44
R10 6.76 15.55 14.34 15.06 14.93 17.39 17.73 21.39 24.31 31.48 30.62 31.51 34.73
R11 12.63 23.17 22.50 16.68 16.35 16.11 16.14 17.96 22.42 25.77 25.74 23.85 25.17
R12 6.93 14.06 14.26 14.70 13.82 15.17 15.36 17.66 20.15 24.20 24.30 24.74 27.07
ARMM 6.17 14.90 11.08 12.11 13.01 14.50 16.50 18.08 18.95 23.53 24.02 24.59 27.16
R13 5.11 15.52 14.08 11.01 11.06 14.95 14.03 16.60 16.91 22.15 21.21 21.86 23.64
Total 651 725 781 804 865 911 1,052 1,126 1,227 1,415 1,541 1,529 1,665
DEPARTMENT and SPECIAL PURPOSE FUNDS, 2000 to 2010 (2011-2012**)
Hilario P. Martinez 21
(₱ in 000,000,000s) 2000 – 2010 Trend line
Source: Department of Budget and Management • The split in budgetary system of Region 4 became effective 2005, thus 4A and 4B ** Projected figures based on trend were used for 2011 and 2012 in the absence of actual data with the same disaggregation. For illustration purposes only

Fund Allocation Shares of Region [2000-2010 Ave. Dep’t + Spcl Purpose Funds]
Hilario P. Martinez 22

Comparative of 2000-2010 Average of Department + Special Purpose Funds
NCR without Nationwide and Central Office Funds
Nationwide and Central Office Funds co-located in NCR
Hilario P. Martinez 23
Geographically, all central offices of all branches of the National Government are located in NCR. Consequently, NCR as an economy, derive benefits from this arrangement, directly and indirectly
With NCR just 0.21% of the total land area of the country, it enjoys a sizable amount of fund share from the general appropriations matched only by Regions 3 and 4A, regions that are many times larger in size

2000-2010 Average of Department & Special Purpose Funds per Region
Hilario P. Martinez 24
Department Funds Special Purpose Funds
DEPT SPCL NCR 28.62 13.48
CAR 7.66 5.86
R1 13.47 8.83
R2 9.01 8.80
R3 18.22 15.78
R4A 18.72 21.19
R4B 10.04 8.69
R5 13.75 10.61
R6 18.42 14.68
R7 12.67 12.15
R8 12.08 10.63
R9 9.40 7.30
R10 10.02 9.03
R11 10.76 8.83
R12 9.06 7.36
ARMM 7.96 7.75
R13 8.07 6.72

DEFINING THE URGENCY OF DEVELOPMENT AND ASSISTANCE
Which regions need to be prioritized?
25 Hilario P. Martinez

1999-2011* Average GRDP Share
Hilario P. Martinez 26
32.76
2.28
3.03
2.04
8.75 13.84
2.45
2.62
6.42
6.78
2.34
2.50 4.32 4.78
3.13 0.88 1.30 NCR
CAR
I
II
III
IVA
IVB
V
VI
VII
VIII
IX
X
XI
XII
ARMM
XIII
• The range of GRDP data needs to be updated annually as basis for averaging. For this presentation, only data for 1999-2011 is available.

Ranking and Classification of Regions according to % share of GRDP
Hilario P. Martinez 27
REGIONS
1999-2011
Average GRDP
Difference
from NCR's
NCR 32.76 0.00
IVA 13.84 18.91
III 8.75 24.01
VII 6.78 25.98
VI 6.42 26.33
XI 4.78 27.98
X 4.32 28.43
XII 3.13 29.63
I 3.03 29.72
V 2.62 30.14
IX 2.50 30.26
IVB 2.45 30.31
VIII 2.34 30.42
CAR 2.28 30.47
II 2.04 30.71
XIII 1.30 31.46
ARMM 0.88 31.87
REFERENCE POINT
G
R
O
U
P
3
GR
OU
P 2
GROUP 1
15.0 3.51
3.50 0.00
Is it reasonable for NCR, which is only 0.21% of total land area, share 1/3 of GDP?

Classification of Regions according to Average GRDP Rate *
Hilario P. Martinez 28 * Based on 1999-2011 GRDP Average
This schedule is adjusted every year to illustrate the development status of regions

Degrees of Urgency and Development Timeframes Group 3
The least developed group, and thus, requires the most urgency in accelerating development
Group 2
This group which has gathered momentum, and thus the 2nd Priority
Group 1
The preferred stage of development for all regions, but the least priority for fund augmentation
Hilario P. Martinez 29 * Based on average GDRP 1999-2011
GROUP 3
GR
OU
P 2
GROUP 1
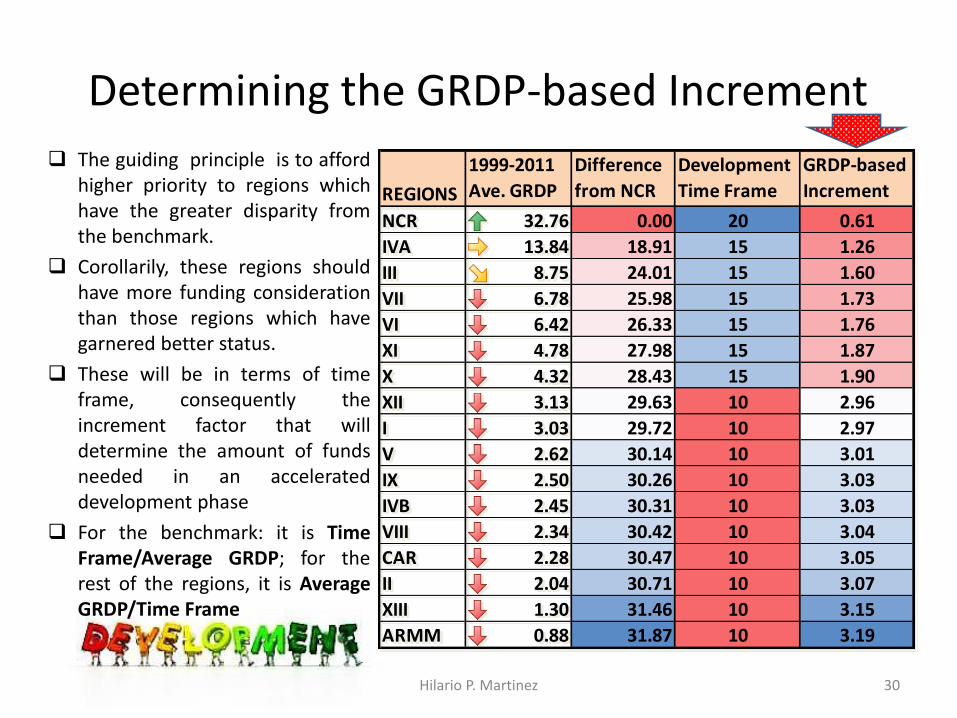
Determining the GRDP-based Increment
The guiding principle is to afford higher priority to regions which have the greater disparity from the benchmark.
Corollarily, these regions should have more funding consideration than those regions which have garnered better status.
These will be in terms of time frame, consequently the increment factor that will determine the amount of funds needed in an accelerated development phase
For the benchmark: it is Time Frame/Average GRDP; for the rest of the regions, it is Average GRDP/Time Frame
Hilario P. Martinez 30
REGIONS
1999-2011
Ave. GRDP
Difference
from NCR
Development
Time Frame
GRDP-based
Increment
NCR 32.76 0.00 20 0.61
IVA 13.84 18.91 15 1.26
III 8.75 24.01 15 1.60
VII 6.78 25.98 15 1.73
VI 6.42 26.33 15 1.76
XI 4.78 27.98 15 1.87
X 4.32 28.43 15 1.90
XII 3.13 29.63 10 2.96
I 3.03 29.72 10 2.97
V 2.62 30.14 10 3.01
IX 2.50 30.26 10 3.03
IVB 2.45 30.31 10 3.03
VIII 2.34 30.42 10 3.04
CAR 2.28 30.47 10 3.05
II 2.04 30.71 10 3.07
XIII 1.30 31.46 10 3.15
ARMM 0.88 31.87 10 3.19

“Those who have less in life, should have more in law”
Hilario P. Martinez 31
Region-biased GAA
Hilario P. Martinez 32
80% 20%

Premises and Assumptions assumed
Gross Regional Domestic Product (GRDP) History: 1999 to 2011
Annual General Appropriations: 2000 to 2010
Projected GAA 2012 to illustrate the 20:80 Fund Allocation Scheme
Hilario P. Martinez 33

Reference Data for the GRDP-Based 20:80 Ratio
1999 – 2011 GRDP
Hilario P. Martinez 34
NCR 32.76 1
CAR 2.28 14
I 3.03 9
II 2.04 15
III 8.75 3
IVA 13.84 2
IVB 2.45 12
V 2.62 10
VI 6.42 5
VII 6.78 4
VIII 2.34 13
IX 2.50 11
X 4.32 7
XI 4.78 6
XII 3.13 8
ARMM 0.88 17
XIII 1.30 16
1999-2011
Ave. GRDPREGIONS Rank
PROJECTED
APPLIED TO 2012
FUND
Note: ₱ in 000,000,000s
General Appropriation

Fund Structure of the 2012* General Appropriation
Hilario P. Martinez 35
* Projected from 2000 to 2010 GAA (using TREND)
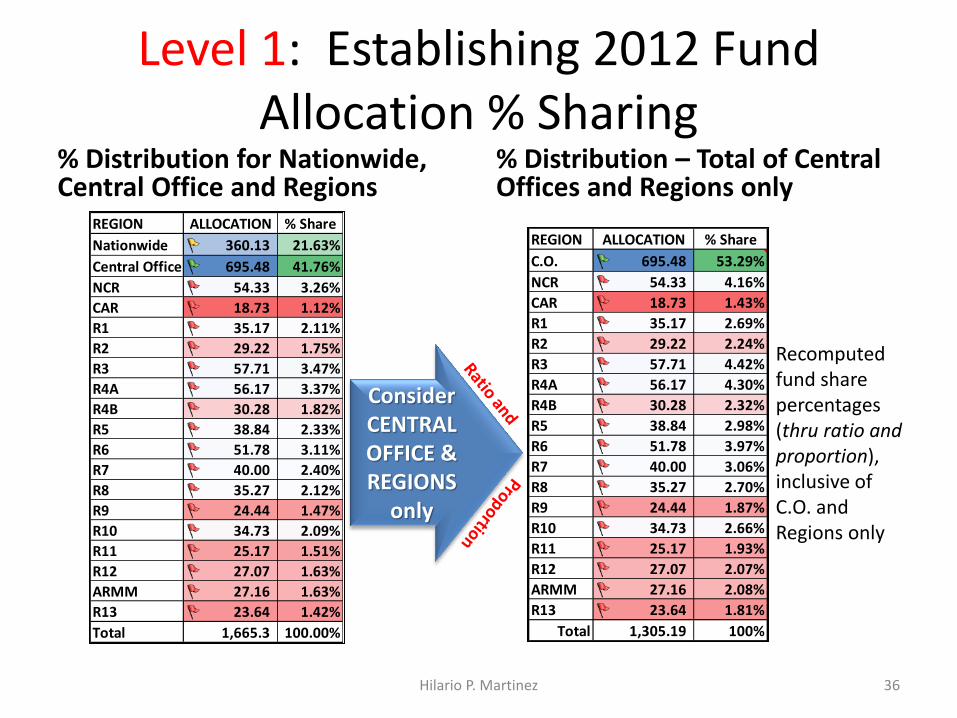
Level 1: Establishing 2012 Fund Allocation % Sharing
% Distribution for Nationwide, Central Office and Regions
% Distribution – Total of Central Offices and Regions only
Hilario P. Martinez 36
Consider CENTRAL OFFICE & REGIONS
only
Recomputed fund share percentages (thru ratio and proportion), inclusive of C.O. and Regions only
REGION ALLOCATION % Share
Nationwide 360.13 21.63%
Central Office 695.48 41.76%
NCR 54.33 3.26%
CAR 18.73 1.12%
R1 35.17 2.11%
R2 29.22 1.75%
R3 57.71 3.47%
R4A 56.17 3.37%
R4B 30.28 1.82%
R5 38.84 2.33%
R6 51.78 3.11%
R7 40.00 2.40%
R8 35.27 2.12%
R9 24.44 1.47%
R10 34.73 2.09%
R11 25.17 1.51%
R12 27.07 1.63%
ARMM 27.16 1.63%
R13 23.64 1.42%
Total 1,665.3 100.00%
REGION ALLOCATION % Share
C.O. 695.48 53.29%
NCR 54.33 4.16%
CAR 18.73 1.43%
R1 35.17 2.69%
R2 29.22 2.24%
R3 57.71 4.42%
R4A 56.17 4.30%
R4B 30.28 2.32%
R5 38.84 2.98%
R6 51.78 3.97%
R7 40.00 3.06%
R8 35.27 2.70%
R9 24.44 1.87%
R10 34.73 2.66%
R11 25.17 1.93%
R12 27.07 2.07%
ARMM 27.16 2.08%
R13 23.64 1.81%
Total 1,305.19 100%

Level 2: % Share computation from “CO & Regions” to “Regions” only
Per projected 2012 Fund: Central Office and all Regions
Computing for % share of Regions only
Hilario P. Martinez 37
Recomputed fund share percentages (thru ratio and proportion), inclusive of Regions only
Excluding Central Office (C.O.)
REGION ALLOCATION % Share
C.O. 695.48 53.29%
NCR 54.33 4.16%
CAR 18.73 1.43%
R1 35.17 2.69%
R2 29.22 2.24%
R3 57.71 4.42%
R4A 56.17 4.30%
R4B 30.28 2.32%
R5 38.84 2.98%
R6 51.78 3.97%
R7 40.00 3.06%
R8 35.27 2.70%
R9 24.44 1.87%
R10 34.73 2.66%
R11 25.17 1.93%
R12 27.07 2.07%
ARMM 27.16 2.08%
R13 23.64 1.81%
Total 1,305.19 100%
REGION ALLOCATION % Share
NCR 54.33 8.91
CAR 18.73 3.07
R1 35.17 5.77
R2 29.22 4.79
R3 57.71 9.47
R4A 56.17 9.21
R4B 30.28 4.97
R5 38.84 6.37
R6 51.78 8.49
R7 40.00 6.56
R8 35.27 5.79
R9 24.44 4.01
R10 34.73 5.70
R11 25.17 4.13
R12 27.07 4.44
ARMM 27.16 4.45
R13 23.64 3.88
Total 609.71 100%

Level 3: Applying GRDP-based Increment for the Total Adjusted Share The % share of Regions
is the basis for the GRDP-based increment
The Increment is added to the % share to arrive at the Total % Share for each region
Ratio and Proportion [a/A = b/B] is applied to “Total % Share” for a normalized % share with a 100% total
The “Pro Rata % Share” determines the corresponding allocation for each region
Hilario P. Martinez 38
Ratio & Proportion
₱ Allocation % Share
NCR 54.33 8.91 0.61 9.52 6.74 41.11 -24.34%
CAR 18.73 3.07 1.26 4.33 3.07 18.70 -0.12%
R1 35.17 5.77 1.60 7.37 5.22 31.82 -9.54%
R2 29.22 4.79 1.73 6.52 4.62 28.17 -3.60%
R3 57.71 9.47 1.76 11.22 7.95 48.45 -16.06%
R4A 56.17 9.21 1.87 11.08 7.84 47.83 -14.85%
R4B 30.28 4.97 1.90 6.86 4.86 29.62 -2.16%
R5 38.84 6.37 2.96 9.33 6.61 40.29 3.75%
R6 51.78 8.49 2.97 11.47 8.12 49.50 -4.41%
R7 40.00 6.56 3.01 9.57 6.78 41.34 3.34%
R8 35.27 5.79 3.03 8.81 6.24 38.04 7.84%
R9 24.44 4.01 3.03 7.04 4.98 30.39 24.36%
R10 34.73 5.70 3.04 8.74 6.19 37.72 8.62%
R11 25.17 4.13 3.05 7.18 5.08 30.98 23.08%
R12 27.07 4.44 3.07 7.51 5.32 32.43 19.81%
ARMM 27.16 4.45 3.19 7.07 5.00 30.50 38.80%
R13 23.64 3.88 3.15 7.60 5.38 32.82 12.30%
Total 609.71 100.00 41.22 141.22 100.00 609.71 0.00%
% ChangeREGION
Projected 2012 GRDP-based
Increment
Total %
Share
Pro Rata
% Share
Adjusted ₱
Allocation

Hilario P. Martinez 39
Include C.O. (20%) to Regions
for 80%
GR
DP
-bas
ed
Incr
em
en
t A
pp
lied
to
Re
gio
ns
20
12
Fu
nd
Sh
are
20
12
Fun
d Sh
are R
eco
mp
uted
for
C.O
. and
Re
gion
s usin
g 20
:80
Ratio
REGION % Share ₱ Fund
NCR 6.74 41.11
CAR 3.07 18.70
R1 5.22 31.82
R2 4.62 28.17
R3 7.95 48.45
R4A 7.84 47.83
R4B 4.86 29.62
R5 6.61 40.29
R6 8.12 49.50
R7 6.78 41.34
R8 6.24 38.04
R9 4.98 30.39
R10 6.19 37.72
R11 5.08 30.98
R12 5.32 32.43
ARMM 5.00 32.82
R13 5.38 30.50
Total 100.00 609.71
C.O. 20.00% 261.04
NCR 5.39% 70.40
CAR 2.45% 32.03
R1 4.17% 54.49
R2 3.70% 48.24
R3 6.36% 82.97
R4A 6.28% 81.91
R4B 3.89% 50.73
R5 5.29% 69.00
R6 6.49% 84.77
R7 5.42% 70.79
R8 4.99% 65.15
R9 3.99% 52.04
R10 4.95% 64.60
R11 4.06% 53.05
R12 4.25% 55.53
ARMM 4.00% 52.24
R13 4.31% 56.20
Total 100.00% 1,305.19
20:80 % Sharing
of 2012 Fund
₱ Fund
ShareREGION

Hilario P. Martinez 40
Re
com
pu
te Fu
nd
Sh
are w
ith
“Natio
nw
ide” in
clud
ed
Final %
Fun
d Sh
are fo
r 20
12
– GR
DP
-co
nsisten
t & 2
0:8
0 C
om
plian
t 2
01
2 F
un
d S
har
e R
eco
mp
ute
d f
or
C.O
. an
d R
egi
on
s u
sin
g 2
0:8
0 R
atio
C.O. 20.00% 261.04
NCR 5.39% 70.40
CAR 2.45% 32.03
R1 4.17% 54.49
R2 3.70% 48.24
R3 6.36% 82.97
R4A 6.28% 81.91
R4B 3.89% 50.73
R5 5.29% 69.00
R6 6.49% 84.77
R7 5.42% 70.79
R8 4.99% 65.15
R9 3.99% 52.04
R10 4.95% 64.60
R11 4.06% 53.05
R12 4.25% 55.53
ARMM 4.00% 52.24
R13 4.31% 56.20
Total 100.00% 1,305.19
20:80 % Sharing
of 2012 Fund
₱ Fund
ShareREGION
REGION 2012 Fund Share % Share
Nationwide 360.13 21.63%
C.O. 261.04 15.67%
NCR 70.40 4.23%
CAR 32.03 1.92%
R1 54.49 3.27%
R2 48.24 2.90%
R3 82.97 4.98%
R4A 81.91 4.92%
R4B 50.73 3.05%
R5 69.00 4.14%
R6 84.77 5.09%
R7 70.79 4.25%
R8 65.15 3.91%
R9 52.04 3.13%
R10 64.60 3.88%
R11 53.05 3.19%
R12 55.53 3.33%
ARMM 52.24 3.14%
R13 56.20 3.37%
Total 1,665.32 100.00%

This review covers C.O. and Regions only
C.O. allocation declined by -62.47%
The biggest increases were from the Mindanao group ranging from 86.02% to 137.70%
The smallest increases were from Luzon, from 43.76% to 77.67%, while the Visayas group were from 63.71% to 84.69%
NCR had the smallest increase of 29.58%
Hilario P. Martinez 41
REGION ₱ per 2012 ₱ per 20:80 ₱ Change % Change
C.O. 695.48 261.04 -434.44 -62.47%
NCR 54.33 70.40 16.07 29.58%
CAR 18.73 32.03 13.30 71.05%
R1 35.17 54.49 19.31 54.91%
R2 29.22 48.24 19.02 65.08%
R3 57.71 82.97 25.25 43.76%
R4A 56.17 81.91 25.74 45.82%
R4B 30.28 50.73 20.45 67.56%
R5 38.84 69.00 30.17 77.67%
R6 51.78 84.77 32.99 63.71%
R7 40.00 70.79 30.79 76.98%
R8 35.27 65.15 29.87 84.69%
R9 24.44 52.04 27.61 112.98%
R10 34.73 64.60 29.87 86.02%
R11 25.17 53.05 27.88 110.79%
R12 27.07 55.53 28.46 105.17%
ARMM 27.16 52.24 25.08 92.32%
R13 23.64 56.20 32.56 137.70%
Total 1,305.19 1,305.19 0.00 0.00%

per 2012 per 20:80
CO 695.48 261.04 86.12 174.91 -74.85%
NCR 54.33 70.40 23.23 47.17 -13.17%
CAR 18.73 32.03 10.57 21.46 14.62%
R1 35.17 54.49 17.98 36.51 3.80%
R2 29.22 48.24 15.92 32.33 10.62%
R3 57.71 82.97 27.37 55.60 -3.67%
R4A 56.17 81.91 27.02 54.88 -2.29%
R4B 30.28 50.73 16.74 33.99 12.28%
R5 38.84 69.00 22.77 46.24 19.05%
R6 51.78 84.77 27.97 56.80 9.70%
R7 40.00 70.79 23.36 47.44 18.59%
R8 35.27 65.15 21.49 43.65 23.75%
R9 24.44 52.04 17.17 34.87 42.71%
R10 34.73 64.60 21.31 43.29 24.65%
R11 25.17 53.05 17.50 35.55 41.24%
R12 27.07 55.53 18.32 37.21 37.48%
ARMM 27.16 52.24 17.24 35.00 28.87%
R13 23.64 56.20 18.54 37.66 59.27%
Total 1,305.19 1,305.19 430.62 874.57 -32.99%
₱ Allocation
REGION
₱ Share to
Debt Service
₱ Balance due
to [per 20:80]
% Change from
[per 2012]
Level 6: Incorporating the Debt Servicing Provision Apportionment for Debt
Servicing applied to C.O. and Regions
Sharing is Pro-Rata and was based on the % distribution arrived at in the 20:80 scheme for C.O. + Regions
₱430.62B was deducted from “C.O. + Regions” based on this % sharing resulting to a net of ₱874.57B
C.O. incurred -74.85% decrease due to debt servicing, having the biggest share
Hilario P. Martinez 42

₱1,234.7B is the 20:80-rationalized 2012 Allocation incorporating the provision for “Nationwide”
This fund (₱ per 20:80) is already Debt Servicing-free, as processed in the preceding level
NCR has a -13.17% reduction in funds, Regions 3 has -3.67% and -2.29% for Region 4A; CO fund is reduced by -74.85%
Funds for the rest of the Regions are increased, ranging from 3.8% to 48.05%, the direct effect of the 20:80 Ratio
No change is proposed for “Nationwide” provision
Hilario P. Martinez 43 Ratio & Proportion
Region ₱ per 2012 % Share ₱ per 20:80 % Share ₱ Change % Change
Nationwide 360.13 21.63% 360.13 29.17% - 0.00%
C.O. 695.48 41.76% 174.91 14.17% (520.56) -74.85%
NCR 54.33 3.26% 47.17 3.82% (7.16) -13.17%
CAR 18.73 1.12% 21.46 1.74% 2.74 14.62%
R1 35.17 2.11% 36.51 2.96% 1.34 3.80%
R2 29.22 1.75% 32.33 2.62% 3.10 10.62%
R3 57.71 3.47% 55.60 4.50% (2.12) -3.67%
R4A 56.17 3.37% 54.88 4.45% (1.29) -2.29%
R4B 30.28 1.82% 33.99 2.75% 3.72 12.28%
R5 38.84 2.33% 46.24 3.74% 7.40 19.05%
R6 51.78 3.11% 56.80 4.60% 5.02 9.70%
R7 40.00 2.40% 47.44 3.84% 7.44 18.59%
R8 35.27 2.12% 43.65 3.54% 8.38 23.75%
R9 24.44 1.47% 34.87 2.82% 10.44 42.71%
R10 34.73 2.09% 43.29 3.51% 8.56 24.65%
R11 25.17 1.51% 35.55 2.88% 10.38 41.24%
R12 27.07 1.63% 37.21 3.01% 10.14 37.48%
ARMM 27.16 1.63% 35.00 2.84% 7.84 28.87%
R13 23.64 1.42% 37.66 3.05% 14.01 59.27%
Total 1,665.32 100.00% 1,234.70 100.00% (430.62) -25.86%

LEVEL 1 LEVEL 2 LEVEL 3 LEVEL 4 LEVEL 5 LEVEL 6 LEVEL 7
Nationwide 360.13 21.63% 21.63% 29.17% 360.13
C.O. 695.48 41.76% 53.29% 20.00% 41.76% 20.00% 14.17% 174.91
NCR 54.33 3.26% 4.16% 8.91% 6.74% 5.39% 3.26% 5.39% 3.82% 47.17
CAR 18.73 1.12% 1.43% 3.07% 3.07% 2.45% 1.12% 2.45% 1.74% 21.46
R1 35.17 2.11% 2.69% 5.77% 5.22% 4.17% 2.11% 4.17% 2.96% 36.51
R2 29.22 1.75% 2.24% 4.79% 4.62% 3.70% 1.75% 3.70% 2.62% 32.33
R3 57.71 3.47% 4.42% 9.47% 7.95% 6.36% 3.47% 6.36% 4.50% 55.60
R4A 56.17 3.37% 4.30% 9.21% 7.84% 6.28% 3.37% 6.28% 4.45% 54.88
R4B 30.28 1.82% 2.32% 4.97% 4.86% 3.89% 1.82% 3.89% 2.75% 33.99
R5 38.84 2.33% 2.98% 6.37% 6.61% 5.29% 2.33% 5.29% 3.74% 46.24
R6 51.78 3.11% 3.97% 8.49% 8.12% 6.49% 3.11% 6.49% 4.60% 56.80
R7 40.00 2.40% 3.06% 6.56% 6.78% 5.42% 2.40% 5.42% 3.84% 47.44
R8 35.27 2.12% 2.70% 5.79% 6.24% 4.99% 2.12% 4.99% 3.54% 43.65
R9 24.44 1.47% 1.87% 4.01% 4.98% 3.99% 1.47% 3.99% 2.82% 34.87
R10 34.73 2.09% 2.66% 5.70% 6.19% 4.95% 2.09% 4.95% 3.51% 43.29
R11 25.17 1.51% 1.93% 4.13% 5.08% 4.06% 1.51% 4.06% 2.88% 35.55
R12 27.07 1.63% 2.07% 4.44% 5.32% 4.25% 1.63% 4.25% 3.01% 37.21
ARMM 27.16 1.63% 2.08% 4.45% 5.00% 4.00% 1.63% 4.00% 2.84% 37.66
R13 23.64 1.42% 1.81% 3.88% 5.38% 4.31% 1.42% 4.00% 3.05% 35.00
TOTAL 1665.32 100.00% 100.00% 100.00% 100.00% 100.00% 100.00% 100.00% 100.00% 1234.70
Summary of Changes in % Share
Hilario P. Martinez 44
2012 PROJECTED
2012 AMENDED
GRDP INCR
20:80 RATIO
- DEBT SERVC

LEVEL 1 LEVEL 2 LEVEL 3 LEVEL 4 LEVEL 5 LEVEL 6 LEVEL 7
Nationwide 21.63% 360.13 360.13 360.13 29.17%
C.O. 41.76% 695.48 695.48 261.04 261.04 174.91 174.91 14.17%
NCR 3.26% 54.33 54.33 54.33 41.11 70.40 70.40 47.17 47.17 3.82%
CAR 1.12% 18.73 18.73 18.73 18.70 32.03 32.03 21.46 21.46 1.74%
R1 2.11% 35.17 35.17 35.17 31.82 54.49 54.49 36.51 36.51 2.96%
R2 1.75% 29.22 29.22 29.22 28.17 48.24 48.24 32.33 32.33 2.62%
R3 3.47% 57.71 57.71 57.71 48.45 82.97 82.97 55.60 55.60 4.50%
R4A 3.37% 56.17 56.17 56.17 47.83 81.91 81.91 54.88 54.88 4.45%
R4B 1.82% 30.28 30.28 30.28 29.62 50.73 50.73 33.99 33.99 2.75%
R5 2.33% 38.84 38.84 38.84 40.29 69.00 69.00 46.24 46.24 3.74%
R6 3.11% 51.78 51.78 51.78 49.50 84.77 84.77 56.80 56.80 4.60%
R7 2.40% 40.00 40.00 40.00 41.34 70.79 70.79 47.44 47.44 3.84%
R8 2.12% 35.27 35.27 35.27 38.04 65.15 65.15 43.65 43.65 3.54%
R9 1.47% 24.44 24.44 24.44 30.39 52.04 52.04 34.87 34.87 2.82%
R10 2.09% 34.73 34.73 34.73 37.72 64.60 64.60 43.29 43.29 3.51%
R11 1.51% 25.17 25.17 25.17 30.98 53.05 53.05 35.55 35.55 2.88%
R12 1.63% 27.07 27.07 27.07 32.43 55.53 55.53 37.21 37.21 3.01%
ARMM 1.63% 27.16 27.16 27.16 30.50 52.24 52.24 35.00 35.00 3.05%
R13 1.42% 23.64 23.64 23.64 32.82 56.20 56.20 37.66 37.66 2.84%
TOTAL 100.00% 1665.32 1305.19 609.71 609.71 1305.19 1665.32 874.57 1234.70 100.00%
Summary of Changes in ₱ Share
Hilario P. Martinez 45
2012 PROJECTED
2012 AMENDED
GRDP INCR
20:80 RATIO
- DEBT SERVC
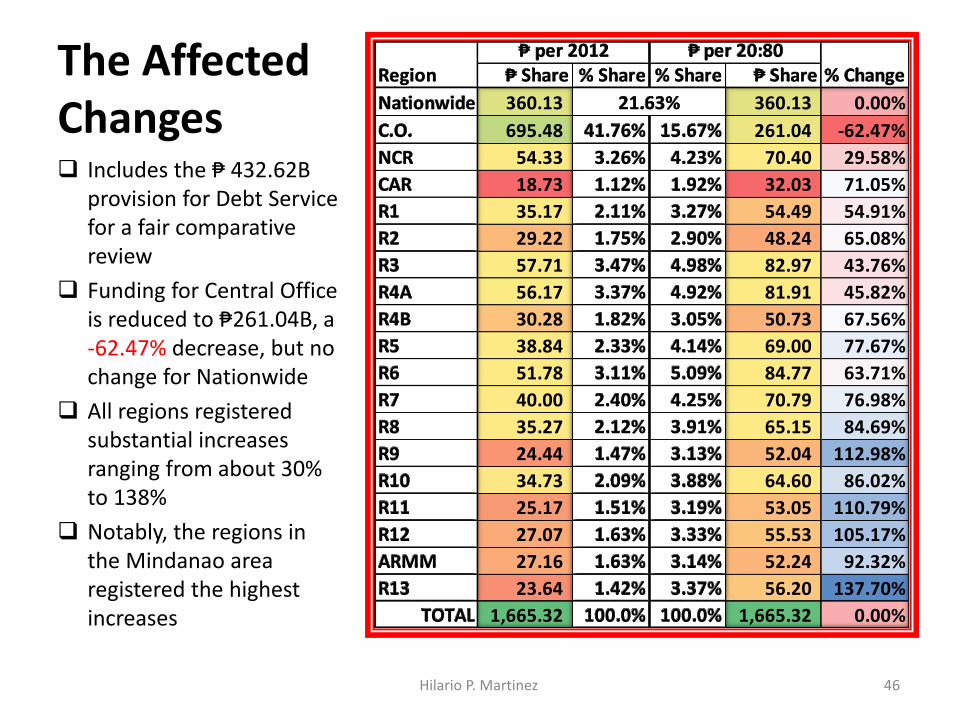
The Affected Changes Includes the ₱ 432.62B
provision for Debt Service for a fair comparative review
Funding for Central Office is reduced to ₱261.04B, a -62.47% decrease, but no change for Nationwide
All regions registered substantial increases ranging from about 30% to 138%
Notably, the regions in the Mindanao area registered the highest increases
Hilario P. Martinez 46
₱ Share % Share % Share ₱ Share
Nationwide 360.13 360.13 0.00%
C.O. 695.48 41.76% 15.67% 261.04 -62.47%
NCR 54.33 3.26% 4.23% 70.40 29.58%
CAR 18.73 1.12% 1.92% 32.03 71.05%
R1 35.17 2.11% 3.27% 54.49 54.91%
R2 29.22 1.75% 2.90% 48.24 65.08%
R3 57.71 3.47% 4.98% 82.97 43.76%
R4A 56.17 3.37% 4.92% 81.91 45.82%
R4B 30.28 1.82% 3.05% 50.73 67.56%
R5 38.84 2.33% 4.14% 69.00 77.67%
R6 51.78 3.11% 5.09% 84.77 63.71%
R7 40.00 2.40% 4.25% 70.79 76.98%
R8 35.27 2.12% 3.91% 65.15 84.69%
R9 24.44 1.47% 3.13% 52.04 112.98%
R10 34.73 2.09% 3.88% 64.60 86.02%
R11 25.17 1.51% 3.19% 53.05 110.79%
R12 27.07 1.63% 3.33% 55.53 105.17%
ARMM 27.16 1.63% 3.14% 52.24 92.32%
R13 23.64 1.42% 3.37% 56.20 137.70%
TOTAL 1,665.32 100.0% 100.0% 1,665.32 0.00%
₱ per 2012 ₱ per 20:80
21.63%
Region % Change

Comparison by Major Grouping
The rest of Luzon, the Visayas group and the Mindanao group all merited additional funds to hasten development
The Mindanao group gathered the highest increase in funds primarily due to the GDRP-based increment and the 20:80 ratio
NCR and Central Office has decreased allocation, with the latter having more than 70% decrease
The status quo in Nationwide fund is due to the flexibility required to be maintained for the National Government
Hilario P. Martinez 47

Fund Changes by Region
Hilario P. Martinez 48
NCR, Regions 3 and 4A, with their interfaced-economies, should harness the partnership of its private sector to sustain development
The rest of the Regions, obviously have not attained enough momentum, and thus will require additional funding and assistance to accelerate development

A Probable Future, A Doable Future …
Hilario P. Martinez 49
1st Five Years 2nd Five Years 3rd Five Years 4th Five Years
LEGEND: G1 = GRDP rate < 3.51 G2 = GRDP rate < 15.01 G3 = GRDP rate > 15.0
G1 G2 G3 G1 G2 G3 G1 G2 G3 G1 G2 G3 % % % %
… From a majority membership in G1, transitioning to be a member of G2, and ultimately as members of G3!!!

Complimentary Action Points1/
Require all RDCs* to develop, implement and coordinate a long-term development plan that is updated on a yearly basis
Mandate all regional subsidiaries of national agencies to make their programs and projects directly responsive to local needs, supportive, and complimentary to RDC-specific and -approved PPAs**
Limit the role of central offices in partaking line authority/responsibility for PPAs that are primarily region-based and region-specific; primarily in strategic coordination and integration
Hilario P. Martinez 50
* RDCs – Regional Development Councils ** PPAs – Programs/Projects/Activities
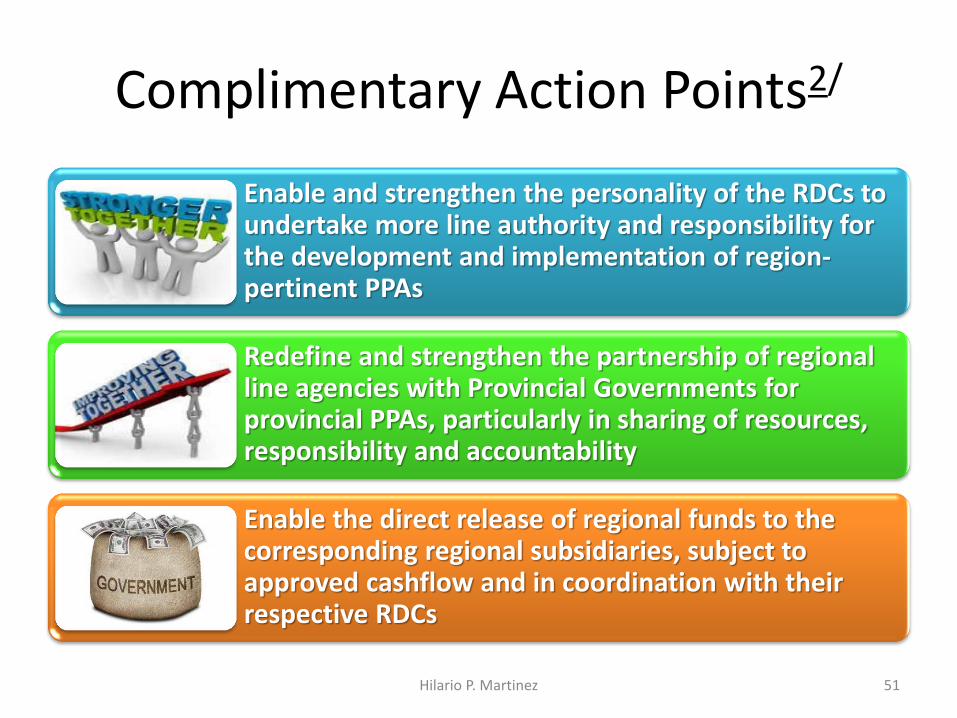
Complimentary Action Points2/
Enable and strengthen the personality of the RDCs to undertake more line authority and responsibility for the development and implementation of region-pertinent PPAs
Redefine and strengthen the partnership of regional line agencies with Provincial Governments for provincial PPAs, particularly in sharing of resources, responsibility and accountability
Enable the direct release of regional funds to the corresponding regional subsidiaries, subject to approved cashflow and in coordination with their respective RDCs
Hilario P. Martinez 51

Hilario P. Martinez 52


