CMAPUER 1 OPTOGALVANIC EFFECT AND ITS APPLICATIONS-AN OVERVIEW 1.1 INTRODUCTION The passage of electricity through gases usually produces a great variety of lumdnous phenomena which are typical for different kinds of the electrical discharges. Conversely. electrical phenomena can be generated in gases by absorption of light. Optogalvanic COG) effect is such a phenomenon in which impedance of a gas discharge changes due to the absorption of radiation by atoms. molecules, ions etc. of the gaseous sample or the electrode material present in the discharge. Early experiments on this effect usually involved two discharge tubes; one tube was used as a source of excitation which perturbs the population of species present in the second tube by’ exciting atoms from a lower to a higher energy state. Penning in 1928 [1] observed a change in the breakdown voltage when a discharge tube was irradiated with light emitted from an identical discharge. Joshi and co-workers [2] have also observed change in the threshold potential of an electrical discharge in presence of light; which they termed as light effect. Variation of voltage across He-Ne laser tube has been observed when it begins to lase [3] and ir: gas lasers this is much pronounced under certain operating conditions of the discharge. Although the O6 effect has been observed and used for a
Transcript
CMAPUER 1
OPTOGALVANIC EFFECT AND ITS APPLICATIONS-AN OVERVIEW
1.1 INTRODUCTION
The passage of electricity through gases usually produces agreat variety of lumdnous phenomena which are typical fordifferent kinds of the electrical discharges. Conversely.electrical phenomena can be generated in gases by absorption oflight. Optogalvanic COG) effect is such a phenomenon in whichimpedance of a gas discharge changes due to the absorption ofradiation by atoms. molecules, ions etc. of the gaseous sampleor the electrode material present in the discharge. Earlyexperiments on this effect usually involved two discharge tubes;one tube was used as a source of excitation which perturbs thepopulation of species present in the second tube by’ excitingatoms from a lower to a higher energy state. Penning in 1928 [1]observed a change in the breakdown voltage when a discharge tube
was irradiated with light emitted from an identical discharge.Joshi and co-workers [2] have also observed change in thethreshold potential of an electrical discharge in presence oflight; which they termed as light effect. Variation of voltageacross He-Ne laser tube has been observed when it begins to lase[3] and ir: gas lasers this is much pronounced under certainoperating conditions of the discharge.
Although the O6 effect has been observed and used for a
lumber of applications over the years. the usefulness of thiseffect for spectroscopic and analytical studies was realized onlyafter the development of tunable dye lasers. With the use oftunable laser systems it is possible to study this effect undermuch better and refined conditions and this has stimulated anincreased interest in the studies of fundamental as well as ofapplied nature. Green and co-workers in 1976 [4]. using a dyelaser source. have demonstrated the sensitivity of the method indetermining sodium contamination by detecting sodium atoms in alithium hollow cathode lamp.
Absorption of photons by atomic or molecular species willsignificantly affect the relative population of various levels inthe discharge. This results a change in ion generation rate.which in turn. causes a change in impedance of the dischargerequiring a different voltage to sustain it. The 06 signal cancorrespond to an increase or decrease in the discharge currentdepending on the kinetics of the levels whose populations areperturbed by the laser. If the laser excite atoms from a levelwith a small probability of ionization to a level with a largeprobability of ionization. the discharge current will increaseand the discharge voltage will decrease. Alternatively if thelaser excites atoms from a level with a large probability ofionization to a level with a small probability of ionization thedischarge current will decrease and the discharge voltage willincrease. The latter situation often arises when the lower level
has a high probability of‘ collisional ionization, and upper levelis a short lived resonance level ['5].
The importance of 0G effect in spectroscopy and spectrochemical analysis was first demonstrated by Green [4] The use ofO6 effect for plasma diagnostics or for laser plasma interactionis possible only if we have a detailed information on variousprocesses in the discharge under investigation. However, for manyspectroscopic applications. any ionized gas can be considered tobe a black box whose impedance and electrical output isspecifically controlled by the input of a monochromatic light. Ingeneral. the small change in the discharge voltage AV can beconsidered as proportional to the change in local population ofthe excited states. AN as generated by the absorption ofiradi ati on thr ough [63
AI/=foI1AN1 (1.1)where
011 = 0V/BN1. i = 1.2. (1.8)This concept is based on the variation in density for eachexcited state within the discharge volume. Zelewski et al [7]have also shown that the relative variation of the plasmaimpedance for weak 06 signal depends on the relative opticalabsorption and the temperature.
Laser optogalvanic spectrum is recorded by monitoring the
3
change in voltage across the discharge tube as a function ofwavelength of the probe laser beam. An experiment involving OGeffect compliment the usual experiment in atomic or molecularspectroscopy, where the spectra are recorded using a spectrograph
on a photographic film or with monochromator and photo detectors.
Line width observed in 0G spectrum is that of the dye laser whichis considerably smaller than those obtained with usual methods.With a single mode ring dye laser and by making use of Dopplerfree techniques. resolution up to of a few MHZ can be easilyobtained. OG detection is distinguished from other spectroscopicmethods by the presence of a sustained discharge with an electrongas at a relatively high temperature. Because of this hightemperature in the discharge. there are significant atomic andmolecular populations in excited states and hence transitionsbetween the excited levels in atoms or molecules can be detected.
Refractory elements. which have very high melting point. can beconveniently studied with this technique.
Several types of electrical gas discharges are currentlyused for O6 spectroscopy COGS). Some of them are low pressurepositive columns. hollow cathodes. and plane diode typedischarges [8]. The properties and mechanism of these dischargesare thoroughly discussed in many standard books on ionized gases[9-12]. An electrical discharge can be produced by applying ahigh voltage between two electrodes within the cell which isfilled with a gas at pressures of a few torr Under the
influence of the electric field. this gas will get ionized andmost of the discharge properties are characterized by variousexcitation and de-excitation processes of the species present inthe discharge. The simple experimental setup for observing OGeffect consists of an electrical discharge produced in a gascell. provided with two electrodes between which a stable dcvoltage is applied[4J. A ballast resistance is used to limit thecurrent in the circuit. The modulated laser beam is passedthrough the cell. which results in a change in impedance of thedischarge by resonant absorption of radiation. A couplingcapacitor blocks the dc voltage and the change in impedance canbe measured directly on an oscilloscope. Pulsed or cw lasers canbe used for exciting the discharge medium.
The advantages of O6 effect over other spectroscopic methods
are that the voltage signal can be directly used forspectroscopic or analytic measurements eliminating the need tomonitor irradiating source optically as in absorption or emissionspectroscopy. Since no optical measurement is required inmonitoring the signal. the problems associated with thecollection efficiency. scattered light etc.. do not limit thesensitivity. From an experimental point of view. the method issimple and convenient; the discharge medium acts as the sampleand a pair of electrodes with a coupling capacitor are sufficientfor detection.
Main source for noise in the experiments are statistical
5
fluctuations of electrons arising from plasma instabilities. ifthe cell is not operated in a range of current corresponding to astable discharge region[i3]. If the discharge remains stable. thenoise can be minimized to the level of shot noise determined bythe current flow through the resistance which is in series udththe cell. For OGS studies the selection of gases. electrodematerial. cell configuration. applied voltage. pressure etc. mustbe such that the random fluctuations of the electrical outputleading to noise is minimum.
Sflgnificant progress has already been made in understandingthe 0G effect both qualitatively and quantitatively. The aim ofmany .investigations made with different experimental anddischarge conditions has been to understand the mechanisms whichregulate the CG signal production. Laser optogalvanicspectroscopy is particularly a powerful technique for providingspectroscopic information unobtainable from conventionalspectroscopic methods. The optogalvanic studies. to date. havebeen carriedout using visible laser radiation. The O6 detectionprovides valuable tool for studies in the ultra violet andinfrared region of the spectrum as well. UV photons have energies
of the same order of magnitude as the ionization potential ofmany atoms/molecules and the O6 effect refers to a perturbationin the ionization states and hence OGS in the UV region is quitepracticable[14]. Laser optogalvanic signals in moleculardischarges produced by IR laser excitation have been reported for
several molecules [15-16]. Current interests of O6 effect aremostly for a wide variety of spectroscopic and analyticalapplications with particular interest in high resolution studiesdue to its high sensitivity and selectivity[17}.
1.2 GAS DISCHARGES - EXCITATION METHODS
Two type of schemes commonly used for producing discharges
are by direct current Cdc) and radio frequency Crf)excitation[8). In dc OG technique. an electrical dischargeproduced by a stable dc voltage is irradiated with a laser beam.A resistance. which limits the current in the circuit. isconnected in series with the cell Cfig 1.1). The gas pressureand the discharge current are adjusted to get a nunimum noiselevel and the output is taken via a coupling capacitor whichblocks the dc component. Plane diode type or positive columndischarges are commonly used for gaseous samples and hollowcathodes are used for solids. including refractory metals. Moredetails of the discharge cells and about the experimental aspectsare discussed in chapter 3.
Detection of optical resonant absorption in gases with radiofrequency excitation. in an electrodeless cylindrical dischargetube was first demonstrated by Staciulescu et al [18]. Anothersimple scheme for observing optogalvanic effects in the rfdischarge has also been reported by Suzuki[19J is as shown in fig1.8. In this method. the discharge is produced by applying an rf
Modulated beom _Discharge Cell
Light SourceJ
CRO J R
Fig 1.1 Simple experimemtal arrangement for 0G effect.
RF Tttmsmiiler
gas L TpumpJ M ‘ _ cV '7 W Su i
CW Dye Laser Ia Cower H "9ref ‘1 3%R L _ < ’\/\/\r—'
Sig Tuned Amp
Fig 1.2 06 effect with rf excitation CC-discharge cell.L-lock-in amplifier and R—chart recorder)
field having an output power of 2 50 watts. to two electrodesseparated by 5 to 10 cm of a glass tube of length 2 40 cm anddiameter 10-30 mm. The electrodes are copper plates with a widthof 1 cm which are wound around the tube. A pickup coil aroundthe tube and the capacitor forms a tank circuit which is adjustedto be resonant with the applied rf field. Signal picked up bythe coil are rectified and passed through an amplifier tuned tothe modulation frequency. The output is monitored by anoscilloscope and measured with a lock in amplifier. The dischargecondition and the magnitude of the signal depends on the gaspressure. tube diameter. electrode spacing. rf power. laser powerand molecular species. The best combination of these parameterswhich gives maximum signal is different for each molecules.
In rf electrodeless discharges. the entire plasma isapproximately neutral and diffusion controlled which oftenresembles the positive column of an equivalent dc dischargewdthout the complications of the cathode and anode regionsobserved as in dc glow discharge. In contrast to dc discharges.the use of high frequency electrodeless discharges for OGS hascertain advantages viz., Ca) much lower discharge power levelnunimizes broadening due to the collision of electrons and theline shift of spectral lines, Cb) spatially homogeneous plasmaCc) high electron temperature allows the excitation of a numberof levels and Cd) a complete elimination of the noise caused bythe cathode sputtering. High frequency detection technique is
readily adaptable for the studies of unstable molecules whichare reactive to metal electrodes in the discharge tube. Asimple theory of the O6 effect in low pressure rf discharges ofAr and Cesium has given by Bulyshev [80].
The rf detection appears to be suitable for Rydberg statespectroscopy [81]. high resolution spectroscopy[22.33] etc. andusing these methods optogalvanic detection of negative ions ofmolecules [84] Ar metastables [85]. frequency stabilization [26].measurements of predissociation rates of .3 state of HCO [87] etc.have been reported. Investigations on 0G effect in microwavedischarges have also been reported in the literature[28.8Ql
1.3 06 EFFECT IN FLAME
In contrast to electrically sustained discharges. flame is achemically sustained plasma and the laser induced galvanicstudies can also be adopted to flame. OGS in flames. also knownas laser enhanced ionization (LEI) spectroscopy. has become amost promising tool for the quantitative method for the traceanalysis of elements[5.30—33J. The common atom reservoirs foranalytical atomic spectrometry are atmospheric pressure flames.furnaces and electrical plasmas. Such environments promote somelevel of ionization of atomic and molecular species. depending onthe ionization potential of the species. Enhanced ionizationrate due to the thermal collisions of laser excited and otherspecies constitute the basis of the 0G effect in flames or in
[0
laser enhanced ionization.
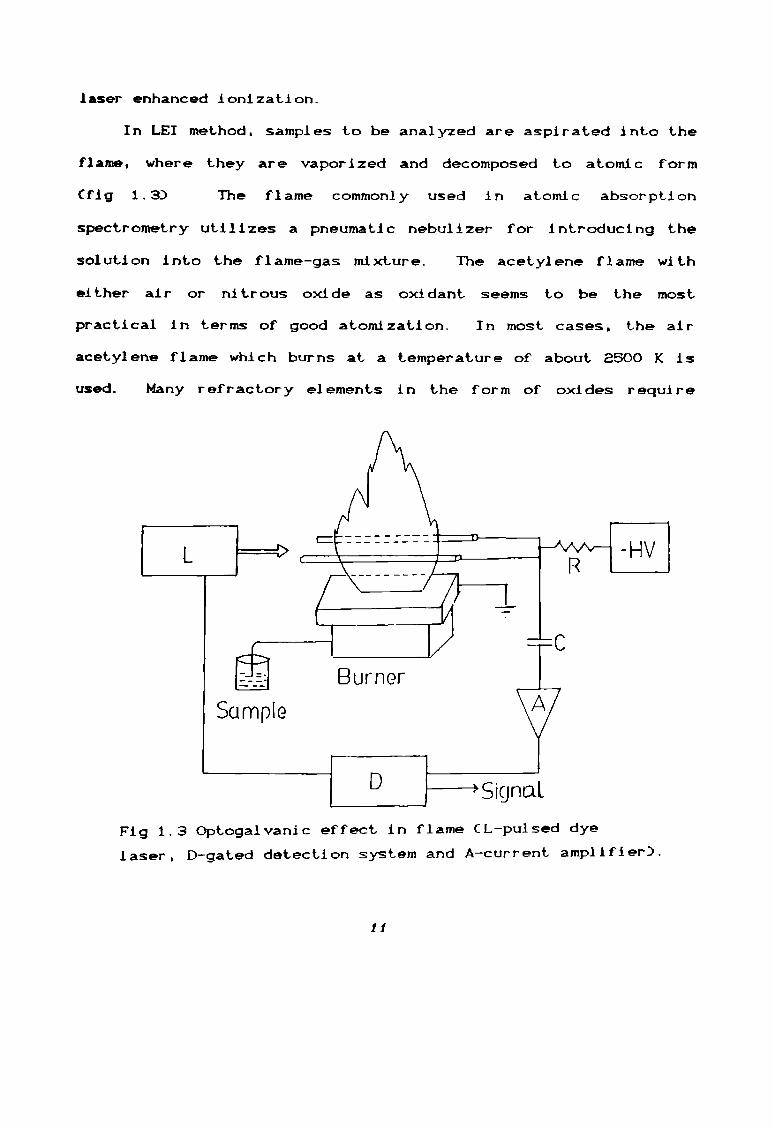
In LEI method. samples to be analyzed are aspirated into theflame. where they are vaporized and decomposed to atomic form(fig 1.3) The flame commonly used in atomic absorptionspectrometry utilizes a pneumatic nebulizer for introducing thesolution into the flame-gas mdxture. The acetylene flame wdtheither air or nitrous oxide- as oxidant seems to be the mostpractical in terms of good atomization. In most cases. the airacetylene flame which burns at a temperature of about 3800 K isused. Many refractory elements in the form of oxides require
2'"; BurnerSample AD -_’SignaL
Fig 1.3 Optogalvanic effect in flame CL—pulsed dyelaser. D—gated detection system and A—current amplifier).
11
hotter nitrous oxide flame C3000 K) to achieve efficientatomization. Use of a tunable dye laser for the resonantexcitation of the element of interest results in a significantperturbation of the population of energy levels. The enhancedrate of collisional ionization of the resulting excited atomsrelative to those in the ground state is the basis of the laserenhanced ionization technique. To detect the occurrence of theLEI. a voltage is applied across the flame and the resultingcurrent is monitored. LEI signal appears as change in thiscurrent. and is thus most easily detected by using pulsed oramplitude modulated cw lasers with synchronous detection. Evenwith no bias voltage, enhanced ionization always occurs in flameswhen the species are optically excited. It is only to collect thefree charge carriers created by LEI that an external electricfield is necessary. In general. the signal is caused by themoticw: of electrons and ions from the laser irradiation zonetowards the biased electrodes. Due to the difference between ion
and electron mobilities there is a build up of net positive spacecharge sheath in an electrical field distribution which resemblesthat of negative Langmuir probe. The alignment of the laser beamclose to the cathode within the cathode sheath greatly increasesthe collection efficiency of charged species. Theoretical andexperimental developments of LEI in flame are studied in somedetails by many workers [30—34L Numerous elements have been
investigated by LEI spectroscopy using single and multistep laser
12
excitation. The limit of detection is in the range of 1-10-3ng/ml [30]. Besides the trace element analysis. the 0G effect inflame is also suitable for diagnostics of combustion phenomenaand spectroscopy of molecules and radicals.
The applicability of multi photon optogalvanic techniques toprobe the hydrogen plasma is reported by Ausschnitt [35]. Reporton the use of O6 effect for dark space diagnostics of a hollowcathode discharge [36], investigations of cathodic region of neondischarge [37] and space charge effects [38]. analysis ofTownsend discharge [39]. measurement of electric field. absolute
metastable density and temperature in the cathodic region of aglow discharge [40,41] etc. are also available in literature.
1.4 APPLICATION TO ATOMIC AND MOLECULAR SPECTROSCOPY
Experimental simplicity is one of the most attractiveaspects of optogalvanic spectroscopy. Optogalvanic detectionprovides a convenient means of observing an optical transitionwithout requiring any conventional optical detectors [48—45].
Laser induced galvanic study of electrical discharges,flames and plasmas have provided a wealth of information onspectral properties of atomic and molecular species. Unlikeemission or absorption spectroscopy. which require the use ofoptical detectors, optogalvanic spectroscopy is based on thedetection of variations in electrical impedance caused byresonant absorption of laser by atoms or molecules. In the latter
13
case the discharge itself acts as both spectroscopic sample anddetector of the perturbed atoms/molecules in the medium.Generally. the impedance variations are controlled by variousionization processes in the discharge. For most of thespectroscopic applications. however. a detailed knowledge of thelaser plasma interaction mechanism is not necessary. Laserinduced OGS is particularly a powerful technique for providingspectroscopic informations which are unobtainable using otherspectroscopic techniques such as laser induced fluorescence.absorption etc. and is widely used for Doppler free spectroscopy[46]. level crossing OGS [47—49]. two photon spectroscopy[50-56]. Rydberg spectroscopy [S7—5Ql. penning ionizationspectroscopy [60,61] etc.
Many refractory elements are best studied in hollow cathodedischarge Chcd). where ions or electrons colliding with thecathode remove atoms from the cathode by sputtering. making thesputtered atoms accessible to gas phase optical spectroscopy.Since these materials are part of the discharge. OGS provides themost straight forward technique for studying them. Due to arelatively high temperature in the plasma. there are significantatomic and molecular populations in levels far from the groundstate. Hence OG effect can be used to detect transitions petween
excited levels in atoms/molecules and the spectra of ions. freeradicals etc. of refractory elements. OGS investigations usingmultistep laser excitation with dye laser has been demonstrated
14
as another technique for studying highly excited atomic levels.OGS provides an important alternative to absorption or
fluorescence studies for the determination of spectroscopic datasuch as relative oscillator strength. electron temperature.isotope and hyperfine structure measurements. determination oftransition energies [68]. measurements of line broadening andline shifts. determdnation of Lande g factor [633 etc. Use of 0Geffect in various other fields like for the study of Zeemaneffect [64]. autoinization spectrum of Kr [65]. frequencystabilization [6B—70]. intracavity atomic absorption measurements
[71]. the detection of photons [72]. etc. have also beenreported.
It is only recently that laser optogalvanic spectroscopy hasbeen applied to study molecular species. Feldmann [73] extendedthis technique to molecular species; although the signals wereweaker by several orders of magnitude as compared with those ofatoms. At present OGS has been successfully used to record thespectra of molecules in the visible and IR [74—78] region.Webster et al [153 have studied the LOG signal of molecules inthe IR wavelength region by using tunable diode laser Results
of investigations of simple diatomic molecules like I2 [79—85J.N2 [19,73] and of many complex molecules are also available inthe literature. CGS technique has been applied to the detectpositive molecular ions [86]. negative ions £84.87]. and for themeasurement of photo detachment [15] phenomena. Several lines
15
belonging to the va band of NH3 at 9.5pm and the v3 band of N08at B.8pm have been studied by Webster [15] and found thatabsorption spectrum is directly comparable with LOG spectrum.Sflngh et al [88] have studied low pressure dc discharges ofammonia from excitation of ground as well as excited vibrational
states with a line tunable coé laser and have estimated thevibrational and rotational temperature of the discharge.
Even though OGS overcomes most of the limitations in theconventional studies of gaseous media. it does have limitationsof its own. The technique has. inherently. very highsensitivity. although attaining this sensitivity may require someeffort to produce an electrically quiet discharge. The pressureand current necessary to operate the discharge in a stable regimemay perturb the atomic or molecular energy levels of interest.although this generally does not appear to be a significanteffect in moderate resolution spectroscopy.
1.5 OSCILLATOR STRENGTH MEASUREMENTS
Zelewski et al [7] have observed that for certaintransitions in a neon hollow cathode discharge. magnitude of theimpedance change is proportional to the product of thewavelength. degeneracy of the initial level and the oscillatorstrength. Keller et al [89] have also demonstrated that. laserinduced impedance changes could be used for the determination ofoscillator strength and electron temperature of an electrical
16
discharge. These authors measured the laser induced impedancechange for some transitions of neon and uranium for which themagnitude of the impedance change depends only upon theproperties of the initial level i. such that
———i G A f [A] C1.3)
where A211 is the laser induced impedance change at Kij. Iij isthe laser intensity which is a normalizing factor in thesemeasurement. f is the oscillator strength of the transition and1J[A] is the concentration of the level 1. given by.
._{A1 a giexp { -——— C1.4)k T
where gi is the degeneracy of the state 1. Then.
AZIJ _ E1—~—— G A 3 f exp -——— (1.5)ij i ijIij h TThus. log[A2iJ/Ixgf] verses EE plot will be a straight line fromwhich oscillator strength and the temperature of the dischargecan be evaluated. However in the case of calcium. Bechor et al[90] have observed a large inaccuracy in measuring the oscillatorstrength by this method. Major uncertainties in the measurementof oscillator strength are due to the following reasons.1) The 0G effect has a strong spatial dependence.
I7
2) The interaction of laser beam with plasma is a complex processand is usual1)r non—linear with respect to parameters such asnumber density. electron density. the temperature etc.
1.6 WAVELENGTH CALIBRATION
In laser spectroscopy. as in classical spectroscopicmethods. it is often necessary to have a source of accuratelyreproducible reference wave numbers. The desirablecharacteristics of a reference spectrum are; it should be easilyand conveniently’ observable. lines of the spectrum should behighly reproducible and the source should have a good spectraldistribution of useful reference lines. A number of sources have
been proposed and used for laser wavelength calibration. The mostwidely used source for this purpose is the absorption spectrum ofmolecular iodine. It has good spectral coverage and easy to use.but its accuracy is limited by the unresolved hyperfine structureand asymmetric Doppler brodended lines.
King et al [91] have shown that OG effect provides a simpleand accurate technique to measure laser profile and for directwavelength calibration of spectral lines. The technique isequally successful for cw and pulsed lasers. Calibration spectrumis recorded with a portion of the reflected laser beam. using abeam spli tter . whi ch pr ovi des si mul taneous measurement of the
laser wavelength and the spectra derived from the experiment.Thus the laser wavelength in any spectral region can be
18
calibrated by utilizing an appropriate discharge lamp. OG effectin hollow cathode discharge (hcd) lamps has been extensively used
in spectroscopy for calibrating dye laser wavelength [14.91—100l.Most of the commercially available hcd lamps. which containselected cathode material and filled with a buffer gas like neonor argon. are suitable for this.
Transitions associated with rare gases are often used forwavelength calibration because of their high intensity.Investigations of 06 spectrum of neon and argon in a widespectral region. which is useful to calibrate both cw and pulsedlasers. have been reported. The use of transitions in uraniumand thorium discharges have been proposed as being well suitedfor this purpose because of their narrow line width and theavailability of a large number of lines in the IR. visible and UVspectral range. Many lines covering a broad spectral region areeasily observable in most of the commercially available hcdlamps. The accuracy in the wavelength measurement of lines using
these lamps is limited only by Doppler broadening and the lineshifts due to collision process.
As an aid to wavelength calibration, Keller et al [99] havestudied the relative intensity of the laser induced voltagechange with the intensity of the corresponding emission line ofneon over a wide wavelength region. In a Uranium hcd at constant
current the ratio of the voltage change to the laser intensityfor cw laser excitation is given by
19
AV E——£J a RiJf1Jgiexp{--—£—} (1.6)I h TAViJ is the observed voltage change when the laser wavelength Aljamwesponds to the £1 —+ EJ transition, fij is the oscillatorstrength of this transition. 31 degeneracy of the initial Cith)state. E1 is the energy of this state and I is the laserintensity. The intensity of the emission line is given by
8. f EF31 u -§i——%i gJexp{P-4-} (1.7)J AlJ kbT
In this case the initial state is the jth level. For a small
wavelength region Aij does not change appreciably and EJ=E1+hv1J.Thus these equations can be rewritten for comparison over a smallwavelength region as
AV E-—iJ a f1Jgiexp{s-—£- (1.8)I h Tand
E:FJ1 a f1Jg1exp{--———} (1.9)hbT
where the factor k‘3 and exp C-hu/kbT) have been incorporated inthe proportionality constant. Inspection of eqns (1.8) and (1.9)indicates that there should be a correspondence between the laser
20
induced voltage and the intensity of the emission line. Thiscorrespondence indicates that OG effect is useful for wavelengthcalibration.
Effect of photoelectric emission on (X3 effect is anotheremerging area of light—matter interaction. Photoelectricemission is troublesome especially in the ultraviolet regionwhere the photon energy exceeds the work function of the cathodematerial. As the photon energy approaches the work function. theentire surface can contribute to photoelectric emission and thereis a large increase in the 06 signal Hence. when this method isused for wavelength calibration in the UV spectral region.photoelectric emission from the cathode will mask the 06 signal.This is especially true for pulsed excitation where it can be aserious problem even in the visible region. Construction of thedischarge tube- with a clear optical path through the cathodewould be very useful at shorter wavelength. Dovichi et al [100]have constructed a tubular hollow cathode discharge tube suchthat the laser light can pass through the centre of the dischargewithout striking the cathode surface. The use of this tubular hcdeliminates interferences from photo emission and permitswavelength calibration of pulsed lasers at shorter wavelengths.Babin et al [101] have also developed a convenient iron hcd formeasuring the reference wavelength in the 810-300 nm region which
is suitable to use for high resolution measurements.Recently. a fully automatic wavelength calibrator has been
21
developed to calibrate the dye laser system (102). In this systemwhen a target wavelength is put into the keyboard. the computerscans the laser wavelength and takes OG signal of the hcd lampwhich is installed in the dye laser system. Then the wavelengthof the laser is tuned to the target comparing with the reference06 line. In this system the reproducibility in the absolutewavelength calibration over a spectral range from 220-740 nm isbetter than : 1cm’1
1.7 SPECTRAL PROFILE OF THE 06 SIGNAL
Spectral profile of a transition in a gas discharge has afinite width and the characteristic shape is determined by theconditions existing in the source. Different processes thataffect spectral profile are due to natural broadening, Dopplerbroadening and the broadening as a result of interaction ofabsorbing or emitting atoms with the neighboring particles.
Doppler broadening is caused as a result of randomdistribution of transition frequencies due to the random thermalmotion of atoms in the discharge medium (103). The shape andwidth of the spectral lines radiated from a discharge lamp isDoppler broadened. The Doppler width can be reduced by coolingand operating the discharge at low currents. In laserspectroscopy. there are several techniques to eliminate this.Intermodul ated optogal vani c spec tr oscopy. pol ar 1 zati onintermodul ated exci tati on . optogal vani c doubl e resonance
22
spectroscopy etc. are the commonly used methods for this purpose.Interaction between atoms, molecules. ions or electrons will
perturb the state of radiative atom and will cause linebroadening. line- shift or distortions in the» spectral profilewhich can also be investigated by 06S E104}. Due to a small linewidth and the tunability of the lasers along with a highselectivity of OGS. measurement up to a few MHz could be easilyattained I105].
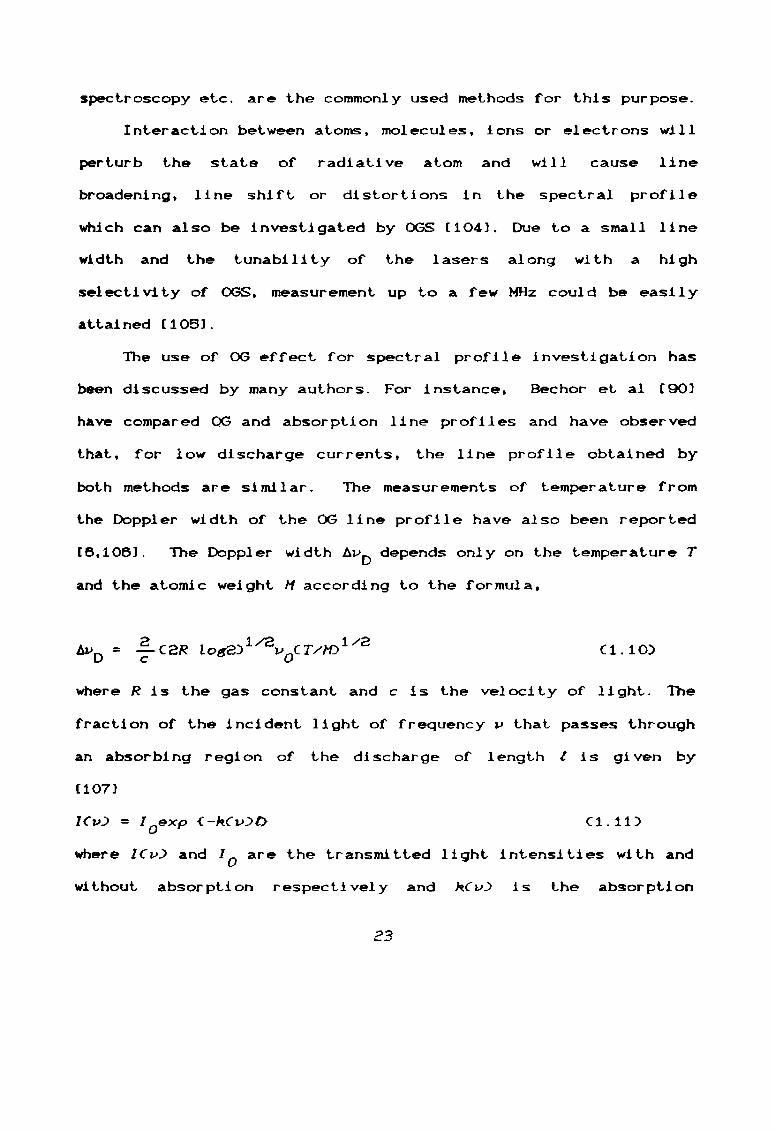
The use of O6 effect for spectral profile investigation hasbeen discussed by many authors. For instance. Bechor et al [90]have compared 0G and absorption line profiles and have observedthat. for low discharge currents. the line profile obtained byboth methods are simdlar. The measurements of temperature fromthe Doppler width of the 06 line profile have also been reported[6.106J. The Doppler width Au depends only on the temperature TD
and the atomic weight M according to the formula.
8 1/2 21/AvD = -E—C2R toga) v0CT/M) (1.10)
where R is the gas constant and c is the velocity of light. Thefraction of the incident light of frequency u that passes throughan absorbing region of the discharge of length l is given by[107]
I(v) = Ioexp {-R(v)C> C1.11)where ICv) and I are the transmitted light intensities with and0
without absorption respectively and h(v) is the absorption
23
coefficient as a function of frequency. The integral of theabsorption coefficient is expressed as [108]
2X 5jucwdu =- —9 -324»: c1.12)8n 31
where A0 is the wavelength of the transition. 31 and 52 are thestatistical weights of the lower and the upper statesrespectively. N is the atom density at the lower level and A isthe Einstein coefficient. When the Doppler broadening isdominant. the absorption coefficient at the line centre is givenby
h(v) = h exp {— [2 Cu-v0)Clog8)1/2/AvDJ2} (1.13)
where v and h are the frequency and the maximum absorption0 0coefficient at the line centre. Integrating eqn (1 12) oneobtains
2A 1/8 3it ——°—— 1°38 —a NA (1.14)o 4nAvD n 31
Thus. from the 0G spectral profile. the temperature T is obtaineddirectly from the Doppler width and the atomic density of thelower level N is obtained from the maximum absorptioncoefficient.
24
1.8 HGH RESOLUTION 0G SPECTROSCOPY
Random thermal motion of atoms or molecules in a dischargecauses their resonance frequencies. as seen by a stationaryobserver. to be shifted by the Doppler effect. Since the sampleas a whole consists of atoms and molecules moving in alldifferent directions with a large range of velocities. theadditive effect of this individual shift is to broaden thespectral lines. This Doppler broadening is often the factor thatlimits the resolution obtainable in a standard spectroscopicexperiment. Several techniques have been developed tx> overcomethis limitation and to obtain a much better resolution. TheDoppler free saturation spectroscopy and two photon spectroscopy
have recently been combined with optogalvanic detection toincrease the range of applications of these methods to highresolution spectroscopy.
Doppler free intermodulated optogalvanic spectroscopy(IMOGSD. similar to saturation spectroscopy. is first describedby Lawler I109]. In this method. radiation from a single modelaser is split in to two beams of roughly equal intensity. and
both beams mechanically chopped at two different frequencies f1and fa are passed through the discharge from opposite directions(fig 1.4). If the laser is tuned to the centre of a transition.both beams will interact with the same group of atoms. havingzero velocity’ component along the beams. and thus avoids theDoppler shift. In this case. non—linearity caused by these two
25
DYEIASER
BS
WSOVRGE
LOCK-IN AMPLIFIER
Fig 1.4 Experimental scheme for 1nLermodu1atedoptogalvanic spectroscopy.
\"
MW2 /DYE LASER
M
NH?
REF
LOCK—lN AMPUFER
Fig 1.5 Principle of optogalvanic double resonance
wl
W1OYELASER
W2XJ
spectroscopic experiment.
26
gabeams saturate the same group of atoms to produce Doppler free
_;-jisignals modulated at frequencies Cf1+f‘aD and (f1-fa) in addition
to the Doppler broadened signals at fl and fa.Comparison of intermodulated optogalvanic spectroscopy and
Doppler free saturated absorption spectroscopy indicates thatIMOGS is more sensitive than the saturation absorptionspectroscopy. This method is an extremely simple technique and ismost useful when low noise detectors or high quality opticalcomponents are unavailable. Doppler free 114065 is widely usedfor isotope shift measurements. hyperfine structure studies and alarge number of atomi c and mol ecul ar spectr oscopi cinvestigations. Bevereni et al [110] have demonstrated thatDoppler free intermodulated optogalvanic detection could beapplied to Zee-man spectroscopy of volatile and non-volatileelements in hcd without loss of accuracy or resolution formagnetic fields larger than 180 Gauss.
When the gas pressure in the discharge cell is of the orderof 0.1 torr or greater. the recorded Doppler free spectra showsharp peaks on the top of broad pedestal. These pedestals areattributed to velocity changing collisions which tend toredistribute the population of the ground or metastable levelatoms over the original Maxwellian distribution and thus reducingthe velocity selection of‘ the saturating beams consequentlyresulting into the Doppler broadened spectrum. This problem canbe eliminated by the method of polarization intermodulated
27
excitation CPOLINEX) developed by Hansch [111]. In POLINEX. the
polarization of one or both of the beam is modulated rather thanthe intensity of the beam as in IMOGS. In this way. bymodulating the polarization rather than the intensity. thedetected Doppler free‘ signal arises front light induced atomdcorientation, and the atoms which suffered a velocity’ changingcollision will no longer contribute to signal if theirorientation are destroyed. POLINEX can take advantage of therules for the absorption of the polarized light to yieldinformation on the angular momenta of the participating energylevels.
Another interesting technique for state selective atomic andmolecular spectroscopy proposed by Vidal [112.113J is by makinguse- of optogalvanic double- resonance COGDRD. In this method.discharge is irradiated by two tunable lasers operating atfrequencies mi and we. The two laser beams. modulated atfrequencies f1 and fa respectively. are passed into the dischargetube from opposite directions. The laser—induced change in thedischarge current is detected by a lock—in amplifier at a
frequency Cf1— £23 or Cf1+ F2). The principle of the method isexplained in fig 1.5. Laser 1 is tuned to a transition wab andinduces an intensity dependent change in the population densitiesof levels a and b. Depending on the ionization rates of levels aand b. this gives rise to a modulation of the plasma discharge
current detectable at modulation frequency fl Eumdlarly. laser
28
3 is able to generate a detectable signal at modulation frequencyf if it is tuned to some other transitions of the system under2.
investigation. If‘, however. both lasers simultaneously pumptransitions that have one state in common. one can generatelaser-induced changes of the plasma discharge current that areproportional to the product of the two laser intensities involved
and that can be detected at a frequency Cf1- fa) or Cf1+ fa).In the OGDR experiment. frequency mi of laser 1 is tuned to
a particular transition frequency (nab. An OG signal at frequencyCf1— fa) or Cf1+ fa) can be detected by scanning the laser 2 iflaser 3 coincides with a transition that has state a or b incommon. One, therefore. has a state—selective version of 06S.
1.9 ISOTOPEZ ANALYSIS
Since for low laser intensities. 0G effect is proportionalto the density of the absorbing species. it was suggested byKeller at al [89] that. isotopic analysis of elements could beperformed by laser induced optogalvanic spectroscopy in hollowcathode plasma-. Due to the presence of Doppler broadening andhyperfine structure. the accurate measurement of isotope shift byclassical method is very difficult. However. using Doppler freemethods such as IMOGS I109]. POLINEIX OGS [111] etc. . the optical
isotope shift with an accuracy of a few MHz could be measured.Hollow cathodes are extensively used for isotope analysis. sincethey are characterized by narrow spectral line with electron
29
temperature 2 3500 K and hence any element including refractorymaterial can be investigated. Details of the dependence of the 06signal strength on isotope concentration in uranium hcd was firstreported by Pianorasa et al [114].
The transition energy for atoms of different isotopes from alevel of energy E’ to a lower level of energy E" will be
Eg- E3 = hug and Ek- E5 = hufi (1.15)
where a and B denotes heavier and lighter isotopes respectively.
Then hfiv - va) corresponds to optical isotope shift which can beI?
measured by scanning the laser wavelength over the transition.The determination of the ratio aN / 3N of any two isotopic
pairs a and (3 of an element by 06S consists of measuring thedensities “N. HN of these two isotopes. that being in two givenisotope shifted energy levels, which absorb the incident laserphotons. This absorption can. in principle. produce positive andnegative 06 signals. where. the sign depends on the particularlevel being excited and hence on the configuration to which itbelongs. For a given isotope pair. whose energy difference isdue to the isotope-shift term belong to the same configuration.It follows that in most cases for a given isotope pair. the O6signals wdll have the same sign.
The 0G signal SCv) for a transition at a fTequency v isrelated to the absorbed laser intensity AICD3 by
30
SC») = CDAICU) C1.16)where D is the geometrical cross section of the laser beam and Cis a proportionality factor which is constant for a giventransition. for all isotopes. In the case of a homogeneousabsorbing layer of length 3 illuminated by a laser-beam ofintensity I which is sufficiently low so as to avoid saturation.equation 1.16 becomes
50») -= CDI{1 — expt-hCv)tJ) C1.17)
where K») is the frequency dependent absorption profile of thetransition. For small absorptions 120.»)! << 1. eqn.C1.17) can bewritten as
SC») = CDIkCv)£ (1.18)The explicit hCv)£ dependence of 5(1)) can be used to relate SCI»)
to the atom density in the lower level of the transition by usingthe re). ati on .
3 .V (1.19)Ihcvbdv = 8”“)
where [J] = 8J+1; J and J’ are the statistical weights of thelower and upper l evel s . respecti vel y, A i s the E1 nstei n
31
tmansition probability and N is the isotope population in thelower level. In a hcd. the significant line broadening effect isthe Doppler broadening due to thermal motion of the atoms.Atomic absorption line shapes are then well approximated by aGaussian profile and eqnC1.19) can be rewritten as
1/81 nIRC»-Dd» = 5 [log 3] RoAvD (1.20)where ho. the absorption coefficient at the line center is givenby 8 1/2_ Ao[J']A log 2"° - "' “-3”and AvD. the Doppler width of the transition CFWHM). is given by
12 1/2A» = §;lfZ§£9_ [ T ] c1_g3)D X0 77with xo in Angstroms. T in kelvins and H .in amu. Thus fromequations (1.17). (1.18) and (1.31). one obtains the relationshipbetween the 06 signal at the line center So and the density ofthe absorbing atoms N as
4n[J]AvD " 1/2 1 50N = ——————— [— log[1- (1.23)X30,” log 2 T CD12for strong absorption and
32
4n[J}AvD n 1/8 soN = [ ] (1.243x°[J_}A log 2 CD12
for weak absorption.
Eqns. (1.23) and (1.84) are valid for isotopes having zeronuclear angular momentum. In the case of odd isotopes for whichthe nonzero nuclear angular momentum produces hyperfine splittingof the atomic transitions, then the relation between theintegrated 06 signal and the density of the atoms can be writtenas I114).
N = -??—§£££L——J3Cv)du c1 35)Ao[J'}ACIDl
Studies on uranium isotopes [114] indicates that theconcentration and the measured OG signal at the line centre fordifferent isotopes. for weak absorption. satisfies the relation
234 234———E 2 5° C1 28)238” 23350
The Theoretical detection limit attainable for even isotopes isof the order of 106 atoms/cm3 [114]. Isotope splitting oftransitions in U. Mo. Ne etc have been reported by manyresearchers by employing OGS techniques [25.8Q,114-117]
33
1.10 HYPERFINE STRUCTURE ANALYSIS
Hyperfine structure of atom arises mainly as a result of theinteraction of magnetic moment of a nucleus with the electric
field produced by the valence electrons. Wave number TF of the Fcomponent of an atomic level is given by the expression [1183
_ g r3ccc+13 —4ICI+1)JCJ+1)JTr ' 76* A2 + B 8IC8I+1)JC2J+1) C1‘373
where
c = FCF+1) -ICI+1D —JCJ+1) c1.ae)and
F = I+J. I+J-1.. [I-J] (1.29)To is the wave number of the level if there were no hyperfineinteractions and I is nuclear spin. The splitting constants Aand B due to magnetic and electric interactions are respectivelygiven by
p H co)A =__£_l___ c1.3o)IJ
andB = eQVCO) C1.31)where pl is the magnetic dipole moment of the nucleus. HJCO) isthe magnetic field produced by the electrons at the nucleus. Q isthe nuclear quadrapole moment and VCOD is the average of thefield gradient at the nucleus. According to the equation (1.87).
34
the magnetic and the electric interaction between the nucleus andthe orbital electron splits a fine structure multiplet level ofquantum number J into a multiplet of hyperfine structure levels.The number of levels is equal to the number of possibleorientations of I and J ie. 8I+1 if J 2 I and 2J+1 if I Z J.
The small magnitude of the hyperfine splitting and the largeDoppler width of the spectral lines makes accurate measurementsvery difficult. Development of high resolution laserspectroscopy have resulted into a variety of interesting andpowerful technique to measure hyperfine splitting. For accurateuwasurement of hfs. the Doppler free methods have to be used.However. for heavier elements the Doppler broadening at roomtemperature is in the range of 600-900 MHz while the hyperfinesplittings are in the range of a few GHz, so that Doppler limdtedtechniques are sufficient I119].
The sensitivity of OGS technique is quite high as comparedwith other methods and it can be used for the study of most ofthe elements in the periodic table. In this method. atom aresputtered from the cathode of a hollow cathode lamp. filled wdthan appropriate buffer gas at a suitable pressure. The sputteringtechnique eliminates the need to have a high temperature cell ora heat pipe oven and is readily applicable even for refractorymetals. Another advantage is that highly excited state or singlyionized atoms can be produced in sufficient density" so thatspectroscopy in these species can be easily carried out without
35
the need of multistep excitation. Results of the hfsinteractions using OGS applied to sputtered atoms in hollowcathode lamps for a large number of elements are available in theliterature (116. 119-183].
1.11 PHOTOEMISSION OPTOGALVANIC EFFECT
The change in impedance of a gas discharge can also begenerated by injecting electrons into the discharge viaphotoelectric effect which is known as photoemission optogalvanic(POG) effect. In this non—resonant process the photon energyrequired is greater than the work function of the cathodematerial. The photoelectrons will further interact with thedischarge species and the current in the circuit will be theresultant of the original plasma current and that produced by theinteraction of photoelectrons with the plasma. The essentialdifference between the 0G and POG effect is that the former is
due to the resonant absorption of radiation where as the latteris by the non-resonant absorption processes. The POG effect hasnumerous practical applications in real time monitoring of metalor semiconductor surfaces (1241. surface characterization I125].diagnostics of electrode surfaces in a discharge lamp I126). etc.More about the effect is described in chapter 7
Studies of the 0G effect in ionized gases are at presentlargely developed in connection with various applications inphysics and chemistry. Pc-ssi bili ti es of this powerful
35
spectroscopic tool have opened wide range of research areas infor atomic and molecular spectroscopy; high resolution. Rydberg.multi photon spectroscopy. isotope and hyperfine structureanalysis; diagnostics of electrical discharges. flames andplasmas; analytical chemistry; wavelength calibration; laserfrequency stabilization etc.
REFERENCES
1 F H Penning. Physica 8 (I928) 1372 S 5 Joshi. Current Sci. 8 (I939) 549. Proc.1nd.Acad.$ci. 21
(1945) 3893 A Garscadden and P Bletzinger. J.Appl.Phys. 35 (1964) 34324 R B Green. R A Keller. 6 G Luther. P K Schenck and J C Travis
Appl.Phys.Lett. 29 (1976) 7275 J E M Goldsmith and J E Lawler. Contemp.Phys. 22 (198!) 2356 E H van Veldhuizen. F J de H003 and D C Schram. J.Appl.Phys.
56 (1984) 20477 E F Zalewski. R A Keller and E Engleman Jr.. J.Chem.Phys.
70 (1979) 10158 I I Popescu. Trends in quantum electronics (Ed. A H Bohhorove
and I Ursu Springer Verlag. Berlin 1985) p3919 A Von Engle. Ionized gases (Oxford University Press. London)
1965
10 A Von Engle. Electric Plasmas; their nature and uses CTaylerand Francis Ltd. London 1983)
11 C Brown. Basic data on plasma physics (Wiley. New Yorh.1959)12 Yuri P Raizer. Gas discharge physics (Springer Verlag. Berlin
1991)13 R A Keller and E F Zalewshi. Appl.0pt. 19 (1980) 330114 H Hippler and J Pfab. Opt.Comm. Q7 (1993) 347
37
I516
17
18
19
2!
22
23
24
31
32
33
34
35
U 'fi ‘i U
R Wébster and R T Menzies. J.Chem.Phys. 78 (1983) 2121J Jackson. J E Lawler and T V Hansch.
0pt.Comm.33 (1980) 51J.de Physique 44 (1983) C7
R C Bobulescu.I Popescu. Appl.Phys.Lett.
Suzuki. 0pt.Comm. 38 (198!) 364E Bulyshev, N V Denisova and N G Preobrazhenshii.
64 (1988) 590
E Arimondo.
Camus.
A Surmeian. D Popescu and37 (1980) 888
Stanciulescu.
0pt.Spec£rosc.
Labastie. F Biraben and E Giacobino,15 (1982) 2595
R Lyons. A L Schawlow and 6 Y Yan. 0pt.Comm. 38 C198!) 35Suzuki and H Kakimoto. 93 (I982) 423
Appl.Phys.B 51 (1990) 374J.Hbl.Spectrosc.
Susuhi and T Kasuya.E Hurnic. R B Robinson, D Stonebach. H J Colgan and F A
Hoscatelli. Appl.Phys.Lett. 54 (1989) 792C Tsai. T Lin, C Y Shieh. T C Yen and T T $hy.Appl.Opt. 30
(1991) 3842Vasudev and R N Zare J.Chem.Phys. 76 (1982) 5267Sehiguchi and A Hasuyama. J.Appl.Phys.58 (1985) 154Hameau. J Vascat. D Dangoisse and P Glorieux. 0pt.Comm. 49
(I984) 423C Travis, P K Schench. G C Turk and V G Mallard. Anal.Chem.
and A N Chester. Plenum Press.C Travis, G C Turck and R B Green. Anal.Chem. 54 (1982)
1006A
K Schench. W G Mallard. J C Travis and K C Smith69 (1978) 5147
Speccrochem. Acta 473 (1992) 245J.Chem.Phys.
Axner and S Sjostrom.P Ausschnitt. G C Bjorhlund and R R Freeman,
33 (I978) 85!
38
J.Phys.B At.Mbl.Phys.
Appl.Phys.Lett.
36
38
40
4!
424344
4546
47
4849
51
525354
5556
58
59
61
M II 2 TH fl
V V V3 K ‘Sit D U
K
L
D (D I k.i: N PU L
Appl.Phys.B 54 (1992) 35De Harinus and A Sasso. J.Appl.Phys. 63 (tQ88)649S T Karcher and C S Ih. Appl.0pl. I8 (1979) 3513P J.Phys.D:Appl.Phys.Babin and J H Gagne.
Kopeika.Scheer,
26 (1993) 1700A Den Hartog. D A Doughty and J E Lawler.
(1988) 2471Dougty and J E Lawler.
F Vermeersch and F J de Hoog.
Phys.Rev.A 38
Appl. Phys.Le£t. 45 (1984) 61!King and P K Schenck, Laser Fucus (March 1978) 50Fergueson, Phil.Trans.R.$oc.Lond.A 307 (1982) 645
J.0pt.$oc.Am 68 (1978) 352R Anderson and R Alexander. Am.J.Phys 49 (198!) 767
Opt.Comm. 43 (1932) 26J.Phys.B:At.Hol.Phys.
W '* U3 K Bridges.Arnett,J Lorenzen and K Niemax.Hannaford and H W Series. 14 (198!)
L661
Hannaford and H W Series.N Dodd. J.Phys.B:At.Hbl.Phys.E H Goldsmith. A J Ferguson.
0pt.Lett. 4 (1979) 230E H Goldsmith and A V Smith. Opt.
Phys.Rev.Lett. 48 (1982) 132616 (1983) 2721
J E Lawler and A L Schawlow.
Comm. 32 (1980) 403Shuher. A Ben-Amer and G Erez, 0pt.Comm. 39 C198!) 51Shuher. A Ben-Amer and G Erez, 0pt.Comm. 49 (I984) 263Wfihata. S Saihan and H Kimura. Opt.Comm. 38 C198!) 27!Wdda. Y Adachi and C Hirose. 0pt.Comm. 66 (1988) 203
Chem.Phys.Lett 187 (1991) 545N Ganguly and A Garscadden. J.Appl.Phys. 57 (1985) 4856H Katayama. J H Cook. V E Bondybey and T A Miller.
Chem.PHy5.Lett. 62 (1979) 542Delsart. J C Keller and C Thomas.
(1981)3355C Smith. 8 C Bentz.
J.Am.Chem.Soc.
Duncan and R Devonshire.
J.Phys.B:At.Hbl.Phys. 14
C G Bruhn and W W Harrison.10! (1979) 749
Ben—Amer. R Shuher and G Erez. Appl.Phys.Lett. 38 (1981) 763
39
626364
55
67
686970
71
72
7374
75
76
77
78
79
8!
82
8384
85
H
P
Lanlois E and J H Gagne.A
E
H
D 6 PH 1 r- C
N
D
A Khan. H A Gondal and H H Rats. J.Phys.B 57 (I993) 123Hannaford and H W Series. Opt.Comm. 4! (1982) 427
Wdda. Y Adachi and C Hirose.David and J H Gagne. Appl.0pt.
R T Menzies and U P Oppenheim.Electron. 18 (1982) 19
T Shy and T C Yen. 0pt.Comm. 60 (1986) 306Ph.Roesch. Opt.Comm. 44 (1983) 259L S smith and S Hoffatt. Opt.Comm. 30 (1979) 213
J Kavaya.
F Zalewshi. R A Keller and C T Apel. Appl.Opt. 20 (1981) 1584A Petrucci and J D Winefordner, Spectrochemica Acta 478
(I992) 437Feldman. 0pt.Comm. 29 (1979) 57E Huenchausen. R D May and G W Hills. 0pt.Comm. 48 (1984)
317
Van Roozendael. G W Hills and H Herman. 0pt.Comm. 58 (I986)319
H Begemann and R J Saykally. Opt.Comm. 40 (1982) 277C Carlson. L A Cross and T M Dunn. Chem.Phys.Lett.1I3 (1985)
515
Hameau, E Arimondo, J Wascat and P Glorieux, 0pt.Comm. 53(1985) 375
T Rettner, C R Webster and R N Zare, J.Phys.Chem. 85 (I981)1105
H Beterov and N V Fateyev, 0pt.Comm. 40 (I982) 425Kumar. A K Rat and D K Rat. Pramana-J.Phys. 3! ([988) L42!K Rai. 5 B Rai. 5 N Thakur and D K Rat. Chem.Phys.Lett. 138
(1987) 215R Webster and I S Hcbermid. J.Chem.Phys. 78 (I983) 646Demuynck and J L Destombes. IEEE J Quatum Electron. 17 (1981)
575A Haner. C R Webster. P H Flamant and I S Hcdermid. Chem.
Phys.Lett. 96 (1983) 30240
86 R Wdlkup. R W Dreyfus and Ph Avourts. Phys.Rev.Lett. 50 (1983)1846
87 H Amemiya and T Suzuki. Jap.J.Appl.Phys. 29 (I990) LX71288 K Singh. R D Cunha and V B Kartha. 0pt.Comm. 79 (1990) 3389 R A Keller. R Engleman Jr. and E F Zalewski. J.Opt.Soc Am. 69
(1979) 73890 H A Bachor. P J Hanson and R J Sandeman. Opt.Comm. 43 (1982)
337
91 D S King. P K Schench. K C Smyth and J C Travis. Appl.0pt. 16(1977) 2617
92 J R Néstor. Appl.0pt. 21 (1982) 415493 A Duchworth. R S Adrain and B A Tozer. 0pt.Laser Tech. 24
(1992) 3994 B R Reddy ahd P Venhateswarlu. 0pt.Comm. 85 (1991) 49195 C J Sansonetti and K H Weber. J. Opt.Soc.Am.B I (1984) 36!96 K Narayanan. G Ullas and S B Rat. Chem.Phys.Lett.156 (1989) 5597 B R Raddy. P Venkateswarlu and H C George. 0pt.Comm. 75
(I987) 25798 H C Su. 5 R Ortiz and D L Hbnts. 0pt.Comm. 61 (1987) 25799 R A Keller. R Engleman Jr. and B A Palmer. Appl.0pt. 19 (1980)
836
100 N J Dovichi. D S Hbore and R A Keller. Appl.Opt. 21 (1982)1468
101 F Babin. P Camus. J H Gagne. P Pillet and J Boulmer,0pt.Lett. 12 (1987) 468
102 Y Oki. T Izuha. H Heada. C Honda. Y Hasegawa, H Futami,J Izumi and K Matsuda. Jap.J.Appl.Phys. 30 (I99!) LI744
103 Alan Corney. Atomic and laser spectroscopy (Oxford universityPress, Oxford. 1977)
104 K Nbveedullah and A S Ndqvi. Opt.Comm. 56 (1985) 117105 T Mhsaki. Y Adachi and C Hirose. Appl.$pectrosco. 42 CtQ88)54106 D K Doughty, E A Den Hartog and J E Lawler. Appl.Phys.Lett.
46 (1985) 352
41
107
108
109
110
111
112
113114
115
116
117
118
119
120
121
122
123124
125
126
H Sahahibara. H Hushiga and T Golo.Heas.$ci.Technol. 2 (1991) 1017
C 6 Mitchell and M W Zemanshy.Cambridge.1961)
A I Ferguson.Phy5.Rev.Letl.
Hiramalsu.
(University Press.
J E H Goldsmith, D J Jackson and42 (1979) 1046
E Lawler.A L Schawlow.
Beverini. M Galli. M Inguscio. F Slrumia and G Bionducci.0pl.Comm. 43 (1982) 261
W Hansch. D R Lyons. A L Schawlow. A Siegel. Z Y Wang and6 Yan. 0pt.Comm. 38 (1981) 47
R Vidal. Opt.Letl. 5 (1980) 158Engleman Jr. and R A Keller. 0pl.Lell. 5 (1980) 465Pianarosa. Y Demers and J M Gagne. J.Opl.Soc.Am.B I (1984)
704
H Suri. R Kapoor. G D Saksena and P R K Rao. 0pl.Comm. 49(I984) 29
N Rao, M N Reddy and R Singh. Phys.Nbws (DEC 1988) 132Siegel. J E Lawler. B Couillaud and T V Hansch. Phys. Rev.A
23 (1981) 2457Kopfermann and E E Schneider,Press. 1958)N Reddy and G N Rao. Physica C 150 (1988) 457Singh. G N Rao and R K Thareja.
363
Singh. G N Rao and R K Thareja. J.0pl.Soc.Am.B 8 (1991) 12H Gulhohrlein and H P Keller. J.Phys.B:At.Hbl.Phys. 21
(1988) 2353N Reddy. 5 A Ahmad and G N Rao.W Downey. A Hilchell and R A Gotlscho.
(1988) 5280B D Al and J Singh.
Nuclear Moments (AcademicNew York.
Pramana-J.Phys. 38 (1992)
J.Opl.$oc.Am.B 9 (1992) 22J.Appl.Phys. 63
52 (1988)S Selwyn. Appl.Phys.Lelt.1953
B Schulman and D R Woodward. Appl.Phys.Lell. 55 (1989) 1618