67
• • • • • • • • • • • • • • • • • • • • • • • • • • • • • • • • • • CORE Metadata, citation and similar papers at core.ac.uk Provided by NERC Open Research Archive

• •
• •
• •
• •
••
••
• •
• •
• •
• •
• •
• •
• •
• •
••
• •
• •
CORE Metadata, citation and similar papers at core.ac.uk
Provided by NERC Open Research Archive

GRE ATER NAKU RU WATER SU PPLY
LON DIAN I DAM
HYDRO LOG ICAL ANAL YSIS
This report is prepa red for
Sir Al exan de r Gibb S Partners , (Africa ) , Nairobi
by
•Institute of Hydrolo gy
Wa llin gfo rd
Oxon
UK
Feb rua ry 198 3

INTRODUCTION
Londiani dam is one of the two dams constitutin g the first
phase of the Greater Nakuru Water Development Plan which w ill
provide the water needed for the southern area of the rift valley
as delineat ed in the draft report (Ref .1).
The chosen dam site (map reference 0870 0867) is on the river
Kipchorian in the 1GC drainage basin and has a catchment area of
136 3cm2. Figure 1 shows the location of the dam site in relation
to the nearest river gaugin g station, which is 1GC5 on the Nyando
river, and the long term raingauges .
The object ives of this study are to prOvide estimates of
floods for the spillway design and construct ion wo rks and to
ca lcu late the yield availab le from the dam site for 10, 20 and 50
years retu rn period of fai lure and three retention leve ls .
The Londiani dam catchment stretches a long the western side of
the rift va lley as far north as the equator . The a ltitude va ries
from 2200 metres at the dam site to ove r 2600 metres in the upper
reaches where mu ch of the land is forested. However, deforestat ion
of these areas has been taking place for ma ny years which may be
causing a change in the catchment response to rainfall and also in
the rate of soil erosio n.
The climate of the Lon diani catchment, as for most of the rift
valley , is contro lled by the Intertrop ica l Converge nce Zone
(ITC Z ). This zone is formed by a se ries of low pressure areas
which are para lle l to th e equator and mo ves w ith the sun north and
south of the equator. The "long " and "short" rains of Kenya are
associated with th e instability caused by the movement of the ITCZ
in March to May and October to De cembe r respective ly . Rai nfall
occurring between these periods , in July and August , are known as
the "continental rains" and result from the develop ment of local
anticyclones.
.This describes the general pattern of th e unde rlying climate

•
•
• • Location map
•
•
•
• ..e . - IN
I\ 0 5. .... . .. .. .......
• N .\
•\
\N
\• \
)/ I )
• /
•f ... I
i
/ .. .° ° /
\
\ ."1
\
•
0 4 \ "IN
N DAM S IT E
Z s .„ ... \• - ./ ... 1
.•- •• r .
• N .' s' i
\, - . 1
• \
) . .. • ' ' - -- .• I ea LONDIAN I 9 3
/ A MAU SUMMITel / '•
( /• 02 !GCS
\ a, /• 9 LONG TERM RA INGAUGES
1 LONDIANI• 2 LUMBWA 1
3 MAU SUMMIT• 4 LUMBWA 2
$ EOUATOR•
.- - CATCHMENT BOUNDARY
• Sea le 1 : 250 000
•
•
•
•
•
•
•
••
Figure 1

41
41
41
41across Kenya but the mountainous range of the rift valley tends to
break up the effect of the ITCZ pattern and this, compounded with,
• the effect of the large lakes in the valley, produces a ve y
• comp lex climatic region .
•1 AVA ILABLE DATA
• Rainfall
41Londiani has a mean annual rainfall of about 1200 mm , and most
41. of this occurs between Ap rI l and August formi ng a well-defined wet
• season . The variability of both annual rainfall and its time of
41 occurrence is very high so that an ana lysis of water resources
incorporating rainfa ll as a mean annual statis tic could be very
41 mi sleading . It is therefore necessa ry to inc lude h istoric rainfa ll
• data wherever possib le to incorporate the inh erent variabi lity in
• the ana lysis.
41The rain gauge network is fairly sparce in the northern rift
411 va lley bu t, of the records that do exist some extend back to 1902.
411 There are on ly three automatic raingauges in the area and the
41nea rest of these to Londiani is Kericho . The other raingauges are
read daily and summa rized as month ly tota ls.
41
• The five long term raingages are listed in Tab le 1 to gether
41with the period of record for which data are available and the
weights used to determine catchment rainfa lls for the reservoir
• yield analysis . The weights were simp ly estima ted from Thiesson
• po lygons drawn for the catchments to the dam site and to the
gauging station 1GC5 .41
• Evaporation
•Potential evaporation estimates have been ca lcu lated by
41Woo dhead (Ref. 2 ) using the Penman equation for all the available
• data at that time . Potential evaporation is a rath er more
41 conservative statistic than rainfall and thus the mean month ly
estimate is mo re app licable for use in a resource ana lysis than the41
mean month ly ra infa ll.
41
111

•
••
• TABLE 1
• Catchment Rainfall Analysis - Londiani
•• Weighting Weighting
Rainfa ll Gauge Period of Record for dam for 1GC 5
• site catchment
• catchment
••
Londi ani
Lumbwa
903502
903568
1908- 1980
1938- 1976
29
10
130
11
• Lumbw a 903520 1905- 1980 0 4
• Equator 903569 1938- 1975 14 1 14 1
•Ma u Summi t 903538 1932- 1979 0 89
Mean annual rainfa ll (mm ) 1202 1165

40
The average potential evaporation for the Londiani catchment
was calcu lated from the mean of five stations which are the
Equator, Kericho , Koru , Mo lo and Mo lo (Py reth rum Res.) stations .
The mean month ly potentia l evapo ration estima tes are show n in
Table 2 together with the mean monthly rainfa ll estimates.
• Runoff Data
, I IThe nea rest gauging station to th e Londiani dam site is 1GC 5
on the Nyando rive r with a catchme nt area of 25 1 km 2 including th e
Kipchorian river. Records are avai lab le from this site for 1964 to
1980 in the form of mean month ly flow s w hich are obtained from
•staff gauge readings and a rating curve ; these data are tabu lated
in the Appendix in Table A l.
4111 The staff gauge is read tw ice daily and is in a natural
411 section with a rock control downstream . The rating curve is based
on discharge measurements carried ou t during low and medium flow s
extrapolated to encompass higher flow s.
411
•Of the other gauging stations in the area the ma jority have
IDrecords of 20 years or less and some of the stations are not
rated. Very few stations have had flows ca lcu lated since 1976 thu's
• considerab ly reducing the available data set .
411Sedimentation
ID
4111 Th ere is very little available informa tion abou t the sedime nt
• load of Kenyan rivers and how it is changing with land use ;
however , a large programme of sediment samp ling has recent ly been411
set up by MOWD inc luding measurements at station 1GC4 on an
• adjacent catchme nt to the Nyando . Dunne (Ref . 3) worked on
I I - suspended se diment samp ling and produced sediment rating curves fo r
97 stations in Kenya . These are useful for estimation of sediment411
load when accompanied by a flow duration curve of the station, but
• the new est rated catchments are in the 1GD and 1GB drainage basins .
411Two sedime nt samp les have been co llected at station 1GC4 , one
IDin May 1980 and one in June . The sediment concentrations measured
•

0TABLE 2
Mean Monthly Climatolo ca l Characteristics
•
•
•
Evapo ration
(mm )
Rain fall to
Dam Site (mm )
Seasonal
Distrib ution o f
Runo ff %
January 16 1 40 1.69
February 155 44 1.51
• March 170 75 3.38
• April 137 157 2 .97
0May
June
132
120
138
115
6 .67
5.40
• Ju ly 112 154 15.84
• Au gust 115 188 28 .9
0Septemb er 133 100 16.79
October 144 56 5.57
• November 135 78 8 .69
•December 148 56 2.59
•Total 1662 120 1 100 .00

41
41
41
41
41
41
41
41
41
40
40
41
41
41
41
40
41
41
4D
41
41
41
41
40
41
41
41
41
41
were approxima tely 112 and 84 ppm respectively . Neither o f these
measurements suggest a large sediment concentratio n but more data
will be necessary to come to any conclusions .
A recent study in the Tana river catchm ent reported erosion
rates o f about 0.5 mm/year, (Re f . 4). Th is may be used as an
indication of po ssible rates of sedimentation in the tondiani area .

• 2.1 INTRODUCT ION
41
41The ob jective of this flood analysis is to provide estimates
of spillw ay design .and construct ion floods for the proposed dam
• sites. The range of return pe riods for the spi llway design floods
41 is 100 to 500 years ; for construction floods the range is 5 to 50
•years.
41 A numb er of metho ds are availab le for the estimation of floods
•111
of these return periods name ly :
). FLOOD ANAL YSIS
1. statistica l ana ly sis of peak discharges ,
41 2. statistical ana lysis of rainfa ll and then conversion to
41 runoff using a su itab le mode l,
41 and 3. empirical methods.
41To use the first method without excessive ext rapo lation fo r
• estima ting high return period floods requires many years of
41 streamf low records . The ana lysis can be based either on records
41from a single gauging stat ion or from a numbe r of stations with in a
simi lar hy dro logical region . For the single station the annual
41 ma ximum flows are abstracted from the records , ranked and then
• p lotted using an assumed theoretical distribution ; for the re giona l
41ana lysis , the sample size is increased by pooling the available
data together in dimension less form .
41
• Raingauges are generally more plentiful than river gauging
stations and their records longer. Consequent ly the stat istics of41
extreme rainfall can often be estimated more accurately than flood
41 statistics . Also much statistica l wo rk has alrea dy been carried
out on ext reme rainfall in Kenya . The unit hydrograph - losses
method uses a simp le hydrograph mo del to conve rt a chosen design
storm to runoff. If adequate data are avai lable a unit hydrograph
can be derived from observed data ; oth erwise a synth etic unit
hdyrograph is estimated using catchment characteristics such as
channel length and slope . Rainfall intensity-duration-freq uency
relationsh ips are used to construct design storms of the required
return periods .
•

41
41
41
41Some of the em pirical methods for flood estima tion can be
applied to a wi de range of climates and countries . Others , such as
• the design method for the United Kingdom described in the Flood
• Stu dies Report (FSR ) (Re f 5) or for East Afr ica desc ribed in the
41Transpo rt and Roa d Research Laboratory Report (TRRL ) (Ref 6) relate
to more specific regio ns .
41
41 The ma jority o f river flow reco rds in Ke nya a re for river
41gauging stations wh ere river stage is ob served one or two times a
day . Flood statistics are therefore generally base d on mean daily
41 flow data rather than instantaneous peak discharges . Moreover
• since up to 80 per cent o f tdaily rainfall occurs between 1300 h rs
and 2200 hrs (Re f 7 ) the flood peaks are rarely ob se rved on medium41and small catchm ents where no automa tic reco rders a re installed.
41 In these cases floo d statist ics based on mean daily discha rges will
41 tend to be underestima te d.
41Rainfall data from autographic recorders in Ke nya have been
41 analysed and the results pub lished in a convenient form for
41 estimating design sto rms for given durations and frequencies (Re fs
• 8 , 9 ). Insu fficient short-term rain fall and runo ff data are
41currently available for the dam site catchment to allow derivation
of real unit hydro graphs in a conventional way .
41
• Consequently it was decided that neither metho d (1) nor (2 )
41coul d be use d on its own to estimate design floods . On the other
hand to rely .solely on an empirical method would have meant
41 igno ring the data that do exist . Our aim has therefore been to
41 ma ke maximum use of all available data and to use a combination o f
the three metho ds .41
41 First a regional flood frequency curve was constructed using
41 the local data available ; these were annual maximum mean daily
discharges . Experience from other parts of the wo rld suggests that41the dimensionless frequency distributions of instantaneous and mean
41 daily peak discharges will be similar . This similarity is
• supported by data from river ga u gin g station 2GB 1 On the Ma lewa
river locate d to the south east of Nakuru (Figure 2).41
•
•

•
•
• 2GB1: Flood frequency curves
•4
•
• 3
• 0/ 6
•2
•
•
• ••
• 1
. •• •• •• ••
• •• •• •• •
•0
•-:2 - 1 0 1 2 3 4 5 Yi
•2 5 10 20 50
T [years)• Mean daily discharge•
•
•
•
•4
• 3
•
•2
•• • •
•
• 1
•
S.
• •. 1 •
•- 2 - 1 0 1 2 3 4 Y i
O2 5 10 20 SO
T [ years] Figure 2• Instantaneous discharge

This p rovided an estimate of the mean annu al flood (Q ) at the
dam site can be made, flood peaks of retu rn periods up to about 50
years can be deduced from the dimension less frequency curve . The
magnitude of was estima ted using the TRRL me thod .
The parameters of a unit hydrograph losses model were adju sted
to ensure that the floods predicted for return perio ds up to 50
years were consistent with the desired regiona l floo d freq uency'
curv e. Th is provided a basis for sca ling the percentage runoff
term in the unit hydrograph Mode l which cou ld then be used to
ca lculate' higher return period floods fo r spillway design .
2.2 DATA USED /N FLOOD ANALYSIS
The records of a number of gauging stations in drainage basi n
1 we re inspected. The data from severa l stations were exc luded
either be cause stage readings were taken on ly once every .:two or
three days, or because the rat ing curves app eared to be
particularly suspect . For the remaining stations (Figure 3) the
annual ma ximum mean daily flow s were ext ract ed from the MOWD files
(see Appen dix Table A2); no chart records were available for the
extraction of instantaneous peak disch arges .
Rainfa ll data were taken from two published sou rces, namely
the MOWD rainfall frequen cy atlas of Kenya (Re f 8 ) and the TRRL
design ma nual (Ref 9 ).
2.3 STATIST ICAL ANALYSIS
A regiona l flood frequency curve is essentia lly a frequency
distribution of QT/Q ,
-
where QT is the floo d of retu rn period T
years Q
-
is the mean annua l floo d . The re lation is assumed to be
valid for all catchments within a region , or a lternatively to
represent the mean of the different relationsh ips for the different
catchments in the region .

•
•
• Gauging station locations•
•
•
•
•
•
•
•
•GR11
•
•1.G
•10 01 1GC5
••• N. • • ••-•\.
1JC171JC15
• 1JC14
• . *
• 1.J
•
•••
•
•
•
•
• Da rn site
• • Gauging stat ions
•Drainage area boundary
Drainage baisin boundary
••
APPROXIMAT E SC ALE » 1: 750 .0 00
•
• Figure 3•

ID
The curve is constructed from the series of annual ma ximum
floods at the gauging stations shown in Figu re 3 ; the data _are
• .tabulated in the Appendix as Tab le A2. Each record was converted
411 into a dimension less se ries Q/ Q, and the indi vidual events ranked
• in ascending order. The plotting position , yi, that corresponds
to the floo d of rank i in the series was estimated from the
Gringorten formu la given by
F =i - 0 .44
i N + 0.12
• and yi = - ln - (In Fi)
where Fi is the plotting position expressed as a probability ,
i is the rank of the event ,
40 an d N is the numbe r of events in the se ries.
Th ese floods we re then grouped into ran ges of y (- 1.5 to 1.0411
etc ) and the mean va lues of y and the ratio Q/ Q ca lcu lated for each
range . By using these calcu lated means , it was possible to define
ID the regiona l curve up to a va lue of y = 2.6 . The curve may be
• tentatively extended further by plotting the three highest
• individual va lues of Q/ (5 as being the th ree highest events taken
10 from a sample population of 74 events, 74 being the tota l numbe r of
events in the poo led record.
ID
411 The resu lting curve is shown in Figure 4.
•2.4 TRRL METHOD
40
• Th e TRRL method of floo d estimation is a simp le techniq ue for
•estimating design hydrographs for ungauged catchments. In common
411with the u nit hydrograph-losses mode l, the method consists of
converting a given design storm to runoff using an approp riate
ID

••••••••••••••••••••••••••••••••••
0/5
4
2
•
-1
Poo led f lood frequency
•
•
0 1 2
Yi
2 5 10
T [years]
curve
20
0
• GRO UPED VALUES
0 THREE H IG HEST VALUES
50
Figure 4
•••41 mode l. In the TRRL method the concept of contributing area
coefficient is analogou s to the perce ntage runoff in the unit
41 hydrograph model; the former remains constant, whereas the latter
40 tends to increase with increasing retu rn period . This means that
the TRRL method will tend to ensure that floo ds of moderate and
high retu rn periods are progressive l underestima ted. In both
411methods, howeve r, it is assumed that a storm of a given return
period will cause a floo d of the same retu rn period . The actual
40 response of a catchment will depend on the local antecedent
0conditions and the assumption may not be sti'ict ly true, but in the
absence of detai led loca l information it is considered to be
40 reasonab le.
LF.
The method is describe d fully in the relevant TRRL Reports
(Refs 6 , 9 ) so on ly a brief summa ry is given here . The se lected
design storm is conve rted to runoff using a simp le three parame ter
mode l, whose parameter va lues depend on the catchment 's physical
and clima to logica l characteristics. The parameters of catchment
lag, initial retention and contributing area coefficient were
41 estimated in the light of field visits and from the tab les , map s
40 and figures in the Reports.
•mean annual flood (Q ) at the dam site. Although strict ly the
41 return period of the mean annual floo d is 2.33 years for the Gumbel
41 dist ribution, we have assumed that this flood can be reasonab ly
estimated from the 2 year return period ra infall. A summary of the
parameters used in the calcu lation is given in Table 3, and gives a••••
••
For this study the TRRL method ha's been used to estima te th e
-Q of 30 m 3/sec .
2.5 UN IT HYDROGRAPH - LOSSES MODEL
The unit hydrograph for a particu lar catchme nt defines the
response to a unit vo lume of net or effective rainfall input ove r a
specified time interva l. The method re lies on tWo main assumptions
o f catchment behaviour name ly :-

ID
II
ID
I I TABLE 3
41
• Summary o f TRRL Method Parameters
• Catchment area 136 km 2
• Land slope 4 .47%
• Channel slope 2.44%
S1085 14 .72 m/km Source
II2 year daily point rainfall 55 mm TRRL 623 Figure 1
0 Areal reduct ion pactor .83 n Fi gure 17
• Rainfall time (Tp ) .75 TRRL 706 Table 8
Catchment lag (K ) 8 hours I I
111 Table 7
Antecedent rainfall zone Nyanza n Figure 14
I IDry zo ne Table 3
• Catchment wetness factor (Cw) .75 Table 5
• Standard contributing area coeff (C s) .45 Table 4
Lan d use factor (CL ) .50 Table 6411
1111
•
•
40
I I
411
II
I I
•
411
ID
ID
ID
ID
ID
11
II

(1) there is a linear relationship between net rainfa ll and
flood discharge ; ie tw ice the net rainfa ll doubles the
flow
(2) the princip le of superposition applies ; the fina l flood
hydrograph is made up from the di rect addition Of the
ordinates of a se ries of unit hydrographs scaled and
lagged according to the net rainfall hyetograph . This
process is ca lled convo lution .
Th e p rocess of flood estima tion .using the unit
hydrograph-losses model involves the fo llowing 'step s:
(1) Estimating the shape .of the unit hydrograp h. Idea lly
th is should be based on recorded flood and rainfall data ;
in the absence of suitab le data, an empirical formu la has
to be used
(2) De fining a design storm
(3 ) Estimating the percentage runoff from the design storm
(4 ) Comb ining the unit hy drograph with the (net ) design
storm . A slow responS e or 'baseflow ' component of this
hydrograph is added to the flood hydrograph, but this is
usually sma ll: by comparison with the direct/runoff from
ma jor floods.
Unit hydro aph estima tion
In the absence of continuou s flow records and .recording
rainfall data for catchments in the Londiani region , it was
necessary to derive a synthetic unit hydrograph from catchment
characteristics . Many empirica l formu lae have been used to
estimate the time to peak , Tp , of a synthetic triangular unit
hydrograph . These equat ion s are based on phy sica l catchment
characteristics such as stream length and slope . It is therefore
not unreasonable to use this typ e of physically based equation in
th is work. An empirica l relationship from the FSR based on stream—length and slope (Vo l I @6 .5.4) gives the time to p eak (Tp ) of
the hydrograph as :-
Tp = 2.81 0.47
hours

41
where L is the mainstream length ,
and S is the slope of the ma instream measured between
10 per cent and 85 per cent of L from the mouth of
• the catchment in m/km .
•The Shape of the unit hydrograph is defined by a triangle
4111 whose time base (TB ) and peak discharge (Qp ) are defined ‘by :-
411 TB = 3 .52 Tp
•220
IDQp = m 3/s/ 100 km 2
Tp
•Using the catchment characteristic data summarised in Table 3
the following va lues are obtained
•6 hou rs
TB 15 hours40
Qp 36 m3/s/ 100 1cm
2
ID
• Note that these figures have been rounded.
4111Design storm duration
•• The FSR (V8 1 I §6 .7.6) recommends the fo llowin g equation for
ID the duration of the design storm :
'11111D = Tp 1 1 + SAAR/ 1000)
•
ID where SAAR is the catchment average annual rainfall. The choice of
,storm duration is not particularly critical for the calcu lation ofID
flood peak, and we consider that the use of this equation is
•ID reasona Dle ; an estimate of D s 13 hou rs was obtaine d .

ID
41
IDDesign storm depth
Intensity - duration - frequency curves and maps have been
prepared for a number of rainfa ll stations in Kenya (Ref 8 ). By
using th ese curves and maps togethe r it was possib le to estima te
• the 24 hour rainfalls in the Londiani catchment Eor return periods
410 of 5 to 100 yea rs ; these are p lotted in Figure 5. A line has been
41fitted to these points by eye , and then extrapolated up to a 600
year return period ; estimates of the 200 and 500 return pe riod
• falls were then taken from th is line . Lumb 's work (Ref 10 ) was
•used to estimate the probable ma ximum precipitation (PMR ).
IDThe 5 year return period rainfa ll intens ity-duration curve was
used to construct the p rofile of the design storm . A nested
• profile was adopted such that for all du rations the rainfa ll
intensities of the same return period occurred within the same4111storm . The year storm of 13 hours duration was therefore composed
ID of the 1 in 5 year 1 hou r fall in the centre of the 1 in 5 year 3
hour fall etc . Design storms of higher return periods were based
on an identical profile because no other relevant data were
availab le.
• A lthough the average intensity over the total storm duration
40 has the required return period , the nested profi le w ill tend to
create a larger flood because of its peaky nature. However it is
pre ferab le to use the local rainfa ll data in th is conservative
fashion rather than adopt other, less peaky profiles, such as those
•described in the FSR which are strict ly valid only for the United
Kingdom .
411
Ar ea l reduction factor
ID
411The storm profiles derived so far app ly to po int rainfa lls .
An areal reduction factor (ARF ) has to be used to take account of
the fact that point rainfal intensities are higher than those
10 occurring with the same exceedance p robability over large r areas .
ARF 's have been ca lculated by the TRRL (Ref 9 ), and in the absence
of other data , it has been assumed that for this ba sin an ARF of
• 0 .83 is va lid for design storms of all return periods. Th e 1 in 5
411 year areal profile for the dam catchment is shown in Figu re 6.
111

Rainfall growth curve
4 5
5 10 25 50 100
T years]
200 50 0
6 7 Yi
Figure 5

Catchment wetness index
An indication of how wet the catchment is like ly to be before
a flood event is given by the catchment wetness index (CW I ). This
index is a comb ination of soil moisture deficit (SMD ), and a 5 day
antecedent precipitation index (API5), defined by
CWI = + APIS - SMD
For flood design it has been assumed that the SMD is zero , a
reasonable assumption for the wet season .
If 0 is the duration of the design storm , then API5 has been
calculated from a storm of duration 50 ; the design storm being
nested at the centre of the longe r storm . It is assumed that half
the difference between the longer and design duration storms fell
uniform ly in the 20 hours p rior to the design storm . For du rations
other than 24 hours a conve rsion equation from the FSR is used
(Vo l I §6.8.3).
Ba se flow
The convo lution of the unit hydrograph w ith the net rainfall
p rofile gives the rapid response component of the total hydrograph ;
the other component is the slow response or baseflow component .
However baseflow is only a sma ll proportion of the flood hydrograph
and its value is therefore not critical to the estimate of the peak
disch arge .
The FSR gives an equation for the slope response comp onent
(Vol I §6.5.11)
Baseflow = 0 .000326 (CW/ + 0.00074 RSMD + 0 .003)
where RSMD is the net 1 day rainfall of 5 year return period .
Percentage runo ff
There were no data av ailab le in this study from which an
ent irely objective assessment cou ld be made of how much of the

30
20
10
00
1 in 5 year rainfall profile
2 4 s a 10 12
Time [hours]
Figure 6

41
41
41gross ra infall would be effective in producing flood runoff. For
• the United Kingdom the FSR proposed equat ions for percentage runo ff
41 composed of th ree components re lated to the physical
characteristics of the catchment , its initia l wetness and the size41
of the rainstorm . FSR type equations have a lso been successfully
• used in other parts of the world .
•Initia lly these equations were used to estimate percentage
41runoff from local data . However the unit hy drograph mode l
41 predictions based on these values , for floods with return periods
41 up to 100 yea rs, did not reproduce the steepness of the observed
41 flood freq uency curve shown in Figure 4. Consequent ly the
estima tes of percentage runoff were adjusted sub jectively until the
41 model predict ions fitted the observed data more closely .
41
41 The mode l parameters finally used are summa rised in Table 4 ;
the model predictions and flood frequen cy curve are compared in
41 Figure 7.
41
• 2.6 DESIGN FLOOD ESTIMATES
41Co nstruction floods
41
41 we recommend the peak discharge of construction floods , with
41return periods up to 50 years, should be estmated from the pooled
flood frequency cu rve shown in Figure 4, and the estimate of
41Q
-
= 30 m3/sec calcu lated using the TRRL method . The shape of the
• flood hydrograph can be a simp le trian gu lar unit hydrograph where
• the du ration of the flood is 15 hours and the time to peak is 6
hours .41
• Spillway design floods
•Estimates of spillway design floods are given in Tab les 5 to 7
41and in Figu re 8. These estima tes were ma de using the unit
41 hydrograph losses mo del described abo ve and assumed values of
41 percentage runoff. These estimates are based on a number of
41 assumptions, which we be lieve are consistent w ith ou r understanding
•
•

Return Period
(years)
TA BLE 4
Design Flood Pa rameters
Rain fall Percentage Volume Qma x
(mm ) Runo ff (m3x106) (m
3/s )
n )
5 52.2 17.5 1.78 4 3.1
10 58 .8 20 .0 2.14 54 .0
25 7 1.8 22 .5 2 .75 72.3
50 80.6 25.0 3.30 88 .8
100 9 1.5 30 .0 3.98 110 .0

••••••••••••••••••••••••••••••••••
6
4
3
2
0
2
Unit hydrograph model : Flood predict ions
• UN MODEL PREDICT IONS
REGIONAL CURVE
1 2 3 4 5 6 7
Si;
5 10 25 50 100 200 50 0
T [years]
Figure 7

of the hydro logy of the Londiani region based on information
presently availab le .
These assumptions , and in particular the estimate of time to
p eak and percentage runoffs cou ld, and should, be verified by
detailed exami nation of rainfall and flow rcords from instruments
insta lled on the catchment specifica lly for this pu rpose .

G re a te r N a ku ru 'aa te r Su pp ly
2 0 0 Yea r F luod
C o n vo lut io n of un it n yo rog raoh and ne t ra in p ro file
T im e
1.002 .003 .0n4 .005 .006 .007.ena . co9. co
10 .001 1 .0012 .0013 .0014 .0015 .0016 .001 7 .0018 .0019 .0020 .002 1 .0022 .0023 .0024 .002 5 .0026 .002 7 .00
A rea (SQ .K m .)Da ta in te rv a l (h r )De s ig n o u ra c io n (Fir)To ta l ra in (m m )Pe rcen tage runo ff
S a se f lo w (cum e cs p e r sq .km )
Tr iang u la r un it h yc rog rap h comp u te d from To = 6 .0
T o ta l 1,:etR a in Ra inmm m m
1 .71 .512 .3 1 •643 .29 .393 .25 .973 .54 1.06
2 .6955 .35 16 .012 .9 5 2 .693 .54 1.063 .25 .973.29 .992 .81 .241 .71 .51
Lonu ian i D am De s ign F l 0 00 s -ADL F
.0 06 .11
12 .2212 .532 4 .4 4
70 .5636 .5772 .6722 .6224 .6c20 .6916 .7012 .7fl2 .7 14 .7 1.7 2
136 .201 .7:0
13 .CD10 2 .4030 .n0
.04073
unit To t a lHyd ro rap h Hyd rograo ho rd ina te c u mecs
5 .555.3e7 .109 .05
11 .F115 .4521 .7240 .2960 .3479 .'9193 .94
117 .75132 .76125 .77115 .03102 .9689 .7175 .52e0 .7145 .7231 .3018 .1712 .7 110 .078 .166 .305 .965 .60
TO T AL FLOO D VO LU •E Cf ILL IO N Y3 ) 4 .7 5
- P eak-

•
G reate r Naku ru wa te r SupP ly
500 Yea r Flood
Con vo lu t ion o f un it nyd rog raph and ne t ra in pro file
A re a (So .Rm .) 136 .00Data in te rva l (mr ) 1 .00Des ign du ra tion (m r) 13.00To ta l ra in (mm ) 118 .95Percen tage runo ff 3 5 .00B a s e f lo . (cu rne c s D e r sq .k m ) .0 4 1 39
T riangu la r un it nyc rog raph compu ted from Tp= 6 .0
Lond ian i Dam De sign F lo od s TA B L E 6
T im e T ota lRa inmm
N etRa inmm
U nitHyd ro g rapho rd ina te
Tota lMyd rograoh
cumecs
.00 1'.98 .69 .00 5 .631 .00 3 .26 1.14 6 .11 5 .2 12 .00. 3..83 1 .34 12.22 7 .733 .00 1 .77 1 .32 le.33 10 .374 .00 4 .11 1 .4 4 24 .44 14 .105 .00 10 .39 3 .64 30 .56 19 .036 .00 64 .26 22 .49 36 .67 26 .097 .00 10 .39 3 .64 32 .67 52 .688 .00 4 .1 1 1 .44 28 .68 79 .8 39 .00 3 .77 1.32 24 .63 106 .33
10 .00 3 .83 1.34 20 .69 132 .1211 .00 3..26 1 .14 16.70 157 .0412 .60 1 .98 .69 12 .70 177 .9 2 -P eak-

•
•PRO BABLE MAX IMUM FLOOD
• AR E A (SO .Km .)DATA INTERVAL (HR )40 DES IGN DURAT ION (HR )TOTAL RAIN (mm )PERCEN TAGE RUNOFF
•BAS E FLOW (CUMECS PER SO .Km )
•
GRE ATER NAKuRu WATER SUPPLY : LONO IAN I 0Am DES IGN FL OODS TABLE 7
136 . 001 . 00
13 . 0018 6 . 9 2
45 . 0 0. 04 139
TR IANGUL AR UN IT HYDROGRAPH COMPUTED FR OM TP = 6 . 0
•••
CON VOLU T ION OF UNI T HYDROGRAPH ANO NE T RA IN PRO F ILE
T IM E TOTAL NET UN IT TOTALRAIN RA IN HYOROGRAPH HYDROGRAPHmm mm ORO INATE CUmECS
40. 0 0 3 . 1 1 1 . 4 0 . 0 0 5 . 6 3
I I 1 . 00 5 . 13 2 . 3 1 6 . 1 1 6 . 792 . 0 0 6 . 0 1 2 . 7 0 12 . 22 9 . 8 7• 3 . 00 5 . 9 3 2 . 6 7 18 . 3 3 15 . 2 04 . 0 0 6 . 4 5 2 . 9 1 2 4 . 4 4 22 . 75I I 5 . 0 0 16 . 3 4 7 . 35 30 . 5 6 32 . 7 1
40 6 . 0 0 10 0 . 9 87 . 0 0 16 . 3 4
4 5 . 4 4
7 . 3536 . 6 732 . 6 7
48 . 78100 . 7 0
• 8 . 0 0 6 . 4 69 . 0 0 5 . 9 3
2 . 9 12 . 6 7
28 . 6 82 4 . 68
155 . 5 52 09 . 10
• 10 . 0 0 6 . 0 1 2 . 70 2 0 . 6 9 2 6 1 . 2 01 1 . 0 0 5 . 13 2 . 3 1 16 . 7 0 3 11 . 5 5
• 12 . 0 0 3 . 11 1 . 4 0 12 . 7 0 35 3 . 72 -PEAK-13 . 0 0 8 . 7 1 3 34 . 6 0
ID 14 . 0 0 4 . 7 1 3 05 . 3815 . 0 0 . 72 2 72 . 17
40 16 . 0 0 2 35 . 9 217 . 0 0 19 7 . 11
I I 18 . 0 0 156 . 5 619 . 0 0 1 15 . 5 4
40 2 0 . 0 0 76 . 082 1 . 0 0 40 . 17
• 2 2 . 0 0 25 . 2 22 3 . 0 0 17 . 9 9
0 2 4 . 0 0 12 . 7 8
I I 25 . 0 026 . 0 0
9 . 0 36 . 7 5
• 2 7 . 0 0 5 . 7 7
40 TO TAL FLOOD VOLUME (M ILL ION m3 ) 12 . 0 4
•
•
•

• •
• •
••
• •
••
• •
• •
• •
• •
• •
••
• •
• •
• •
• •
• •
• •
Greater Nakuru Wateh Supply i LondIan1 Dam.DeeIgn.Flood.Eet1mates
FIGURE.8
2
00
Yea
r F
loo
d5
00
Ye
ar
Flo
od
—
Pro
ba
b I
e M
ax !
mu
m .F
I o
od
0 P,C
)o
/S.
/S.
O
/S.
S.
/...
11.
/S.
‘
/‘
/\
/\
0 /
\0
/ \
—/
\/
\/
\/
\
/\
/\
/\
...\
./ "..
.0...
--
s...-
.
...
....
__ -
- -"
....
.
• .
..
.. -
10
15
Time (hours.)
5
0

41RESERVOIR YIELD ANA L YSIS
411
41 For th is report we are required to provide estimates of the
• firm yield of the reservoir at the Londiani dam site for risks of
41failure of 1 in 10, 20 and 50 years and retention levels of 2320,
2325 and 2330 m . We have assumed that a yield with a retu rn period
• of failure of N years is defined as the yield which can be supp lied
41 from the reservo ir with a failure , of unspecified duration ,
occurring, on average, once every N years.41
41 Reservoir yield analysis re lies on a series of river flows at
• the dam site. The nearest gauging station set up by MOWD is 1GC 5
on the Nyando ; howeve r, Sir Alexande r Gibb and Partners (Africa )41
have built a sma ll structure at the dam site to enab le flow
41 readings of the river throughout this hydro logical year . Readings
• were started in Ap ril 198 1 and because the site has not yet been
41 rated, these data have not been used for the present ana lysis.
41 Th e flow recorded at 1GC5 is appro ximate ly 14 km downstream
• from the dam site. The response to rainfall at this station should
• be simi lar to that at the dam site as the catchments have simi lar
climate, topo graphy and land use .
41
• To transfer the flow data from 1GC 5 to the site we considered
41 corresponding catchment areas and mean annual rainfa ll.
41The catchment rainfalls were determined using Theissen po lygon
41 weigh ted means of the five long term stations in the area as shown
• in Tab le 1. From these there is no evidence to suggest that the
41rainfa ll in the dam site catchment is significantly different from
that in the catchment to 1GC 5.
•
41 The runoff for the dam site can thus be best estimated usin g a
simp le catchm ent area ratio to transform the flow data from 1GC 5.41
• 3.1 EXTENSION OF RUNOFF RECORD
•
41Thus we have a flow series of 16 yea rs of month ly data (some
of which are incomp lete ). This is no t sufficient to define

411
ID
IDadequate ly the 50 year return period yield without extensive
extrapo lation of resu lts and , as a consequence , allow confidence in
40 these results . As the rainfall data span 76 years it should be
possib le to obtain a mo re re liable resu lt by extending the runo ff
sequence using the rainfa ll data .
A rainfall-runo ff re lationship can be either conceptually or
statistically based . A con ceptual mode l wou ld be di fficu lt to fit
and would lead to imprecise results in this case as adequate data,
such as soil moistu re content and infiltration rates , are not
ID availab le to describe the process of the transition between
• rainfa ll and runoff.
IDA statistical mode l, in the form of a linea r regression , was
ID used instead to re late the runoff to rainfall on an annua l basis.
40 We believe that a monthly relationship wou ld be mu ch more tenative
than an annual relationsh ip with much larger inherent erro r.
The regression twas carried out using logarithms of both the
rainfall and runoff series as this removes the emp hasis from flood
ID flows which w ould , otherwise, tend to dominate the fitting
p rocedure . Th is is part icu larly important for reservoir yie ld
analysis as the accurate p rediction of low flows is more pertinent
• to the analysis than the floods. The logarithmi c transformation
ID a lso ensures that there are no negative p redicted flow s. This
411would not necessarily be the case with a regress ion carried ou t on
natural flow s.
ID
• The data are p lotted in Figure 9 together with the line of
411best fit for the 13 years included in the ana lysis . The equation
describing the regression line is
•LOG (RUNOFF ) = - 11.04 1 + 4.29 1 LOG (RA INFALL )
w ith a corre lation coefficient of 78 per cent .
411
411 Th is equation is extreme ly sensitive to rainfa ll and could
predict unreasonable resu lts if it is used outside the range of fitIDo f the regression ; howeve r, on ly 3 years of the 76 years of record

•
•
•
•Line of best fit between annual catchment
•
• rainfall and runoff for the dam site
•
•
•
• 3 -0
•
•
2.5
•0
•
•2
• To
•co
• Ch 1-50
•
•
• 1•
•
•
• 0.52-8 5 2 90 2.95 3 .00 3.05 3 .10 3.15 3 .20 3.25
•Log annual rainfall Imml
•Figure 9

41fall outside the range of fit and these 3 fall on ly just outside ,
41therefore the equation is adeq uate to describe a re lationship
41 between rainfall and runoff. Data from 1968 and 1979 were
41 initially included in this ana lysis but were later discarded as
obvious outliers.
41
41 The Predictive Mode
411
41This simple regression equation could be used to predict
runoff va lues for the years when we have on ly rainfa ll data but the
41 variance of the synthetic series wou ld not be representative of the
41 actual runoff series . Using this equation assumes that the
rainfall-runo ff re lationship is perfect ly described by the line41
whereas there is , in fact , a scatter of points abou t the line in
41 Figure 9. We must inc lude a stochastic element into the prediction
41 eq uation and to do this a norma l random variance , of mean 0 and
standard deviation 1, is scaled to represent the scatter o f the41
re gression by mu ltiplying it by the standard deviat ion of the
41 re siduals.
41
41 The equation used for the prediction of annua l runoff from
annual rainfall va lues is
41
41 LOG (RUNOFF) 11.04 1 + 4 .29 1 LOG (RA INFALL ) + 0.297E
41
41Thus a total series of 76 years of annua l runoff was predi cted for
site 1GC5 and used to estimate the flows at the dam site.
41
41 The seasonal distribution of runoff was determi ned fo r the
data from 1GC 5 express ing the mean month ly flow as a perce ntage of
41 the mean annual flow . Th is distribution was imposed on the 76
41 years of annual data to p roduce a 76 yea r series of month ly flow s
41 for the dam site.
41The effect of the inclusion of a stochastic e lement in th e
41 predict ion equation is that there is no uniq ue solution for the
41 synthetic series. An infinite numbe r of series can be produced
41mere ly by altering the stochastic element, although these series
will be high ly correlated . If just one of these series is chosen
41

at random and used for the reservoir yield ana lysis, the results
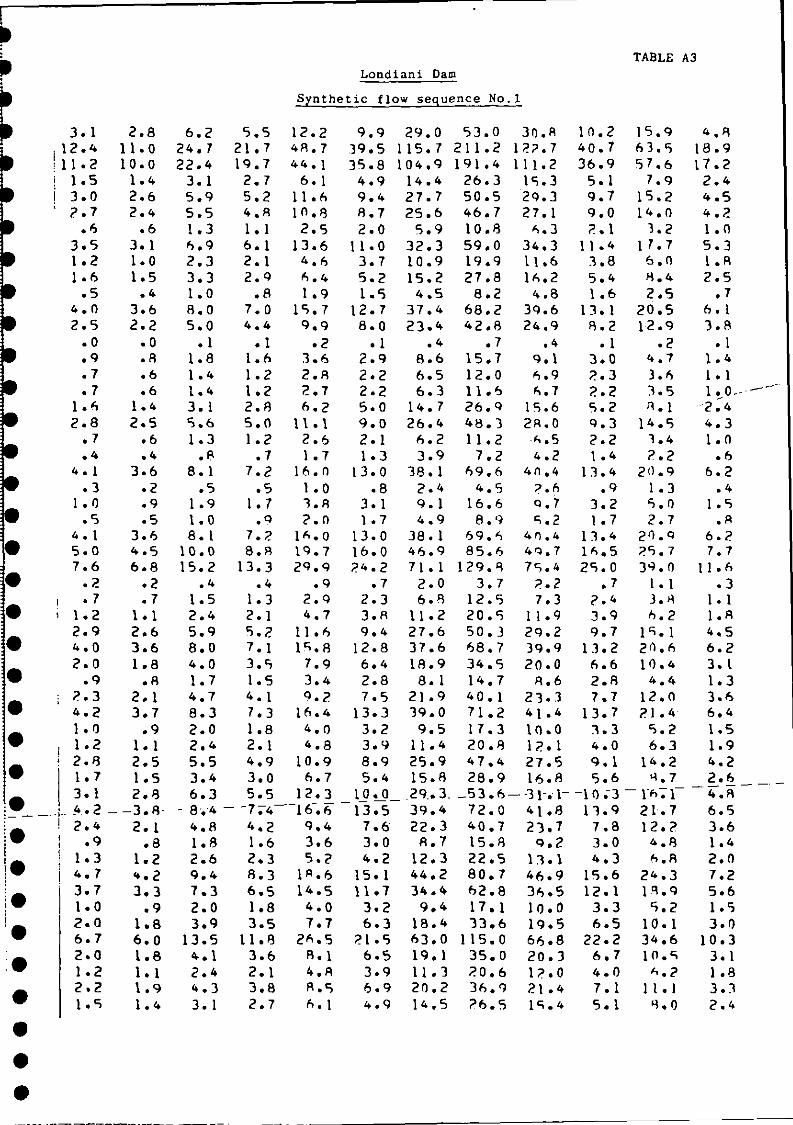
mi ght be biased . To guard against this we have predicted 9
• separate series of inflows (tabulated in the Appendix in Table A3
•to A l2) and the storage yield ana lysis is ca rried out using each
series. The results are co llated and the behaviour of the
reservoir is described by the mean of the 9 series .
•3 .2 RESERVO IR STORAGE YIELD ANALYSIS
The storage yie ld ana lysis is req uired to p rovide resu lts of
• the yield availab le , for 10 , 20 and 50 year return periods o f
• failure and for retention leve ls of 2320 , 2325 and 2330 me tres .
There are ma ny metho ds current ly used for sto rage yield ana lysis
but we believe that the most reliab le are based on a reservoir
behaviour analysis. The inflows are routed through the rese rvoir,
on a month ly time base , and a water balance is carried out
inco rpo rating reservoir yield, spill, inflow , rainfall and
evaporation . The evaporation used is show n in Table 2 and the
• catchment rainfall in Table 8 . Th is will describe the behaviour of
the reservoir unde r the conditions of the synthetic flow seq uence .
It only rema ins to quantify the return period of failure
attributab le to the yield .
ID The relatively short records avai lable severely constrain the
choice of reservoir analysis procedu re . The Gould Probability
matrix method was chosen as it makes use of all the available data
and produces a precise answer.
•The Gould metho d is described in the appendix but briefly it
divides the reservo ir storage into N states of equa l storage and
uses the reservoir routing procedure to dete rmine the probability
of ending a yea r in any state conditiona l on the starting state .
•The probability of failure from startin gf in any state is also
dete rmined and this is combined with the stea dy state probability
of being in any state to give the tota l probability of failure.
•The Gould metho d relies on the assumption that there is no
0serial corre lation in the annua l runoff data and a statistica l
analysis resu lted in no evidence to suggest that serial correlation
410 did exist.

41
41
41
41 RA INFALL FOR LONO IAN I C A TCHM EN T (mm ) TABLE 8
41YE AR J AN FEH m AR APR m AY JU N JUL Au G SE P OC T No v DEC
40 19 05 114 .3 11.7 225 .0 189 .0 166 .9 3 1.7 114.8 98 .6 94 .5 106 .9 4 0 .1 145 .819 06 .0 14 0 .0 2 13 .4 174 .0 294 .6 166 .9 304 .0 150 .6 106 .4 18 1.4 25 .4 64 .5
40 19 07 83 .8 116 .8 .0 584 .2 429 .3 373 .4 2 73.0 109 .5 73 .2 49 .3 56 .9 20 .819 08 20 .8 108 .6 8 0 .3 203 .9 109 .5 128 .2 230.0 322 .1 126 .0 35 .2 75 .0 15 .1
41 19 09 24 .2 .7 11.8 268 .4 84 .0 113.3 135 .8 29 1.3 115 .8 25 .9 28 .2 64 .319 10 9 .3 .0 106 .7 111.9 42 .0 130 .8 180.2 237 .8 170 .0 36 .5 9 .1 29 .2
40 19 11 .0 12 .3 10 1.4 177 .2 70 .8 104 .0 35 .4 128 .6 27.5 25 .5 116 .7 3 .219 12 4 .2 160 .4 66 .2 156 .1 64 .3 172 .8 205 .7 125 .5 152 .3 25 .6 69 .7 19 .8
41 19 13 1.0 82 .6 88 .4 125 .5 124 .5 24 3.9 124 .8 5 1.0 12 .4 32 .3 6 1.6 7 1.719 14 57 .3 66 .6 95 .2 9 9 .0 19 1.9 54 .1 139 .5 2 08 .6 92 .8 27 .5 9 0 .9 2 .1
41 19 15 15 .5 11.7 162 .8 139 .9 79 .0 15 1.6 32.9 78 .8 55 .6 54 .1 52 .3 50 .019 16 72 .6 22 .9 35 .3 144 .5 177 .5 185 .9 54 .5 145 .2 203 .5 15 0 .2 6 3 .0 48 .4
41 19 17 36 .8 28 .2 48 .9 205 .6 145 .9 148 .5 90.0 144 .3 203 .5 111.2 25 .4 .019 18 11.0 3.2 .1 82 .0 89 .1 38 .1 74 .5 158 .2 6 .8 15 .1 9 .2 10 .9
41 19 19 13 .9 12 1.6 96 .5 155 .6 77 .8 4 3.3 130.0 117 .2 77 .3 10 .2 45 .5 2 .0192 0 3 1.1 2 .2 138 .9 196 .7 64 .1 62 .5 109 .4 99 .7 38 .2 90 .3 83 .5 30 .4
41 192 1 .3 62 .7 12 .1 7 .6 113 .4 195 .1 2 12 .7 174 .8 44 .6 42 .8 62 .1 3 .91922 29 .6 54 .7 12 1.2 126 .0 10 1.5 66 .0 170.7 2 10 .5 89 .5 19 .5 27 .6 44 .9
40 19 23 .0 129 .4 32 .5 237 .7 209 .6 6 7.7 242 .6 102 .7 114 .0 48 .9 48 .3 12 .0192 4 .0 74 .9 27.5 146 .7 116 .4 33 .5 10 1.2 236 . 1 109 .5 35 .8 6 7.4 32 .3
• 1925 134 .0 2 .7 96 .3 6 .0 137 .3 100.0 126 .5 187 .3 12 .0 20 .1 115 .5 44 .219 26 44 .0 93 .2 32 .0 185 .0 154 .3 94 .2 160.6 247.2 20 7.7 83 .3 115 .8 4 .0
41 192 7 10 .5 52 .2 36 .8 10 1.7 99 .8 46 .7 145 .4 123.8 76 .9 14 .6 15 .8 13 .719 28 12 .8 20.9 3 1.9 118 .7 177 .6 138 .0 8 1.3 123 .5 30.0 100 .5 72 .0 8 .6
• 1929 .0 1.0 17 .6 133 .8 162 .3 115 .1 195 .5 119 .2 86 .6 38 .9 33 .5 85 .619 3 0 150 .1 20 .1 282 .2 26 1.8 182 .7 154 .0 92 .2 104 .0 129 .2 54 .6 56 .6 27 .6
• 19 3 1 6 .9 44 .9 12 1.7 176 .7 2 12 .9 10 1.5 150.3 15 0.2 127 .7 2 1.8 6 1.3 6 3 .319 32 6 .4 45 .3 170 .4 136 .3 118 .5 129 .7 155 .0 154 .8 172 .7 33 .4 34 .7 34 .0
• 19 33 24 .3 15.9 26 .7 24 .0 5 3 .0 74 .1 162 .1 176 .8 137.6 56 .6 16 .2 36 .51934 3 .2 16 .2 22 .1 116 .9 105 .4 114 .1 150 .6 180 .4 22 .9 45 .9 37 .3 2 .8
• 19 35 .0 76 .3 11.5 74 .6 22 1.7 69 .5 117 .8 94 .8 8 3.7 92 .9 2 1.1 110 .119 36 65 .6 183 .1 152 .6 158 .8 6 1.8 111.6 5 1.4 146 .9 99 .9 4 1.4 9 .2 58 .2
• 19 37 39 .9 27 .0 134 .4 25 1.6 138 .6 166 .6 19 1.2 197 .8 13 .8 4 3.0 138 .8 20 .319 36 47 .1 5 .8 76 .2 37. 1 133 .4 119 .2 177.7 24 1.0 99 .0 42 .8 33 .6 78 .1
• 1939 25 .0 19 .5 32 .0 112 .3 49 .5 98 .9 197.8 139 . 1 11.4 24 .3 82 .8 11.7194 0 4E1.5 95 .7 225 .9 235 .8 153 .3 88 .7 149 .1 189 . 1 2 .4 11.2 76 .6 12 .1
• 194 1 6 1.3 46 .5 122 .7 22 1.7 184 .0 118 .1 137 .1 116 .2 82 .6 72 .4 188 .1 10 0 .5194 2 .8 5 .0 167 .8 189 .0 202 .0 14 0 .4 96 .2 187 .9 103.2 8 .2 11.7 33 .3
• 19 4 3 3 .9 32 .3 7 .9 100.9 125 .1 15 3 .0 15 1.5 170.6 139 .8 4 7.0 2 1.1 35 .519 44 5 .2 16 .1 48 .6 99 .9 109 .6 72 .8 132 .2 2 16 .1 124 .6 5 7.4 112 .3 26 .9
• 19 45 10 .8 23 .4 4 .4 13 .9 176 .5 199 .5 186 .5 220.0 152 .9 4 1.2 46 .8 34 .619 46 3 .6 2 .5 38 .5 2 12 .0 119 .6 196 .0 136 .2 22 1.7 103 .0 59 .9 19 .2 7 .5
• 19 4 7 110 .8 43 .0 97 .3 276 .3 134 .5 152 .2 148 .8 113 .7 140 .7 4 1.0 8 .5 6 7 .71948 6 .1 2 .1 53 .6 132 .3 122 .7 16 7.0 183 .6 187 .6 107.7 85 .5 28 .3 32 .8
• 19 49 10 .8 2 1.3 1.7 149 .0 122 .9 139 .6 14 1.7 184 .8 142 .8 14 .4 16 .1 69 .619 5 0 2 4 .0 1.6 56 .6 139.8 8 4 .4 8 1.4 200.8 15 1.9 120.4 55 .7 12 .8 2 .4
• 195 1 14 .5 16 .1 122 .3 3 16 .7 106 .5 68 .7 83.7 184 .4 58 .5 6 7.4 110 .8 24 0 .219 5 2 .0 36 .8 20.7 3 15 .9 237 .4 4 7.3 159 .7 188 . 1 104 .6 57 .9 15 .6 8 .4
• 195 3 9 .9 1.9 9 .2 147 .1 12 1.6 192 .7 82 .5 103.2 48 .0 76 .7 27 .6 82 .91954 22 .0 28 .7 16 .6 173 .8 207 .5 78 .2 137 .3 157 .4 146 . 1 64 .7 39 .7 39 .1
41 1 9 5 5 P . 8 73 .1 34 .3 137 .4 84 .4 8 1.6 159 .7 363 .4 262 .5 53 .8 4 1.0 16 1.8
•
•
•

TABLEc o Md
8
19 5 6 1 4 6 . 3 8 7 . 3 7 7 . 9 14 5 . 5 1 14 . 0 14 2 . 5 16 9 . 2 2 2 1 . 3 9 3 . 9 8 1 . 2 3 0 . 5 2 7 . 31 9 5 7 3 3 . 8 12 . 9 8 0 . 3 17 6 . 6 2 2 9 . 4 1 7 5 . 4 12 4 . 4 16 4 . 6 12 . 6 19 . 1 6 8 . 2 5 6 . 219 5 8 7 0 . 6 12 6 . 7 8 6 . 7 9 9 . 7 1 0 2 . 2 1 6 1 . 4 15 2 . 2 2 2 3 . 8 12 7 . 3 75 . 7 15 . 1 1 0 3 . 319 5 9 3 7 . 0 3 2 . 8 1 0 3 . 8 8 9 . 8 10 5 . 8 6 1 . 5 12 7 . 1 14 7 . 6 9 7 . 9 79 . 3 10 4 . 5 16 . 119 6 0 4 1 . 2 1 3 . 4 14 1 . 4 15 8 . 4 9 5 . 6 5 8 . 8 1 3 4 . 5 2 3 7 . 5 6 3 . 3 2 7 . 3 6 3 . 7 3 9 . 719 6 1 7 . 6 8 . 8 2 2 . 0 1 1 3 . 2 12 4 . 3 1 0 7 . 7 8 4 . 2 2 2 2 . 3 7 5 . 6 8 5 . 4 3 9 6 . 5 1 7 1 . 019 6 2 6 0 . 8 4 . 7 7 6 . 3 1 15 . 8 2 0 3 . 2 9 8 . 0 19 1 . 1 15 6 . 9 13 0 . 3 7 9 . 5 12 0 . 5 5 5 . 619 6 3 8 0 . 9 3 7 . 3 6 8 . 7 2 3 2 . 9 2 12 . 6 4 4 . 0 12 7 . 1 18 9 . 6 2 8 . 3 1 0 . 3 17 5 . 6 18 7 . 019 6 4 14 . 9 5 2 . 2 12 1 . 5 2 3 2 . 2 12 2 . 5 9 1 . 8 2 3 4 . 2 13 1 . 0 17 7 . 0 6 2 . 4 2 3 . 2 5 3 . 119 6 5 5 7 . 3 8 . 1 5 5 . 2 15 2 . 3 6 8 . 9 5 5 . 7 10 2 . 7 8 8 . 7 4 2 . 6 8 2 . 5 6 7 . 9 3 9 . 919 6 6 5 . 3 1 0 3 . 0 8 4 . 3 2 5 8 . 6 4 7 . 9 6 9 . 0 2 10 . 9 14 3 . 2 9 8 . 6 3 4 . 8 6 8 . 7 6 . 219 6 7 4 . 8 18 . 4 3 1 . 8 16 2 . 5 2 5 7 . 3 1 3 0 . 0 19 4 . 6 13 7 . 4 4 2 . 2 5 1 . 8 14 4 . 5 1 0 . 91 9 6 8 . 1 2 2 2 . 0 8 7 . 1 2 75 . 8 10 3 . 5 8 8 . 3 1 1 0 . 1 15 6 . 3 1 1 . 9 7 9 . 4 1 0 3 . 4 3 7 . 119 6 9 7 4 . 6 6 9 . 3 6 3 . 8 14 . 4 12 9 . 0 2 8 . 1 13 7 . 5 1 10 . 1 10 0 . 5 5 4 . 6 6 8 . 9 5 . 11 9 10 1 6 0 . 4 5 7 . 9 19 9 . 2 15 3 . 4 1 1 0 . 1 15 6 . 7 1 7 2 . 0 2 0 8 . 9 9 4 . 6 4 3 . 4 3 3 . 0 2 1 . 019 7 1 4 2 . 3 5 . 3 18 . 1 12 4 . 7 1 3 5 . 5 1 2 3 . 7 18 0 . 7 2 5 3 . 4 78 . 7 4 9 . 1 2 4 . 3 17 2 . 219 7 2 2 . 5 12 4 . 5 9 . 0 7 4 . 1 1 1 7 . 2 1 2 9 . 8 9 9 . 0 14 4 . 4 6 6 . 9 1 17 . 0 1 9 6 . 9 2 0 . 619 7 3 8 4 . 3 9 6 . 8 1 . 6 16 . 3 15 3 . 1 7 2 . 3 9 8 . 5 17 1 . 2 2 0 5 . 7 1 2 . 7 8 1 . 7 5 . 919 7 4 3 . 0 2 0 . 2 17 0 . 1 1 0 7 . 1 8 6 . 1 9 8 . 6 18 9 . 7 13 9 . 2 6 6 . 3 2 7 . 5 4 0 . 3 1 3 . 819 7 5 . 9 2 . 9 1 0 1 . 2 16 6 . 0 15 2 . 4 9 0 . 3 1 8 3 . 2 2 4 4 . 3 16 8 . 4 1 0 1 . 4 3 0 . 3 2 8 . 419 7 6 2 0 . 0 6 . 9 9 . 2 1 1 4 . 0 1 12 . 3 9 9 . 9 1 73 . 5 1 7 0 . 5 4 1 . 4 2 8 . 6 6 2 . 7 1 3 . 319 7 7 1 3 0 . 7 3 5 . 7 4 . 0 3 0 1 . 9 14 5 . 9 15 1 . 0 18 8 . 2 1 7 3 . 0 7 4 . 8 7 7 . 3 18 1 . 2 5 7 . 51 9 7 8 1 2 2 . 5 10 2 . 8 2 0 1 . 9 1 0 0 . 5 1 36 . 4 1 7 9 . 4 12 2 . 0 1 0 9 . 1 16 9 . 9 1 0 1 . 4 2 6 . 3 8 3 . 919 7 9 1 0 3 . 3 16 8 . 7 1 4 6 . 7 2 4 6 . 5 1 15 . 3 7 4 . 1 18 1 . 4 14 6 . 1 16 4 . 3 4 7 . 8 4 9 . 3 . 919 8 0 2 . 2 15 . 5 2 6 . 8 15 0 . 4 19 2 . 7 1 3 8 . 2 1 0 4 . 7 10 4 . 1 4 5 . 1 4 8 . 0 7 0 . 0 3 0 . 5

41
41
41
41This process was carried out using all 9 sequences of inflow s
to produce curves describing the return period o f failure for a
41 particular retention level. The mean of these resu lts is drawn in
41 Figu re 10 and the yields for return periods of 10, 20 and 50 years
have been extracted and tabu lated in Table 9 . The results were41
also investigated for lower retention leve ls to extend the ana lysis
41 to inc lude much lower yie lds than were at first indicated .
403.3 CONCLUSION S
41
41 The yields availab le for 10, 20 and 50 year return periods o f
41 failure and different retention levels are listed in Table 9 .
41 These have been p lotted in Figure 11 to allow interpolation between
the results , providing a continuous storage/yield relationship for
41 the return periods concerned.
The error associated with the transfer of runoff data from
station 1GC S to the dam site is quite sma ll but the confidence in
the extension of the flows using the annual rainfa ll series is much
less . How ever, w ith the data that is curre ntly availab le and
requiring results w ith return periods of up to 50 years, we believe
that th is method will provide the most reliable resu lts possible .
41
41 Th e results of the yield ava ilable become more unre liable as
41 the return period increases but they are we ll defined up to the 50
41year return period . These results are based on the assumption that
the reservoir is in a steady stat e, so that it has been constructed
41 for long enough to negate the effect of initia lly being empty . If
41 a reservoir is fair ly sma ll and is not expected to provide frequent
41overyear storage , the likelihood of filling reaches a steady va lue
very soon after const ruction. Howeve r, in this case, the
41 reservoirs considered include very large storages which could take
41 ma ny years to fill and, du ring the initial years the yield
41availab le , with a given risk , will be mu ch reduced . If it is
decided to construct a large reservoir in this ara an ana lysis
41 should be carried ou t to determine the length of time for which the14 ,
rese rvoir will be likely to be unab le to supp ly the yield and also
the reduced yie ld which will be availab le .41

• 0 .06
•
•
•
•
• 0 .05
•
•
•
•
•" N.
•
0-0 4
•
• •E AZ A• AZ
0-03
•
•••
Londiani reservoir storage Yield analysis
•
_. . , 6 1a
/ a
/ ' ' . å
' ' A
a A / A
Z a
.- - - - - - - - - +/ a
a A A
/ — +
. ' '' ° ' ' ' ' -f
• +/ +7
+
• x
•,c 3c
•0 02
• x/ x
• o'"-- cl
•-- -0
D' '5( 20•
RETURN PERIOD (TEARS!
10
Probability of failure [percentage)
A RET ENTION LEVEL 2330 m
• 2325 in
23 20 m
2312 m
230 6 rn
0
• 0 -0 10 2 4 6 8 10 12 14 16 18 20 22
•
Figure 10

41
41TABLE 9
ID Yield Results from Figure 11
411
Retention Storage Yield Available (thousand m 3/day )
level
(m) (million m3) 10 yrs 20 yrs 50 yrs
412330 72.7 47 .2 42 .5 37 .8
0 2325 45.5 42 .2 37 .5 33.2
41 2320 26 .9 35.8 31.8 27.8
2313 12.0 26 .0 22 .8 19.5•
2306 6.0 18.8 16 .0 14.0
•
•
•
•
•
•
•
•
•
•
•
•
•
•
•
•
•
•
•
•
•

0
Storage — yield curves for Londiani reservoir
10 20 30 40 50
Storage [million m3]
o 10 YEAR RETURN PERIOD
x 20
-I- 50
60 70 80
Figure 11

41
41
41
41The sedimentation informa tion available is very sca rce and has
been discusse d in the intro duction . Using the figure of 0.5 mm per
41 year we arrive at a sedimentation rate of about 3 .5 million m 3 in
41 50 years . As the reservo ir at the hi gher retention levels is
41designed to store several years of runoff the trap effic iency will
be very nearly 100 pe r cent and thus all this se diment wi ll be
• stored in the reservoir. Th is figure of 0.5 mm is sugge sted from
41 research carrie d out on the Tana river (Re f . 4) and as such will
only provide a possible estimate of se dimentation . /t is41impe rative that se diment samples are recorded in the area
41 pa rticularly as this region is undergo ing deforestation which
41 increases the soil erosion drama tically .
41Erosion of soil by rainfall is usually relate d to the
41 intensity of rain but in regions where the mean annual
• precipitation is more than 1000 mm there is usually dense forest
41 ve getation as in the upper reaches of the Londiani catchment . This
forms a canopy which protects the soil . Severe so il erosion will
41take place in these areas if the vegetal cover is remove d , expo sing
41 the soil to intense rainfall . Th us the extent of silt deposition
• in the reservo irs will largely depend on the deforestation taking
place an d the provision of soil conservation schem es .
41
41
41
41
41
41
41
41
41
41
41
ID
ID
ID

41
41
41REFERENC ES
41
41 . Grea te r Nakuru Water Ce velopment Plant , 1980-2000
Prelim inary De sign Stu dy - Dra ft Re port . Sir Ale xan de r G ibb
& Pa rtners (Africa ) March 1980 .
6
• ). St udi es o f Potentia l Evapo ra tion in Ke nya ; Wo o dh ea d , T ., 1968 .
3. Su spende d sediment data for the rive rs o f Kenya ; Dun ne , T .
De partm ent of Geolo gical Sc iences , University of Wa sh ington
• Ju ly 1974 .
414. Propo sa ls for the field measurement o f se diment discha rge and
41 reservo ir surveys in the Upper Tana River basin , Ke nya .
• Brabben , T ., Hy draulics Research Station Resea rch Proposa l ODM
• 3/4 December 1979 .
41 3. Floo d Stu dies Repo rt ; Natural Environm ent Re sea rch Council
• 1975 .
41S. Th e TRRL East African floo d mo del ; T RRL Repo rt 706 , 1976 .
41
The Diurna l va riatio n o f precipita tion in East Africa ; Tom sett ,
• J .E . Ea st AFrican Meteo ro logical De pa rtm ent , Technical
Memo randum No 25 , 19 75 .
41
• 8. Rain fal l Freq uency Atlas o f Kenya ; M inistry o f Wate r
• Development , January 1978 .
9 . The Pre diction of Sto rm Ra in fall in Ea st Africa ; TRRL Repo rt
• 6 23 , 1974 .
4110 . Probable Maximum Pr ecip itation (PMP ) in Ea st Africa for
dura tion up to 24 hours ; Lumb , F .E . Ea st African Meteo ro lo gical
• De partm ent , Te chnical Memo randum No 16 , 197 1.
11. Re se rvoir Capacity an d Yield , McMahon , T .A ., & Mein , R .G .
Elsevier 1978 .

41
41
41A PPEN DIX
41
41 THE GOULD PROBAB ILITY MATRIX MET HO D
6
41The Gould metho d requires that the rese rvoir is divided into
41 several (N) states of equal storage value . Each year of the in flow
41 data is treate d separately and is route d th rough the rese rvoir ,
starting the rese rvo ir in each of the N states and noting the state41in which it finishes . When this procedure has been repeated for
41 each year of data the results are co llated in a transition matrix
• which expresses the probability of ending in any o E the N states ,
41 conditional on the starting state . At the same time , the number of
occasions in which the reservoir fails or spills is counte d and
41 noted with its corresponding starting state . Thus we can dete rmine
• the probab ility of spilling , failing and en ding in any particular
• state , conditional on the starting state . We need only determine
41the probability o f be ing in each oE the states at the sta rt of a
year and then the joint probability of this and of failin g will
• determine the stea dy state likelihoo d of failure .
•
41The steady state probability vector of sto rage contents can be
determined from the transition matrix and starting conditions of
• the reservoir. If the transition ma tr ix T i s multipl ;ie d by the
• initial vector of probabilities of starting contents P we will
41arrive at the vecto r of probabilities of starting contents at the
second year .
•
•IP12 = ITIx1P11
•
41 This process can be continue d according to the schem e
41
.41 l'It+1
•
41
H.
41

ID
However , with time , the vector P t reaches a stea dy state a s the
initial conditions at the beginning o f the first year become
1111 negligib le . Once the vecto r P t reaches a stea dy state this
• desc ribes the likelihood of being in any of the N states and this
occurs whenID
411 IpIt+1 = Ipit•• We are now in a position to determi ne the probability of
failure which is the sum oE the products of the probability of the
reservoir being in each particular zone and the probability of
failure from starting in that zone .

•
•
•
•
YEAR JAN FEB MAR
FLOWS FOR STATION 1GC5
APR MAY JUN
(CUSECS)
JUL AUG SEP OCT
TABLE Al
NOV DEC
• 1964 999.9 8.9 9.7 999.9 34.4 24.1 254.1 268.2 336.6 81.1 18.2 11.71965 10.0 7.9 7.2 6.9 6.7 6.0 6.0 7.2 6.1 5.1 5.6 4.7
• 1966 4.5 5.0 4.6 40.4 12.1 7.9 23.0 310.1 167.3 14.2 9.0 5.41967 4.7 4.8 4.5 7.7 11.1 41.6 269.0 233.8 49.3 10.7 12.6 27.3
• 1968 5.6 7.5 19.9 500.7 1182.6 32.7 30.9 319.7 29.6 12.0 10.3 16.31969 7.0 6.5 5.8 4.9 5.6 4.8 5.5 9.4 8.4 5.4 4.8 4.7
• 1970 5.4 5.7 9.9 22.1 45.2 45.4 38.6 348.6 94.2 25.2 9.9 6.41971 5.6 4.9 4.5 4.9 999.9 6.4 61.1 262.5 184.4 37.7 9.8 12.8
• 1972 10.5 16.8 6.7 3.9 8.6 18.9 33.1 18.9 6.5 5.6 5.8 4.71973 4.2 7.0 4.5 4.9 6.6 11.4 11.5 32.8 127.9 13.1 6.1 3.2
• 1974 4.6 3.2 3.2 9.9 4.6 5.3 109.1 78.4 61.4 19.1 8.8 7.11975 4.6 4.2 4.6 5.6 8.1 9.9 89.3 319.9 320.3 166.7 18.7 8.5
• 1976 4.6 4.2 3.5 5.3 5.3 6.4 49.4 66.7 48.4 8.5 5.3 4.61977 4.3 5.3 4.9 16.9 205.2 124.3 202.0 189.6 56.5 17.7 454.1 70.3
• 1978 35.7 28.2 145.5 55.4 33.2 45.9 126.1 154.7 113.3 44.8 14.5 10.91979 10.8 42.6 15.2 12.6 24.0 13.7 20.5 24.3 11.3 8.2 5.9 5.1
• 1980 5.4 5.0 4.9 7.7 62.8 19.7 23.2 30.0 21.7 11.1 4.9 4.1

41
41
41 3
41ANNUAL MAXIMUM FLOO DS (ft /sec )
(mean daily flows)
TABLE A2
41
41 Year 1GC5 1GG 1 IJC 11 IJC I4 1JC 15 IJC 17
411956 262 .5
41 57 153.0
• 58 282.0 3.9
59 243.0 4 .1
4160 133.0 14.0
41
• 196 1 387 .0 25.0 7.7
4162 276 .0 420 16 .0 8 .8
63 287 .0 636 16.0 11.0
• 64 3520 287 .0 - 12.0 5.7
• 65 13.2 63.1 64 4.9 1.3
4166 4335 143.0 399 13.0 4 .4 3.2
67 1980 18 .8 230 11.2 - 3.6
41 68 3385 - 296 15.5 5.4 2 .6
• 69 13.4 70.7 145 5.4 1.6 .9
41 70 226 .5 1640 256 15.4 2.7
41 1971 2420 2870 387 18 .4 3.1
• 72 77.4 664 157 10.1 1.8
• 73 689 .5 513
74 270
• 75 2327
• 76 255
41 ._ 77 2034
78 447
4179 90
• 80 176 .5
•
•
- -
•
S nthetic
Londian i Dam
TABLE A3

S nthetic flow se uence No .1 continued
TABLE A3
2 . 3 2 . 0 4 . 6 4 . 0 9 . 0 7 . 3 2 1 . 5 39 . ? 2 2 . 8 7 . 6 1 1 . 8 3 . 54 . 7 4 . 2 9 . 3 8 . 2 1R . 3 1 4 . 9 4 3 . 6 7 9 . 6 4 A . 2 15 . 3 2 3 . 9 7 . 12 . 2 1 . 9 4 . 3 3 . 8 R . 5 6 . 9 2 0 . 3 3 7 . 0 2 1 . 5 7 . 1 1 1 . 1 3 . 32 . 5 2 . 3 5 . 0 4 . 4 9 . 9 8 . 0 2 3 . 6 4 3 . 1 25 . 0 8 . 3 1 3 . 0 3 . 99 . 4 8 . 4 18 . 9 16 . 6 37 . 2 30 . 2 8 R. 5 16 1 . 5 9 3 . 8 3 1 . 1 4 8 . 6 14 . 51 . 6 1 . 4 3 . 2 2 . 8 6 . 3 5 . 1 14 . 9 2 7 . 3 15 . 8 5 . 3 3 . 2 2 . 42 . 8 2 . 5 5 . 5 4 . 8 10 . 9 8 . 8 2 5 . 8 4 7 . 2 2 7 . 4 9 . 1 14 . 2 4 . 23 . 1 2 . 3 6 . 3 5 . 5 12 . 4 10 . 0 29 . 4 5 3 . 7 3 1 . 2 1 0 . 4 16 . 2 4 . 83 . 1 2 . 8 6 . 3 5 . 5 12 . 3 10 . 0 2 9 . 3 5 3 . 5 3 1 . 1 10 . 3 16 . 1 4 . 81 . 4 1 . 2 2 . 8 2 . 4 5 . 5 4 . 4 13 . 0 2 3 . 7 13 . 8 4 . 6 7 . 1 2 . 1
10 . 4 9 . 3 2 0 . 8 18 . 2 4 0 . 9 3 3 . 2 9 7 . 2 1 7 7 . 5 10 1 . 1 3 4 . 2 5 3 . 4 15 . 93 . 5 3 . 1 6 . 9 6 . 1 1 3 . 6 1 1 . 1 3 2 . 4 5 9 . 2 34 . 4 1 1 . 4 17 . 8 5 . 3
. 7 . 6 1 . 5 1 . 3 2 . 9 2 . 3 6 . 8 12 . 4 7 . 2 2 . 4 3 . 7 1 . 11 . 0 . 9 2 . 0 1 . 8 4 . 0 3 . 2 9 . 5 17 . 3 10 . 0 3 . 3 5 . 2 1 . 51 . 5 1 . 4 3 . 1 2 . 7 6 . 1 4 . 9 14 . 5 2 6 . 5 15 . 4 5 . 1 R. 0 2 . 43 . 3 3 . 0 6 . 6 5 . 8 1 3 . 0 10 . 6 3 1 . 0 5 6 . 6 3 2 . 9 10 . 9 1 7 . 0 5 . 1
. 5 . 4 1 . 0 . 9 2 . 0 1 . 6 4 . 7 8 . 6 5 . 0 1 . 6 2 . 6 . A3 . 2 2 . 9 6 . 4 5 . 6 12 . 7 10 . 3 30 . 1 5 5 . 0 3 1 . 9 10 . 6 16 . 5 4 . 92 . 6 2 . 3 5 . 1 4 . 5 1 . 1 8 . 2 2 4 . 1 4 4 . 0 2 5 . 6 A. 5 13 . 2 3 . 92 . 9 2 . 5 5 . 7 5 . 0 1 1 . 2 9 . 1 2 6 . 7 4 8 . 8 2 8 . 3 9 . 4 14 . 7 4 . 4
. 5 . 4 1 . 0 . 9 2 . 0 1 . 6 4 . 6 8 . 5 4 . 9 1 . 6 2 . 5 . 8

•6
•
II
111
- - -
4 . 1 3 . 7 8 . 34 6 . 2 4 1 . 2 9 2 . 35 4 . 9 4 9 . 1 10 9 . 8
8 . 0 18 . 02 . 2 4 . 8
. 8 1 . 7
9 . 02 . 4
. 9
. 51 . 21 . 03 . 3
. 31 . 92 . 3
. 2 . 2 . 4 . 4 . 86 . 0 5 . 3 12 . 0 10 . 5 2 3 . 6
13 . 8 1 2 . 3 2 7 . 6 2 4 . 3 5 4 . 42 . 4 2 . 1 4 . 8 4 . 2 9 . 51 . 2 1 . 1 2 . 4 2 . 1 4 . 71 . 0 . 9 2 . 1 1 . 8 4 . 15 . 2 4 . 7 10 . 5 9 . 2 2 0 . 6
__ __ 2 . 3 _ _ 2 . 0 - -4 . 5 - 4 . 0 - - - 9 ; 0 -4 . 9 4 . 4 9 . 8 8 . 6 19 . 34. 2 3 . 8 8 . 5 7 . 5 16 . 71 . 1 1 . 0 2 . 2 1 . 9 4 . 3
S n t h e t i c f l ow s e ue nc e No . 2
7 . 3 16 . 3 13 . 2 3 8 . 7 7 0 . 7 4 1 . 1 1 3 . 6 2 1 . 38 1 . 1 18 1 . 9 14 7 . 5 4 3 2 . 3 7 8 9 . 2 4 5 8 . 5 15 2 . 1 2 3 7 . 39 6 . 5 2 16 . 4 175 . 5 5 14 . 4 9 3 9 . 1 5 4 5 . 6 18 1 . 0 2 8 2 . 415 . 8 35 . 4 2 8 . 7 8 4 . 1 15 3 . 5 8 9 . 2 29 . 6 4 6 . 2
4 . 3 9 . 5 7 . 7 2 2 . 7 4 1 . 4 2 4 . 0 8 . 0 18 . 41 . 5 3 . 4 2 . 7 8 . 0 14 . 6 8 . 5 2 . 8 4 . 4
. 4 1 . 0 . 9 2 . 0 1 . 6 4 . 7 9 . 6 5 . 0 1 . 7 2 . 61 . 1 2 . 4 2 . 1 4 . 8 3 . 9 1 1 . 3 2 0 . 7 12 . 0 4 . 0 6 . 2
. 9 2 . 1 1 . 8 4 . 1 3 . 3 9 . 8 17 . 9 10 . 4 3 . 4 5 . 42 . 9 6 . 5 5 . 7 12 . 9 10 . 4 30 . 6 5 5 . 9 3 2 . 5 10 . 8 16 . 8
. 2 . 6 . 5 1 . 1 . 9 2 . 6 4 . 8 2 . 8 . 9 1 . 41 . 7 3 . 8 3 . 4 7 . 5 6 . 1 1 7 . 9 3 2 . 6 19 . 0 6 . 3 9 . 82 . 0 4 . 5 4 . 0 9 . 0 7 . 3 2 1 . 3 3 8 . 9 2 2 . 6 7 . 5 1 1 . 7
. 1 . 0 . 1 . 1 . 2 . 2 . 5 1 . 0 . 6 . 2 . 3
. 8 . 7 1 . 5 1 . 4 3 . 0 2 . 5 7 . 2 1 3 . 2 7 . 7 2 . 5 4 . 0
. 4 . 3 . 7 . 6 1 . 4 1 . 1 3 . 4 6 . 1 3 . 6 1 . 2 1 . 8
. 7 . 6 1 . 4 1 . 3 2 . 8 2 . 3 6 . 7 1 2 . 2 7 . 1 2 . 4 1 . 7
. 8 . 4 1 . 0 . 9 1 . 9 1 . 6 4 . 6 8 . 4 4 . 9 1 . 6 2 . 51 . 4 1 . 3 2 . 8 2 . 5 5 . 6 4 . 5 13 . 2 2 4 . 1 14 . 0 4 . 7 7 . 3
. 8 . 7 1 . 6 1 . 4 3 . 1 2 . 5 7 . 4 1 3 . 5 7 . 8 2 . 6 4 . 02 . 4 2 . 2 4 . 9 4 . 3 9 . 6 7 . 8 2 2 . 8 4 1 . 7 2 4 . 2 8 . 0 12 . 53 . 1 2 . 7 6 . 1 5 . 4 12 . 1 9 . 8 2 8 . 8 5 2 . 6 3 0 . 5 10 . 1 15 . 8
. 3 . 3 . 6 . 5 1 . 1 . 9 2 . 6 4 . 1 P . 8 , 9 1 . 4
. 8 . 4 1 . 0 . 8 1 . 9 1 . 5 4 . 5 8 . 2 4 . 8 1 . 6 2 . 51 . 1 1 . 0 2 . 2 2 . 0 4 . 4 3 . 6 10 . 4 19 . 1 1 1 . 1 3 . 7 5 . 76 . 5 5 . 8 13 . 1 1 1 . 5 25 . 8 2 0 . 9 6 1 . 3 1 1 1 . 9 6 5 . 0 2 1 . 6 3 3 . 61 . 7 1 . 5 3 . 4 3 . 0 6 . 7 5 . 4 16 . 0 2 9 . 1 1A. 9 5 . 6 9 . 81 . 9 1 . 7 3 . 8 3 . 3 7 . 4 6 . 0 17 . 6 3 2 . 2 18 . 7 6 . 2 9 . 7
. 9 . 8 1 . 8 1 . 6 3 . 6 3 . 0 8 . 7 15 . 8 9 . 2 3 . 0 4 . 8
. 5 . 4 . 9 . 8 1 . 8 1 . 5 4 . 3 7 . 9 4 . 6 1 . 5 2 . 41 . 9 1 . 7 3 . 7 3 . 3 7 . 3 5 . 9 17 . 4 3 1 . 8 18 . 5 6 . 1 9 . 63 . 0 2 . 7 6 . 0 5 . 3 1 1 . 9 9 . 6 2 8 . 3 5 1 . 6 3 0 . 0 9 . 9 15 . 54 . 4 3 . 9 8 . 8 7 . 7 17 . 3 14 . 1 4 1 . 2 7 5 . 2 4 3 . 7 14 . 5 2 2 . 61 . 0 . 9 2 . 0 1 . 8 4 . 0 3 . 3 9 . 6 1 7 . 4 1 0 . 1 3 . 4 5 . 2
. 6 1 . 9 3 . 4 2 . 019 . 1 5 6 . 1 10 2 . 4 5 9 . 54 4 . 1 12 9 . 3 2 3 6 . 0 13 7 . 1
7 . 7 2 2 . 5 4 1 . 1 2 1 . 93 . 8 1 1 . 2 2 0 . 4 1 1 . 93 . 3 9 . 7 17 . 7 1 0 . 3
16 . 7 4 9 . 1 8 9 . 6 _ . 5 2 . 07 . 3 2 17 3 38 . 9 2 2 . 6
15 . 7 46 . 0 8 3 . 9 4 8 . 813 . 5 3 9 . 7 72 . 5 4 2 . 1
3 . 5 10 . 1 18 . 5 1 0 . 7
T ABL E A4
6 . 37 0 . 78 4 . 21 3 . 8
3 . 71 . 3
. 81 . 91 . 65 . 0
. 4
2 . 93 . 5
. 11 . 2
. 51 . 1
. 72 . 21 . 23 . 74 . 7
. 4
. 71 . 7
10 . 02 . 62 . 91 . 4
. 72 . 84 . 66 . 71 . 6
. 7 1 . 0 . 319 . 7 3 0 . 8 9 . 24 5 . 5 7 1 . 0 2 1 . 2
7 . 9 12 . 4 3 . 73 . 9 6 . 1 1 . 83 . 4 5 . 3 1 . 6
_7 . 5 1 1 . 7 3 . 5
16 . 2 2 5 . 2 7 . 514 . 0 2 1 . 8 6 . 5
3 . 6 5 . 6 1 . 7
1 . 3 1 . 2 2 . 6 2 . 3 5 . 2 4 . 2 12 . 3 2 2 . 4 1 3 . 0 4 . 3 6 . 7 2 . 04 . 0 3 . 6 8 . 0 7 . 0 15 . 7 12 . 8 3 7 . 4 6 8 . 3 3 9 . 7 1 3 . 2 2 0 . 5 6 . 11 . 8 1 . 6 3 . 6 3 . 2 7 . 2 5 . 8 17 . 0 3 1 . 1 18 . 1 6 . 0 9 . 3 2 . 8
. 6 . 5 1 . 1 1 . 0 2 . 2 1 . 8 5 . 2 9 . 6 5 . 6 1 . 8 2 . 9 . 9
1 . 7 1 . 5 3 . 4 3 . 0 6 . 7 5 . 4 15 . 9 2 9 . 1 16 . 9 5 . 6 8 . 7 2 . 610 . 9 9 . 7 2 1 . 8 19 . 2 4 3 . 0 34 . 9 10 2 . 2 18 6 . 6 10 8 . 4 3 6 . 0 5 6 . 1 16 . 7
3 . 2 2 . 9 6 . 5 5 . 7 12 . 8 10 . 3 3 0 . 3 5 5 . 4 3 2 . 2 1 0 . 7 16 . 7 5 . 01 . 6 1 . 5 3 . 3 2 . 9 6 . 5 5 . 2 15 . 4 2 8 . 1 16 . 3 5 . 4 8 . 4 2 . 5
; 3 . 2 2 . 9 6 . 4 5 . 7 12 . 7 10 . 3 30 . 1 5 5 . 0 3 2 . 0 1 0 . 6 16 . 5 4 . 91 . 9 . 8 1 . 8 1 . 5 3 . 5 2 . 8 8 . 2 15 . 0 8 . 7 2 . 9 4 . 5 1 . 3

•
11
1111
11 TABLE A4 ( c o n t i n u e d )
116
11 3 . 0 2 . 7 6 . 0 5 . 2 1 1 . 7 9 . 5 2 7 . 9 5 0 . 9 2 9 . 6 9 . 8 15 . 3 4 . 65 . 6 5 . 0 1 1 . 2 9 . 9 2 7 . 1 17 . 9 5 2 . 6 9 6 . 1 5 5 . 8 18 . 5 2 8 . 9 8 . 6
11 2 . 0 1 . 8 4 . 1 3 . 6 8 . 0 6 . 5 19 . 1 34 . 8 2 0 . 2 6 . 7 10 . 5 3 . 16 . 8 6 . 0 13 . 5 1 1 . 9 2 6 . 7 2 1 . 6 6 3 . 4 1 15 . 7 6 7 . 2 2 2 . 3 3 4 . 8 10 . 4
11 A. 5 7 . 6 17 . 1 15 . 0 3 1 . 7 2 7 . 3 8 0 . 0 14 6 . 0 8 4 . 8 2 8 . 1 4 3 . 9 1 3 . 1. 2 . 2 . 4 . 4 . A . 6 1 . 9 3 . 5 2 . 0 . 7 1 . 0 . 3
6 4 . 1 3 . 6 8 . 1 7 . 1 16 . 0 12 . 9 3 7 . 9 6 9 . 3 4 0 . 2 1 3 . 4 2 0 . 8 6 . 21 3 . 0 6 . 7 5 . 4 15 . 9 2 9 . 0 16 . 9 5 . 6 8 . 7 2 . 6OD
1 . 72 . 8
1 . 52 . 5
3 . 45 . 6 4 . 9 1 1 . 0 8 . 9 2 6 . 1 4 7 . 6 2 7 . 6 9 . 2 14 . 3 4 . 3
. 9 . 8 1 . 7 1 . 5 1 . 4 2 . 8 8 . 1 14 . 9 8 . 6 2 . 9 4 . 5 1 . 341 3 . 2 2 . 9 6 . 5 5 . 7 12 . 8 1 0 . 4 3 0 . 3 5 5 . 4 3 2 . 2 10 . 7 1 6 . 7 5 . 01 . 0 . 8 1 . 9 1 . 7 3 . 7 3 . 0 8 . 9 16 . 3 9 . 4 1 . 1 4 . 9 1 . 541 . 4 . 4 . 8 . 7 1 . 6 1 . 3 3 . 9 7 . 1 4 . 1 1 . 4 2 . 1 . 61 . 8 1 . 6 3 . 6 3 . 1 7 . 0 5 . 7 16 . 7 3 0 . 4 17 . 7 5 . 9 9 . 2 2 . 741 . 7 . 6 1 . 4 1 . 1 7 . 9 2 . 3 6 . 8 12 . 4 7 . 2 2 . 4 3 . 7 1 . 12 . 3 2 . 1 4 . 6 4 . 1 9 . 1 7 . 4 2 1 . 7 3 9 . 6 2 1 . 0 7 . 6 1 1 . 9 3 . 541 . 8 . 7 1 . 6 1 . 4 3 . 1 2 . 5 7 . 3 13 . 3 7 . 7 2 . 6 4 . 0 1 . 25 . 5 4 . 9 1 1 . 1 9 . 7 2 1 . 8 17 . 7 5 1 . 8 9 4 . 5 5 4 . 9 18 . 2 2 8 . 4 8 . 541 6 . 8 6 . 1 13 . 7 1 2 . 0 2 6 . 9 2 1 . 9 6 4 . 1 1 16 . 9 6 7 . 9 2 2 . 5 35 . 2 1 0 . 5
'!6 . 7 6 . 0 13 . 5 1 1 . 6 2 6 . 5 7 1 . 5 6 3 . 0 1 15 . 1 6 6 . 9 2 2 . 2 3 4 . 6 10 . 1
. 7 . 6 1 . 3 1 . 2 2 . 6 2 . 1 6 . 3 1 1 . 5 6 . 7 2 . 2 3 . 4 1 . 0

•
IS

•••••
••
•••••0
•
•TABLE A5 ( c o n t i n u e d )

0
•
•
•
2 . 39 . 6
3 6 . 110 . 3
1 . 22 . 7
2 . 08 . 6
3 2 . 39 . 21 . 12 . 4
4 . 519 . 172 . 22 0 . 6
2 . 45 . 4
S n t h e t i c f l o w s e q ue n c e No . 4
4 . 0 8 . 9 7 . 2 2 1 . 2 38 . 816 . 8 3 7 . 7 3 0 . 6 8 9 . 6 16 3 . 76 3 . 4 14 2 . 2 1 15 . 3 3 3 8 . 1 6 1 7 . 318 . 1 4 0 . 5 3 2 . 8 9 6 . 3 17 5 . 8
2 . 1 4 . 7 3 . 8 1 1 . 1 2 0 . 34 . 7 10 . 6 8 . 6 2 5 . 3 4 6 . 2
2 7 . 59 5 . 1
35 8 . 610 7 . 1
1 1 . 82 6 . 8
TABLE A6
7 . 5 1 1 . 73 1 . 5 4 9 . 2
1 19 . 0 18 5 . 63 3 . 9 5 2 . 9
3 . 9 6 . 18 . 9 1 3 . 9
3 . 514 . 75 5 . 315 . 8
1 . 84 . 1
. 4 . 3 . 8 . 7 1 . 5 1 . 2 3 . 5 6 . 5 3 . 8 1 . 2 1 . 9 . 6
• 4 . 5 4 . 0 8 . 9 7 . 8 17 . 6 14 . 3 4 1 . 8 76 . 4 4 4 . 4 1 4 . 7 2 3 . 0 6 . 81 . 8 1 . 6 3 . 7 3 . 2 7 . 2 5 . 9 1 7 . 2 3 1 . 4 18 . 2 6 . 0 9 . 4 2 . 8
• 3 . 1 2 . 8 6 . 2 5 . 4 12 . 2 9 . 9 2 8 . 9 5 2 . 9 3 0 . 7 10 . 2 15 . 9 4 . 7. 8 . 7 1 . 7 1 . 5 3 . 3 2 . 7 7 . 8 14 . 3 8 . 3 2 . 7 4 . 3 1 . 3
• 2 . 9 2 . 6 5 . 7 5 . 0 1 1 . 3 9 . 1 2 6 . 8 4 8 . 8 2 8 . 4 9 . 4 14 . 7 4 . 42 . 3 2 . 1 4 . 7 4 . 1 q . 2 7 . 5 2 1 . 8 3 9 . 9 2 1 . 2 7 . 7 12 . 0 3 . 6
• . 1 . 1 . 1 . 1 . 2 . 2 . 5 1 . 0 . 6 . 2 . 3 . 1. 4 . 3 . 7 . 6 1 . 5 1 . 2 3 . 4 6 . 3 1 . 7 1 . 2 1 . 9 . 6
• . 6 . 5 1 . 2 1 . 0 2 . 3 1 . 9 5 . 6 10 . 1 5 . 9 2 . 0 3 . 0 . 9. 6 . 5 1 . 1 1 . 0 2 . 3 1 . 8 5 . 4 9 . 8 5 . 7 1 . 9 2 . 9 . 9
• 2 . 7 2 . 4 5 . 5 4 . 8 10 . 8 8 . 7 2 5 . 6 4 6 . 8 2 7 . 2 9 . 0 14 . 1 4 . 22 . 7 2 . 4 5 . 3 4 . 7 10 . 5 8 . 5 2 4 . 9 4 5 . 5 2 6 . 5 8 . 8 1 3 . 7 4 . 1
• . 7 . 6 1 . 4 1 . 2 2 . 7 2 . 2 6 . 5 1 1 . 9 6 . 9 2 . 3 3 . 6 1 . 11 . 5 1 . 3 3 . 0 2 . 6 5 . 9 4 . 8 14 . 0 2 5 . 6 14 . 9 4 . 9 7 . 7 2 . 3
• 4 . 1 3 . 6 8 . 2 7 . 2 16 . 1 13 . 0 3 8 . 2 6 9 . 8 4 0 . 5 1 3 . 4 2 1 . 0 6 . 3. 7 . 6 1 . 4 1 . 2 2 . 7 2 . 2 6 . 5 1 1 . 8 6 . 9 2 . 3 3 . 6 1 . 1. 9 . 8 1 . 8 1 . 5 3 . 5 2 . 8 8 . 3 15 . 1 8 . 8 2 . 9 4 . 5 1 . 4
1 . 5 1 . 3 3 . 0 2 . 6 5 . 9 4 . 8 1 3 . 9 2 5 . 4 14 . 8 4 . 9 7 . 6 2 . 3• 5 . 4 4 . 8 10 . 7 9 . 4 2 1 . 1 17 . 1 5 0 . 3 9 1 . 8 5 3 . 3 17 . 7 2 7 . 6 8 . 7
•2 . 1
. 71 . 9
. 64 . 21 . 4
3 . 71 . 3
8 . 22 . 8
6 . 72 . 3
19 . 66 . 8
3 5 . 712 . 4
2 0 . 77 . 2
6 . 92 . 4
10 . 71 . 7
3 . 21 . 1
. 3 . 7 . 6 1 . 3 1 . 1 3 . 1 5 . 7 1 . 3 1 . 1 1 . 7 . 50 . 6 . 6 1 . 3 1 . 1 2 . 5 2 . 0 6 . 0 10 . 9 6 . 4 2 . 1 3 . 3 1 . 0
. 6 . 5 1 . 1 1 . 0 2 . 3 1 . 8 5 . 4 9 . 8 5 . 7 1 . 9 2 . 9 . 91 . 4 1 . 3 2 . 9 2 . 5 5 . 6 4 . 6 13 . 4 2 4 . 5 14 . 2 4 . 7 7 . 4 2 . 24 . 0 3 . 6 8 . 1 7 . 1 15 . 9 12 . 9 3 7 . 7 6 8 . 8 4 0 . 0 1 3 . 3 2 0 . 7 6 . 2
• 3 . 2 2 . 9 6 . 5 5 . 7 12 . 8 10 . 3 3 0 . 3 5 5 . 4 3 2 . 2 10 . 7 16 . 6 5 . 0. 7 . 6 1 . 4 1 . 3 2 . 8 2 . 3 6 . 7 12 . 2 7 . 1 2 . 4 3 . 7 1 . 1
• 2 . 5 2 . 3 5 . 1 4 . 5 10 . 0 8 . 1 2 3 . 8 4 3 . 4 2 5 . 2 8 . 4 1 3 . 0 3 . 94 . 2 3 . 8 8 . 4 7 . 4 16 . 6 13 . 4 39 . 4 7 1 . 9 4 1 . 8 1 3 . 9 2 1 . 6 6 . 4
• 2 . 9 2 . 6 5 . 9 5 . 2 1 1 . 6 9 . 4 2 7 . 6 5 0 . 3 2 9 . 2 9 . 7 15 . 1 4 . 51 . 5 1 . 3 3 . 0 2 . 6 5 . 9 4 . 8 14 . 1 2 5 . 8 15 . 0 5 . 0 7 . 7 2 . 3
• 1 . 6 1 . 4 3 . 1 2 . 8 6 . 2 5 . 0 14 . 7 2 6 . 9 15 . 6 5 . 2 8 . 1 2 . 42 . 0 1 . 8 4 . 0 3 . 5 7 . 9 6 . 4 18 . 9 3 4 . 4 2 0 . 0 6 . 6 1 0 . 3 3 . 1
411 1 . 5 1 . 3 3 . 0 2 . 6 5 . 8 4 . 7 13 . 9 2 5 . 4 14 . 7 4 . 9 7 . 6 2 . 37 . 2 6 . 5 14 . 5 12 . 7 2 8 . 6 2 3 . 1 6 7 . 9 12 3 . 9 7 2 . 0 2 3 . 9 3 7 . 3 1 1 . 1
• 1 . 9 1 . 7 3 . 7 3 . 3 7 . 3 6 . 0 17 . 4 3 1 . 9 18 . 5 6 . 1 9 . 6 2 . 9. 8 . 7 1 . 7 1 . 5 3 . 3 2 . 7 7 . 8 14 . 2 8 . 3 2 . 7 4 . 3 1 . 3
• . 4 . 4 . 9 . 8 1 . 7 1 . 4 4 . 1 7 . 5 4 . 3 1 . 4 2 . 2 . 77 . 7 6 . 9 15 . 4 13 . 5 3 0 . 3 2 4 . 6 7 2 . 0 13 1 . 4 7 6 . 4 2 5 . 3 3 9 . 5 1 1 . 81 . 7 1 . 5 3 . 4 3 . 0 6 . 8 5 . 5 16 . 1 2 9 . 4 17 . 1 5 . 7 8 . 9 2 . 6
•. 7
2 . 1. 6
1 . 91 . 44 . 2
1 . 23 . 7
2 . 78 . 3
2 . 26 . 7
6 . 519 . 7
1 1 . 83 5 . 9
6 . 82 0 . 8
2 . 36 . 9
3 . 51 0 . 8
1 . 13 . 2
•9 . 96 . 2
8 . 85 . 5
19 . 712 . 4
17 . 310 . 9
3 8 . 82 4 . 4
3 1 . 519 . 8
9 2 . 35 8 . 0
16 8 . 5105 . 9
9 7 . 96 1 . 5
3 2 . 52 0 . 4
5 0 . 73 1 . 9
15 . 19 . 5
2 . 1 1 . 9 4 . 2 3 . 7 8 . 3 6 . 7 19 . 7 3 5 . 9 2 0 . 9 6 . 9 10 . 8 3 . 21 . 6 1 . 4 3 . 2 2 . 8 6 . 4 5 . 2 15 . 1 2 7 . 6 16 . 0 5 . 3 8 . 3 2 . 5
. 5 . 5 1 . 0 . 9 2 . 0 1 . 6 4 . 8 8 . 8 5 . 1 1 . 7 2 . 7 . 8

0
•
•
•
41
41
41
41
•
41
41
41
41
41
0
••
I fb
•••••
••
TABLE A6 ( c o n t i n u e d )

•
• 5 n t h e t i c f l o w s e u e n c e No . 5T ABLE A7
• 5 . 0 4 . 5 10 . 0 8 . 8 19 . 8 16 . 0 4 7 . 0 8 5 . 8 4 9 . 8 16 . 5 2 5 . 8 7 . 7
0 2 0 . 112 6 . 5
18 . 01 13 . 0
4 0 . 22 5 2 . 9
35 . 32 2 2 . 3
7 9 . 24 9 8 . 4
6 4 . 2 18 8 . 2 3 4 3 . 7 19 4 . 74 0 4 . 1 1 18 4 . 6 2 16 2 . 7 12 5 6 . 5
6 6 . 24 16 . 8
10 3 . 36 5 0 . 3
1 0 . 819 3 . 8
•5 . 18 . 9
4 . 68 . 0
1 0 . 317 . 8
9 . 015 . 7
2 0 . 33 5 . 1
16 . 42 8 . 5
4 8 . 28 3 . 5
8 8 . 015 2 . 4
5 1 . 18 9 . 5
17 . 02 9 . 4
2 6 . 54 5 . 8
7 . 913 . 7
41 . 9. 4
. 8. 4
1 . 8. 8
1 . 6. 7
3 . 61 . 7
2 . 91 . 3
8 . 63 . 9
15 . 67 . 2
9 . 14 . 2
3 . 01 . 4
4 . 7
2 . 21 . 4
. 6
• 3 . 42 . 0
3 . 01 . 8
6 . 74 . 1
5 . 93 . 6
1 3 . 28 . 1
10 . 76 . 5
3 1 . 419 . 2
5 7 . 43 5 . 0
3 3 . 32 0 . 3
1 1 . 16 . 8
1 7 . 21 0 . 5
5 . 13 . 1
41 . 51 . 6
. 51 . 4
1 . 13 . 2
1 . 02 . 9
2 . 16 . 4
1 . 75 . 2
5 . 115 . 1
9 . 32 7 . 6
5 . 416 . 1
1 . 85 . 3
2 . 8A. 3
. 82 . 5
41 11. 22 . 5
10 . 02 . 2
2 2 . 44 . 9
19 . 74 . 3
4 4 . 29 . 7
35 . 87 . 8
10 5 . 12 3 . 0
19 1 . 84 2 . 0
1 1 1 . 42 4 . 4
3 7 . 08 . 1
5 7 . 71 2 . 6
1 7 . 23 . 8
5 . 0. 8
. 0
. 7. 1
1 . 6. 1
1 . 4. 2
3 . 1. 1
2 . 6. 4
7 . 5. 7
13 . 7. 4
7 . 9. 1
2 . 6. 2
4 . 1. 1
1 . 2
• 1. 1. 7
1. 0. 6
2 . 21 . 4
1 . 91 . 2
4 . 42 . 7
3 . 52 . 2
10 . 46 . 4
18 . 91 1 . 6
1 1 . 06 . 8
3 . 62 . 2
5 . 73 . 5
1 . 71 . 0
• 1 . 32 . 3
1 . 12 . 1
2 . 64 . 6
2 . 24 . 0
5 . 09 . 1
4 . 17 . 3
1 1 . 92 1 . 5
2 1 . 83 9 . 3
12 . 72 2 . 8
4 . 27 . 6
6 . 6
1 1 . 82 . 03 . 5
41 1 . 01 . 8
. 91 . 6
2 . 03 . 6
1 . 73 . 2
3 . 97 . 2
3 . 25 . 8
9 . 31 7 . 1
16 . 93 1 . 2
9 . 818 . 1
3 . 36 . 0
5 . 19 . 4
1 . 52 . 8
• 2 . 6. 7
2 . 3. 6
5 . 21 . 4
4 . 51 . 3
10 . 22 . 8
8 . 32 . 3
2 4 . 26 . 7
4 4 . 212 . 2
2 5 . 77 . 1
8 . 52 . 4
1 3 . 33 . 7
4 . 0
1 . 1
• 1 . 21 . 3
1 . 11 . 2
2 . 52 . 7
2 . 22 . 4
4 . 85 . 3
3 . 94 . 3
1 1 . 512 . 6
2 1 . 02 3 . 0
12 . 21 3 . 4
4 . 14 . 4
6 . 36 . 9
1 . 92 . 1
41, 7 . 56 . 7
6 . 76 . 0
15 . 013 . 4
13 . 21 1 . 7
2 9 . 52 6 . 3
2 3 . 92 1 . 4
7 0 . 26 2 . 6
1 28 . 11 14 . 3
7 4 . 46 6 . 4
2 4 . 72 2 . 0
3 9 . 53 4 . 4
1 1 . 510 . 2
AD 1 . 8. 5
1 . 6. 5
3 . 61 . 1
3 . 1. 9
7 . 02 . 1
5 . 71 . 7
16 . 75 . 0
3 0 . 59 . 1
1 7 . 75 . 1
5 . 91 . 7
9 . 22 . 7
2 , 7. 8
AD . 31 . 3
. 31 . 2
. 72 . 7
. 62 . 3
1 . 35 . 3
1 . 04 . 3
3. 012 . 5
5 . 62 2 . 9
3 . 21 3 . 3
1 . 14 . 4
1 . 76 . 9
. 52 . 0
• 1 . 83 . 9
1 . 63 . 5
3 . 77 . 9
3 . 26 . 9
7 . 315 . 5
5 . 912 . 6
17 . 33 6 . 9
3 1 . 56 7 . 4
19 . 33 9 . 2
6 . 113 . 0
9 . 52 0 . 3
2 . 86 . 0
• 1 . 81 . 3
1 . 61 . 2
3 . 72 . 6
3 . 22 . 3
7 . 25 . 2
5 . 84 . 2
1 7 . 11 2 . 3
3 1 . 32 2 . 4
18 . 21 3 . 0
6 . 04 . 3
9 . 46 . 7
2 . 82 . 0
41 3 . 86 . 2
3 . 45 . 5
7 . 512 . 3
6 . 610 . 8
14 . 92 4 . 3
12 . 119 . 7
3 5 . 35 7 . 7
6 4 . 510 5 . 4
3 7 . 56 1 . 3
12 . 42 0 . 3
19 . 43 1 . 7
5 . 89 . 4
AD]J.1=41
1 . 61 . 22 . 51 . 9
. 92 . 9
1 . 41 . 12 . 21 . 7
. 82 . 6
3 . 22 . 54 . 93 . 81 . 75 . 9
2 . 82 . 24 . 33 . 31 . 55 . 2
6 . 34 . 99 . 77 . 53 . 4
1 1 . 6
5 . 14 . 07 . 86 . 12 . 89 . 4
15 . 01 1 . 62 3 . 01 7 . 8
8 . 22 7 . 6
2 7 . 42 1 . 24 1 . 93 2 . 514 . 95 0 . 4
15 . 91 2 . 32 4 . 418 . 9
8 . 72 9 . 3
5 . 34 . 18 . 16 . 32 . 99 . 7
8 . 26 . 4
12 . 69 . 84 . 5
1'5 . 1
2 . 51 . 93 . 82 . 91 . 34 . 5
• 2 . 7 2 . 4 5 . 5 4 . 8 10 . 7 8 . 7 2 5 . 5 4 6 . 6 2 7 . 1 9 . 0 14 . 0 4 . 22 . 1 1 . 9 4 . 2 3 . 7 8 . 3 6 . 8 19 . 8 3 6 . 2 2 1 . 0 7 . 0 1 0 . 9 3 . 2
• . 6 . 6 1 . 3 1 . 1 2 . 5 2 . 0 5 . 9 1 0 . 8 6 . 2 2 . 1 3 . 2 1 . 04 . 3 3 . 8 8 . 6 7 . 6 16 . 9 13 . 7 4 0 . 2 7 3 . 5 4 2 . 7 14 . 2 2 2 . 1 6 . 6
• 3 . 5 3 . 1 6 . 9 6 . 1 13 . 7 1 1 . 1 3 2 . 5 5 9 . 4 3 4 . 5 1 1 . 4 17 . 8 5 . 31 . 4 1 . 2 2 . 7 2 . 4 5 . 4 4 . 4 12 . 8 2 3 . 4 1 3 . 6 4 . 5 7 . 0 2 . 1
• 3 . 6 3 , 2 7 . 2 6 . 4 14 . 3 1 1 . 6 3 3 . 9 6 1 . 9 3 6 . 0 1 1 . 9 18 . 6 5 . 53 , 7 3 , 3 7 . 3 6 . 4 14 . 4 1 1 . 7 3 4 . 2 6 2 . 5 3 6 . 3 12 . 0 18 . 8 5 . 6
AP3
2 . 54 . 8
2 . 34 . 3
5 . 19 . 6
4 . 48 . 4
10 . 018 . 9
8 . 115 . 3
2 3 . 74 4 . 9
4 3 . 38 1 . 9
2 5 . 24 7 . 6
8 . 315 . 8
1 3 . 02 4 . 6
3 . 97 . 31 2 . 6 2 . 3 5 . 2 4 . 6 10 . 2 8 . 3 2 4 . 3 4 4 . 4 2 5 . 8 8 . 6 1 3 . 3 4 . 0
14 11 3 . 4 3 . 0 6 . 8 6 . 0 1 3 . 4 10 . 9 3 1 . 9 5 8 . 2 3 3 . 8 1 1 . 2 1 7 . 5
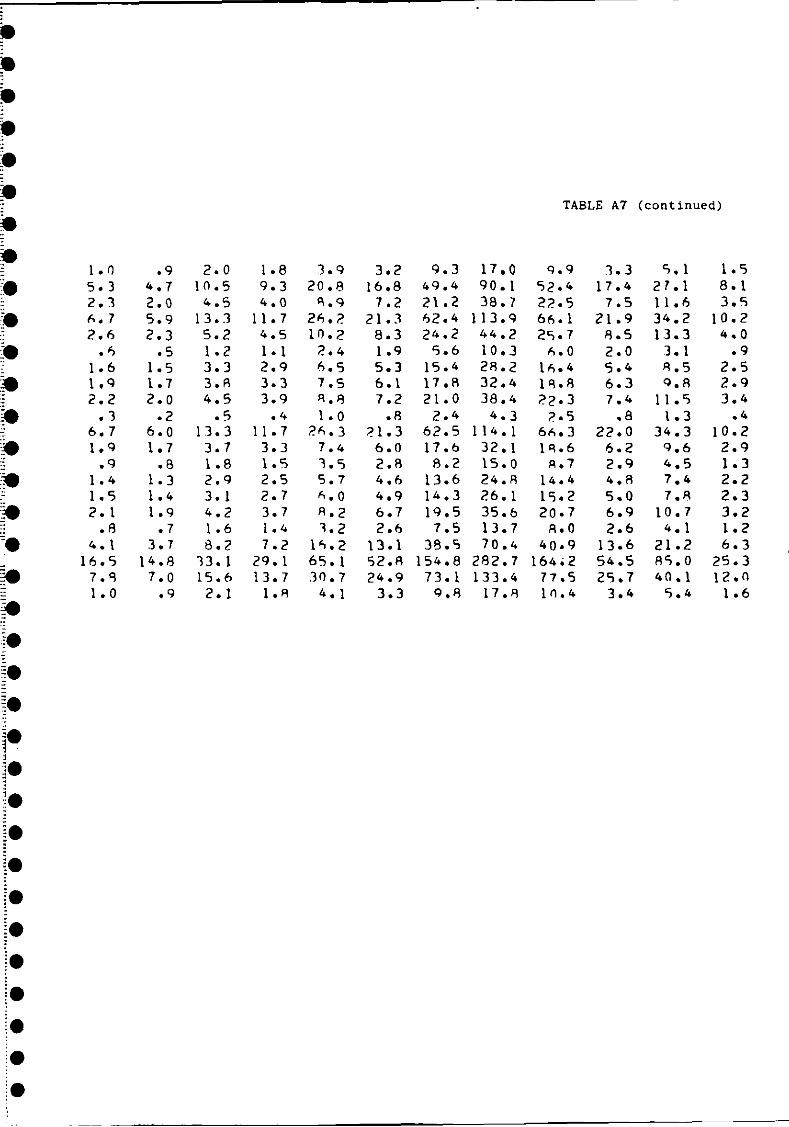
TABLE A7 ( c on t i nue d )
1 . 0 . 9 2 . 0 1 . 8 3 . 9 3 . 2 9 . 3 17 . 0 9 . 9 3 . 3 5 . 1 1 . 55 . 3 4 . 7 10 . 5 9 . 3 2 0 . 9 16 . 8 4 9 . 4 9 0 . 1 5 2 . 4 1 7 . 4 2 7 . 1 8 . 12 . 1 2 . 0 4 . 5 4 . 0 8 . 9 7 . 2 2 1 . 2 3 8 . 7 2 2 . 5 7 . 5 1 1 . 6 3 . 56 . 7 5 . 9 1 3 . 3 1 1 . 7 2 6 . 2 2 1 . 3 6 2 . 4 1 1 3 . 9 6 6 . 1 2 1 . 9 3 4 . 2 1 0 . 22 . 6 2 . 3 5 . 2 4 . 5 1 0 . 2 8 . 3 2 4 . 2 4 4 . 2 2 5 . 7 8 . 5 1 3 . 3 4 . 0
. 6 . 5 1 . 2 1 . 1 2 . 4 1 . 9 5 . 6 10 . 3 6 . 0 2 . 0 3 . 1 . 91 . 6 1 . 5 3 . 3 2 . 9 6 . 5 5 . 3 15 . 4 2 8 . 2 16 . 4 5 . 4 R . 5 2 . 51 . 9 1 . 7 3 . 8 3 . 3 7 . 5 6 . 1 17 . 8 3 2 . 4 1 8 . 8 6 . 3 9 . 8 2 . 92 . 2 2 . 0 4 . 5 3 . 9 R . 8 7 . 2 2 1 . 0 3 8 . 4 2 2 . 3 7 . 4 1 1 . 5 3 . 4
. 3 . 2 . 5 . 4 1 . 0 . 8 2 . 4 4 . 3 7 . 5 . 8 1 . 3 . 46 . 7 6 . 0 13 . 3 1 1 . 7 2 6 . 3 2 1 . 3 6 2 . 5 1 14 . 1 6 6 . 3 2 2 . 0 3 4 . 3 10 . 21 . 9 1 . 7 3 . 7 3 . 3 7 . 4 6 . 0 17 . 6 3 2 . 1 18 . 6 6 . 2 9 . 6 2 . 9
. 9 . 8 1 . 8 1 . 5 3 . 5 2 . 8 8 . 2 15 . 0 8 . 7 2 . 9 4 . 5 1 . 31 . 4 1 . 3 2 . 9 2 . 5 5 . 7 4 . 6 13 . 6 2 4 . 8 14 . 4 4 . 8 7 . 4 2 . 21 . 5 1 . 4 3 . 1 2 . 7 6 . 0 4 . 9 14 . 3 2 6 . 1 15 . 2 5 . 0 7 . 8 2 . 32 . 1 1 . 9 4 . 2 3 . 7 51 . 2 6 . 7 19 . 5 3 5 . 6 2 0 . 7 6 . 9 1 0 . 7 3 . 2
. 8 . 7 1 . 6 1 . 4 3 . 2 2 . 6 7 . 5 13 . 7 8 . 0 2 . 6 4 . 1 1 . 24 . 1 3 . 7 8 . 2 7 . 2 16 . 2 13 . 1 3 8 . 5 7 0 . 4 4 0 . 9 1 3 . 6 2 1 . 2 6 . 3
16 . 5 14 . 8 33 . 1 29 . 1 6 5 . 1 5 2 . 8 15 4 . 8 2 8 2 . 7 16 4 42 5 4 . 5 8 5 . 0 2 5 . 37 . 9 7 . 0 15 . 6 13 . 7 30 . 7 2 4 . 9 7 3 . 1 13 3 . 4 7 7 . 5 2 9 . 7 4 0 . 1 12 . 01 . 0 . 9 2 . 1 1 . 8 4 . 1 3 . 3 9 . 8 17 . 8 10 . 4 3 . 4 5 . 4 1 . 6

S n t h e t i c f l o w s e u e n c e No . 6TABLE A8
2 . 6 2 . 3 5 . 2 4 . 6 10 . 2 8 . 3 2 4 . 2 4 4 . 3 2 5 . 7 8 . 5 1 3 . 3 4 . 012 . 4 1 1 . 1 2 4 . 9 2 1 . 9 4 9 . 0 3 9 . 8 1 16 . 6 2 12 . 8 12 1 . 6 4 1 . 0 6 4 . 0 19 . 12 1 . 9 19 . 6 4 3 . 8 38 . 5 8 6 . 4 7 0 . 0 2 0 5 . 3 3 7 4 . 8 2 17 . 8 7 2 . 2 1 12 . 7 3 3 . 6
2 . 0 1 . 8 4 . 1 3 . 6 8 . 0 6 . 5 19 . 1 3 4 . 8 2 0 . 2 6 . 7 10 . 5 3 . 13 . 0 2 . 6 5 . 9 5 . 2 1 1 . 6 9 . 4 2 7 . 7 5 0 . 5 2 9 . 3 9 . 7 15 . 2 4 . 51 . 8 1 . 6 3 . 6 3 . 1 7 . 0 5 . 7 16 . 7 3 0 . 5 1 7 . 7 5 . 9 9 . 2 2 . 7
. 4 . 4 . 9 . 7 1 . 7 1 . 4 4 . 0 7 . 3 4 . 2 1 . 4 2 . 2 . 77 . 5 6 . 7 15 . 1 13 . 3 2 9 . 7 2 4 . 1 7 0 . 7 12 9 . 1 75 . 0 2 4 . 9 3 8 . 8 1 1 . 61 . 2 1 . 1 2 . 4 2 . 1 4 . 7 3 . 8 1 1 . 3 2 0 . 6 12 . 0 4 . 0 6 . 2 1 . 81 . 7 1 . 5 3 . 4 3 . 0 6 . 8 5 . 5 16 . 1 2 9 . 4 17 . 1 5 . 7 9 . 8 2 . 61 . 0 . 9 1 . 9 1 . 7 3 . 8 3 . 0 8 . 9 16 . 3 9 . 5 3 . 1 4 . 9 1 . 55 . 1 4 . 6 10 . 3 9 . 0 2 0 . 2 16 . 4 4 8 . 1 8 7 . 9 5 1 . 1 16 . 9 2 6 . 4 7 . 92 . 2 2 . 0 4 . 5 3 . 9 8 . 8 7 . 2 2 1 . 0 3 8 . 3 2 2 . 3 7 . 4 1 1 . 5 3 . 4
. 0 . 0 . 1 . 1 . 1 . 1 . 3 . 6 . 4 . 1 . 2 . 11 . 4 1 . 3 2 . 8 2 . 5 5 . 5 4 . 5 13 . 2 2 4 . 1 14 . 0 4 . 6 7 . 2 2 . 2
. 5 . 4 1 . 0 . 9 2 . 0 1 . 6 4 . 7 8 . 6 5 . 0 1 . 7 ? . 6 . 81 . 9 1 . 7 3 . 8 3 . 3 7 . 5 6 . 0 1 7 . 7 3 2 . 3 18 . 8 6 . 2 9 . 7 2 . 92 . 1 1 . 9 4 . 2 3 . 7 8 . 3 6 . 7 19 . 6 3 5 . 8 2 0 . 8 6 . 9 1 0 . 8 3 . 22 . 8 2 . 5 5 . 5 4 . 6 10 . 9 8 . 8 2 5 . 8 4 7 . 2 2 7 . 4 9 . 1 14 . 2 4 . ?
. 9 . 8 1 . 8 1 . 6 3 . 5 2 . 9 8 . 4 15 . 3 8 . 9 3 . 0 4 . 6 1 . 4
. 9 . 8 1 . 7 1 . 5 3 . 4 2 . 8 8 . 1 14 . 7 8 . 6 2 . 8 4 . 4 1 . 36 . 1 5 . 5 12 . 2 10 . 7 2 4 . 1 19 . 5 5 7 . 2 1 0 4 . 5 6 n . 7 2 0 . 1 3 1 . 4 9 . 4
. 4 . 4 . 9 . 8 1 . 7 1 . 4 4 . 1 7 . 5 4 . 4 1 . 4 2 . 3 . 71 . 5 1 . 4 3 . 1 2 . 7 6 . 1 4 . 9 14 . 5 2 6 . 4 15 . 3 5 . 1 7 . 9 2 . 41 . 9 1 . 7 3 . 9 3 . 4 7 . 7 6 . 2 18 . 2 3 3 . 2 19 . 3 6 . 4 1 0 . 0 3 . 0
17 . 1 15 . 3 34 . 3 3 0 . 1 6 7 . 5 5 4 . 8 16 0 . 5 2 9 3 . 1 1 7 0 . 3 5 6 . 5 8 8 . 1 2 6 . 34 . 6 4 . 2 9 . 3 8 . 2 18 . 3 14 . 8 4 3 . 5 7 9 . 4 4 6 . 1 15 . 3 2 3 . 9 7 . 1
10 . 7 9 . 6 2 1 . 4 18 . 8 4 2 . 2 3 4 . 2 10 0 . 3 18 3 . 1 10 6 . 3 35 . 3 5 5 . 0 16 . 4• 3 . 4 1 . 0 . 8 1 . 9 1 . 5 4 . 5 8 . 2 4 . 8 1 . 6 2 . 5 . 7• 4 . 3 . 8 . 7 1 . 5 1 . 2 3 . 6 6 . 6 1 . 8 1 . 3 2 . 0 . 6. 8 . 6 1 . 7 1 . 5 1 . 3 2 . 7 7 . 9 14 . 5 6 . 4 2 . 8 4 . 3 1 . 3
2 . 7 2 . 4 5 . 3 4 . 7 10 . 4 8 . 5 2 4 . 8 4 5 . 3 2 6 . 3 8 . 7 1 3 . 6 4 . 14 . 4 3 . 9 8 . 7 7 . 7 17 . 2 14 . 0 4 1 . 0 7 4 . 8 4 1 . 4 14 . 4 2 2 . 5 6 . 71 . 1 1 . 0 2 . 2 1 . 9 4 . 4 3 . 5 10 . 4 19 . 0 1 1 . 0 3 . 7 5 . 7 1 . 7
. 2 . 2 . 4 . 4 . 8 . 7 1 . 9 3 . 5 2 . 0 . 7 1 . 1 . 31 . 9 1 . 7 3 . 9 3 . 4 7 . 7 6 . 2 18 . 3 3 3 . 3 19 . 4 6 . 4 1 0 . 0 3 . 02 . 1 1 . 9 4 . 2 3 . 7 8 . 3 6 . 7 19 . 7 36 . 0 2 0 . 9 6 . 9 10 . 8 3 . 24 . 2 3 . 8 8 . 4 7 . 4 16 . 6 13 . 4 39 . 3 7 1 . 8 4 1 . 7 1 3 . 8 2 1 . 6 6 . 42 . 2 2 . 0 4 . 5 3 . 9 8 . 8 7 . 1 2 0 . 9 3 8 . 1 2 7 . 1 7 . 3 1 1 . 5 3 . 41 . 8 1 . 6 3 . 6 3 . 1 7 . 0 5 . 7 16 . 6 3 0 . 4 17 . 6 5 . 9 9 . 1 2 . 7
. 9 . 8 1 . 8 1 . 6 3 . 5 2 . 8 8 . 3 15 . 1 8 . 8 2 . 9 4 . 6 1 . 4
. 5 . 5 1 . 1 . 9 2 . 1 1 . 7 4 . 9 9 . 0 5 . 2 1 . 7 2 . 7 . 84 . 9 4 . 4 9 . 8 8 . 6 19 . 3 15 . 6 4 5 . 8 8 3 . 7 4 8 . 6 16 . 1 2 5 . 2 7 . 52 . 8 2 . 5 5 . 6 4 . 9 1 1 . 0 8 . 9 2 6 . 0 4 7 . 5 2 7 . 6 9 . 2 14 . 3 4 . 31 . 7 1 . 5 3 . 4 3 . 0 6 . 8 5 . 5 16 . 1 2 9 . 3 17 . 0 5 . 7 9 . 8 2 . 61 . 4 1 . 3 2 . 8 2 . 5 5 . 5 4 . 5 13 . 2 2 4 . 1 14 . 0 4 . 6 7 . 2 2 . 23 . 2 2 . 8 6 . 4 5 . 6 12 . 5 1 0 . 2 2 9 . 8 5 4 . 4 3 1 . 6 10 . 5 1 6 . 4 4 . 93 . 4 3 . 0 6 . 7 5 . 9 13 . 3 10 . 8 3 1 . 6 5 7 . 7 3 3 . 5 1 1 . 1 1 7 . 3 5 . 2
. 5 . 4 1 . 0 . 8 1 . 9 1 . 5 4 . 5 8 . 1 4 . 7 1 . 6 2 . 4 . 71 . 1 . 9 2 . 1 1 . 8 4 . 1 3 . 4 9 . 8 18 . 0 10 . 4 3 . 5 5 . 4 1 . 6
118 . 0 16 . 1 36 . 1 3 1 . 7 7 1 . 1 5 7 . 6 16 9 . 0 3 0 8 . 5 1 7 9 . 2 5 9 . 5 9 2 . 8 2 7 . 62 . 7 2 . 4 5 . 4 4 . 8 10 . 7 8 . 7 2 5 . 4 4 6 . 3 2 6 . 9 8 . 9 1 3 . 9 4 . 22 . 9 2 . 6 5 . 8 5 . 1 1 1 . 3 9 . 2 2 7 . 0 4 9 . 2 2 8 . 6 9 . 5 14 . 8 4 . 46 . 6 5 . 9 13 . 1 1 1 . 5 2 5 . 8 2 0 . 9 6 1 . 4 1 12 . 9 6 5 . 1 2 1 . 6 3 1 . 7 10 . 0
. 9 . 8 1 . 7 1 . 5 1 . 4 2 . 8 8 . 1 1 4 . 8 8 . 6 2 . 8 4 . 4 1 . 3

•
•
•
•
•
•
••
TABLE A8 ( c o n t i n u e d )

S n t h e t i c f l o w s e u e n c e No . 7
TABLE A9
4 . 3 3 . 8 8 . 5 7 . 5 16 . 8 13 . 6 3 9 . 9 7 2 . 8 4 2 . 3 14 . 0 2 1 . 9 6 . 54 7 . 2 4 2 . 2 9 4 . 4 8 3 . 0 18 6 . 1 15 0 . 9 4 4 2 . 2 8 0 7 . 4 4 69 . 1 15 9 . 6 2 4 2 . 8 7 2 . 43 9 . 1 3 4 . 9 7 8 . 2 6 8 . 7 15 4 . 1 12 4 . 9 3 6 6 . 2 6 6 8 . 5 38 8 . 4 12 8 . 8 2 0 1 . 0 5 9 . 9
8 . 1 7 . 3 16 . 3 14 . 3 3 2 . 0 2 6 . 0 7 6 . 2 1 39 . 0 8 0 . 8 2 6 . 8 4 1 . 8 12 . 52 . 4 2 . 2 4 . 8 4 . 3 9 . 5 7 . 7 2 2 . 7 4 1 . 4 24 . 0 8 . 0 12 . 4 3 . 72 . 3 2 . 1 4 . 6 4 . 0 9 . 1 7 . 3 2 1 . 5 3 9 . 3 2 7 . 8 7 . 6 1 1 . 8 3 . 5
. 7 . 6 1 . 3 1 . 2 2 . 7 2 . 2 6 . 3 1 1 . 5 6 . 7 2 . 2 3 . 5 1 . 01 . 7 1 . 5 3 . 3 2 . 9 6 . 5 5 . 3 15 . 5 2 8 . 3 16 . 5 5 . 5 8 . 9 2 . 51 . 0 . 9 2 . 1 1 . R 4 . 1 3 . 3 9 . 7 1 7 . 7 10 . 3 3 . 4 5 . 3 1 . 62 . 0 1 . 8 4 . 1 3 . 6 8 . 0 6 . 5 19 . 1 3 4 . 9 2 0 . 2 6 . 7 10 . 5 3 . 1
. 6 . 6 1 . 2 1 . 1 2 . 4 2 . 0 5 . 8 1 0 . 5 6 . 1 2 . 0 3 . 2 . 92 . 3 2 . 0 4 . 6 4 . 0 9 . 0 7 . 3 2 1 . 4 3 9 . 0 22 . 7 7 . 5 1 1 . 7 3 . 52 . 4 2 . 1 4 . 8 4 . 2 9 • 4 7 . 6 2 2 . 4 4 0 . 9 2 1 . 8 7 . 9 1 2 . 3 3 . 7
. 1 . 1 . 2 . 1 . 3 . 3 . 7 1 . 4 . 8 . 3 . 4 . 1
. 8 . 7 1 . 6 1 . 4 3 . 2 2 . 6 7 . 5 13 . 8 8 . 0 2 . 7 4 . 1 1 . 2
. 6 . 5 1 . 2 1 . 0 2 . 3 1 . 9 5 . 5 10 . 0 5 . 8 1 . 9 1 . 0 . 9
. 8 . 7 1 . 7 1 . 5 3 . 3 2 . 7 7 . 8 14 . 3 8 . 3 2 . 8 4 . 3 1 . 31 . 2 1 . 1 2 . 4 2 . 2 4 . 8 3 . 9 1 1 . 5 2 0 . 9 12 . 2 4 . 0 6 . 3 1 . 92 . 6 2 . 3 5 . 2 4 . 6 10 . 2 8 . 3 2 4 . 3 4 4 . 3 25 . 7 8 . 5 13 . 3 4 . 01 . 7 1 . 5 3 . 4 3 . 0 6 . 7 5 . 4 15 . 8 2 8 . 9 16 . 8 5 . 6 8 . 7 2 . 6
. 7 . 6 1 . 4 1 . 2 2 . 7 2 . 2 6 . 5 1 1 . 9 6 . 9 2 . 3 3 . 6 1 . 14 . 0 3 . 5 7 . 9 7 . 0 15 . 6 12 . 7 3 7 . 2 6 7 . 9 39 . 4 13 . 1 2 0 . 4 6 . 1
. 4 . 3 . 7 . 6 1 . 4 1 . 1 3 . 3 6 . 1 1 . 5 1 . 2 1 . 8 . 5
. 3 . 2 . 5 . 5 1 . 0 . 8 2 . 5 4 . 5 7 . 6 . 9 1 . 4 . 4
. 7 . 6 1 . 4 1 . 2 2 . 8 2 . 3 6 . 6 12 . 1 7 . 0 2 . 3 3 . 6 1 . 16 . 1 5 . 4 12 . 2 1 0 . 7 2 4 . 0 19 . 4 5 7 . 0 1 0 4 . 0 6 0 . 4 2 0 . 1 3 1 . 3 9 . 33 . 1 2 . 7 6 . 1 5 . 4 17 . 1 9 . 8 2 8 . 7 5 2 . 5 3 0 . 5 10 . 1 15 . 8 4 . 73 . 0 2 . 7 6 . 0 5 . 2 1 1 . 8 9 . 5 2 7 . 9 5 1 . 0 29 . 6 9 . 8 15 . 3 4 . 6
. 3 . 2 . 5 . 5 1 . 1 . 9 2 . 5 4 . 6 2 . 7 . 9 1 . 4 . 4
. 4 . 4 . 9 . 7 1 . 7 1 . 4 4 . 0 7 . 3 4 . 2 1 . 4 2 . 2 . 7
. 9 . 8 1 . 7 1 . 5 3 . 4 2 . 7 8 . 0 14 . 6 A. 5 2 . 8 4 . 4 1 . 32 . 8 2 . 5 5 . 5 4 . 8 10 . 9 8 . 8 2 5 . 8 4 7 . 1 2 7 . 4 9 . 1 14 . 2 4 . 26 . 2 5 . 5 1 2 . 3 1 0 . 8 2 4 . 3 19 . 7 5 7 . 7 1 05 . 3 6 1 . 2 2 0 . 3 3 1 . 7 9 . 42 . 6 2 . 3 5 . 2 4 . 6 10 . 2 8 . 3 2 4 . 3 4 4 . 4 25 . 8 8 . 6 1 3 . 4 4 . 01 . 1 1 . 0 2 . 2 1 . 9 4 . 3 3 . 4 10 . 1 18 . 5 10 . 7 3 . 6 5 . 5 1 . 71 . 5 1 . 4 3 . 1 2 . 7 6 . 1 4 . 9 14 . 5 2 6 . 5 15 . 4 5 . 1 8 . 0 2 . 42 . 9 2 . 6 5 . 7 5 . 0 1 1 . 3 9 . 2 2 6 . 9 4 9 . 1 2 8 . 5 9 . 5 14 . 8 4 . 4
1 . 6 1 . 4 3 . 1 2 . 7 6 . 1 5 . 0 14 . 6 2 6 . 6 15 . 5 5 . 1 8 . 0 2 . 4. 7 . 6 1 . 5 1 . 3 2 . 9 2 . 3 6 . 8 1 2 . 4 7 . 2 2 . 4 3 . 7 1 . 1
1 . 0 . 8 1 . 9 1 . 7 3 . 7 3 . 0 8 . 9 16 . 3 9 . 4 3 . 1 4 . 9 1 . 52 . 0 1 . 8 4 . 0 3 . 6 8 . 0 6 . 5 19 . 0 3 4 . 6 2 0 . 1 6 . 7 10 . 4 3 . 12 . 1 1 . 9 4 . 2 3 . 7 8 . 3 6 . 7 19 . 7 3 6 . 0 2 0 . 9 6 . 9 1 0 . 8 3 . 22 . 4 2 . 1 4 . 8 4 . 2 9 . 4 7 . 6 2 2 . 3 4 0 . 6 2 3 . 6 7 . 8 12 . 2 3 . 61 . 4 1 . 3 2 . 8 2 . 5 5 . 6 4 . 5 13 . 2 2 4 . 2 14 . 0 4 . 7 7 . 3 2 . 21 . 3 1 . 2 2 . 6 2 . 3 5 . 2 4 . 2 12 . 3 2 2 . 5 13 . 1 4 . 3 6 . 8 2 . 0
. 6 . 6 1 . 3 1 . 1 2 . 5 2 . 1 6 . 0 1 1 . 0 6 . 4 2 . 1 3 . 3 1 . 05 . 0 4 . 5 1 0 . 0 8 . 8 19 . 7 16 . 0 4 6 . 9 8 5 . 5 4 9 . 7 16 . 5 2 5 . 7 7 . 72 . 0 1 . 8 4 . 0 3 . 5 7 . 8 6 . 4 18 . 6 3 4 . 0 19 . 8 6 . 6 1 0 . 2 3 . 0
. 4 . 4 . 9 . 8 1 . 7 1 . 4 4 . 1 7 . 4 4 . 3 1 . 4 2 . 2 . 71 . 6 1 . 4 3 . 2 2 . 8 6 . 3 5 . 1 14 . 9 2 7 . 2 15 . 8 5 . 2 8 . 2 2 . 47 . 4 6 . 7 14 . 9 13 . 1 2 9 . 4 2 3 . 8 6 9 . 8 12 7 . 4 74 . 0 2 4 . 6 3 8 . 3 1 1 . 43 . 0 2 . 7 6 . 0 5 . 2 1 1 . 7 9 . 5 2 7 . 9 5 0 . 9 29 . 6 9 . 8 15 . 3 4 . 61 . 1 1 . 0 2 . 3 2 . 0 4 . 5 3 . 7 1 0 . 7 19 . 6 11 . 4 3 . 8 5 . 9 1 . 82 . 7 2 . 4 5 . 4 4 . 7 10 . 6 8 . 6 2 9 . 1 4 5 . 9 2 6 . 6 A. 8 1 3 . 8 4 . 12 . 2 2 . 0 4 . 4 3 . 9 8 . 8 7 . 1 2 0 . 8 3 8 . 0 2 2 . 1 7 . 3 1 1 . 4 3 . 4

•
•
•
•
•
•
••
t o
•
••• TABLE A9 ( c on t i n ue d )

S n t he t i c f l o w s e u e n c e No . 8
TABLE Al 0
5 . 1 4 . 5 10 . 2 8 . 9 2 0 . 0 16 . 2 4 7 . 5 8 6 . 8 5 0 . 4 16 . 7 2 6 . 1 7 . 816 . 5 14 . 7 3 3 . 0 2 9 . 0 6 9 . 0 5 2 . 7 15 4 . 5 2 8 2 . 0 16 3 . 0 5 4 . 4 8 4 . 8 2 5 . 32 4 . 7 2 2 . 0 4 9 . 3 4 3 . 3 9 7 . 2 78 . 8 2 3 1 . 0 4 2 1 . 7 2 4 5 . 0 8 1 . 3 12 6 . 8 3 7 . 8
4 . 5 4 . 0 9 . 1 8 . 0 17 . 8 14 . 5 4 2 . 4 7 7 . 5 4 5 . 0 14 . 9 2 3 . 3 6 . 91 . 0 . 9 2 . 1 1 . 8 4 . 1 3 . 3 9 . 7 1 7 . 7 10 . 3 3 . 4 5 . 3 1 . 6
. 9 . 8 1 . 8 1 . 6 3 . 6 3 . 0 8 . 7 15 . 8 9 . 2 3 . 0 4 , 8 1 . 4
. 2 . 2 . 3 . 7 . 6 1 . 7 3 . 0 1 . 11 . 6 . 9 . 32 . 3 2 . 1 4 . 7 4 . 1 9 . 2 7 . 5 2 1 . 9 4 0 . 0 2 3 . 3 7 . 7 12 . 0 3 . 61 . 0 . 9 1 . 9 1 . 7 3 . 8 3 . 0 8 . 9 16 . 3 9 . 5 3 . 1 4 . 9 1 . 51 . 2 1 . 1 2 . 4 2 . 1 4 . 7 3 . 8 1 1 . 1 2 0 . 3 1 1 . 8 1 . 9 6 . 1 1 . 8
. 5 . 4 . 9 . 8 1 . 9 1 . 5 4 . 4 8 . 0 4 . 7 1 . 5 2 . 4 . 74 . 5 4 . 0 8 . 9 7 . 8 17 . 6 14 . 3 4 1 . 8 7 6 . 3 4 4 . 3 14 . 7 2 2 . 9 6 . 8
1 0 . 5 9 . 3 2 0 . 9 18 . 4 4 1 . 2 3 3 . 4 9 7 . 9 1 78 . 8 10 3 . 9 34 . 5 5 3 . 8 1 6 . 0. 0 . o . 1 . 1 . 2 . 1 . 4 . 8 . 4 . 1 . 2 . 1. 3 . 3 . 6 .5 1 . 1 . 9 2 . 6 4 . 8 2 . 8 . 9 1 . 4 . 4
1 . 2 1 . 0 2 . 3 2 . 1 4 . 6 3 . 7 1 1 . 0 2 0 . 1 1 1 . 7 1 . 9 6 . 0 1 . 81 . 0 . 9 1 . 9 1 . 7 3 . 8 3 . 1 8 . 9 16 . 3 9 . 5 3 . 1 4 . 9 1 . 51 . 3 1 . 2 2 . 6 2 . 3 5 . 1 4 . 2 12 . 2 2 2 . 3 12 . 9 4 . 3 6 . 7 2 . 04 . 9 4 . 4 9 . 8 8 . 6 19 . 2 15 . 6 4 5 . 7 8 3 . 4 4 A . 9 1 6 . 1 2 5 . 1 7 . 51 . 0 . 9 2 . 1 1 . 8 4 . 1 3 . 3 9 . 7 1 7 . 6 10 . 3 3 . 4 5 . 3 1 . 6
. 7 . 7 1 . 5 1 . 3 2 . 9 2 . 4 7 . 0 12 . 7 7 . 4 2 . 5 3 . 8 1 . 19 . 7 8 . 6 19 . 3 17 . 0 38 . 1 3 0 . 9 9 0 . 6 16 5 . 3 9 6 . 1 3 1 . 9 4 9 . 7 14 . 8
. 2 . 1 . 3 . 3 . 6 . 5 1 . 5 2 . 7 1 . 5 . 5 . 8 . 2
. 8 . 7 1 . 5 1 . 4 3 . 0 2 . 5 7 . 2 13 . 2 7 . 7 2 . 6 4 . 0 1 . 21 . 1 1 . 0 2 . 2 1 . 9 4 . 3 3 . 5 1 0 . 2 18 . 5 10 . 8 3 . 6 5 . 6 1 . 76 . 9 6 . 2 13 . 8 12 . 1 2 7 . 2 2 2 . 1 6 4 . 7 1 18 . 1 6 R. 6 2 2 . 8 3 5 . 5 10 . 61 . 6 1 . 4 3 . 2 2 . 8 6 . 3 5 . 1 14 . 9 2 7 . 3 15 . 9 5 . 3 8 . 2 2 . 43 . 1 2 . 8 6 . 2 5 . 5 12 . 2 9 . 9 2 9 . 1 5 3 . 1 3 0 . 9 1 0 . 2 1 6 . 9 4 . 8
. 8 1 . 7 1 . 5 3 . 3 2 . 7 7 . 9 14 . 4 R. 4 2 . 8 4 . 3 1 . 3. 3 . 3 . 7 . 6 1 . 3 1 . 1 3 . 1 5 . 6 1 . 3 1 . 1 1 . 7 . 5
1 . 6 1 . 4 3 . 1 2 . 7 A. 1 5 . 0 14 . 6 2 6 . 6 15 . 5 5 . 1 8 . 0 2 . 41 . 7 1 . 6 3 . 5 3 . 1 6 . 9 5 . 6 16 . 3 2 9 . 8 17 . 3 5 . 7 9 . 0 2 . 76 . 4 5 . 7 12 . 7 1 1 . 2 2 5 . 1 2 0 . 4 5 9 . 7 10 8 . 9 6 3 . 3 2 1 . 0 3 2 . 8 9 . 83 . 4 3 . 1 6 . 9 6 . 1 1 1 . 6 1 1 . 0 32 . 3 5 9 . 0 34 . 3 1 1 . 4 1 7 . 7 5 . 3
. 6 . 5 1 . 2 1 . 0 2 . 3 1 . 8 5 . 4 9 . 9 5 . 7 1 . 9 3 . 0 . 94 . 6 4 . 1 9 . 1 8 . 0 18 . 0 14 . 6 4 2 . 7 7 7 . 9 4 9 . 3 15 . 0 2 3 . 4 7 . 07 . 3 6 . 5 14 . 6 12 . 8 2 11 . 7 2 3 . 3 6 8 . 3 12 4 . 7 72 . 4 2 4 . 0 3 7 . 9 1 1 . 21 . 9 1 . 7 3 . 9 3 . 4 7 . 6 6 . 2 18 . 1 3 3 . 0 19 . 2 6 . 4 9 . 9 3 . 01 . 0 . 9 2 . 0 1 . 8 4 . 0 3 . 2 9 . 4 17 . 2 10 . 0 3 . 3 5 . 2 1 . 5
. 8 . 7 1 . 6 1 . 4 3 . 1 2 . 5 7 . 5 13 . 6 7 . 9 2 . 6 4 . 1 1 . 23 . 6 3 . 2 7 . 1 6 . 2 14 . 0 1 1 . 3 3 3 . 3 6 0 . 7 3 9 . 3 1 1 . 7 18 . 3 5 . 41 . 1 1 . 0 2 . 2 1 . 9 4 . 3 3 . 5 10 . 3 1 8 . 8 1 0 . 9 3 . 6 5 . 7 1 . 71 . 5 1 . 4 3 . 0 2 . 7 6 . 0 4 . 8 14 . 2 2 5 . 9 15 . 1 9 . 0 7 . 8 2 . 32 . 8 2 . 5 5 . 5 4 . 8 10 . 9 8 . 8 2 5 . 8 4 7 . 1 2 7 . 4 9 . 1 14 . 2 4 . 2
. 5 . 4 1 . 0 . 8 1 . 9 1 . 5 4 . 5 8 . 1 4 . 7 1 . 6 2 . 4 . 71 . 3 1 . 1 2 . 5 2 . 2 5 . 0 4 . 0 1 1 . 8 2 1 . 6 12 . 6 4 . 2 6 . 5 1 . 94 . 1 3 . 6 8 . 2 7 . 2 16 . 1 13 . 0 38 . 2 6 9 . 8 4 0 . 5 1 1 . 4 2 1 . 0 6 . 32 . 2 2 . 0 4 . 5 4 . 0 8 . 9 7 . 2 2 1 . 1 3 8 . 5 2 2 . 3 7 . 4 1 1 . 6 3 . 4
. 8 . 7 1 . 7 1 . 5 3 . 3 2 . 7 7 . 8 14 . 2 8 . 3 2 . 7 4 . 3 1 . 32 . 7 2 . 4 ' 5 . 4 4 . 8 10 . 7 8 . 7 2 5 . 4 4 6 . 4 2 6 . 9 8 . 9 1 3 . 9 4 . 26 . 5 5 . 8 1 3 . 1 1 1 . 5 2 5 . 8 2 0 . 9 6 1 . 3 1 1 1 . 8 6 9 . 0 2 1 . 6 3 3 . 6 10 . 02 . 1 1 . 9 4 . 1 3 . 6 8 . 2 6 . 6 19 . 4 3 5 . 4 2 0 . 6 6 . 8 1 9 . 6 3 . 2
. 8 . 7 1 . 6 1 . 4 3 . 2 2 . 6 7 . 5 13 . 8 8 . 0 2 . 7 4 . 1 1 . 23 . 9 3 . 5 7 . 8 6 . 9 15 . 4 12 . 5 36 . 6 6 6 . 8 3 8 . 8 12 . 9 2 0 . 1 6 . 0
. 5 . 5 1 . 0 . 9 2 . 0 1 . 7 4 . 9 8 . 9 5 . 2 1 . 7 2 . 7 . 8

0

$ n t he t i c f l ow se uence No . 9TABLE Al l
3 . 0 2 . 7 6 . 0 5 . 2 11 . 7 9 . 5 2 7 . 9 5 0 . 9 29 . 6 9 . 8 15 . 3 4 . 69 . 6 8 . 6 19 . 3 16 . 9 39 . 0 3 0 . 8 9 0 . 3 16 4 . 9 9 5 . 8 3 1 . 8 4 9 • 6 14 . 8
3 0 . 7 2 7 . 4 6 1 . 4 5 4 . 0 12 1 . 0 9 8 . 1 2 9 7 . 6 5 25 . 0 3 05 . 0 10 1 . 2 15 7 . 9 4 7 . 17 . 2 6 . 5 14 . 5 12 . 7 2 8 . 5 2 3 . 1 6 7 . 7 12 3 . 6 7 1 . 8 2 3 . 8 3 7 . 2 1 1 . 11 . 7 1 . 5 3 . 3 2 . 9 6 . 6 5 . 3 15 . 6 2 8 . 5 16 . 5 5 . 5 9 . 6 2 . 53 . 1 2 . 8 6 . 2 5 . 4 12 . 2 9 . 9 2 8 . 9 5 2 . 8 3 0 . 7 10 . 2 15 . 9 4 . 7
. 6 . 5 1 . 1 1 . 0 2 . 2 1 . 8 5 . 3 9 . 7 5 . 7 1 . 9 7 . 9 . 93 . 3 3 . 0 6 . 7 5 . 9 13 . 2 10 . 7 3 1 . 3 5 7 . 2 3 3 . 2 1 1 . 0 17 . 2 5 . 11 . 3 1 . 1 2 . 5 2 . 2 5 . 0 4 . 1 1 1 . 9 2 1 . 7 12 . 6 4 . 2 6 . 5 1 . 91 . 4 1 . 2 2 . 7 2 . 4 5 . 4 4 . 4 12 . 8 2 3 . 3 13 . 6 4 . 5 7 • 0 2 . 1
. 6 . 5 1 . 2 1 . 1 2 . 4 1 . 9 5 . 6 10 . 3 6 . 0 2 . 0 3 . 1 . 93 . 0 2 . 7 6 . 0 5 . 3 11 . 9 9 . 7 2 8 . 3 5 1 . 7 30 . 0 10 . 0 15 . 6 4 . 64 . 1 3 . 6 8 . 1 7 . 2 16 . 0 13 . 0 38 . 1 6 9 . 6 4 0 . 4 1 3 . 4 2 0 . 9 6 . 2
. 1 . 1 . 1 . 1 . 3 . 2 . 7 1 . 3 . 7 . 2 . 4 . 1
. 9 . 8 1 . 7 1 . 5 3 . 4 2 . 8 8 . 1 14 . 8 8 . 6 2 . 8 4 . 4 1 . 31 . 3 1 . 2 2 . 6 2 . 3 5 0 1 4 . 1 12 . 1 2 2 . 1 12 . 9 4 . 3 6 . 7 2 . 01 . 0 . 9 2 . 1 1 . 8 4 . 1 3 . 3 9 . 7 17 . 6 10 . 3 3 . 4 5 . 3 1 . 61 . 4 1 . 3 2 . 8 2 . 5 5 . 5 4 . 5 13 . 1 2 3 . 9 13 . 9 4 . 6 7. 2 2 . 12 . 9 2 . 5 5 . 6 4 . 9 1 1 . 1 9 . 0 2 6 . 4 4 8 . 1 28 . 0 9 . 3 14 . 5 4 . 31 . 5 1 . 3 3 . 0 2 . 6 5 . 9 4 . 8 14 . 0 2 5 . 5 14 . 8 4 . 9 7 . 7 2 . 31 . 5 1 . 4 3 . 1 2 . 7 6 . 1 4 . 9 14 . 4 2 6 . 3 15 . 3 5 . 1 7 • 9 2 . 44 . 3 3 . 9 8 . 7 7 . 6 17 . 1 13 . 8 4 0 . 5 74 . 0 4 3 . 0 14 . 3 2 7 . 3 6 . 6
. 2 . 2 . 4 . 8 . 7 2 . 0 3 . 7 7 . 1 . 7 1 . 1 . 31 . 2 1 . 1 2 . 4 2 . 1 4 . 8 3 . 9 1 1 . 4 2 0 . 8 17 . 1 4 . 0 6 . 7 1 . 9
. 7 . 6 1 . 4 1 . 2 2 . 8 2 . 2 6 . 5 11 . 9 6 . 9 2 . 3 3 . 6 1 . 113 . 7 12 . 3 2 7 . 5 24 . 2 5 4 . 2 4 3 . 9 12 8 . 7 2 35 . 0 1 36 . 5 4 5 . 3 7 0 . 7 2 1 . 1
4 . 8 4 . 3 9 . 6 8 . 4 19 . 9 15 . 3 45 . 0 8 2 . 1 4 7 . 7 15 . 8 24 . 7 7 . 42 . 9 2 . 6 5 . 8 5 . 1 11 . 4 9 . 2 2 7 . 0 4 9 . 4 29 . 7 9 . 5 14 . 8 4 . 4
. 2 . 2 . 4 . 4 . 9 . 7 2 . 0 3 . 7 7 . 1 . 7 1 . 1 . 31 . 4 1 . 3 2 . 8 2 . 5 5 . 5 4 . 5 11 . 1 2 4 . 0 13 . 9 4 . 6 7 . 2 2 . 11 . 6 1 . 5 3 . 2 2 . 9 6 . 4 5 . 2 15 . 2 2 7 . 8 16 . 1 5 . 4 4 . 3 2 . 5. 8 . 7 1 . 6 1 . 4 3 . 2 2 . 6 7 . 6 13 . 8 8 . 0 2 . 7 4 . 2 1 . 2
5 . 8 5 . 2 1 1 . 6 10 . 2 2 2 . 9 18 . 6 5 4 . 5 9 9 . 4 5 7 . 8 19 . 2 29 . 9 8 . 91 . 8 1 . 6 3 . 6 3 . 1 7 . 1 5 . 7 16 . 8 3 0 . 6 17 . 8 5 . 9 9 . 2 2 . 7
. 3 . 3 . 7 . 6 1 . 3 1 . 1 3 . 1 5 . 7 3 . 3 1 . 1 1 . 7 . 54 . 4 4 . 0 8 . 9 7 . 8 17 . 5 14 . 2 4 1. 5 75 . 7 4 4 . 0 1 4 . 6 22 . 8 6 . 83 . 1 2 . 8 6 . 2 5 . 5 12 . 3 10 . 0 29 . 2 5 3 . 4 3 1 . 0 10 . 3 16 . 1 4 . 83 . 4 3 . 1 6 . 9 6 . 0 13 . 5 1 1 . 0 3 2 . 2 5 8 . 7 34 . 1 1 1 . 3 17 . 7 5 . 31 . 2 1 . 1 2 . 4 2 . 1 4 . 6 3 . 8 1 1 . 0 2 0 . 1 1 1 . 7 3 . 9 6 . 0 1 . 8
. 9 . 8 1 . 9 1 . 6 3 . 7 3 . 0 8 . 7 15 . 8 9 . 2 3 . 1 4 . 8 1 . 41 . 6 1 . 4 3 . 1 2 . 7 6 . 2 5 . 0 14 . 6 26 . 7 15 . 5 5 . 1 9 . 0 2 . 42 . 1 1 . 9 4 . 2 3 . 7 9 . 3 6 . 8 19 . 8 36 . 2 2 1 . 0 7 . 0 10 . 9 3 . 23 . 7 3 . 3 7 . 4 6 . 5 14 . 6 1 1 . 8 34 . 7 6 3 . 3 36 . 8 12 . 2 19 . 0 5 . 72 . 0 1 . 8 4 . 0 3 . 5 7 . 9 6 . 4 18 . 7 34 . 2 19 . 9 6 . 6 10 . 3 3 . 12 . 1 1 . 8 4 . 1 3 . 6 8 . 1 6 . 6 19 . 3 35 . 2 2 0 . 5 6 . 8 10 . 6 3 . 2
. 8 . 7 1 . 6 1 . 4 3 . 1 2 . 5 7 . 4 13 . 6 7 . 9 2 . 6 4 . 1 1 . 23 . 1 2 . 8 6 . 2 5 . 4 12 . 2 9 . 9 29 . 0 5 2 . 9 3 0 . 7 1 0 . 2 15 . 9 4 . 7
I 1 . 9 1 . 7 3 . 8 3 . 3 7 . 5 6 . 1 17 . 8 32 . 5 18 . 9 6 . 3 9 . 91 2 . 9. 9 . 8 1 . 8 1 . 6 3 . 6 2 . 9 8 . 4 15 . 4 0 . 0 3 . 0 4 . 6 1 . 4
2 . 9 2 . 6 5 . 8 5 . 1 11 . 4 9 . 2 2 7 . 1 4 9 . 4 28 . 7 9 . 5 14 . 9 4 . 410 . 8 9 . 6 2 1 . 6 19 . 0 4 2 . 5 34 . 5 10 1. 1 18 4 . 6 107 . 2 3 5 . 6 5 5 . 5 16 . 5
3 . 8 3 . 4 7 . 7 6 . 8 15 . 1 12 . 3 36 . 0 6 5 . 7 39 . 2 12 . 7 19 . 8 5 . 94 . 8 4 . 3 9 . 6 8 . 4 19 . 9 15 . 3 4 5 . 0 8 2 . 1 4 7 . 7 15 . 8 24 . 7 7 . 42 . 3 2 . 0 4 . 5 4 . 0 8 . 9 7 . 2 2 1 . 1 38 . 6 22 . 4 7 . 4 11 . 6 3 . 51 . 7 1 . 6 3 . 5 3 . 1 6 . 9 5 . 6 16 . 4 29 . 9 17 . 4 5 . 8 9 . 0 2 . 7

TABLE Al l ( c o n t i n u e d )
2 . 5 2 . 2 4 . 9 4 . 3 9 . 7 7 . 9 2 3 . 2 4 2 . 3 2 4 . 6 8 . 2 1 2 . 7 3 . 87 . 5 6 . 7 15 . 0 1 3 . 1 2 9 . 5 2 3 . 9 7 0 . 0 12 7 . 8 7 4 . 3 2 4 . 6 3 8 . 4 1 1 . 54 . 2 3 . 7 8 . 3 7 . 3 16 . 4 1 3 . 3 3 9 . 0 7 1 . 3 4 1 . 4 1 3 . 7 2 1 . 4 6 . 44 . 0 3 . 5 7 . 9 6 . 9 15 . 6 1 2 . 6 3 7 . 0 6 7 . 6 3 9 . 3 13 . 0 2 0 . 3 6 . 14 . 8 4 . 3 9 . 7 8 . 5 19 . 0 1 5 . 4 4 5 . 2 8 2 . 6 4 A. 0 15 . 9 2 4 . 8 7 . 4
. 7 . 6 1 . 4 1 . 2 2 . 8 2 . 3 6 . 6 1 2 . 1 7 . 0 2 . 3 3 . 6 1 . 12 . 7 2 . 4 5 . 4 4 . 7 1 0 . 6 8 . 6 2 5 . 1 4 5 . 8 2 6 . 6 8 . 8 1 3 . 8 4 . 13 . 1 2 . 8 6 . 2 5 . 4 1 2 . 2 9 . 9 2 9 . 0 5 2 . 9 3 0 . 8 1 0 . 2 15 . 9 4 . 72 . 7 2 . 4 5 . 4 4 . 7 1 0 . 6 8 . 6 2 5 . 2 4 6 . 0 2 6 . 7 8 . 9 1 3 . 8 4 . 1
. 6 . 6 1 . 3 1 . 1 2 . 5 2 . 0 5 . 9 1 0 . 8 6 . 3 2 . 1 3 . 2 1 . 02 . 5 2 . 2 4 . 9 4 , 3 9 . 7 7 . 8 2 3 . 0 4 2 . 0 2 4 . 4 8 . 1 1 2 . 6 3 . 112 . 7 2 . 4 5 . 4 4 , 8 1 0 . 7 8 . 7 2 5 . 4 4 6 . 4 2 6 . 9 8 . 9 1 3 . 9 4 . 21 . 5 1 . 3 2 . 9 2 . 6 5 . 7 4 . 6 1 3 . 6 2 4 . 9 14 . 4 4 . 8 7 . 5 2 . 2
. 6 . 5 1 . 1 1 . 0 2 . 2 1 . 8 5 . 2 9 . 5 5 . 5 1 . 8 2 . 9 . 91 . 0 . 9 2 . 0 1 . 8 4 . 0 3 . 2 9 . 4 1 7 . 2 1 0 . 0 3 . 3 5 . 2 1 . 52 . 6 2 . 3 5 . 2 4 . 6 1 0 . 3 8 . 4 2 4 . 5 4 4 . 8 2 6 . 0 8 . 6 1 3 . 5 4 . 0
. 4 . 3 . 7 . 6 1 . 4 1 . 2 3 . 4 6 . 2 3 . 6 1 . 2 1 . 9 . 64 . 6 4 . 1 9 . 3 8 . 1 18 . 1 1 4 . 8 4 3 . 4 7 9 . 2 4 6 . 0 15 . 3 2 1 . 8 7 . 14 . 7 4 . 2 9 . 3 8 . 2 18 . 4 14 . 9 4 3 . 7 7 9 . 8 4 6 . 4 15 . 4 2 4 . 0 7 . 22 . 1 1 . 8 4 . 1 3 . 6 8 . 1 6 . 6 19 . 2 3 5 . 1 2 0 . 4 6 . 8 1 0 . 6 1 . 1
. 8 . 7 1 . 6 1 . 4 1 . 1 2 . 5 7 . 3 1 3 . 3 7 . 7 7 . 6 4 . 0 1 . 2


