139
GREATER TZANEEN MUNICIPALITY 2008/09 ANNUAL REPORT Annual report on service delivery progress and challenges for the 2008/09 financial year.

GREATER TZANEEN
MUNICIPALITY
2008/09
ANNUAL REPORT Annual report on service delivery progress and challenges for the 2008/09 financial year.

1
TABLE OF CONTENTS
Mayors Foreword 3
List of Abbreviations 6
List of Tables 9
List of Figures 11
1. Overview of the Municipality 12
2. Performance Highlights per Department 14
2.1 Community Services 2.2 Corporate Services 2.3 Chief Financial Officer 2.4 Electrical Engineering 2.5 Engineering Services 2.6 Municipal Manager 2.7 Planning and Economic Development 2.8 Municipal Managers Comments on overall performance
3. Human Resource and Organisational Management 86
4. Audited statements and Finance Related Information 99
5. Functional Area Service Delivery Reporting 106
5.1 General Information 5.2 Executive and Council 5.3 Finance and Administration 5.4 Human Resources 5.5 Procurement 5.6 Planning and Development 5.7 Community and Social Services 5.8 Housing 5.9 Traffic 5.10 Licensing 5.11 Solid Waste 5.12 Waste Water management 5.13 Road Transport 5.14 Water 5.15 Electricity Distribution 5.16 Streetlights

2
6. Conclusion 138

3
Mayors Foreword
I am privileged to be presenting to you the 2008/09 annual report which seek to unfold how
Council worked in realizing and achieving its mandate of delivering quality service to its people.
We are the Greater Tzaneen Municipality which has been mandated by our democratic
government of the Republic of South Africa to deliver service to our people in all the wards.
Our vision remains to be the fasters growing economy in our province Limpopo, which ensures
access to sustainable basic service to every household.
We are very clear of what the people need and over the past, including the 2008/09 financial year
we have tried all our best to deliver quality basic service to our people. It basically a known fact
that the priorities of our people remain clean water, sanitation, Electricity, Roads and Houses. As
Greater Tzaneen Municipality we have accelerated the pace to ensure that the situation of water
shortage in our community is quickly resolved. We were doing this in partnership with Mopani
District Municipality who is currently the water service Authority. We as well have successfully
deployed many water tanks to ensure that where shortage persists, it is quality attended to, and
that has been successfully done.
Electricity
The 2008/09 financial year had a backlog of electricity being reduced to a satisfactory level
where five of our villages (Mugwazeni, Mulati –Berlyn , Ntsako, Mafarana and Lefera) were
Electrified at once with the fund which were received from the then Department of minerals and
Energy (DME) which is currently known as the Department of Energy. The efforts which the
Municipality had taken were as a result of the fact that we as Greater Tzaneen Municipality

4
always try hard to ensure that our communities received services at the time they should be
received. We are trying our utmost best to ensure that we lobby more funds to reduce the
electricity shortage that we have.
Roads
We are very pleased with the progress made in keeping our internal streets usable and up to
standard. The grader which are deployed to our four cluster are reported to be keeping our road
in good conditions we are doing well with funeral roads as well. The maintenance and the
repairs of our access roads in our villages as well, declare the commitment that we are really
keeping our infrastructure in good conditions. We as well have good plans to ensure that many
access roads are constructed to enable our people to have easy access to place of interest and of
common use.
Houses
We are proud to account to our people that the government has delivered well in terms of
providing shelter to our people by unblocking many of those blocked houses which were
frustrating to our communities. The programme of reconstructing these blocked structures has
been clearly tabled. The MEC of the Department of Local Government and Housing has outlined
a clear approach to ensure that the programmed is implemented very quickly. The house at Dan
Extension 2 has been of great relief to many of our people who need shelter.
We remain focused to the objectives mandated to us as Local Government and we will continue
to implement them. We have as well showed our commitment to fight poverty as have together
worked with the Department of health and Welfare in ensuring that people received food parcels
as due to them. Our councilors and wards committee has assisted in ensuring that these food
packs are received by people who qualify against all odds.

5
Our plan for the coming financial year will cover many of the backlogs of services which are still
needed by our community. Which pose challenges to the lives of the people in our residents to
understand that the government is delivering and it shall continue to deliver?
Thank you
Alderman OJ Mushwana
Mayor

6
LIST OF ABBREVIATIONS
AMEU Association of Municipal Electricity Undertakings
ARV Anti Retro Viral
CBD Central Business District
CBO Community Based Organization
CBP Community Based Planning
CPA Community Property Association
DBSA Development Bank of Southern Africa
DGCF District Communicators Forum
DLTC Drivers License Testing Centre
DME Department of Minerals and Energy
DoC Drop off Centre
DWAF Department of Water Affairs and Forestry
EU European Union
GCF Government Communicators Forum
GTM Greater Tzaneen Municipality
HCW Health Care Waste
HR Human Resource
ICT Information Communication Technology
IDP Integrated Development Plan
IGR Inter Governmental Relations
IMASA Institution of Municipal Administration for Southern Africa
IMATU Independent Municipal Association of Trade Unions
IMPSA Institute for Municipal Practitioners for South Africa
JAQ Job Analysis Questionnaires
JOC Joint Operational Centre

7
LAN Local Area Network
LDV Light Delivery Vehicle
LED Local Economic Development
LGCF Local Government Communicators Forum
LIBSA Limpopo Business Service Agency
LISSC Local Inter-Sectoral Steering Committee
LLF Local Labour Forum
MoA Memorandum of Agreement
MPCC Multi Purpose Community Centre
MSP Municipal Service Provider
NDPG Neighborhood Development Grant
NGO Non Governmental Organization
PEIG Premier Emergency Infrastructure Grant
PHP Peoples Housing Programme
POF Public Off-loading Facility
PMS Performance Management System
REDS Regional Electricity Distributors
RDP Reconstruction and Development Plan
RSC Regional Service Council
SABC South African Broadcasting Corporation
SABS South African Bureau of Standards
SALGA South African Local Government Association
SAMWU South African Municipal Workers Union
SANS South African National Standards
SAPS South African Police Service
SCM Supply Chain Management
SDF Spatial Development Framework

8
SEDA Small Enterprise Development Agency
SONA State of the Nation Address
TSC Thusong Service Centre (same as MPCC)
TCE Total Control of Epidemic
WAN Wide Area Network
WSP Work Place Skills Plan

9
LIST OF TABLES
Table 1: RDP housing project progress
Table 2: Number of Town Planning Applications processed during 2008/09
Table 3: Staff establishment per department, 2008/09
Table 4: Service provision with regard to personnel administration during 2008/09
Table 5: Training programmes attended during 2008/09
Table 6: Councilor salaries and allowances, 2008/09
Table 7: Councilor Allowances for 2008/09 to 2009/10 (R)
Table 8: Senior official’s salaries and allowances, 2008/09
Table 9: Personnel Expenditure versus the total budget, 2001/02 to 2008/09
Table 10: GTM salary budget, 2006/07 - 2010/11
Table 11: Contributions to Pension funds and Medical Aid, 2006/07 – 2010/11 (R)
Table 12: Population group of employees, 2008/09
Table 13: Gender profile, 2008/09
Table 14: Arrears per service debtor 2007/08 & 2008/09
Table 15: Quarterly information on grants (2008/09)
Table 16: 2008/2009 MIG Budget
Table 17: 2009/2010 MIG Budget
Table 18: 2010/2011 MIG Budget
Table 19: GTM General Information
Table 20: Executive and Council
Table 21: Total Debtors outstanding, 30, 60, 90, 120 and longer days (R'000s)
Table 22: Five Largest Creditors for 2008/09
Table 23: External Loans 2008/09

10
Table 24: Arrears owed to the municipality by Officials and Councilors for 2008/09
Table 25: Administration – Human Resource
Table 26: Community and Social Services
Table 27: Planning and Development – Economic Development
Table 28: Housing
Table 29: Public safety - traffic
Table 30: Community Services - Licensing
Table 31: Solid Waste
Table 32: Waste Water Management
Table 33: Road Transport
Table 34: Water Distribution
Table 35: Electricity Distribution
Table 36: Electricity - streetlighting

11
LIST OF FIGURES
Figure 1: GTM Population Pyramid, 2006
Figure 2: % of Employees per population group, 2008/09

12
1. OVERVIEW OF THE MUNICIPALITY
1.1 Geographical location
The Greater Tzaneen Municipality is located in the Limpopo Province of South Africa. The
municipal area is approximately 3240 km², and extends from Haenertsburg in the West, to
Rubbervale in the East (85km), and just south of Modjadjiskloof in the North, to Trichardtsdal in
the South (47km). The municipal boundaries form an irregular, inverted T-Shape, which has
developmental implications for the Municipality, more specifically a huge distance to markets,
difficulties in respect of service provision, and constraints to development. The Greater Tzaneen
Municipal area encompasses the proclaimed towns of Tzaneen, Nkowankowa, Lenyenye,
Letsitele and Haenertsburg. In addition, there are 125 rural villages, concentrated mainly in the
south-east, and north-west, of the area. Almost 80% of households reside in these rural villages.
1.2 Socio-Economic Profile
Greater Tzaneen Municipality is characterised by a very youthful population with 56% of the
population being younger than 24 years of age (the population pyramid for GTM is illustrated in
Figure 1). Females outnumber males with 111 females for every 100 males, in other words 52%
of the population is female. The average annual growth rate from 1996 to 2006 was 1.2% with
an estimated population of 396,711 in 2006 (Global Insight Database). The unemployment rate
in the municipal area increased from 36.5% in 1996 to an estimated 41.4% in 2006, according to
the Global Insight data base. This coincides with a decrease in the percentage of the population
with formal employment from 43.8% to only 28.3% in 2006. The Gini- coefficient for Greater
Tzaneen Municipality increased from 0.59 in 1996 to 0.65 in 2006, meaning that inequality have
actually increased, with the gap between the rich and the poor increasing.

13
Figure 1: GTM Population Pyramid, 2006 (Source: Global Insight)
1.3 Service Delivery Priorities
The service delivery priories of the Greater Tzaneen Municipality are informed by the powers
and functions of the institution. The Integrated Development Plan (IDP) is the principle guide to
all development initiatives. Through a strategic planning process the service delivery priorities
was mapped out to form a balanced strategy map to guide service delivery in achieving our
vision “To be the fastest growing economy in Limpopo where all households have access to
sustainable basic services”. The Key Performance Areas (KPAs) identified are Economic
Growth, Social, Environmental sustainability and infrastructure development as well as Good
Governance and Administration. A summary of the service delivery backlogs are included as
Annexure H.
14
2. PERFORMANCE HIGHLIGHTS PER DEPARTMENT
2.1 Community Services
The Community Services Department is responsible for ensuring environmental health,
providing library services and waste management services as well as the development and
maintenance of all cemeteries, parks and recreational facilities. The Department is also
responsible for ensuring traffic law enforcement and managing the issuing and renewal of
vehicle and driver licenses. The performance highlights per programme is as follows:
2.1.1 Environmental Health Monitoring
The aim of environmental health monitoring is to promote an environment conducive for
sustainable use of environmental resources, ensure that people live, work and recreate in a safe
and healthy environment. The division also aims to provide integrated, equitable and accessible
environmental management and health services through: industrial impact management, bio-
diversity management, environmental monitoring, environmental awareness, food control, vector
control and the implementation of an HIV/ AIDS strategy.
a) Community health
Achievements:
• HIV/AIDS internal focus awareness campaign was held.
• Red ribbon month seminar was celebrated and World AIDS day function initiated by
Mopani District Municipality was supported.
• We managed to host STI week.
• Candle light memorial service held.
• 2 Peer education working group workshops were held.
• 32 978 male and 450 female condoms were distributed respectively.

15
• 2 seminars for target groups were held.
Challenges:
Lack of support and interest on HIV/AIDS issues by the community and colleagues.
b) Environmental health
Achievements:
• All wetlands were identified, assessed, classified and prioritized for rehabilitation.
• 167 Food premises were evaluated to ensure food safety.
• Mosquito larvae control was done in all the streams within the Tzaneen area.
• 180 Samples of water and 85 milk samples were taken for analyses.
• 2 landfill audits were conducted.
• 88 Schools were evaluated and top three winning schools were awarded with prizes.
Challenges:
• There is insufficient Environmental Health Practitioners to perform the function.
2.1.2 Library Services
The aim of Library services is to ensure proficient library development, project information and
reading promotion at the Tzaneen, Haenertsburg and Letsitele libraries, to arrange and host
book-related arts and culture projects and to promote the establishment of community libraries
and library collections at schools.
a) Library Development and Reading Promotion

16
Achievements:
• 94,683 library users benefited from the information resources available in the
libraries.
• 111,215 books/magazines were circulated.
• 125 School groups were hosted.
• 1,282 Relevant books were donated to the GTM libraries via the GTM library
Committees, processed and included in the library collections.
• 619 Relevant books were donated to farm or village schools via the GTM Library
Committees.
• An article on the GTM library outreach programme ’Paired Reading’ was published
in the April – July 2008 issue of the magazine, The Free State Librarian.
Challenges:
• Communities from the Greater Tzaneen Municipality area and beyond use the
Greater Tzaneen Municipal libraries. For communities outside Tzaneen, Letsitele
and Haenertsburg transport costs are a factor. Schools are assisting learners by
bussing them in to GTM libraries to find project information.
• The high cost of establishing and operating much needed new municipal libraries is a
major challenge facing the GTM Library Services. Also hampering service delivery
is the uneven management of the National Treasury Library Grant by the Provincial
Library Services.
• The lack of sufficient libraries in the province, where learners are well assisted, leads
to an influx of learners to the GTM libraries, causing library staff and resources to be
strained.
b) Book related Arts and Culture programmes
Achievements:

17
• 4 Holiday programmes were hosted, with the emphasis on arts and crafts, using
recycled or inexpensive materials.
• 9 Book-related cultural events were hosted.
• 1,350 Learners participated in the annual creative library competition.
• An article on the GTM library events was published in the March 2009 issue of the
Library and Information Association of South Africa’s magazine, LIASA-in-touch.
Challenges:
• The Book related Arts and Culture programmes presented by the GTM Library
Services rely on the goodwill and support of the Library Committees, donor
organizations and the local business community. Their generosity is appreciated but
unpredictable.
2.1.3 Licensing and Testing
The aim of Licensing and Testing services is that all applications relating to vehicle and driver
licenses are processed.
a) Vehicle licensing
Achievements:
None
Challenges:
Shortage of manpower, shortage of office space and unhealthy working conditions at
cashiers offices (No fresh air or air conditioners).
18
b) Drivers licensing
Achievements:
Piloting the electronic booking system in Limpopo
Challenges:
Overcrowding of testing stations and driving schools than are uncontrolled
c) Temporary advertisements and dog licensing
Achievements:
None
Challenges:
The function does not get much attention and Law Enforcement officers are reluctant to assist
2.1.4 Parks and Recreational Facilities
The aim of Parks and Recreational Facilities services is to identify areas of need, plan; develop,
maintain add aesthetic value of parks and recreational facilities of the Greater Tzaneen
Municipality for its community.
a) Parks and open spaces management
Achievements:
• Securing NDPG Funds were received from NDGP for upgrading 2 community parks
and development of 1 Community Park at A, B and C Section Nkowankowa during
2009/2010 financial year. Also funds for developing Nkowankowa 2 entrances in
2009/2010 were received from NDGP.
• Bookings at facilities:

19
o Nkowankowa Stadium bookings = 90
o Julesburg and Lenyenye stadium bookings = 208
o Projector room in Nkowankowa community hall = 30
o Club house bookings = 58
o Nkowankowa community hall bookings = 238
o Lenyenye stadium bookings = 66
• 11 municipal decorations were done
• Grass cutting:
o 19,049,897 m² on sidewalk were done
o 16,419,032 m² on parks, recreational and developed parks were done
o 5,090,565 m² on open spaces were done
o 28,648,919 m² on sport facilities were done
o 7,511 m² Sidewalks:
o 25,011 m² Weed control on side walk
o 32 Termites nests treated
o 35 Dangerous trees removed or pruned
• Open spaces maintenance:
o 206400 m² of grass slashed
o 40 termite’s nests treated
o 40 dangerous trees pruned/removed
• Recreational and developed parks:
o 10 Play apparatus repaired
o 60 termite’s nests treated
20
o 60 Dangerous trees removed /pruned
Challenges:
• Handyman’s post for repairing play operators etc.
• Replacement of grass cutting machines, they are more than 9 years old.
b) Recreational facility management
Achievements:
None
Challenges:
• Funds for developing recreational facilities at GTM Rural Areas
• Funds for maintaining Tzaneen Olympic swimming pool
• GTM Facility Supervisor is needed to manage all municipal recreational facilities.
• Funds to upgrade Clubhouse
• Funds to purchase furniture for recreational facilities
c) Cemetery management
Achievements:
• 212 funerals for adults
• 43 funerals for children
• 14 funerals for paupers
• 4 funerals for Muslim
• Graves opened:
• 120 were opened at Nkowankowa
21
• 92 were opened at Lenyenye
• 3 were opened at Haenertsburg
• 63 were opened at Tzaneen
• 11 graves were opened for reburial
Challenges:
• Funds and land for Lenyenye and Mavele cemetery development
• Funds for cemeteries extension such as Nkowankowa, Mafarana, Mangweni etc.
• Funds for cemetery upgrading
d) Sport, Arts and Culture Support
Achievements:
• 19 Clubs affiliated to GTM sport and Recreation Council
• Women in sport event at Lenyenye stadium
• One indigenous game competition in each cluster and one local at Xihoko Sport Ground
• Premiers half marathon at UNICORN
• African Heritage Celebration at Tsonga Kraal on the 11-12/09/2008
• District Arts and Culture Competition at Lenyenye stadium on the 20/09/2008
• Children’s rights celebration at Nkowankowa stadium
• Clubs development launch held at Polokwane on the 11-14/ 12/08
• Election of Sport Cluster committees at Runnymede and Rhelela on the 24/01/2009
• Marula festival at Tsonga and all Municipalities in the district attended.
• School Sport festival at Malwandla Primary School and 5 schools participated on
the 14/02/2009

22
• O.R. Tambo games held on the 21/02/2009
• District Inter Hub festival was held at Sekgosese Hub and 5 municipalities
attended.
• Marathon at Vasasela High School, distance of 7-15 km
• Inter Municipal games at Greater Tzaneen Municipality on the 05/05/09 and 7
codes were played.
• Local Indigenous games AT Nkowankowa stadium on the 16/05/09 and 7 codes
were played such as Muruba Mrabaraba, Diketo, Dibeke, Intonga, Juskei and
Khokho.
• Confederation Cup viewing screen placed at Nkowankowa stadium.
• 2 Hubs are developed in Clusters by the Department of Sport Arts and Culture to
be monitored by GTM Community Services Department i.e. Rhelela and
Julesburg with hubs coordinators.
• Club development identified at Bulamahlo i.e. Makhubidung soccer Club and
Burgerdorp net ball club, Lesedi Cluster has Nkowankowa. Boxing club and
Nkowankowa rugby club and Rhelela Cluster has Rhelela ladies soccer and
Rhelela athletic club
• Greater Tzaneen Football Association has 21 Clubs registered to it from Lesedi
cluster, 18 Clubs at Bulamahlo Cluster 11Clubs at Runnymede and 07 Clubs at
Rhelela Cluster.
• Arts and Culture Competition at Lenyenye stadium and community hall and 33
activities were done
• Art and Culture talent search meeting at Polokwane

23
Challenges:
• Greater Tzaneen Municipality festival did not take place due to finance challenges
• Budget for GTM Sport Internal activities
• Funds for upgrading and developing community sport grounds
e) Heritage and Museum
Achievements:
• Marula festival took place at Tsonga Kraal on the 12-13/02/2009
Challenges:
• The programmes are not running effectively due to financial constraints
• They are running their meetings without the Secretary
• Postponement of meetings due to poor attendance of the members
• There is no constitution or Policy
2.1.5 Waste Management
The aim of Waste Management services is to create an environment which is safe and healthy to
live and work in for all people in the area of jurisdiction via a comprehensive and integrated
waste management service which is equitable, effective and sustainable.
a) Waste Minimization
Achievements
• Formal recycling system was implemented at Tzaneen C.D.B.
• 100 % operational composting plant exists adjacent to the Landfill
• Rural Waste Minimization [on-going-school programme] to be implemented at 24
schools (as illustrated bellow)

24
• 4 major Clean-ups conducted in the 4 cluster areas by Environmental-club members
(as illustrated below)
Challenges
• Gas extraction system on the landfill site to be investigated
• Rural Waste Minimization [on-going-school programme] to be implemented at 56
schools for 2010-2011
b) Waste collection and Transportation
Achievements
• 160 000 m³ non-compacted solid waste of all residential, business, industrial and
health care waste were removed 2008-2009
• A full (100%) curbside collection service is rendered to all communities in the
following suburbs of Greater Tzaneen Municipality (which represents only 15% of
all households):
o Nkowankowa
25
o Lenyenye
o Letsitele
o Haenertsburg
o Tzaneen
• Rural projects at 24 x schools which represents 14,400 households which receive a
basic service
• All streets & main roads was cleaned on a regular and periodic schedule from all
debris and solid waste [5312 m³ / annum ]
• All public taxi- & bus ranks are continuously serviced and cleaned on a pre-
determined schedule
• Health Care Waste (HWC) storeroom was erected at the Landfill
• Stand-by vehicles were provided
Challenges
• The services to be extended to include:
o All the ± 129 Villages
o 76,434 residential stands, which are situated within the jurisdiction area of
G.T.M.
• The mandate of GTM is to provide all households with a basic removal service
• Health care waste removal vehicle must be provided
• Tender for extended service delivery to be awarded
• Additional budget requirements of ± R 16,000,000-00 to extend M.S.P.`s to Rural
Areas
c) Waste disposal and treatment
Achievements:
• 1 permitted landfill-site 4 km from Tzaneen. [11 ha in size]
• Fully permitted from 1/12/2004 as a G.M.B- site
• Landfill being managed by a M S P (Waste Group Ingwe) in compliance with spec’s
from the Integrated Waste Management Plan (IWMP)

26
• Audit results vary from 91%-95% which indicate an excellent operational activity
• Managed in accordance with construction plan – cell building method.
• H.C.W. being collected & treated in terms of the Health Act manifesto
Challenges:
• Permit - investigate closure permit of landfill
• Design / construction plan and 3D model is presently being designed and
developed by Consulting Engineers
d) Pollution control
Achievements:
• 10 public toilet blocks managed by Tzaneen Solid Waste at:
o 6 blocks at Tzaneen
o 1 block at Nkowankowa
o 1 block at Letsitele
o 1 block at Haenertsburg
o 1 block at Lenyenye (Non operational)
o Blocks open for 12 hours daily
• Cleaning and disinfecting of blocks every 2.5 hours
• Provision of toilet paper to public for free
Challenges:
• Policing of illegal dumping:
o No regular policing
• Facilities management , personnel & infrastructure to be transferred to a dedicated
Division for the purpose
• Court procedures:
o Lack of municipal court/sentences
• Public toilets management

27
o 20 new toilets to be provided at the Bus-& Taxiterminus (determined by the
number of users)
2.1.6 Traffic Law Enforcement
The aim of Traffic Law Enforcement services is to regulate traffic flow at intersections accidents
scenes, scholar patrol points, in order to safeguard lives and to reduce accidents to a minimum.
Education of learners/scholars on road safety issues (those visiting our traffic centres of
Minitzani or/and Bonatsela) where learners are taught road safety skills.
a) Road safety education
Achievements:
• Road safety campaign coupled with scholar patrols rolled out to rural areas of Relela,
Gavaza/Burgersdorp, Sasekani and Nkowankowa.
• Road Safety point also at Bona Tsela Mini Traffic centre at Maake Technical
College.
Challenges:
• Shortage of personnel remains a great challenge.
b) Visible policing
Achievements:
• Officers are on a daily basis doing foot patrols thereby engaged in visible policing, in
town and all policing areas of Council.
Challenges:
• Not all policing areas are visited at the same time, all the time.

28
c) Roadblocks & Speed checks
Achievements:
• Roadblocks are manned on particular roads successfully, daily, including attending
accidents.
• Speed checks are done on accident-prone roads, most of the time.
Challenges:
• Not enough manpower to respond to all calls at all times. Sometimes reports of
traffic law violations are reported long after the person violating have long moved
on.
d) Scholar patrols
Achievements:
• Service spread to rural areas of Relela, Sakekani, Burgersdorp/Gabaza and Rita,
including Nkowankowa with the support of affected schools.
Challenges:
• Services are sometimes requested in areas where no serious challenges are reported.
e) Technical services
Achievements:
• There are two Technical members responsible for checking, installing and
maintaining road traffic signs around town and surrounding rural areas.
Challenges:
29
• The same technical staff does not have their transport for their activities. This causes
delays in implementing their efforts. In most cases they walk to all their work
stations.
f) Security and access control
Achievements:
Availability of security personnel at work stations as deployed. Register of visitors at
security check points.
Challenges:
• Loss of access cards when visitors (sometimes) are issued with them and then fail to
return them to security.
• Theft of Council property at other workstations unavailability of security at strategic
entrances/exits continued break downs of access doors.
g) Burgersdorp Pound
Achievements
• Assists in housing stray animals including stock confiscated by members of the
SAPS stock theft unit from stock thieves.
• All stray beasts are released to their rightful owners upon payment of admission of
guilt fine, and the SAPS stock theft until need to provide proof of a case number
registered to release suspected stolen beasts.
Challenges
• The pound needs the services of a pound master, a position not easy to fill due to
budgetary constraints.
• Theft of animals impounded, coupled with theft of electrical cable at the pound.

30
2.2 Corporate Services
The Corporate Services Department is responsible for providing legal services and
administrative support to Council and administration, also to ensure proper human resource
management and to coordinate the communications, public participation and marketing efforts of
council. The performance highlights per service and programme is as follows:
2.2.1 Administrative Support
The aim of Administrative support services is to render committee services to the Council and its
committees through the coordination of translation activities and by providing meeting support
services. Also to render office auxiliary services such as archiving-, messenger-, cleaning-,
typing -, reprographic- and telephone services. Lastly, to render Councillor Support Services by
providing administrative support services to political office bearers and by providing office
support services to political office bearers.
a) Council and Exco support
During the period under review the following Council and Executive Committee meetings
were conducted:
• Ordinary Council meetings: 4
• Special Council meetings: 5
• Ordinary Executive Committee meetings: 19
• Special Executive Committee meetings: 5
One question of which notice has been given and ten motions were received. All meetings
were conducted in terms of the provisions of the Municipal Structures Act 117 of 1998. All
agendas and minutes were distributed timeously but we work towards the goal that agendas
and minutes be distributed electronically to all role players. In order to achieve this, laptops

31
will have to be bought for all concerned (Councilors etc.). In the long run this financial
implication will be to the benefit of the Council. Administrative Support is also given to the
Mayor, Speaker and other full-time Councilors. Some of the achievements and challenges
are depicted as follows:
Achievements:
• Implementation of decision management on Collaborator
• A client satisfaction rating of 80,2% was achieved
• All council agendas were distributed within the prescribed time period
• All minutes of meetings were completed within the prescribed time period
• Statistics of attendance of Councilors to Council and Executive committee meetings were kept in the prescribed manner
• All minutes of meetings were typed within 3 working days from receipt.
• The establishment of an Events Coordinating Committee
• Items are distributed to departments within 10 working days from the meeting date
• The establishment of an Oversight Committee
• Air conditioning in the Council Chamber and Entertainment Hall
Challenges:
• Timeous submission of Council and Executive Committee items by departments for
inclusion in agenda
• Timeous comments by departments on Council and Executive Committee items.
• Attendance of Council meetings by the public
• Improved attendance of Council and Executive Committee meetings by members of
the different Traditional Authorities
• Upgrading of Council Chambers and Conference room as regards to furniture and
equipment
• Timeous submission of declarations of interests

32
• Due to financial constraints the proposed twinning agreement with Matola
Municipality could not be finalized
• Training of personnel (financial constraints)
• The lack of office space and equipment
• Encourage involvement of communities in matters of Local Government
b) Cluster, study group and committee support
In order to assist the Executive Committee to discharge their responsibilities
contemplated in the Structures and Systems Act, the Council has established Section 80
Committees as working committees (Study Groups) of the Executive Committee. The
following clusters were established:
• Economic
• Social
• Infrastructure
• Governance and Administration
• Finance
• Sport, Arts and Culture
• Special Committee
The roles of the clusters are as follows:
The different study groups resort under each cluster. The study groups are mandated to
research and make recommendations on specific topics in their field i.e. public
participation, communication, water, electricity etc. In this way Councilors play a
leading role in the decision making process and also give political direction on matters
serving before the Council. Presently all items are referred to the relevant Study Group
to make a recommendation to the Executive Committee. In this way Councilors take

33
ownership of the items that are submitted to Council. Meeting support is however also
rendered to the following committees:
• Airfield Control Board
• Local Labour Forum
• Management meetings
• Remuneration Committee
• Oversight Committee
Achievements:
• Number of Study and Cluster Group meetings arranged in time
• Minutes completed and typed within the prescribed time
• Implementation of items tracking and resolution management process
• Support to Council and all its Committees
Challenges:
• Ward Committees to submit the needs of the communities to the different Clusters/Study Groups
• Generation of items by Departments to the Clusters/Study groups
• Timeous submission of items to the Clusters/Study groups by Departments
• To prevent submission of items to Clusters/Study groups on the meeting date
• Comments by departments within prescribed time period
• Attendance of meetings by all role players
• Adherence to starting times of meetings
• Better utilization of Study Groups
• To distribute agendas and minutes electronically to all role players
c) Records management

34
Achievements:
• The electronic Records processes implemented fully functional and utilized, namely
• Workflow of incoming and outgoing correspondence
• Workflow of memorandums
• Filing of e-mails
• Distribution of faxes
• Customer Care (workflow of registered telephone queries)
• Item preparation and circulation
• The in-house workshop was provided by the Admin Officer (Records) to all users on
Records procedures and circulation of items.
• Full time Collaborator support consultants available to assist with daily problems
experienced by users.
• Full time technician from Xerox available to assist with problems experienced with
machines on a daily basis.
• Reduced movement of files.
• Regular visits by representatives of other municipalities to gain first hand knowledge
of our records office.
• Regular maintenance of photo-copy machines.
• A high client satisfaction rating has been achieved.
• Compliance with Batho Pele Principles.
• Reprographic services are rendered within two working days
• Faxes are delivered timeously
• Messenger services are executed within one working day
• The post is opened on the same day of receipt
• Diary services are rendered within three working days.
• A number of Officials are busy with further studies
Challenges:

35
• Lack of sufficient office space and storage equipment (e.g. zippel cabinet).
• Proper risk measures not fully exercised due to financial constraints.
• Failure in implementation of the new approved file plan due to lack of filing storage.
• Lack of internal support in terms of handling external telephone enquiries via switchboard.
• Lack of internal support with attendance of files by departments as tasked by co-departments.
• Failure to be supplied with materials needed to execute daily activities (e.g. materials out of stock on a regular basis).
• The effective use of collaborator by all personnel (system is people driven).
• More training opportunities for personnel.
• The correct usage of reference numbers.
2.2.2 Communications and Marketing
The aim of communication and marketing services is to ensure that the Municipality – both
Council and Management – articulates and disseminates common messages in an efficient,
coherent and co-ordinated manner. The functions of this Division are:
• To provide public relations and communication services, both internally & externally.
• To co-ordinate inter governmental relations services.
• To maintain and update the municipal website.
• To implement and sustain the Batho Pele project.
• To market the Greater Tzaneen Municipal area as a tourist destiny and an area for investment.
a) Internal and external communication

36
The internal and external communication is guided by the Communication Policy as well
as the Marketing Policy as approved by Council.
Achievements:
• Although this Division was not fully resourced and without the services of a Head of
Division for most of the time, it still managed to conduct the basic functions
required. In this regard the organizing of press/media conferences as well as the
responding to media enquiries can be indicated. However, more details are furnished
hereunder.
Challenges:
• Adequate resourcing of the Section both from a financial and human resources
perspective is a huge challenge.
b) Event Management
Achievements:
• The Division managed to organized or co-organize, host or assist with the following events:
o World Consumer Rights Day in Lenyenye Community Hall
o Launch of GTEDA
o Screening of the State of Nation Address (SONA)
o Provincial Government Communicators Forum
o Africa Day Soccer Tournament
o IDT Event at Sevengwane PS on – 26/10/09
o Africa Day Seminar – 24-25/05/09
o PVA event Nkowankowa Stadium – 15/06/2009
o Official switch on ceremony in Sedan
o Launch of EPWP at Tivumbeni Dept of Roads & Transport – 16/10/09
37
o Mopani Executive Mayor’s Charity Cup – 19/07/09
o Letaba Show – 2008
o Women’s Month Event
o Batho Pele Build-up Activity Event – 02/10/09
o Communicator Lekgotla
o EXCO Meets the People in Muyexe
o Are Ageng Mzanzi in Ward 21 Nkowankowa C sport ground
o Mamitwa Day
o Provincial Batho Pele Day Event in Belleview
o Heroes Walk
o District Imbizo in Bonn Village
o District Communication Strategy Review
o Mayoral Imbizo at Moleketla Ward 9
o Presidential Hotline at Hayani Guest House in Polokwane
o WADA Event in Ramothsinyadi
o Youth Seminar
o Assisted with the constitution of a Provincial Batho Pele Forum
Challenges:
• Short-staffed
• Shortage of Quality Equipment – Digital Cameras, Video Cameras, etc.
• Role clarification
• Short-time for planning
c) Website – www.tzaneen.gov.za
38
Although there is room for improvement of the website which will be addressed in the new financial year, the following information is for the record:
• Posted 55 vacancies
• Posted 30 tenders
• 13 stories were posted under news and up-dates
• Posted 15 notices
• Two Mayor’s speeches.
d) Batho Pele
Achievements
Some progress was made with the implementation of the Batho Pele project. A Batho
Pele Policy was drafted and approved by Council. A Batho Pele Forum was constituted
for Greater Tzaneen Municipality and a roll-out plan accepted. This roll-out resulted in
the following:
Achievements:
• Acquired name tags for 200 employees
• Name plates for all offices in the main building in place
• Formed a Batho Pele Forum
• Elected secretariat to the District Batho Pele Forum
• Assisted in the organization of all local build-up activities in Mopani District
• Attend 12 District Batho Pele Forum meetings
• Convened 6 Batho Pele Forum Meetings
Challenges:
The following challenges exist to successfully implement the Batho Pele project:
• Attendance of Batho Pele Forum

39
• No customer care system in place
• No vote dedicated to Batho Pele project
• Staff not wearing name tags
• Inadequate management support
e) Marketing, advertising and branding
Achievements:
• A Marketing Policy is in place that will have to be implemented.
Challenges:
• Due to a severe staff shortage this important function did not received the necessary
attention that is needed. The matter will be addressed in the new financial year.
2.2.3 Human Resource1
The mission of the HR Division is to effectively manage the rendering of Human Resources
advisory and support services to Council and internal/external clients through the following
functions:
• Personnel Administration
• Personnel Provisioning and Employment Equity
• Training, Education and Development
• Labour Relations
• Organizational Development
• Occupational Health and Safety 1 See Chapter 3 for further information regarding Human Resource Management.
40
Achievements
• New aligned organogram compiled during the first half of 2009.
• Comprehensive skills audit conducted for all staff; including DWAF staff.
• Skills audit data analysed and report drafted/submitted.
• WSP compiled by using electronic data from comprehensive Skills Audit.
• Update of HR Ringfencing for RED 6 was done.
• Perception, Attitude & Morale Survey 2008 was conducted.
• Corporate Services Client Survey 2008 was conducted.
• Employment Equity Project sustained with focus on gender & disability.
• Local Labour Forum (LLF) sustained.
• Sustained the OHS Management System and conducted OHS Risk Assessment.
• Conduct preparatory work for Electricity Learnership.
• Continue the process of HR Policy review.
• Mr. Tienus Visser received the IMPSA HR Practitioner of the Year Award for 2009 as
well as the Norlanga Branch Person of the Year Award for 2008.
Challenges
• Filling of essential & critical vacancies due to financial constraints.
• Planning for smooth integration of DWAF Water & Sewerage Staff.
• Implementation of more learnerships.
• Sourcing of more funding for education, training & development.
• Lack of office space and inadequate HR Archive.
• Finalizing an HR Strategy
2.2.4 Legal Services

41
The purpose of the Legal Services is to provide specialized Legal Service to the Municipality.
a) Legal advice
Legal Division provides legal advice to both the political and administrative arms of Council
through written and verbal opinions and advice on policy matters, legislative matters,
implementation of Council resolutions, and interpretation and analysis of administrative acts
and decisions to ensure compliance with both the National and Provincial Acts, Policies, and
Proclamations, including Council By-Laws and legislative positions. Because of the rural
nature and lack of proper information on the part of our communities in relation to
processing legal issues, our Division also often than not provide advice to the external client
(i.e. community members) on a pro bono basis. In the year under review, we processed over
2000 verbal and written and verbal opinions.
b) Admin Support (secretariat)
One of the key responsibilities of the Division is to provide Secretariat function to Council
for both the political and administrative arms of Council. This is done by providing a legal
administrative support to Council Standing Committees (i.e. Clusters), and also sits in Bids-
Committee; Pre-Assessment Committee; Employees Sports Committee; and IDP/Budget
Steering Committee.
c) Litigation
One of the central tasks of the Division is to represent and provide support to Council on all
litigation matters and other quasi judicial forums. At this stage, all internal disciplinary
hearings and arbitration matters are done in-house, an issue that saved Council thousands of
rands under the year in review. Thus far 18 internal hearings and conciliation and arbitration
matters concluded. It should however be noted that our legal officials do not represent
matters in courts, except to give legal instructions during proceedings and the service is still

42
outsourced to external experts. This is informed by the very generic responsibilities that
legal division in all public provides.
d) Legislative Support
Another critical responsibility of the Division is to develop By-Laws, Policies, Agreements,
legal Memorandums, Deeds of Sales, and Resolutions for Council and between Council and
a second or third party. Both the Senior Legal Advisor and the Assistant Legal Advisor
underwent a vigorous training in legislative drafting with the Justice College as a measure of
harnessing their skills and prowess to ensure proper compliance with standards and modules
of legislative and policy development. Equally, as part of internal personnel development
principle adopted by the HOD, Mrs. Nkuna was equally sent for an in-depth training in
drafting Service Level Agreements in the Public Service. A task which she is growing with
exceptionally well. It should thus be noted that in the past this service used to be outsourced
and such costs Council up to R15 000 – 00 on each piece of agreement/policy. At this stage,
32 Draft By-Laws have been concluded and awaits public participation and to be gazetted.
Challenges
• Unconcluded conditions of employment for Mrs. Nkuna as an Admin. Clerk of the
Division.
• A single Clerical administrator who has to deal with supply chain matters, contract
management, clerical and administrative duties, and litigation support.
• Insufficient budgetary provisions to accommodate the growing responsibilities of the
Division, as well as implementing consultative processes on the promulgation of Bay-
Laws and public policies.
• Non consideration and non implementation of legal opinions and advice by senior
managers which had created some of the legal actions currently under juri.

43
• Abdication of the duty to make decisions, by senior mangers, and relegating such to be
made by a legal advice/opinion, hence causing delays in the conclusion of matters.
• Unavailability of delegated authority or empowering policy to allow a proper monitoring
and management of awarded contracts and made agreements to ensure compliance with
conditions and standards as laid down by Council in the very same SLA’s and MoA’s
made by Council.
• The gap between the HOD and the Assistant Legal Advisor in terms of levels which does
not allow for the delegation of authority, hence impedes and halting processes and
programmes in times of leaves and other commitments by the HOD.
2.2.5 Public Participation and Project Support
The aim of the Public Participation and Project Support Division is to render public participation
services by providing constituency development and support services and to render
administrative support in the satellite offices / Thusong Centres.
In order to execute the aim of the Division, the following programmes must be implemented and
maintained:
• Ward Committee Support
• Community Based Planning (CBP)
• Project Support
• Outreach, Imbizo’s and Community Liaison Programmes
• Thusong Service Centres.
The achievements and challenges for the programmes are the following:
a) Ward Committee Support
Achievements:

44
• All 34 ward committees were established and all wards have a programme of
meetings.
• The needs of each ward in priority order are available for the ward committees.
Challenges:
• The amount of the stipends paid to ward committee members is too low to cover the
transport costs. This resulted in some committee members not to attend the meetings
due to financial constraints which on its part hamper the work of the ward
committee.
• In wards 12, 13, 14 and 15 meetings are not conducted as expected.
b) Community Based Planning (CBP)
Achievements:
• Unfortunately, no achievements can be reported in this respect although Greater
Tzaneen Municipality was a pilot in the country when this process was evaluated. A
basis of skills is still available to use this planning tool in wards in future.
Challenges:
• The main challenge for not implementing CBP is the lack of adequate resources, both
financial and human resources.
c) Project support
Achievements:
• The Section is supporting departments and Project Steering Committees with the
implementation of projects. Assistance was given with the following projects:
o Mugwazeni electrification
45
o Makhefora access road
o Ramotshinyadi access road
o N’wamitwa MPCC
o Housing data collection
o Marirono access road
o Pharare project site
o Masoma Hweetji site
o Hweetji access road site
o Mafarana, Lefara electricity project hand over
o Mafarana-Gabaza road
o Gabaza, Pharare and Hweetji access road
o NDPG
o Phase 3 tar road at Lephephane
Challenges:
The challenges experienced with project support are -
• Traditional leaders sometimes do not understand nor support developmental local
government.
• There are not enough funds available to capacitate Project Steering Committee
members and/or the liaison officers of the projects. (CLO’s)
• Inadequate monitoring of COIDA matters by the Department of Labour.
d) Outreach, Imbizo’s and Community Liaison Programmes
Achievements:
•••• These programmes are conducted in close liaison with the Communication and
Marketing Division as well as the Office of the Mayor. These matters are being
addressed by the mentioned divisions in their reports.

46
b) Thusong Service Centres
Achievements:
• With the exception of Nkowankowa and Lenyenye, another four Thusong Service
Centres are in operation, namely, Relela, Runnymede, Lesedi and Bulamahlo. These
centres were operationilized and Community Development Facilitators (CDF’s),
Information Officers and Community Development Workers (CDW), the latter from
the Office of the Premier were deployed at such centres to serve as a “one-stop-
window” service point for all public sector services. In most of the centres one or
more public sector departments are also deployed to assist communities to access the
services they are entitled to.
Challenges:
•••• Some of the centres are not fully staffed and equipped, for example, no IT networks.
These challenges will hopefully be addressed in the next financial year.
47
2.3 Chief Financial Officer
The office of the Chief Financial Officer is responsible for providing financial services to council
through income and expenditure management, the drafting of the budget, supply chain
management and overall financial management. The department is also responsible for ensuring
that Council have access to up to date information technology. The performance highlights per
service and programme is as follows:
2.3.1 Expenditure
The aim of the Expenditure services is… (please provide narrative regarding the aim of the
function and the programmes discussed below)
a) Asset Register Management
Achievements:
•••• A full asset verification of moveable assets was done before 30 June by BAUD
Systems
Challenges:
• The biggest challenge with the asset register is to get it GRAP compliant especially
in the following areas:
o Unbundling of infrastructure assets
o Account for finance leases
o To ensure the correctness immoveable property in the asset register
o Valuation of unbundled infrastructure assets
b) Grants Management

48
Greater Tzaneen Municipality currently has received a lot of grants and the following
grants have been received and managed by Greater Tzaneen Municipality:
• Nkowankowa/Lenyenye sport stadium
• Drought relief programme
• CMIP
• Neighborhood Grant
• PMU - MIG grant
• VUNA awards
• PHP Housing Project
• Cattle pound
• Seta grant
• Community based projects
• Nat MSIG grant
• Cleanest town
• Electrification Farm Houses
• Dept of Trade and mineral
• Fruit & Nut Cluster
• Umsombombo Youth Fund
Achievements:
• All grants are reflected in the Greater Tzaneen Annual Financial Statements and
will be audited annually.
Challenges:

49
• To manage all grants financially takes a lot of time and there are not always
enough personnel available to do all the accounting and reporting
• Grants supplied must also come with funding for administration cost
c) Expenditure management
Achievements:
Greater Tzaneen Municipality expenditure department managed all of the institutions
expenditure within the guidelines as set out in the MFMA, Budget and cash flow to
ensure that all expenditure can be audited in the annual Audit.
Challenges:
All departments must buy into the Financial Recovery plan and all other guidelines to
ensure that all expenditure is done efficiently and that there is no fruitless expenditure.
2.3.2 Financial Services and Budget
The aim of the Financial Services and Budget to promote a sound and sustainable budget and
reporting office which will ensure efficient annual budget and financial reporting.
a) Budget
Achievements:
• Greater Tzaneen Municipality always submitted their budget in time and in the
format required.
• Greater Tzaneen Municipality was also congratulated in writing by Provincial
Treasury for being the only Municipality in Limpopo who has submitted their
2009/2010 draft budget on time and in the format required.
Challenges:
50
• To submit the 2010/2011 budget on time and in the required format.
b) Financial Reporting
Achievements:
• All financial reports have been submitted timeously during the 2008/2009 financial
year.
• A letter was also received from Provincial Treasury in which Greater Tzaneen
Municipality and Mopani were congratulated for being the only two Municipalities
who have submitted all Section 71 reports timeously.
Challenges:
• To continue submit all financial reports timeously
• The rate at which the reports are increasing may result in a shortage of personnel to
compile these reports.
c) Investments
Achievements:’
• Funds were invested despite the fact that GTM experienced cash flow problems
• R 20 Million were invested on short-term basis.
• Adequate provision has been made by way of external investments to ensure that
cash is available on maturity date of external sinking fund loans. Investment income
on the other hand is utilized to fund the operational budget. Held to maturity
investments at 30 June 2009 amounted to R25.8 million.
Challenges:
51
• To invest all surplus funds when funds are available
2.3.3 Revenue
The aim of the Revenue services to promote a culture of payment for municipal services to
ensure all monies due to the municipality are collected for municipal financial viability and
growth.
a) Billing
Achievements:
• Monthly statements sent timeously.
• Implementation of the new tariffs as per budget
Challenges:
• System improvements, accurate meter reading, current details of consumers/rate payers
b) Revenue collection
Achievements:
• An increase of 22% on service charges
Challenges:
• Implementing new tariffs for 2009/2010 financial year.
• Implementation of the new valuation roll.
• Maintaining the database
c) Debt collection
Achievements:
• 3% increase in debt collected rate (54% to 57%).

52
• 96% credit control succession rate
Challenges:
• Customer credit profiling,
• Legal processes
2.3.4 Information Technology
The aim of the Information Technology services is to develop and maintain an IT network that
ensures universal access to IT for all office based staff while ensuring the safety of Council
Management Data.
a) Master systems planning
The Mopani District Municipality is coordinating the development of a master system
plan that will inform IT operations and capital spending in total. It was envisaged that
this project will be completed by the end of December 2008.
b) IT support services
Challenges:
During the financial year the Head of the Division resigned and due to cost saving
measures in place at the time the position was not filled. The responsibility for IT, which
to a great extend, involved managing the service provider to whom the service is
outsourced, was delegated to the Head of Expenditure.
The cost-saving measures have also had an impact on the replacement of IT equipments
which have reached the end of their useful lives. Innovative ways will also have to be
considered to address the issue of new desktops and laptops for new officials that have
been appointed. At present only the managers and some selected Heads of Divisions
have laptops allocated to them.

53
The service level agreement between Greater Tzaneen Municipality and Business
Connection has expired and is currently running on a month-to-month basis, no clear
indication has been given as to how long the status quo would remain.
c) Network management
Achievements:
The municipality was able to achieve network availability for all users of up to 95%.
Challenges:
Due to non-replacement of old equipment the municipality’s server crashed at the end of
the financial year. The critical impact of this was on the non-access to the financial
system which was necessary for billing purposes. At the same time the UPS also packed
up which resulted in the servers receiving power from the main supply without any back-
up system or a system to regulate electricity fluctuations. This is exposing the
municipality to severe risk of loss of data and non access to the network.
Network management is a challenge due to absence of proper network management tools
deployed to constantly poll network resources in order to properly gauge total network
uptime and availability. The LAN(s) and WAN are both routed and bridged via an edge
router (which also needs upgrading) but without WAN Management tools statistics and
alerts cannot be collected from routers and backbone switches to enable proper analysis
of network throughput(s), convergence, congestion and dataflow bottlenecks which
inform future scalability of both the wired and wireless networks.

54
Inventory and stock control of printer consumables is a competency that lies with the IT
Department. In the past we solely relied on end users to inform us of their need to
replace toners and cartridges for both standalone printers as well as multifunctional
printers. In January 2010, we deployed trial software that reports on printers’ toner levels,
pending replacement of imaging units and fuser kits, toner change management and
volume breakdown by printer device function. During the trial period, the current printer
service provider will be approached to assist with the procurement of the licensed
software.
d) Data warehouse
Due to financial constraints this project was not undertaken. However all officials have
access to the main server to save their work centrally. As a parallel and related project
the municipality is also busy with an exercise to have full GIS system in place
e) Disaster recovery
There currently are not sufficient disaster recovery measures put in place to cover data
server crashes as well as loss of communication between sites. The former is covered as
part of the Master Systems Plan, spearheaded by the Mopani District Municipality, but
the latter has not been sufficiently catered for during the rollout of the wireless WAN
backbone. Redundant backup links forming a mesh network between municipal offices
should be added to the current network topology to re-route data in the event of network
outages arising from either faulty equipment or fresnel zone created by rainy weather.
f) Telephony
The current Philips Pabx was upgraded in 2005 to enable Ethernet functionality required
to interface the telephone system with the Local and Wide area networks. There

55
currently are three (3) types of telephone handset available to users i.e. Digital, Analogue
and IP with the latter being the favoured to replace both analogue and digital with the
proposed telephone system upgrade to enable call centre functionality
2.3.5 Supply Chain Management
a) Stock management (Stores)
Achievements:
• The annual stock taking took place during the end of June 2009.
o All items were counted, verified and compared with Council stock records.
o During the stock count, items to the value of R55 332.60 were recorded as
surplus and
o R9,549.57 as deficit (considering that a single item like a transformer or mini
sub station has a very high rand value).
o A Nett surplus of R45 783.03, taking in account the following rand value
figures and movement of stock items, this Nett surplus only represents 0.07%
of the total stock value.
o In summary:
� Rand value of issues: R16 712 840.76
� Rand value of stock purchases: R16 118 941.48
� Value of stock, end of June: R 6 746 644.80
� Stock codes in stores: 1484
� Internal requisitions processed: ± 5350
� Stock orders issued: ± 1700
� Goods receiving notes processed: ± 1800
Challenges:

56
• As the stores are one of the main sections in the Municipality, we must strive to
adhere to Batho Pele Principles.
• Limiting mistakes.
• To update the present control systems.
• Training of staff to their full potential.
• Ensure versatile employees.
• Stock control must be the first priority.
• Have proper measures to secure stock to limit stock theft.
b) Procurement
Achievements:
• The process of reviewing database of suppliers has been implemented and the
process of acquisition as element of SCM is increasing its rate by having SCM
sourcing quotations. This process minimizes the uncertainties of unfairness when
sourcing quotes from service providers as it is controlled centrally.
Challenges:
• Some service providers do not complete their projects complete their projects on
time.
• Local market does not have enough service providers for some services such as
printing and design.
• Service providers are not accessible as they change contact details without informing
SCM as results they cannot be used.

57
2.4 Electrical Engineering
The Electrical Engineering Department is responsible for developing and maintaining the urban
and rural electrical network in the GTM area of jurisdiction. The performance highlights per
service and programme is as follows:
a) Electrical By-laws
Achievements:
• Item B67 OF 27 November, council noted new bi-laws and requested cooperate
service to investigate possible funding for promulgation.
Challenges:
• No promulgation of by-laws yet, due to a lack of funding
b) Electrification of Farm worker houses
Achievements:
• Three hundred and sixteen (316) unit were electrified for the total cost of R 1371
667.00
Challenges:
• To motivate farmers to pay for the connection cost and to complete project in the
allocated time allowed for.
c) Electrification (Eskom area of jurisdiction)
Achievements:
• 526 households connection were electrified by Eskom at Sedan village.

58
Challenges:
• Insufficient funding to eliminate backlog
d) Electrification (GTM area of jurisdiction)
Achievements:
• 70 new domestic connections were made for the total cost of R697,638.13.
Challenges:
• Insufficient network capacity to provide connections to consumers.
e) Electrification of schools and clinics
Achievements:
Unknown
Challenges:
• Communications with service provide was not up to standard
f) Maintenance of distribution network
Achievements:
• 30 km of overhead lines have been rebuilt for an amount of R3,813,702,00 and
• 54 streetlights were installed in Nkowankowa for an amount of R400,000.00
59
• Additional capacity were created by refurbishing 1 x 10 MVA transformer and
constructing of 4 x outdoor 33 kV substations for the amount of R5,786,298.00.
Challenges:
• Obtaining additional funds to enable the department to perform proper maintenance
on the distribution system.
g) Streetlights
Achievements:
• 54 Streetlights were installed in Nkowankowa
Challenges:
• The cost of material is a major concern.(R6,500-00/ Streetlight)
h) Capacity development
Achievements:
• Phase one of many has been initiated with the request for tenders. The Social
Economic Management process is underway and hopefully the tender will be
awarded soon.
Challenges:
• Further financing of the required to the amount of R81 million rand

60
2.5 Engineering Services
The Engineering Services Department is responsible for the developing and maintenance of the
roads, storm water, water and sewer networks of GTM. The department must also maintain all
council property and project manage all MIG projects. The performance highlights per service is
as follows:
2.5.1 Building and Maintenance
The division building and maintenance services are responsible for building control office,
maintenance of all council owned building and fleet management mechanical workshop.
a) Building control
By legislation local authorities are required to enforce the national building regulation act
of 1977.
Achievements:
• Square meters new houses approved 18186m² to the value of R 54,558,000
• Square meters addition to existing houses approved 6682m² to the value of R 20,046,000
• Square meters new shops approved was 1537m², to the value of R 4,611,000
• Square meters addition to existing shops approved was 527m², to the value of R 1,581,000
• Square meters addition to existing industrial approved was 1278m², to the value of R 3,834,000
• Square meters of new other (cell phone towers ) approved was 234m², the value of which is unknown

61
Challenges:
• Lack of electronic building control system to assist in scanning and circulating the
plans to shorten response time, while improving on safe keeping of the building
plans.
• The cost of the system is estimated at R 80 000
b) Building maintenance
The unit is as well responsible for maintenance and management of all municipal
buildings. Municipal buildings are maintained and managed according to the allocated
annual budget, which has not been sufficient to can neither meet the needs nor satisfy
Occupational Health and Safety Act requirements.
Achievements:
The following operational maintenance projects were successfully completed:
• Nkowankowa office paving
• Waterproofing of roof slabs at the civic centre
• Tiling of offices PED, Revenue , Communication offices
• Various routine and emergency maintenance conducted in various municipal buildings
Challenges:
• The acquisition of a building facility management system estimated at R 150,000
will assist in capturing detailed building conditions and advice on when and what
type of maintenance is due
• Shortfall in budget of 75% , the current budget is about R 1million which represent
about 25%

62
• In order to meet the needs of maintaining municipal building a budget of around R 4
million a year is therefore required
c) Fleet management
The primary responsibility of the fleet sub-section is to make vehicles available to the all
users:
Achievements:
• Managed to acquire three new trucks through MIG grants
• One water tanker , Honey sucker and skip loader for solid waste
• Managed to save 25% of the total budget allocated without compromising the service
Challenges:
• Age of the fleet e.g honey sucker as old as 27 years which is creating problems due
to old model
• Absence of a full fleet management system that will generate a report on a monthly
basis to check driver abuse and negligent drivers.
• Sufficient capital provision to replace old vehicle
• Workshop management system
• Fleet replacement policy and aligning fleet policy to the new AARTO ACT
• Shortage of skilled artisan
2.5.2 Project Management (MIG)
63
The aim of the project management services is to provide all South Africans with at least a basic
level of service through the provision of grant finance aimed at covering the capital cost of basic
infrastructure for the poor.
Achievements:
• Successfully completed 5.6km of gravel road of Sedan internal streets
• Completed 2km of gravel road of Marumofase access road
• Completed 2km of gravel road of Leseka access road
• Completed Tzaneen rural waste removal phase2, constituted of 16 public off
Loading facilities
• Completed Tzaneen landfill site phase2 which constitute of transfer stations at
Haenertsburg, Lenyenye and Nkowankowa.
Challenges:
• No service level agreement for consultant
• Non performance of consultants and contractors
• Late appointment of contracts by supply chain unit which have a negative impact on
both project budgeting and scheduling
2.5.3 Roads and Storm water
The aim of the roads and stormwater services is to provide for maintenance of all new, existing
roads and storm water management within the entire GTM.
a) Road maintenance
Achievements:

64
• Internal streets and funeral roads graded total of 1779km completed
• Regravelling of roads total of 24km completed
• Patchwork to existing tar roads totaling to 7510.92m² completed
• Road marking to existing roads totaling to 8861m² completed
• Sand seal roads which has to be replaced
Challenges:
• Insufficient budget provision to meet targets and challenges
• Heavy rains which caused lot of potholes in the entire town including the Township
Lenyenye, Nkowankowa , Letsitele , Haenertzberg and all rural roads within the
entire GTM
b) Storm water management
Achievements:
• Stone pitching to sand seal roads in Lefara and Moleketla totaling to 5994m²
• Additional stone pitching to various villages has been completed totaling to 4456m²
Challenges:
• Insufficient budget provision to meet targets and challenges
• Heavy rains which caused lot of potholes in the entire town including the Township
Lenyenye, Nkowankowa , Letsitele , Haenertsburg and all rural roads within the
entire GTM
65
2.5.4 Water and Sewer
a) Water purification & supply:
Achievements:
• Managed to supply potable water that satisfies SANS 241:2003
• Keeping in the run, monthly water quality sampling programme through service
provider while conducting our daily sample taking and analysis.
• Registered Blue drop Water status for all GTM operated water works.
Challenges:
• Insufficient funds to upgrade Georges Valley Water Treatment Works.
• High turbidity during Rainy season.
• Lack of sufficient personnel to do preventative maintenance for both electrical and
mechanical equipment
• Insufficient water allocation.
• Letaba River bank is gradually collapsing where it may affect our water works fence
and eventually affecting the pump station for Tzaneen Dam Water Works.
b) Waste water management
Achievements:
• Managed to keep effluent as required by Special Standard for Wastewater.
• Succeeded in preventing the spreading of waterborne diseases by ensuring that the
effluent complies to Special Standard for Wastewater
66
• Registered the Wastewater works for Green Drop Status.
Challenges:
• Insufficient capital provisioning for upgrading Nkowankowa and Lenyenye
Wastewater works.
• Vandalism and theft of equipment at the wastewater works.
• Storm water lines connected to sewer lines resulting in overloading of Sewage works
• Illegal connection especially at Nkowankowa Section C & RDP houses.
c) Borehole maintenance
Achievements:
• 17 of the 28 Boreholes selected were repaired while 1 was drilled and equipped.
Challenges:
• Theft of pumps, electrical cables and transformers.
• Vandalism of pipes followed by illegal household connections to water and sewer.
d) Sanitation
Achievements:
• 3000 VIP pit latrines were constructed
Challenges:
• Non compliance to Indigent register.

67
2.6 Municipal Manager
The office of the Municipal Manager is responsible for disaster management as well as internal
audit. The performance highlights per service is as follows:
2.6.1 Disaster Management
The aim of the disaster management services is to have a safe, informed and prepared
community that will be able to handle and cope with all emergencies / disasters within the
Greater Municipal area.
a) Disaster prevention
Before any prevention of any disasters can take place, risk assessment must take place.
Disaster Management Act: 57 of 202, section 47(a) states that determining the risks of the
area must take place, and assessing the vulnerability of communities. Prevention
includes the identification of hazards, the assessment of threats to life and property and
the measures to reduce potential loss of life and property damage, sometimes disaster
mitigation. Mitigation measures range from community awareness campaigns to increase
knowledge of how to deal with disaster situations, land use zoning and design decisions
to stop development which may be dangerous in the event of a disaster. All mitigation
measures are important as they can only reduce the cost of disasters to the community,
but they help to save lives
Achievements:
• Training on Disaster Management to:-
o Hospitals, Schools, Colleges, Ward Committee Members, Community
Development Workers, Individuals, Business Forums and Private Businesses.
68
o Fire Awareness Campaigns / Fire Training \ were conducted for the following
institutions: Sebone Primary School, Rita Primary School, Tzaneen Private
Hospital and
o Greater Tzaneen Municipality’s Staff.
o Addressing of communities on the consequences of crime was conducted by
Mopani District Disaster, Disaster Management Tzaneen, Indunas and ANC
leadership, example Burgersdorp Village.
o 50% of all wards were visited and risk assessment was done.
o Cholera, Rabies and H1N1 contingency plans in conjunction with all relevant
stakeholders were developed.
Challenges:
• Negotiation with traditional leaders, not to allocate land or erven to community
members that are in flood lines.
• Training facilities, Funds and Qualified Personnel.
• Attended a week long workshop on the development of a new Phase One,
Emergency Plan for the Greater Tzaneen Municipal area, these plans will be
submitted to Council early 2010, for acceptance and approval.
• The Phase Two emergency plan that must follow within the next three months. The
aim of this unit is to submit the final Phase Three Emergency Plan to Council by
October 2010.
b) Disaster management
Achievements:

69
• Corporate Plan Completed, Emergency Plan, Risk Assessment 75% complete.
• The following special events plans were done:
o Novus Marine Air Show, Letaba Show, Handling over of deeds for beneficiaries
of Lenyenye and Nkowankowa, Inauguration of Hosi Philia N’wamitwa,
Contingency Plan for Cholera, Africa Day Celebration, Public Viewing at
Nkowankowa, Inauguration of the District Mayor, Mayor’s Charity Cup.
• Emergency data base up to date.
• Help to communities within 72 hours.
Challenges:
• Store room required
• Office space insufficient
2.6.2 Integrated Development Planning
The aim of the integrated development planning is to develop the principle planning document
for the municipality to ensure the integration and alignment of all programmes and services
while ensuring community ownership of the IDP.
a) Preparatory Processes (Process Plan & forums)
Achievements:
• The IDP/ BUDGET/ PMS process plan was approved.
Challenges:
• We were not complying with the process plan.

70
• IDP/ BUDGET/ PMS Rep Forum and Steering Committee were not convened as per the process plan.
• Representative Forum not fully utilised as required to ensure community ownership of the process.
b) Analysis
Achievements:
• The phase was completed
• Public Participation/ community meetings took place
Challenges:
• Analysis not credible
• CBP was suspended.
c) Strategy Development
Achievements:
• Strategies were revised at a Strategic Session that took place in May 2007
Challenges:
• Strategies not aligned to strategies phase
d) Project planning & budget alignment
Achievements:
• Projects we identified
Challenges:
• Projects not aligned to strategies
• Projects not implemented.

71
e) Integration of programmes
Achievements:
• Some internal Developmental Plans and Strategies were submitted.
Challenges:
• Some Plans and Strategies were not developed.
f) Adoption and implementation
Achievements:
• The IDP for 2009/10 was adopted on the 29th of May 2009.
Challenges:
• No implementation of planned projects due to budget constraints
2.6.3 Internal Audit
The aim of the internal audit services is provide an independent, objective assurance and consulting services designed to add value and improve the operations of the organization.
g) Risk assessment
Achievements:
• Risk assessment has been done, risk register and report has been submitted to the municipal manager and the Audit Committee.
Challenges:
• Absence of risk assessment software.
• Absence of a risk officer.
• Risk assessment is done once per year instead of continuous risk assessment.

72
h) Audit programme implementation
Achievements:
• 65% of the Audit programme has been implemented.
Challenges:
• Shortage of staff.
• Increasing special requests from Management.
• Preparation and physical annual stock count.
i) Internal Audit reporting
Achievements:
• Four quarterly reports have been submitted to the Audit Committee.
Challenges:
• Immediate response from management to audit findings.
2.6.4 Performance Management
The aim of performance management services is to provide a mechanism for Management to
monitor and evaluate institutional as well as individual performance on a regular basis and report
on the performance as per legislated requirements.
a) PMS policy development
Achievements:
• None
Challenges:

73
• During the 2008/09 performance assessment it became evident that the PMS policy
needs to be revised. Due to the fact that the office is staffed by only one person, time
constraints have resulted in this not taking place.
• Currently the PMS is only applied to the first 3 levels of staff. The development of
an Incentive Policy is an urgent requirement to enable the cascading of the PMS to
lower staff levels.
b) Performance Monitoring and Reporting
Achievements:
• None
Challenges:
• Quarterly performance reports are not submitted to Council or as legislated. The
delayed finalisation of reports is mainly due to the delayed submission of information
by Departments.
• Community involvement in performance monitoring is limited to information sharing
at the IDP Representative Forum and Council sittings.
c) Scorecard & Performance Plan Development
Achievements:
• All Managers and HODs signed Performance Plans
Challenges:
• The finalisation of the Scorecard and therefore also the SDBIP & Performance
Agreements are dependant on the finalisation of IDP projects. The delays in

74
finalising the IDP make it impossible to have the Performance Agreements and
SDBIP ready within the legislated timeframes.
d) Performance Evaluation
The Performance Evaluation for 2008/09 was finalised in September 2009. The performance
report is attached as Annexure A.

75
2.7 Planning and Economic Development
The Planning and Economic Development Department is responsible for providing socio-
economic development, tourism and LED and housing administration support. The department
is also responsible for managing land development and town planning applications and to ensure
integrated planning and performance management. The performance highlights per service is as
follows:
2.7.1 Geographical Information System (GIS)
The aim of the GIS services is create and enhance a comprehensive management tool that
competent in executing Municipal functions in area such as Town Planning, finance,
engineering, environment, IDP and as well as other external services.
Achievements:
• Identified all user requirements for the Municipality and the estimated financial
implication.
• Designed organogram which caters for the above mentioned needs.
Challenges:
• Municipality has currently no resources to fund the initial part of the project.
• Organogram is still pending approval by Council.
• The identified funders want us to co-invest in the system at the ration of 40/60 percentage.
• The Municipal current inability to fund capital projects
2.7.2 Land Property and Housing Division

76
The aim of the land, property and housing services is to manage and administer Municipal land
(Land sale, Lease, Donations, expropriation of land and negotiate land purchase), Administer the
allocation of beneficiaries in Pioneers Old Age Home. Also to administer the Municipal Houses
by means of rental and manage Housing projects allocated by Province and lastly human
settlement as per the new mandate. Current Housing programmes are:
• People housing process
• Developer driven housing
• Social housing
• Community residential units.
• Hlamda process
• Consumer housing education.
• Coordinate rental tribunal program.
• Negotiate funding from the Province.
• Extended Discount benefit Scheme
• Dealing with encroachments
a) RDP & PHP housing
Table 1: RDP housing project progress
RDP Project
Location
Year allocated Number of
units allocated
Number of
units
completed
Challenges
Mbambamencisi 2008 500 327 Non availability
of sites.
Mariveni 2008/9 50 50

77
Table 1: RDP housing project progress
RDP Project
Location
Year allocated Number of
units allocated
Number of
units
completed
Challenges
Lephephane 2008/9 100 100
Mavele 2008/9 100 97 3 beneficiaries
should be
replaced.
Already 3 new
beneficiaries
completed the
forms for
approval
Achievements:
• 574 Houses complete and 85% of the blocked project completed.
Challenges:
Non availability of sites at Mbambamencisi. People are selling sites without the
knowledge of the Traditional Council and the Municipality
b) Pioneers Old Aged Homes
Achievements:
• 7 Old people were allocated units
Challenges:

78
• We receiving more application but the units are not enough to accommodate large
number of people.
• Old Age Homes is not a core function of municipality. We once held a meeting with
Department of social Development to explore the possibility of a subsidy or total
transfer of the function but this has not yielded any results.
c) Land management
Achievements:
• 5 site were sold in Nkowankowa section C
Challenges:
• Nkowankowa is land locked, hence there’s a huge demand for sites.
• Huge Increase of illegal settlements.
• Transnet owns properties in Nkowankowa but under utilized. Negotiations are under
way for them to transfer the property.
• Lenyenye graveyard remains unresolved.
2.7.3 Socio Economic Development, Tourism and LED
The aim of the socio-economic development, tourism and LED services is to promote and
network economic opportunities that will ensure job creation, poverty alleviation and investment
for economic growth.
a) Poverty reduction and empowerment
Achievements:
• Training on poverty monitoring tool

79
• Support poverty alleviation projects e.g. Thabina soil conservation
• Website developed on poverty monitoring
Challenges:
• No baseline study
• No funding to develop poverty alleviation strategy
• Tools to record poverty
• Stats SA as the only source of official statistics
b) Tourism
Achievements:
• Mefakeng Tourism Development
• Training of TDA’s and Cooperatives by TEP
• Establishment of Local tourism association
• Indaba Annual event
• Getaway show
• Event calendar
• 2010 plan
Challenges:
• Uncoordinated events
c) Agriculture
Achievements:
• Land Claims Support Forum
• Continuous support to 8 Agriculture projects

80
• Peppadew project
• Feasibility study conducted by Agency e.g. livestock improvement, Sapekoe and fruit and nut.
Challenges:
• Funding for projects
• Coordination between emerging and formal farmers
• Establishment of agricultural forum
d) Business Development
Achievements:
• Maake plaza opened
• Hawkers study completed
• Shopping center study completed by GTEDA
Challenges:
• Shortage of bulk services limit further development
e) Economic growth and investment
Achievements:
• Established Development Agency
• 6 studies conducted
• Neighborhood partnership development grant funding approved for Nkowankowa
and Lenyenye.
Challenges:
• Co funding

81
• Investment/ incentive strategy approval by TIL.
2.7.4 Town Planning Division
The aim of the town planning services is to co-ordinate in a harmonious manner development of
the Town in terms of all applicable legislations and policies to promote the health, safety, good
order, amenity, convenience and general welfare of the town to achieve the desired economic
growth and good governance
a) Spatial Development Framework (SDF)
The purpose of the policy is to guide and promote investment in spatial situation so as to
inform the IDP with reference to the desired spatial and build foam of the municipality to
indicate desired patterns of land use and set out objectives that reflect desired spatial foam.
The provision of the strategic guidelines in respect of the location and nature of the
development within the municipality. Guide for decision making and act as source for the
capital investment framework required for future growth.
Achievements:
• Council approved policy documents that are informative to the IDP
• Informative in decision making on development application
• No appeals and challengeable hearing arising from policy documents.
• Aligned to the Provincial Spatial Perspective.
• Community involvement is at an acceptable level as per constitution.
• Revised SDF promulgated with no objections.
Challenges:
• The data about the capital investment framework is insufficient.
• The statistical data not compressively collated for proper calculations of projections.

82
• No funding for the implementations of catalyst projects, thus no Attraction for
private investment.
• Does not address the current rural challenges.
• The desired integration seem unattainable due lack of capital projects funds.
• Intergovernmental relations lacking far behind in the developmental sphere due to
cross cutting responsibilities.
• National and provincial priorities differ with locals as far as infrastructure
development is concerned, thus compromising the integrity if the municipals IDP.
• Housing projects planned at National Level often disregard the competency and
affordability of the Local Government infrastructure enhancement to achieve
integrated housing
• Some municipal projects are planned and implemented outside the approved SDF
and IDP.
b) Land Use Management and town planning applications
The number of town planning applications handled during 2008/09 is contained in Table 2. .
Table 2: Number of Town Planning Applications processed during 2008/09
Category Applications outstanding 1 July 2008
New Applications Received 2008/09
Applications outstanding 30 June 2009
Rezoning/permit none 23 3
Township Establishment/ extension 1. 4 1
Special Consent none 10 none
Reg. 188 none 80 33
Subdivision/consolidations 3 22 1

83
Achievements:
• A comprehensive draft land use management system is in the process of being finalized for the entire town including rural areas.
• Rural areas application can now be handled at ease with the assistance of Tribal Authorities.
• Maps and plans can be improved for future development using GIS.
• A process to unify and integrate separated habitat areas has commenced through the Land Use Management system.
Challenges:
• There is currently no promulgated land use legislation to deal with the ills of the past.
• Legislative impediments in rural application slow down the process of approval, hence the 33 applications outstanding for June 2009.
• Different town planning legislations and authority impact on the process flow of applications.
• Lack of Human capital
• Resistant to integrations from both internal and external factors.
• Business processes need to be re-engineered to coincide with transformation

84
2.8 Municipal Manager’s comments on overall performance
The overall performance per Key Performance Area can be summarized as follows:
2.8.1 KPA 1: Municipal Transformation and Organisational Development
The delays in the conclusion of the SDBIP and Performance Agreements for Section 57
Managers is noted with concern and will in future be addressed as this hampers the submission
of performance reports to Council. Also, the filling of critical vacancies is a matter that will be
attended to as best possibly within our current financial constraints. GTM is doing well in
adhering to our Employment equity policy and will work hard to improve equity on Management
and Labourer levels.
2.8.2 KPA 2: Basic service delivery and infrastructure development
When considering basic service delivery as a whole the main issues that need urgent attention are:
• The establishment of a Integrated Management Information System (GIS based) to inform al infrastructure planning
• Infrastructure Development Plans for all sectors
• Capital funding to assist in expanding infrastructure networks to eradicate existing backlogs
• Operational funding for the maintenance of existing infrastructure networks to prevent the collapse thereof
• Adherence to the Service Level Agreement by the Water Service Authority (Mopani District Municipality)
2.8.3 KPA 3: Local Economic Development

85
Although various activities are being undertaken to support economic growth and investment in
the GTM area, the ability of Council to stimulate economic growth is hampered by the serious
infrastructure challenges facing council. Various development initiatives had to be turned down
due to the limit capacity of Council to provide access to services, in particular, water and
electricity.
2.8.4 KPA 4: Municipal Financial Viability and Management
GTM is doing exceptionally well in terms of financial reporting. However, we are currently
implementing a Financial Recovery Plan, which was initiated in 2007/08 to improve the financial
situation of Council. Attempts to improve our financial situation were however impeded by the
following realities:
• Limited ability to minimise fixed cost in relation to personnel expenditure and long term
contracts
• Limited Capital available to extend service provision in order to expand the revenue base
• Debt recovery process to be improved
The ability of Council to render services in a sustainable manner is dependant on sound financial
management and therefore the Financial Recovery plan receives priority attention.
2.8.5 KPA 5: Good Governance and Public Participation
Although GTM has not conducted a customer satisfaction survey during the 2008/09 year, the
involvement of the community in the affairs of Council is being driven by the Public
Participation unit. Regular IDP representative forum meetings also take place. With regard to
IGR, GTM attends all IGR forum activities in the District and Local area to improve working
relations and service delivery.

86
3. HUMAN RESOURCE AND ORGANISATIONAL MANAGEMENT
3.1 Organisational design
3.1.1 Functional Organogram
The organogram is reviewed annually to cater for new needs/functions and also to align it to the
IDP. The organogram is attached as Annexure B.
3.1.2 Functional Structure re-design
During the 2008/9 financial year the Department Transport, Safety, Security and Liaison with the
Law Enforcement and Licensing and Testing Divisions under its control was reintegrated with
the Community Services Department. This Department also consists of the Waste Management,
Library Services, Health Services and Parks & Recreation & Cemeteries Divisions. Also, the
IDP/PMS Sections were reallocated from the Planning and Economic Development Department
to the Office of the Municipal Manager.
A comprehensive organogram review took place during the first half of 2009 to, inter alia, cater
for the amalgamated Water & Sewerage function.
3.1.3 Staff establishment
The staff establishment was updated in line with the approved functional structure. As on 30
June 2009 906 positions were approved of which 607 were filled with 299 vacancies. The
breakdown of the approved positions per department is presented in Table 3.

87
Table 3: Staff establishment per department, 2008/09
Department Positions Approved
Positions filled
Positions vacant
Municipal Manager 16 9 7
Planning & Economic Development 24 15 9
Finance 75 50 25
Corporate Services 71 47 24
Engineering Services 258 154 104
Community Services 341 233 108
Electrical Engineering 121 99 22
Total 906 607 299
3.1.4 Task job evaluation
Job Analysis Questionnaires (JAQ’s) for all positions were prepared after the training of 30
identified departmental representatives. Final job descriptions were signed by all parties and
submitted to the Regional Task Job Evaluation Committee on 30 March 2006. The final
outcomes report after moderation was received on 6 December 2007. Implementation of the
outcome can only be done once the grading and salary structuring process is finalized. Attention
was given to the maintenance of job descriptions for positions created after 1 July 2005.
3.2 Personnel administration
A summary of the services provided through personnel administration is summarized in Table 4.
Table 4: Service provision with regard to personnel administration during 2008/09
Type of service Number of cases
Paying work outside Council approved 6

88
Table 4: Service provision with regard to personnel administration during 2008/09
Type of service Number of cases
Employees declaring interest 14
Councilors declaring interest 7
Personnel files maintained 1518
Days Study leave recorded 426
Days leave sold 3062
Long Service Leave days sold 1021
Permanent entrants engaged 85
Temporary staff absorbed 39
Students engaged 4
Staff Promoted 21
Temporary / Casual employees administered 25
Number of exits 50
Long Service Awards made 14
Advertisements prepared & placed 85
Short-listing meetings held 85
Interviews held 85
Probation approved 80
Number labour incidences dealt with 2
Disciplinary cases recorded 23
Grievances recorded 0
Local Labour Forum meetings held 9
Job descriptions maintained 46
89
3.3 Skills development
The Greater Tzaneen Municipality is committed to skills development and fully subscribes to the
provisions of the National Skills Development Strategy. Therefore, the Workplace Skills Plan
(WSP) for the 2008/2009 financial year was submitted to the Local Government SETA
(LGSETA) and has been implemented; as far as finances permitted it. The Employee
qualification profile is attached as Annexure C.
The Training Policy was reviewed to accommodate new challenges and approved by Council for
implementation and an amount of R864 725 was budgeted for skills development during the
2008/2009 financial year. The money was intended for, inter alia, to finance training
interventions which had been identified to address the skills gaps in the Municipality. The
training interventions are conducted by accredited training providers to ensure quality of
provision.
The Local Government SETA (LGSETA) was again approached for funding for the training of
employees on Adult Basic Education and Training (ABET), but it was not approved.
With regard to the implementation of learnerships, the Water learnerships have been concluded.
The Energy SETA assessed the programme and 14 officials were certified competent and have
received their certificates on 24 October 2008. The first intake of four Community Development
Worker learnerships has concluded the programme successfully. Another intake of 24 learners
have started with the programme during November 2006 and concluded at the end of December
2007. The Municipality will also implement an electricity learnership during 2009/2010. Ten
(10) employed learners and five (5) unemployed have been earmarked for participation in the
learnership. Other training programmes that were attended by staff are presented in Table 5:
Table 5: Training programmes attended during 2008/09
NO Programme Number of staff attended
1 Legislative Drafting 1

90
Table 5: Training programmes attended during 2008/09
NO Programme Number of staff attended
2 Trade Test: Motor Mechanic 1
3 Structural Analysis and Design 1
4 Investigators, Initiators and Prosecutors 1
5 Children’s Right 1
6 OHS & Legal Responsibilities of the managers and Head of Divisions
28
7 OHS Training 26
8 Survey and Terrain, Roads, Sewer, Storm water and water. 1
9 Risk Based Auditing 1
10 Compaction of Road Building Materials 1
11 E-Natis Training 2
12 Transportation of Dangerous Goods (Hazatrans) 2
13 First Aid 31
14 Fleet Improvement Strategies 2
15 Conciliation and Arbitration 2
16 Municipal Finance 3
17 Municipal Leadership Development Programme 7
18 Policy and Legal Framework 2
19 Translation 2
20 Certificate Programme in Management Development (CPMD) 7
21 Chlorine Handling 14
22 Fujitsu 2
23 Municipal Leadership Development Programme 2
24 The Prosecutor 18
25 ORHUS 17

91
Table 5: Training programmes attended during 2008/09
NO Programme Number of staff attended
26 Conflict Management 1
27 Trade Test Preparation Motor Mechanic 1
28 Trade Test Preparation Electrician 1
29 Performance Management 1
30 Chairing Disciplinary Hearings 2
31 Defensive & Advanced Driving 1
32 Minute Taking & Report Writing 1
33 Ill Health and Poor Performance in the Workplace 1
34 New Engineering Contracts 1
35 Fire Fighting 54
36 IDP Skills Programme, Leadership & Management 1
37 Civil Designer 1
38 Financial Management Training 11
39 Financial Life Skills 68
40 Fire-arm Practical Shooting 14
41 Induction 18
3.4 Disclosure of salaries, allowances and benefits
The salaries and allowances received by Councilors during 2008/09 are presented in Table 6 & 7.
Table 6: Councilor salaries and allowances, 2008/09
Councilors Total package (R) Mayor 571,982

92
Table 6: Councilor salaries and allowances, 2008/09
Councilors Total package (R) Speaker 464,441
Executive Committee 1,160,802
Full time Councilors 2,171,766
Councilors 9,739,429
Councilors Pension 0
Medical Fund Cont. 0
Table 7: Councilor Allowances for 2008/09 to 2009/10 (R) 2007/2008 2008/2009 2009/2010 Allowance Mayor 483,652 400,000 454,424
Allowance Full time Councilors
2,222,911 1,821,332 2,067,626
Allowance Executive Committee
1,009,197 825,599 937,249
Allowance Other Councilors
8,203,718 7,308,873 7,361,559
Councilors allowance Travel
0 3,217,329 4,394,668
Contribution – Councilors other
53,767 107,036 164,903
Total Cost 11,973,245 13,680,169 15,380,429
Table 8 presents the salaries and allowances of senior officials (Section 57 Managers) for
2008/09.
Table 8: Senior official’s salaries and allowances, 2008/09
Senior officials Salary (R)
Incentive (R)
Leave Pay (R)
Total Package(R)
Municipal Manager 878,439 37,590 0 926,833

93
Table 8: Senior official’s salaries and allowances, 2008/09
Senior officials Salary (R)
Incentive (R)
Leave Pay (R)
Total Package(R)
Chief Financial Officer 538,828 55337.39 170,326 773,478
Corporate Services Manager 538,828 55,337 109,830 711,806
Community Services Manager
646,594 27,669 37,436 719,330
Engineering Services Manager
592,710 598,642
Electrical Engineering Manager
682,857 43,831 734,052
Planning & Economic Dev. Manager
646,563 45,187 691,750
Total 4,524,818 264,950 317,592 5,155,890
The total personnel expenditure versus the total budget from 2001/02 to 2008/09 is presented in
Table 9 while the total salary budget is presented in Table 10. These figures exclude Councilors’
allowances and expenditure for contracted services.
Table 9: Personnel Expenditure versus the total budget, 2001/02 to 2008/09
Year Personnel Expenditure
Total Budget %
2001/2002 R 58,417,205 R 194,824,456 29.98
2002/2003 R 59,930,618 R 204,468,743 29.31
2003/2004 R 56,791,828 R 226,609,538 25.06
2004/2005 R 63,556,842 R 274,061,622 23.19
2005/2006 R 70,993,634 R 329,631,453 21.54
2006/2007 R 83,725,900 R 303,777,315 27.56
2007/2008 R 57,951,171 R 309,987,346 18.69
2008/2009 R67,646,316 R399,323,160 16.94

94
Table 10: GTM salary budget, 2006/07 - 2010/11 2006/2007 2007/2008 2008/2009 2009/2010 2010/2011 Basic Scale 54,635,948 64,195,387 67,084,179 77,905,942 81,801,239 Overtime 4,149,648 7,753,691 8,102,607 10,008,205 10,508,615 Pensionable Allowance
6,899,639 7,369,932 7,701,579 9,383,333 9,852,500
Annual Bonus
3,299,788 3,599,173 3,761,136 6,220,884 6,531,928
Standby Allowance
321,000 669,861 700,005 895,921 940,717
Leave Payments
4,159,658 6,216,222 6,495,952 7,448,077 7,820,481
Housing Allowance
507,464 671,184 701,387 1,030,323 1,081,839
Travel Allowance
3,487,274 3,836,497 4,009,139 5,314,839 5,349,745
Relocation Allowance
18,795 19,697 20,584 0 0
Medical Examination
20,840 15,552 16,252 20,000 21,000
Performance Incentive Schemes
1,349,722 1,396,994 1,459,859 1,867,560 1,960,938
Total (Employee related costs)
78,849,776 95,744,190 100,052,679 120,095,084 125,869,002
The contributions made to Pension funds and Medical aids from 2005/06 to 2009/10 are
presented in Table 11.
Table 11: Contributions to Pension funds and Medical Aid, 2006/07 – 2010/11 (R)
CONTRIBUTIONS 2006/2007 2007/2008 2008/2009 2009/2010 2010/2011 Medical Aid Scheme 4,568,157 5,807,254 6,068,580 3,923,697 4,119,882 Pension Schemes 10,066,755 11,123,114 11,623,654 14,165,726 14,874,012 UIF 491,142 821,289 858,247 673,509 707,184 Group Insurance 916,888 805,552 841,802 1,073,928 1,127,624

95
Table 11: Contributions to Pension funds and Medical Aid, 2006/07 – 2010/11 (R)
CONTRIBUTIONS 2006/2007 2007/2008 2008/2009 2009/2010 2010/2011 Medical Aid continued Member
0 0 0 0 0
Workers Compensation
456,853 359,005 375,161 649,929 682,425
Levies - Seta 783,893 518,228 541,548 928,605 975,035 Levies – Bargaining Council
76,714 23,463 24,519 28,326 29,742
Employee Related Costs – Social Contribution
17,360,402 19,457,905 20,333,511 21,443,720 22,515,904
GRAND TOTAL 96,210,178 115,202,095 120,386,190 141,538,804 148,384,906
3.5 Employment equity
The position in terms of representivity of the workforce profile as on 30 June 2009 is as follows (see Table 12), also See Figure 2:
Table 12: Population group of employees, 2008/09
Population group Number %
Black 537 88.5
White 63 10.3
Coloured 4 0.7
Indian 3 0.5
Total 607 100

96
As far as gender is concerned, the position as on 30 June 2009 is as follows (see Table 13):
Table 13: Gender profile, 2008/09
Gender Number % Male 434 71%
Female 173 29%
Total 607 100%
In terms of appointment of people with disabilities as on 30 June 2009, the Municipality
achieved 1.5% against the national benchmark of 2%.
3.6 Occupational Health and Safety
The Occupational Health and Safety Policy as well as the Employee Wellness Policy were
reviewed. The total number of injuries on duty reported for the period 1 July 2008 to 30 June
2009 was 10 which was 13 lower than the 23 reported during 2007/08. No occupational disease
was reported. Direct man-hour lost due to occupational injuries for the period was 446.11 hours
which was lower than the 551.15 reported during 2007/08.

97
516 OHS inspections were conducted for the period 1 July 2008 to 30 June 2009. These
inspections are conducted to monitor compliance in terms of the OHS Act at different work
stations. The OHS committee held 16 meetings and 30 officials underwent first aid training
(level 1). The OHS Officer further inducted ± 112 contractors at the bid briefing sessions on
OHS specifications and Memorandums of Agreement in terms of Section 37(2) of the OHS Act.
Furthermore, occupational hygiene monitoring equipment, i.e. gas detectors were used to check
risk factors (asphyxiation-insufficient oxygen) in confined spaces (sewage manholes), Lux meter
to check quality and adequacy of light in offices and workshops and sound level meter to check
level of occupational exposure to noise, were used to monitor these stressors (asphyxiants, poor
lighting, noise). Where deviations occurred, recommendations were given to
supervisors/superintendents to reduced stressors to acceptable levels e.g. addition and/or
replacement of lights in offices and workshops, purging of manholes before entering, repairing
noisy machinery and use of earplugs/muffs.
Lastly an OHS Risk Assessment was conducted on 6 and 7 March 2008 for all the work places in
the Greater Tzaneen Municipality by an independent Occupational Hygiene Technologist. The
purpose of conducting this statutory assessment is to identify risk and hazards associated with
activities, to assess the seriousness of these hazards and formulate a system to reduce safety risks
to a minimum or at least to an acceptable level as recommended.
3.7 Employee Assistance Programme (EAP)
The EAP Policy was reviewed to accommodate changing circumstances. A Smoking Policy was
also developed for implementation. As on 30 June 2009, 75 employees utilized the EAP to seek
assistance in resolving personal problems ranging from chronic illness (TB & HIV/Aids),
emolument attachments orders, loan sharks, marital affairs and alcohol abuse. All cases (75)
were dealt with.
Health talks regarding prevention of HIV and tuberculosis at work were given during health and
safety committees meetings to members of the committee who are having weekly health and
safety talks in their respective workplaces. Over and above the latter, HIV/AIDS, TB and

98
Diabetic awareness through the Department of Health & Social Welfare were done for the period
18 May 2009 to 8 June 2009 and 322 officials attended. Staff was tested for TB on site and
HIV/AIDS in the local clinic. 398 Employees attended the Employee Wellness Day which was
held during May 2009.

99
4. AUDITED STATEMENTS AND FINANCE RELATED INFORMATION
4.1 Financial Statements and clarifying comments for 2008/09
The 2008/09 Financial Statements was submitted within the legislated timeframes and is
herewith attached as Annexure D. Clarifying comments to the Financial Statements is
attached as Annexure E.
4.2 Auditor General Report on Financial Statements
The AG report is herewith submitted as Annexure F.
4.3 Corrective action taken in response to Audit Report for 2007/08
The programme of action in response to the AG Audit report is herewith attached as
Annexure G.
4.4 Recommendations from Audit committee
No recommendations were received from the Audit Committee in relation to the AG
report.
4.5 Assessment on arrears on municipal taxes and service charges
Arrears on rates and services for 2008/09 increased by 14.137% or R15 039 038.00.
Arrears on Rates and services per financial statements for the financial year ending
2008/09 = R121 422 656.00. Arrears on Rates and services per financial statements for
the financial year ending 2007/08 = R 106 383 618.00

100
Table 14: Arrears per service debtor 2007/08 & 2008/09
Service debtors 2007/2008 2008/2009 Rates 25,851,355 29,595,066 Electricity 20,902,754 28,182,539 Water 33,272,168 35,210,658 Sewer 7,924,495 8,663,591 Refuse 18,432,846 19,770,802 Service debtors 106,383,618 121,422,656
The increase of these arrears is due to following reasons: • High rate of unemployment and increase of the indigent register.
• Non payment of accounts by Nkowankowa and Lenyenye whose payment rate
has dropped from 33% and 43% for 2007/2008 to 31% and 39% for 2008/09
• The payment rate for both Nkowankowa and Lenyenye is below the projected
average of 60% and 72% respectively.
• Credit control actions were fully implemented in all towns except in Lenyenye
due to problems with water supply pressure that has since been resolved late in
2009.
• Debt collection was poorly implemented and eventually stopped due to technical
reasons
• Non Payment of Provincial and National departments.
• Revenue loss due to poor implementation of the Valuation roll
Action to be taken to increase payment rate:
• Full implementation of Revenue Enhancement Strategy developed by CorpMD
that includes expansion of the revenue base to formalized areas and a need to
establish a complete and correct customer database for these areas
• Full implementation of credit control and debt collection in all town
• Improving the efficiency of the Promis system and conduct a billing database
audit for existing towns.
• Correction of Valuation roll and billing of correct rates for all properties.

101
4.6 Auditor - General Report on Performance Report for 2008/09
No comments have been received from the Auditor General regarding the Annual
Performance report for 2008/09.

4.7 Grant Expenditure
Table 15: Quarterly information on grants (2008/09) Grant Details 1st Qtr 30 Sept '08 2nd Qtr 31 Dec '08 3rd Qtr 30 Mar '09 4th Qtr 30 June '09 List grants individually Received Expenditure Received Expenditure Received Expenditure Received Expenditure Free basic water - - - - 8,841,818.00 3,030,073.00 - - Provincial local government 64,200.00 29,436.00 Drought relief programme - - - - - - - - Financial management grant 500,000.00 56,874.36 79,722.75 42,880.91 790,223.40 Equitable share 29,200,438.00 29,200,438.00 21,900,329.00 21,900,329.00 42,627,807.00 42,627,807.00 Seta 12,403.50 5,045.60 344,193.45 8,328.00 100,457.00 MIG grant 3,606,000.00 3,820,242.00 8,156,000.00 9,227,145.00 5,143,000.00 1,396,341.00 3,036,000.00 6,897,008.00 Department of trade and mineral 5,693,231.00 733,934.00 648,240.00 625,376.00 886,835.00 National electrification grant 74,923.00 792,269.00 284,791.00 465,471.00 Umsombovu youth fund 38,080.00 13,090.00 Fruit & nut grant 123,714.00 894.00 337,680.00 162,487.00 Neighbourhood grant MSIG 400,000.00 3,000,000.00 Upgrading sport facilities 52,066.00

4.8 The use of donor funding support
Donor funding to the amount of R2,722,388.73 from Irish Aid was spent on 4 Tourism
projects namely building the Nkopadi Lodge, the Muhlaba Lodge, Tzana Tours and
Thabina camp
4.9 Information on long-term contracts
Payments made in terms of long-term contracts during 2008/09 are as follows:
• Motla engineering R 872 309 (Electrical installations)
• Africa meter reading R 1 777 444 (Service Meter reading)
• Tukisha trading R 3 539 747 (Fuel)
• Cetlego suppliers R 0 (Protective Clothing)
• Greenvalley contractors R 2 889 116 (Electrical maintenance)
• Siphiwe engineering R 4 621 053 (Electrical installations)
• Quality plant hire R 3 303 379 (Equipment hire)
• Selby construction R 3 624 800 (Roads maintenance)
• Waste group R 5 559 030 (Solid waste collection)
• Kgosi monene R 3 495 886 (Security)
4.10 Three year capital plan for addressing infrastructure backlogs in terms of
MIG framework
Table 16 - 18 presents the capital plan in terms of MIG from 2008/09 to 2010/11.

104
Table 16: 2008/2009 MIG BUDGET
Project Name AMOUNT
Tzaneen Landfill Site Phase 2 R3,507,087.16
Tzaneen Rural Waste R8,000,000.00
Mamitwa Taxi Rank R3,871,995.75
Marironi Access Road R5,601,498.78
Sedan Internal Street R3,642,069.17
Hweetji Access Road Phase 1 R1,981,149.14
PMU – Management R1,400,200.00
TOTAL R 28,004,000.00 (ACTUAL)
Table 17: 2009/2010 MIG BUDGET
Project Name AMOUNT
Hweetji Access Road Phase 2 R2,446,050.86
Rural Waste Removal R16,000,000.00
Pharare Access Road R2,442,001.00
Gabaza Access Road R2,779,584.00
Makhefora Access Road R3,037,200.00
Ramotshinyadi Internal Street Phase 1 R4,846,565-00
PMU- Management R1,660,600.00
TOTAL R33,212,000.00 (ESTIMATE)
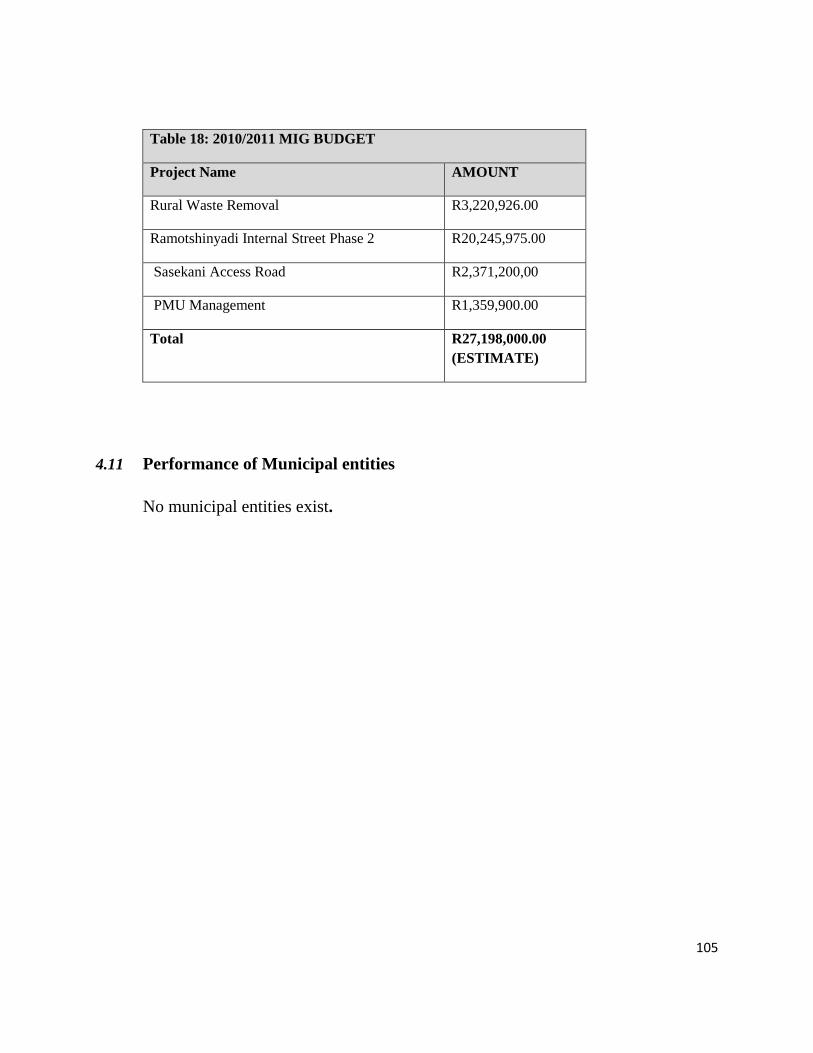
105
Table 18: 2010/2011 MIG BUDGET
Project Name AMOUNT
Rural Waste Removal R3,220,926.00
Ramotshinyadi Internal Street Phase 2 R20,245,975.00
Sasekani Access Road R2,371,200,00
PMU Management R1,359,900.00
Total R27,198,000.00 (ESTIMATE)
4.11 Performance of Municipal entities
No municipal entities exist.

106
5. FUNCTIONAL AREA SERVICE DELIVERY REPORTING
TABLE 19: GREATER TZANEEN MUNICIPALITY GENERAL INFORMATION Reporting Level Detail Total Overview: The Greater Tzaneen Municipality is located in the Limpopo Province of South Africa in
the Mopani District Municipal area. The municipality is charachterised by well established infrastructure in the towns of Tzaneen, Letsitele and Haenertsburg with the towns of Nkowankowa and Lenyenye lagging behind in this respect. The municipality also serves 125 rural villages which are spread throughout the municipal area. Although most households have access to basic water provision great backlogs exist with regard to the access to basic sanitation, electricity and waste removal services.
Information: Geography:
1 Geographical area in square kilometres 3240km² Source: SDF Demography:
2 Total population (Projected for 2006) 396,711 Source: Global Insight Database
3 Indigent Population (registered) 28,552 Households earning less than R1600 per month collectively
and are thus unable to afford basic municipal Services
4 Total number of voters 158,775
Source: IEC (VRS) 5 Aged breakdown: No %
- 65 years and over 16,009 4.04 - between 40 and 64 years 74,200 18.70 - between 15 and 39 years 173,706 43.79 - 14 years and under 132,796 33.47 Source: Global Insight Database, 2006
6 Household income: No % Less than 1,500 48,330 46 1501-3500 25,657 25 3501-6000 12,968 12 6000 or more 17,282 17 Source: Global Insight Database, 2006

107
Table 20: Function:
Executive and Council
Sub Function: N/A
Reporting Level Detail Total
Overview: Includes all activities relating to the executive and council function of
the municipality including costs associated with mayoral, councilor and committee expenses and governance.
Description of the Activity:
The function of executive and council within the municipality is administered as follows and includes:
Executive Committee: Is the head of the executive branch of the Council. Gives political direction to the executive management team. Gives recommendations to Council in respect of its executive and legislative powers. Makes recommendations to Council on proposed political structures of Council. Works closely in a co-ordinated and co-operative relation with the Municipal Manager. The Executive Committee and Mayor within the legislative framework provided by the Municipal Structures Act, the Municipal Systems Act, the Municipal Finance Management Act and subject to Council resolutions, direct and drive the transformation and development of the municipality. Is the ceremonial representative of the Council. COUNCIL : -Exercises control of its legislative and executive functions and direct its administration accordingly. Council has responsibilities as a sphere of government at Local level, as ascribed to it in terms of the Constitution, legislation and the common Law. Council monitors and takes resolutions to fulfill its role and responsibilities. -To achieve the objectives set out in section 152 of the Constitution. -Reviewal of community needs -Develop mechanisms to consult the community. -Provision of services to all its rate payers.
Analysis of the Function:
1 Councilor detail:
Total number of Councilors 67
Number of Councilors on Executive Committee 10
2 Ward detail:
Total number of Wards 34
Number of Ward Meetings
3 Number and type of Council and Committee meetings:

108
1.Infrastructure cluster 2.Sports Arts and culture cluster 3.Economic cluster 4 Finance cluster 5 Governance and Administration cluster 6 Local Labour Forum 7 Social Cluster
11 4 2 5 4 11 4
Key Performance
Area Performance During the Year, Performance Targets Against
Actual Achieved and Plans to Improve Performance Target Actual
Council and Exco Support
% Council / EXCO resolutions referred to Departments within 7-working days from council / EXCO resolution
100% 100%
% of Council agendas distributed within the 72-hours prior to the meeting
97% 100%
# of Council sittings 4 4
Ward committee support
Number of Fully functional ward committees 34 32

109
Financial Administration:
Debtor Billings:
Outstanding Debtors
Table 21: Total Debtors outstanding, 30, 60, 90, 120 and longer days (R'000s) 30 Days 60 Days 90 Days 120 Days 120 + Days Total Water
1,082,554.51 852,095.55 945,512.82 1,060,882.03 23,836,009.64
27,777,054.55 Assessment Rates 1,372,366.21 1,122,070.33 1,222,106.41 832,868.90 18,444,201.20
22,993,613.05
Electricity 3,077,814.42 1,089,209.69 749,519.38 633,384.49
6,917,119.21
12,467,047.19
Refuse Removal
804,308.59 647,352.86 570,028.23 552,614.75 13,483,213.69 16,057,518.12
Sewerage 252,857.56 198,084.70 209,295.53 203,274.21 6,016,752.08 6,880,264.08
Largest creditors:
Table 22: Five Largest Creditors for 2008/09
Creditor 30 Days 60 Days
90 Days
120 Days
120 + Days Total
Eskom 7,223,993 7,223,99
3
Quality Plant Hire 6,502,606 6,502,60
6 Infrastructure Finance Corporation 2,076,509
2,076,509
Noordelike Provinsie Wet Administrator 1,724,340
1,724,340
Development Bank of SA 1,214,132 1,214,13
2
External Loans
Table 23: External Loans 2008/09
External Loan
Loan Agency
Year approved
Loan amount
Amount repaid by June 2009
Balance due date
Interest rate
1 INCA 1998 22,711,992.76 12.50% 2 DBSA 1980 10,292,000 0 10,292,000.00 13.95% DBSA 1980 1,272,999.00 16.15%
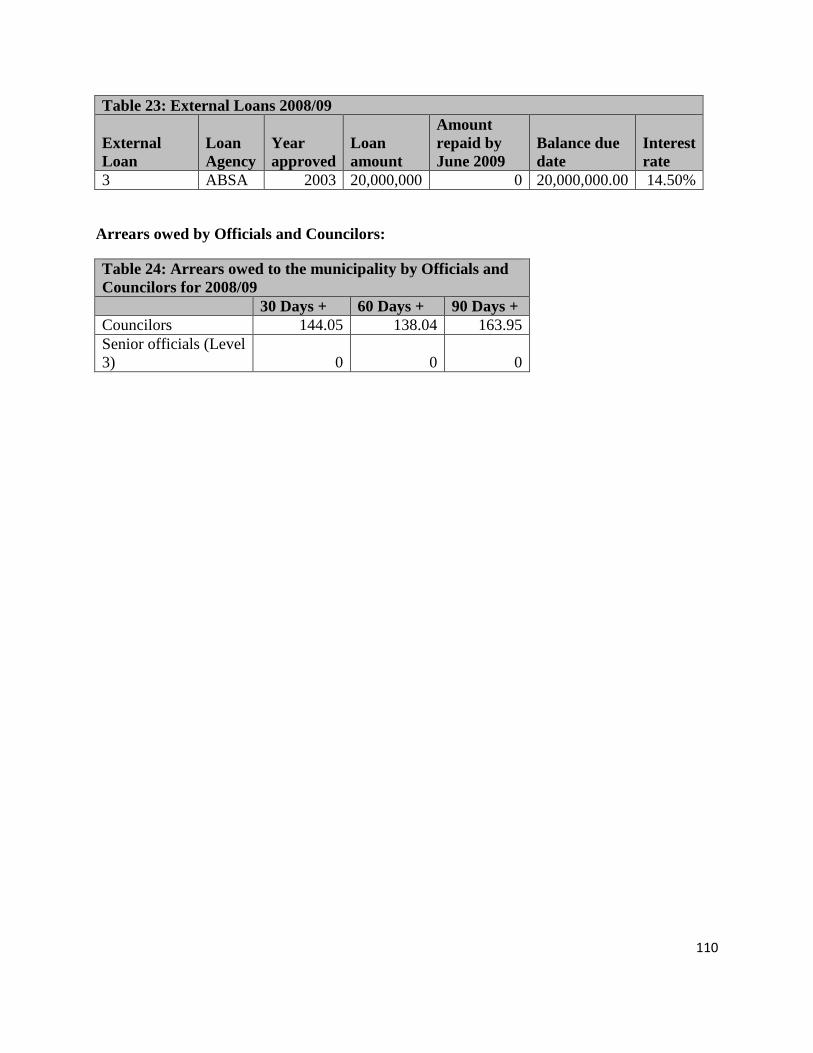
110
Table 23: External Loans 2008/09
External Loan
Loan Agency
Year approved
Loan amount
Amount repaid by June 2009
Balance due date
Interest rate
3 ABSA 2003 20,000,000 0 20,000,000.00 14.50%
Arrears owed by Officials and Councilors:
Table 24: Arrears owed to the municipality by Officials and Councilors for 2008/09 30 Days + 60 Days + 90 Days + Councilors 144.05 138.04 163.95 Senior officials (Level 3) 0 0 0

111
Table 25 Function:
Administration
Sub Function: Human Resources
Reporting Level
Detail Total
Overview: Human Resources Management in local government is a Subsection of general management which can be defined as the application of capital for the optimum utilization of human resources, machines, material, work methods, marketing, etc. with the end result that affordable and sustainable services can be realized. In Greater Tzaneen Municipality the Human Resources Division forms part of the Corporate Services Department together with the Divisions for Administrative Support, Legal Services, Communication & Marketing as well as Public Participation & Project Support.
Description of the Activity:
The function of Human Resources management within the Municipality is administered as follows and includes:
Employee Level
* Deployment (canvassing and recruitment, selection, engagement, career management, termination of services, retirement planning, pensioners' aftercare). * Administration (Corporate Service Manager's policies/procedures, job evaluation, remuneration, EAP,BC Agreements, disciplinary/grievance and retrenchment procedures) * Achievement (education, training, developmental counseling, learnerships and promotion)
Group Level * Intra Group Functioning (team development/conflict management and participation) * Inter Group Functioning (IR Structures, Trade Union relationships and Collective Bargaining)
Organizational Level * Corporate Strategy (Management and HR Planning) * Corporate Structure (organization and job design, resource utilization) Corporate Functioning (values, employee motivation, employee equity and HR surveys)
The above functions are directed to internal clients only and are confined to the area of jurisdiction of the Greater Tzaneen Municipality. However, with the devolution of powers and functions, services are rendered for the Mopani District Municipality, namely: - Water & Sewerage - Environmental Health
The Municipality has a mandate to exercise its powers and functions in terms of - - Section 156 of the Constitution - Chapter 3 of the Local Government Municipal Systems Act ( No 32 of 2000) - Section 12 Notice for Greater Tzaneen Municipality

112
The strategic objectives of this function are to:
Render HR support to Council and departments in line with the institutional strategic guidelines;
- Maintain and extend personnel administrative system.
- Ensure Skills Development.
- Enhance ability and capacity to support Occupational Health & Safety for employees.
- Ensure sound labour relations/ conflict management.
- Implementing organizational development interventions.
The key issues for 2008/2009 were:
* Filling of critical vacancies with competent staff * Smooth integration of DWAF Water & Sewerage Staff * Implementation of Task Final Outcome Report & devolving of function. * Conducting of skills audit for GTM & capturing of data * Implementation of learnerships * Extension and equipping of HR Filing Room * Securing adequate funding for training. * Reviewing and aligning of organogram to IDP.
Analysis of the Function:
The total "Cost to Employer" for the 2008/9 financial year amounted to R91.3 million.
Number and cost to employer of all municipal staff employed: R (000s)
- Senior Officials and Manager 31 15503873
- Professionals 22 7880054
- Technicians and associate professionals 19 4844569
- Clerks 129 21414298
- Service and sales workers 23 4834410
- Skilled agricultural and fishery workers 2 2125137
- Craft and related trades workers 70 8920157
- Plant and machine operators and assemblers 67 6583942
- Elementary occupations 241 19170450
Note: total number to be calculated on full-time equivalent (FTE) basis, providing detail of race and gender according to the breakdown described above. Total cost to include total salary package
604 91276890
Key Performance
Area
Performance During the Year, Performance Targets Against Actual Achieved and Plans to Improve Performance
Target Actual
Skills Development Occupational Health and Safety Employment equity HR policies
% Compliance to Workplace Skills plan # man-hours lost - due to occupational, health and safety incidents % Compliance to Employment Equity plan # Progress with the development and review of HR Policies
100% 0
100% 3
86% 446
90% 3

113
Table 26 Function: Community and Social Services
Sub Function: All inclusive
Reporting Level Detail Total
Overview:
Description of the Activity:
The function of provision of various community and social services within the municipality is administered as follows and includes:
These services extend to include Waste Management, Parks development and maintenance, Cemetery management, Community facilities and Libraries but do not take account of Museums, Child care and aged care which resides within the jurisdiction of provincial government. The municipality has a mandate to:
1. Provide waste removal services to all households 2. To develop and maintain parks and open spaces 3. To develop and maintain cemeteries 4. To develop and maintain community halls and recreational facilities
The strategic objectives of this function are to:
<List here>
The key issues for 2008/09 were:
<List here>
Analysis of the Function:
<Provide statistical information on (as a minimum):>
1 Nature and extent of facilities provided: no of facilities: no of users:
- Library services 3 94,863
- Museums and art galleries 1 600 visitors per
month
- Other community halls/facilities 2.00 650 bookings
- Cemeteries and crematoriums 6 cemeteries in
proclaimed
towns & 90 in
rural area
273 funerals
- Child care (including creches etc) 0 0
- Aged care (including aged homes, home help) 1 33 units
- Schools 0 0
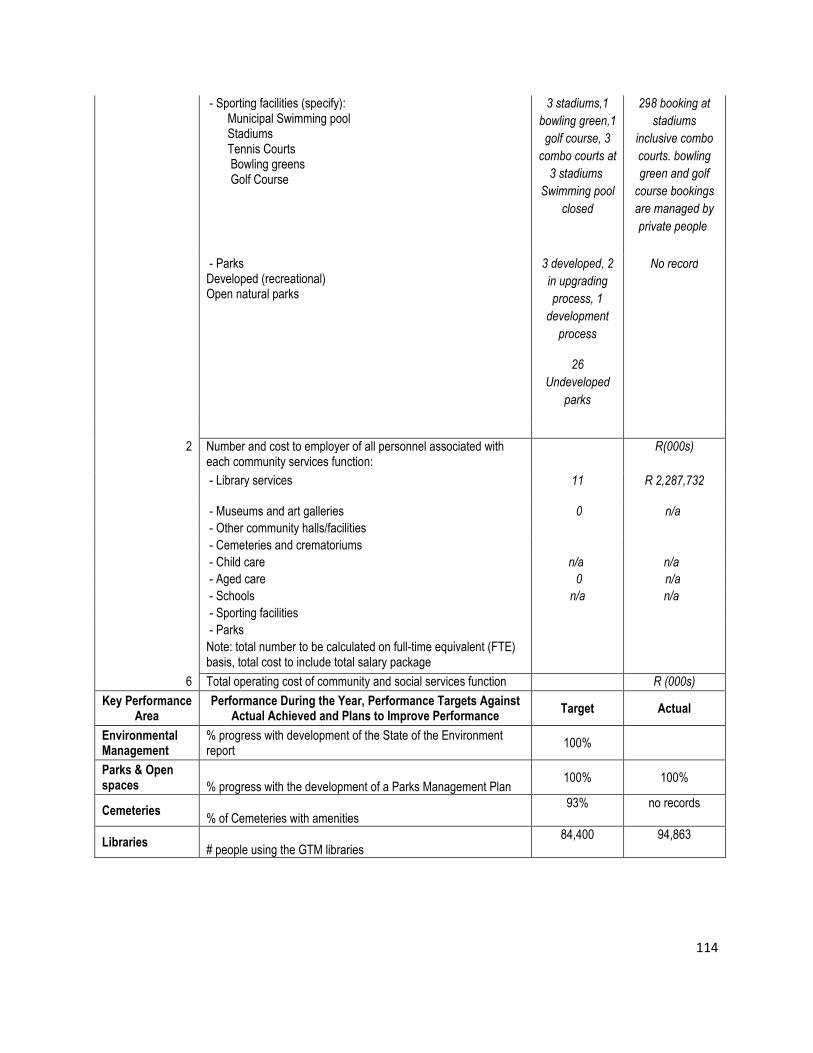
114
- Sporting facilities (specify): Municipal Swimming pool Stadiums Tennis Courts Bowling greens Golf Course
3 stadiums,1
bowling green,1
golf course, 3
combo courts at
3 stadiums
Swimming pool
closed
298 booking at
stadiums
inclusive combo
courts. bowling
green and golf
course bookings
are managed by
private people
- Parks Developed (recreational) Open natural parks
3 developed, 2
in upgrading
process, 1
development
process
26
Undeveloped
parks
No record
2 Number and cost to employer of all personnel associated with each community services function:
R(000s)
- Library services 11 R 2,287,732
- Museums and art galleries 0 n/a
- Other community halls/facilities
- Cemeteries and crematoriums
- Child care n/a n/a
- Aged care 0 n/a
- Schools n/a n/a
- Sporting facilities
- Parks
Note: total number to be calculated on full-time equivalent (FTE) basis, total cost to include total salary package
6 Total operating cost of community and social services function R (000s)
Key Performance Area
Performance During the Year, Performance Targets Against Actual Achieved and Plans to Improve Performance
Target Actual
Environmental Management
% progress with development of the State of the Environment report
100%
Parks & Open spaces % progress with the development of a Parks Management Plan
100% 100%
Cemeteries % of Cemeteries with amenities
93% no records
Libraries # people using the GTM libraries
84,400 94,863

115
Table 27 Function:
Planning and Development
Sub Function: Economic Development
Reporting Level Detail Total
Overview: To promote and network economic opportunities that will ensure job creation, poverty alleviation and investment for economic growth
Description of the Activity:
The function of economic planning / development within the municipality is administered as follows and includes:
1. Ensure social and economic development as prioritized in the IDP 2. Establish capacity and promote interdepartmental collaboration 3. Establish LED forum to maximize efforts and mobilize resources 4. Build and maintain the economic database of the Municipality 5. Identify and market new economic opportunities 6. Improve the quality of life and sustainable livelihoods 7. Network to create sustainable partnerships 8. Mobilize and motivate individuals and communities to initiate economic initiatives
These services extend to include Socio-Economic Development, Tourism and LED. The municipality has a mandate to:
The Municipality has a mandate to exceed its constitutional mandate in delivering developmental services to its people through partnerships with stakeholders
The strategic objectives of this function are to:
1. Development of the Agriculture Value Chain 2. Development and promotion of Tourism 3. Trade Development and Business Diversification 4. Development of the Fruit and Nut Value Chain Cluster
The key issues for 2008/09 were:
1. Mefakeng Tourism development 2. Hawkers Development 3. Establishment of the Economic Development Agency 4. Feasibility study development 5. SMME Support and development 6. Agriculture Support 7. Land Claims Support
R13M R750,000 R7m R,8M N/A N/A
Analysis of the Function:
1 Number and cost to employer of all economic development personnel: Number R (000s)
- HOD 1 R710 533
- Senior Admin Officer 1 R337 064
- LED Officer 1 R225 550
- Tourism Officer 1 R780 99
- Tourism Information Officer 1 R193,726
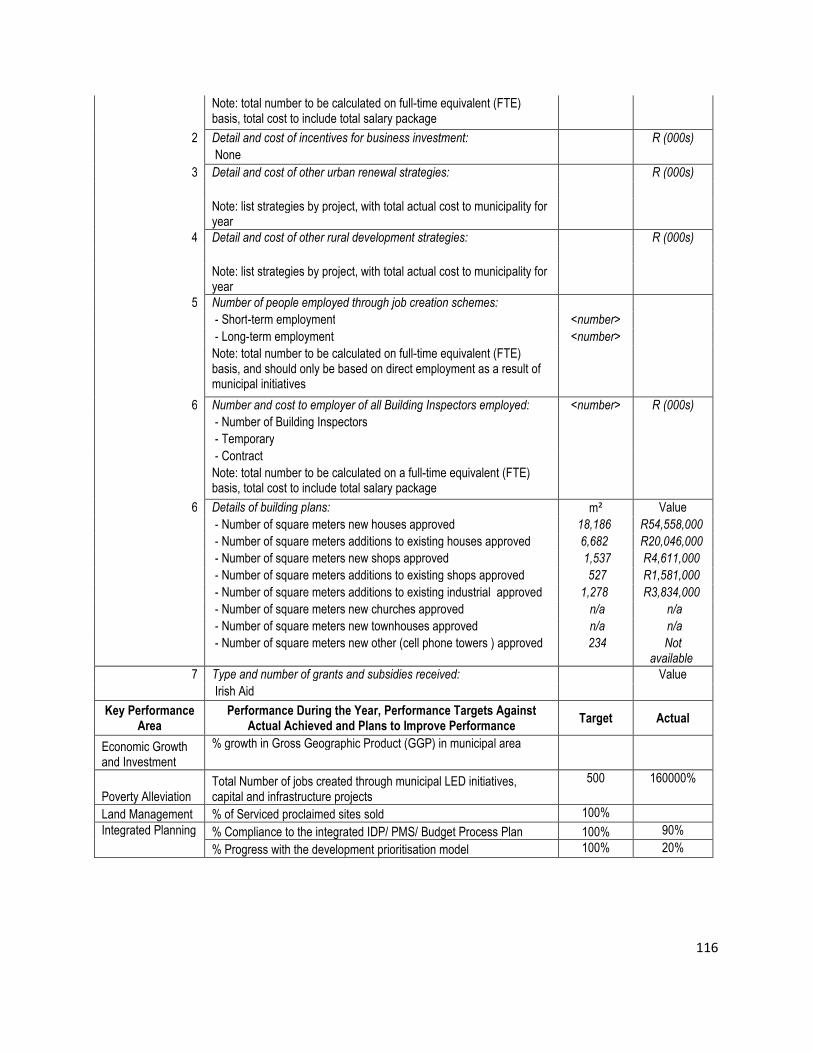
116
Note: total number to be calculated on full-time equivalent (FTE) basis, total cost to include total salary package
2 Detail and cost of incentives for business investment: R (000s)
None
3 Detail and cost of other urban renewal strategies: R (000s)
Note: list strategies by project, with total actual cost to municipality for year
4 Detail and cost of other rural development strategies: R (000s)
Note: list strategies by project, with total actual cost to municipality for year
5 Number of people employed through job creation schemes:
- Short-term employment <number>
- Long-term employment <number>
Note: total number to be calculated on full-time equivalent (FTE) basis, and should only be based on direct employment as a result of municipal initiatives
6 Number and cost to employer of all Building Inspectors employed: <number> R (000s)
- Number of Building Inspectors
- Temporary
- Contract
Note: total number to be calculated on a full-time equivalent (FTE) basis, total cost to include total salary package
6 Details of building plans: m² Value
- Number of square meters new houses approved 18,186 R54,558,000
- Number of square meters additions to existing houses approved 6,682 R20,046,000
- Number of square meters new shops approved 1,537 R4,611,000
- Number of square meters additions to existing shops approved 527 R1,581,000
- Number of square meters additions to existing industrial approved 1,278 R3,834,000
- Number of square meters new churches approved n/a n/a
- Number of square meters new townhouses approved n/a n/a
- Number of square meters new other (cell phone towers ) approved 234 Not available
7 Type and number of grants and subsidies received: Value
Irish Aid
Key Performance Area
Performance During the Year, Performance Targets Against Actual Achieved and Plans to Improve Performance
Target Actual
Economic Growth and Investment
% growth in Gross Geographic Product (GGP) in municipal area
Poverty Alleviation Total Number of jobs created through municipal LED initiatives, capital and infrastructure projects
500 160000%
Land Management % of Serviced proclaimed sites sold 100%
Integrated Planning % Compliance to the integrated IDP/ PMS/ Budget Process Plan 100% 90%
% Progress with the development prioritisation model 100% 20%

117
Table 28: Function: Housing Sub Function: N/A
Reporting Level
Detail Total
Overview:
Description of the Activity:
The function of provision of housing within the municipality is administered as follows and includes:
The aim of the land, property and housing services is to Manage and administer Municipal land (Land sale. Lease, Donations, expropriation of land and negotiate land purchase)
Administer the allocation of beneficiaries in Pioneers Old Age Home.
Analysis of the Function:
1 Number and cost of all personnel associated with provision of municipal housing:
number R (000s)
- Professional (Architects/Consultants)
- Field (Supervisors/Foremen)
- Office (Clerical/Administration) 2
- Non-professional (blue collar, outside workforce)
- Temporary
- Contract
Note: total number to be calculated on full-time equivalent (FTE) basis, total cost to include total salary package. Professional includes project design, Field includes all tradespersons.
2 Number and total value of housing projects planned and current: number R (000s)
- Current (financial year after year reported on)
- Planned (future years)
Note: provide total project and project value as per initial or revised budget
3 Total type, number and value of housing provided: number R (000s)
RDP 574 54650.00 per unit
Note: total number and total value of housing provided during financial year
4 Total number and value of rent received from municipal owned rental units 2 <value>
<list details, including number of units handed over to residents> <total> <value>
5 Estimated backlog in number of (and costs to build) housing: Total 40 000
Cost R2,186,000,000
6 Type of habitat breakdown: 2001 2008
- number of people living in a house or brick structure 56,393
- number of people living in a traditional dwelling 23,154
- number of people living in a flat in a block of flats 714

118
- number of people living in a town/cluster/semi-detached group dwelling 461
- number of people living in an informal dwelling or shack 3,487
- number of people living in a room/flatlet 3,330
7 Type and number of grants and subsidies received: number R (000s)
None
8 Total operating cost of housing function R (000s)
Key Performance
Area
Performance During the Year, Performance Targets Against Actual Achieved and Plans to Improve Performance
Target Actual
% of annual beneficiaries verified 100% 100%
Housing Development
# Trainers trained on consumer housing education 30 350
% PHP housing complaints or issues raised attended to within 3 working days 100% 100%
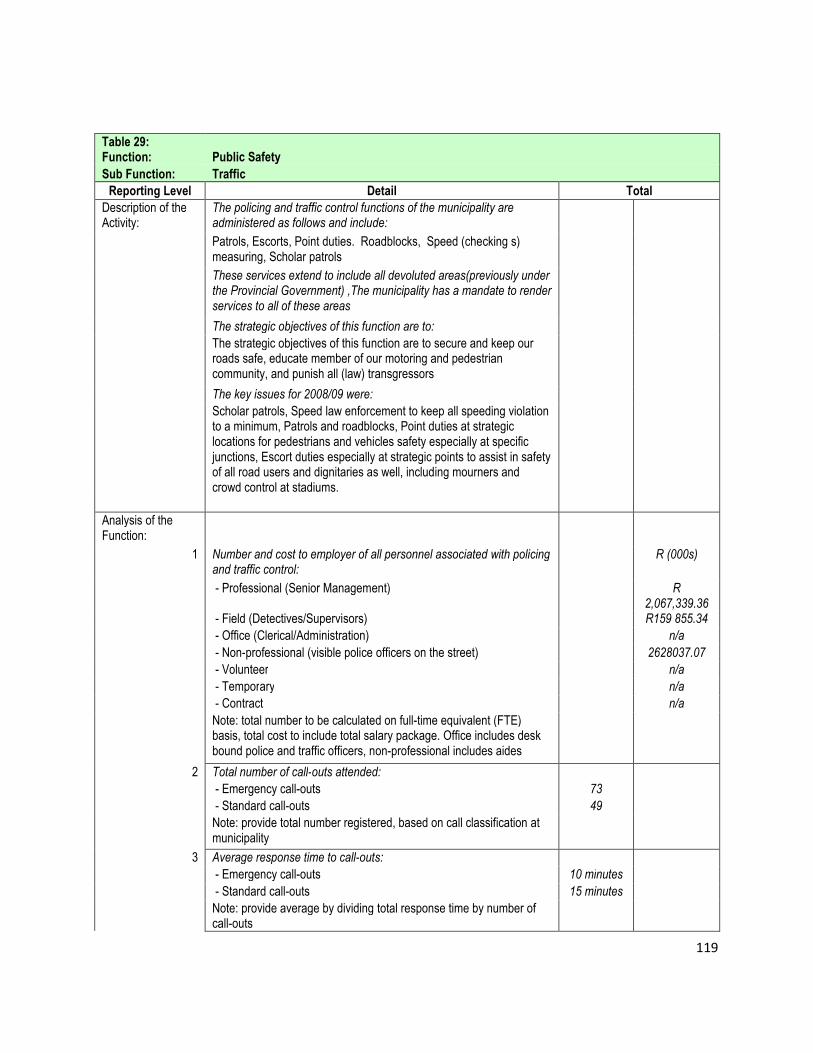
119
Table 29: Function: Public Safety
Sub Function: Traffic
Reporting Level Detail Total
Description of the Activity:
The policing and traffic control functions of the municipality are administered as follows and include:
Patrols, Escorts, Point duties. Roadblocks, Speed (checking s) measuring, Scholar patrols
These services extend to include all devoluted areas(previously under the Provincial Government) ,The municipality has a mandate to render services to all of these areas
The strategic objectives of this function are to:
The strategic objectives of this function are to secure and keep our roads safe, educate member of our motoring and pedestrian community, and punish all (law) transgressors
The key issues for 2008/09 were:
Scholar patrols, Speed law enforcement to keep all speeding violation to a minimum, Patrols and roadblocks, Point duties at strategic locations for pedestrians and vehicles safety especially at specific junctions, Escort duties especially at strategic points to assist in safety of all road users and dignitaries as well, including mourners and crowd control at stadiums.
Analysis of the Function:
1 Number and cost to employer of all personnel associated with policing and traffic control:
R (000s)
- Professional (Senior Management)
R 2,067,339.36
- Field (Detectives/Supervisors)
R159 855.34
- Office (Clerical/Administration) n/a
- Non-professional (visible police officers on the street)
2628037.07
- Volunteer n/a
- Temporary n/a
- Contract n/a
Note: total number to be calculated on full-time equivalent (FTE) basis, total cost to include total salary package. Office includes desk bound police and traffic officers, non-professional includes aides
2 Total number of call-outs attended:
- Emergency call-outs 73
- Standard call-outs 49
Note: provide total number registered, based on call classification at municipality
3 Average response time to call-outs:
- Emergency call-outs 10 minutes
- Standard call-outs 15 minutes
Note: provide average by dividing total response time by number of call-outs

120
4 Total number of targeted violations eg: traffic offences: <total>
Speeding, Parking offences, Drunken driving, Cell phone offences, Safety belt offences, Driving licenses offences, Disregard for Road Traffic signs/ Markings
5 Total number and type of emergencies leading to a loss of life or disaster:
6 Type and number of grants and subsidies received: <total> R (000s)
No grants/subsidies
R12 296 589
Note: total value of specific public safety grants actually received during year to be recorded over the five quarters - Apr to Jun last year, Jul to Sep, Oct to Dec, Jan to Mar, Apr to Jun this year.
7 Total operating cost of police and traffic function
Key Performance Area
Performance During the Year, Performance Targets Against Actual Achieved and Plans to Improve Performance
Target Actual
# road safety interventions 10
Traffic Law Enforcement
% capturing of fines within 1 working day 100% 100%
# of rural school visits for road safety education 3 3

121
Table 30: Function: Community Services
Sub Function: Licensing
Reporting Level Detail Total
Overview: This includes all activities relating to vehicle and driver related licenses
Traffic fine payments. Trade license applications and all temporary advertisements and dog licenses applications
Description of the Activity:
The Licensing and Testing functions of the municipality are administered as follows and include:
Issue learners and drivers licenses and all vehicle registration and licenses
These services extend to include <function/area>, but do not take account of <function/area> which resides within the jurisdiction of <national/provincial/other private sector> government. The municipality has a mandate to:
Assist the issue of all vehicle and driver related licenses
The strategic objectives of this function are to:
Service deliveries
Analysis of the Function:
The key issues for 2008/09 were:
1 Bribery and Corruption ,shortage of staff and overcrowding of applicants at testing stations from outside GTM boundaries
number R (000s)
<Provide statistical information on (as a minimum):>
Number and cost to employer of all personnel associated with Licensing and Testing:
- Professional (Senior Management) 1
- Field (Detectives/Supervisors) 6
- Office (Clerical/Administration) 36
2 - Temporary 0
- Contract 0
3 Note: total number to be calculated on full-time equivalent (FTE) basis, total cost to include total salary package. Office includes desk bound police and traffic officers, non-professional includes aides
R (000s)
Key Performance Area
Number of licenses renewed & issued per category Target Actual
Licensing 1. Learners licenses issued 2. Drivers’ licenses issued 3. Number of vehicle licensed 4. Number of vehicles registered 5. Number of permits issued
6221 14918 41169 9951 262
Total operating cost of the Licensing function R16.295.252
Performance During the Year, Performance Targets Against Actual Achieved and Plans to Improve Performance
% complaints for driver related licenses resolved within 2-days 100%
% complaints for vehicle related licenses resolved within 2-days 100%
R-value generated for vehicle registration (Agency agreement) R3.885.072
R-value generated by the issuing of learners and drivers licenses R8.677.681

122
Table 31 Function: Waste Management
Sub Function: Solid Waste
Reporting Level Detail Total
Overview: Includes refuse removal, solid waste disposal and landfill, street cleaning and recycling
Current Target
1. Waste Minimization 1.1. Recycling at landfill. 1.2. Recycling at premises. 1.3. Re-use. (Bulk wood chipping) 1.4. Compost terrain. 1.5. Rural Waste Minimization
5434 m³ 1 project 0 project 100% 8 school
6060 m³ 2 projects 1 project 100% 24 schools
2. Treatment and Disposal. 2.1. Disposal at permitted of landfill / facilities. 2.2. Operational P.O.F.`s at all towns
100% 100%
100% 100%
3. Collection & Transportation. 3.1. Curbside collections. 3.2. Bulk removals. 3.3. H.C.W. removals 3.4. Toxic waste removals. 3.5. Litterpicking / as per routes-schedules. 3.6. Replacement of fleet / stand-by vehicles.
- 100% 100% 100% 10% 100% 100%
- 100% 100% 100% 100% 100% 100%
4. Pollution control 4.1. Operationalisation of all public toilet-blocks 4.2. Effective law-enforcement
98% 0%
100% 100%
5. Management & I.C.T. - Systems 5.1. Electronic capturing of info. 5.2. External funding of un-funded projects.(L.E.D.) 5.3. M.I.S. info-systems. 5.4. I.T. Networking to all sub-offices. 5.5. Solid waste software development. 5.6. Solid waste information distribution to clients. 5.7. Sufficient monetary provision
0 systems 0 % 0 systems 80 % 0 systems 100 % R24.31 milj
1 system 100 % 1 system 100 % 1 systems 100% R 29.8 milj
Description of the Activity:
The refuse collection functions of the municipality are administered as follows and include:
1. LEVEL OF SERVICE. 1.1. A full curbside collection service is rendered to all communities in the following suburbs of Greater Tzaneen Municipality, which represents only 11% of all households viz:- 1.1.1. Nkowankowa 1.1.2. Lenyenye 1.1.3. Letsitele 1.1.4. Haenertsburg 1.1.5. Tzaneen 1.2. 160 000 m3 non-compacted solid waste of all residential, business, industrial and health care waste are removed @ annum.

123
3. BACKLOGS 3.1. 84% of households in the total rural areas, representing ±75.537 households 3.2. The cost to address the service in full with immediate effect, will be approximately R75, 000,000-00 per annum for all 129 x villages. 4. GEOGRAFIC DISTRIBUTION .4.1. The jurisdiction area is divided by the main roads from Politsi via Tzaneen, Tarentaalrand, Letsitele and Trichardtsdal, in a Northern and Southern service region
6. WASTE MINIMIZATION .5.1. Recycling programme envisage 1 x project/annum5.1.1. 2007/08 = Tzaneen C.B.D5.1.2. 2008/09 = Nkowankowa C.B.D.5.1.3. 2009/10 = Lenyenye C.B.D.5.1.4. 2010/11 = Letsitele/H/burg C.B.D.5.1.5. 1 X Residential project / annum from 2010 / 20115.2. Presently all organic waste (garden) is treated at the composting site adjacent to the landfill @ present ± 15,436 m3 2007/2008 5.3. Rural Waste Programme based on on-going-in-school projects subjected to tender awarding.5.4. Futuristic gas end use viability study / closure permit application. 5.5. Recycling at the Tzaneen Landfill [5,343 m3 / annum.]5.6. Recycling presently takes place at the source of origin and are removed by private enterprise from industrial and business premises [56,590 m3 / annum]
6. LITTER PICKING. (MAIN ROADS & STREETS) 6.1. All streets & main roads are cleaned on a regular and period schedule from all debris and solid waste [5312 m3 / annum ] 6.2. All public taxi - & bus ranks are continuously serviced and cleaned on a pre-determined schedule. 6.3. THE SERVICES MUST BE EXTENDED TO INCLUDE:- 6.3.1. ± 129 Villages or another 80,034 residential stands, which are situated within the jurisdiction area of G.T.M.
7. DROP-OFF-FACILITIES.{OFF- LOADING for general public & NOT A TRANSFERSTATION} 7.1. Drop-off-facilities each at viz:-7.1.1. Nkowankowa7.1.2. Lenyenye7.1.3. Letsitele7.1.4. Haenertsburg7.2. 6m³ skips utilized for this purpose and are cleaned on a daily basis at the Tzaneen Regional Landfill.7.3. All P.O.F.`s (public offloading facilities) are managed by a MSP (Waste Group Ingwe )7.4. No municipal employee utilized at these facilities.
8. PUBLIC TOILETS. 8.1. 10 x public toilet blocks managed by Tzaneen Solid Waste 8.2. 6 x blocks at Tzaneen 8.3. 1x block at Nkowankowa 8.4. 1x block at Letsitele 8.5. 1x block at Haenertsburg 8.6. 1x block at Lenyenye (Non operational) 8.7. Blocks open for 12 hours daily 8.9. Cleaning and disinfecting of blocks every 2.5 hours 8.10. Provision of toilet paper to public free

124
9. LANDFILL SITE. 9.1. 1x Regional landfill, 4 km. from Tzaneen. [11 x ha in size.] 9.2. Fully permitted from 1/12/2004 as a G.M.B- site. 9.3. Landfill being managed by a M. S. P. (Waste Group Ingwe) in compliance with spec’s from the I.W.M.P.[Integrated Waste Management Plan ] 9.4. Managed in accordance with construction plan – cell building method.
10 The mandate of GTM 10.1 Is to provide all households with a basic removal service to protect the environment for the benefits of future and present generations through legislative and other measures to prevent pollution and ecological degradation promote conservation to secure sustainable development:-10.2 The International context where the I.W.M.P. forms part of the:-§ Strategic goals of the Rio declaration§ The Agenda 21 principles§ Kyoto protocol§ 19 x other International agreements10.3 The National context:-§ The Bill of Rights (Section 24) of the National Constitution provides as follows:-“Everyone has the right to an environment that is not harmful to their health or well-being§ The Environmental Management Act§ The Environmental Waste Management Act§ Environmental Conservation Act 10.4 The Tzaneen Integrated Waste Management System must give effect to these requirements of the Constitution
The strategic objectives of this function are to:
1. WASTE MINIMIZATION 1.1. Recycling. 1.1. Composting. 1.1. Re-use. 1.1. Rural Waste Minimization {On-going-school-project} 2. COLLECTION AND TRANSPORTATION. 2.1. Curbside collection. 2.2. Bulk removals. 2.3. Health Care Waste removals. 2.4. Toxic waste removals. 2.5. Litter picking. 2.6. Vehicle fleet management. 3. DISPOSAL AND TREATMENT. 3.1. Permitted treatment facilities. 3.2. Permitted disposal sites. 3.3. Public off-loading facilities. 4. POLLUTION CONTROL. 4.1. Operationalisation of Toilet-blocks 4.2. Effective Law-Enforcement. 4.3. Communication Operations 5. MANAGEMENT & I.C.T.SYSTEMS. 5.1. Appropriate I.T. hard- & software for all sub-offices. 5.2. Effective admin- system. { personnel & procedures} 5.3. Information distribution to clients.
The key issues for 2008/09 are: Current Target
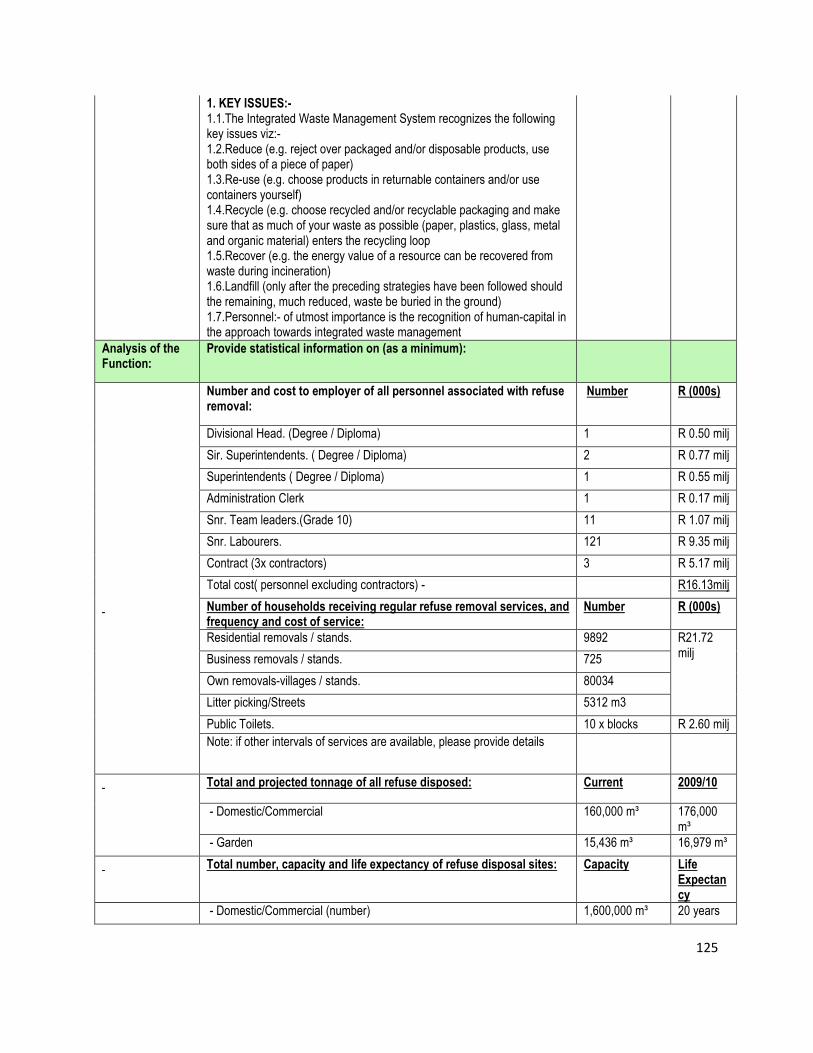
125
1. KEY ISSUES:- 1.1.The Integrated Waste Management System recognizes the following key issues viz:- 1.2.Reduce (e.g. reject over packaged and/or disposable products, use both sides of a piece of paper) 1.3.Re-use (e.g. choose products in returnable containers and/or use containers yourself) 1.4.Recycle (e.g. choose recycled and/or recyclable packaging and make sure that as much of your waste as possible (paper, plastics, glass, metal and organic material) enters the recycling loop 1.5.Recover (e.g. the energy value of a resource can be recovered from waste during incineration) 1.6.Landfill (only after the preceding strategies have been followed should the remaining, much reduced, waste be buried in the ground) 1.7.Personnel:- of utmost importance is the recognition of human-capital in the approach towards integrated waste management
Analysis of the Function:
Provide statistical information on (as a minimum):
Number and cost to employer of all personnel associated with refuse removal:
Number R (000s)
Divisional Head. (Degree / Diploma) 1 R 0.50 milj
Sir. Superintendents. ( Degree / Diploma) 2 R 0.77 milj
Superintendents ( Degree / Diploma) 1 R 0.55 milj
Administration Clerk 1 R 0.17 milj
Snr. Team leaders.(Grade 10) 11 R 1.07 milj
Snr. Labourers. 121 R 9.35 milj
Contract (3x contractors) 3 R 5.17 milj
Total cost( personnel excluding contractors) - R16.13milj
Number of households receiving regular refuse removal services, and frequency and cost of service:
Number R (000s)
Residential removals / stands. 9892 R21.72 milj
Business removals / stands. 725
Own removals-villages / stands. 80034
Litter picking/Streets 5312 m3
Public Toilets. 10 x blocks R 2.60 milj
Note: if other intervals of services are available, please provide details
Total and projected tonnage of all refuse disposed: Current 2009/10
- Domestic/Commercial 160,000 m³ 176,000 m³
- Garden 15,436 m³ 16,979 m³
Total number, capacity and life expectancy of refuse disposal sites: Capacity Life Expectancy
- Domestic/Commercial (number) 1,600,000 m³ 20 years

126
- Garden (number) 180,000 m3 20 years
Reporting Level Detail Total
Anticipated expansion of refuse removal service: Households R (000s)
- Domestic/Commercial 100 H/h`s R0.09 milj.
- Garden 0 0
Free Basic Service Provision:
- Quantity (number of households affected) 3825 R 3.2 milj
- Quantum (value to each household) 1 R70.39 p.m.
Total operating cost of solid waste management function R (000s)
Collections & transportation; Litter picking; Public Toilet Management; Disposal
R24, 31 milj.
Key Performance Area
Performance During the Year, Performance Targets Against Actual Achieved and Plans to Improve Performance
Target Actual
Waste minimisation
Number of waste collection points in rural areas (schools) 24 24
Collection and Transportation
Number of waste collection points in urban areas (stands) R-Value of Free Basic waste removal
13,477 R 3.2 mil
13,477 R 3.2 mil

127
Table 32: Function: Waste Water Management
Sub Function: Sewerage etc
Reporting Level Detail Total Cost
Overview: Includes provision of sewerage services not including infrastructure and water purification, also includes toilet facilities
Description of the Activity:
The sewerage functions of the municipality are administered as follows and include:
Sewer is received from domestic industrial waste and other sources of waste water then purified up to the acceptable legal standard and discharged to the river
The municipality has a mandate to:
Render provisioning wastewater and sanitation services to its communities.
The strategic objectives of this function are to:
(1) Render a service with cost recovery on a sustainable manner. (2) This service is provided on a 24 hour basis to all urban areas of Tzaneen, Nkowankowa, Lenyenye, Haenertsburg and Letsitele. (3) The service includes a sustainable maintenance support on a 24 hour basis, wherein currently we are the Water Service Provider at this stage and Mopani District is the Water Service Authority.
The key issues for 2008/09 are:
Lack of enough budget which hinders service delivery.
Analysis of the Function:
1 Number and cost to employer of all personnel associated with sewerage functions:
R 1,215,109
- Professional (Engineers/Consultants) 2 R 0.35 M
- Field (Supervisors/Foremen) 4 R 0.32M
- Office (Clerical/Administration) 2 R 0.41
- Non-professional (blue collar, outside workforce) 24 R 0.13
- Temporary
- Contract
Note: total number to be calculated on full-time equivalent (FTE) basis, total cost to include total salary package
2 Number of households with sewerage services, and type and cost of service:
R (000s)
- Flush toilet (connected to sewerage system) 10000 R17,500,000
- Flush toilet (with septic tank) 260 R455,000.00
- Chemical toilet 0 0
- Pit latrine with ventilation 3000 R19,500,00
- Pit latrine without ventilation 0 0
- Bucket latrine 0 0

128
- No toilet provision 10000 R17,500,000
Note: if other types of services are available, please provide details
3 Anticipated expansion of sewerage: R (000s)
- Flush/chemical toilet 3500 R6,125,000
- Pit latrine 1682 R10,933,000
- Bucket latrine 0
- No toilet provision 0
Note: provide total number of households anticipated to benefit and total additional operating cost per year to the municipality
4 Free Basic Service Provision:
- Quantity (number of households affected) 30,030
- Quantum (value to each household) 1750
Reporting Level Detail Total Cost
Note: Provide details of how many households receive the FBS provision, and the average value it means per household. Describe in detail the level of Free Basic Services provided.
Revenue
5 Total operating cost of sewerage function R (000s)
Key Performance Area
Performance During the Year, Performance Targets Against Actual Achieved and Plans to Improve Performance
Target Actual
Sanitation % of Households without RDP standard sanitation service % Progress with the completion of a Water and Sanitation Master Plan % of Indigent households with access to free basic sanitation # of Households that received sanitation services
10% 10% 90% 6121
0,5% 0% 71% 6121

129
Table 33: Function: Road Transport
Sub Function: Roads
Reporting Level Detail Total Cost
Overview:
Description of the Activity:
The road maintenance and construction responsibilities of the municipality are administered as follows and include:
To construct and maintain existing ,new roads and storm water within its area of jurisdiction
The strategic objectives of this function are to:
to create and maintain all access roads and storm water management within greater Tzaneen municipality
The key issues for 2008/09 were:
internal street and funeral roads graded total km 1779 km 1779km
Regravelling total number of km 24 km 24km
new tarred roads total km 0.5km 0.5km
patchwork for existing roads total number or square meters 7510.92m2
7510.92m2
Stone pitching for sand seal roads 5994m2
Additional stone pitching to various village to control storm water within GTM
4456m2
Road marking to existing roads total number of square meters 8861m2
8861m2
Analysis of the Function:
<Provide statistical information on (as a minimum):>
1 Number and cost to employer of all personnel associated with road maintenance and construction:
8484815
-One Head of division 1
Two senior superintendant 2
- Four Field (Supervisors/Foremen) 4
- Office (Clerical/Administration) 1
- Non-professional (blue collar, outside workforce) 28
- Temporary 1
- Contract 1
Note: total number to be calculated on full-time equivalent (FTE) basis, total cost to include total salary package
2 Total number, kilometers and total value of road projects planned and current:
R (000s)
- New bitumenised (number)
- Existing re-tarred (number)
- New gravel (number)
- Existing re-sheeted (number)

130
Note: if other types of road projects, please provide details
3 Total kilometres and maintenance cost associated with existing roads provided
R (000s)
- Tar 0.5km 671194
- Gravel 24km
Note: if other types of road provided, please provide details
4 Average frequency and cost of re-tarring, re-sheeting roads 1992598
- Tar 7510m2 748432
- Gravel 1779km 3241791
Note: based on maintenance records
5 Estimated backlog in number of roads, showing kilometers and capital cost
- Tar
- Gravel
Note: total number should appear in IDP, and cost in future budgeted road construction programme
6 Type and number of grants and subsidies received: R (000s)
Municipal Infrastructure Grant <total> <value>
Note: total value of specific road grants actually received during year to be recorded over the five quarters - Apr to Jun this year, Jul to Sep, Oct to Dec, Jan to Mar, Apr to Jun this year.
7 Total operating cost of road construction and maintenance function
Key Performance Area
Performance During the Year, Performance Targets Against Actual Achieved and Plans to Improve Performance
Target Actual
Roads and Storm water Infrastructure
% increase in storm water drainage per km roads 80% 80%
Km of transportation routes upgraded 180 0
Km of new road infrastructure provided 11 0
% of Capital budget allocated for roads spent 100% 88%

131
Table 34: Function: Water
Sub Function: Water Distribution
Reporting Level Detail Total Cost
Overview: Includes the bulk purchase and distribution of water
Description of the Activity:
The water purchase and distribution functions of the municipality are administered as follows and include:
Purchasing, Abstracting, Purification and supplying to both rural and urban segments within GTM through water reticulation network and water tankers.
The municipality has a mandate to:
Render the provisioning of Water services within the area of its jurisdiction.
The strategic objectives of this function are to:
Plan, Manage and deliver water and wastewater services to the communities
The key issues for 2008/09 are:
Insufficient budget which prevents the unit to fulfill all its needs and the needs of the communities.
1 Number and cost to employer of all personnel associated with the water distribution function:
R 5.24 M
- Professional (Engineers/Consultants) 2 R 0.94
- Field (Supervisors/Foremen) 4 R 1.10
- Office (Clerical/Administration) 2 R 0.39
- Non-professional (blue collar, outside workforce) 54 R 2.81
- Temporary 0
- Contract 0
2 Percentage of total water usage per month
266727 R 2,982,359.2
3 Total volume and cost of bulk water purchases in kilolitres and rand, by category of consumer
4152456 R1,272,570.12
4 Total volume and receipts for bulk water sales in kilolitres and rand, by category of consumer:
- Category 1 Residential - Res- Free Basic
2468100 -
R 30,309,311.21 R 23,166,309.64
- Category 2 Business 192179 R 1,698,730.03
- Category 3 Industrial 255628 R 176,4327.60
- Category 4 Departmental - Category 4 State - Category 4 Educational - Category 4 Other
39755 140030 94111 10924
R 378,668.59 R 1,082,762.46 R 500,041.73 R 54,468.76
5 Total year-to-date water losses in kilolitres and rand KL Cost
269916 R 24,111.1

132
Reporting Level Detail Total Cost
6 Number of households with water service, and type and cost of service:
10000 R 18,407,704
- Piped water inside dwelling 3267 R 6,043,950.
- Piped water inside yard 1850 R 16,000,000
- Piped water on community stand: distance < 200m from dwelling
1250 R 30,000.00
- Piped water on community stand: distance > 200m from dwelling
3000 R 64,500.00
- Borehole 267 R 5,340,000.00
- Spring 0
- Rain-water tank 0
Note: if other types of services are available, please provide details
7 Number and cost of new connections: Revenue R (000s)
283 R 523,550.00
8 Number and cost of Disconnections
890
R 477,900.00
and reconnections: 885 R 480,600.00
9 Number and total value of water projects planned and current:
- Current (financial year after year reported on) 1 R1,000,000
- Planned (future years) 2 R4,000,000
Note: provide total project and project value as per initial or revised budget
10 Anticipated expansion of water service:
- Piped water inside dwelling Mopani District
Municipality Functions
WSA
- Piped water inside yard
- Piped water on community stand: distance < 200m from dwelling
- Piped water on community stand: distance > 200m from dwelling
56 R 2,000,000
- Borehole 0
- Spring 0
- Rain-water tank 0
Note: provide total number of households anticipated to benefit and total additional operating cost per year to the municipality
11 Estimated backlog in number (and cost to provide) water connection:
74000 R 136,900,000
- Piped water inside dwelling 450 R 55,890,000
- Piped water inside yard
- Piped water on community stand: distance < 200m from dwelling
8750 R 12,980,000
- Piped water on community stand: distance > 200m from dwelling
- Borehole 28 R 5,600,000.00
- Spring 0
- Rain-water tank 0

133
Note: total number should appear in IDP, and cost in future budgeted capital housing programmes
12 Free Basic Service Provision:
- Quantity (number of households affected) 30030 R 55,555,500
- Quantum (value to each household) 10000
Note: Provide details of how many households receive the FBS provision, and the average value it means per household. Describe in detail the level of Free Basic Services provided.
13 Type and number of grants and subsidies received: R (000s)
Free Basic Water R 7,679,394.14
Note: total value of specific water grants actually received during year to be recorded over the five quarters - Apr to Jun last year, Jul to Sep, Oct to Dec, Jan to Mar, Apr to Jun this year.
14 Total operating cost of water distribution function R 22.9 M
Key Performance Area
Performance During the Year, Performance Targets Against Actual Achieved and Plans to Improve Performance
Target Actual
Water distribution # of new basic water connections # metered water connections / total figure of households, as % % of Indigent households with access to free basic water
40 90% 90%
880 10% 72%

134
Table 35 Function: Electricity
Sub Function: Electricity Distribution
Reporting Level Detail Total Cost
Overview: The Electrical services department’s main function is to distribute and sell electricity within its licensed area. It is responsible for constructing networks, connecting customers and repairing and maintaining networks. It is also responsible for maintaining public lighting and street lights. The Greater Tzaneen Municipality consumers consist of domestic, agricultural, industrial and business customers
Description of the Activity:
The electricity purchase and distribution functions of the municipality are administered as follows and include:
New connections •Upgrading •Down grading •Extension of network
The municipality has a mandate to:
The municipality has a mandate to act in accordance to its Distribution Licenses as issued by the National Electricity Regulator of South Africa (N.E.R.S.A).
The strategic objectives of this function are to:
Supply a cost effective electricity service to consumers within the licensed distribution area and to coordinate the prioritisation and electrification of communities in Eskom distribution area within the municipality's jurisdiction.
The key issues for 2008/09 were:
Insufficient capacity to provide new electricity supply in the municipality's licensed distribution area and insufficient funding to eradicate electrification backlogs in Eskom's licensed distribution area.
Analysis of the Function:
1 Number and cost to employer of all personnel associated with the electricity distribution function:
R (000s)
- Professional (Engineers/Consultants) 6
- Field (Supervisors/Foremen) 13
- Office (Clerical/Administration) 10
- Non-professional (blue collar, outside workforce) 73
- Temporary
- Contract
Total Cost to Employer of Electrical Department R 17,492
Note: total number to be calculated on full-time equivalent (FTE) basis, total cost to include total salary package.
2 Total quantity and cost of bulk electricity purchases in kilowatt hours and rand, by category of consumer
R (000s)
All Categories

135
363,561,133 R 93,059
3 Total quantity and receipts for bulk electricity sales in kilowatt hours and rand, by category of consumer:
R (000s)
All Categories 314,352,323 R 96,666
4 Total year-to-date electricity losses in kilowatt hours and rand R (000s)
<detail total> 49,208,810 R 12,479
5 Number of households with electricity access, and type and cost of service:
R (000s)
Municipal 5,888.00
Eskom 68,161.00
Non-electrified (Eskom distribution area) 20524 R 184,716
6 Number and cost of new connections: R (000s)
<detail total> 70 R 680
7 Number and cost of disconnections and reconnections R (000s)
<detail total>
8 Number and total value of electrification projects planned and current: R (000s)
- Current (financial year after year reported on) (Farm Labour Housing)
513 R 3,182
- Planned (future years) (Farm Labour Housing) 500 R 3,000
- Current (financial year after year reported on) (Eskom Distribution Area)
2,825.00 R 26,077
Note: provide total project and project value as per initial or revised budget
9 Anticipated expansion of electricity service: Expansion is done through
development
Installation of new cables and substations
Note: provide total number of households anticipated to benefit and total additional operating cost per year to the municipality
10 Estimated backlog in number (and cost to provide) Electricity connection:
R (000s)
<detail total> 20,524 R 184,716
Note: total number should appear in IDP, and cost in future budgeted capital housing programmes
11 Free Basic Service Provision: R (000s)
- Quantity (number of households affected) 9195 R 2,873
- Quantum (value to each household) 50 KWH
Note: Provide details of how many households receive the FBS provision, and the average value it means per household. Describe in detail the level of Free Basic Services provided.
12 Type and number of grants and subsidies received: R (000s)
D.M.E Grant for the electrification of farm labour housing INEP(DORA) R 1,372
Note: total value of specific electricity grants actually received during year to be recorded over the five quarters - Apr to Jun last year, Jul to Sep, Oct to Dec, Jan to Mar, Apr to Jun this year.
13 Total operating cost of electricity distribution function R 136,757

136
Key Performance Area
Performance During the Year, Performance Targets Against Actual Achieved and Plans to Improve Performance
Target Actual
Electricity Infrastructure
MVA increase of urban capacity 10 10
% of Electricity losses 12.0% 13%
# of Farm labour houses electrified 324 316
Network maintenance
% of Substations maintained (11kv substations) 100% 100%
% of Substations maintained (132/66/33/11kv) 100% 100%
# Meter boxes maintained (Urban) 0 0
# Meter boxes maintained (Rural) 40 69

137
Table 36 Function: Electricity
Sub Function: Street Lighting
Reporting Level Detail Total Cost
Overview: The municipal is responsible for the provision and maintenance of public and street lights in the municipality’ electricity distribution area i.e. Tzaneen, Letsitele, Gravelotte & Haenertsburg. It is also responsible in Eskom’s distribution area such as Nkowankowa Township. The other responsibility is providing strategic lights in villages
Description of the Activity:
Street lighting responsibilities of the municipality are administered as follows and include:
Maintenance and installation of lights.
The municipality has a mandate to:
Service and maintain all streetlights and public lights.
The strategic objectives of this function are to:
Provide streetlights for safety and security.
The key issues for 2008/09 were:
Capital for new lights.
Analysis of the Function:
1 Number and total operating cost of streetlights servicing population: R (000s)
<complete> 2793 268.00
Note: total streetlights should be available from municipal inventory
2 Total bulk kilowatt hours consumed for street lighting:
<complete> Unknown
Note: total number of kilowatt hours consumed by all street lighting for year
Key Performance Area
Performance During the Year, Performance Targets Against Actual Achieved and Plans to Improve Performance
Target Actual
Street lighting % of Streetlights maintained 100% 100%
# of new streetlights installed 54 351
138
7. CONCLUSION
The 2008/09 financial year was a tough year for GTM as budget constraints limited the ability of
Council to implement most programmes to the full. However, in spite of this, the achievements
highlighted in the report is worthy of note as they were accomplished under very difficult
circumstances. Many of the challenges highlighted in the report will remain with us for years to
come but these we see as challenges and stepping stones towards greater achievement.


