This Selected Issues paper for Greece was prepared by a staff team of the International Monetary Fund as background documentation for the periodic consultation with the member country. It is based on the information available at the time it was completed on November 23, 2005. The views expressed in this document are those of the staff team and do not necessarily reflect the views of the government of Greece or the Executive Board of the IMF. The policy of publication of staff reports and other documents by the IMF allows for the deletion of market-sensitive information.
To assist the IMF in evaluating the publication policy, reader comments are invited and may be sent by e-mail to [email protected].
Copies of this report are available to the public from
International Monetary Fund ● Publication Services 700 19th Street, N.W. ● Washington, D.C. 20431
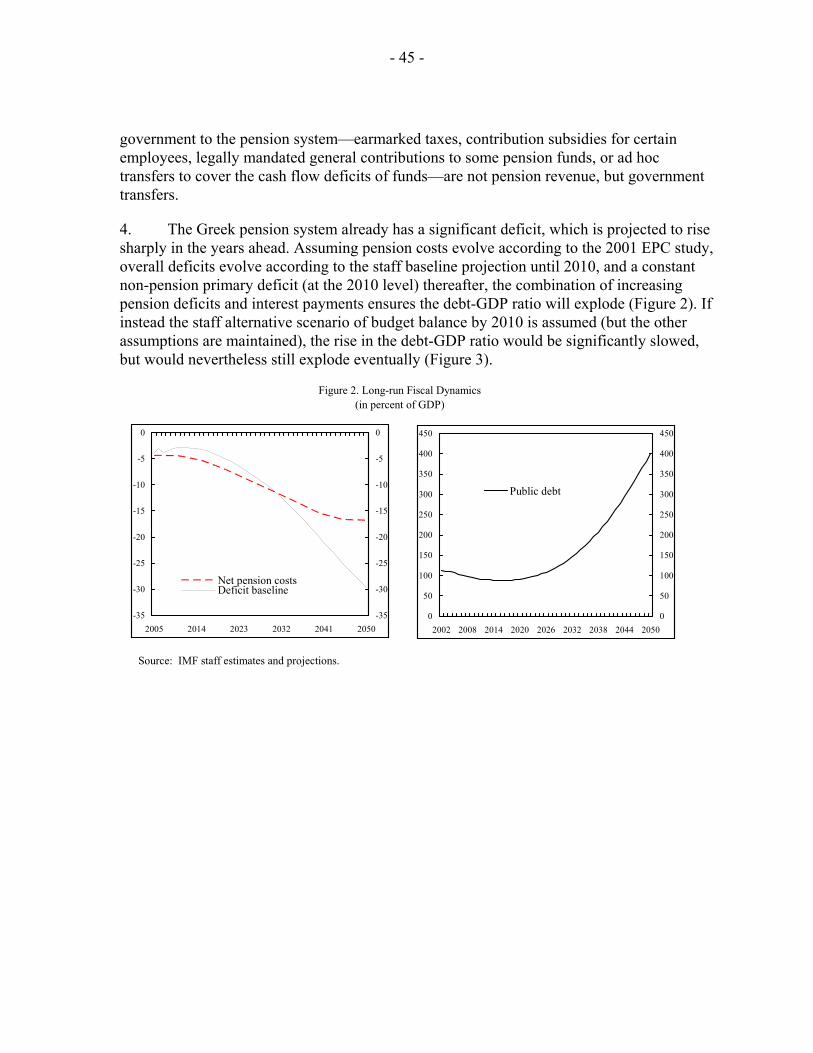
Prepared by Anastassios Gagales (EUR) and Christiane L. Roehler (FAD)
Approved by European Department
November 23, 2005
Contents Page
I. Growth in Greece: Can Better Performance Be Sustained?...............................................4 A. Introduction..........................................................................................................4 B. The Recent Growth Recovery in Perspective ......................................................6 C. The Contribution of Exceptional Factors in Recent Years ................................11 Immigration........................................................................................................11 Monetary Stimulus.............................................................................................15 Financial Stimulus .............................................................................................16 The 2004 Athens Olympics ...............................................................................17 The combined Effect of Exceptional Factors on Growth ..................................20 D. What is the Trend in Underlying Growth? ........................................................20 E. What Accounts for the Recent Rise in Growth?................................................25 F. Is the Better Growth Performance Sustainable over the Medium Term?..........28 G. What would be the Effect of Population Aging on Long-term Growth?...........29 Baseline Scenario...............................................................................................30 How Robust is the Baseline Scenario? ..............................................................35 H. Concluding Remarks...........................................................................................38 Table 1. Long-Term Growth and its Determinants........................................................................31 Figures 1. Key Economic Indicators in International Context ..........................................................5 2. Selected Economic Indicators, 1960–2004........................................................................8 3. Population Developments and Prospects, 1970–2050.....................................................32 4. Demographic Developments, 1960–2002........................................................................33 5. Population and Employment, 1970–2050........................................................................34
- 2 -
Text Box 1. The Three Phases of Growth in Post-WWII Greece..........................................................7 Appendices 1. Markov Regime Switching (MRS) ..................................................................................39 2. The Framework for Long-Term Growth Projections.......................................................40 References ............................................................................................................................41 II. Greece: Issues in Pension Reform...................................................................................44 A. Introduction.........................................................................................................44 B. An Overview of the Greek Pension System........................................................46 C. The Financial State of the Pension System.........................................................49 Recent Financial Developments in Social Security Funds ................................51 The Evolution of Pensioners and Contributors..................................................60 The Impact of Pension Fund Mergers................................................................62 Ad hoc Legislative Changes ..............................................................................64 D. Factors Contributing to High Pension Expenditures ..........................................64 Replacement Rates.............................................................................................65 Final Year Calculations .....................................................................................65 Minimum Pensions and their Adjustment..........................................................66 Effective Retirement Age ..................................................................................68 A Differentiated and Still Maturing System......................................................70 E. The Impact of Fragmentation ..............................................................................71 F. Approaches to Reforms: Some Examples ...........................................................72 Considerations for Reforms ...............................................................................72 Austria................................................................................................................72 Germany.............................................................................................................73 Italy ....................................................................................................................74 Sweden...............................................................................................................75 G. Conclusion ......................................................................................................................76 Tables 1. Structure of the Social Insurance fund System 2004, by Supervising Agency ...............47 2. Projections of Pension Deficits under Different Assumptions (as of 2001)....................50 3. Comparison of Assumptions for Pension Projections 2001 and 2005.............................54 4. Pension Expenditures, 1998–2004...................................................................................55 5. Revenue and Expenditures of Social Security Funds under the Supervision of the Ministry of Employment and Social Protection, 2004 and 2003.....................................57 6. Social Protection Revenue and Expenditures of General Government ...........................58 7. General Government: Social Security Revenue and Expenditure, 1998–2004 ...............59 8. Status of Major Pension funds, 2004 ...............................................................................61 9. Pensioners Receiving Minimum Pensions.......................................................................67 10. Minimum Retirement Pensions, 1998–2005..................................................................68
- 3 -
11. Pension Benefit Increases for IKA Primary Insurance..................................................69 Figures 1. Pension Expenditure ........................................................................................................44 2. Long-run Fiscal Dynamics...............................................................................................45 3. Fiscal Sensitivity..............................................................................................................46 4. Population and Employment, 2000–50............................................................................53 Text Box 1. The Scope of Existing Banking Sector Pension Funds....................................................63 References ............................................................................................................................77
- 4 -
I. GROWTH IN GREECE: CAN BETTER PERFORMANCE BE SUSTAINED?1
A. Introduction
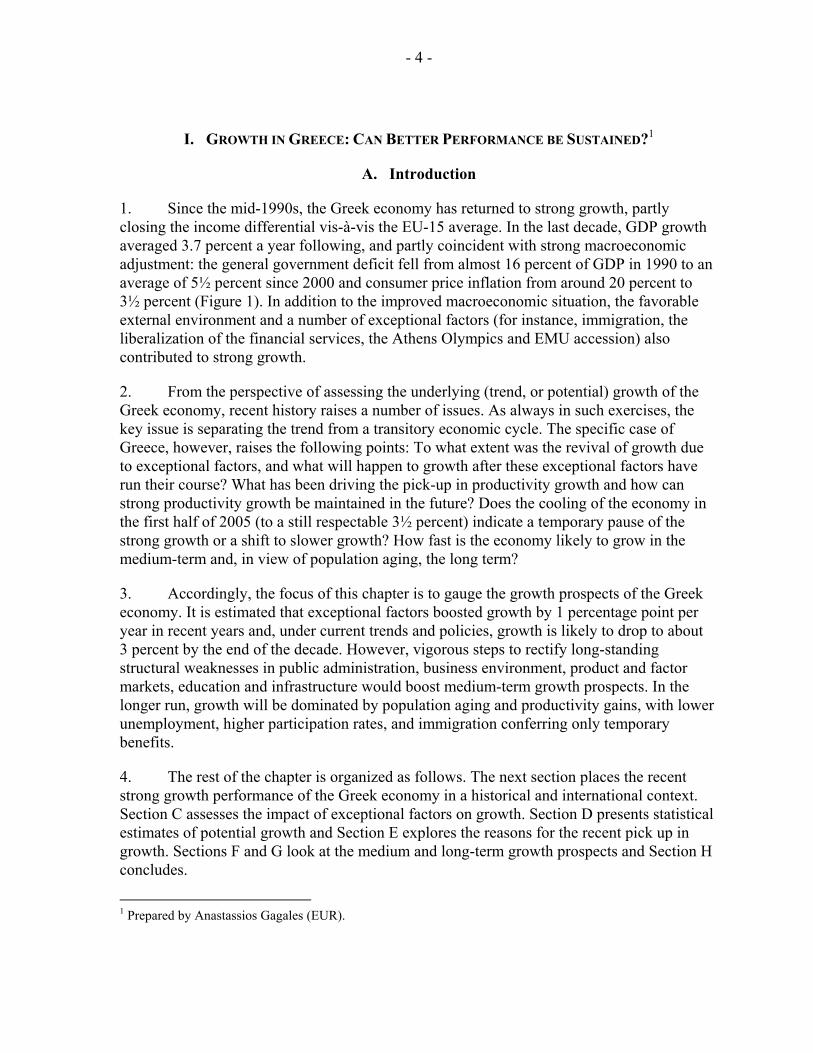
1. Since the mid-1990s, the Greek economy has returned to strong growth, partly closing the income differential vis-à-vis the EU-15 average. In the last decade, GDP growth averaged 3.7 percent a year following, and partly coincident with strong macroeconomic adjustment: the general government deficit fell from almost 16 percent of GDP in 1990 to an average of 5½ percent since 2000 and consumer price inflation from around 20 percent to 3½ percent (Figure 1). In addition to the improved macroeconomic situation, the favorable external environment and a number of exceptional factors (for instance, immigration, the liberalization of the financial services, the Athens Olympics and EMU accession) also contributed to strong growth.
2. From the perspective of assessing the underlying (trend, or potential) growth of the Greek economy, recent history raises a number of issues. As always in such exercises, the key issue is separating the trend from a transitory economic cycle. The specific case of Greece, however, raises the following points: To what extent was the revival of growth due to exceptional factors, and what will happen to growth after these exceptional factors have run their course? What has been driving the pick-up in productivity growth and how can strong productivity growth be maintained in the future? Does the cooling of the economy in the first half of 2005 (to a still respectable 3½ percent) indicate a temporary pause of the strong growth or a shift to slower growth? How fast is the economy likely to grow in the medium-term and, in view of population aging, the long term?
3. Accordingly, the focus of this chapter is to gauge the growth prospects of the Greek economy. It is estimated that exceptional factors boosted growth by 1 percentage point per year in recent years and, under current trends and policies, growth is likely to drop to about 3 percent by the end of the decade. However, vigorous steps to rectify long-standing structural weaknesses in public administration, business environment, product and factor markets, education and infrastructure would boost medium-term growth prospects. In the longer run, growth will be dominated by population aging and productivity gains, with lower unemployment, higher participation rates, and immigration conferring only temporary benefits.
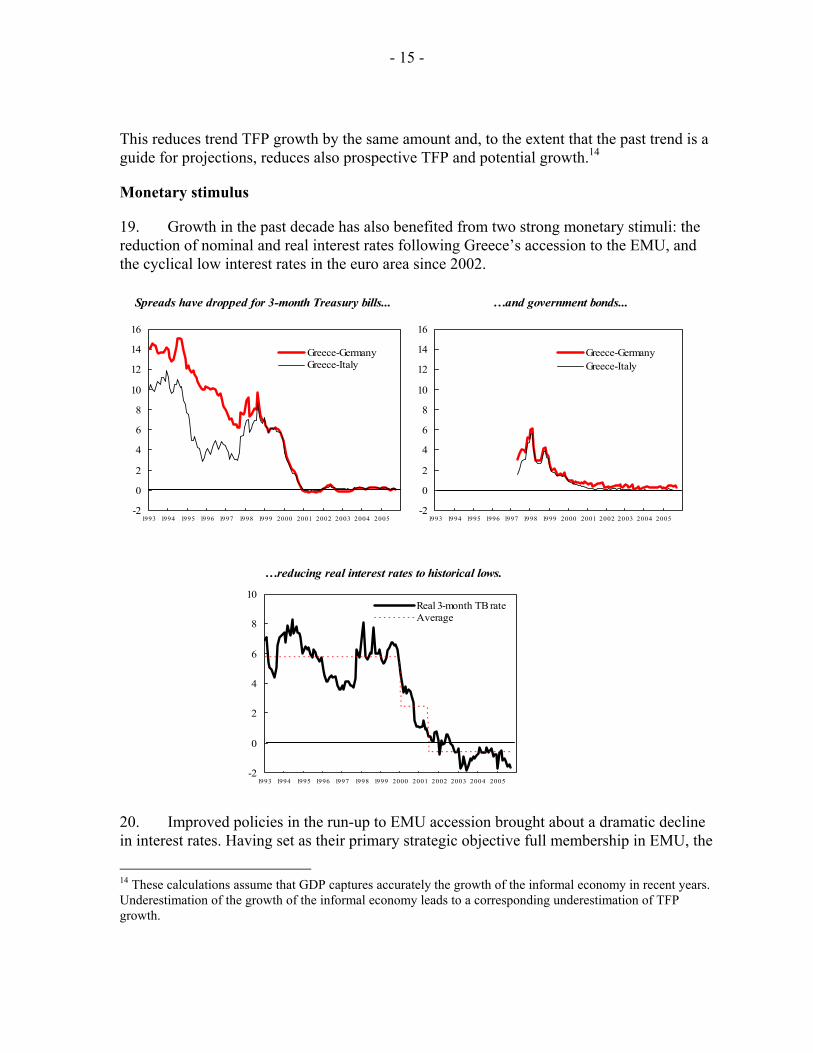
4. The rest of the chapter is organized as follows. The next section places the recent strong growth performance of the Greek economy in a historical and international context. Section C assesses the impact of exceptional factors on growth. Section D presents statistical estimates of potential growth and Section E explores the reasons for the recent pick up in growth. Sections F and G look at the medium and long-term growth prospects and Section H concludes.
1 Prepared by Anastassios Gagales (EUR).
- 5 -
Figure 1. Greece: Key Economic Indicators in International Context
Sources: World Bank; OECD; and IMF staff calculations.
0 1 2 3 4 5
IRLSVKPOLCZEGRCLUXFIN
GBRSWEAUSESPBELFRAUSA
EADN
AUTITAJPN
DEUNLDCHEPRT
Per-Capita GDP growth,2000-04 average
Robust economic growth ...
0 50 100 150 200 250
LUXUSACHE
DNIRL
AUTBELAUSNLDJPN
GBRFRADEUFINITASWEA
ESPGRCPRTCZESVKPOL Gross National Income
in percent of the Euro Area average, 2003
… has narrowed the income differential relative to the euro area average.
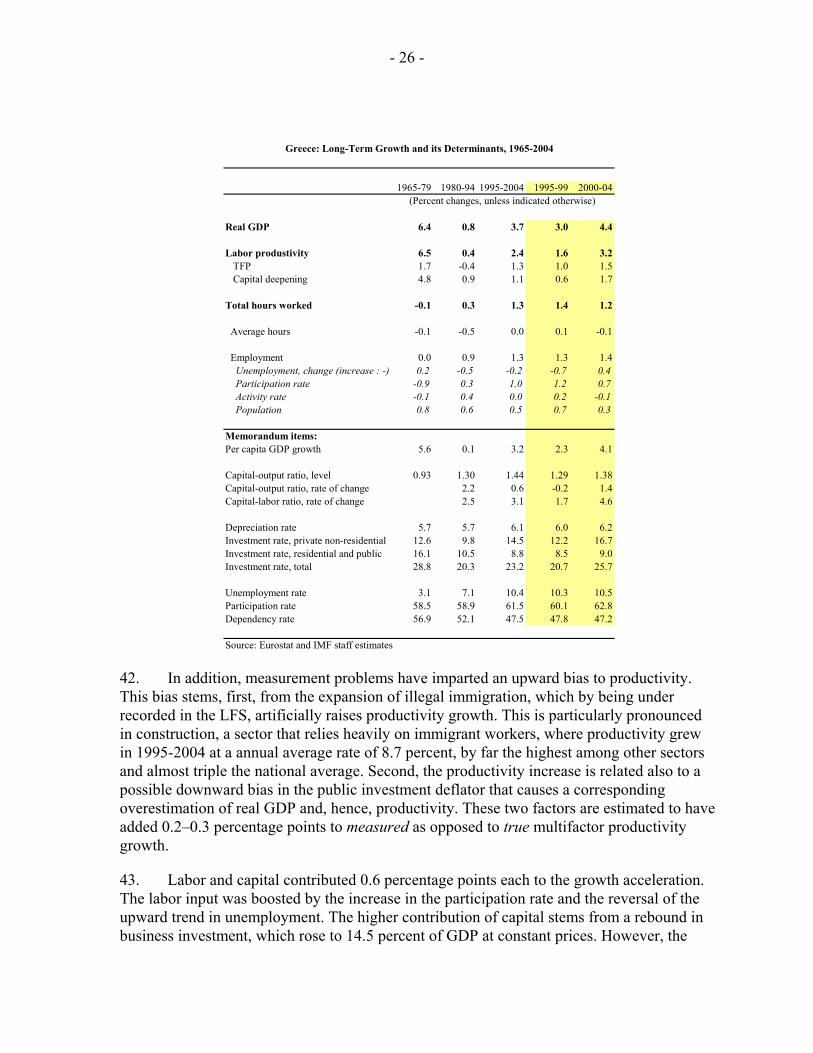
-8 -6 -4 -2 0 2 4 6
JPNSVKCZEGRCPOLPRTFRADEUITA
USAEA
NLDAUTGBRESPBELCHEAUSIRL
SWEDNKLUXFIN
Fiscal Balance as % of GDP, 2000-04 average
Despite significant adjustment, the fiscal deficit remains high...
-1 0 1 2 3 4 5
POLIRL
AUSESP
GRCPRTCZENLDUSAITA
LUXDNEA
BELAUTFRAFINSW
DEUGBRCHEJPN
CPI Inflation, 2000-04 average
… and inflation is above the euro area average.
0 5 10 15 20 25
PRTDN
GRCCHEAUTJPN
AUSESPBELITAEA
FRANLDDEUIRLSW
USAFIN
GBR
Business Investment as % of GDP, 2000-04 average
Business sector investment has been high l
0 2 4 6 8 10 12
GRCESPFRAITAFINEA
DEUCZEBELAUSUSAPRTAUTGBRJPNDN
SWEIRL
NLDCHELUX
Unemployment Rate, 2000-04 average
…but unemployment remains very high.
- 6 -
B. The Recent Growth Recovery in Perspective
5. Over the past half century, the growth performance of the Greek economy has been uneven. From the early 1950s until the mid-1970s the economy grew at an annual average rate of 6½ percent narrowing the income differential vis-à-vis the EU-15 countries and raising living standards well above those of Spain, Portugal and Ireland. Then, abruptly and for the next 15 years, the economy stalled and macroeconomic and structural imbalances worsened, manifested among other things in soaring fiscal deficits and inflation (Figure 2). Since the mid-1990s, the economy has returned to strong growth, benefiting from improved policies, a favorable external environment, and a number of exceptional factors.2
6. There is broad consensus that the reversals in the growth process are related primarily to shifts in policy orientation rather than exogenous shocks. 3 The rapid growth of the 1950s and 1960s was jumpstarted by the bold economic reforms of 1953 that boosted external competitiveness and dismantled controls (Box 1). The subsequent stalling coincided with very lax fiscal and monetary policies, increased state interference in the economy,
2 In this chapter, the dating of the reversals in the growth process is based exclusively on the statistical properties of the GDP series. For instance, Tavlas and Zonzilos (2001) report structural breaks in the GDP series at around 1980 and 1995. Alogoskoufis (1995), using as criterion breaks in the economic policy regime, argues that the first structural break occurred somewhat earlier, in 1974. The two dates are not inconsistent given that, as a rule, policy shifts and changes in the institutional framework materialize over a number of years and affect growth after a lag. The same argument applies also to the second structural break in 1995.
3 Extensive reviews of Greece’s post-WWII economic performance can be found in Bank of Greece (1978, 1982), Alogoskoufis (1995), and Garganas et.al. (2001). Christofides (1996) provides a critical survey of the literature.
- 7 -
Box 1. The Three Phases of Growth in Post-WWII Greece
The history of growth in Greece is very instructive from the policy perspective. The large swings in the direction of policy dwarfed other developments creating a quasi controlled experiment environment that allows us to gauge the responsiveness of the economy to policy shifts. There are three growth phases: Rebound and catching up (1950–79): The long period of rapid growth after a decade of conflict was jumpstarted with a 50 percent devaluation, trade liberalization, and the removal of price controls. Growth averaged 8.5 percent during 1960–70 and was also supported by strict fiscal and monetary discipline, wage moderation, favorable business conditions, and cheap credits to priority sectors. However, by the early 1970s the economy had become overheated and macroeconomic imbalances started to build up. The first oil shock exacerbated these imbalances and exposed vulnerabilities in corporate balance sheets; moreover, its monetary accommodation destabilized price expectations. The fluid political environment during this period was not conducive to tackling decisively the macroeconomic and structural imbalances. In addition, worsening labor relations and increasing state intervention—including nationalizations—undermined business confidence, strained the public finances and compromised monetary policy. During 1974-79, the public sector turned from surpluses to high deficits and the unit labor cost shot up. Growth weakened to 3.4 percent per year (less than half its earlier rate) and inflation soared to 12.8 percent (compared to 2 percent during 1960–70). Stagflation (1980–94): This period is characterized by financial instability and pronounced state intervention. Early in this period, the macroeconomic imbalances and structural problems that were inherited from the 1970s were exacerbated by the second oil shock and EU accession. The monetary accommodation of the second oil shock and the introduction of full wage indexation entrenched inflationary expectations. The rehabilitation and resolution of loss-making enterprises was delayed by the specter of rising unemployment and was accompanied by a rise in state corporatism, soft budget constraints, an expansion of the role of the state, and the bloating of the public sector. In addition, the ambivalent official attitude towards the EU and a proclivity to seek exceptions from EU directives did not facilitate the dynamic integration of the economy into the EU. Last, but not least, policies were introduced to ameliorate social exclusion and income inequalities. Against this backdrop, the general government deficit reached 16 percent of GDP, the tax burden was raised and monetary policy was subjugated to the financing needs of the state. Inflationary finance pushed inflation to over 20 percent and drained resources from the private sector. Productivity stagnated, investment dropped, unemployment doubled to 7 percent, and the economy stalled (Figure 2). By the mid-1980s, the need to recalibrate economic policy became apparent but a notable attempt in 1985–87 to stabilize the economy with EU support was short lived. The direction of policy started to improve in the early 1990s. Of particular importance is the liberalization of the financial sector and efforts to rein on fiscal deficits and inflation. However, the beneficial effect of these policies on growth were felt with a lag, mainly after 1994. Featherstone (2003) argues that the risk of marginalization as the rest EU member countries were making arrangements for closer integration catalyzed broad political consensus for improving policies.
1965-79 1980-94 1995-04
Per capita GDP growth, in percent 5.6 0.1 3.2GDP growth, in percent 6.6 0.8 3.7Productivity growth 6.5 0.4 2.4TFP growth 1.7 -0.4 1.3Business investment, percent of GDP 12.6 9.8 14.5Unemployment, in percent 3.1 7.1 10.4CPI inflation, in percent 9.0 18.4 4.7General government balance, in percent of GDP -0.7 -10.2 -5.3
Greece: Key Economic Indicators
Growth revival (1995–2004): In this period, the economy returned to financial stability and growth and major efforts were made to catch up with structural reform. Initially, policies were driven by the requirements for EMU participation and deeper integration with the EU. A bold stabilization program, building on earlier progress, resulted in the cumulative reduction of inflation by 17 percentage points during 1990–99 and of the fiscal deficit by 14 percentage points of GDP. Linking the adjustment program with EMU participation, added credibility to the disinflation effort and helped prevent output losses. However, some adjustment fatigue could not be avoided as the unemployment rate ratcheted up. Growth accelerated to 4 percent benefiting from the restoration of price stability, privatization, liberalization of several sectors of the economy, the crowding in of the private sector as the public sector phased out its reliance on compulsory bank financing, the removal of distortions, the completion of major infrastructure projects. Growth benefited also by a favorable external environment (especially in the Balkans), and a number of exceptional factors (see Section C).
Source: OECD, Analytical Databank; AMECO; and IMF staff calculations.
GDP Growth
-6
-4
-2
0
2
4
6
8
10
12
14
1960 1965 1970 1975 1980 1985 1990 1995 2000
Unemployment rate
0
2
4
6
8
10
12
14
1960 1965 1970 1975 1980 1985 1990 1995 2000
Business sector investment,In percent of GDP
8
10
12
14
16
18
20
1960 1965 1970 1975 1980 1985 1990 1995 2000
CPI inflation
0
5
10
15
20
25
30
1960 1965 1970 1975 1980 1985 1990 1995 2000
-20
-15
-10
-5
0
5
10
1960 1965 1970 1975 1980 1985 1990 1995 2000
General government balance, in percent of GDP
Total
Primary
Wages(1990=100)
20
40
60
80
100
120
140
1960 1965 1970 1975 1980 1985 1990 1995 200080
90
100
110
120
Real unit labor cost(Right axis)
Real compensation per employee
- 9 -
policies to change the distribution of income, and drifts in the direction of policy. Two notable attempts in 1985 and 1992 to stabilize the economy were short lived. Finally, the spark that the economy has been showing since the mid-1990s is related to the removal of earlier distortions, the restoration of a stable macroeconomic environment—linked to EMU participation—and the liberalization of broad sectors of the economy, especially financial services.
7. The economy stalled in the 1980s, derailing the catch-up process. Since 1975, Greece’s growth rate has been lower than the euro area’s. It has also trailed growth in Spain and Portugal—countries with broadly similar initial economic conditions and experiences (for example, a transition from dictatorship to democracy and EU accession)—and fallen well short of that in Ireland. As a result, even after the recent rebound in growth, Greece’s per capita GNP, while up from 67 percent of the euro-area average in the mid-1990s, is still below the 86 percent of the average recorded in the 1970s. Moreover, Greece’s relative position vis-à-vis the euro area has been overtaken by Spain, Portugal, and Ireland. Looking forward, convergence is likely to be a lengthy process: it would take over 20 years to raise Greece’s per capita income to the euro area average, assuming a growth differential of 1.3 percentage points a year (the average recorded during 1995–2004).
1960-79 1980-94 1995-20041960-74 1975-79
Greece 5.7 7.3 4.0 0.1 3.0Euro area 4.0 4.7 2.4 1.8 1.7Spain 4.6 6.2 0.5 2.1 2.7Portugal 5.3 7.2 1.3 2.6 2.2Ireland 3.6 3.7 3.5 3.2 7.1Source: World Bank development incicators.
Per capita GDP Growth in Selected EU Countries
50
60
70
80
90
1975 1980 1985 1990 1995 2000
GreecePortugalSpain
Per capita GNI relative to the euro area
8. Greece’s experience with stop and go growth is not unique. Jones and Olken (2005) have found evidence that growth “miracles” and “failures” are ubiquitous at ten to fifteen year time horizons. Their analysis suggests that growth reversals are largely due to shifts in productivity growth, rather than factor accumulation; growth accelerations are associated with substantial increases in trade; growth decelerations, on the other hand, are correlated with increases in monetary instability and sharp declines in investment. An important conclusion from the international experience is that growth miracles do not last forever and they do not always end smoothly.
- 10 -
9. Viewed from a broader perspective, the recent growth rate of the Greek economy has been high, but not exceptionally so. Although well above the euro area average—itself not a very ambitious benchmark—Greece’s growth rate falls short of the growth rates of some other more advanced economies. It is also well below the growth rates registered by the new EU accession countries—which are at a less advanced stage in the convergence process—and is even lower than Greece’s growth rate after the first oil shock. In addition, the recent growth rate has been insufficient to reduce the extremely high unemployment and public indebtedness, eliminate chronic structural problems in broad sectors of the economy, and redress elements of underdevelopment still present in the Greek economy.
0 2 4 6 8 10
IrelandLuxembourg
AustraliaFinlandGreece
New ZealandCanada
United StatesSpain
SwedenUnited Kingdom
PortugalNetherlands
FranceAustria
BelgiumDenmark
Euro AreaItaly
SwitzerlandGermany
JapanGDP growth, 1995-2004 (In percent)
- 11 -
C. The Contribution of Exceptional Factors in Recent Years
10. In the past decade, growth benefited from several exceptional factors. Most prominent have been: strong immigration; nominal convergence to the EU and the adoption of the euro; rapid credit expansion in the wake of liberalization of the financial sector and, more recently, below-normal interest rates in the euro area; and the 2004 Athens Olympics.4 This section tries to quantify the impact of these factors on growth and distinguish between supply and demand effects (the latter do not matter for potential growth) and transitory versus lasting effects (only the latter matter for underlying growth). The distinction between potential and underlying growth is important for the analysis that follows. Potential growth corresponds to the rate of growth that can be maintained while achieving low and stable inflation, whereas underlying growth refers to the trend in potential growth. A temporary supply shock—for instance, a surge in immigration or investment—would raise potential but not underlying growth. Thus, the latter is the relevant concept in determining the longer term growth momentum of an economy.
Immigration
11. Net immigration has been the major driving force behind population growth in Greece. After a long history of emigration, during the past quarter century Greece became a significant immigration country.5 The turn-around started in the mid-seventies when several European countries adopted restrictive immigration policies, spurring the return of about half of the earlier economic emigrants. The restoration of democracy in 1974, too, had a catalytic effect on immigration. Subsequently, a significant number of political refugees from the Greek civil war and other ethnic Greeks were repatriated, especially following the opening up of the borders with Albania in 1987. Immigration (largely illegal) soared in the 1990s following the collapse of the communist regimes in the Balkans and Eastern Europe. Indeed, with the indigenous population virtually stagnant, immigration accounts for the entire increase in the population in the past decade. As a result, the share of foreigners in the population census quadrupled from 1.6 percent in the 1991 to 7 percent in the 2001.6 However, full accounting of illegal immigrants could raise the share of foreigners to up to 10 percent (Baldwin-Edwards, 2004), well above average by international standards.
4 The list is not exhaustive. One could add also privatization (which has raised productivity in formerly state owned enterprises), deepening integration with the internal EU market, and EU transfers of about 1½ percent of GDP annually in the period 2000–04. These factors are not considered owing to the fact that they have a lasting effect on growth and thus affect underlying growth.
5 In 1950–74 about one million Greeks (13 percent of the population) emigrated to Western Europe, Australia, Canada and the USA. This emigration alleviated unemployment pressures, relaxed (through remittances) the external financing constraint during the take-off of the Greek economy, and facilitated some transfer of skills. OECD (2005) and Kasimis (2004) provide comprehensive accounts of the history of immigration in Greece.
6 The increase in the share of foreigners underestimates the effect net immigration on population since it does not include the repatriation of ethnic Greeks and the return of earlier Greek emigrants.
- 12 -
Contributions to population growth (In percent)
-1.0
-0.5
0.0
0.5
1.0
1.5
1960 1965 1970 1975 1980 1985 1990 1995 2000
ImmigrantsNatives
Immigration has been the main driver of population growth in recent years ...
Sources: NSSG and IMF staff calculations.
Foreign population, 2001 (% of total population)
0 5 10 15 20
SwitzerlandCanada
United StatesAustria
GermanyBelgium
GreeceSweden
DenmarkUnited Kingdom
NetherlandsNorwayIrelandSpain
ItalyPortugal
Czech RepublicFinland
Japan
…and foreigners constitute a significant portion of the resident population.
Source: World Bank development indicators. 12. Both supply and demand factors have contributed to the surge of immigration. Supply factors include low wages and difficult economic conditions in the countries of origin. From the demand side, immigration has been driven by chronic labor shortages in agriculture, tourism, construction and certain services. Immigration (especially illegal) has also been used to circumvent non-wage costs and labor market regulations. The large––and probably expanding—informal economy, which is estimated at 30-40 percent of GDP, has acted as a catalyst.7 8In addition, ineffective border controls and the lack of a coherent and proactive immigration policy have acted as facilitators. In the 2001 census, Albanians were by far the largest ethnic group, followed by Bulgarians, Romanians and Georgians. Construction was the largest employer, accounting for one quarter of the immigrant workers, followed by agriculture (17 percent), tourism and trade (16 percent), manufacturing (12 percent) and other services (20 percent).
13. Notwithstanding its significance, immigration is covered poorly in statistics. Despite two attempts in 1998 and 2001 to legalize immigrants, at least one-third of the immigrant population is believed to remain undocumented. The total immigrant population, based on a conservative estimate of illegal immigrants, is estimated to have reached 900,000 in 2004,9 which is consistent with the implied cumulative immigration from published annual statistics
7 An interesting analysis of the relationship between illegal immigration and the informal economy, from the perspective of Mediterranean countries, can be found in Reyneri (2003).
8 The informal economy in Greece is 5-10 percentage points of GDP larger than in other southern European countries. This reflects ineffective administrative controls and enforcement mechanisms, over-regulation—especially in the labor market—and relatively high tax rates. See Kanellopoulos et.al. (1998), Schneider (2000), Tatsos (2001) and Vavouras and Manolas (2003).
9 These figures do not include 50,000 asylum seekers and 200,000 immigrants of ethnic Greek origin. See Kathimerini (Oct. 20, 2004) and Baldwin-Edwards (2004).
- 13 -
on population, births and deaths. By comparison, the foreign population in the Labor Force Survey (LFS) was only 550,000 in 2004, which raises doubts about the accuracy of employment statistics.10
Employment growth Contribution to employment growth Contribution to GDP growth 4/
3/ Foreign employment is based on the immigration estimates in Baldwin-Edwards (2004) and an employment rate of 64 percent.
Greece: Contribution of Employment to GDP Growth, 1995-2004
(Annual rates, in percent)
2/ Foreign employment estimates are based on immigration implied by population, birth and death statistics and an employment rate of 64 percent as per the 2001 Census.
4/ Contributions to GDP growth assume an employment elasticity of output of 0.65 (estimated with a Cobb-Douglas production function) and 25 percent below avergae productivity for foreign workers (as indicated by wage differentials in IKA statistics). 14. During the 1995–2004 upswing, immigration contributed 0.3–0.4 percentage points annually to growth. This is a production-side estimate.11 The range reflects differences in the estimate of foreign employment between the Labor Force Survey—which reports an implausibly low number of foreign workers (owing to inherent difficulties in surveying illegal immigrants)—the more comprehensive (but less detailed) Baldwin-Edwards study, and, finally, implied estimates of immigration from annual population statistics.
10 This estimate is obtained by inflating the 440,000 working-age foreigners reported in the LFS by the share (80 percent) of working-age immigrants in the total immigrant population.
11 Using a Cobb-Douglas production function, the impact of immigration on GDP growth is: ∆lnY = θ · γ · (Lf /(Lg+γLf ) · ∆lnLf Where Y, α, K, Lg and Lf denote respectively, GDP, technological progress, capital, and the employment of native population and immigrants. θ stands for the elasticity of output with respect to employment and Greeks and γ is a Mincerian measure of the relative productivity of migrant workers. The calculation abstracts from the second round effect of immigration on capital. This is given by (1-θ) · φ · ∆lnL , where φ stands for the elasticity of capital with respect to immigration that depends on relative factor prices and substitutability of factors of production.
- 14 -
15. About half of the impact of immigration on growth is transitory. In the past, immigration has been clearly above its sustainable level. The latter is difficult to pin down but a plausible working hypothesis is that immigration could grow at a sustainable rate of 3.5 percent per year, which is consistent with the NSSG’s population projections. On this basis, about half of the growth in immigration has been transitory,12 which implies a temporary boost to potential GDP growth by 0.2 percentage points per year. Being a supply shock, a temporarily faster immigration boosts both actual and potential growth. However, it would not affect underlying growth, which is what matters for projecting trends into the future.
16. The high immigration of the past decade is unlikely to continue. The inflow is expected to slow as the stock adjustment from the Balkans and Eastern European countries runs its course, the absorptive capacity of the economy is exhausted, and immigration policy becomes proactive and performance based. If immigration continues at its current pace of 40,000 persons annually—the assumption used in the NSSG’s baseline population projection (October 2005)—the share of first-generation immigrants in the population would rise in the next ten years from 10 to 13 percent.
17. The above calculations do not consider second-round effects of immigration on growth. These include induced investment needed to maintain capital-labor ratios; changes in relative factor prices and factor intensities; and complementarities in labor markets. For instance, immigration has alleviated chronic labor market shortages and reduced production costs, thereby strengthening demand for domestic labor. It has also facilitated greater female participation by improving home- and long-term care services and by enhancing job prospects. The surge in immigration has also raised domestic demand and raised demand for housing. However, benefits have not come without costs, such as delays in enterprise restructuring, an expanding informal economy, and an overstretched social and physical infrastructure. Immigration, consisting mainly of low-skill labor and catering jobs frowned upon by the indigenous population, has not been unwelcome, especially as it is not considered to have been the main culprit for the inching up of unemployment in the mid-1990s.13
18. The under-recording of illegal immigrants in employment statistics leads to the over-estimation of productivity growth. The preceding calculations suggest that adding to the employment series an adjustment for illegal immigration raises the contribution of employment in the standard growth accounting framework by 0.2–0.3 percentage points.
12 Transitory immigration is calculated as deviations from trend.
13 Lianos (2001) proposes a framework for analyzing distributional effects from, and the optimal size of immigration.
- 15 -
This reduces trend TFP growth by the same amount and, to the extent that the past trend is a guide for projections, reduces also prospective TFP and potential growth.14
Monetary stimulus
19. Growth in the past decade has also benefited from two strong monetary stimuli: the reduction of nominal and real interest rates following Greece’s accession to the EMU, and the cyclical low interest rates in the euro area since 2002.
20. Improved policies in the run-up to EMU accession brought about a dramatic decline in interest rates. Having set as their primary strategic objective full membership in EMU, the
14 These calculations assume that GDP captures accurately the growth of the informal economy in recent years. Underestimation of the growth of the informal economy leads to a corresponding underestimation of TFP growth.
- 16 -
authorities took resolute steps to meet the convergence criteria set by the Maastricht Treaty. As a result, inflation fell from around 20 percent in the early 1990s to 3½ percent since 2000. In addition, between Greece’s entry in the Exchange Rate Mechanism (1998) and accession in the EMU (2001), long-term interest rates dropped from 8.5 to 5.3 percent. The Oxford Economic Forecasting Model (OEF, 2005) and the Bank of Greece (BoG) quarterly model (Sideris and Zonzilos, 2005) suggest that this interest rate convergence raised growth by 1-1½ percentage points in 2001 by allowing an increase in the investment rate and, to a lesser extent, consumption. The lower real interest rates are likely to have a permanent effect on the level of GDP—the GDP trajectory will shift upwards—due to a higher capital-labor ratio but, arguably, the growth rate will fade gradually over time as the transition to the new steady-state is completed.
21. Since 2003, growth has also benefited from a cyclical monetary easing in the euro area. Nominal interests are about 2 percentage points below their “historically normal” level and some interest rates have even become negative in real terms. The OEF and BoG models suggest that this monetary stimulus added 0.4 percent points to output growth in 2004.
Financial stimulus
22. Since the mid-1990s, the liberalization of the banking sector has been providing a strong stimulus through the relaxation of credit controls, together with lower interest rates. Consumer credit soared in 1994–95, when most quantitative credit constraints were dismantled, and has since been rising at an average annual rate 34 percent. This relentless credit growth reflects primarily the rising number of persons gaining access to bank credit and the relaxation of credit limits, rather than the decline in interest rates. Although financial liberalization was essentially completed in 1994, the relaxation of limits per borrower was more gradual (Voridis and others, 2003) and the reactivation of credit ceilings in 1999–2000 (to avoid destabilizing capital inflows in the run-up the EMU accession) lengthened the adjustment process.15 The adjustment of behaviors and portfolios has yet to be completed and may continue for some time, given the low household credit/GDP ratio by international standards.
15 During the twelve-month period April 1999–March 2000, the Bank of Greece imposed temporary credit controls to stem credit expansion: banks were required to place in a non-remunerated deposit an amount equivalent to the growth of credit above specified rates. The Bank of Greece took also steps to smooth the impact of the reduction of reserves requirements from 12 percent to the euro area’s 2 percent: the freed-up reserves were placed in a blocked deposit and were released gradually by end-200l. See Garganas and Tavlas (2001) and Hilbers and others (2005).
23. The rapid expansion of credit to households has had a powerful impact on GDP growth. With the adjustment of behaviors and portfolios still unfolding, the econometric estimation of the macroeconomic impact of financial liberalization is problematic. However, a rough estimate is possible from information on household indebtedness. A recent survey (Mitrakos et. al., 2005) indicates that for 20 percent of the borrowers, the debt/income ratio exceeded 100 percent and, for another 20 percent, debt service exceeded 30 percent of their income. Banks report that about 7 percent of consumer credit is impaired. There is also circumstantial evidence that credit card debt is increasingly used to cover basic current expenses and is becoming part of the “safety net” in times of economic hardship. Against this backdrop, it is reasonable to assume that at least 10 percent of borrowers are credit constrained and, thus, their spending is aligned to credit expansion. Combining this with adjustments for the import content of private expenditure and the possibility that bank credit may be crowding out trade credit and borrowing from informal lending channels, yields that credit expansion to households contributed to GDP growth on average 0.2 percentage point yearly in 1995–2004 and about 0.4 percent in 2004.
24. The financial stimulus is likely to persist in the near term. Given that private sector credit as a share of income remains well below the euro area average, the expansionary effect of financial liberalization is expected to fade only gradually as the market matures and households’ indebtedness stabilizes.
The 2004 Athens Olympics
25. The organization of the Olympics was an ambitious project with upfront costs and potential future benefits. Besides providing a sizeable demand stimulus to an already booming economy, the Olympics were the catalyst for undertaking long overdue infrastructure projects (mainly in transportation and telecommunications), facilitated the development of local expertise, and helped upgrade and expand tourism infrastructure. Last,
- 18 -
but not least, the Olympics generated also a generalized euphoria about economic prospects and boosted spending. The successful organization of the Olympics and better infrastructure could improve Greece’s international image as tourist destination and attractiveness as business location. Finally, the acquisition of expertise could spur the development of new private sector activities. However, these potential future benefits would be dented by the costs of amortizing the (yet uncertain) financial loss of the Olympics.
26. The Olympics boosted public and private expenditure. During 2002-04, public expenditure for the preparation of the various venues averaged 1¼ percent of GDP.16 Sponsors contributed another ¼ percent of GDP on average in 2003–04.17 In addition, the completion of several infrastructure projects was accelerated to coincide with the opening of the Olympics and the tourism industry expanded capacity and upgraded the quality of services. Finally, the Olympics buoyed tourist revenue and private consumption in 2004, although well below expectations.
2000 2001 2002 2003 2004 2005 2000-05
Public investment 69 208 1,127 1,663 2,024 330 5,421
First-round effect on nominal GDP, million euros 69 133 634 1,414 2,117 530 4,827
First-round effect, in percent of nominal GDP 0.1 0.1 0.4 0.9 1.3 0.3 0.5
Total effect, in percent of nominal GDP 0.1 0.2 0.7 1.4 1.9 0.4 0.8
Total effect, in percent of GDP at constant prices 0.1 0.2 0.7 1.4 2.0 0.5 0.8
Impact of Olympics on GDP growth 0.1 0.1 0.6 0.8 0.6 -1.6 0.1
Sources: Ministry of Economics and Finance and IMF staff calculations.
Economic Impact of the Athens Olympics, 2000-05(At current prices in million euros, unless otherwise indicated)
16 This estimate is based on budgetary figures, which, being on a cash basis, might differ from national accounts data. For 2005, the first post-Olympic year, the public investment budget earmarked 0.2 percent of GDP for Olympic-related expenditure.
17 Estimate based on Alpha Bank's publication, The Greek Economy, July/August 2004.
- 19 -
27. Olympics-related spending is estimated to have raised growth by 0.6 percent a year on average in 2002–04. This estimate reflects mainly a demand stimulus. It treats as transitory all budgetary Olympic expenditures and parts of private investment, consumption and exports as indicated in the preceding table. It also assumes 40 percent import content for Olympic-related expenditure and an expenditure multiplier 1.518 and uses the public investment deflator to calculate growth rates.19 Moreover, as a first approximation, the calculation does not account for spill-over effects on inflation and competitiveness and assumes that the contributions of sponsors did not crowd out private expenditure. The situation was reversed with the winding down of Olympic spending: the withdrawal of stimulus knocked as much as 1.6 percentage points off growth in 2005.20
28. However, the Olympics have so far had a limited impact on underlying growth. Expenditures on strictly Olympic infrastructure (stadiums, for example) is unlikely to have significantly expanded the productive capacity of the country. Improved traffic conditions have been a collateral benefit that has raised living standards and, to some extent, productivity. There is also the possibility of positive spill-over effects on the rest of the economy, but these are uncertain, not automatic, and usually take time to materialize.
29. Nevertheless, the Olympics could provide some medium-term stimulus to growth. The size of the stimulus would depend on the successful marketing of the Olympic image and infrastructure, the ability to put the tourism sector on a sustainable growth trajectory, and the exploitation of competencies developed during the Olympics. In this regard, significant first steps were taken in 2005 with the creation of the Ministry of Tourism and the revitalization of the advertising campaign. However, key for success will be the responsiveness of the private sector and its readiness to adapt to the changing international environment. The strong recovery of tourism in 2005 is a hopeful sign but, given the long list of remaining structural problems that still beset the sector, intense international competition,21 and special factors (e.g. the tsunami) that diverted tourism to Greece in 2005, it is too early to ascertain if the recovery of tourism in 2005 was a turning point.
18 The impact on growth is approximately equal to the change in the share of Olympic expenditure to GDP. Thus, the increase in their share by 0.2 percentage point of GDP in 2004 boosted headline growth by exactly the same amount.
19 Significant surcharges were needed to ensure the timely completion of several athletic venues and related infrastructure projects. To the extent that these surcharges exceed those paid for other public investment projects, applying the public investment deflator to Olympic projects would lead to the overstatement of real GDP (and TFP growth if athletic venues were excluded from productive capital).
20 This constitutes the upper limit of the effect on growth. The effect would be lower to the extent that funds previously earmarked for the Olympics were subsequently channeled to other expenditure.
21 Patsouratis et.al. (2005) argue that Greece’s tourism is price elastic relative to other Mediterranean competitors.
- 20 -
The combined effect of exceptional factors on growth
30. The four exceptional factors considered of immigration, monetary stimuli, financial stimulus, and the Olympics boosted growth by 0.7 percentage points a year. Their combined effect has been stronger in recent years, rising from ½ percentage point in 1995–99 to 1 percentage point in 2000–04. Immigration was the dominant factor in 1995–99 but its significant has since been declining. Recently, lending to households has emerged as the dominant factor, although both were overshadowed by contribution of Olympic spending in 2002–04.
31. Still, even after excluding the effects of these factors, growth performance in recent years has been strong, averaging 3½ percent. This rough estimate of underlying growth is slightly higher than potential growth, which includes also the supply effect of immigration and indirect supply effects from the remaining exceptional factors. For assessing the growth potential over the medium term, underlying growth is a more relevant indicator than potential growth, direct estimates of which are derived in the next section.
Total impact 0.6 0.5 0.4 0.4 0.4 0.4 0.5 1.1 1.4 1.4 0.5 1.0 0.7Memorandum items:GDP growth 2.1 2.4 3.6 3.4 3.4 4.5 4.3 4.2 4.6 4.7 3.0 4.4 3.7GDP growth excluding exceptional factors 1.5 1.8 3.2 3.0 3.1 4.1 3.7 3.1 3.2 3.2 2.5 3.5 3.01 The estimates abstract from second round effects.2 Includes only the effect of transitory immigration, which is measured by the deviation of immigration from its long-term trend.
(In percent) (Average, in percent)
Impact of Exceptional Factors on Growth 1
D. What is the Trend in Underlying Growth?
32. Unobservable potential/underlying growth is most commonly estimated by two approaches. Statistical techniques focus on the time series properties of GDP, and economic techniques examine aggregate supply capacity through the production function. The point of departure of both is the traditional assumption in business cycle analysis that potential output evolves smoothly and actual output fluctuates around potential in identifiable phases. The change in log output, ∆yt, is decomposed into:
∆yt = ∆pt + ∆ct where ∆pt denotes potential output growth and ∆ct is the change in the output gap; changes in logs are used as approximations of percentage changes. Furthermore, potential growth can be
- 21 -
decomposed into ∆pt = ∆ut + ∆et where ∆ut and ∆et denote respectively underlying growth and the contribution of exceptional factors to potential growth. In the longer term, potential and underlying growth coincide. 33. The statistical approach uses signal extraction techniques to identify the two unobserved components. The approach works well with historical data but do not address the question as to what drives potential growth and the cycle and thus are not well suited for projections.
34. The economic approach makes it possible to identify how factor inputs and technical progress contribute to potential growth. This decomposition of the determinants of growth highlights the constraints that weigh on the economy and the role of economic policy and structural reforms in strengthening growth. Also, the economic approach provides a framework for building scenarios for the future based on hypotheses for the evolution of demographic, institutional and technological factors. Here, a Cobb-Douglas production function expresses growth as:
∆yt = αt + (1-θ) ∆Κt +θ ∆Ηt
where αt, ∆Κt and ∆Ηt denote respectively the growth of total factor productivity, productive
capacity and labor input. After decomposing these three factors into their “normal”—or potential—and cyclical components using economic theory and/or purely statistical methods, potential growth is expressed as:
∆pt = αt
* + (1-θ) ∆Κt* +θ ∆Ηt
* where the superscript * denotes potential growth rates. The economic approach shares some of the problems of the statistical approach. In particular, total factor productivity is unobservable and, being calculated residually, could be contaminated by omitted variables and other specification errors. 35. At the practical level, each approach has its strengths. In cases where, like in Greece, the effect of exceptional factors on output is more accurately estimated than their effect of capital and employment, statistical estimates of potential growth could be more accurate than the ones based on the production function. Ideally, the best of each approach could be brought together through a multivariate Kalman filter.
36. The rest of this section presents statistical estimates of potential growth. There are broadly three signal extraction techniques to estimating potential growth:
• Smoothing filters: these define the trend by certain smoothness characteristics, which use them to construct the estimates. For instance, the Hodrick-Prescott filter constructs a smooth trend series {τt} that minimizes ∑(yt-τt)2+λ·∑(∆τt+1-∆τt)2, where λ
- 22 -
is the penalty on variations in trend growth. The popular choice of λ=100 eliminates from annual series cyclical fluctuations at frequencies lower than eight years.22
• Band-Pass filters: these differentiate {τt} and {ct} by their cyclical characteristics and form estimates that attenuate certain frequencies. For example the Baxter-King and Christiano-Fitzgerald filters are linear filters that isolate periodicities between a lower and an upper bound (usually 1.5 and 8 years). The advantage of band-pass filters over the HP filter is their flexibility to isolate specific frequencies; in practice, however, their estimates are similar to those of the HP filter.
• Signal extraction filters: these define {τt} and {ct} by specific stochastic processes and apply signal extraction methods such as the Kalman Filter. The power of the multivariate Kalman filter rests in its ability to incorporate economic theory (for instance, information about inflation, unemployment and other relevant factors) to sharpen the identification of the cyclical and trend components. A potential disadvantage, stemming from the non-linearity of the filter, is that convergence is not assured and the solution may be sensitive to the choice of starting values, especially of the variances.
37. Filters work well with stationary time series but often encounter problems when applied to actual economic series. In particular, smoothing and (to a lesser extent) band-pass filters tend to be imprecise (i) if at the boundaries of the sample the series happens to be off-phase, (ii) when the series is subject to persistent non-periodic shocks and (iii) when the smoothness assumption is not supported by the data. All three problems appear to be present in the Greek GDP series. Specifically, in the last years of the sample, the exceptional factors have boosted activity, which may therefore be above potential. These elements tend to introduce a positive bias in filter-based estimates of underlying growth, but have also been responsible for the repeated upward revisions of potential growth estimates in the recent past. Finally, the filtered series—being smooth by construction—has been slow to pick up the structural breaks in the data generating process that appear to have occurred around 1980 and 1995.
22 This parameterization comes from Burns and Mitchell (1944), whose research suggested that business cycles in the US economy last up to eight years.
- 23 -
0.0
0.5
1.0
1.5
2.0
2.5
3.0
3.5
4.0
1980 1985 1990 1995 2000 2005
end-point 2000end-point 2002end-point 2005
Potential growth estimates were revised upwards repeatedly in recent years and ...
Real GDP growthPeriod averagesReal growth, HP-based
… the HP filter was slow to pick up the changes in GDP growth.
38. Against this background, two modifications were made in the estimation of the filters. First, the estimation horizon was extended beyond 2005 in an attempt to mitigate the end-of-sample problem. For this purpose, a baseline scenario was used that postulates a smooth transition from the currently high growth to the slower rates implied by population aging (see below). Second, in an attempt to remove the bias from non-periodic shocks, the filters are applied to an adjusted GDP series, which excludes the effect of immigration, cyclically low interest rates, and the Olympics, namely three of the exceptional factors identified above. The effect of rapid credit expansion to households has not been removed to ensure compatibility with the baseline scenario that postulates continued strong, albeit declining, credit growth in the immediate future.
Memorandum items:Average 3.5 3.5 3.5 3.5 3.5 3.5Differential from filters based on unadjusted data 0.4 0.5 0.6 0.6 0.5 0.4
1 To ensure convergence, the Kalman filter is estimated with restrictions on the variances of the error terms.
Potential Growth Estimates Based on Adjusted GDP Data(In percent)
- 24 -
39. The results of the estimation can be summarized as follows:
• Underlying growth rose significantly in 1995-98 and is currently about 3½ percent a year. The differences among the various estimates are insignificant and insensitive to the length of the estimation horizon. However, the estimates are subject to considerable uncertainty stemming from their reliance on the future growth path. Substantial deviations from the baseline, in either direction, and thus revisions of the estimates cannot be excluded.
• On current trends, underlying growth could decline in the medium term. This stems from the fact that the effect of the rapid credit expansion to households, estimated in Section C at around 0.4 percentage points, is included in the adjusted GDP series. Thus, as this runs its course, underlying growth would ease towards 3 percent.
• Exceptional factors artificially raise potential growth by ½ percentage point, estimated as the difference in the potential growth estimates of the unadjusted and adjusted GDP series. This is close to the estimate (0.7 percentage points) presented in previous section.
• The Regime Switching model confirms the above estimates. This model (Appendix I), which by construction can identify reversals in trend growth and is increasingly used for business cycle dating, suggests that the Greek economy has been in the fast growth state uninterruptedly since 1994 and that, based on quarterly data until 2005, the probability of reverting to slow growth is almost zero.23
23 The model suggests also the economy went into recession in 1981-83, 1986-87 and 1992-94, a result that is consistent with, but more refined than, those based on structural break tests. Tavlas and Zonzilos (2001) discuss the application of the Zivot-Andrews test to the Greek GDP series.
- 25 -
E. What Accounts for the Recent Rise in Growth?
40. A growth accounting exercise indicates that the rebound in total factor productivity (TFP) was the main factor behind stronger growth. The growth in labor input and the pick up of investment had a much smaller contribution to the acceleration of growth.24
1980-94 1995-2004
Contributions to growth
accelerationGDP growth 0.8 3.7 2.9Contributions: Labor 0.2 0.9 0.6 Capital 1.0 1.6 0.6 Total factor productivity -0.4 1.3 1.7
Contributions to GDP growth
0 1 2 3 4
IrelandFinland
AustraliaGreece
United StatesSwedenCanada
New ZealandUnited Kingdom
BelgiumGermanyPortugalDenmark
NetherlandsFrance
AustriaItaly
TFP growth, 1995-2004 (In percent)
41. The rebound of TFP growth is mostly structural, although temporary factors have also played a role. TFP has benefited from structural reforms and privatizations, the reduction of distortions in resource allocation—especially, the eradication of inflationary expectations—and the introduction of new information and telecommunication technologies.25 At 1.3 percent, TFP growth has been strong by international standards although below TFP growth in several high income/productivity economies. Moreover, the rebound in TFP is not exceptional for an economy emerging from a protracted period of declining TFP and with ample room for catching up. To some extent, however, it relates also to the cyclical upswing of the economy and the absence of comprehensive statistics on resource utilization, especially in services.26
24 The calculations were based on an elasticity of output with respect to labor of 0.65, which is estimated from a Cobb-Douglas production function that allows for structural breaks in the TFP series. No adjustment was made for changes in the quality of factor inputs. TFP growth was calculated by subtracting a weighted average of the growth of capital and labor input from actual growth.
25 See Nikolitsa (2005) for a detailed analysis of the decline and rise in labor productivity in Greece and of factors impeding the convergence of productivity to the euro area average. The latter include over-regulation, the small size of enterprises, sluggishness in adopting new technologies, the competition deficit in several sectors, and the regression—in relative terms—of the education system.
26 Being calculated as a residual, TFP growth incorporates also the effect of omitted variables (such as the quality and utilization of labor and capital); measurement errors (including the employment of immigrant workers); and changes in the structure of production.
Greece: Long-Term Growth and its Determinants, 1965-2004
42. In addition, measurement problems have imparted an upward bias to productivity. This bias stems, first, from the expansion of illegal immigration, which by being under recorded in the LFS, artificially raises productivity growth. This is particularly pronounced in construction, a sector that relies heavily on immigrant workers, where productivity grew in 1995-2004 at a annual average rate of 8.7 percent, by far the highest among other sectors and almost triple the national average. Second, the productivity increase is related also to a possible downward bias in the public investment deflator that causes a corresponding overestimation of real GDP and, hence, productivity. These two factors are estimated to have added 0.2–0.3 percentage points to measured as opposed to true multifactor productivity growth.
43. Labor and capital contributed 0.6 percentage points each to the growth acceleration. The labor input was boosted by the increase in the participation rate and the reversal of the upward trend in unemployment. The higher contribution of capital stems from a rebound in business investment, which rose to 14.5 percent of GDP at constant prices. However, the
- 27 -
effect of this increase on capital and the capital-labor ratio was blunted by some pick up in the depreciation rate (due to technological progress). On average, capital deepening added 1.1 percentage points to growth and raised labor productivity growth to 2.4 percent, the second highest after Ireland among OECD countries. The increases in investment and labor participation as well as the decline in unemployment are likely to contain some cyclical component, the measurement of which is subject to considerable uncertainty before the completion of the business cycle.
44. The rebound in growth was uneven. It was led primarily by non-financial services, which represent almost 30 percent of GDP, including telecommunications and tourism. This sector accounted for 1.7 percentage points, or almost half of the growth during 1995-2004. Construction, too, expanded at a very fast pace but, owing to its much smaller share in output, had a smaller contribution to growth. Industry, on the other hand, has been undergoing significant restructuring. Under pressure from strong international competition, it has been registering sizeable productivity gains but also downsizing and plant closures.
Labor productivity Employment
(Composition, in percent)
(Contribution to growth)
Agriculture, forestry, fishing 6.4 0.0 0.0 2.5 -2.5Industry, including energy 13.7 0.3 2.2 3.5 -1.2Conctruction 8.6 0.7 11.7 8.7 2.8Trade 28.6 1.4 5.7 4.4 1.2Financial and business services 20.9 0.6 3.0 -1.1 4.1Other services 21.9 0.6 3.2 0.9 2.3
Total 100.0 3.8 3.8 3.0 0.8Sources: NSSG and IMF staff calculations.
(Percent changes)
Developments in GDP by Sector, 1995-2004
GDP
45. The uneven contribution of the various sectors to growth points to vulnerabilities as well as opportunities. The pace of growth in the newly liberalized telecommunications is likely to ease in the medium term as the sector approaches maturity. Similarly, the future contribution of the construction sector would depend on infrastructure investment—for which there is ample scope but also binding financing constraints—and conditions in the real estate market. On the other hand, services have potential but need to be supported by a more flexible and pro-growth institutional environment and strategic plans to develop further key sectors such as tourism.
- 28 -
F. Is the Better Growth Performance Sustainable over the Medium Term?
46. The production function approach suggests that underlying growth accelerated to 3.6 percent a year during the period 2000–04.27 The acceleration was driven primarily by capital (due to the rise in investment) and the pick up in trend productivity. Labor was neutral as aging offset a rise in the participation rate. Potential growth was slightly higher, 3.9 percent, since it includes also the effect of exceptional factors (immigration, monetary stimuli and the Olympics) on the growth of capital and total factor productivity.
2000-04 2005-10
Potential growth 3.6 3.3Contributions Labor 0.5 0.4 Capital 2.0 1.9 Total factor productivity 1.1 1.0Memorandum item:Actual growth 4.4 3.2
Underlying growth and contributions, 2000-2010
47. Potential growth is projected to slow gradually to about 3 percent by 2010. Central to this projection, which assumes current policies and trends, is that credit expansion to households, which in recent years boosted GDP by 0.4 percentage points, slows gradually as the market for household credits matures. A possible scale down in EU transfers, which have been instruments for infrastructure projects, and further erosion in Greece’s external competitiveness due to continuing inflation differentials and fast reforms in competing economies could also slow growth. From the supply side, the slowdown in potential growth reflects an assumed modest slowing of TFP growth and a decelerating working age population due to aging. As a result, potential growth is projected to average 3.3 percent during 2005–10 (Table 1). However, substantial uncertainty surrounds such estimates and changes in policies could be decisive. For example, recent OECD (2005) calculations suggest that a combination of product and labor market reforms could boost growth by up to 1½-percentage point annually for a number of years.
48. The above estimates exceed earlier staff estimates, are broadly similar to current estimates by other international organizations, and are somewhat lower than the authorities’ estimates. Earlier staff estimates (Vamvakidis, 2002, and Lutz, 1998) put potential growth at 2.6–3 percent based on lower estimates of productivity growth and capital accumulation. At that time there was little compelling evidence of a structural increase in TPF growth, and investment. Since then, however, the Greek economy has consistently exceeded expectations. 27 Underlying growth is estimated from trend growth in factor inputs and total factor productivity, excluding the impact of exceptional factors as discussed in Section C.
- 29 -
The latest OECD (2005) and European Commission (2005) estimates of potential growth are, respectively, 3¾ and 2.9 percent, and both project a modest decline in the years ahead. The authorities estimate potential growth at 3¾–4 percent on a more optimistic assessment of TFP and factor growth.
49. Real time estimates of potential output are subject to significant uncertainty due to the inherent difficulty of distinguishing between trend and cycle in the most recent observations. The characterization of, say, a rise in TFP growth as trend shift or temporary shock depends on the duration of the increase and the path of future increases,28 which can only be ascertained ex post, usually after considerable lag. An additional source of uncertainty is revisions in national accounts. Thus in real time one can make at best a probabilistic statement, based on available information, and keep updating it as new information accrues. The chart below illustrates the sensitivity of potential growth estimates to perturbations in the baseline scenario.
BaselineBaseline plus 0.5 percentBaseline minus 0.5 percentPortugal-type slump
Future growth prospects have a strong impact on potential growth estimates
G. What would be the effect of population aging on long-term growth?
50. Like in other European economies, the long term growth outlook is dominated by the impending population aging. Greece’s population is set to start declining around 2020. The share of population older than 64 will almost double to 31 percent by 2050 and the old-age dependency ratio—the population over 64 divided by those in the 15-64 cohort—to approach 77 percent (Figure 3). By 2050, only one out of every two persons will be of working age. Although long-term demographic projections are inherently uncertain, the factors underlying the population aging are beyond dispute: life expectancy has increased rapidly while fertility
28 For example, the assessment as to which portion of a rise in TFP growth from, say, 1 to 1.5 percent is permanent or transitory would be different depending on whether subsequent growth is 2 percent, 1.5 percent or only 0.5 percent.
- 30 -
has dropped to one of the lowest in Europe (Figure 4). Barring a major surprise, these trends are well entrenched and likely to continue.
Baseline scenario
51. Mainly as the result of population aging, potential growth is projected to drop from 3½ percent currently to just below 1 percent a year by 2050. Capital deepening and technological progress are assumed to keep annual labor productivity growth close to 2 percent (Table 1). But the decline in the population and the rise in old-age dependency will reduce total hours worked and shave almost 1 percentage point off GDP growth. Increases in the retirement age and the participation rate—both of which are low by international standards—and the drop of unemployment from its currently very high level would provide a temporary relief; immigration cannot be relied on to sustain growth, given that Greece already has a relatively high share of foreigners in the population. The acceleration of structural reforms could boost total factor productivity but, if reforms were to falter, potential growth could be lower than envisaged in the baseline.29 The long-term growth outlook is based on projections for labor and capital inputs and TFP embedded in a two-factor Cobb-Douglas production function. The analytical framework of the projections is outlined in Appendix II.
52. Labor input is projected to peak around 2020 and start declining thereafter dragging down GDP growth (Figure 5). Labor input is measured in hours and is calculated as the product of population, the share of working-age population, the participation rate, the employment rate, and average hours worked per employed.
• Population in the NSSG’s baseline scenario starts declining around 2020 when declines in the indigenous population start to more than offset net immigration.30
29 The Ministry of Economy and Finance in the 2004 update of the Stability and Growth Programme and the European Commission (2005) project a similar outlook for growth.
30 Further details on l population projections can be found in the 2005 National Strategy Report on Pensions.
• The share of working-age population is projected to decline from 68 percent to 56 percent between 2005 and 2050, exacerbating the decline in population and bringing forward to the early 2010s the peak in working age population.
• The participation rate is set to rise to 70 percent as women continue to take up work and early retirement dissipates.
• The employment rate increases in tandem with the decline of unemployment to 7 percent by 2030.
• Average hours worked per employed decline until 2020 and remain constant thereafter. Average hours have been declining since 1970 as a result of more holidays and shorter workweeks but the shortening of the workweek may now have reached a limit. Part-time employment is expected to expand as more women enter the labor force, elderly move into semiretirement, and enterprises rely increasingly on flexible employment arrangements. As a result, the ratio of hours worked per full-time employee to hours worked per part-time employee is projected to rise slightly leading to a small further decline in average hours until 2020.
53. Capital accumulation affects growth through capital deepening. Capital input is measured as the product of capital stock (excluding residential structures) times its utilization rate. Capital stock projections are based on a constant investment rate of 16 percent of GDP and a depreciation rate of 6 percent, which correspond to their averages in 2000-04. The investment rate affects the path towards the steady state but not the steady state itself. Over time, the effect of investment on capital is being eroded by depreciation from the rising capital stock.
54. Total factor productivity, projected to grow by 1 percent a year, is the main contributor to long-term GDP growth. The risks to the TFP growth scenario are balanced. On the downside, aging may depress TFP growth as older societies could be less innovative and flexible; moreover, the expansion of the services sector (especially elderly care) could slow overall productivity growth. On the upside, structural reforms could raise TFP growth permanently by encouraging the reallocation of resources from low to high productivity sectors, improving education and recruiting actively high skilled and enterprising immigrants, and creating an economic environment conducive to innovation.
How Robust is The Baseline Scenario?
55. The long-term GDP outlook depends on long-term growth and on shocks that permanently shift the GDP path. Long-term growth is driven by three factors: growth in hours worked (Ĥ), TFP growth (Â), and the labor elasticity of output (θ). These are related to GDP growth (Ŷ) through the equation Ŷ = Ĥ + (1/θ) Â (see Appendix II). Thus, with TFP set to grow at 1 percent and labor elasticity at 0.65, labor productivity will grow at 1.5 percent in the steady state; and with hours declining by 0.9 percent a year, GDP growth converges to 0.6 percent, which is reached some time after 2050. Shocks that can permanently shift the
- 36 -
level of GDP, but not the growth rate, include changes in the NAIRU, labor force participation or the investment rate.
56. A sensitivity analysis of the baseline scenario suggests that the long-run growth rate of real GDP could vary between 0.4 percent and 1.4 percent a year. The lower bound corresponds to the low-population growth scenario and the upper bound to high population and TFP growth.
• The investment rate affects the level of the GDP trajectory but not the long-run growth rate. Nevertheless, a higher level is important for fiscal sustainability because it reduces fiscal imbalances in flow terms. If, because of reforms that make Greece more attractive as a business location, the investment rate increases by 4 percentage points over its baseline of 16 percent, average growth would be 2 percent a year—0.2 percentage points above the baseline—and the level of GDP in 2050 would exceed the baseline by 12 percent.
• The “high” population scenario would raise average output growth in 2050 from 0.9 to 1.4 percent and boost average growth during 2005-50 by 0.3 percentage points. Similarly, the “low” population growth scenario would reduce average growth by 0.3 percentage points. An important ingredient of these scenarios is immigration.
• The low labor force participation rate and the high unemployment rate allow large scope for raising output levels, but not long-term growth. For instance, a reduction of the unemployment rate by 3 additional percentage points would temporarily raise output growth by up to ½ percentage point for several years.
• An increase in the retirement age by 4 years postpones the time when the labor force starts declining. Such an increase, phased in over a period of 16 years, does not affect the long-term growth rate, but raises the level of GDP by 9.6 percent relative to the baseline.
• Raising TFP growth by 0.3 percentage point raises long-term output growth by 0.5 percentage point. The effect on output growth is “magnified” by a factor of (1/θ) because higher TFP growth raises the steady state growth of the capital/labor ratio in physical units and hence capital deepening (see Appendix II).
57. The above projections abstract from interactions among growth, the fiscal situation, and policies. For example, if along any of these paths public debt reaches a level that makes investors uncomfortable, credit ratings could suffer and interest rates rise, exacerbating the pressure on public finances. As a result, investment and growth would also suffer. Policies can also affect behavior and distort choices. Raising taxes to improve the fiscal situation could discourage labor supply and capital accumulation thereby reducing growth.
BaselineHigh population growthLow population growthHigher retirement ageHigh investment rateHigh participation rateLower unemploymentHigh TFP growth
- 38 -
H. Concluding Remarks
58. The main focus of this paper was to estimate potential growth in Greece and evaluate the growth prospects. The results show that potential growth increased considerably in recent years, reaching 3 ½ percent, supported by a rebound in productivity growth, strong investment and an expanding labor due to immigration and increasing participation. In addition to the rebound in potential growth, actual growth has also benefited from a number of exceptional factors (Olympics, EMU accession, and financial liberalization) which have contributed about 1 percentage point in recent years.
59. The estimates suggest that potential growth will slow eventually as productivity growth settles to a more sustainable level and, especially, as the population ages. Reforms that reduce unemployment and increase labor force participation and investment can raise output growth considerably over the medium term and, thus, are of profound importance for economic welfare in general and fiscal sustainability in particular. However, these reforms have no impact on long run growth. Key to higher long-term growth is policies that raise productivity growth, mainly education and the creation of an open, competitive and dynamic economy.
- 39 - APPENDIX I
Markov Regime Switching (MRS)
The MRS approach to the business cycle, pioneered by Hamilton (1989), models output growth as an autoregressive process switching between two regimes or states of nature. Growth in each regime is given by: ∆Yt = µs(t) + φ1∆Yt-1 +…+ φp∆Yt-p + ut (1) where S(t) is a discrete random variable that takes the values 1 or 2 depending on whether the economy is in the fast- or slow-growth regime with respective drift rates µ1 and µ2 (µ1 > µ2). The autoregressive coefficients measure the persistence of growth shocks ut , where E(ut )=0 and V(ut )=σ2. The business cycle is associated with the shifts in S(t), whereas the random shocks ut capture other fluctuations unrelated to the cycle. The model is completed by specifying the evolution of regimes. In every period the economy switches randomly between the two regimes and the probability that if the economy is in regime i in period t it will switch to regime j in period t+1 is modeled as a two-state Markov process:
P{ s(t)=j│s(t-1)=i, s(t-2), s(t-3), ...} = P{ s(t)=j│s(t-1)=i} ≡ pij (2) That is, the conditional transition probability pij depends only on the current state of the economy, not on earlier states. Generalizations of the model include more than two regimes, regime-specific autoregressive coefficients and random shocks as well as the linking of the transition probabilities to institutional and other features of the regimes, for instance, the quality of institutions and policy frameworks. The model (1)-(2) was estimated with quarterly seasonally adjusted GDP from 1981:02 to 2005:01: Variable Coefficient Standard error t-statistic µ1 0.867 0.049 17.5 µ2 -0.238 0.106 -2.2 φ1 -0.131 0.088 -1.49 φ2 0.200 0.082 2.44 φ3 -0.056 0.078 -0.7 φ4 -0.572 0.077 -7.4 p11 0.948 0.031 30.6 p22 0.891 0.072 12.4 σ 0.525 0.044 11.9
Total factor productivity: At = (1 +  ) · At-1 or equivalently: Et = (1 + Ê ) · Et-1 Capital accumulation: Ct=(1-δ) · Ct-1 + i · Yt-1 Hours worked Ht = Lt · ht Hours per employed: ht = hft · (1- πt ) + hpt · πt Employment: Lt=(Population)t · (activity rate)t · (participation rate)t· (1-URt ) Where: The circumflex ^ denotes percent change Y = real GDP A = total factor productivity, which grows at a constant rate  E = Harrod neutral technical progress which is related to total factor productivity by At= E t
θ and, in terms of rates of change, by Ât = θ · Êt u = capacity utilization. It is set at its historic average constant after the completion of the current business cycle. C = capital stock H = total hours worked hf, hp = hours worked per full-time and per part-time employee π = share of part-time employment L = employment UR = unemployment rate. It is set equal to the NAIRU after the completion of the cycle. The above model enables us to express GDP growth as the sum of seven components: Ŷ =[ Â + (1-θ)(capital deepening)] +ĥ + (population growth)+ (aging) + (participation growth) – (unemployment decline) where capital deepening is defined as Ĉt – Ĥt and the bracketed term in the above expression equals labor productivity growth: Ŷt – Ĥt = Ât +(1-θ)( Ĉt – Ĥt ). In terms of Harrod neutral technical progress, labor productivity growth is written as: Ŷt – Ĥt = θ · Êt +(1-θ)( Ĉt – Ĥt ). At the steady state, the following relations hold among the key variables: • The capital-labor ratio, expressed in efficiency units, Ct /(Et·Ht ), remains constant.
• Expressed in physical units, the capital-labor ratio increases at the rate of: Ĉ – Ĥ = (1/θ) Â = Ê.
• The growth of labor productivity per hour worked depends on TFP growth and the labor elasticity of output: Ŷ – Ĥ = Â +(1-θ)( Ĉ– Ĥ) = (1/θ) Â = Ê.
• The output-capital ratio remains unchanged: Ŷ = Ĉ
• Output growth is the sum of growth in labor productivity and hours worked: Ŷ = (1/θ) Â + Ĥ = Ê + Ĥ
- 41 -
REFERENCES Alogoskoufis, George, 1995, “The Two Faces of Janus: Institutions, Policy Regimes and
Macroeconomic Performance,” Economic Policy, No 20, pp 147–92. Baldwin-Edwards, Martin, 2004, Statistical Data on Immigrants in Greece, Mediterranean
Migration Observatory, Panteion University, Athens, Greece. Baldwin-Edwards, Martin, 2005, “Statistical Data on Immigrants in Greece: An Analytical
Study of Available Data and Recommendations of Conformity with EU Standards,” Mediterranean Migration Observatory.
Banerji, A., 2004, “The Greek Tortoise and the Irish Hare”, in IMF Country Report
No. 05/38, pp 12-29. Bank of Greece, 1978, “The First Fifty Years of the Bank of Greece, 1928–78”, Bank of
Greece, Athens. Bank of Greece, 1982, “The Greek Economy”, Bank of Greece, Athens. Bosworth, Barry and Tryphon Kollintzas, 2001, “Economic Growth in Greece: Past
Performance and Future Prospects,” in Bryant et. al. (eds.) “Greece’s Economic Performance and Prospects,” Bank of Greece and the Brookings Institution.
Bryant, Ralph, N. Garganas and G. Tavlas (eds.), 2001, “Greece’s Economic Performance
and Prospects,” Bank of Greece and the Brookings Institution. Christofides, Charalambos, 1996, “Growth Performance: A Survey of the Literature,” in
Greece-Recent Economic Developments and Statistical Issues, IMF Country Report 96/121.
European Commission, 2005, “The budgetary projection exercise of DG ECFIN and the
Ageing Working Group: detailed desription of agreed underlying assumptions and of projection methodologies,” ECFIN (2005)REP/E3/NDG/53678
Featherstone, Kevin, 2003, “Greece and EMU: Between External Empowerment and
Domestic Vulnerability,” Journal of Common Market Studies, Vol. 41, No. 5, pp. 923–40.
Garganas, Nicholas and Georg Tavlas, 2001, “Monetary Regimes and Inflation Performance:
The Case of Greece,” in Bryant et. al. “Greece’s Economic Performance and Prospects,” Bank of Greece and the Brookings Institution.
Hamilton, James, 1989, “A New Approach to the Economic Analysis of Non-Stationary
Time Series and the Business Cycle,” Econometrica, vol. 55, no. 2, pp.357–84.
- 42 -
Hilbers, P., Otker-Robe, I., Pazarbasioglou, C., and Johnsen, G., 2005, “Assessing and Managing Rapid Credit Growth and the Role of Supervisory and Prudential Policies”, IMF Working Paper 05/151
Jermanowski, M., 2005, “Empirics of Hills, Plateaus, Mountains and Plains: a Markov-
Switching Approach to Growth,”forthcoming in Journal of Development Economics. Jones, B. and B. Olken, 2005, “the Anatomy of Start-Stop Growth,” mimeo. Kanellopoulos, Kostas, Kousoulakos, I. and Rapanos, B., 1995, Underground Economy and
Tax Evasion, KEPE, Athens. Kasimis, Charalambos and Ch. Kasimi, 2004, Greece: A History of Immigration,
unpublished manuscript. Koutsogeorgopoulou, V. and H. Ziegelschmidt, 2005, “Raising Greece’s Potential Growth”,
Economics Department working paper No. 452, OECD, Paris Levinson, Amanda, 2005, “Regularization Programs in Greece,” Centre on Migration, Policy
and Society, Oxford University. Lianos, Theodore, 2004, “The Optimal Size of Immigrant Stock,” pp. 55–68 in “Essays in
Economic Analysis: A Festschrift for the 45th Foundation Anniversary of KEPE,” Athens.
Lutz, Mark, 1998, “Potential output and the Output Gap in Greece: a Third Face for Janus?”
in Greece: Selected Issues, IMF, Washington, DC Ministry of Economy and Finance, 2005, “National Reform Programme for Growth and
Jobs, 2005–2008,” Athens Ministry of Employment and Social Protection and Ministry of Economy and Finance, 2005,
“The Greek National Strategy Report on Pensions,” Athens Nicolitsa, Dafni, 2005, “Per Capita Income, Productivity and Labor Market Participation:
Developments in the Greek Economy,” Bank of Greece, Economic Bulletin, No. 25, pp. 41-68.
OECD, 2005, “Annual Review-Greece,” OECD, Paris Pagoulatos, George., 2001, “The Enemy Within: Intragovernmental Politics and
Organizational Failure in Greek Privatization”, Public Administration, Vol. 79, No. 1, pp. 125–46.
Patsouratis, V., Frangouli, Z. and Anastasopoulos, G., 2005, “Competition in Tourism among
the Mediterranean Countries,” Applied Economics, vol. 37, pp. 1865–70.
- 43 -
Reyneri, Emilio, 2003, “Illegal Immigration and the Underground Economy,” Paper Presented at the conference The Challenges of Immigration and Integration in the EU and Australia, 18–20 February 2003, University of Sydney.
Spanou, C., 1996, “On the Regulatory Capacity of the Hellenic State: A Tentative Approach
Based on a Case Study,” Int’l Review of Administrative Sciences, Vol. 62, pp. 219–37.
Spraos, John, 2001, “EU Transfers and Greece’s Real Exchange Rate: A Naked Eye View”,
in Bryant e. al. “Greece’s Economic Performance and Prospects,” Bank of Greece and the Brookings Institution.
Schneider, Friedrich and D. Enste, 2000, “Shadow economies Around the World: Size,
Causes, and Consequences,” IMF Working Paper 00/26. Sideris, G. and N. Zonzilos, 2005, “The Greek Model of the European System of Central
Banks Multi-Country Model,” Working Paper No. 20, Bank of Greece, Athens. Tatsos, N., 2001, “Underground Economy and Tax Evasion in Greece,” Foundation for
Economic and Industrial Research (IOBE), Papazisis, Athens. Vamvakidis, Athanasios and L. Zanforlin, 2002, “The Determinants of Growth: The
Experience in the Southern European Economies of Greece and Portugal,” IMF Country Report No. 02/91
Vavouras, Ioannis and George Manolas, 2003, “The Underground Economy in Greece and
Around the World,” Papazisis Editions, Athens, Greece. Voridis, Hercules, Eleni Angelopoulou and Ifigenia Skotida, 2003, “Monetary Policy in
Greece 1990–2000 through the Publications of the Bank of Greece,” Bank of Greece Economic Bulletin, No. 20, January, pp. 7–86.
- 44 -
II. GREECE: ISSUES IN PENSION REFORM1
A. Introduction
1. As has been known for several years, as their populations age virtually all advanced economies will face increasingly severe fiscal pressures stemming from rising costs of so-called first-pillar pensions and of health care. According to the most recent figures available (the 2001 EPC study), Greece is projected to experience by far the largest increase in these costs between now and 2050 of any EU-15 country (Figure 1). This fact, and an already very high level of public debt in relation to GDP highlight the importance of pension reform in Greece.
Source: EPC/ECFIN/655/01, and European Commission.
Figure 1. Pension Expenditure(in percent of GDP)
0
5
10
15
20
25
30
EL ES AU DE FIN FR IT NL BE DK PT SW LU IRL UK0
5
10
15
20
25
30
2000 2050 as of 2001 EPC report 2050 Revised as of 2004
2. In brief, the Greek pension system relies almost exclusively on government-backed—that is, first pillar—pensions, which offer comprehensive coverage, are largely unfunded, and are provided by a very large number of self-governed social insurance funds. While these funds have considerable autonomy (in terms of investing funds, for example), the fact that they are backed by the government implies that shortfalls will, one way or another, be reflected in the overall general government fiscal position.
3. It is this aggregate level, as distinct from the actuarial prospects of the individual funds, that is appropriate for analysis of the sustainability of the pension system.2 A key concept of the analysis is the “pension balance”: social insurance contributions (plus possibly revenue from funds’ assets) less benefits. Other tax revenue or payments by central
1 Prepared by Christiane L. Roehler (FAD). 2 Greek statistics therefore correctly classify social insurance funds as part of general government.
- 45 -
government to the pension system—earmarked taxes, contribution subsidies for certain employees, legally mandated general contributions to some pension funds, or ad hoc transfers to cover the cash flow deficits of funds—are not pension revenue, but government transfers.
4. The Greek pension system already has a significant deficit, which is projected to rise sharply in the years ahead. Assuming pension costs evolve according to the 2001 EPC study, overall deficits evolve according to the staff baseline projection until 2010, and a constant non-pension primary deficit (at the 2010 level) thereafter, the combination of increasing pension deficits and interest payments ensures the debt-GDP ratio will explode (Figure 2). If instead the staff alternative scenario of budget balance by 2010 is assumed (but the other assumptions are maintained), the rise in the debt-GDP ratio would be significantly slowed, but would nevertheless still explode eventually (Figure 3).
Source: IMF staff estimates and projections.
-35
-30
-25
-20
-15
-10
-5
0
2005 2014 2023 2032 2041 2050-35
-30
-25
-20
-15
-10
-5
0
Net pension costsDeficit baseline
0
50
100
150
200
250
300
350
400
450
2002 2008 2014 2020 2026 2032 2038 2044 20500
50
100
150
200
250
300
350
400
450
Public debt
Figure 2. Long-run Fiscal Dynamics(in percent of GDP)
5. In light of these observations, this chapter surveys the current state of the Greek pension system, presents our understanding of its financial state, analyzed specific institutional features that contribute to its unusually high projected rise in costs, discusses the impact of the system’s fragmentation, and considers further reforms based on the experiences of other European countries.
B. An Overview of the Greek Pension System
6. The system is very fragmented, reflecting its history of evolution from a piecemeal system of occupational schemes. Hence, membership and insurance rules, which are based on the sector of employment, vary substantially. Despite consolidation in the 1990s, there are still 173 social security funds (Table 1).3 Of these, 24 are primary funds that provide the main pension, and 124 are supplementary, lump sum, and provident funds. In addition to pensions, most primary funds also provide health cover, or provide it through another fund. Some funds provide additional benefits, like family benefits.
3 The National Statistical Service of Greece (NSSG) currently includes 140 social insurance funds in its recently established survey, used to compile fiscal statistics.
- 47 -
Table 1. Greece: Structure of the Social Insurance Fund system 2004, by supervising agency
I. Ministry of Labor and Social Insurance Main insurance 23Supplementary insurance 34Sickness funds 16Lump sum benefit funds 19Other benefits (e.g., unemployment, housing) 3
II. Ministry of Defense Supplementary insurance 3Lump sum benefits 7
III. Ministry of Economy and Finance Supplementary insurance 1
IV. Ministry of Marine Main insurance 1Supplementary insurance 1Sickness 1Lump sum benefits 4
V. Ministry of Agriculture Insurance of agricultural production 1
VI. Hellenic Parliament Lump sum benefits 1
VII. Insurance Agencies Sickness benefits for employees of public water utility 1
VIII. Mutual Aid Societies Provident funds 54
IX. Occupational funds Fully funded provident funds 3
Total funds 173of which
Main insurance 24Supplementary insurance 39Sickness 18Lump sum benfits 31Mutual aid provident funds 54Other benefits 4Fundes occupational funds 3
Source: Ministry of Labor and Social Insurance, Social Budget 2004.
7. The major private-sector funds are: IKA, which covers most dependent employees; OAEE, for the self-employed (it has three constituent funds, TEBE, TSA, and TAE); and OGA, for farmers, the rural population, and the otherwise uninsured. IKA provides both primary pension through IKA-ETAM, and supplementary pensions, through IKA-ETEAM, but not all those insured in IKA-ETAM are also insured in IKA-ETEAM. OAEE and OGA do not have supplementary insurance funds.
8. The primary pension funds usually provide a replacement rate of 70 percent. Insurance in supplementary pension funds was made mandatory for dependent employees in 1983, with a customary replacement rate of 20 percent. Thus, the total replacement rate is typically 90 percent. In addition, provident funds can provide lump sum payments upon retirement. Special primary and supplementary funds—mainly for various professional groups (e.g., lawyers, and doctors), public enterprises, and banks4—typically provide more generous benefits. The standard retirement age is 65 years, although some funds with earlier ages are still in the process of moving to this standard.
4 Recent legislation has provided for bank pensions to be folded into other first pillar schemes.
- 48 -
9. The standard contribution rates for primary pension are 6.67 percent for the employee, 13.33 percent for the employer, and (for labor market entrants after 1992) 10 percent by the government. OGA receives 7 percent from farmers, and 14 percent from the government. For supplementary pensions, the standard rates are 3 percent for the employee and 3 percent for the employer. Lump-sum benefit funds are financed solely by employees. Higher contributions apply to some funds, and for jobs in heavy and unhealthy occupations that allow for earlier and more generous retirement. Pension plans sponsored by companies (e.g., banks, public enterprises) often have much higher employer contributions to finance an existing deficit.
10. Many rules for pension contributions, and the calculation, vesting, and levels of benefits vary significantly across funds. For example, IKA benefits are calculated usually on the basis of the final 5 years of salary, OAEE pensions take into account the whole contribution history, and OGA pensions have up to three different components, as past changes to the scheme have resulted in different rules for groups of enrollees.
11. Rules also differ across beneficiaries within funds. The major break is between those who entered the labor force before December 31, 1992, and those who entered after, reflecting a set of reforms that were implemented in 1990-1992 in the wake of severe financial difficulties facing some funds at the time. Generally: rules were made more uniform across funds; contributions were increased or, for some schemes, introduced; insurance periods were lengthened; vesting rules were tightened; and the replacement rate was reduced (though this was never fully implemented and was later reversed). However, those who entered the labor force before 1992 were grandfathered in many respects.
12. A number of changes to pension rules were introduced in the last decade, mainly to make the system more comprehensive and less fragmented. Some of these changes are still in the transition phase. For OGA, an existing non-contributory basic pension was supplemented by a contributory supplementary pension scheme in 1987, and in 1997 a primary pension scheme introduced that will gradually replace the basic pension, and the abolished supplementary scheme. In 1996 a means tested supplementary pension (EKAS) was introduced for those with low benefits. Since the early 1990s, funds were merged or abolished, but mergers of some major primary funds (legislated in 1999 for the self-employed funds into OAEE, and in 2002 for some special funds with IKA) still need to be effected. In 2004, uniform rules for calculating pensions if contributions were made to multiple funds were established.
13. Apart from the funds described above, which apply to those working in the private sector, is the civil service system. For civil servants, primary pensions are paid from the budget. In addition, regular civil servants are insured by three supplementary funds. Benefit levels were until recently more generous than for IKA, but a phased reduction in benefits has been legislated: the calculation of benefits will be shifted from final salary to the average of the last 5 years, replacement rates will be lowered from 80 percent to 70 percent, and the retirement age for women will increase to 65.
- 49 -
14. Funded occupational pensions (second pillar schemes) are very small. They were introduced only in 2002, having previously been prohibited. As of October 2005, only three occupational pension schemes for small professional groups had been authorized. No specific legal provisions for individual pension savings (third pillar schemes) exist in Greece.
C. The Financial State of the Pension System
15. Because the pension system is so complex, reliable projections depend on detailed data. The most recent comprehensive study was carried out around 2000 on the basis of 1998 data, and formed the background for the Greek report on the costs of aging to the European Commission in 2001 (Government of Greece, 2001 a, b, c).5 As no detailed projections have been prepared since, this chapter is largely based on these estimates (Table 2).
16. The 2001 projections estimated that pension expenditures would increase by 12.2 percent of GDP from 12.6 percent of GDP in 2000 to 24.8 percent of GDP in 2050. As contributions were expected to remain nearly constant in relation to GDP, the pension deficit increased by a similar magnitude. The analysis shows that only very optimistic macroeconomic developments (scenario 6) or fairly drastic changes to the pension parameters (scenarios 8, and 10) would significantly reduce this very large pension deficit. Looking at the somewhat shorter run, the pension deficit was projected to rise by 2.1 percent of GDP (to 6.9 percent of GDP) by 2020.
5 See the selected issues paper for the 2002 Greece Article IV report (IMF Country Report No. 02/58) for a more detailed description of these estimates.
- 50 -
Cha
nge
Diff
eren
ce
2000
2020
2030
2050
2000
to 2
050
in c
hang
e2/
rel.
to c
entra
l (1)
Cen
tral p
roje
ctio
ns1
Pens
ion
defic
it (to
tal r
equi
red
gove
rnm
ent t
rans
fers
)4.
86.
911
.116
.812
.0M
emor
andu
m it
em: P
ensi
on e
xpen
ditu
res 1
/12
.615
.720
.224
.812
.2
Cen
tral a
ssum
ptio
nsA
djus
tmen
ts o
f pen
sion
s: In
flatio
n pl
us 1
per
cent
Ave
rage
sala
ry g
row
th e
qual
ave
rage
real
gro
wth
of 1
.75
perc
ent o
ver p
roje
ctio
n pe
riod
Hea
dlin
e pe
nsio
n re
plac
emen
t rat
e: 8
0 pe
rcen
t for
labo
r mar
ket e
ntra
nts p
ost 1
992
(60
perc
ent p
rimar
y, 2
0 pe
rcen
t sup
plem
enta
ry)
Ave
rage
infla
tion:
2.5
per
cent
Sens
itivi
ty a
naly
sis
2Lo
wer
ferti
lity,
hig
her l
ife e
xpec
tanc
y4.
84.
311
.420
.415
.63.
63
Hig
her l
abor
forc
e pa
rtici
patio
n4.
86.
110
.216
.111
.3-0
.74
Rea
l sal
ary
and
grow
th 1
.5 p
erce
nt a
fter 2
030
4.8
7.6
1218
.213
.41.
4
Com
bina
tion
scen
ario
s5
Adv
erse
: low
ferti
lity,
hig
h lif
e ex
pect
ancy
, low
labo
r for
ce p
artic
ipat
ion,
low
gro
wth
4.8
8.7
13.4
23.0
18.2
6.2
6O
ptim
istic
: hig
h fe
rtilit
y, lo
wer
life
exp
ecta
ncy,
hig
h la
bor f
orce
par
ticip
atio
n, lo
wer
un
empl
oym
ent,
high
gro
wth
4.8
4.7
8.2
9.3
4.5
-7.5
Pens
ion
para
met
er a
naly
sis
7Pe
nsio
n in
dexa
tion
by in
flatio
n4.
85.
48.
812
.88.
0-4
.08
Nor
mal
retir
emen
t age
of 6
7 fo
r eve
ryon
e un
der a
ge 5
0 in
200
14.
85.
08.
613
.28.
4-3
.6
9Fa
ster
tran
sitio
n to
pos
t-199
2 ru
les:
Pen
sion
rule
s for
pos
t-199
2 la
bor m
arke
t ent
rant
s als
o ap
ply
to p
re-1
992
labo
r mar
ket e
ntra
nts f
or c
ontri
butio
n ye
ars f
rom
200
1 on
war
d4.
86.
610
.316
.211
.4-0
.6
10Pe
nsio
nabl
e ea
rnin
gs c
alcu
late
d ba
sed
on li
fetim
e ea
rnin
gs h
isto
ry w
ith e
arlie
r yea
rs' e
arni
ngs
reva
lued
at a
vera
ge e
arni
ngs i
ncre
ases
(ins
tead
of f
inal
ear
ning
s for
mul
as)
4.8
6.8
9.5
14.6
9.8
-2.2
Sour
ce: G
over
nmen
t of G
reec
e (2
001a
).1/
Exp
endi
ture
s net
of c
ontri
butio
ns fo
r civ
il se
rvic
e sc
hem
e.2/
For
Gre
ece,
pen
sion
def
icits
incr
ease
thro
ugho
ut th
e pr
ojec
tion
perio
d re
achi
ng th
e m
axim
um in
205
0.
Tabl
e 2.
Gre
ece:
Pro
ject
ions
of p
ensi
on d
efic
its u
nder
diff
eren
t ass
umpt
ions
(as o
f 200
1)
(As a
per
cent
of G
DP)
- 51 -
17. In 2002 Greece reported updated pension projections to the EU that reduce the projected increase until 2050 by 2.2 percent of GDP. This revision was the result of five offsetting factors. Three factors reducing costs were a policy commitment to adjust pensions only in line with price inflation, rather than civil service wage increases (a saving of about 4 percent of GDP by 2050), a phased reduction of civil service primary pension replacement rate from 80 percent to 70 percent, and more benign population projections. Raising costs was a reversal of the decision to cut the primary pension replacement rate to 60 percent, and more generous calculations for minimum pensions in IKA.
18. More recent developments, however, indicate that the initial 2001 projections may prove more accurate, though the necessary detailed analysis remains to be done. Importantly, revised demographic projections prepared for the EU Working Group on Aging (European Commission, 2005a) indicate that the population and employment dynamics may be worse than previously assumed (Table 3). While the old age dependency ratio (ages 65 an up in relation to ages 15-65) is expected to increase by a similar magnitude, the effective economic dependency ratio (not employed, 15 years and older, relative to the employed 15 years and older) increases much more sharply (Figures 4). This outcome is due to revisions of assumptions along a number of dimensions: longer life expectancy, lower fertility rate, lower female labor market participation, and a smaller decline in unemployment.1
Recent Financial Developments in Social Security Funds
19. Recent data on pensions and the social security funds also indicate an upward drift in pension expenditures, in contrast to the 2001 projections which showed fairly flat spending until about 2010. It seems, however, that the gap between pension expenditures and contributions remained roughly constant, and hence the pension deficit remained approximately in line with the 2001 projections. Unfortunately, no data directly comparable to the 2001 pension study are easily available. The main sources of information are the Social Budget,2 the European System of Integrated Social Protection Statistics (ESSPROS), and the national accounts.
20. The Social Budget shows a clear upward trend in pension expenditures since 1998 (an increase of 2 percent of GDP), mainly driven by the main primary insurance, and the means tested program EKAS that provides supplementary pensions for low pensions (Table 4). At the same time, total social insurance contributions also increased, slightly
1 The new projections have a more optimistic immigration assumption of 35,000 a year (as opposed to about 25,000 a year in the initial projections), which implies that by 2050 about 2 million of 10.5 million residents will be immigrants arriving after 2004 or their descendents.
2 This is prepared annually by the Ministry of Employment and Social Protection, and usually published in about October of the budget year. The data for this paper are based on the Social Budget 2004.
- 52 -
increasing the gap between pension expenditures and total social insurance contributions (by about 0.3 percent of GDP).3
3 Social insurance contributions also include contributions for the health branches, and some other benefits. The Social Budget does not isolate a time series of pension contributions, but Table 5 indicates that pension contributions are about 70 percent of total social insurance contributions collected by social security funds under the supervision of the MESP. Some other contributions, and the contributions for the primary pension of civil servants, are collected by the government.
- 53 -
Figure 4. Greece: Population and Employment, 2000-50(in thousands)
Unemployment ratio (in percent) 11.0 5.5 -5.5 9.3 7.0 -2.3
Basic macroeconomic assumptions (Annual avgerages; 2005 refers to initial 5 year period, 2050 refers to total projection period)
Labor productivity 2.3 2.0 -0.3 2.1 1.8 -0.3Real GDP growth 3.4 2.0 -1.4Potential GDP growth 2.9 1.5 -1.4
Sources: Economic Policy Committee, European Union, 2001 and 2005.
3/ Pension expenditures increase throughout the projection period and reach their peak in 2050.The size of the working age population (ages 15-64) reaches it peak about 2010, and peak employment is in about 2015.4/ Ratios are IMF calculations using the population projections for the baseline study, and macro assumptions as stated.in EPC/ECFIN/655/01. Resulting ratios may differ slightly from EPC report.
1/ Budgetary challenges posed by ageing populations, EPC/ECFIN/655/01.2/ Draft - The 2005 EPC budgetary projection exercise (ECFIN/CEFCPE(2005)REP/54772 plus background paper, annexes and table).
Table 3. Greece: Comparison of Assumptions for Pension Projections 2001 and 2005.
- 55 -
1998 1999 2000 2001 2002 2003 2004
(In millions of Euro)Total 12,148 13,298 14,767 16,222 17,784 19,538 21,937Pension Funds 1/ 9,747 10,558 11,760 12,915 14,233 15,634 17,569
Source: Social Budget 2004; Greek authorities; and IMF staff estimates.1/ Social Budget 2004.2/ Funds under the supervision of the Ministry of Employment and Social Protection.In 2004 changes to IKA-ETEAM.3/ Data from Greek authorities.4/ Social Budget 2004. Includes all contributions, not just for pensions.
Table 4. Greece: Pension Expenditures, 1998-2004
21. The pension deficit in 2004 was about 5 percent of GDP, which needed to be funded from other government resources or asset-related incomes. In 2004, according to the Social Budget, funds under the supervision of the Ministry of Employment and Social Protection (MESP) showed a pension deficit of 2.8 percent of GDP (Table 5). A deficit of 3 percent of GDP in the primary funds was somewhat off-set by a small surplus in the supplementary funds. In addition, net funding for the civil service pension system (Euro 3,640 million pensions paid from the budget less primary pension contributions accruing to the budget of about Euro 1 billion), EKAS (Euro 728 million), and the Seamen’s funds (Euro 540 million)
- 56 -
required funding of about 2.3 percent of GDP.4 This is in line with the 2001 EPC projections.5
22. In contrast, ESSPROS data6 show some increase in pension expenditures since 1998 until 2001, 7 but a slight reduction thereafter (Table 6). Overall pension expenditures increased from about 12 ½ percent of GDP to about 13 percent of GDP, but it should be noted that pension expenditures reported in ESSPROS tend to be quite a bit higher than those reported in the Social Budget. Total actual social security contributions are reported at 11 to 11½ percent of GDP, again indicating a fairly constant pension deficit. Overall government funding computed for all the general government social protection schemes declined slightly from 1998 to 2004, reducing the overall surplus of the social protection schemes.8 There has been no major change in the composition of pension expenditures or social security contributions except that lump sum benefits seem to decline.
23. Trends in the national accounts’ data9 also show an increase in both social contributions and social benefits although there is a decline in both in 2004 (Table 7).10 However, social benefits (which are largely driven by cash pension expenditures) increased more rapidly than social contributions, indicating a widening pension deficit of perhaps ½ percent of GDP.
4 The pension deficit for social security funds outside of the MESP is not known, but the Social Budget reports that the Seamen’s funds require a transfer of Euro 540 million.
5 The projected pension deficit of 4.3 percent of GDP assumed other net inflows of about 0.6 percent of GDP.
6 ESSPROS data are based on an annual survey of social insurance funds that is conducted about one year after the budget year, with a view to obtaining information from final accounts. Hence, statistical data are only available with a lag of nearly two years.
7 ESSPROS data for all schemes (not just general government schemes as in Table 6) show pension expenditures in cash in 1998 at 13.0 percent of GDP, and in 1999 at 13.1 percent of GDP. About ½ percent of GDP of total pension expenditures reported in ESSPROS is not paid by the general government.
8 Government funding estimates include a large component of imputed funding for schemes financed from the budget.
9 National accounts data also utilize a survey of social insurance funds, which has many similarities with the survey used for ESSPROS, but has only recently been introduced and is conducted quarterly.
10 Item D62: Social benefits other than transfers in kind.
Table 5. Greece: Revenue and Expenditures of Social Security Funds under the supervision of theMinistry of Employment and Social Protection, 2004 and 2003
- 58 -
As a percent of GDP As a share of expenditures2000 2001 2002 2003 2004 2/ 2000 2001 2002 2003 2004 2/ 2000 2001 2002 2003 2004 2/
Source: Greek authorities; and IMF staff estimates.1/ ESSPROS: European System of Integrated Social Protection StatisticsThis table only includes general government schemes, and excludes employer, and private sector expenditures.2/ According to Social Budget 2004. Pension expenditures include EKAS scheme.
Table 6. Greece: Social protection revenue and expenditures of general government (ESSPROS) 1/
of which:d.1 Compensation of employees 12,660 13,847 14,443 15,180 17,257 18,281 21,115d.11 Wages and salaries 9,967 10,631 11,097 11,571 13,234 13,755 16,052d.12 Employers' social security contributions 2,693 3,216 3,346 3,609 4,023 4,526 5,063d.121 Employers actual SS contributions 432 521 623 726 841 987 1,056d.122 Employers imputed SS contributions 2,261 2,695 2,723 2,884 3,182 3,539 4,007
of which:d62 Social benefits other than social transfers in kind 17,160 18,651 20,399 22,499 24,185 27,334 28,735d62-CG Central government 3,835 4,100 4,266 4,447 4,862 5,175 5,724d62-LG Local government 3 3 3 6 6 7 9d62-SS Social security funds 13,323 14,548 16,130 18,046 19,317 22,152 23,002
of which:d.1 Compensation of employees 11.6% 11.7% 11.7% 11.5% 12.1% 11.9% 12.6%d.11 Wages and salaries 9.1% 9.0% 9.0% 8.8% 9.3% 8.9% 9.6%d.12 Employers' social security contributions 2.5% 2.7% 2.7% 2.7% 2.8% 2.9% 3.0%d.121 Employers actual SS contributions 0.4% 0.4% 0.5% 0.6% 0.6% 0.6% 0.6%d.122 Employers imputed SS contributions 2.1% 2.3% 2.2% 2.2% 2.2% 2.3% 2.4%
of which:d62 Social benefits other than social transfers in kind 15.7% 15.8% 16.6% 17.1% 17.0% 17.7% 17.2%d62-CG Central government 3.5% 3.5% 3.5% 3.4% 3.4% 3.4% 3.4%d62-LG Local government 0.0% 0.0% 0.0% 0.0% 0.0% 0.0% 0.0%d62-SS Social security funds 12.2% 12.3% 13.1% 13.7% 13.6% 14.4% 13.8%
Nominal GDP 108,977 117,850 123,173 131,769 142,370 154,153 167,170
Source: Eurostat; and IMF staff estimates.
Table 7. Greece: General government: Social Security revenue and expenditure, 1998-2004
(In millions of Euro)
- 60 -
24. While somewhat ambiguous, the financial data seem to indicate an increase in pension expenditures and possibly the pension deficit. Moreover, the reasons for the increase in social insurance contributions is not clear. If higher contribution levels are related to stronger enforcement or higher employment, they would be sustainable. If, however, reported contributions relate to special employer funding to finance gaps in the smaller pension schemes, they are unlikely to be sustained.
The Evolution of Pensioners and Contributors
25. The overall number of pensioners for the major pension funds has evolved approximately as predicted, but there are some changes between funds. In particular, OGA has a lower number of pensioners, while the number of civil service pensioners seems much larger (Table 8). The number of contributors according to the Social Budget 2004, however, appears to be much larger, implying a better ratio of contributors to pensioners, and providing an explanation for the good performance of social insurance contributions. The funds’ own data, indicate a somewhat larger pensioner population than the Social Budget does.
- 61 -
Tota
lIK
A 1
/TE
BE
2/C
ivil
serv
ice
OG
A 4
/O
ther
5/
excl
. oth
erTo
tal
Stan
dard
EKA
STo
tal
Stan
dard
EKA
S3/
Tota
lB
asic
Pr
imar
yPr
imar
yEK
AS
Supp
l.
Pens
ione
rs 7
/2,
312,
818
903,
675
183,
195
183,
195
369,
743
856,
205
836,
082
483,
581
......
...O
ld a
ge1,
509,
777
535,
430
95,3
3795
,337
229,
230
649,
780
633,
148
431,
756
Mal
e32
9,69
322
8,72
7Fe
mal
e20
5,73
742
1,05
3D
isab
ilit y
314,
850
131,
280
22,4
3022
,430
19,0
3114
2,10
914
1,59
145
,845
Mal
e88
,736
59,8
78Fe
mal
e42
,544
82,2
31Su
rviv
ors
431,
284
236,
965
65,4
2865
,428
121,
482
7,40
94,
436
5,98
0Sp
ouse
2,97
32,
973
Chi
ldre
n4,
436
4,43
63,
007
Ver
y ol
d un
insu
red
56,9
0756
,907
56,9
07
(In
mill
ions
of E
uro)
Pens
ion
expe
nditu
res,
annu
al14
,757
6,55
36,
190
363
1,43
31,
323
110
3,64
03,
130
2,52
460
63,
709
255
3,08
5O
ld a
ge4,
297
4,14
615
286
282
338
2,74
42,
319
1,79
552
4D
isab
ilit y
906
823
8320
418
717
117
611
535
77Su
rviv
ors
1,35
01,
221
129
368
313
5577
919
135
Spou
ses
604
Chi
ldre
n17
513
Ver
y ol
d un
insu
red
181
181
Uni
dent
ified
718
633
(In
Euro
s)A
vera
ge a
nnua
l pen
sion
exp
endi
ture
s6,
380
7,25
17,
824
7,22
39,
845
3,65
63,
019
1,25
3O
ld a
ge8,
026
9,03
78,
633
11,9
713,
569
2,83
51,
214
Dis
abili
t y6,
901
9,09
38,
353
6,15
74,
302
3,77
61,
675
Surv
ivor
s5,
695
5,62
24,
782
6,41
02,
512
3,01
687
5V
ery
old
unin
sure
d3,
186
3,18
6
Mem
oran
dum
item
s: C
ompa
rison
dat
aTo
tal e
xcl c
ivil
serv
ice
Pens
ione
rsSo
cial
bud
get 2
004
(as o
f 8/1
/200
3)2,
146,
165
879,
000
178,
393
852,
000
236,
772
Proj
ecte
d fo
r 200
5 (2
001
EPC
stud
y)2,
385,
000
986,
000
150,
000
233,
000
944,
000
305,
000
Old
age
6/
589,
000
74,0
0063
4,00
019
4,00
0D
isab
ilit y
160,
000
22,0
00...
221,
000
20,0
00Su
rviv
ors
237,
000
54,0
00...
89,0
0091
,000
Con
tribu
tors
Soci
al b
udge
t 200
4 (a
s of 8
/1/2
003)
3,85
2,49
21,
917,
000
583,
500
734,
000
617,
992
Proj
ecte
d fo
r 200
5 (2
001
EPC
stud
y)3,
324,
000
1,59
4,00
057
5,00
050
8,00
062
7,00
052
8,00
0D
epen
denc
y ra
tion
Soci
al b
udge
t 200
4 (a
s of 8
/1/2
003)
1.80
2.18
3.27
0.86
2.61
Proj
ecte
d fo
r 200
5 (2
001
EPC
stud
y)1.
391.
623.
832.
180.
661.
73
Sour
ces:
Gre
ek a
utho
ritie
s; a
nd IM
F st
aff e
stim
ates
.1/
Fin
anci
al d
ata
from
Soc
ial B
udge
t, 20
04, h
olid
ay-le
ave
bonu
s was
allo
cate
d to
cat
egor
ies s
tate
d.2/
Dat
a fr
om T
EBE.
Par
aple
gia
allo
wan
ce a
nd h
olid
ay-le
ave
bonu
s was
allo
cate
d to
cat
egor
ies s
tate
d.3/
Acc
ordi
ng to
Soc
ial B
udge
t 200
4; d
istri
butio
n ac
ross
cat
egor
ies e
stim
ated
from
cur
rent
mon
thly
pay
men
ts.
4/ D
ata
prov
ided
by
OG
A.
5/ P
rimar
y an
d su
pple
men
tary
acc
ordi
ng to
Soc
ial B
udge
t 200
4, E
KA
S ac
cord
ing
to d
ata
subm
itted
by
Gre
ek a
utho
ritie
s.6/
Dat
a pr
ovid
ed b
y in
sura
nce
fund
s7/
For
civ
il se
rvic
e: A
ll pe
nsio
ners
incl
udin
g di
sabi
lity
and
surv
ivor
s.Tabl
e 8.
Gre
ece:
Sta
tus o
f maj
or p
ensi
on fu
nds,
2004
- 62 -
The Impact of Pension Fund Mergers
26. The effort to reduce the number of pension funds, and in particular merge them into IKA, can affect the financial status of the pension system. Simple mergers leave the general government accounts unaffected, but often they are accompanied by changes to pension rules and employer obligations to finance any deficit. Mergers can also generate a temporary cash inflow into the pension system, that may mask a (possibly worsening) long-term deficit. Since a set of mergers was initiated in the mid-90s, and some of the arrangements are still being implemented,46 such effects may be partly responsible for the increases in social insurance contributions observed in recent years: for example, sponsors of abolished funds may have settled financial obligations like clearance of arrears, transfer of assets, or lump sum contributions to pay future obligations.
27. The ongoing reforms of pensions in the banking sector and the telecommunication company (OTE)—both have generous pension plans—also may impact the time path of the general government pension deficit with temporary effects for about the next 10 years47 as well as higher long-term deficits. Law 3371/2005 authorized the integration of the banking sector’s primary funds into IKA, provided that the supplementary funds were integrated into IKA-TEAM and a new “Integrated Bank Employees’ Social Security Fund” (ETAT).
28. The absorption of the primary funds will increase the public pension deficit, as the additional employer contribution to finance the deficit is eliminated. However, as the government already had made a commitment to accept these primary funds (Law 3029/2002) and it was unlikely that the sponsoring institutions would finance the accumulated liabilities of the pension funds in their existing form, this transfer is best viewed as an acknowledgement of existing implicit government liabilities. Moreover, the effect is likely to be small when set against the projected long-term changes of the pension system as a whole.
29. The transfer of the supplementary bank pension funds may improve the pension deficit in the near term, but worsen it in the longer term. Law 3371/2005 specifies the transfer of supplementary pension insurance to IKA-ETEAM, but the new banking sector fund ETAT will provide an additional pension dependent on employment status:
• Existing pensioners’ full pension (which was established according to banking sector rules) will henceforth be paid by IKA, but adjusted according to IKA rules.
46 A major incomplete merger (albeit likely without cash injections) is the establishment of OAEE, which is to be created from the main funds for the self-employed TEBE, TSA, and TAE. This was legislated by law 2676/1999, but the funds still operate independently under the umbrella of OAEE.
47 The reform of banking sector pensions was made urgent by prospect of the move to IFRS, which requires the recognition of unfunded pension liabilities. Reforms of OTE’s pensions are related to efforts to commercialize OTE. Financial studies to estimate the financial effects of these changes are currently being carried out.
- 63 -
• Current members who joined by 1992 will be awarded a pension upon retirement according to the rules of their bank fund. The primary pension, and the IKA supplementary pension will be paid according to IKA terms, and adjusted annually. The component of the initial pension in excess of IKA terms will be paid by ETAT.
• Current members who joined between 1993 and 2004 will receive pensions according to IKA terms, plus an additional pension based on their accumulated contributions in excess of IKA contributions between 1993 and 2004. This additional supplementary pension will be paid from ETAT resources.
• Bank staff who joined after 2005 will be regular members of IKA pension funds. Box 1: The Scope of Existing Banking Sector Pension Funds
Only two banks operate their own primary pension fund: National Bank of Greece (NBG) and Agriculture Bank. Primary pension insurance for all other bank staff was already with IKA-ETAM. In contrast, most banks operate their own supplementary pension fund but their scope and benefits, as well as the obligations of sponsoring banks differed widely by historical legislation. Some funds subsidized the primary pension in addition to providing the supplementary pension, some operate as normal auxiliary pension funds, and some used IKA’s supplementary pension fund. Thus, while formally most pension obligations arise in the supplementary schemes (which generally only aim to replace 20 percent of income), a comparison of Emporiki’s and NBG’s pensions demonstrates the existing disconnect between pension fund organization and employers’ financial obligations. Emporiki’s supplementary fund was required to provide the same pension level (combined primary and supplementary) as the NBG, effectively by topping up IKA pensions. Emporiki, as the sponsor, had an unlimited liability to make up any deficit (supplementary pension contributions less expenditures). In contrast, NBG obligations to finance the deficits of its primary pension fund were legally limited, but it was unclear who would make up any additional shortfall arising from mandatory benefit rules.
30. ETAT is a closed fund, that is expected to be prefunded by banks to cover the existing pension obligations in excess of IKA terms. Law 3371/2005 envisages banks settling their pension liabilities fully through transfers of assets of existing pension funds, other lump sum transfers, or excess social security contributions over 10 years, as determined by a financial study. While the banks make payments to ETAT (and thus the social security system), additional receipts accrue to general government. Once these payments subside, any pension deficit from the transferred bank pensions (whether on IKA terms or in excess of it) has to be covered from general government cash flows without special contributions from employers, although asset sales from ETAT can contribute to financing.
31. A short-term positive cash flow to the pension system could also arise from the expected merger of OTE’s pension fund with IKA (legislated by law 3029/2002), in combination with the current early retirement program. The legislation authorizing early retirement for OTE employees in conjunction with the change in labor conditions (Law 3371/2005, Article 74), specifies that any pension costs associated with the early retirement
- 64 -
program are to be born by OTE and the Greek State. The Greek government will settle its obligations through a specified transfer of OTE shares to the OTE pension fund. Thus part of the cost of the early retirement program fall on general government, and the cash flow will be affected from the moment that early retirement is taken.48 The law does not specify OTE’s terms of contribution, but if OTE fully settles its obligations towards the pension system during a pension fund merger a short-term positive cash flow to the pension system could arise.
Ad hoc Legislative Changes
32. Ad hoc adjustments to pensions beyond the stated rules seem to contribute to increasing pension expenditures beyond projections (i.e., the assumed effects of demographic changes). A major area are the increases to low pensions in excess of consumer price inflation (see section IV below). There is a declared policy that the pensions in the three component funds of OAEE (for the self-employed) are to be unified and the lower pensions of TSA were already increased to TEBE levels.49 Moreover, the annual adjustment for minimum pensions was larger than price inflation for most recent years. Law 3029/2002 redefined the reference for the minimum pension, and changed supplementary pensions for dependents including for existing pensions. It also gave an additional benefit to those entitled to the minimum pension by adding a bonus for years worked beyond 15 years. These effects are not insignificant as a large share of pensioners receives minimum and low pensions (e.g., in IKA 63 percent of pensioners receive the minimum pension).
33. Some changes to individual schemes increase costs. For example, the benefit formulas for the supplementary fund MTPY, the civil service “share” fund, were recently changed fundamentally, with the stated objective of increasing the very low pensions of long-time pensioners; existing nominal pension levels are protected. Similarly law 3232/2004 increased survivors’ benefits of the TEADY fund.
34. Thus, the adverse dynamics identified by the 2001 exercise persist, despite (or, in some cases, because of) reforms introduced since then. The next section examines the Greek pension system more closely, to identify factors that make even current pension expenditures in Greece high in comparison with many other countries, since such factors are arguably a focus for reform efforts.
D. Factors Contributing to High Pension Expenditures
35. This section discusses five factors that seem to contribute to the already high pension costs in Greece, and that will carry forward into the future: High replacement rates, benefit 48 This assumes that the OTE supplementary fund TAP-OTE is considered part of general government.
49 Minimum pensions for TAE currently are higher than TEBE levels, but have been increased at the same rate as TEBE pensions in recent years.
- 65 -
calculations based on final years’ salaries; generous minimum pensions; relatively short contribution year requirements; a wide differentiation of benefits across funds; and a still maturing system. Other factors sometimes mentioned in this regard are the widespread classification of jobs as heavy and unhealthy work, and the frequent use of disability pensions, but their analysis requires more detailed data than were available for this study.
Replacement Rates
36. Greece’ mandatory main pension system expects a pension (with 35 year’s of service) of 70 percent of final year’s earnings from the primary pension and 20 percent from the supplementary pension. As the standard employee pension contribution rates are 6.67 percent and 3 percent, respectively, this implies a net replacement rate of close to 100 percent. This is very high by OECD standards, where the net replacement rate typically falls with income (Figure 5).
Final Year Calculations
37. The effects of a high replacement rate are compounded by calculating pensionable earnings in relation to the earnings of the final years of work, because seniority increases average earnings for most of the working life. Based on the profile of average earnings by age group derived from household surveys (Figure 6), for a retiree at age 60, the current calculation of lifetime earnings based on the last 5 years results in pensionable earnings are 23 percent higher than if the whole lifetime earnings history (from age 16) had been taken into account. This method—using current earnings in current year prices—is equivalent to a revaluation of earlier earnings in relation to average earnings. If only price increases were taken into account for revaluing earlier earnings (not the real growth in average earnings), the difference in the estimation of pensionable earnings would be even bigger.
Source: OECD (2005).
Figure 5. Net replacement rates by earnings level, mandatory pension programs, men
0
20
40
60
80
100
120
140
0.5 0.8 1.0 1.5 2.0 2.5Individual earnings, multiple of average
Net
repl
acem
ent r
ates
0
20
40
60
80
100
120
140
Greece OECD
Source: Data from Greek authorities.
Figure 6. Average employment earnings (including self-employed and farmers), by age group
Average earnings
Earnings in percent of 16-
19 (right-scale)
0
4000
8000
12000
16000
20000
16-1
920
-24
25-2
930
-34
35-3
940
-44
45-4
950
-54
55-5
960
-64
65-6
970
-74
75-7
980
-84
85-8
990
-94
90
100
110
120
130
140
- 66 -
Minimum Pensions and Their Adjustment
38. Greece has repeatedly taken measures to increase the minimum pension, as a large share of pensioners receive them (Table 9). Minimum pensions, which depend on the fund, currently range from 37 percent of minimum wage to about 75 percent of minimum wage (Table 10), although they do not apply in certain cases of reduced pensions at early retirement. In many cases, additions to these minima are granted, and if applicable, supplementary pensions can be received:
• For persons currently retiring in OGA, both a primary pension and the full basic pension are awarded (although the amount of the basic pension will be reduced as the number of years under the primary system increases).
• For IKA pensioners, an additional pension of 1 percent per year is given for years worked in excess of 15.
• Pensioners with very low pensions (except OGA) can receive a means tested supplement EKAS, which in particular applies to IKA pensioners.
• There is also a range of rules on more generous minimum pensions (relative to contribution history) for disabled persons, mothers with children, and early retirement.
Source: Greek authorities; and IMF staff estimates.Note: OGA primary pension is usually granted in addition to the basic pension (until the transition to the primary system only is completed.)
Pension as a share of minimum wage (married, 1st semester)
Increase, in percent
In Euro
- 69 -
39. While the differentiation of minimum pensions by fund and hence recipient group probably addresses to some extent differences in living circumstances, there may be scope to rationalize the system, and agree on a more uniform level of minimum protection without overlapping rules and possibly simultaneous access to minima-related income. For example, the widespread use of minimum pensions in IKA could be related to non-traditional work histories including some insurance periods abroad or with other pension funds that generate independent pension rights, and possibly contribution evasion. Moreover, in principle, increases in minimum pensions feed through the whole scale of pension increases. Although in recent years this effect has been mitigated (lower increases have been awarded to higher pensions, Table 11), this policy, and the implied compression of pensions, may not be sustainable in the long run.
Source: Ministry of Employment and Social Protection; and IMF staff estimates.
Table 11. Greece: Pension benefit increases for IKA primary insurance
Effective Retirement Age
40. The effective retirement age in Greece, 60.4 years, is low by international comparison (Figure 8). Data for the civil service and IKA confirm the continuation of early retirement. The average retirement age for Greece is raised by later retirement in OGA where retirement before age 65 is difficult. However, civil service pensions are more generous (currently still 80 percent replacement rate for the primary pension) than the private sector, which contributes to the high total pension expenditures.
- 70 -
Source: Eurostat.
Figure 7. Effective and official retirement ages in the EU15 (2000/01)
52545658606264666870
Luxe
mbu
rgB
elgi
um
Fran
ce
Italy
Gre
ece
Aus
tria
Spai
n
Ger
man
yN
ethe
rland
sFi
nlan
dSw
eden UK
Den
mar
kIr
elan
dPo
rtuga
l
52545658606264666870
Average exit from labor market (2000/01)Official "headline" retirement age (men)
41. A contributing factor to early retirement is likely that a full pension is obtained with 35 contribution years, which many full-career workers will reach well before age 65. Recent legal changes, including to allow retirement without age restrictions after 37 contribution years (which also implies a replacement rate in excess of 70 percent for the primary pension), will contribute to continued low effective retirement ages.
A Differentiated and Still Maturing System
42. Greece was the only country in Europe (EU 15), that in the 2001 EPC study expected a significant increase in pension expenditures due to an increase in the benefit ratio, and one of four with a significant increase in eligibility. Of the projected total increase of pension expenditures of 12.2 percent of GDP, an estimated 9.9 percentage points are due to an increase in the dependency ration, 1.4 percentage points to increased eligibility, and 4 percentage points to increases in the benefit ratio (a saving of 3.6 percentage points stems from a higher employment rate).
43. Some of the increase in the benefit ratio will be the result of further economic development. Owing to differences in benefits across schemes, average benefit ratios will tend to drift up as employment continues to shift out of agriculture. Moreover, some schemes are still maturing implying higher benefits as retirees have increasingly longer contribution histories.
44. These in-built pressures for benefit enhancements are aggravated by the recent reform dynamics. Mergers of funds lead to pressures for improved entitlements on the basis of the most favorable existing rule (e.g., in the merger of OAEE), while downscaling of very generous rules tends to be subject to long grandfathering periods. As downscaling inevitably leads to inequities in the system, the long grandfathering rules also provide opportunities for requests to reconsider the benefit reductions, as has happened with a number of important rule changes introduced for post-1992 labor market entrants (e.g., reinstatement of primary
- 71 -
pension replacement rate of 70 percent, easing of age restrictions for retirement, and reinstatement of some preferential treatment for mothers).
E. The Impact of Fragmentation
45. The previous section analyzed some factors that drive pension expenditures in Greece, and repeatedly the fragmentation of the system played a role. This section highlights the tension between a defined benefit system and its organization in numerous autonomous pension funds.
46. In a defined benefit system the government is responsible for covering the deficit arising from the contribution and benefit structure. However, in the first instance each fund, as an independent entity, focuses on its own financial status. The efforts by each fund to ensure sufficient and timely availability of resources leads to a complicated system of precommitted government contributions and transfers, which can easily result in over funding of some funds, while other funds still have a deficit. In Greece, funds are entitled to certain taxes (“social contributions”). In addition, the general government is committed to a wide range of contributions, including: the employer contribution for OGA, a 10 percent pension contribution for all post-1992 labor market entrants (tripartite financing),50 a mandatory contribution to MTPY, and an annual transfer equivalent to 1 percent of GDP to IKA. The government is also directly responsible for certain benefits, including the pensions for the very old uninsured, and the financing of EKAS. Last, the government may make transfers to assist directly with a deficit. As a result, reportedly, not all mandated government contributions are effected in cash (or even included in the budget), but just included in the accounts. While the allocation of each of these resources is justified by different considerations, effectively each is equivalent to a transfer from central government.
47. Restrictions on the availability of central government financing in funds that operate in more than one branch can lead to cross-financing within the fund to alleviate temporarily a shortfall. This currently seems to be the case in IKA, which uses the transfer to the pension branch (intended for asset accumulation) to finance (partly) the deficit in the health branch.
48. Difficult valuations of claims between funds, because of the defined benefit nature of pensions and the differences in rules between funds, make it likely that many compensations between funds are not actuarially fair, differentially impacting the financial status of the funds concerned. This over time could also lead to limitations on the interactions between funds. Indeed, a number of funds raised objections to the rules on settlement of claims between funds arising from pensions generated by insurance in multiple funds (Law 3232/2004).
50 Excluding IKA since the introduction of an annual transfer in 2002.
- 72 -
49. A fragmented system accommodates pressures to increase benefits. If the financial status of a fund is good, even while others operate in a deficit, a case can be made to improve benefits, especially if those benefits are less favorable that those of other funds in an apparently weaker financial position. In contrast, funds in financial distress receive government transfers, which are not generally conditional on reducing benefits or raising contributions. This asymmetry may undermine the system viewed as a whole.
F. Approaches to Reforms: Some Examples
Considerations for Reforms
50. As noted at the outset of this chapter, Greece is far from alone in facing rising pension cost that potentially will destabilize the public finances. Several other countries have already responded to this challenge by implementing, or at least legislating, reforms. This section draws on these experiences to illustrate options that have proved politically feasible, although each involves difficult trade-offs that each country has handled differently.
51. The approaches to reform are of two types: parametric or paradigmatic. A parametric reform maintains a defined-benefit structure that links pension benefits to financial and social criteria not closely related to the contribution history. Such reforms include changes to the retirement age, factors for the calculation of benefits for each contributory year, contribution rates, or early retirement provisions. By contrast, a paradigmatic reform fundamentally changes the nature of the system. Most prominent is changing from a defined benefit to a defined contribution system. In the latter, benefits are determined by contributions and earnings on capital saved. This has many implications, including less certainty about retirement income (assuming the government promise under a defined benefit system is viewed as certain), typically less redistribution across lifetime incomes, and limits on future government liabilities. Another paradigmatic shift would be from a comprehensive first pillar scheme with benefits related to income, to a minimum first-pillar scheme intended to avoid poverty coupled with an expanded second pillar system. Again, depending on the details, government liability could be limited, even if the first pillar were defined benefit.
Austria
52. Austria has one of the highest current pension expenditures in Europe, and is one of the most rapidly aging countries. Prior to reform, Austria had a fairly fragmented pension system, with two major schemes covering dependent employees, many self-employed, and farmers, but smaller schemes for special groups. Civil servants had a non-contributory scheme financed from the budget. Relatively high pension costs were due to generous benefit rules, which included a maximum 80 percent replacement rate, pensionable earnings assessed on the last 15 years’ earnings instead of lifetime earnings, indexation to net wages, and an early effective retirement age. Two reforms, in 2003 and 2005, achieved major changes.
53. The 2003 reform introduced substantial changes in parallel into the major pension systems including for civil servants, but did not address the gaps between schemes. Reforms
- 73 -
included an increase in the retirement age to 65 with a 4.2 percent deduction (bonus) for early (late) retirement; a shift to assessing pensionable earnings on 40 years of contribution, and a change to price indexation. Most of the 2003 reforms were phased in over 5 to 25 years, a cap on benefit losses relative to the previous regime is in place until 2032.
54. In the 2005 reform, most groups of workers including most civil servants (but excluding most civil servants of subnational governments) were brought into a unified system that follows the (reformed) rules for contributions and benefits of the main private system. Full integration was not achieved, as contribution rates for farmers (15 percent) and the self-employed (17.5 percent) are lower than the general rate (22.8 percent), with the difference made up by the government. Only small groups, including civil servants of subnational governments, remain outside of the unified scheme. The harmonization of the pension systems applies only to those below age 50.
55. Overall, the reforms, especially those to civil service pensions, are expected to reduce pension expenditures by about 3 percent of GDP in the long run relative to no-reform estimates, eliminating most of the anticipated increase.
Germany
56. The German public pension system is a defined-benefit scheme with 26 funds. Most employees belong to either the fund for salaried employees, or regional funds for wage earners (although the distinction between these two groups was removed in 2005), but pension rules still differ somewhat for smaller funds for miners, seamen, and farmers, and some specialized funds, e.g., for artists. Civil servants receive a pension from the budget.
57. The declared objective of keeping the pension contribution rate below 20 percent until 2020, and below 22 percent until 2030 has been met in part by transfers from the budget and in part by incremental tightening of pension rules. The retirement age was gradually increased to its current value of 65. While pensions are generally indexed to wages, a sustainability factor was introduced (beginning in 2005) that reduces pensions depending on changes in the ratio of pensioners and employed pension contributors (but, the average pension cannot drop below 46 percent of current average earnings).
58. A host of other cost-saving measures have also been introduced. Due to the increasing labor force participation of women, the generosity of widows and widowers pension has been repeatedly reduced. Survivors pensions for younger couples were reduced in 2002 from 60 percent to 55 percent and stricter limits were placed on duration. The 2002 legislation also introduced pension splitting for married couples, e.g., pension entitlements accrued during the marriage are split between the two partners and no survivor’s pension is paid. Earlier still, rules had been introduced that take into account the own income of the survivor when calculating the survivor’s pension.
59. Reforms have also enhanced incentives to work. Around the retirement age, this incentives is provided by a deduction of 0.3 percent of the pension for each month of early
- 74 -
retirement, and a bonus of 0.5 percent for later retirement. An option for a partial pension was introduced for older workers who wish to work part time. Conversely, for retirees below the regular retirement age of 65, employment income is capped. In addition, for low income jobs, the employer pays pension contributions based on the gross salary, but the employee can choose a reduced contribution, thus enhancing net earnings (though benefits will also be based on the lower contribution). Finally, the new government intends to further raise the retirement age to 67 years.
60. Most changes have been phased in, with transition periods are linked to the date of birth. Other grandfathering rules like personal circumstances when the law went into effect are also used. Some reforms are “reforms of reforms,” e.g., by accelerating the phasing of changes introduced with earlier legislation, as was done for the increase in retirement ages. In addition, to help compensate pensioners for such reductions in public entitlements, Germany has recently strengthened occupational pension insurance and introduced incentives for savings in an individual pension account (the “Riester Rente”).
61. In the 2004 updates to the pension cost estimates, Germany reported a reduction in projected 2050 pension expenditures of 2.4 percent of GDP, relative to 2001 projections.
Italy
62. Pension expenditures rose very rapidly in Italy in the 1980s, and by the early 1990s Italy’s pension spending was, as a percent of GDP, some two-thirds higher than the EU average at the time. As a result, two major reforms were implemented to contain the rise in spending and put the system on a better long-term footing.
63. In 1992, the “Amato” reform sought to harmonize pension parameters (across the private and public sector, for example) and stabilize the pension spending as a fraction of GDP. To achieve the latter, the prevailing generous benefits were reduced in a number of ways, including by extending the reference period for calculating benefits, increasing the minimum number of contribution years (from 15 to 20), and indexing benefits to prices rather than prices and the industrial contractual minimum wage. These measures were phased in, to limit the shock to current pensioners. In addition, incentives were provided to build up second-pillar pensions, to help compensate for the reduction in first pillar benefits. Although the measures, especially price indexation, reduced the growth of pension outlays, it soon became apparent that more would be needed.
64. In 1995, the “Dini” reform ushered in a profound change by linking benefits closely to contributions via a capitalization formula. Past contributions were calculated as 33 percent of past wages and capitalized at the five-year moving average of GDP growth at the time the contribution was paid. Payouts were annuitized assuming an internal rate of return of 1.5 percent and a transformation coefficient that adjusted for the age of retirement relative to life expectancy. The new system therefore took on aspects of a defined contribution scheme. A system in which payouts are not linked to ex post returns on actual investments, however, is sometimes called a “notional defined benefit” scheme.
- 75 -
65. The “Dini” reform also enhanced incentives to stay in the workforce via the transformation coefficients and by abolishing “seniority” pensions, which had allowed early retirement without penalties.
66. Finally, it included a long phase-in period for those who were already in the workforce in 1995. For others, the replacement rate will fall by as much as 30 percent.
67. According to the 2001 EPC estimates (Figure 1), which take account of these reforms, Italy has the highest pension costs in the EU, but is projected to have very little further increase between now and 2050.
Sweden
68. Before reforms in the early 1990s, the Swedish pension system was a defined benefit system with a flat-rate universal component and an earnings-related component. During the 1980s, as wage and labor force growth slowed, concerns arose about the sustainability of this system. On the heels of a recession, the government charged a body of representatives from the political parties (and some experts) to propose reforms, and the legislation for a new pension system was enacted in 1994.
69. A key objective of the reform was to ensure the solvency of the pension system even in the face of demographic shocks. To this end, a notional defined benefit plan (the focus of this discussion) was put in place, alongside a smaller funded component. In the Swedish scheme, an “interest rate”, normally depending on the growth in nominal average income, is applied to contributions to compute a notional asset value, and benefits are paid according to an annuity formula. Two important factors keep the system in balance. First, the annuity rate is adjusted for life expectancy; all else equal, if life expectancy rises, either retirement must be postponed or the benefit declines. Second, if the liabilities of the scheme outstrip the capacity to pay (which is possible since benefits are not governed by an ex post return on actual assets, as would be the case in a classic funded defined benefit program), the “interest rate” is adjusted downward until balance is restored.
70. The reform also made the system more neutral as regards the retirement decision, by allowing early retirement (after age 61) with less contribution and therefore less pension, and allowing workers to accumulate “capital” by continuing to work and pay contributions without limit. It is even possible to work and contribute while collecting a pension benefit.
71. The new system was phased in. Those born before 1938 remain in the old system, those born after 1953 are entirely in the new system, and those born in between face a weighted combination of the two, with the weight on the new system rising for those born later.
72. As in the case of Italy, projections suggest that pension spending will not rise much as a fraction of GDP. In both cases, however, it is worth emphasizing that adjustment to unforeseen developments is, by the logic of a defined contribution scheme, via changes in
- 76 -
benefits (rather than changes in contributions, as would be the case in a defined benefit scheme). Thus, there is a risk that such benefits will prove politically unacceptable, and that the scheme will therefore be made more generous than now envisaged.
G. Conclusion
73. The Greek pension system is already relatively generous, as measured against Greek incomes, and, according to the best available evidence, will in the long run experience the largest increase in spending in relation to GDP of any EU country. This evidence should be updated as soon as possible, consistent with the ongoing exercise at the EU level. Nevertheless, the admittedly incomplete data now available suggests that the situation as estimated at beginning of this decade had not materially improved in the past five years.
74. Pension reform will be needed to ensure the long-term viability of the system. Fiscal consolidation now—specifically balancing the general government budget by the end of the decade—will stave off the time when the debt-GDP ratio begins to rise sharply as a result of aging costs, but will be insufficient to ensure debt sustainability. Considerations of possible reforms, which should draw on the experiences of other European countries but also be sensitive to the situation in Greece, should begin as soon as possible. Since pension reforms typically take some time to become fully effective, owing for example to necessary grandfathering provisions, early action will help to avoid more painful choices down the road.
- 77 -
REFERENCES Bundesministerium fuer Gesundheit und Soziale Sicherung, 2005: “Ratgeber Rente,“ Berlin. Canziani, P. and D. G. Demekas, 1995, “The Italian Public Pension System: Current
Prospects and Reform Issues,” IMF Working Paper WP/95/33, Washington. European Commission, 2001: “Budgetary challenges posed by ageing populations: the
impact on public spending on pensions, health and long-term care for the elderly and possible indicators of the long-term sustainability of public finances,“ Economic Policy Committee, EPC/PCFIN/655/01-EN final, Brussels.
detailed description of agreed underlying assumptions and of projection methodologies,“ Economic Policy Committee, ECFIN/CEFCPE(2005)REP/54772, Brussels.
————, 2005b: “European Economy—Public Finances in EMU–2005,“ Sec(2005) 723,
Brussels. Feldstein, Martin and Horst Siebert, 2002: “Social Security Pension Reform in Europe,“
University of Chicago Press, Chicago and London. Government of Greece, 2001a: “Review of Retirement Pension System: Report by the
Government’s Actuary’s Department, United Kingdom,” Athens. ————, 2001b: “Review of Retirement Pension System: Report on Financial Estimates for
Parametric and Structural Changes—Government’s Actuary’s Department, United Kingdom,” Athens.
————, 2001c: “Country Fiche on Pension Projections: Greece,” Athens. ————, 2002a: “The Greek Report on Pension Strategy,” Ministry of Economy and
Finance, and Ministry of Labor and Social Security, Athens. ————, 2002b: “The Greek Social Security System,” Ministry of Labor and Social
Security, General Secretariat of Social Security, Athens. ————, 2004a: “Social Budget 2004,” Ministry of Labor and Social Security, General
Secretariat of Social Security, Athens. ————, 2004b: “Social Security Fund Assets,” Ministry of Labor and Social Security,
General Secretariat of Social Security, Athens.
- 78 -
Hamann, A. J., 1997, “The Reform of the Pensions System in Italy,” IMF Working Paper WP/97/18, Washington.
International Monetary Fund, 2002: “Greece: Selected Issues—An Overview of Pension
Reform,” Country Report 02/58, Washington. International Monetary Fund, 2003, “Italy: Selected Issues—Pension Reform Issues,”
Country Report 03/352, Washington. International Monetary Fund, 2003: “Austria: 2003 Article IV Consultation Staff Report,”
Country Report 03/372, Washington. OECD, 2005: “Pensions at a Glance,” Paris. Palmer, E., 2000, “The Swedish Pension Reform Model,” World Bank SP Discussion