Page 1
ORIGINAL ARTICLE
Green and sustainable remediation practices in Federal Agencycleanup programs
Louis E. Martino1 • Carol L. Dona2 • Jerry Dicerbo3 • Amy Hawkins4 •
Beth Moore3 • Robert Horner5
Received: 1 August 2016 /Accepted: 6 October 2016 / Published online: 27 October 2016
� The Author(s) 2016. This article is published with open access at Springerlink.com
Abstract Federal agencies manage hazardous waste sites
under the assumption that environmental restoration will
improve the environment by returning contaminated
groundwater to beneficial use, removing waste residuals
from a site, treating discharges to surface water, and
reducing overall risks to human health and the environ-
ment. However, the associated time-consuming and
expensive operations, extensive performance monitoring,
and post-closure care can lead to unanticipated environ-
mental impacts due to both the technological nature of
these cleanup activities and the related protracted time-
lines. These life-cycle impacts can and should be included
in the evaluation of remedial alternatives. Increasingly,
Federal agencies are considering these life-cycle impacts—
variously referred to as ‘‘environmental footprint analysis,’’
‘‘sustainable remediation,’’ ‘‘green remediation,’’ ‘‘greener
remediation,’’ and ‘‘green and sustainable remediation’’—
when evaluating environmental restoration approaches. For
the purposes of this paper, this concept will be referred to
as ‘‘green and sustainable remediation’’ (GSR), with
application of GSR assumed to take place across the
cleanup life cycle, from the investigation phase through
site closeout. This paper will discuss the history of GSR,
what GSR is, who is implementing GSR, and GSR metrics.
The paper will also discuss two approaches to GSR, using
case studies to understand and implement it; the first will
be a qualitative approach, and the second a more detailed
quantitative approach.
Keywords Green remediation � Sustainability �Environmental footprint � EO 13693 � Sustainableremediation � Forum (SURF) � Green cleanups
A brief history of green and sustainableremediation
Increasingly, concepts variously referred to as ‘‘sustainable
remediation,’’ ‘‘green remediation,’’ ‘‘greener remedia-
tion,’’ and ‘‘green and sustainable remediation’’ (hereafter
referred to as ‘‘green and sustainable remediation,’’ or
GSR) are being incorporated into the investigation and
remediation of contaminated sites (hereafter referred to as
‘‘environmental restoration,’’ or ER) (Holland et al. 2011).
Although the concept of GSR has great cachet today, in
reality, the concept has a long pedigree.
One of the first instances of subject matter experts
(SMEs) examining the impacts of site remediation over an
entire project life cycle comes from a case study in Canada
(Page et al. 1999). The SMEs involved with this study
examined the impacts associated with excavating and dis-
posing soil contaminated with lead, arsenic, cadmium, and
polyaromatic hydrocarbons. A concept referred to as ‘‘life-
cycle thinking’’ was used to inventory the impacts of site
remediation activities in an effort to expand the consider-
ation of environmental and human health impacts. The
authors concluded that the remediation of a site resulted in
& Louis E. Martino
[email protected]
1 Argonne National Laboratory, Suite 600, 955 L’Enfant Plaza
SW, Washington, DC 20024, USA
2 U.S. Army Corps of Engineers, Omaha, NE, USA
3 U.S. Department of Energy, Headquarters, Washington, DC,
USA
4 U.S. Naval Facilities Engineering Service Center,
Port Hueneme, CA, USA
5 U.S. Department of Energy, ORISE Associate, Washington,
DC, USA
123
Environ Earth Sci (2016) 75:1407
DOI 10.1007/s12665-016-6219-8
Page 2
life-cycle burdens that were (1) local—aquifer damage and
contaminants remaining below the cleanup level; (2)
regional—emissions, resource consumption, and human
health; and (3) global—acid rain, global warming, and
ozone depletion. The assessments indicated that the effects
of operations as trivial as excavation and disposal can
extend beyond the boundaries of the site itself.
Since that time, a number of other SMEs have attempted
to define sustainable and green remediation concepts and to
develop approaches to measure project life-cycle impacts
based on the consideration of these concepts. The following
are some, but not all, of the key milestones since this began:
• 2006—Sustainable Remediation Forum (SURF) formed.
Its purpose is to foster the formal integration of
sustainable principles, practices, and metrics in remedi-
ation projects on a national and international basis.
• 2007—Association of State and Territorial Solid Waste
Management Officials (ASTSWMO) created the Green
Cleanups Task Force, which advocates for ‘‘greener
cleanups.’’
• 2008—US Environmental Protection Agency (EPA)
first developed the Green Remediation Technical
Primer and formed the EPA/State Greener Cleanup
Working Groups.
• 2011—Interstate Technology Regulatory Council
(ITRC) published guides on Green and Sustainable
Remediation Technology Overview (GSR-1) and GSR
Technical/Regulatory Guidance (GSR-2).
• 2013— and American Society of Testing and Materials
(ASTM) published the standard guides Standard Guide
for Integrating Sustainable Objectives into Cleanup
(E2876-13) (ASTM 2013a) and Standard Guide for
Greener Cleanups (E2893-13), which includes a best
management practices table in Excel format (ASTM
2013b).
The timeline continues beyond 2013 with numerous
references to GSR-related case studies, technical approa-
ches for integrating GSR into decision making for reme-
diation sites, and GSR-focused conferences and symposia,
which are reported on in the literature. The SURF website
contains links to numerous GSR-related publications and
resources (http://www.sustainableremediation.org/remedia
tion-resources).
What is GSR?
Whether conducted under Federal cleanup programs like
the Comprehensive Environmental Response, Compensa-
tion, and Liability Act (CERCLA) or the Resource Con-
servation and Recovery Act (RCRA), as amended, or by
State-directed cleanup programs, the purpose of ER
activities is to remediate a site to the point where it can be
beneficially used, for example, for residential development,
recreational use, or industrial use. Whether the ER activi-
ties involve achieving strict cleanup standards to allow
residential reuse or more lenient cleanup standards to allow
industrial reuse, any environmental improvement will be
accompanied by various impacts. Various organizations
have developed different, but similar, definitions of sus-
tainable remediation practices, each focusing on different
aspects of the process in crafting approaches for measuring
these overall impacts:
• EPA defines green remediation as ‘‘the practice of
considering the environmental effects of remedy imple-
mentation and incorporating options to minimize the
environmental footprint of cleanup actions’’ (EPA
2008, 2012).
• SURF defines sustainable remediation as ‘‘a remedy or
combination of remedies whose net benefit on human
health and the environment is maximized through the
judicious use of limited resources’’ (Ellis and Haadley
2009).
• ITRC defines GSR as ‘‘the site-specific employment of
products, processes, technologies, and procedures that
mitigate contaminant risk to receptors while making
decisions that are cognizant of balancing community
goals, economic impacts, and environmental effects’’
(ITRC 2011).
• ASTSWMO defines green remediation as ‘‘considera-
tion of sustainability principles in all phases of
remediation in order to maximize the net environmental
benefit of a cleanup’’ (ASTSWMO 2011).
• ASTM defines greener cleanup as ‘‘the incorporation of
practices, processes, and technologies into cleanup
activities with the goal of reducing impacts to the
environment through reduced demands on natural
resources and decreased emissions to the environment.
A greener cleanup considers the five core elements,
while protecting human health and the environment. In
the environmental remediation industry, this term is
used interchangeably with green cleanup, green reme-
diation, and greener remediation’’ (ASTM 2013b). In
this case, the five factors are: minimizing energy use;
maximizing the using of renewable energy; minimizing
air pollutants, GHG emissions and water use; reducing,
reusing, and recycling materials; and protecting land
and ecosystems.
• The US Department of Defense (DoD) defines GSR in
the Defense Environmental Restoration Manual as
follows: ‘‘Green and sustainable remediation expands
on DoD’s current environmental practices and employs
strategies for environmental restoration that use natural
resources and energy efficiently, reduce negative
1407 Page 2 of 13 Environ Earth Sci (2016) 75:1407
123
Page 3
impacts on the environment, minimize or eliminate
pollution at its source, and reduce waste to the greatest
extent possible. Green and sustainable remediation uses
strategies that consider all environmental effects of
remedy implementation and operation and incorporates
options to maximize the overall environmental benefit
of environmental response actions’’ (DoD 2012).
To measure GSR impacts during the life cycle of the
cleanup process, metrics have been developed in EPA’s
Core Sustainability Principles (EPA 2012). The EPA def-
inition of a metric is a project parameter for which a
quantitative value may be derived mathematically, esti-
mated through engineering details, or extracted from past
project records with actual data (EPA 2012). Others view
GSR evaluation through the lens of a more expansive
definition of ‘‘metric.’’ SURF documents a suite of metrics
that are both qualitative and quantitative. SURF defines a
metric as ‘‘the specific aspect of the parameter to be
measured.’’ Metrics are further designated as ‘‘quantifiable
or qualitative’’ and identified as environmental, social, or
economic measures’’ (Butler et al. 2011).
For the purposes of this paper, the expansive SURF
definition of GSR and GSR metrics will be used. This
definition allows a choice over a large set of potential
metrics measure quantitative and qualitative environmen-
tal, social, and economic impacts to best represent site-
specific characteristics of the project being analyzed and
the interests of the stakeholders. Because the impacts and
their relative importance to the project will be project-
specific, it is expected that the metrics chosen for each
project will vary.
Who are the GSR practitioners?
Both public- and private-sector organizations practice
GSR. Public-sector groups include both Federal and State
organizations. In some cases, public/private consortia were
organized on a project-specific basis and on a program-
matic basis to aid in the implementation of GSR. Federal
agencies with active GSR programs include:
• EPA Headquarters and Regions,
• US Department of Energy (DOE) Cross Programmatic
Work Group,
• US Department of Defense (DoD),
• US Army Corps of Engineers (USACE),
• US Naval Facilities Engineering Command,
• US Air Force, and
• US Army.
State programs include, but are not limited to, programs
in:
• California,
• Massachusetts, and
• Minnesota.
Other practitioners include:
• National and international SURF members;
• ASTM;
• ITRC;
• ASTSWMO;
• Private-sector corporations such as Boeing, DuPont,
Shell, and Exxon; and
• Numerous cleanup consulting firms.
This paper will focus on GSR implementation in Federal
agency-related ER projects.
Why implement GSR?
The key drivers for the implementation of GSR are Federal
agency requirements, policies, and guidance; and envi-
ronmental, economic, and societal benefits. The agency
requirements include compliance with executive orders and
agency-specific policies. In addition, agencies may issue
GSR guidance that, if not accompanied by an executive
order or policy, encourages GSR and instructs how GSR
can be implemented. The agency requirements, along with
any agency policies and guidance, are discussed below.
The environmental, economic, and social benefits are dis-
cussed in the following section.
Executive orders, guidance, and policy
There are no specific laws or regulations that mandate the
implementation of GSR. However, there are Federal
Executive Orders (EOs) that require Federal agencies to
incorporate sustainability practices in agency operations.
Most recently, ‘‘Planning for Federal Sustainability in the
Next Decade’’ (EO 13693) incorporates sustainability
principles and Federal leadership in environment, energy,
and economic performance. In addition, ‘‘Climate Change
Adaptation’’ (EO 13653) also addresses sustainability
principles. There are also many agency-specific actions.
Examples include:
• DOE Order 436.1: ‘‘Departmental Sustainability.’’
(DOE 2011).
• DoD policy: ‘‘Consideration of GSR Practices in the
Defense Environmental Restoration Program’’ (DoD
2009), updated in ‘‘Defense Environmental Restoration
Program Management Manual 4715.20’’ (DoD 2012).
• US Navy policy requires GSR as part of optimization:
‘‘Policy for Optimizing Remedial and Removal Actions
Environ Earth Sci (2016) 75:1407 Page 3 of 13 1407
123
Page 4
at All Department of the Navy (DON) Environmental
Restoration Program Sites’’ (DON 2012).
• US Navy: ‘‘Guidance on Green Sustainable Remedia-
tion,’’ UG-2093-ENV, Rev. 1 (U.S. Navy 2012).
• USACE: ‘‘Decision Framework for Incorporation of
Green and Sustainable Practices into Environmental
Remediation Projects’’ (USACE 2010), updated in
‘‘Detailed Approach for Performing Green and Sus-
tainable Remediation (GSR) Evaluations in Army
Environmental Remediation’’ (USACE 2012a).
• US Air Force Instruction 32-7001 DOE Office of
Environmental Management GSR contracting policy
for cleanups.
• EPA: ‘‘Encouraging Greener Cleanup Practices through
Use of ASTM International’s Standard Guide for
Greener Cleanups’’ (EPA 2013).
• EPA Regions 1 through 10: region-specific green
remediation policies.
In addition to the above-noted agency-specific guidance,
GSR policy and guidance have been developed by State
governments, public–private partnerships, and standard-
setting organizations. This guidance includes the following
documents:
• California: ‘‘Interim Advisory for Green Remediation’’
(California DTSC 2009).
• Illinois: ‘‘Greener Cleanups Matrix’’ (Illinois EPA 2008).
• Minnesota: ‘‘Green and Sustainable Remediation,
Petroleum Remediation Program’’ and ‘‘A practical
GSR Framework for Federal Agencies and States’’
(MPCA 2011, 2012).
• New York: ‘‘Program policy, DER-31 green remedia-
tion’’ and ‘‘Policy for Green Remediation’’ (NYSDEC
2010, 2011).
• Oregon: ‘‘Green Remediation Policy Draft’’ (Oregon
DEQ 2011).
• Wisconsin: ‘‘Green and Sustainable Remediation Man-
ual’’ (Wisconsin DNR 2012).
• ASTSWMO: ‘‘Incorporating Green and Sustainable
Remediation at Federal Facilities’’ (ASTSWMO 2010).
• ITRC: ‘‘A Practical GSR Framework for Federal
Agencies and States’’ (ITRC 2011).
• ASTM: ‘‘Standard Guide for Integrating Sustainable
Objectives into Cleanup’’ (E2876–13) (ASTM 2013a)
and ‘‘Standard Guide for Greener Cleanups’’ (E2893-
13) (ASTM 2013b).
Benefits of implementing GSR
GSR can help achieve the protectiveness of the cleanup
remedy with a smaller environmental footprint, which has
the potential to reduce costs while engaging communities
in decision making. Because GSR includes consideration
of resource preservation, it also has the potential to
improve economic outcomes by increasing the economic
value of a site (e.g., turning a brownfield into a green field
and facilitating site reuse). Although not necessarily at
every site, GSR implementation can achieve the following
goals:
• Reduce energy consumption,
• Contribute to meeting greenhouse gas reduction goals,
• Reduce toxic air emissions,
• Reduce waste generation,
• Conserve water and natural resources,
• Reduce ecological impact,
• Reflect good environmental stewardship,
• Help gain public acceptance and build the public’s
confidence,
• Demonstrate performance in achieving environmental
sustainability goals, and
• Reduce costs.
How does one go about implementing GSRat a site?
Much of the ER work done for Federal agencies is per-
formed by contractors; therefore, the first step in imple-
menting GSR is often to include GSR as part of
procurement actions to create the contractual mechanisms
for vendors to perform GSR during the remediation.
Including the work as part of the procurement actions
impacts the second step: to determine the level of GSR that
will be performed during the remediation process and the
method that will be used to incorporate GSR. Sec-
tion ‘‘How does one go about implementing GSR at a
site?’’ A. of this paper addresses the contracting/procure-
ment practices specifically. Section ‘‘How does one go
about implementing GSR at a site?’’ B. describes the GSR
implementation methods that can be used.
A. Contracting/procurement practices
The initial inclusion of GSR in the procurement process
consists of a paragraph or section in the statement of work
(SOW) that commits the contractor to using GSR to the
maximum extent feasible and practical during all phases of
the project. For example, the SOW could require the con-
tractor to prepare a characterization, remediation, moni-
toring, or waste management plan that includes GSR
activities and a follow-up report that documents the GSR
activities implemented. In addition, the SOW could require
ongoing communication between the contractor and the
project team (e.g., inclusion of GSR in the progress reports
1407 Page 4 of 13 Environ Earth Sci (2016) 75:1407
123
Page 5
and monthly meetings to update the project team on the
progress of GSR implementation and to allow project team
members to provide input during the GSR implementation
process). Finally, and potentially most importantly, the
contract can include incentives for the contractor to use
GSR practices with measurable goals to achieve results and
cost benefits. Resources that can be used for crafting con-
tract language and incentives include the following:
• DOE GSR contract and incentive language: DOE
memo ‘‘Green and Sustainable Remediation Contract
Language,’’ distributed to DOE field sites in September
2013 directs field sites to include GSR contract
language (DOE 2013).
• US Army GSR study contract language examples can
be found at http://www.fedcenter.gov/Documents/
index.cfm?id=22322&pge_prg_id=27392 (see Appen-
dix A, Attachment A-2) (USACE 2012b).
• EPA Greener Remediation Contracting Toolkit (EPA
2015).
• Air Force Instruction (AFI) 32-7020 (US Air Force
2014).
• Air Force Instruction (AFI) 32-7001 (US Air Force
2011).
B. Implementation approaches
In addition to developing the SOW, there should be an
initial consideration of the method(s) used for implement-
ing GSR. The GSR practitioners mentioned above have
developed several methods to do this. The EPA advocates
the method outlined in the ASTM Standard Guide for
Greener Cleanups (E 2893-13) (ASTM 2013a) across all of
its cleanup programs (Encouraging Greener Cleanup
Practices through Use of ASTM International’s Standard
Guide for Greener Cleanups (EPA 2013).
The EPA’s recommended method tends to focus on
environmental considerations. In contrast, other Federal
agencies tend to look at a broader scope of impacts,
including social, economic, and environmental considera-
tions (ITRC 2011). For this broader scope of impacts, the
methods outlined in either the ASTM Standard Guide for
Integrating Sustainable Objectives into Cleanup (E2876-
13) (ASTM 2013a) or the US Navy and Army agency-
specific guidance documents or decision frameworks are
available. See, for example, the following documents:
• US Navy: Guidance on Green Sustainable Remedia-
tion, UG-2093-ENV, Rev. 1 (U.S. Navy 2012).
• USACE: Decision Framework for Incorporation of
Green and Sustainable Practices into Environmental
Remediation Projects (USACE 2010), updated in
Detailed Approach for Performing Green and
Sustainable Remediation (GSR) Evaluations in Army
Environmental Remediation (USACE 2012a).
In addition, several states have GSR policies and related
GSR methods (see section ‘‘Why implement GSR?’’).
Because the method selected will depend on the customer
(DoD agency, EPA, State, or other) and the interests of the
stakeholders, including regulators, consultation with the
stakeholders and incorporation of their input is encouraged
while developing the SOW and during GSR
implementation.
Although the terminology and definitions that refer to
and define GSR vary and multiple public-sector, private-
sector, and public/private entities have crafted methods for
evaluating GSR practices, these methods can generally be
condensed into two approaches:
• Approach 1 is a qualitative way to identify and
implement commonsense GSR-related best manage-
ment practices (BMPs).
• Approach 2 is a quantitative assessment and evaluation
of a remedy footprint using GSR metrics associated
with any given set of BMPs, with a quantitative
comparison between and among the remedial options
and remedy components as applied to a given remedy
or suite of remedies. This approach can be used to
measure the footprint reductions gained from the BMPs
selected and implemented.
Using one approach does not preclude using the other.
For example, ASTM’s Standard Guide for Greener
Cleanups (E 2893-13) provides a framework to identify
and incorporate BMPs into site cleanup with the option to
quantitatively measure BMPs during the cleanup process
(for more insight, see ASTM’s 2014 webinar at http://
www.clu-in.org/conf/tio/gcsg_042514).
Table 1 summarizes the key features of both approa-
ches. Included in Table 1 are descriptions of each approach
and the associated time commitment and cost. Also
included is a summary of when to intervene during the
cleanup process. The table also provides a sample appli-
cation of each approach. It is anticipated that the effort
needed to research and select appropriate BMPs for a given
project (Approach 1) would be minimal and could be
accomplished in 2–24 h. In contrast, the effort needed to
perform a detailed quantitative footprint evaluation (Ap-
proach 2) would likely require a much more significant
effort involving from 40 to 100 h of effort. The costs noted
are the anticipated costs for either identifying the BMPs or
performing the quantitative evaluation, and not the costs
for implementing the BMPs.
The features of the approaches detailed in Table 1 can
be used to help select the approach most appropriate for an
individual project, with the selection process interfacing
Environ Earth Sci (2016) 75:1407 Page 5 of 13 1407
123
Page 6
across the preparation of the SOW and award of contract.
One consideration is the overall size of the project and
related environmental footprint. For small projects, the
decreases in environmental footprint may not merit the
level of effort of a quantitative evaluation. For example,
the environmental footprint within the investigative phase
is usually low relative to the footprints considered in the
remedy selection and implementation phases. Therefore,
Approach 1 (BMP evaluation only) may be sufficient for a
project in the investigative phase. Similarly, for a project of
small size or duration in any of the remedial phases, a BMP
evaluation without quantification may be the best choice.
However, all the methods developed by the agencies, as
discussed earlier, recommend a BMP evaluation on all
projects because of the relatively low level of effort com-
pared to the potential for footprint and related cost
reductions.
The next section discusses the process used in Approach
1 and illustrates this process through a case study.
C. Approach 1: qualitative bmp selection process
and case study
Approach 1 can be performed ad hoc by researching and
identifying BMPs that are likely to result in minimizing the
impacts of remediation activities based on professional
judgment and experience. However, a formalized frame-
work and a comprehensive list of BMPs can be used to
implement Approach 1 to increase the potential of BMP
implementation and related footprint reduction. An exam-
ple of a more formalized method for Approach 1 is
depicted in Fig. 1, which is taken from ASTM’s Standard
Guide for Greener Cleanups (E 2893-13) (ASTM 2013b).
A key step in this sequence (or in an ad hoc selection
strategy) is the identification of applicable BMPs. A
number of resources provide comprehensive BMP lists; the
following are some of these resources
Table 1 GSR approaches
Parameter Approach 1
Use of BMPs
Approach 2
Footprint quantitative evaluation
Description Enhance the remedial project by incorporating sustainable
methods—this involves identifying and implementing
BMPs
A quantitative decision takes a holistic view of the remedy or a
portion of the remedy. Using specially designed GSR software,
this approach considers the project design, metric evaluation,
and life-cycle cost in selecting the preferred alternative
Time
commitmenta2–24 h 40–60 h: BMPs with footprint evaluation
80–100 h: BMPs with a full life-cycle assessment (LCA)
Costb $1 K–$5 K $10 K–$15 K
When to
intervene
Anytime during the cleanup or closure process Most often during the remedy design, construction, and remedy
operation. Less likely in investigations
Example This BMP can be as simple as replacing diesel fuel with
low-sulfur diesel or biodiesel blend for trucks and heavy
equipment
Using quantitative analysis to determine the use of in situ
remediation technique instead of pump-and-treat technologies
reduces energy requirements and GHGs and enables
achievement of cleanup metrics in a shorter amount of time at
lower cost
a Information from Silver et al. (2015); this does not include GSR implementation and documentationb From the 2012 Army GSR Study (USACE 2012b). These costs will vary depending on the complexity of the site
Fig. 1 ASTM flowchart for selecting qualitative BMPs (reprinted,
with permission, from E 2893-13, Standard Guide for Greener
Cleanups, copyright ASTM International, 100 Barr Harbor Drive,
West Conshohocken, PA 19428. A copy of the complete standard
may be obtained from ASTM: www.astm.org.)
1407 Page 6 of 13 Environ Earth Sci (2016) 75:1407
123
Page 7
• EPA Technology-Specific BMPs http://www.cluin.org/
greenremediation
• ASTM Standard Guide BMP lists contained in the
following:
• Integrating Sustainable Objectives into Cleanups
(E2876-13).
• Standard Guide for Greener Cleanups (E2893-13).
• For a nominal fee, writable versions of the BMP
Excel tables from ASTM can be obtained and used
in a similar fashion to show the identification,
selection, implementation, and documentation
process.
• The BMP Excel table from ASTM lists 160 BMPs.
• PDF-writable technical summary.
• DoD agency BMP lists:
• USACE, Evaluation of Considerations and Incor-
poration of Green and Sustainable Remediation
Practices in Army Environmental Remediation,
which includes BMPs and checklists (see http://
www.fedcenter.gov/Documents/index.cfm?id=2232
2&pge_prg_id=27392).
• Navy Phase-Specific Footprint Reduction Methods
Checklists in the Navy GSR Guidance, found at
www.navfac.navy.mil/go/erb.
To illustrate the Approach 1 process, we provide a BMP
case study of a Federal agency site with groundwater
contaminated with chlorinated solvents. The record of
decision specifies the use of an in situ groundwater injec-
tion technology with monitored natural attenuation for
polishing after injections have sufficiently lowered the
chlorinated solvent concentrations. Although soil at the site
is contaminated, the contamination is below screening
levels and does not require remediation. Table 2 demon-
strates the results of the ASTM process described in Fig. 1.
As depicted in Table 2, a suite of BMPs was selected for
evaluation. For example, one could select from the ASTM
guide all of those BMPs potentially applicable for the
remediation of groundwater, soil, staffing selection, pur-
chasing energy offset credits, and so forth. There are more
than 160 ASTM BMPs, which focus on various potential
components of cleanup projects including buildings, vehi-
cles, wastewater, air emissions, energy, and other compo-
nents. Not all BMPs will be applicable to each project. As
suggested by the ASTM guide, in Step 1 the practitioner
then determines which BMPs are applicable or documents
the rationale for not selecting a BMP. For example,
although BMP 5 is applicable for the treatment of
groundwater using active treatment technologies (e.g.,
pump and treat), the BMP is not applicable because
groundwater is being treated in situ.
In Step 2 the practitioner subjectively ranks BMPs as
low, medium, or high in order to prioritize which BMPs
will be implemented. As noted in Table 2, BMPs 4 and 7
have been ranked high because greater impacts and related
largest potentials for footprint reduction appear to be
associated with those remediation activities.
Subsequently in Step 3, the practitioner would select
those BMPs that are going to be implemented or otherwise
Table 2 Case study illustrating Approach 1 BMP process
Best management practice Step 1—check if
applicable or explain
if not
Step
2—
priority
Step 3—check if
selected or explain if
not
Step 4—indicate if BMP was implemented
or explain if not
BMP 1—buy carbon offset credits 4 Low Agency policy does
not allow
N/Aa
BMP 2—reclaim uncontaminated soil
for reuse
Soil remediation was
not required
N/A N/A N/A
BMP 3—use byproducts/waste/less-
refined materials from local sources
4 Medium 4 Substitute substrate–substrate unavailable at
time of remediation
BMP 4—switch to a less energy-
intensive technology for remediation
polishing
4 High 4 Decision to switch to monitored natural
attenuation (MNA) deferred until more
monitoring
BMP 5—use regenerated granular
activated carbon in carbon beds
No extracted
groundwater
N/A N/A N/A
BMP 6—use local staff to minimize
resource use
4 Low 4 Implemented
BMP 7—conduct pilot tracer tests to
optimize hydraulic delivery of
reagents
4 High 4 Implemented
a N/A = BMP is not applicable
Environ Earth Sci (2016) 75:1407 Page 7 of 13 1407
123
Page 8
explain why the BMP was not selected. For example, BMP
1 was not selected because, in this case, the Federal agency
does not allow the purchase of carbon offset credits.
Finally, in Step 4 the whole process is documented.
Table 2 then both represents Approach 1 and documents
the results of the approach’s BMP qualitative selection
process.
D. Approach 2: quantitative selection processand case study
Approach 2 flows from Approach 1 and includes the
additional step of a quantitative evaluation of the remedial
options represented by the BMPs. Both ASTM and ITRC
have created a comprehensive framework that leads the
practitioner through a quantitative evaluation of GSR
metrics. The ITRC framework consists of the following six
steps:
• Step 1—Define study goals and scope.
• Step 2—Define the functional unit (what, how much,
how well, and for how long).
• Step 3—Establish system boundaries.
• Step 4—Establish project metrics.
• Step 5—Compile inputs and outputs and assess
impacts.
• Step 6—Analyze sensitivity, uncertainty and interpret
impact assessment results.
The ASTM’s Standard Guide for Integrating Sustain-
able Objectives into Cleanup (E2876-13) contains another
representation of the overall Approach 2 process. The
decision flowchart from ASTM E2876-13 is included in
Fig. 2. Here the BMP evaluation in Approach 1 is followed
Fig. 2 ASTM flowchart for
evaluating best management
practices (reprinted, with
permission, from E 2876-13,
Standard Guide for Integrating
Sustainable Objectives into
Cleanup, copyright ASTM
International, 100 Barr Harbor
Drive, West Conshohocken,
PA 19428. A copy of the
complete standard may be
obtained from ASTM, www.
astm.org.)
1407 Page 8 of 13 Environ Earth Sci (2016) 75:1407
123
Page 9
by quantification of the GSR options identified in the BMP
evaluation.
The first step in Approach 2 is to perform the process
in Approach 1, which is to identify, select, and imple-
ment BMPs. Once the BMPs are implemented, the
footprint reduction from the BMP implementation is
quantified.
A number of evaluation tools are available to quantify
footprint reductions. Selection of a tool will depend on a
variety of considerations, including cost, ease of use, input
parameters required, and tool output. There are several
public-domain sustainable evaluation tools available at no
cost. These tools, and the relevant websites where more
information about these tools can be obtained, are as
follows:
• SiteWiseTM: http://www.sustainableremediation.org/
tools.
• Spreadsheet for Environmental Footprint Analysis
(SEFA) (developed by EPA): http://www.sustainablere
mediation.org/tools.
In addition, private-domain sustainable evaluation tools
are available that can be obtained for a fee. Two of the
commonly used fee-based tools include:
• SimaPro Life-Cycle Analysis tools.
• Envision tools (designed and endorsed by American
Society of Civil Engineers and Harvard University).
These fee-based tools require a license for operation,
maintenance, and updating. In addition, as illustrated in
Table 1, working with the LCA tools requires a higher
level of effort to perform the quantification than do the
public-domain sustainable evaluation SiteWiseTM and
SEFA.
Approach 2 using the ASTM E2876-13 process is
illustrated by a case study where the resource savings of
implemented BMPs were quantified using the GSR eval-
uation tool SiteWiseTM (Version 2). The cleanup site is
referred to as ‘‘Site 5.’’ This 10-acre parcel was used for the
disposal of waste and debris from 1957 until 1965. A GSR
evaluation was used to compare the environmental foot-
print for a CERCLA Interim Removal Action (IRA) with
and without GSR BMPs. The quantitative assessment was
based on the following metrics:
• Greenhouse gas emissions (GHGs),
• Energy usage,
• Electricity usage from renewable and nonrenewable
sources,
• Criteria air pollutants (including sulfur oxides [SOx],
oxides of nitrogen [NOx], and particulate matter
[PM10]),
• Water usage,
• Resource consumption, and
• Injury or fatality accident risk (Bhargava and Sirabian
2013).
The IRA consisted of excavating surface debris, sub-
surface waste, and soil; mechanically screening and sepa-
rating waste streams; and confirmation inspection,
sampling, and site grading. A number of BMPs were
identified for the IRA, which included use of onsite soil
(rather than imported soil) in grading, recycling of scrap
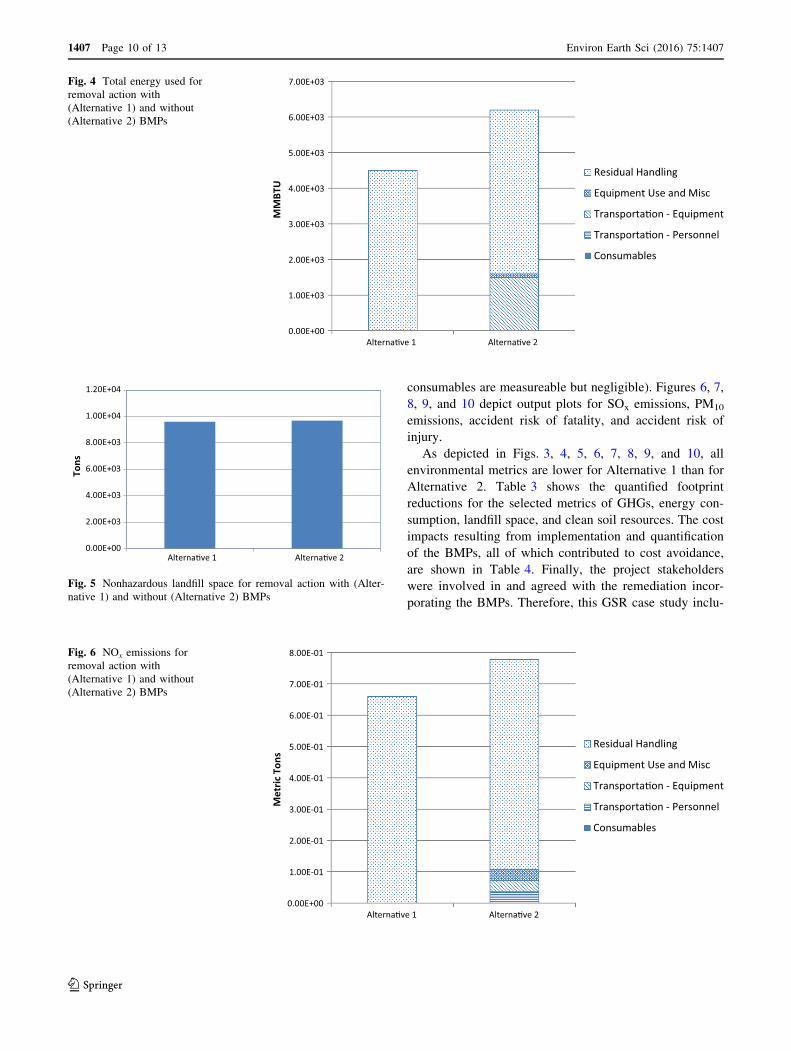
metal, and recycling of concrete. Figures 3 and 4 show the
comparison of the metrics representing environmental
impact for Alternative 1 (BMPs included) and Alternative
2 (BMPs not included). Figures 3, 4, 5, and 6 depict output
plots for GHG emissions, total energy used, nonhazardous
waste landfill space, and NOx emissions (the impact of
0
50
100
150
200
250
300
350
400
450
Alterna�ve 1 Alterna�ve 2
Met
ric T
ons
Residual Handling
Equipment Use and Misc
Transporta�on - Equipment
Transporta�on - Personnel
Consumable
Fig. 3 GHG emissions for
removal action with
(Alternative 1) and without
(Alternative 2) BMPs
Environ Earth Sci (2016) 75:1407 Page 9 of 13 1407
123
Page 10
consumables are measureable but negligible). Figures 6, 7,
8, 9, and 10 depict output plots for SOx emissions, PM10
emissions, accident risk of fatality, and accident risk of
injury.
As depicted in Figs. 3, 4, 5, 6, 7, 8, 9, and 10, all
environmental metrics are lower for Alternative 1 than for
Alternative 2. Table 3 shows the quantified footprint
reductions for the selected metrics of GHGs, energy con-
sumption, landfill space, and clean soil resources. The cost
impacts resulting from implementation and quantification
of the BMPs, all of which contributed to cost avoidance,
are shown in Table 4. Finally, the project stakeholders
were involved in and agreed with the remediation incor-
porating the BMPs. Therefore, this GSR case study inclu-
0.00E+00
1.00E+03
2.00E+03
3.00E+03
4.00E+03
5.00E+03
6.00E+03
7.00E+03
Alterna�ve 1 Alterna�ve 2
MM
BTU
Residual Handling
Equipment Use and Misc
Transporta�on - Equipment
Transporta�on - Personnel
Consumables
Fig. 4 Total energy used for
removal action with
(Alternative 1) and without
(Alternative 2) BMPs
0.00E+00
2.00E+03
4.00E+03
6.00E+03
8.00E+03
1.00E+04
1.20E+04
Alterna�ve 1 Alterna�ve 2
Tons
Fig. 5 Nonhazardous landfill space for removal action with (Alter-
native 1) and without (Alternative 2) BMPs
0.00E+00
1.00E-01
2.00E-01
3.00E-01
4.00E-01
5.00E-01
6.00E-01
7.00E-01
8.00E-01
Alterna�ve 1 Alterna�ve 2
Met
ric T
ons
Residual Handling
Equipment Use and Misc
Transporta�on - Equipment
Transporta�on - Personnel
Consumables
Fig. 6 NOx emissions for
removal action with
(Alternative 1) and without
(Alternative 2) BMPs
1407 Page 10 of 13 Environ Earth Sci (2016) 75:1407
123
Page 11
0.00E+00
5.00E-02
1.00E-01
1.50E-01
2.00E-01
2.50E-01
3.00E-01
3.50E-01
4.00E-01
Alterna�ve 1 Alterna�ve 2
Met
ric T
ons
Residual Handling
Equipment Use and Misc
Transporta�on - Equipment
Transporta�on - Personnel
Consumables
Fig. 7 SOx emissions for
removal action with
(Alternative 1) and without
(Alternative 2) BMPs
0.00E+00
2.00E-01
4.00E-01
6.00E-01
8.00E-01
1.00E+00
1.20E+00
1.40E+00
1.60E+00
1.80E+00
2.00E+00
Alterna�ve 1 Alterna�ve 2
Met
ric T
ons
Residual Handling
Equipment Use and Misc
Transporta�on - Equipment
Transpora�on - Personnel
Consumables
Fig. 8 PM10 emissions for
removal action with
(Alternative 1) and without
(Alternative 2) BMPs
0.00E+00
2.00E-04
4.00E-04
6.00E-04
8.00E-04
1.00E-03
1.20E-03
1.40E-03
Alterna�ve 1 Alterna�ve 2
Risk
of F
atal
ity
Residual Handling
Equipment Use and Misc
Transporta�on - Equipment
Transpora�on - Personnel
Consumables
Fig. 9 Accident risk—fatality
for removal action with
(Alternative 1) and without
(Alternative 2) BMPs
Environ Earth Sci (2016) 75:1407 Page 11 of 13 1407
123
Page 12
ded the triple bottom-line environmental, economic, and
social considerations, all of which were favorable with
respect to the outcome of the IRA incorporating the BMPs.
Summary
This paper has covered the definition of GSR as well as the
development and practice of GSR, with specific emphasis
on GSR in Federal agencies. The Federal agency and State
drivers for GSR consideration and implementation—pol-
icy, guidance, and expected benefits—have been described.
Metrics that are used to represent and measure the envi-
ronmental, social, and economic aspects of environmental
remediation have been defined and explained. Two
approaches to reducing project environmental footprints
have been described: a qualitative approach using GSR
BMPs, and a quantitative approach that uses GSR metrics
to quantify environmental footprint reductions. Case stud-
ies have illustrated both approaches. The case studies have
also illustrated the potential benefits in terms of reduced
energy requirements and resource use, reduced emissions,
cost avoidance, and community concurrence that can be
obtained through application of GSR in environmental
remediation. Additional examples of integrating GSR-re-
lated practices and principles into remediation projects can
be found at both Federal and private-sector facilities. In
general, remediation activities typically result in near-term
improved environmental and societal conditions.
Nonetheless, it is important to recognize that there can also
be both near-term and long-term environmental impacts
associated with the remediation activities. One way to
assess the full life cycle of the impact of environmental
remediation activities is by incorporating GSR practices
and principles into project planning, management, and
decision making.
0.00E+00
2.00E-02
4.00E-02
6.00E-02
8.00E-02
1.00E-01
1.20E-01
Alterna�ve 1 Alterna�ve 2
Risk
of I
njur
y
Residual Handling
Equipment Use and Misc
Transporta�on - Equipment
Transpora�on - Personnel
Consumables
Fig. 10 Accident risk—injury
for removal action with
(Alternative 1) and without
(Alternative 2) BMPs
Table 3 Metric evaluated and
impact of footprint reduction
methods
Metric evaluated Combined impact of footprint reduction methods
Greenhouse gas emissions 224.1 metric tons
Energy consumption 1650 MMBTU
Landfill space 94 tons of waste (equivalent to waste generated by 100 people in 1 year)
Clean soil resource 9600 tons
Table 4 Footprint reduction
method and associated cost
avoidance
Footprint reduction method Associated cost avoidance
8000 cubic yards of on-site soil (vs. imported) used for grading $300,000
Recycling of scrap metal $11,826 recycling credit
$3200 landfill disposal cost
Recycling of 38.66 tons of concrete $1400 landfill disposal cost
Total monetary savings associated with GSR practices $316,400
1407 Page 12 of 13 Environ Earth Sci (2016) 75:1407
123
Page 13
Acknowledgements Argonne National Laboratory’s work was sup-
ported by the US Department of Energy under contract DE-AC02-
06CH11357.
Open Access This article is distributed under the terms of the
Creative Commons Attribution 4.0 International License (http://crea
tivecommons.org/licenses/by/4.0/), which permits unrestricted use,
distribution, and reproduction in any medium, provided you give
appropriate credit to the original author(s) and the source, provide a
link to the Creative Commons license, and indicate if changes were
made.
References
ASTM (American Society of Testing and Materials) (2013a) Standard
guide for integrating sustainable objectives into cleanup, 2013
E2876-13 standard, September, West Conshocken, PA
ASTM (2013b) Standard guide for greener cleanups. E 2893-13
Standard West Conshohocken, PA
ASTSWMO (2010) Incorporating green and sustainable remediation
at federal facilities, August
ASTSWMO (Association of State and Territorial Solid Waste
Management Officials) (2011) Final report: green remediation
at federal facility cleanups. Remediation and Reuse Focus
Group, Federal Facilities Research Center
Bhargava M, Sirabian R (2013) SiteWiseTM version 3 users guide.
UG-0000-ENV. Batelle Memorial Institute, Naval Facilities
Engineering Command. Columbus, Ohio
Butler PB, Hallock LL, Lewis R, Christopher G, Armstead R (2011)
Metrics for integrating sustainability evaluations into remedia-
tion projects, remediation. Wiley online library, Summer.
Maiden, MA
California DTSC (Department of Toxic Substances Control) (2009)
Interim advisory for green remediation. Sacramento, CA
DoD (Department of Defense) (2009) Memorandum from D Robyn
(Office of the Under Secretary of Defense, installations and
environment), Subject: consideration of green and sustainable
remediation practices in the defense environmental restoration
program, August
DoD (2012) Department of defense manual subject: defense envi-
ronmental restoration program (DERP) management. Washing-
ton D.C
DOE (2011) Order 436.1 Departmental sustainability, Washington
D.C
DOE (Department of Energy) (2013) Office of environmental
management (EM): EM memorandum, green and sustainable
remediation contract language, September, Washington, D.C
DON (Department of the Navy) (2012) Policy for optimizing
remedial and removal actions at all DON environmental
restoration program sites, Washington D.C., April
Ellis DE, Haadley PW (2009) Sustainable remediation white paper-
integrating sustainable principles, practices and metrics into
remediation projects remediation 2009. Wiley, Maiden
EO 13653 (2013) Climate change adaptation, Washington, D.C., Nov
1 2013
EO (Executive Order) 13693 (2015) Planning for Federal sustain-
ability in the next decade, Washington, D.C., Mar 19 2015
EPA (2008) Office of solid waste and emergency response, green
remediation: incorporating sustainable environmental practices
into remediation of contaminated sites. EPA 542-R-08-002.
Washington, D.C
EPA (2012) Methodology for understanding and reducing a project’s
environmental footprint. OSWER, Office of Superfund Remedi-
ation and Technology Innovation, Washington, D.C
EPA (2013) Encouraging green cleanup practices through the use of
ASTM international’s standard guide for greener cleanups,
December, Washington, D.C
EPA (2015) Greener cleanups contract and administration toolkit,
December, Washington, D.C. https://clu-in.org/greenremedia
tion/docs/Greener_Cleanups_Contracting_and_Administrative_
Toolkit.pdf
Holland K, Lewis R, Tipton K, Karnis S, Dona C, Petrovskis E, Hook
C (2011) Framework for integrating sustainability into remedi-
ation projects. Remediation 21(3):7–38
Illinois EPA (Environmental Protection Agency) (2008) Greener
cleanups: how to maximize the environmental benefits of site
remediation, February. http://www.epa.state.il.us/land/greener-
cleanups/matrix.pdf. Accessed on 15 June 2016
ITRC (Interstate Technology & Regulatory Council) (2011) Green
and sustainable remediation: a practical framework. GSR-2.
Interstate Technology & Regulatory Council, Green and Sus-
tainable Remediation Team. Washington, D.C. www.itrcweb.
org. Accessed 11 Mar 2016
MPCA (2011) A practical GSR Framework for Federal Agencies and
States, November
MPCA (Minnesota Pollution Control Agency) (2012) Green and
sustainable remediation, petroleum remediation program,
August. https://www.pca.state.mn.us/sites/default/files/c-prp1-
10.pdf. Accessed on 15 June 2016
NYSDEC (New York Department of Environmental Conservation)
(2011) Program policy, DER-31 green remediation. http://www.
dec.ny.gov/docs/remediation_hudson_pdf/der31.pdf. Accessed
on 15 June 2016
Oregon DEQ (Department of Environmental Quality) (2011) Green
remediation. http://www.deq.state.or.us/lq/cu/greenremediation.
htm. Accessed on 15 June 2016
Page CA, Diamond M, Campbell M, McKenna S (1999) Life-cycle
framework for assessment of site remediation options: case
study. Environ Toxicol Chem 18(4):801–810
Silver CF, Goldblum DR, Simon JA (2015) The growing impact of
ASTM’s new standard guide for greener cleanups, presented at
the third international symposium on bioremediation and
sustainable environmental technologies. Miami, FL
USACE (2012a) Detailed approach for performing green and
sustainable remediation (GSR) Evaluations in Army environ-
mental remediation, August
USACE (2012b) Evaluation of consideration and incorporation of
green and sustainable remediation (GSR) Practices in Army
environmental remediation, August. https://www.fedcenter.gov/
Documents/index.cfm?id=22322&pge_prg_id=27392
USACE (United States Army Corps of Engineers) (2010) Decision
framework for incorporation of green and sustainable practices
into environmental remediation projects, March
U.S. Air Force (2011) Air force instruction 32-7001, environmental
management, November. http://www.denix.osd.mil/swr/upload/
afi32-7001.pdf
U.S. Navy (2012) Guidance on Green sustainable remediation UG-
2093-ENV, Rev 1, Washington, D.C., April
U.S. Air Force (2014) Air force instruction 32-7020, final, November.
http://static.e-publishing.af.mil/production/1/af_a4/publication/
afi32-7020/afi32-7020.pdf
Wisconsin DNR (Department of Natural Resources) (2012) Green
and sustainable remediation manual, January, Madison, WI
Environ Earth Sci (2016) 75:1407 Page 13 of 13 1407
123