23
Green Bay & Appleton Markets 2011 Year in Review By: Detlef H. Weiler MAI
| Date post: | 24-Dec-2015 |
| Category: |
Documents |
| Upload: | shona-hamilton |
| View: | 214 times |
| Download: | 1 times |

Green Bay & Appleton Markets 2011 Year in Review
By: Detlef H. Weiler MAI

Weiler Appraisal Inc.
3.0%
4.0%
5.0%
6.0%
7.0%
8.0%
9.0%
10.0%
11.0%
2001 2002 2003 2004 2005 2006 2007 2008 2009 2010 1/11 2/11 3/11 4/11 5/11 6/11 7/11 8/11 9/11 10/11
Unemployment Rate Trends
USA Wisconsin Green Bay Appleton
Source: Wisconsin Worknet
2010 AverageUSA: 9.6%WI: 8.3%Green Bay: 7.7%Appleton: 7.7%
Oct. 2011USA: 8.5%WI: 6.8%Green Bay: 6.5%Appleton: 6.1%

$8.00
$10.00
$12.00
$14.00
$16.00
$18.00
$20.00
$22.00
$24.00
$26.00
6.0%
7.0%
8.0%
9.0%
10.0%
11.0%
12.0%
13.0%
14.0%
15.0%
16.0%
2007 3Q
2007 4Q
2008 1Q
2008 2Q
2008 3Q
2008 4Q
2009 1Q
2009 2Q
2009 3Q
2009 4Q
2010 1Q
2010 2Q
2010 3Q
2010 4Q
2011 1Q
2011 2Q
2011 3Q
Office Market Overview
US Rent Brown Rent Outagamie Rent
US Vacancy Brown Vacancy Outagamie Vacancy
Source: CoStar
Weiler Appraisal Inc.
Brown Co.: 473 Buildings, 7.8 Million Sq. Ft.
Outagamie Co.: 350 Buildings, 4.8 Million Sq. Ft.

Weiler Appraisal Inc.
-
50,000
100,000
150,000
200,000
250,000
300,000
350,000
400,000
450,000
2007 3Q
2007 4Q
2008 1Q
2008 2Q
2008 3Q
2008 4Q
2009 1Q
2009 2Q
2009 3Q
2009 4Q
2010 1Q
2010 2Q
2010 3Q
2010 4Q
2011 1Q
2011 2Q
2011 3Q
Squa
re F
eet
Office Leasing Activity
Brown County Outagamie County
Past Year:Brown Co: 137,043 Sq. Ft. Outagamie Co.: 57,770 Sq. Ft.
Source: CoStar

Source: CoStar
$8.00
$10.00
$12.00
$14.00
$16.00
$18.00
$20.00
$22.00
$24.00
2007 3Q
2007 4Q
2008 1Q
2008 2Q
2008 3Q
2008 4Q
2009 1Q
2009 2Q
2009 3Q
2009 4Q
2010 1Q
2010 2Q
2010 3Q
2010 4Q
2011 1Q
2011 2Q
2011 3Q
EG
I P
SF
Office EGI Trends
National Brown Outagamie
Weiler Appraisal Inc.
Change since peak of market:
National: -12.3% Brown Co.: -11.0% Outagamie Co.: -2.5%
Change since 3rd Quarter 2010:
National: -0.6% Brown Co.: +1.0% Outagamie Co.: -0.3%

Weiler Appraisal Inc.
417 Pine St. 425 Pine St.
NEC Main @ Madison 2737 S. Ridge Rd.
Future Office Vacancies?

Weiler Appraisal Inc.
Office BuildingSale Trends
Brown County
Outagamie County

Source: CoStar
Weiler Appraisal Inc.
Brown Co.: 1,043 Buildings, 14.5 Million Sq. Ft.
Outagamie Co.: 826 Buildings, 12.7 Million Sq. Ft.
$9.00
$10.00
$11.00
$12.00
$13.00
$14.00
$15.00
$16.00
$17.00
$18.00
5.0%
5.5%
6.0%
6.5%
7.0%
7.5%
8.0%
8.5%
9.0%
9.5%
10.0%
2007 3Q
2007 4Q
2008 1Q
2008 2Q
2008 3Q
2008 4Q
2009 1Q
2009 2Q
2009 3Q
2009 4Q
2010 1Q
2010 2Q
2010 3Q
2010 4Q
2011 1Q
2011 2Q
2011 3Q
Retail Market Overview
US Rent Brown Rent Outagamie Rent
US Vacancy Brown Vacancy Outagamie Vacancy

Weiler Appraisal Inc.
Past Year:Brown Co: 116,756 Sq. Ft. Outagamie Co.: 98,052 Sq. Ft.
Source: CoStar
0
10,000
20,000
30,000
40,000
50,000
60,000
70,000
80,000
2007 3Q
2007 4Q
2008 1Q
2008 2Q
2008 3Q
2008 4Q
2009 1Q
2009 2Q
2009 3Q
2009 4Q
2010 1Q
2010 2Q
2010 3Q
2010 4Q
2011 1Q
2011 2Q
2011 3Q
Sqau
re F
eet
Retail Leasing Activity
Brown County Outagamie County Trend Line BC
4 per. Mov. Avg. BC Trend Line OC 4 per. Mov. Avg. OC

Source: CoStar
Weiler Appraisal Inc.
Change since peak of market
National: -13.5% Brown Co.: -19.5% Outagamie Co.: -16.2%
Change since 3rd Quarter 2010:
National: -2.5% Brown Co.: -4.4% Outagamie Co.: -5.3%
$8.00
$9.00
$10.00
$11.00
$12.00
$13.00
$14.00
$15.00
$16.00
$17.00
2007 3Q
2007 4Q
2008 1Q
2008 2Q
2008 3Q
2008 4Q
2009 1Q
2009 2Q
2009 3Q
2009 4Q
2010 1Q
2010 2Q
2010 3Q
2010 4Q
2011 1Q
2011 2Q
2011 3Q
EG
I P
SF
Retail EGI Trends
National Brown Outagamie

Weiler Appraisal Inc.
Retail BuildingSale Trends
Brown County
Outagamie County

Source: CoStar
Weiler Appraisal Inc.
Brown Co.: 160 Buildings, 5.7 Million Sq. Ft.
Outagamie Co.: 115 Buildings, 4.7 Million Sq. Ft.
$9.00
$10.00
$11.00
$12.00
$13.00
$14.00
$15.00
$16.00
$17.00
$18.00
7.0%
8.0%
9.0%
10.0%
11.0%
12.0%
13.0%
14.0%
15.0%
2007 3Q
2007 4Q
2008 1Q
2008 2Q
2008 3Q
2008 4Q
2009 1Q
2009 2Q
2009 3Q
2009 4Q
2010 1Q
2010 2Q
2010 3Q
2010 4Q
2011 1Q
2011 2Q
2011 3Q
Shopping Center Market Overview
US Rent Brown Rent Outagamie Rent
US Vacancy Brown Vacancy Outagamie Vacancy

Weiler Appraisal Inc.
Past Year:Brown Co: 39,654 Sq. Ft. Outagamie Co.: 38,597 Sq. Ft.
Source: CoStar
0
10,000
20,000
30,000
40,000
50,000
60,000
70,000
2007 3Q
2007 4Q
2008 1Q
2008 2Q
2008 3Q
2008 4Q
2009 1Q
2009 2Q
2009 3Q
2009 4Q
2010 1Q
2010 2Q
2010 3Q
2010 4Q
2011 1Q
2011 2Q
2011 3Q
Squa
re F
eet
Shopping Center Leasing Activity
Brown County Outagamie County Trend Line BC
4 per. Mov. Avg. BC Trend Line OC 4 per. Mov. Avg. OC

Source: CoStar
Weiler Appraisal Inc.
Change since peak of market
National: -13.9% Brown Co.: -17.6% Outagamie Co.: -29.0%
Change since 3rd Quarter 2010:
National: -2.8% Brown Co.: -0.2% Outagamie Co.: -9.0%
$8.00
$9.00
$10.00
$11.00
$12.00
$13.00
$14.00
$15.00
$16.00
2007 3Q
2007 4Q
2008 1Q
2008 2Q
2008 3Q
2008 4Q
2009 1Q
2009 2Q
2009 3Q
2009 4Q
2010 1Q
2010 2Q
2010 3Q
2010 4Q
2011 1Q
2011 2Q
2011 3Q
EG
I P
SF
Shopping Center EGI Trends
National Brown Outagamie
Weiler Appraisal Inc.
2004 1Q
2004 3Q
2005 1Q
2005 3Q
2006 1Q
2006 3Q
2007 1Q
2007 3Q
2008 1Q
2008 3Q
2009 1Q
2009 3Q
2010 1Q
2010 3Q
2011 1Q
2011 3Q$750,000
$800,000
$850,000
$900,000
$950,000
$1,000,000
$1,050,000
$1,100,000
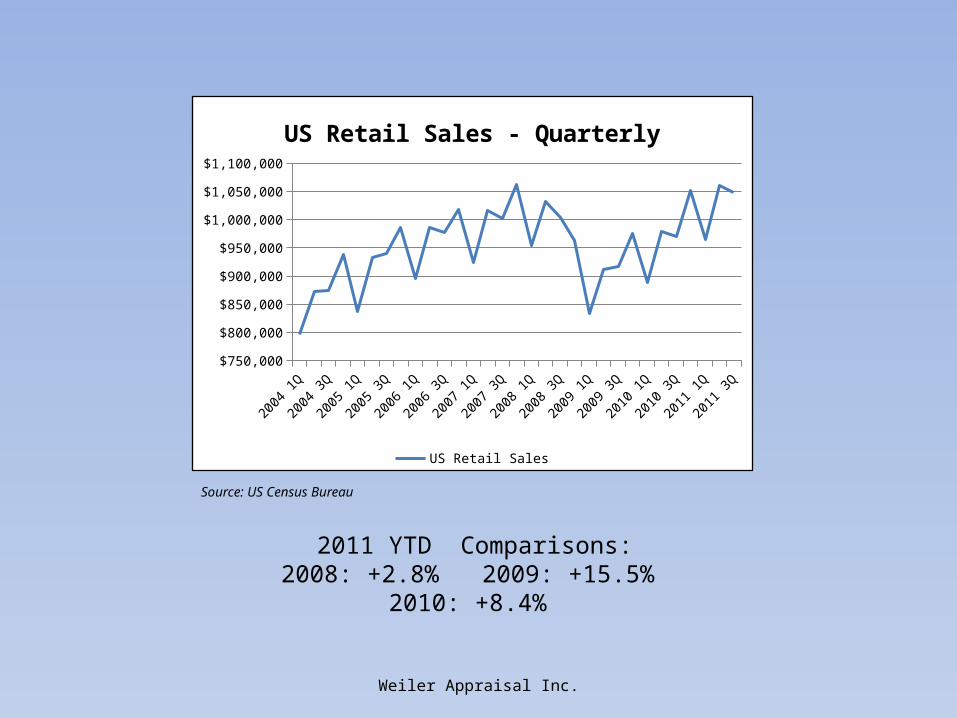
US Retail Sales - Quarterly
US Retail Sales
2011 YTD Comparisons: 2008: +2.8% 2009: +15.5% 2010: +8.4%
Source: US Census Bureau

Source: CoStar
Weiler Appraisal Inc.
Brown Co.: 1,106 Buildings, 37.6 Million Sq. Ft.
Outagamie Co.: 349 Buildings, 15.2 Million Sq. Ft.
$2.50
$3.00
$3.50
$4.00
$4.50
$5.00
$5.50
$6.00
$6.50
$7.00
0.0%
2.0%
4.0%
6.0%
8.0%
10.0%
12.0%
2007 3Q
2007 4Q
2008 1Q
2008 2Q
2008 3Q
2008 4Q
2009 1Q
2009 2Q
2009 3Q
2009 4Q
2010 1Q
2010 2Q
2010 3Q
2010 4Q
2011 1Q
2011 2Q
2011 3Q
Industrial Market Overview
US Rent Brown Rent Outagamie Rent
US Vacancy Brown Vacancy Outagamie Vacancy
Weiler Appraisal Inc.
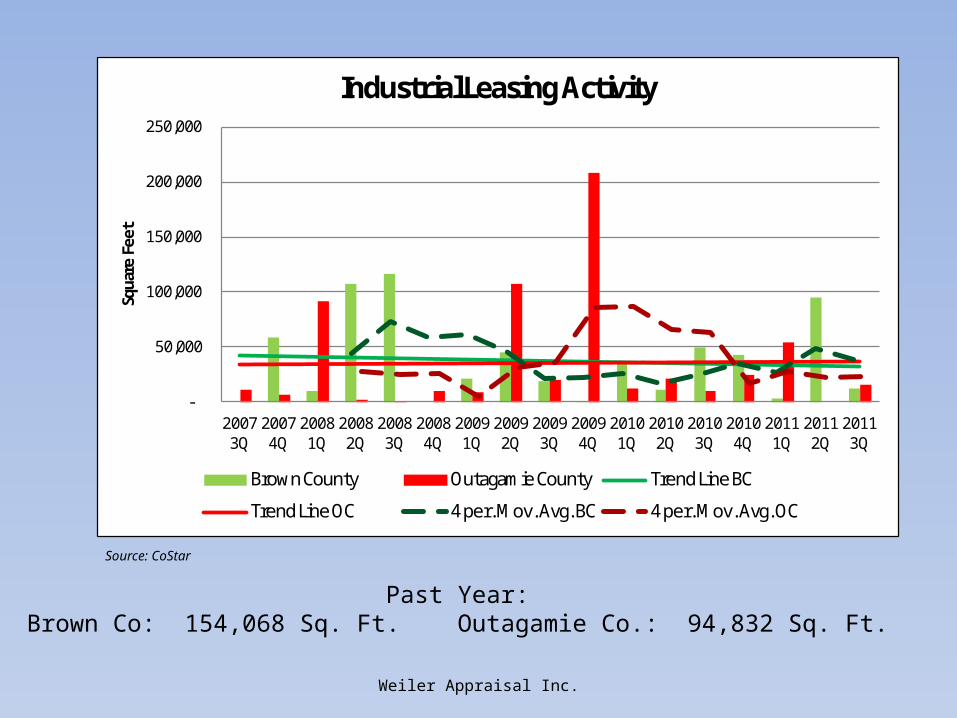
Past Year:Brown Co: 154,068 Sq. Ft. Outagamie Co.: 94,832 Sq. Ft.
Source: CoStar
-
50,000
100,000
150,000
200,000
250,000
2007 3Q
2007 4Q
2008 1Q
2008 2Q
2008 3Q
2008 4Q
2009 1Q
2009 2Q
2009 3Q
2009 4Q
2010 1Q
2010 2Q
2010 3Q
2010 4Q
2011 1Q
2011 2Q
2011 3Q
Squa
re F
eet
Industrial Leasing Activity
Brown County Outagamie County Trend Line BC
Trend Line OC 4 per. Mov. Avg. BC 4 per. Mov. Avg. OC

Source: CoStar
Weiler Appraisal Inc.
Change since peak of market
National: -15.2% Brown Co.: -7.1% Outagamie Co.: -4.4%
Change since 3rd Quarter 2010:
National: -0.8% Brown Co.: -2.2% Outagamie Co.: +1.7%
$2.00
$2.50
$3.00
$3.50
$4.00
$4.50
$5.00
$5.50
$6.00
2007 3Q
2007 4Q
2008 1Q
2008 2Q
2008 3Q
2008 4Q
2009 1Q
2009 2Q
2009 3Q
2009 4Q
2010 1Q
2010 2Q
2010 3Q
2010 4Q
2011 1Q
2011 2Q
2011 3Q
EG
I P
SF
Industrial EGI Trends
National Brown Outagamie

Source: Wisconsin Worknet
Weiler Appraisal Inc.
Change since peak of market
USA: -18.5% WI: -11.9% Brown Co.: -8.7% Outagamie Co.: -13.4%
Change since 2010:
USA: +2.6% WI: +3.5% Brown Co.: +1.8% Outagamie Co.: +0.0%
420,000
440,000
460,000
480,000
500,000
520,000
540,000
560,000
580,000
600,000
20,000
22,000
24,000
26,000
28,000
30,000
32,000
2003 2004 2005 2006 2007 2008 2009 2010 10/2011
Wis
cons
in &
USA
Bro
wn
& O
utag
amie
Average Annual Manufacturing Employment
Brown Outagamie USA / 25 Wisconsin

Weiler Appraisal Inc.
National Manufacturing Capacity Utilization
Source: Federal Reserve
--- Total Industrial Production--- Manufacturing Production

Weiler Appraisal Inc.
Industrial BuildingSale Trends
Brown County
Outagamie County

Weiler Appraisal Inc.
Conclusions:
•Overall, the markets appear to have bottomed out.
•EGIs generally stable to slight increases in most recent quarter(s).
•Retail sales have rebounded.
•Industrial market has experienced increases in manufacturing sector
employment and manufacturing capacity utilization.
•Very limited new construction .
•Declining unemployment rates.
•Exception: Green Bay could see higher future downtown office vacancies.

Contact Information:
Detlef H. WeilerPresident
Weiler Appraisal Inc.1221 Bellevue Street, Suite 202
Green Bay, WI 54302920-544-0264
Weiler Appraisal Inc.


