44
1 Green Belts: a greener future Green Belts: a greener future A report by Natural England and the Campaign to Protect Rural England

1
Green Belts: a greener future
Green Belts: a greener future
A report by Natural England and the
Campaign to Protect Rural England
2
Green Belts: a greener future
Green Belts: a greener future
A report by Natural England and the
Campaign to Protect Rural England
Established in 1926, Campaign to Protect Rural England is a charity that exists to promote the beauty, diversity and tranquillity of rural England. CPRE’s 2026: Vision for the Countryside, sets out how we believe rural England should look in the year of our centenary. This research and the recommendations set out in this report will help realize our aspirations for the Green Belt.
Established by the Government in 2006, Natural England is here to conserve and enhance the natural environment, for its intrinsic value, the wellbeing and enjoyment of people and the economic prosperity that it brings. The evidence presented in this report is expected to support debate on how the Green Belt can deliver more positive benefits to the environment and to people.
Acknowledgements
CPRE and Natural England acknowledge contributions to this report from the following organisations:
TNS UK Ltd
3
Green Belts: a greener future
Foreword
We have prepared this report to bring together fresh evidence and ideas to inform the debate on the future of England’s Green Belt. The Green Belt covers nearly 13% of England, significant not only because of its extent, but because it provides both a breath of fresh air for the 30 million people living in or near to our largest towns and cities.
Green Belt land faces many challenges. It is expected to meet diverse and often conflicting needs, and attracts considerable scrutiny due to the planning controls which govern it and the urban pressures which it faces.
The original purpose of Green Belt is clear. It was introduced 60 years ago to protect the countryside from urban sprawl and to retain the character and vitality of cities. For this purpose, which remains fundamental, it has been highly effective. Subsequently, objectives for the use of land once designated as Green Belt were introduced to planning policy in 1995. These were set to provide recreation and attractive landscapes, to improve damaged and derelict land, to secure nature conservation and to retain farming and forestry. This report considers the extent to which Green Belt is currently meeting these positive objectives and also looks ahead at what the Green Belt could deliver in the future.
The report brings together, for the first time, information on the state of Green Belt land and compares this to other areas of England. We provide evidence that the 1.6 million hectares of Green Belt provide a rich and varied natural environment and many related benefits to society. The ecosystem services provided by Green Belt land are highly significant and have an economic value that is often underestimated or simply not understood. We conclude that these areas could take on an even greater significance in the face of climate change, England’s growing population and the need for a low carbon economy. They can also help in creating a healthier society through providing space for active outdoor lifestyles and nutritious locally grown food.
Our call is for more ambition to enhance the benefits and services provided by Green Belt land so that we can be proud to pass it on to the next generation, and for all our major towns and cities to be surrounded by a recognizable and well maintained natural environment.
In the summary document accompanying this evidence report, we have identified opportunities to achieve this. We invite all those with an interest in the management of the land surrounding our urban areas to discuss these ideas with us and to work together to create Green Belts and urban fringes fit for the future.
Helen Phillips Chief Executive, Natural England
Shaun Spiers Chief Executive, CPRE
4
Green Belts: a greener future
Contents
Foreword 3
Executive Summary 6
1. Introduction 9
Purpose of this report 10
History of the Green Belt 10
Green Belt policy 12
Land use objectives for Green Belt 12
Methods used 14
2. The Green Belt debate 17
Research and comment on Green Belt 18
Local approaches to urban fringe development 19
A global perspective 20
The public perspective 21
Land manager and professional views 23
3. The characteristics of Green Belt land 25
Introduction 26
Quantity and location of Green Belt 26
Land cover 26
Land use 28
Development in the Green Belt 28
Future development in the Green Belt 30
The effects of the Green Belt designation on development – West Midlands 31
Summary 32
4. People and the natural environment 33
Introduction 34
Provision of space for outdoor recreation 34
Provision of routes and trails 34
Accessible Natural Greenspace 36
Educational activity 39
Green Belt case study: Northern Kites 40
Recreational use of Green Belt land 40
Health related recreation 42
Outdoor sporting activity 43
Summary 44
5. Attractive landscapes 45
Introduction 46
All landscapes matter 46
Landscape scale management 47
Green Belt case study: Dearne Valley Green Heart Project 49

5
Green Belts: a greener future
Quality of landscape 50
Damaged and derelict land 52
Litter and fly-tipping 53
Summary 54
6. Healthy natural systems 55
Introduction 56
Priority habitats 56
Protected sites 56
Sites of Special Scientific Interest 56
Green Belt Case Study: Wildspace for a Wild City 60
Birds in the Green Belt 61
Butterflies in the Green Belt 62
Pollution incidents in the Green Belt 64
Public perceptions of nature in Green Belt 64
Summary 64
7. Thriving farming and forestry 65
Introduction 66
Agricultural land 66
Quality of agricultural land 67
Agri-environment schemes 68
Targeting agri-environment schemes 71
Public, land manager and professional views on agriculture and forestry 72
Farm diversification in the Green Belt 74
Green Belt case study: Coton Countryside Reserve Project 76
Forestry land 77
Community Forests 77
Summary 80
8. New challenges for Green Belt land 81
Introduction 82
New challenges, new expectations 82
Climate change mitigation and adaptation 82
Towards a low carbon economy 84
Value of ecosystem services 84
The Green Infrastructure approach 86
Public, land manager and professional views 87
Summary 88
9. Conclusions 89
Bibliography 91
List of Figures 94
Annex 1 – Methodology 95
Annex 2 – Data tables 99

6
Green Belts: a greener future
Executive Summary
This joint report by Natural England and the Campaign to Protect Rural England (CPRE) presents evidence on the state of the land designated as Green Belt.
Our two organisations see a positive future for Green Belts as places which are rich in biodiversity and provide attractive landscapes which are appreciated and used more by the public. In other words, places around towns and cities with a healthy natural environment contributing positively to the ecosystem services required to support life.
Natural England has called for ‘a refresh of Green Belt policy to see how it might evolve to fit twenty first century circumstances and deliver more positive benefits for the natural environment and people’s enjoyment of it’ 1.
CPRE’s 2026 Vision for the Countryside sets out CPRE’s desire for Green Belts to continue to fulfill their planning functions, but also to be ‘more attractive and more accessible, providing an invaluable breathing space for town and city dwellers and supplying them with food’ 2.
The report confirms that Green Belt policy has been highly effective in achieving what it was intended to do despite considerable development pressures in the last half a century. This was the conclusion of a major Government study in 19933 and the analysis commissioned for this study suggests that the conclusion is still valid. The countryside around, and between, the towns and cities protected by Green Belt has remained largely undeveloped, certainly compared to areas without Green Belt or other equivalent planning controls in place.
The positive role for Green Belt land was recognised by the Government in 1995 when the revised Planning Policy Guidance Note 2 (PPG2), specified that, once designated, Green Belts have a role to play in achieving positive land use objectives4. These objectives, six in total, are strictly secondary to the purposes of the Green Belt designation, relating to stopping urban sprawl. This report looks at the state of Green Belt land in terms of these positive land use objectives relating each of these to the ecosystem services they provide. It assesses whether more could be achieved to tackle the new challenges of climate change mitigation and adaptation. This has become increasingly important in recent years with the passing of the Climate Change Act 2008, and a new overall statutory purpose in the Planning Act 2008 for spatial planning to address climate change.
The concept of Green Belt also has strong support amongst the general public, even if they do not always understand the full details of the planning policy. In survey work carried out for this project5, a majority
1 Natural England, Policy on Housing Growth and Green Infrastructure, February 2008.
2 CPRE, 2026 Vision for the Countryside, May 2009, p.6.
3 Elson, M, 1993. The Effectiveness of Green Belt Policy, paragraph 1.1. (for Department for the Environment), HMSO.
4 The land use objectives for Green Belt are listed in Chapter 1.
5 Questions were asked during two weeks in July/August 2009 as part of the Natural England’s omnibus survey on
people and the natural environment.

7
Green Belts: a greener future
(73%) of respondents both knew that Green Belts surround many major towns and cities, and valued Green Belts as places to enjoy quiet recreation, such as walking and cycling.
Nevertheless, the debate about whether or not to retain Green Belt designation as a planning policy persists. In recent years a number of organisations have issued a mixture of polemic and research on Green Belt. The strengths and weaknesses of this long standing planning mechanism have been rehearsed in well publicised debate which has been driven by pressures to find sufficient land to satisfy housing targets, particularly in the south east of England.
Quite separate from the debate about the location of housing growth, this report emphasises the need for multi-functional use of land, particularly in the face of climate change and population growth. ‘Green infrastructure’ within and around towns and cities has an important role to play. Green Belt is already making a contribution which could have even a greater significance in the future if it is managed effectively to maximise the benefits that a natural environment can deliver.
The challenge is to find mechanisms and ways to invest in the land that realise its potential. This will involve working across public and private sectors, and across a range of disciplines. The summary document accompanying this evidence report takes this message forward and identifies opportunities to achieve a greener future for Green Belt.
Report structure and key findings
Chapter 1 Sets the purpose of the report and provides background to the planning legislation and policy for Green Belt.
Chapter 2 Summarises recent research and commentary on Green Belt and presents views expressed about the Green Belt by the public and by those who have a role in managing the land.
Chapter 3 Describes the characteristics of Green Belt land and compares this to other parts of England. It explores the dynamics of the Green Belt, in terms of development pressure and planning controls, and draws conclusions about the effectiveness of land designated as Green Belt in meeting its purpose to contain urban sprawl and the openness of land around the urban form.
Chapter 4 Reviews the contribution Green Belt land makes to the two Green Belt objectives relating to the provision of opportunities for accessing the countryside and for outdoor sport and recreation. While Green Belt land has a greater share of public rights of way, Country Parks and Local Nature Reserves, with the proximity to the urban population the report concludes that there is scope to do more to encourage outdoor education, recreation and sport close to where people live, in turn promoting healthy lives and opportunities to engage with the natural environment.
Green Infrastructure
A network of green spaces which provide life support functions including food, fibre, air to breathe, places for nature and places for recreation. The Green Infrastructure approach seeks to use regulatory or planning policy mechanisms to safeguard natural areas. Multi-functional green infrastructure refers to different functions or activities taking place on the same piece of land and at the same time. For example, a flood plain providing a repository for flood waters, grazing land, a nature reserve and a place for recreation.

8
Green Belts: a greener future
Chapter 5 Reviews the objectives for Green Belt relating to attractive landscapes and damaged and derelict land. The character of the Green Belt is varied but it is important to people. Using the National Character Area approach, 39% of the Green Belt has ‘maintained’ its established landscape quality. A significant proportion (36%) is ‘diverging’ from its established character. 18% of the land is categorised as ‘neglected’ – slightly less than for England as a whole (20%). A high proportion is subject to landscape scale regeneration, such as through the Community Forest programme.
Chapter 6 Reviews the state of nature conservation in the Green Belt. While there are slightly fewer nationally protected sites than for England, the state of the sites across all Green Belt land is similar to the national average. This conceals the fact, however, that some individual Green Belts have a significantly higher proportion of Sites of Special Scientific Interest in a less favourable condition. Some particular species of birds and butterflies are faring well within the Green Belt landscape which is less likely to suffer from over grazing and water pollution and agricultural run-off than other parts of rural England.
Chapter 7 Reviews the Green Belt objective relating to the retention of agriculture and forestry and related uses. It shows that the majority of Green Belt land is either woodland or in agricultural use but that a high proportion of undeveloped land in Green Belt is not registered as agricultural and is more likely to be extended gardens and horse paddocks. Green Belt land receives a lower proportion of agri-environment payment than would be expected for the area covered, and on average receives less payment per hectare, although there is a wide variation between the 14 Green Belt areas.
Chapter 8 Considers the new challenges relating to climate change and assesses whether Green Belt land has the ecological capacity to face these. It acknowledges the ecosystem services currently provided by Green Belt land and concludes that there is potential to do more to support a low carbon economy and to meet the challenges of climate change mitigation and adaptation.
Chapter 9 Concludes that the value of Green Belt land in an undeveloped state is significant and needs to be a powerful consideration in decisions about the future shape and form of urban development and how to tackle challenges of population growth and climate change. It calls for greater ambition for Green Belt land to deliver more benefits to people and to the environment.

9
Green Belts: a greener future
Chapter 1
Introduction

10
Green Belts: a greener future
Introduction
Purpose of this report
This report brings together current and new evidence and ideas to inform the ongoing debate on the future of land designated as Green Belt in England. It reviews the nature of Green Belt land and the benefits it currently delivers, before considering the contribution it makes to a wide range of ecosystem services and the role of Green Belt in tackling future challenges.
Natural England has called for ‘a refresh of Green Belt policy to see how it might evolve to fit twenty first century circumstances and deliver more positive benefits for the natural environment and people’s enjoyment of it’.6
CPRE’s 2026 Vision for the Countryside sets out CPRE’s desire policy that Green Belts should continue to fulfil their planning functions, but also to be ‘more attractive and more accessible, providing an invaluable breathing space for town and city dwellers and supplying them with food’7.
This report provides an evidence base to inform the continuing work of both organisations.
History of the Green Belt
The concept of Green Belt was initially suggested in the late 19th century. In 1898, Ebenezer Howard’s proposed Garden Cities were intended to be “planned, self-contained, communities surrounded by greenbelts, containing carefully balanced areas of residences, industry, and agriculture” 8. In the 1930s CPRE campaigned for a clear barrier of undeveloped land against ribbon development and urban sprawl. As a result of these campaigns and other local initiatives, the first Green Belts were designated in London and Sheffield, the former assisted by an Act of Parliament in 1938. By 1955, Green Belts were firmly supported by both national planning legislation and policy. CPRE has continued to be involved in campaigning for Green Belt designation, and permanent protection, in many parts of the country.
6 Natural England, Policy on Housing Growth and Green Infrastructure, February 2008.
7 CPRE, 2026 Vision for the Countryside, May 2009, p.6. CPRE’s full policy on Green Belts is available from
www.cpre.org.uk.
8 Sir Ebenezer Howard, 1898. To-morrow: a Peaceful Path to Real Reform, (reissued in 1902 as Garden Cities of
To-morrow). Kessinger Publishing.
Ecosystem Services
Ecosystem services are the wide range of valuable benefits that a healthy natural environment provides for people, either directly or indirectly. The benefits range from the essentials for life, including clean air and water, food and fuel, to ‘cultural’ ecosystem services that improve our quality of life and wellbeing, such as recreation and beautiful landscapes. They also include natural processes, such as climate and flood regulation that we often take for granted.

11
Green Belts: a greener future
Figure 1 – Key dates in Green Belt history
Professor Sir Peter Hall argues that the history of the Green Belt can be divided into three phases, the first being the designation of Green Belts in London and Sheffield by local authorities between 1935 and 1947, the second being those immediately following the Town & Country Planning Act 1947; and the third phase post-Green Belts since the 1960s, in which time the land area covered by them has expanded considerably9.
The area covered by fully approved Green Belts has doubled since 197810, although much of this has been as a result of confirmation of details of the Green Belt boundaries that had been agreed in principle as early as the 1950s. In 2006 a large area of land in the South West Hampshire Green Belt was re-designated as the New Forest National Park. Both Natural England and CPRE welcomed this change in designation, as landscape protection became the overarching principle guiding future policies, and levering in more resources for sustainable land management and public access.
9 Hall P, 2007. Rethinking the Mark Three Green Belt. Town & Country Planning, August 2007, p.229.
10 Elson, M, 1993. The Effectiveness of Green Belt Policy, paragraph 1.1. (for Department for the Environment), HMSO.
1898 Garden City movement – Ebenezer Howard proposes Garden Cities surrounded by Green Belts.
1926 Formation of CPRE, one of whose earliest campaigns was against urban sprawl.
1935 First Green Belt proposed in an official planning policy by the Greater London Regional Planning Committee “to provide a reserve supply of public open space and of recreational areas and to establish a Green Belt or girdle of open space.”
1938 Sheffield Green Belt designated by local government.
1938 Green Belt (London and Home Counties) Act.
1947 Town and Country Planning Act, allowed local authorities to control changes in the use of land from undeveloped to developed uses.
1955 Green Belt policy for England was set out in Ministry of Housing and Local Government Circular 42/55 which invited local planning authorities to consider the establishment of Green Belts in their area.
1959 Metropolitan Green Belt fully designated in local plans.
1986 Completion of M25 motorway, running largely through the Metropolitan Green Belt.
1988 Circular42/55 replaced with Planning Policy Guidance Note 2.
1995 PPG2 amended to add positive objectives for Green Belt land.
2001 Current version of PPG2 issued.

12
Green Belts: a greener future
Green Belt policy
Government policy on Green Belts is contained in Planning Policy Guidance 2 (PPG2) which is the current responsibility of the Department for Communities and Local Government (CLG). The five purposes of Green Belts, set out in PPG2, are:
to check the unrestricted sprawl of large built up areas;
to prevent neighbouring towns from merging with one another;
to assist in safeguarding the countryside from encroachment;
to preserve the setting and special character of historic towns; and
to assist with urban regeneration, by encouraging the recycling of derelict and other urban land.
The policy in PPG2 clearly states that the most important attributes of Green Belts are their openness and permanence. Local authorities must have regard to Green Belt policy in preparing spatial plans and the policy in PPG2 can also be a material consideration in reaching decisions on individual planning applications and appeals.
The area covered by Green Belt is set through strategic level planning. Since 2004 this planning has been done through the Regional Spatial Strategies with detailed boundaries fixed by Local Development Frameworks. Any changes have to be justified to the Secretary of State who will need to be convinced that exceptional circumstances exist and alternatives have been considered. Permanence means that Green Belt boundaries should endure for longer than the life of a development plan and not be reviewed every time a local or strategic development plan is reviewed. A record of change is maintained by CLG11.
Development within Green Belts is strictly controlled and there is a general presumption against inappropriate development. Development considered appropriate includes: some mineral extraction; small-scale infill development within villages; the extension/re-use of existing buildings; and development strictly required in connection with agriculture, forestry and outdoor sport and recreation. Where any large-scale development or redevelopment of land occurs, including mineral extraction, landfill, road proposals, or high voltage electricity pylons this is often off-set by contributing towards Green Belt land use objectives or adding to the Green Belt boundary in another location.
Land use objectives for Green Belt
The most recent version of PPG2 (1995), officially recognised for the first time that Green Belts can contribute to other land use goals beyond their purposes. PPG2 states that these additional objectives are not a factor in the designation or continued protection of Green Belt land. This is for two principal reasons: (i) because to make them so would be an active incentive for landowners who wanted to develop their land, to let the quality of the land deteriorate and (ii) they would provide a justification for development to enable improvement which would often contradict the primary purposes and the presumption against most forms of new development. Whilst, therefore, Green Belts should not be designated to take account of these, once designated Green Belts can contribute to the following objectives:
to provide opportunities for access to the open countryside for the urban population;
11 Local Planning Authority Green Belt Statistics: England 2008/09
www.communities.gov.uk/publications/corporate/statistics/lagreenbelt2008

13
Green Belts: a greener future
to provide opportunities for outdoor sport and outdoor recreation near urban areas;
to retain attractive landscapes, and enhance landscapes, near to where people live;
to improve damaged and derelict land around towns;
to secure nature conservation interest; and
to retain land in agriculture, forestry and related uses.
Although not added to Green Belt policy until the mid 1990s, the idea that Green Belt land should provide public benefits has its roots in Ebenezer Howard’s ideas at the beginning of the 20th century and in the 1938 London Green Belt Act. These objectives encourage a positive approach to the use of the land protected from urban sprawl, as well as providing a sense of the greater value and benefits that Green Belt land, once designated, can provide to society.
This report examines the potential of the land use objectives, to see how Green Belt land can contribute positively beyond its original purpose. As Figure 2 shows, fulfilling these objectives can play an important role in delivering a range of environmental benefits, and all of these are supported by a range of ecosystem services.
Chapters 4 to 7 review the evidence relating to the objectives for Green Belt in four sections:
People and the natural environment.
Valued landscapes.
Healthy natural systems.
Thriving farming and forestry.
New challenges for Green Belt land are assessed in Chapter 8.
Figure 2 – Green Belts and Ecosystem Services are mutually reinforcing
PPG2 Green Belt objectives for positive land use
PPG2 Green Belt purposes to prevent urban sprawl
People and the natural environment
Ecosystem Services Cultural: Recreation, Aesthetic value of landscape, Education, Conservation Provisioning: Food, Fibre, Fuel Regulatory: Climate regulation, Flood regulation
Healthy natural systems
Farming and forestry
Valued landscapes
New challenges
Climate change
Population growth

14
Green Belts: a greener future
Methods used
Land cover and land use data has been analysed to describe and review the use of Green Belt land. In addition, local and national questionnaire surveys have been used to seek the views of stakeholders and the public. More detail on the methodology used is in Annex 1. This explains the way the area of Green Belt land was calculated using 2006 data. The area of Green Belt used for this study is 1,619,835 hectares (12.4% of England)12. The current area of Green Belt is nearly 13% of England with the majority of the difference explained by improved mapping.
Throughout the report we have compared Green Belt land with England as a whole, and also with other similar urban fringe areas which we have called ‘Comparator Areas’ (see definition below) 13. The areas cover a further 10% of England, and they face many of the same challenges and opportunities as Green Belt land due to their proximity to major urban areas. Figure 3 shows the location of Green Belts in England.
12 There is a variance of 1.1% between this figure and the official total area recorded for 2008 by CLG, which is 1,638,288
hectares (12.6% of England).
13 Exceptions to this are: the analysis of indicator species in Chapter 6 where data for Green Belt and Comparator Areas
has been set against data for Lowland England rather than England as a whole; and data on derelict and vacant
previously developed land, which has been provided according to the eight Government Office Regions.
Comparator Areas
In this review land designated as Green Belt has been compared with urban fringe areas which are not subject to Green Belt planning controls. The Comparator Areas were devised by drawing 5 km zones around all major towns and cities with population in excess of 100,000. All of the area that was not designated as Green Belt was combined. This included the area around 17 towns and cities with no Green Belt, as well as the areas of land not designated around towns and cities partly surrounded by Green Belt. Figure 3 illustrates this.
Using this approach, the area covered by Green Belt in 2006 was 1,619,835 hectares or 12.4% of England at mean high water (13,050,388). The area covered by the Comparator Areas was 1,325,870 which is 10% of England at mean high water.
Throughout the remainder of the report the term Comparator Areas is used to describe these non-Green Belt urban fringe zones.

15
Green Belts: a greener future
Figure 3 – Map of Green Belt and major urban areas in England
Green Belt areas are based on 2006 data and
digitised to a hectare square grid.
Comparator Areas are 5 km zones
around major urban areas which
are not designated Green Belt.
Green Belt Area (ha)
Avon 66,868
Burton upon Trent and Swadlincote
714
Cambridge 26,340
Gloucester and Cheltenham
6,694
London (Metropolitan) 484,173
North West 247,708
Nottingham and Derby 60,189
Oxford 33,728
SW Hampshire and SE Dorset
78,983
South Yorkshire and West Yorkshire
248,241
Stoke-on-Trent 43,836
Tyne and Wear 71,854
West Midlands 224,954
York 25,553
Total 1,619,835
Urban areas with over 200,000 population without Green Belt
Population
Leicester 303,580
Kingston upon Hull
301,420
Plymouth 243,800
Southampton 234,250
Reading 232,660
Urban areas with over 200,000 population within Green Belt
Population
London 7,215,900
Birmingham 970,900
Liverpool 469,000
Leeds 443,250
Sheffield 439,870
Bristol 420,560
Manchester 394,270
Coventry 303,480
Bradford 293,720
Stoke-on-Trent 259,250
Wolverhampton 251,450
Nottingham 249,850
Derby 229,400
16
Green Belts: a greener future
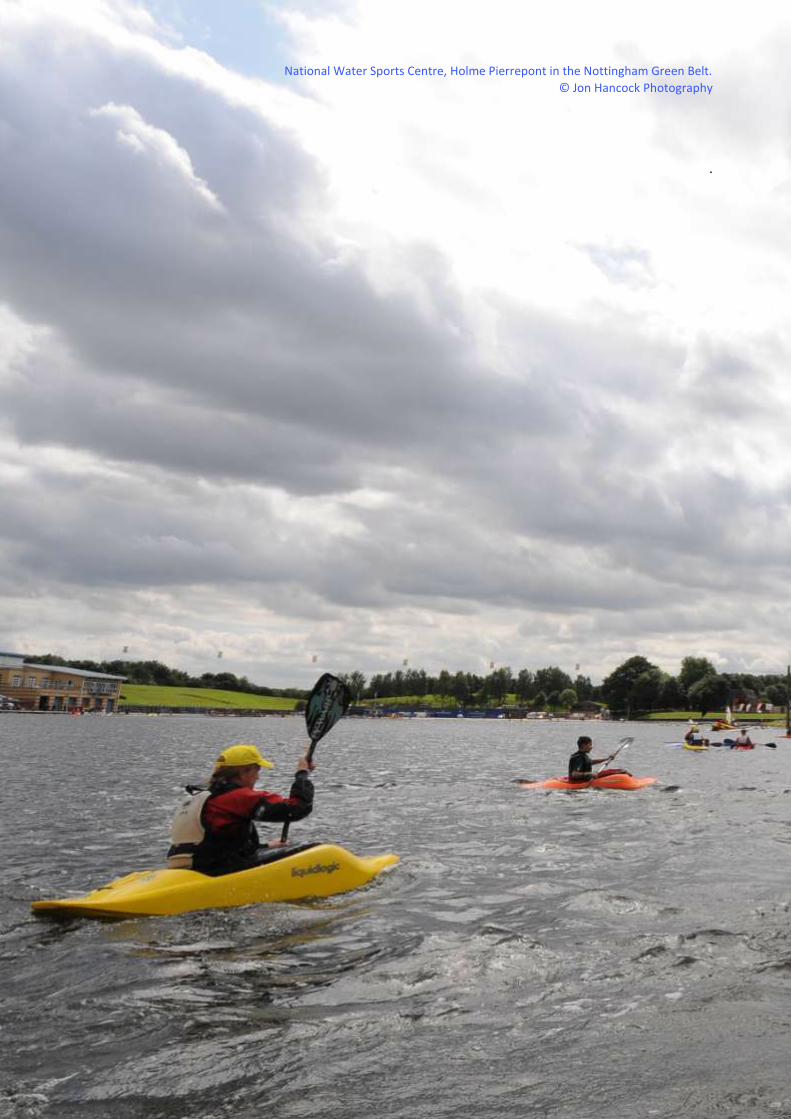
National Water Sports Centre, Holme Pierrepont in the Nottingham Green Belt.
© Jon Hancock Photography
.
17
Green Belts: a greener future
Brockley Hill, near Stanmore
© Henrietta Williams
Chapter 2
The Green Belt debate

18
Green Belts: a greener future
The Green Belt debate
Research and comment on Green Belt
The core principles of Green Belt policy in England have remained relatively intact for over 60 years. This is despite serious challenges from a wide range of professional bodies, academics, and politicians, and pressures from developers and investors.
At the turn of the century several organisations sought further debate and put forward proposals for modernising the Green Belt14. The debate over Green Belt policy tends to fall into two categories:
Its effectiveness as a planning mechanism – does Green Belt, as a planning designation, support sustainability by encouraging urban regeneration and concentration of homes, services and employment opportunities; or does it prevent sufficient homes being built, encourage ‘cramming’ of new housing into large urban areas and artificially inflate prices leading to unaffordable housing and leapfrog development beyond the Green Belt boundaries? Are other tools, such as strategic gaps and green wedges, more effective at creating a sustainable urban form? Should there be more flexibility in terms of permitted development, and the permanence of the designation?
Its role in environmental management – does the Green Belt designation impact on the management of land in the urban fringe? Have the land use objectives for Green Belt land encouraged positive land management? What are the best ways of preventing degradation of land in the urban fringe and maximising productivity of the land, and the benefits to people?
The final report of the Government-commissioned Barker review of Land Use Planning15 stated that ‘the key principles of Green Belt policy remain valid’. However, the report also echoed many of the criticisms of Green Belts. Barker’s Recommendation 9 called for:
regional and local reviews of Green Belt boundaries;
a more positive approach towards applications that would enhance the Green Belt and other surrounding areas; and
a review of the merits of different models of protecting valued open space, including the ‘green wedge’ approach.
The review referred to the view that Green Belts promote ‘leap-frogging’ of development from the large cities they surround to more dispersed locations, thereby increasing commuting times to major cities and exacerbating problems such as increased greenhouse gas emissions. Some have pointed to locations such as Peasedown St.John, near Bath, or Bishop’s Cleeve, near Cheltenham, as examples, and suggest that urban extensions to large towns and cities are the preferred way to avoid this. This thinking appears to have influenced the Panel that in 2007 examined the draft Regional Spatial Strategy for the South West. The Panel referred to the argument that concerns about climate change made Green Belt policy outdated as a means for bringing about sustainable urban growth16. An alternative view is that Green
14 Summarised for the Countryside Agency in ‘Urban fringe – Policy, Regulatory and Literature Research.
Report 2.3: Green Belts, Bartlett School of Planning, University College London (2003)
15 Barker K, Review of Land Use Planning – Final Report, December 2006, paragraph 2.38.
16 South West Regional Spatial Strategy (RSS) Examination in Public Panel Report, January 2008, particularly paragraphs
4.0. 31 and 4.0.33. Downloaded from www.southwesteip.co.uk/downloads/FinalSouthwestEiP.pdf on 7 Oct 2009.
19
Green Belts: a greener future
Belt not only encourages regeneration both within the urban areas it contains and in areas in need of regeneration outside the principal urban areas, but also reduces energy consumption, thereby helping to tackle climate change. There is also a strong argument that the historic cities that have Green Belts need to have a firm limit set on their boundaries in order to protect qualities of intrinsic importance, such as their historic setting. The relationship of Green Belts to two English World Heritage Sites is explored in more detail below.
The Urban Task Force in 1998 noted a proven link between urban residential housing densities and energy consumption, calling for higher density, more compact development on previously developed land as a means of reducing consumption17. The recommendations of the Task Force have played an important role in ensuring that the vast majority of new housing (78% in 2008) is built on previously developed land and at progressively higher densities each year since 1999. This poses urban design challenges, particularly for ensuring adequate provision of local accessible greenspace to support health and quality of life, but has promoted urban regeneration – reinforcing one of the five purposes of Green Belts.
Professor Martin Elson argues that Green Belts were not originally envisaged as merely stopping development, but guiding it to particular locations, in order to shape the expansion of a city on a regional scale18. As part of such a wider strategy, dispersal of new development to towns beyond the Green Belt need not lead to increased carbon emissions from commuting if it is accompanied by supporting infrastructure for employment, public transport, walking and cycling. ’Leap-frogging’ may also be affected by personal choice, with people choosing to live in a small town or more rural location regardless of whether major housing provision is made on Green Belt land or urban fringe. This occurred in the 1950s when people from London ‘leap-frogged’ over the new town of Crawley to places such as Burgess Hill.
Local approaches to urban fringe development
Some large towns and cities have no Green Belt designation (Figure 3) and a number of local authorities in these areas use a range of non-statutory designations relating to landscape protection, nature conservation, and historic sites to maintain gaps between settlements and to shape the form of settlements. These designations go under a variety of names such as “green wedges”, “strategic gaps”, and “rural buffers” and within these areas controls on development can be as restrictive as for designated Green Belt. They are considered to have greater flexibility than Green Belt designation to respond to the new demands for sustainable development as they are not permanent and are subject to review each time a development plan is revised. In consequence, the designations themselves have often not endured, or have failed to protect significant areas of land from sprawl. In places such as Basingstoke and Wokingham, for example, there has been a gradual reduction over time in the area of the ‘strategic gaps’. Evidence from Europe also suggests such policies are less effective than Green Belt designation, for example the Dutch ‘Green Heart’ and in Frankfurt-am-Main in Germany where ‘green wedge’ policies have been used19.
17 Urban Task Force 1999, Towards an Urban Renaissance, p.36 & 38.
18 Elson M, The Effectiveness of Green Belts, HMSO 1994, paragraph 2.2.
19 See accounts provided by German planner Jens Scheller of the Frankfurt-am-Main GruenGuertel (green girdle) quoted
in Surrey County Council / Purple Conference: Greening the Green Belt – Proceedings of conference at Sandown Park,
Esher, Surrey, 5 – 7 October 2005, p.36; and of the Netherlands Green Heart by Michel Van Eeten and Emery Roe,
‘When Fiction Conveys Truth and Authority: The Netherlands Green Heart Controversy’, Journal of the American
Planning Association, 66 (1) Winter 2000, p.58 at 60-61.

20
Green Belts: a greener future
The Government reviewed local designations, such as green wedges in 2003 as part of the review of Planning Policy Guidance 7. As a result the revised Planning Policy Statement 7 strongly discourages the creation of new non-statutory designations, which are seen as additional and unnecessary brakes on development20.
Research presented in Chapter 3 shows that significantly more development takes place around major towns and cities without a Green Belt than those with one, demonstrating that Green Belt remains the most effective mechanism for preventing urban sprawl.
A global perspective
The majority of the world’s population now live in cities for the first time in recorded history. The United Nations Human Settlements Programme has identified uncontrolled urban sprawl as one of the biggest challenges facing the world today, particularly developing countries. It encourages the ‘compact city’ model of urban growth to address the issue and to reduce greenhouse gas emissions caused by additional commuting associated with urban sprawl21. ‘Compact cities’ are commonly characterised by policies like Green Belts to set a clear boundary to urban growth in order to protect natural resources beyond the city boundary. Similarly, at the European level, the European Commission has identified urban sprawl as one of the most urgent of today’s urban planning and design issues22. The Commission has also found that ‘sprawl is generally greater around the largest urban areas (over 500,000 inhabitants) with housing and industrial or commercial uses the dominant new land uses’23. These are precisely the areas which, in England but not in many other European countries, are protected from sprawl by Green Belt policy. Comparison of rates of development on undeveloped land in England and the USA find that the rate of change to development is almost 100 times greater in the USA than England, notwithstanding that the USA has a population (around 300 million) at around six times greater than that of England24.
Green Belts are regarded as a British success story. They have been established in a growing number of countries across the world, from China, India and Korea to Canada and the USA, with similar forms (if not always policy substance) to the British model25.
20 Office of the Deputy Prime Minister (ODPM), Planning Policy Statement 7: Sustainable Development in Rural Areas
(PPS7), 2004, paragraphs 24-25.
21 United Nations Human Settlements Programme (UN Habitat), Planning Sustainable Cities: Global Report on Human
Settlements October 2009, p.213. Summary available from www.unhabitat.org.
22 Commission of the European Communities, Towards a Thematic Strategy on the Urban Environment. COM(2004)60
Final, 2004, p.25
23 Commission of the European Communities, Commission Staff Working Document
Annex To The Communication From The Commission To The Council And The European Parliament On Thematic
Strategy On The Urban Environment Impact Assessment, SEC (2006) 16, p.36. Downloaded from
http://ec.europa.eu/environment/urban/pdf/sec_2006_16_en.pdf on 3 November 2009.
24 According to official statistics quoted by the United Nations Environment Programme in 2007, between 1997 and
2001 approximately 29,000 square kilometres (2,900,000 hectares, or 11,740 square miles) of undeveloped
agricultural or forestry land in the USA was developed. In the same period, only 314 square kilometres of
undeveloped land in England was developed, and in turn only approximately 5% of this undeveloped land was in the
designated Green Belt. Also, the proportion of all new development that has taken place in the Green Belt has
consistently fallen to between 6 and 8% in four out of the six years since 2001 for which statistics are available
(Department for Communities and Local Government, Land Use Change Statistics, Live Tables 244 and 261).
25 See Tang, B; Wong, S; and Lee, A: ‘Green Belt in a compact city: A zone for conservation or transition?’, Landscape and
Urban Planning 79 (2007), p.358.
21
Green Belts: a greener future
The value of another Green Belt purpose – protecting the setting of historic towns – has also been recognised in international fora. UNESCO26 has designated a number of World Heritage Sites across the country in recent years. Green Belt protection played a significant role in bringing about the designation of Bath as a World Heritage Site in 1987. One of the reasons for World Heritage Site designation is Bath’s historic landscape setting, which since 1966 has been maintained by Green Belt as well as, in more recent years, Conservation Area and Area of Outstanding Natural Beauty policies. The local planning authority has also identified the Green Belt as playing an important continuing role in the future management of the World Heritage Site27. Additionally, Green Belt land forms part of the buffer zone designated to protect views of the World Heritage Site of Saltaire, the nineteenth century planned town near Bradford in West Yorkshire, although landscape setting is not a primary reason for the designation in this case. This World Heritage Site was designated in 200128, with the nearby Green Belt having been in place since 1980.
The public perspective
Green Belt is often associated in the public mind as a place designated for its natural beauty or as a place where nature is protected. The planning purposes of Green Belt, such as preventing urban sprawl, are not always well understood.
In the surveys carried out for this research, a number of questions sought to establish the level of public awareness and understanding of Green Belt29 (Figure 4).
Overall, around three-quarters (73%) of the adult population in England are aware that the countryside around many of England’s large towns and cities is called Green Belt.
As the chart illustrates, awareness increases with age from less than a third of those aged under 25 to 90% of those aged 55 or over. Awareness is also significantly higher amongst those in the AB socio-economic groups (89%) and those in white ethnic groups (79%).
In addition to the national survey, local surveys around the North West (Merseyside), Avon and Metropolitan Green Belts were also undertaken with communities living in close proximity to Green Belt land. Overall, 95% of those questioned were aware that the countryside around their communities was ‘Green Belt’, but there was a notably lower awareness (84%) in Merseyside.
26 The United Nations Educational, Scientific and Cultural Organisation.
27 Bath and North East Somerset Council, City of Bath World Heritage Site Management Plan, September 2004,
Appendix 5 – Planning & Policy Framework, paragraph 18. Accessed from www.bathnes.gov.uk on 16 December
2009.
28 Atkins, Saltaire World Heritage Site Environmental Capacity Study, July 2005, paragraph 3.19. Accessed from
www.bradford.gov.uk on 16 December 2009.
29 Natural England omnibus survey on people and the natural environment. Questions on Green Belt were asked over a
two week period in July/August 2009.

22
Green Belts: a greener future
Figure 4 – Public awareness of Green Belt land
73
76
71
31
57
79
88
90
90
89
75
70
62
79
32
Total adult population
Male
Female
16-24
25-34
35-44
45-54
55-64
65+
AB
C1
C2
DE
White
BME
The national survey also asked respondents what things they associated with the words ‘Green Belt’. When asked which of a set list of words came to mind when they heard the words Green Belt, around half of respondents selected woodland (54%) while a similar proportion selected open spaces (52%). Other frequently selected words were nature reserves (48%) and Country Parks (48%) while the more negative answer options were selected by much smaller proportions of respondents (Figure 5).
Figure 5 – Public associations with the words 'Green Belt'
SEX
AGE
SEG
ETHNICITY
13
3
3
4
5
11
13
17
26
27
28
34
48
48
52
54
None of the above
Pylons
Motorways
Quarries
Derelict land
Commercial forestry (for wood)
Planning
Reservoirs
Playing fields
Walking and cycling paths
Community Forests
Farming
Country Parks
Nature reserves
Open spaces
Woodland

23
Green Belts: a greener future
The surveys show that, on the whole, public awareness of the Green Belt is high, however, when questioned on potential development on the Green Belt, the survey results suggest that public views are variable. Respondents were asked to agree or disagree with three statements on this issue (Figure 6).The responses suggest that while there is public support for Green Belt policy, and that this strongly relates to its protective function, there is also the recognition that some development may be necessary.
Figure 6 – Responses to statements about need to develop undeveloped land
England’s large towns and cities need to expand to create jobs so countryside should be built on.
Agree 21% Disagree 57% Neither 22%
Protecting the countryside around England’s large towns and cities prevents affordable housing from being built.
Agree 35% Disagree 41% Neither 24%
While most of the countryside around England’s towns and cities should be protected, some could be used for new housing and other development.
Agree 47% Disagree 30% Neither 23%
Land manager and professional views
A view often found in academia and the professions is that Green Belt is neglected and its condition has suffered as a result of both its close proximity to the urban environment and the presence of strong controls over most forms of new development30. On the contrary, it could also be argued that the forms of new development that have been allowed, particularly infrastructure development such as pylons or quarries, have actively contributed to this feeling of damage. In this view, Green Belt is generally uninspiring or unremarkable and is characterised as derelict and underused land given over to horse grazing or containing ‘bad neighbour’ development such as motorways, pylons or quarries.
In the local surveys for this report, landowners and professionals were asked to agree or disagree with the statement that farmland around major cities in their area is under-used. The response suggests that although neglect appears to be an issue, this varies greatly in different locations and circumstances (Figure 7). The issue of landscape ‘neglect’ in the Green Belt is considered further in Chapter 5.
Figure 7 – Landowner and professional views on whether Green Belt land is under used
Farmland around major cities in their area is under-used
Merseyside Agree 18% Disagree 64% Neither 18%
Bristol Agree 42% Disagree 31% Neither 27%
London Agree 64% Disagree 20% Neither 16%
30 J. Andersson, N. Gallent, R. Oades and M. Shoard, ‘Urban Fringe – Policy, Regulatory and Literature Research.
Report 2.3: Green Belts’, Bartlett School of Planning Report for the Countryside Agency, June 2003, p. 13.

24
Green Belts: a greener future
A number of land managers and professionals interviewed directly or surveyed for this project raised concerns about the ability to diversify economic activity. Land professionals generally also associated Green Belts much more with ‘planning’ (responses ranged between 72-91% in the three survey areas) compared to the general public (a range of 13-34% of responses). Other evidence suggests a much more complicated picture in relation to the presence of rural diversification activities in the Green Belt (see Section 7, Farming and woodland).
Lambourne End Outdoor Centre.
© Henrietta Williams

25
Green Belts: a greener future
© Henrietta Williams
Chapter 3
The characteristics of Green Belt land

26
Green Belts: a greener future
The characteristics of Green Belt land
Introduction
This chapter describes the characteristics of Green Belt land and compares this to other parts of England. It explores the dynamics of Green Belt in terms of development pressure and planning controls and asks whether the purposes of Green Belt policy are being achieved.
Quantity and location of Green Belt
There are 14 separate Green Belts varying in size from London (Metropolitan) at 486,000 hectares to Burton-upon-Trent and Swadlincote at just 700 hectares. In total, they cover just over 1.6 million ha or nearly13% of the land area of England. Within the 14 Green Belts there are 38 major towns and cities with populations of over 100,000 and in total around 30 million people31 or 60% of the population live in the towns and cities surrounded by Green Belt. Most Green Belt land is on the ‘urban fringe’ or the edge of conurbations and extends into the deeper countryside. In a number of cases, however, Green Belt land also forms a wedge of undeveloped land linking the urban fringe to more inner city areas, as is seen in places such as Manchester and the West Midlands. For example, over 33% of the land area of Walsall, an inner part of the West Midlands conurbation, is designated as Green Belt.
There are 17 major towns and cities without Green Belt including Leicester, Kingston-upon-Hull, Reading, Peterborough, Plymouth, Blackpool and Brighton. The location and a full list of Green Belts can be seen in Figure 3.
Land cover
The characteristics of Green Belt land vary considerably as would be expected of such a large area of land. The environment Land Cover Map 200032 illustrates this variation in character (Table 1). The area of land cover type nationally is generally mirrored by the area of land cover type in the Green Belt (Figure 8).
When comparing individual Green Belts more distinctive differences are apparent. For example, arable and horticultural land covers 74% of Cambridge Green Belt but only 17% of Stoke on Trent which has the highest proportion of improved grassland. Both the London (Metropolitan) and SW Hampshire and SE Dorset Green Belts have higher than average mixed woodland. The latter is in part due, however, to the inclusion of the New Forest in this data which has now been designated as a National Park and no longer designated as Green Belt.
31 Total population in urban settlements within the Green Belt boundaries. ODPM's 2001 Urban Settlement data cover
England and Wales corresponding to the 2001 Census data. Urban settlements were defined as areas of built up land
with an associated population of 1,000 and a minimum area of 20 hectares. Settlements separated by less than 200
metres were linked. The settlements were extracted from the Ordnance Survey 1:10,000 scale maps, as at 1st April
2001.
32 Centre for Ecology and Hydrology, 2000

27
Green Belts: a greener future
Figure 8 – Land Cover of Green Belt, Comparator Area and All England
All England
All Green Belt
Comparator Area
KEY
Arable and horticulture
Improved grassland
Semi-natural Grass
Mountain, heath, bog
Broad leaved / mixed woodland
Coniferous woodland
Built up areas and gardens
Standing open water
Coastal
Cambridge
London (Metropolitan)
SW Hampshire and SE Dorset
Stoke-on-Trent

28
Green Belts: a greener future
Perhaps most strikingly, compared with 10% in England as a whole, 7% of both the Green Belt and the Comparator Areas are taken up by ’built up areas and gardens’, meaning land that has been developed and the gardens that adjoin it (Table 1b).
Where land is undeveloped it is the underlying character of the countryside in the area, not the designation itself that is responsible for the land cover present. For example, the high percentage of horticultural and arable cover in the Cambridge Green Belt is the result of the predominantly arable character of the East of England. A similar situation exists for woodland in the south east of England and hence the greater coverage of woodland in the London (Metropolitan) Green Belt. Green Belts in England are not designated on the basis of the type of land they happen to cover and there is no causal relationship to the underlying character of the countryside or the farming practices that are used in the designated area. What Green Belt policy does influence is whether land is either developed or undeveloped.
Land use
Land use in the Green Belt is influenced by the planning designation and has resulted in mainly undeveloped land with a rural character. Although much of the land is undeveloped, a quarter of this is not registered for agricultural use nor is it woodland. This land is made up of such uses as small paddocks, small holdings and extensive gardens. It accounts for 23% of Green Belt land compared to 14% for England (Table 2).
Development in the Green Belt
Green Belt policy has proven very effective at directing the location of development. Built development (both new build and re-building) has been largely concentrated within existing urban boundaries. This is demonstrated by comparing the rate and character of development between urban areas, areas subject to Green Belt controls and Comparator Areas. Between 1985 and 2006, 10.3% of the area classed as urban in 200133 was developed or re-developed compared to just 1.4% of Green Belt land and 2.2% of the Comparator Area (Table 3a).
During the same period, the percentage of undeveloped land which had been converted to developed use was 1.5% within urban areas and 1% for all England compared to 0.9% in the Green Belt and 1.4% in the Comparator Area (Figure 9). The result has been that the density of buildings in urban areas has increased as more buildings are added into existing urban areas.
This does not mean that there has been no built development in the Green Belt. It does mean, though, that it has been minimal. The latest statistics produced by Communities and Local Government (CLG) show that approximately 200,000 new dwellings were built in 2007 with 2% in the designated Green Belt, and 22% of these (or 0.4% of the total number of dwellings) were built on the previously undeveloped land34 in the Green Belt. By comparison, 14% of all new dwellings were built on agricultural land across England and 77% of all new dwellings were built on previously developed land. This is consistent with trends in previous years.
Residential development in the Green Belt has a very particular character. Although a limited number of urban extensions have occurred, more typically there have been a number of very small scale and widely
33 This data relates to land within physical urban areas on their 2001 definition. Urban Areas are defined as those
mapped and published by ODPM / OS in 2001.
34 In planning terms previously undeveloped land means land previously in agricultural or forestry use.
Approximately 7% of Green Belt is counted as ‘previously developed’.
29
Green Belts: a greener future
scattered developments which generally reflect the distribution of existing property such as farmsteads and clusters of cottages. The development involves construction of new dwellings adjoining existing ones and related forms of intensification such as conversion of existing redundant buildings to other, predominantly residential, uses35.
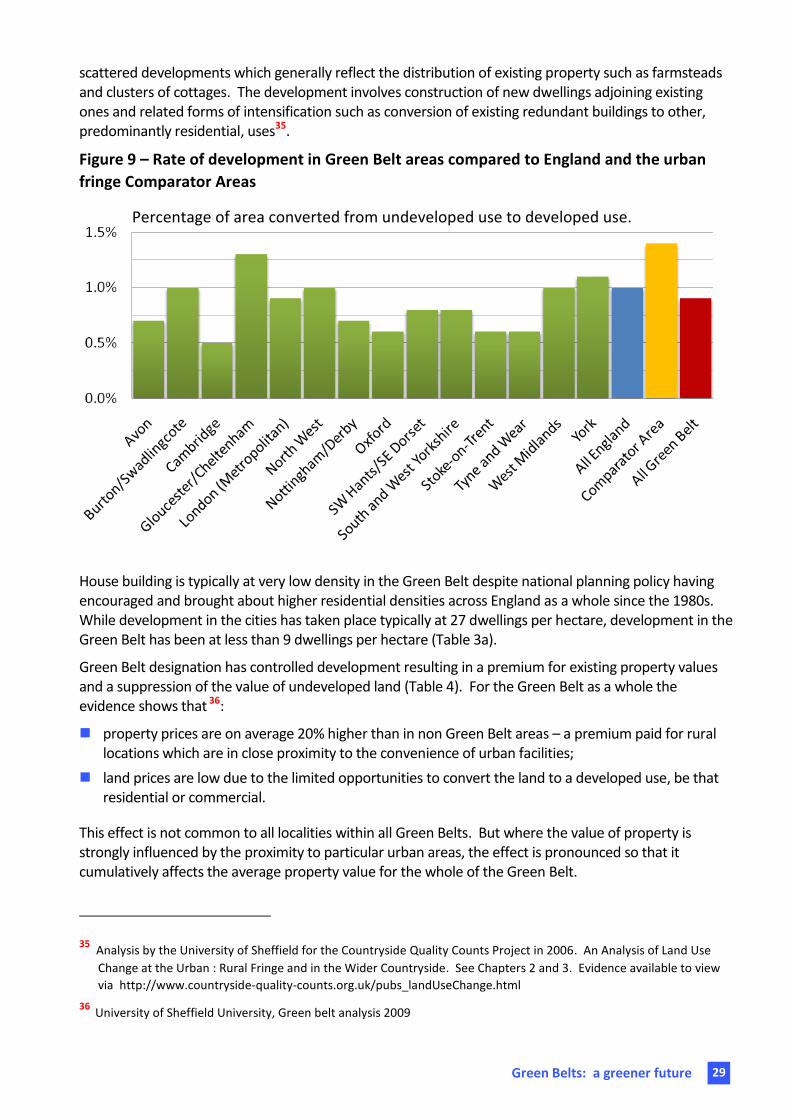
Figure 9 – Rate of development in Green Belt areas compared to England and the urban
fringe Comparator Areas
Percentage of area converted from undeveloped use to developed use.
House building is typically at very low density in the Green Belt despite national planning policy having encouraged and brought about higher residential densities across England as a whole since the 1980s. While development in the cities has taken place typically at 27 dwellings per hectare, development in the Green Belt has been at less than 9 dwellings per hectare (Table 3a).
Green Belt designation has controlled development resulting in a premium for existing property values and a suppression of the value of undeveloped land (Table 4). For the Green Belt as a whole the evidence shows that 36:
property prices are on average 20% higher than in non Green Belt areas – a premium paid for rural locations which are in close proximity to the convenience of urban facilities;
land prices are low due to the limited opportunities to convert the land to a developed use, be that residential or commercial.
This effect is not common to all localities within all Green Belts. But where the value of property is strongly influenced by the proximity to particular urban areas, the effect is pronounced so that it cumulatively affects the average property value for the whole of the Green Belt.
35 Analysis by the University of Sheffield for the Countryside Quality Counts Project in 2006. An Analysis of Land Use
Change at the Urban : Rural Fringe and in the Wider Countryside. See Chapters 2 and 3. Evidence available to view
via http://www.countryside-quality-counts.org.uk/pubs_landUseChange.html
36 University of Sheffield University, Green belt analysis 2009

30
Green Belts: a greener future
Pastures Hill © Natural England
Future development in the Green Belt
Some adjustments to Green Belt boundaries are envisaged in approved or emerging development plans across England.
Infrastructure development (such as airports, motorways and electricity transmission and distribution lines) is a common feature in many areas of Green Belt. One of the largest and most controversial infrastructure proposals in England, a third runway at Heathrow Airport, would have a significant effect on Green Belt land if permitted, both in terms of the location of the runway itself and in the sourcing of construction material from extraction sites in other Green Belt locations. Green Belt issues also figure prominently in the new National Policy Statements on energy, issued for consultation by the Department for Energy and Climate Change towards the end of 2009. The new Infrastructure Planning Commission is likely to face proposals for new or larger overhead electricity transmission lines running through Green Belt areas in Derbyshire, Essex, Kent and North Somerset. Ministers have undertaken that National Policy Statements will reflect existing Green Belt policy.37
Land banking is a phenomenon particularly concentrated on, but not exclusive to, Green Belt land in areas that have enjoyed economic buoyancy in recent years, such as London, the Home Counties and Leeds. Land bankers can vary from major house builders and company pension funds, to speculators from across the world who have been sold land in tiny notional ‘plots’38. In all cases land bankers are
37 See CPRE et al, A Countryside Friendly Smart Grid, March 2009; and statements made by Jim Fitzpatrick MP (then a
Minister at the Department for Transport) to the House of Commons Public Bill Committee on the Planning Bill, in
January 2008.
38 For examples of land banking in the Green Belt by pension funds such as those of BP and British Aerospace see Vidal J,
’10,000 acres of Green Belt under threat’, The Guardian 12 March 2007. For examples of speculative landbanking
involving subdivision of land see CPRE, The Great Landbanking Carve-Up, December 2006.

31
Green Belts: a greener future
waiting for the value of land to increase in the expectation that planning constraints will be weakened or removed.
Land held by well-established companies and funds is generally well-managed in its present agricultural state. The cases involving speculative sub-divisions of plots, though more common in the Green Belt than the countryside as a whole, only involve a tiny proportion of the total area of Green Belt land in England. Nonetheless there are concerns about how land affected by land banking can deliver positive benefits to society through long-term improved environmental management. This is particularly the case when there is a multiplicity of owners from across the world as has been seen in a number of cases.
Much of the land in the Green Belt banked by major companies is proposed for development by land agents working on their behalf through the development plan process.
The effects of the Green Belt designation on development – West Midlands
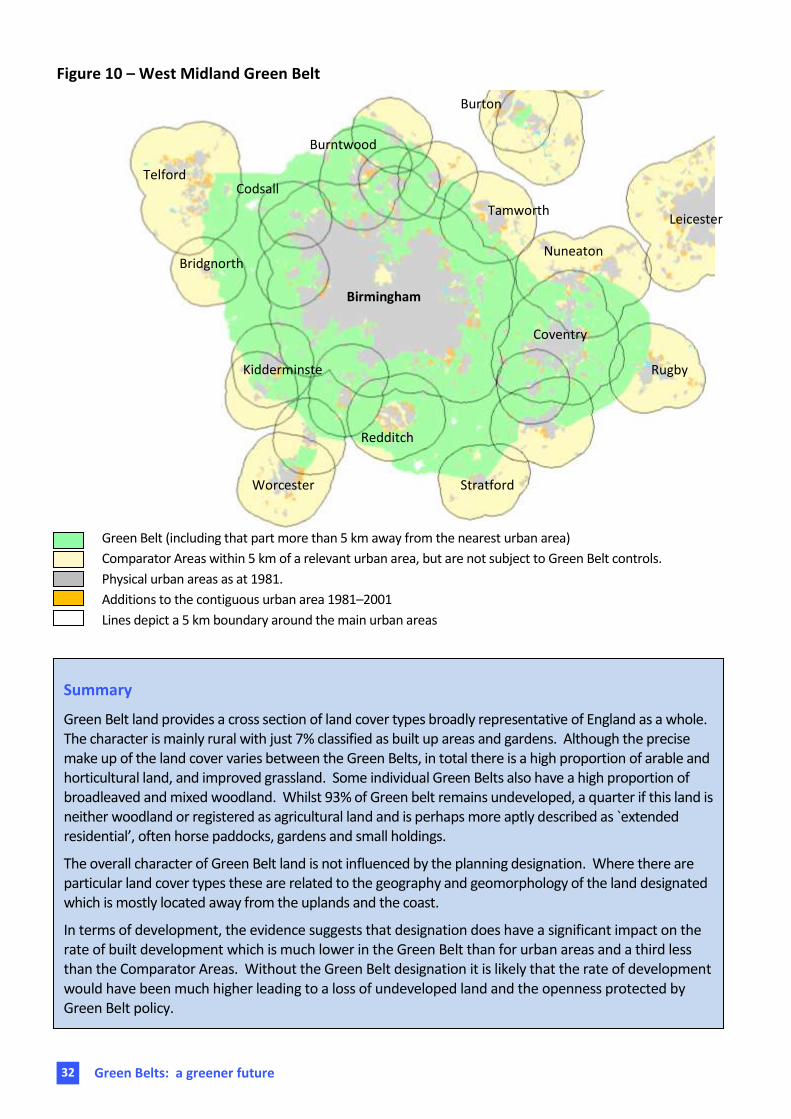
The effects of the Green Belt designation on rates of development can be seen more clearly by looking at the West Midlands Green Belt in greater detail. This encircles the West Midlands conurbation including Coventry, but touches only one edge of the middle ring towns such as Tamworth, Rugby, Stratford, Kidderminster, Bridgnorth and Telford. Leicester, the largest city in England without a Green Belt, appears on the eastern margin (Figure 10).
Few towns in the region are totally surrounded by Green Belt and substantially unprotected margins have allowed for the planned expansion of Telford and Redditch.
It is possible to compare development conditions and other characteristics for many of the West Midlands towns where Green Belt controls have been in place with other unprotected areas – the Comparator Areas (Table 5). Most frequently, the rates of change to developed uses for the Green Belt are markedly lower than for the overall area and for the Comparator Area respectively.
Between 1985 and 2006, the rate for Green Belt areas within Birmingham’s margin was one half of that typical of the entire area (including the development of green pores within the city). For the middle ring towns, the rate of development in the Green Belt has usually been much less than the Comparator Area. One exception to this analysis is the case of Tamworth, which although comparatively small in surface area, serves as a reminder that development pressure tends to be high in parts of the Green Belt.
32
Green Belts: a greener future
Rugby
Worcester
Leicester
Coventry
Burton
Tamworth
Stratford
Kidderminste
r
Bridgnorth
Telford
Summary
Green Belt land provides a cross section of land cover types broadly representative of England as a whole. The character is mainly rural with just 7% classified as built up areas and gardens. Although the precise make up of the land cover varies between the Green Belts, in total there is a high proportion of arable and horticultural land, and improved grassland. Some individual Green Belts also have a high proportion of broadleaved and mixed woodland. Whilst 93% of Green belt remains undeveloped, a quarter if this land is neither woodland or registered as agricultural land and is perhaps more aptly described as `extended residential’, often horse paddocks, gardens and small holdings.
The overall character of Green Belt land is not influenced by the planning designation. Where there are particular land cover types these are related to the geography and geomorphology of the land designated which is mostly located away from the uplands and the coast.
In terms of development, the evidence suggests that designation does have a significant impact on the rate of built development which is much lower in the Green Belt than for urban areas and a third less than the Comparator Areas. Without the Green Belt designation it is likely that the rate of development would have been much higher leading to a loss of undeveloped land and the openness protected by Green Belt policy.
Figure 10 – West Midland Green Belt
Green Belt (including that part more than 5 km away from the nearest urban area)
Comparator Areas within 5 km of a relevant urban area, but are not subject to Green Belt controls.
Physical urban areas as at 1981.
Additions to the contiguous urban area 1981–2001
Lines depict a 5 km boundary around the main urban areas
Burntwood
Codsall
Redditch
Nuneaton
Birmingham

33
Green Belts: a greener future
Chapter 4
People and the natural environment

34
Green Belts: a greener future
People and the natural environment
Introduction
This section reviews the contribution Green Belt land is making to the positive land use objectives in PPG2 relating to Objective 1: opportunities for access, and Objective 2: opportunities for outdoor sport and recreation. It considers these alongside educational and health benefits to assess the broader range of public opportunities for outdoor activity and engagement with the environment offered by the Green Belt.
Provision of space for outdoor recreation
The Green Belt is an important resource of opportunities for informal recreation. Green Belts in particular, but also the Comparator Areas, have higher than average proportions of some types of outdoor recreational open space. There is a smaller proportion of open access land and common land, however, which represent the largest land areas available, in England overall, for outdoor recreation (Table 6).
Figure 11 – Country Parks in the Green Belt
Provision of routes and trails
The density of the Public Rights of Way network is higher in the Green Belt than in other parts of England (Table 7) demonstrating the greater potential for local walks and opportunities to explore the countryside in the urban fringe. As Public Rights of Way are largely remnants of the historical network of routes linking villages, farms, communities and markets they often provide opportunities for people in urban communities to connect with the countryside.

35
Green Belts: a greener future
Figure 12 – Open Access Land in the Green Belt
Objective 1 – Open Access Land
Figure 13 – Density of Public Rights of Way in the Green Belt
Most local authorities have a Rights of Way Improvement Plan with information on the quality of routes and whether they provide a useful resource for people living in the vicinity. Although not specific to Green Belt land, these documents are a useful source of local information on whether the network of routes in the urban fringe provide a useful resource for both recreation and local journeys on foot and cycle.
36
Green Belts: a greener future
The Sustrans National Cycle Network (NCN) has been designed to meet the needs of people today and has improved provision for the urban population to walk and cycle within, around and between towns and cities. The Green Belt now contains 27% of the Cycle Network and a higher proportion is in the non- Green Belt urban fringe (42%). The traffic free parts of the NCN are almost entirely located in Green Belt and non-Green Belt urban fringe (Table 7).
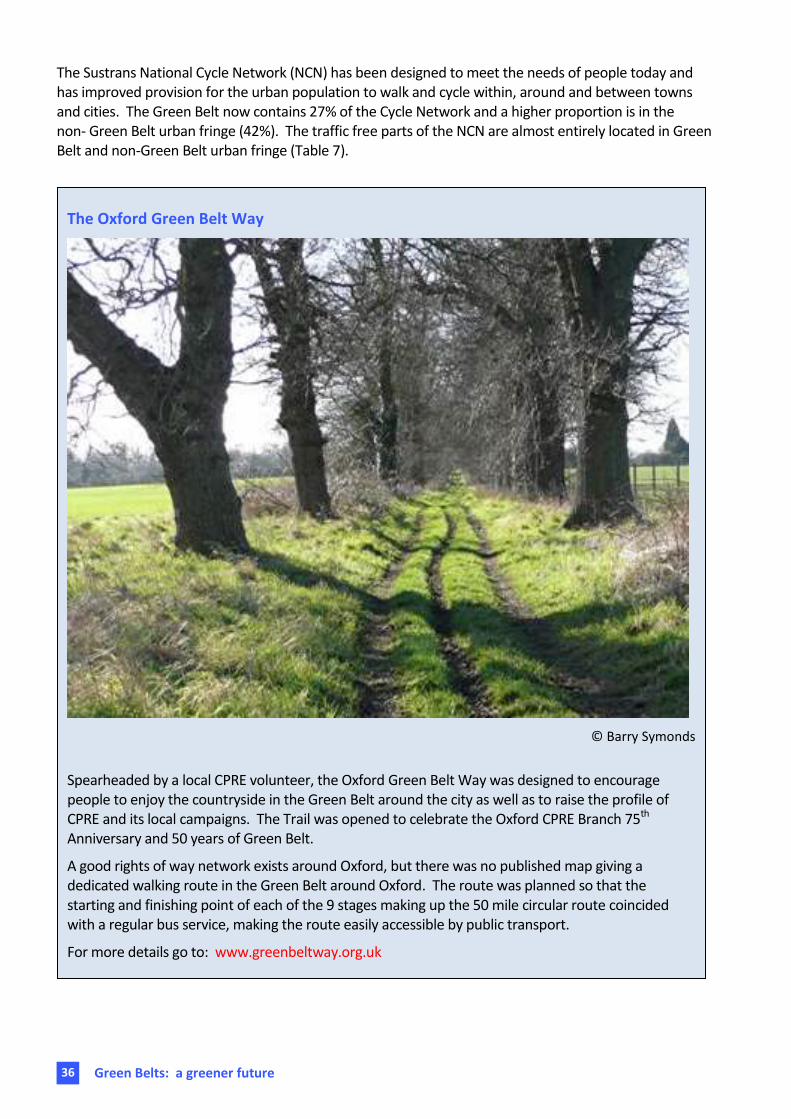
The Oxford Green Belt Way
© Barry Symonds
Spearheaded by a local CPRE volunteer, the Oxford Green Belt Way was designed to encourage people to enjoy the countryside in the Green Belt around the city as well as to raise the profile of CPRE and its local campaigns. The Trail was opened to celebrate the Oxford CPRE Branch 75th Anniversary and 50 years of Green Belt.
A good rights of way network exists around Oxford, but there was no published map giving a dedicated walking route in the Green Belt around Oxford. The route was planned so that the starting and finishing point of each of the 9 stages making up the 50 mile circular route coincided with a regular bus service, making the route easily accessible by public transport.
For more details go to: www.greenbeltway.org.uk

37
Green Belts: a greener future
The higher provision of certain types of recreation space and routes in the Green Belt and the Comparator Areas compared with the rest of England can partly be explained by policies and incentives to create recreational opportunities closer to where people live. It is also due to land becoming available for recreation in the large country estates. In many cases, these estates were built by wealthy industrialists in Georgian and Victorian England close to the major towns and cities where they made their money39.
Accessible Natural Greenspace
Natural England recommends that everyone should have a variety of greenspace, including routes and trails, near to where they live and evidence shows that those with a good range of greenspace close to home, particularly children, are less likely to suffer from obesity and related health issues40. The need for local outdoor recreational opportunities is ever more important with the challenge of adapting to climate change and a low carbon economy. This is considered further in Chapter 8, New Challenges.
Accessible Natural Green Space Standard (ANGSt)
Natural England recommends that everyone should have the following quota of accessible natural green space:
2 hectares within 300 metres
50 hectares within 2km
100 hectares within 5 km
500 hectares within 10km
1 hectare of LNR per 1000 people
In Planning Policy Guidance 17 local authorities are encouraged to “undertake robust assessments of the existing and future needs of their communities for open space, sports and recreational facilities.” The companion guide to PPG17 recommends the use of the Natural England Standard.
39 Land Use Consultants with Kernon Countryside Consultants, The Nature and Potential of Agriculture Around Major
Urban Areas in England, report for Countryside Agency and partners, July 2006, paragraph 3.44.
40 Natural England, Green space access, green space use, physical activity and overweight: a research summary, 2009,
based on original research for Natural England by University of Bristol and University of East Anglia
38
Green Belts: a greener future
Bringing the outdoors closer to people
A study in April 200441 found that the Metropolitan Green Belt contains four areas of public open space over 500 hectares: the Lee Valley Regional Park, Epping Forest, Oaks Park (in Sutton) and Chobham Common (in Surrey).
The catchment areas for these spaces cover most of the eastern side of London north of the River Thames, and most of the boroughs of Croydon and Sutton in the south. There are a number of other green spaces greater than 2 hectares and 50 hectares respectively which between them assist the majority of outer London boroughs in meeting the relevant parts of Natural England’s Accessible Natural Green Space Standard (see page 37).
The study also found that access was better within the area covered by the Greater London Authority than in the areas beyond it. Areas of the Metropolitan Green Belt where access was found to be particularly poor were around Walton on Thames and Weybridge in Surrey.
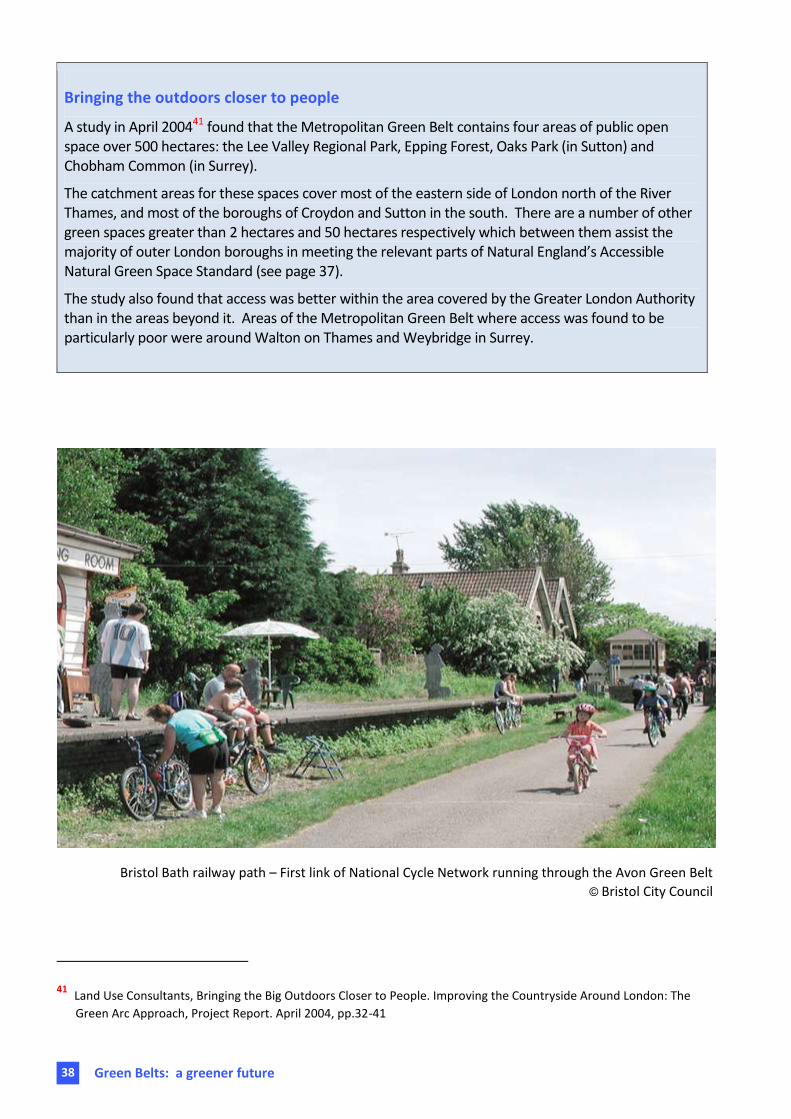
Bristol Bath railway path – First link of National Cycle Network running through the Avon Green Belt
© Bristol City Council
41 Land Use Consultants, Bringing the Big Outdoors Closer to People. Improving the Countryside Around London: The
Green Arc Approach, Project Report. April 2004, pp.32-41

39
Green Belts: a greener future
Educational activity
The proximity of Green Belt to urban areas and many schools and colleges offers opportunities for a range of environmental education activities. Some of these take advantage of the Country Parks, Local Nature Reserves and other local green space in the Green Belt. Some also take advantage of the educational access provided at farms supported with funding from the Environmental Stewardship scheme. Of the schemes funded across England 14% are within Green Belt areas and 12% in the Comparator Areas Table 10).
The Red Kite project in Northumberland is an example where an environmental initiative located in the Green Belt is delivering benefits to education, health, local transport and the economy.
Recreational use of Green Belt land
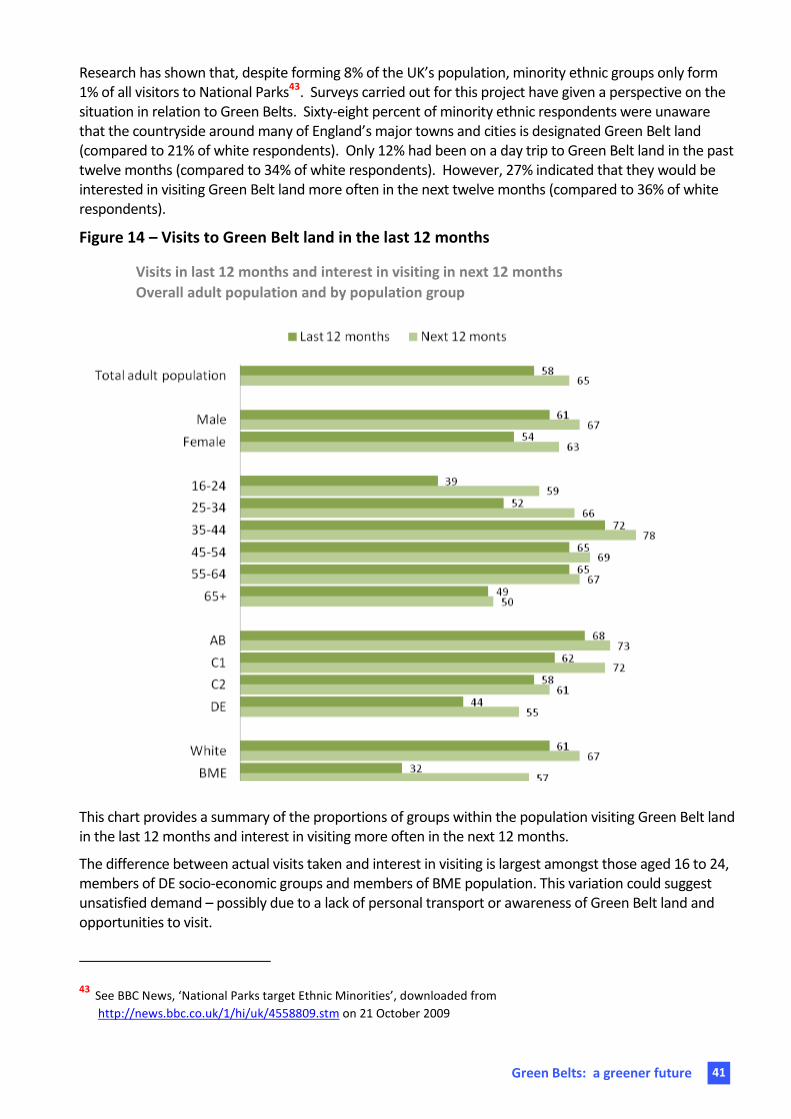
The Green Belt offers a range of opportunities for outdoor recreation, particularly to the 30 million people (60% of the population of England) living in and around the urban areas which the Green Belts surround. Some 58% of people questioned42 said that they have visited the Green Belt in the last 12 months to undertake a variety of activities (Figure 13). Eighty-five percent of the members of the public who responded to the national survey agreed with the statement that ‘the countryside around large towns and cities is somewhere I can go to get peace and quiet’.
Use of the Green Belt for quiet recreation also featured in the top three out of ten possible options describing how the public used the Green Belt in the three areas surveyed by CPRE, with response rates of between 81 and 90% in each area. Quiet recreation was also the most observed public use of the land by landowners and land managers in all three areas.
Sixty-five percent said they were interested in undertaking one or more activity in the next 12 months. Of the 12 options for activities that people wanted to undertake more often in the coming year, visiting for a day out was the highest at 35%, followed by quiet recreation at 26%.
42 Questions were asked during two weeks in July/August 2009 as part of the Natural England’s omnibus survey on
people and the natural environment.

40
Green Belts: a greener future
Green Belt Case Study
‘Northern Kites’ was a 5 year partnership project to return the red kite to north east England.
The project focus is on the urban fringe of Newcastle and Gateshead and very much in the Green Belt. As well as the re-introduction of this iconic species the project has also had a large number of socio-economic benefits some of which are captured below.
The presence of the red kites has created positive health benefits:
Thirty-three Health Walks were organised between September and April 2009. Sixty-three people registered for these walks who have since reported better health.
Two regular walkers improved their fitness so much they chose to become Health Walk Leaders.
A survey of local residents found that 22% attributed an improvement in their physical state to the presence of the kites.
The volunteer health survey indicated that many experienced health improvements as a result of volunteering.
Learning to Fly… with Red Kites’
Northern Kites delivered a Lifelong Learning Programme for people of all ages including:
The hugely successful and innovative Northern Kites ‘Adopt-a-Kite’ Scheme for schools. Through this, over 36,000 children in 107 schools in the North East were delivered positive red kite and environmental messages.
KIDS4KITES, an on-line resource.
The ‘Reduce, Reuse and Recycle with Sprite the Kite’ initiative, which educated over 60,000 children about sustainability issues.
Kite themed adult education courses.
Thousands of people, including over 150 landowners and managers, provided with bespoke Red Kite Information Packs.
The completion of ten red kite research projects by local universities.
41
Green Belts: a greener future
Research has shown that, despite forming 8% of the UK’s population, minority ethnic groups only form 1% of all visitors to National Parks43. Surveys carried out for this project have given a perspective on the situation in relation to Green Belts. Sixty-eight percent of minority ethnic respondents were unaware that the countryside around many of England’s major towns and cities is designated Green Belt land (compared to 21% of white respondents). Only 12% had been on a day trip to Green Belt land in the past twelve months (compared to 34% of white respondents). However, 27% indicated that they would be interested in visiting Green Belt land more often in the next twelve months (compared to 36% of white respondents).
Figure 14 – Visits to Green Belt land in the last 12 months
Visits in last 12 months and interest in visiting in next 12 months
Overall adult population and by population group
This chart provides a summary of the proportions of groups within the population visiting Green Belt land in the last 12 months and interest in visiting more often in the next 12 months.
The difference between actual visits taken and interest in visiting is largest amongst those aged 16 to 24, members of DE socio-economic groups and members of BME population. This variation could suggest unsatisfied demand – possibly due to a lack of personal transport or awareness of Green Belt land and opportunities to visit.
43 See BBC News, ‘National Parks target Ethnic Minorities’, downloaded from
http://news.bbc.co.uk/1/hi/uk/4558809.stm on 21 October 2009
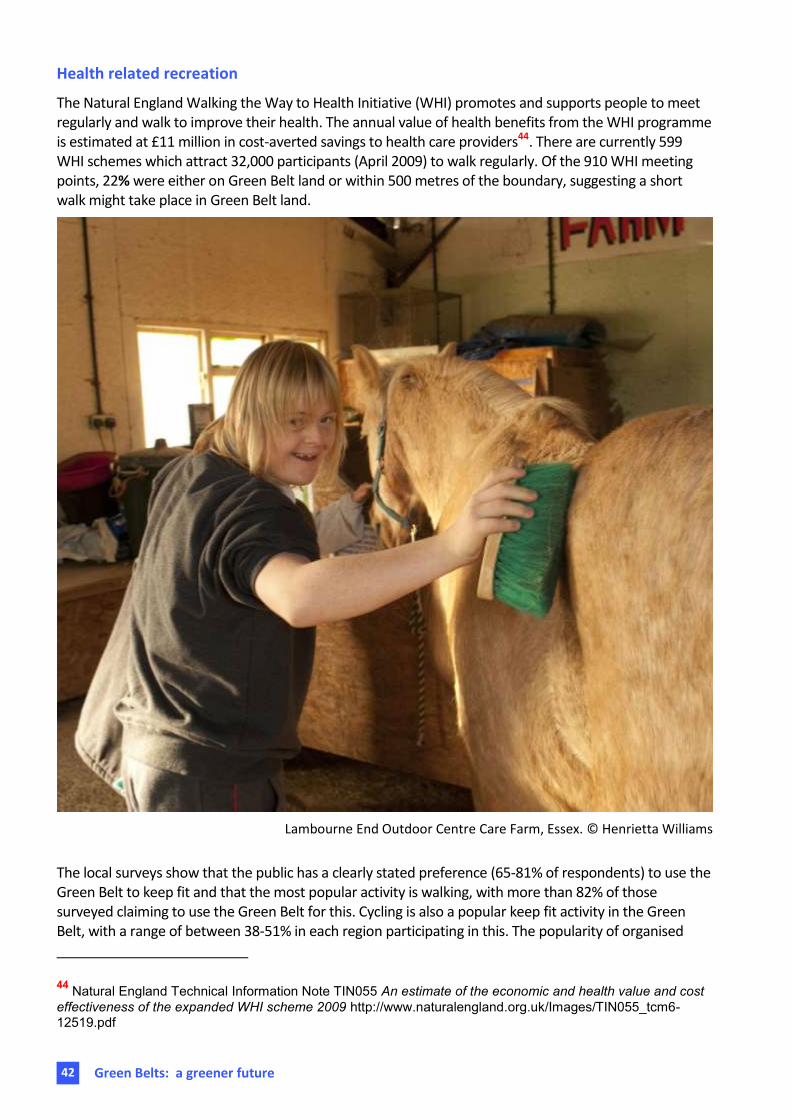
42
Green Belts: a greener future
Health related recreation
The Natural England Walking the Way to Health Initiative (WHI) promotes and supports people to meet regularly and walk to improve their health. The annual value of health benefits from the WHI programme is estimated at £11 million in cost-averted savings to health care providers44. There are currently 599 WHI schemes which attract 32,000 participants (April 2009) to walk regularly. Of the 910 WHI meeting points, 22% were either on Green Belt land or within 500 metres of the boundary, suggesting a short walk might take place in Green Belt land.
Lambourne End Outdoor Centre Care Farm, Essex. © Henrietta Williams
The local surveys show that the public has a clearly stated preference (65-81% of respondents) to use the Green Belt to keep fit and that the most popular activity is walking, with more than 82% of those surveyed claiming to use the Green Belt for this. Cycling is also a popular keep fit activity in the Green Belt, with a range of between 38-51% in each region participating in this. The popularity of organised
44 Natural England Technical Information Note TIN055 An estimate of the economic and health value and cost
effectiveness of the expanded WHI scheme 2009 http://www.naturalengland.org.uk/Images/TIN055_tcm6-12519.pdf

43
Green Belts: a greener future
walking schemes combined with the evidence from the local surveys strongly suggests that Green Belt land could play an important role in health related initiatives in the future.
Other health initiatives and opportunities can also be provided in the Green Belt with its proximity to urban areas making schemes more accessible. Care farming is a good example of this. This uses commercial farms, woodlands and market gardens as a base for promoting mental and physical health through normal farming activity. Care farming has grown rapidly in the Netherlands in recent years, from 75 care farms in 1998 to 1,000 in 200845. Schemes are present in a number of Green Belt locations in England, including Acorn Farm (Knowsley, Merseyside); Lawrence Weston (Bristol); and Lambourne End (Chigwell, Essex).
Outdoor sporting activity
Green Belts also provide space for more organised recreation and sport. There are fewer football pitches in Green Belt than in urban areas, but slightly more golf courses and significantly more equestrian activities and leisure related businesses and attractions, even compared to the non Green Belt Comparator Areas (Table 8 and 9). The particular popularity of horse related recreation in the Green Belt is also borne out by CPRE's local survey work. This revealed that 9.3% of public respondents participated in horse riding. For illustration this can be compared to the national average of about 1% who choose horse riding as a regular activity46.
The Green Belt is also home to some of the nation’s significant formal recreational facilities such as the
National Water Sports Centre, Holme Pierrepont in the Nottingham Green Belt.
© Jon Hancock Photography
45 National Care Farming Initiative, www.ncfi.org.uk/news19-1-09.aspx, downloaded 12 October 2009.
46 Sport England Active People Survey 2, 2007-2008

44
Green Belts: a greener future
Figure 15 – Opportunities for sport and recreation in the Green Belt
Summary
Compared with the rest of England, Green Belt has less open access land but a greater share of some types of recreational resource including Country Parks, Public Rights of Way, National Cycle Network and Local Nature Reserves. People use Green Belt land for informal recreation and value it for the openness it provides. The number of educational activities supported by agri-environment funding in the Green Belt mirror the number across England and there are more health walks starting within or close to Green Belt than in the Comparator Areas. However, there is limited information about the quality of the places provided for outdoor recreation, how far they meet the needs of local people, whether people are able to get to the places, particularly on foot, cycle or by public transport, the patterns and regularity of use, and whether people have good information about the green space close to where they live.
Is Green Belt land achieving the land use objectives for access recreation and sport?
Despite gaps in the information, it is clear that Green Belt land is making an important contribution to the full range of `cultural’ ecosystem services including healthy lifestyles, educational activity, opportunities for outdoor sport and social well-being. With its proximity to the majority of the population there is scope to do more to encourage outdoor education, recreation and sport close to where people live. This will reduce the carbon footprint, help people to engage more with the environment around them, and encourage more regular outdoor activity to promote healthier lifestyles.


