GREEN BUILDINGS AND GREEN USERS: AN ASSESSMENT OF USING GREEN
BUILDING ENVIRONMENTS TO COMMUNICATE SUSTAINABILITY TO USERS
By
Ruqun Wu
A DISSERTATION
Submitted to
Michigan State University
in partial fulfillment of the requirements
for the degree of
Geography—Doctor of Philosophy
2016
ABSTRACT
GREEN BUILDINGS AND GREEN USERS: AN ASSESSMENT OF USING GREEN
BUILDING ENVIRONMENTS TO COMMUNICATE SUSTAINABILITY TO USERS
By
Ruqun Wu
The objective of this work is to assess how green building and green building design
communicate sustainable messages to the building users and affect their awareness, perception,
and knowledge toward sustainability, as well as their pro-environmental behaviors. A
corresponding new concept of influential design is proposed to fulfil the research needs. Two
research challenges—the theoretical and the methodological challenges—are raised to study the
influential design, complemented by three studies. The first study adopted Ajzen’s theory of
planned behavior and extracted the building communication mechanism as: 1) active instruction
from people; and 2) passive instruction from the building. The second study differentiated the
green design elements into visually available or conceptual only green designs and applied
hierarchical regression modeling to ensure the analysis at a finer lever and address spatial
variations within each building and among different buildings. Finally, using a LEED certified
campus residential hall as the study site, the third study empirically tests whether the studied
building affords successful communication of sustainable messages to its users. The results
suggested that the building could afford to promote the awareness among users, while it could
not afford the users’ general knowledge about green building. And users’ perceptions about
green designs are experienced at different spatial scales. Key contributions of this work are: 1)
transferring a message on the construction of an ecologically aware society; 2) applying the
spatial perspective of the building and building design identified to further theoretical research;
3) separating different design elements and performing the analysis at a finer level to extract
causality from the built environment; and 4) providing practical evidence for the green building
management and insights for understanding the design-environment-use feedback loops. For
future work, a specific hypothesis regarding the dichotomous spatial perspectives of a person can
be explored as to whether it is more effective to use the green design at building product or space
scale to communicate sustainability. It is also suggested to consider factors such as different
types of buildings and user groups.
v
ACKNOWLEDGEMENTS
I would like to express thanks to my advisor Dr. Jiquan Chen in Geography for his tremendous
mentor for me. I would also like to thank my committee members, Dr. Arika Ligmann-Zielinska
in Geography, Dr. Peilei Fan in Urban and Regional Planning, and Dr. Suk-Kyung Kim in
Interior Design for serving as my committee and providing insightful comments and suggestions.
I appreciate the academic guidance from Dr. Defne Apul from University of Toledo. I would like
to thank our graduate advisor Ashton Shortridge, and the coordinator Sharon Ruggles. Special
thanks to Dr. Frank Boster and other friends in the College of Communication Arts and Sciences.
I would especially like to thank Carla Iansiti, Jeffery Scheffler, Donald Donagrandi, Michael
Hicks and all other staff at Residential and Hospitality Services for their professional and
efficient help to facilitate the survey conducted in the residential hall. And thanks to Gabriela
Shirkey, Hogeun Park, and Ranjeet John from Landscape Ecology & Ecosystem Science (LEES)
labs who helped me during the questionnaire survey. I appreciate the financial support from the
National Science Foundation (CHE-1230246) for my Ph.D. studies. At the end, I appreciate all
the enjoyable moments that I spend with my friends, and I would like to express appreciation to
my families who always support me.
vi
TABLE OF CONTENTS
LIST OF TABLES ....................................................................................................................... viii
LIST OF FIGURES ....................................................................................................................... ix
1. INTRODUCTION ...................................................................................................................... 1
1.1 Green Building and Communication of Sustainability ......................................................... 1
1.2 Research Questions ............................................................................................................... 4
1.3 Relationships to Sustainability .............................................................................................. 5
1.4 Intellectual, Practical, and Industrial Contributions .............................................................. 6
2. CURRENT UNDERSTANDING ............................................................................................... 8
2.1 Impacts of Green Building on Users ..................................................................................... 8
2.2 Green Building and Users’ Pro-Environmental Attitudes and/or Behaviors ........................ 9
2.3 Relationships between Green Building Design and Sustainable Behaviors ....................... 14
2.3.1 Energy and Water ......................................................................................................... 15
2.3.2 Indoor Environmental Quality ...................................................................................... 16
2.3.3 Transportation ............................................................................................................... 16
2.3.4 Waste Treatment ........................................................................................................... 17
2.4 Sustainable Communication and Education of Green Building .......................................... 18
3. RESEARCH CHALLENGES AND APPROACHES .............................................................. 21
3.1 Theoretical Challenges ........................................................................................................ 22
3.2 Methodological Challenges ................................................................................................. 23
3.3 The Proposed Research Framework and Research Scope .................................................. 25
4. GREEN BUILDINGS NEED GREEN OCCUPANTS: USING THE THEORY OF
PLANNED BEHAVIOR TO STUDY COMMUNICATION OF SUSTAINABILITY FROM
GREEN BUILDINGS ................................................................................................................... 30
4.1 Introduction ......................................................................................................................... 31
4.2 Background Understanding from Communication Science ................................................ 32
4.3 Relevant Studies .................................................................................................................. 35
4.3.1 Green Building-Green Occupant Studies ..................................................................... 35
4.3.2 The TPB for Explaining Green Building–Green Occupant Studies ............................. 37
4.3.3 Visual Persuasion of Green Building and Green Design ............................................. 39
4.4 A Framework Incorporating the TPB for Green Building–Green Occupant ...................... 43
4.4.1 The Framework............................................................................................................. 44
4.4.2 Sample Questionnaires ................................................................................................. 46
4.5 Discussion ........................................................................................................................... 50
4.6 Chapter Conclusions ........................................................................................................... 54
vii
5. THE INFLUENCE OF GREEN BUILDING DESIGN – SEPARATING TO CONCEPTUAL
VS. VISUAL ELEMENTS ........................................................................................................... 55
5.1 Introduction ......................................................................................................................... 56
5.2 Visual Persuasion of Architectural Elements ...................................................................... 56
5.3 A Preliminary Survey .......................................................................................................... 60
5.4 Hypothetical Data Simulation ............................................................................................. 62
5.5 Discussion ........................................................................................................................... 67
5.6 Chapter Conclusions ........................................................................................................... 68
6. HOW GREEN BUILDINGS AFFORD COMMUNICATION OF GREEN DESIGN TO THE
USERS? A SURVEY STUDY ON A LEED CERTIFIED BUILDING ..................................... 70
6.1 Introductions........................................................................................................................ 70
6.2 Methods ............................................................................................................................... 72
6.2.1 The Research Setting .................................................................................................... 72
6.2.2 The Working Procedures .............................................................................................. 75
6.2.3 The Questionnaire ......................................................................................................... 77
6.2.4 Analysis ........................................................................................................................ 81
6.3 Results ................................................................................................................................. 84
6.3.1 Aware-ability ................................................................................................................ 85
6.3.2 Know-ability ................................................................................................................. 87
6.3.3 Perceive-ability ............................................................................................................. 90
6.3.4 Future Importance ......................................................................................................... 92
6.4 Discussion ........................................................................................................................... 94
6.4.1 Aware-ability ................................................................................................................ 94
6.4.2 Know-ability ................................................................................................................. 95
6.4.3 Perceive-ability ............................................................................................................. 96
6.4.4 Future Importance ......................................................................................................... 98
6.5 Chapter Conclusions ........................................................................................................... 99
7. CONCLUSIONS..................................................................................................................... 101
7.1 Summary ........................................................................................................................... 101
7.2 Philosophical, Theoretical and Methodological Contributions ......................................... 103
7.3 Limitations and Future Work ............................................................................................ 104
7.4 Outlook .............................................................................................................................. 107
APPENDICES ............................................................................................................................ 108
Appendix A. Definitions of Terminologies ............................................................................ 109
Appendix B. Results and Analysis from In-depth Review of Previous Studies ..................... 114
Appendix C. Simulation Results of the Hierarchical Model ................................................... 117
BIBLIOGRAPHY ....................................................................................................................... 118
viii
LIST OF TABLES
Table 1. A detailed description of the three equations for measuring Ab, SN, and PBC in the
TPB. .............................................................................................................................................. 41
Table 2. Sample questionnaire designed for measuring the effectiveness of active instruction,
using the example of waste categorization as a targeted behavior. .............................................. 48
Table 3. Sample questionnaire designed for measuring the effectiveness of passive instruction,
differentiating visual and conceptual-only green design. ............................................................. 49
Table 4. Alternative questions to be asked according to the LEED scheme for a more complex
and categorized version to measure conceptual-only green design. ............................................. 50
Table 5. Possible results of studying the effects of active or passive instruction, or an interaction
between active and passive instruction. ........................................................................................ 51
Table 6. The result of the preliminary survey from Melbourne Council House 2. The contingent
2 by 2 table shows the answers on the first and second question. ................................................ 61
Table 7. Background characteristics and the percentage of respondents who are aware or not
aware about the Brody being green based on different user groups. ............................................ 85
Table 8. The perceive-ability for each green design feature implemented in Brody, and the
prioritizing of each of them for future design (Knwl = knowledge: knwl = 0 means knowing
neither, knwl = 1 means knowing either one, knwl = 2 means knowing both questions). ........... 93
Table 9. Previous studies on relationships between green building and occupants’ pro-
environmental attitudes/behaviors and other general environmental attitudes/behaviors studies.
..................................................................................................................................................... 114
Table 10. Associations between green designs and sustainable behaviors from previous research.
..................................................................................................................................................... 115
Table 11. A sample checklist of associations between green designs and sustainable behaviors
that might be implemented in an office building. ....................................................................... 116
ix
LIST OF FIGURES
Figure 1. The conceptual framework for the research, including three individual chapters, with
Chapter 4 and Chapter 5 providing possible solutions to the research challenges and Chapter 6 as
an empirical extension. ................................................................................................................. 26
Figure 2. The feedback loops in studying the influential building designs and the stakeholders
covered in this research. ................................................................................................................ 27
Figure 3. Results of the literature reviews on green building–green occupant studies through the
lens of the theory of planned behavior. ......................................................................................... 42
Figure 4. The modified theory of planned behavior framework to disclose effectiveness of active
instruction (Figure 4a) and passive instruction (Figure 4b). The subscript 1/2 represents the pre-
and post-intervention measurement for each construct. Δ indicates the net change after the
exposure to the green building, to capture the effects of passive instruction – the informational
background factor under the TPB model. ..................................................................................... 46
Figure 5. The three levels of meaning conveyed from the building elements, and two types of
elements under the green building context – the visually available and conceptual only green
design. An example of low-level meaning (adapted from Hershberger (1974)) and an example of
middle-level meaning using a green design example. .................................................................. 59
Figure 6. The hierarchical regression model simulating the individuals clustering in 15 buildings
with different characteristics – a building either having conceptual-only green design or visually
available green designs. ................................................................................................................ 65
Figure 7. The simulation results with likelihood, prior, and posterior shown for the hierarchical
regression model – a screenshot showing results for the estimated parameter of the model
without group-level indicators. ..................................................................................................... 66
Figure 8. The working procedures and logics for understanding major aspects that the green
building shall afford, including the aware-ability, the know-ability, and the perceive-ability, as
well as how people prioritize each design for future implementation. ......................................... 75
Figure 9. The photo elicitation shown to the respondents regarding the selected green design
features implemented in the study site. The short-name for each feature follows the full name in
the bracket. .................................................................................................................................... 80
Figure 10. Conditional independence plot visualizing the relationships between the frequency
(three levels: 1 = rare, 3 = monthly and weekly, 5 = daily) and the awareness (two levels: yes or
no), given respondents’ prior knowledge about green buildings (three levels: laymen, familiar, or
experts). ......................................................................................................................................... 87
x
Figure 11. Mosaic plot showing the lack of fit for the two log-linear models (the
mutual/conditional independence model) investigating independence between the two knowledge
variables (K1 and K2) and the awareness. Figure 11.a indicates that when awareness = 1, K1 and
K2 are positively associated (the blue color). Figure 11.b indicates that when awareness = 0, K1
and K2 are negatively associated (the red color). ......................................................................... 89
Figure 12. The perceive-ability on the new, reduced five variables according to people’s
awareness. The Edu (educational signs), Vw (outside views), and Veg (indoor vegetation) are the
original features, P combines product-related variables, and S combines space-related variables.
....................................................................................................................................................... 92
Figure 13. The hierarchical regression model setup with Winbugs and simulation results for the
model with group-level indicators (g1 and g2). .......................................................................... 117
xi
KEY TO ABBREVIATIONS
BUS Building Use Studies method
CBE Center for Built Environment at UC Berkley
EAI Environmental Attitudes Inventory scale
EB Environment-Behavior
GEB General Measure of Ecological Behavior scale (GEB)
HLR Hierarchical Linear Regression
IEQ Indoor Environmental Quality
LCA Life Cycle Assessment
LEED Leadership in Energy and Environmental Design
NEP New Ecological Paradigm scale
PBC Perceived Behavioral Control
POE Post-occupancy Evaluation
SN Subjective Norm
TPB The Theory of Planned Behavior
USEPA U.S. Environmental Protection Agency
USGBC U.S. Green Building Council
1
1. INTRODUCTION
1.1 Green Building and Communication of Sustainability
Green buildings have become increasingly popular due to their healthier and more resource-
efficient models of design, construction, operation, renovation, maintenance, and demolition
(USEPA 2016). Buildings designed in the past century exemplify the then prevailing modernism
view - the Dominant Social Paradigm (e.g., the assumption of human dominance over nature and
human separation from nature) (Dunlap and Van Liere 1978, Lynam 2007). However, the past
few decades had witnessed fundamental changes in the prevailing social world-view alongside
the environmental movement (Lynam 2007), which had also manifested itself in the emergence
of green buildings (Wu et al. 2015).
Environment-Behavior research answers questions such as “What street layout, sign
system, and landmark location in a new town will make it easy for residents to feel at home?
Why do teenagers vandalize isolated buildings in parks that they themselves could otherwise
enjoy? Does high-density living make people friendlier or meaner?” (Zeisel 2006). It has been
demonstrated that people might be more susceptible to a building’s architectural influence than
they might realize (Yiannas 2015). In this work, an emphasis is about the spatial dimension, such
as determining users’ perceptions about the environmental setting at different spatial scale.
Specifically, the role of space is a dimension in situational surroundings in which human
activities are enacted and experiences are felt (Amedeo et al. 2009).
A wide range of studies on the physical environment (e.g., buildings) and their
associations with user’s behavior and/or experience exist. The physical environment that
supports healthy behaviors is receiving escalating interest (Thompson 2013). Researchers strive
to apply appropriate urban planning and building design as a component for actions related to the
2
prevention of crime (Zeisel 2006). The syntactic properties of layouts of buildings and cities are
important determinants of wayfinding behavior (Peponis et al. 1990). Kim and Kaplan (2004)
used a new urbanism community development case and found that natural features, open spaces,
the overall layout of the community and traditional architectural style played important roles in
determining the residents’ sense of community (i.e. place attachment, community identity, social
interaction, and pedestrianism). Cloutier et al. (2014) related the achievements on
sustainable practices regarding energy/water/waste/food management, urban design, green
building development with residents’ happiness at city level.
Sustainability is defined in this work according to the ISO 15392 – Sustainability in
Building Construction as “a state in which components of the ecosystem and their functions are
maintained for the present and future generations, whereas components of the ecosystem
includes plants and animals, as well as humans and their physical environment.” For humans,
sustainability requires a balancing of key elements of human needs: the economic,
environmental, social and cultural conditions for societies’ existence (ISO 2008, Wu et al. 2016).
The building users mentioned in this work include the following two types of individuals:
1) regular building occupants, including both full-time-equivalent (i.e. representing a regular
building occupant who spends 40 hours per week in the building) and part-time occupants (with
FTE values based on their hours per weeks divided by 40), examples include residents in
apartment, overnight hotel guests, full/part-time employees; and 2) visitors, such as retail
customers, restaurant customers, higher education students other than residents of dorms
(USGBC 2016a).
Two themes that are becoming increasingly popular in the sustainability sector are
effective communications and behavior change (Kaluarachchi and Jones 2013). In the green
3
building sector, it has been identified that the attitudes and behavior of occupants play a critical
role in promoting green buildings, and achieving desired performance of green buildings (Zuo
and Zhao 2014). The focus is that people, their attitudes, and behavior towards sustainable living
are the ultimate critical factors to achieve a low-carbon, green built environment.
Up to date, only a few studies have evaluated the development, emergence, and
performance of a green building in relation to human minds, values, perceptions and behaviors
(Wu et al. 2015). Based on the Environmental Determinism, which states that there is a link
between the behavioral patterns of people and the geographical area they inhabit, Architectural
Determinism, suggests that the environment facilitates or inhibits behavior, providing
opportunities that influence the probability that behaviors will or will not occur (Lynch 1960,
Psychology Dictionary 2016). Lynch (1960) argued that behavior observation should be an
essential part of the design in order to understand what people actually do on a site to inform new
planning. This kind of thinking has been acknowledged, for example, the Post-Occupancy
Evaluation (POE) seeks whether the implemented designs meet the original intentions, to seek
unintended consequences from users’ interaction.
Two decades ago, Lister and Stevens (1996) suggested buildings as an active teaching
tool to communicate sustainability. Lynam (2007) tested the potential to educate building users
about sustainability through immersion in a green building. Using buildings as a teaching tool
has a distinctive feature, that is, buildings as visual objects themselves can vividly communicate
messages to people. Previous studies have already shown that the visualization of sustainability
is effective in sustainable education/communication (Ma 2008, Mann 2011, Wu et al. 2016).
Under the current transformation to sustainable urbanization and the emergence of green
buildings, few studies existed on researching the effects of sustainable physical environment
4
(used interchangeably with green building design throughout the paper) on users’ behavior. Most
relevant studies compared the environmental attitudes of occupants from green buildings with
those from control buildings (Hostetler and Noiseux 2010, Deuble and de Dear 2012, Daniel et
al. 2014). The fundamental questions, however, remain uncertain, such as “What are the
communication mechanisms and through which communication channels do green building
designs convey their meanings to building users?”
1.2 Research Questions
The overall objective of this research is to study how green buildings and green design elements
communicate sustainable messages to people and affect their awareness, perception, knowledge
toward sustainability, as well as their pro-environmental behaviors. I conducted my research
from both theoretical and methodological aspects and finished with an empirical study.
The theoretical and methodological challenges will be laid out based on current
understanding after a comprehensive review of previous studies. A solution to theoretical
challenges is proposed through the lens of the theory of planned behavior (TPB), and it serves to
answer the following questions: 1) to what extent do green buildings communicate green
messages to their occupants? And 2) how do buildings influence occupants’ pro-environmental
behaviors?
Then, a solution to methodological challenges is proposed through applying hierarchical
linear regression to evaluate the potential of a green building design on influencing the
occupants’ pro-environmental behavior, especially the effectiveness of its visual persuasion. The
hierarchical linear regression model with Bayesian inference is proposed and tested with
simulated data, which extracts: 1) the effectiveness of the visual or conceptual-only green
building design on influencing occupants to behave more pro-environmentally at the building-
5
level; and 2) the effects due to the occupants’ awareness and perception of the green design at
the individual/personal level.
Finally, a survey study in a Leadership in Environmental and Energy Design (LEED)
certified residential hall on campus is carried out to answer following questions: 1) how can the
affordance theory be applied to the green building? 2) using the concept of “x-ability” from the
affordance theory, how does the building afford three major aspects: 2.1) “aware-ability”, how
the users become aware of the building being a green building, 2.2) “know-ability”, how the
users become knowledgeable about general green building topics, and 2.3) “perceive-ability”,
how users perceive different green design elements. A special emphasis on spatial dimension is
investigated when studying perceive-ability.
1.3 Relationships to Sustainability
The emergence of the green building goes along with technical standards and certification
schemes such as LEED, Energy Star. To ensure the sustainable operation of green buildings,
technical sustainability (i.e. in terms of building products, construction methods, daily operations
(Williams and Dair 2007)) alone, without users’ involvement is not enough. The question
remains not so much about the adoption of green building technologies as to that of: 1)
communication of green design philosophy; 2) appreciation of green designs; 3) generation of
green building and sustainability knowledge; and ultimately; and 4) the adoption of sustainable
behaviors.
The connection of this work with sustainability is multi-fold. First, a synergistic effect
might be ascertained: if people are positively influenced by green concepts, they will support
green buildings and thus provide a virtuous cycle. Second, if these positive synergies are
confirmed, the barriers to implementing green building practices once identified by Hoffman and
6
Henn (2008) could also be tackled, which include factors such as egocentrism, and
environmental literacy at the individual level. Third, people can become more conscious about
green buildings and the natural environment. Fourth, the results can be learned, shared, adopted
by further green building designs in similar settings, thus reducing the design-use gap in a
building development. On the contrary, if a green building, and/or its design elements cannot
express themselves properly and if people are not aware of its green features, do not perceive it
as a green building, or it cannot facilitate people’s sustainable behaviors, such findings can also
have major implications for the future design and management of green buildings.
1.4 Intellectual, Practical, and Industrial Contributions
The worldwide booming of green buildings has several foundations: 1) the positive impacts on
the external environment (e.g., through sustainable site, reduction of material and energy) and
the society (e.g., saving building life-cycle cost, creating a green job market); and 2) the positive
impacts on occupant health through providing occupants better indoor environmental quality. A
systematic way of quantifying such impacts is Life Cycle Assessment (LCA). While LCA is
widely recognized and adopted, one of the biggest challenges remains: modeling the impacts
from building use stage. Previous studies either chose not to study/report the impacts from use
stage (Lazzarin et al. 2008, Connor et al. 2012), or use pre-defined assumptions (e.g., from the
building designer) to estimate the impacts from use stage (Singh et al. 2011). Such pre-defined
static assumptions have been increasingly criticized and some study tried to establish dynamic
occupancy profile and applied to whole building LCA (Collinge 2013). This study introduces a
feedback loop within different stakeholders along the life cycle of a building and fills in the gap
between the initial design and user experience within the loop. Insights gained in this study can
be integrated into future whole building LCA.
7
The 2009 Passive and Low Energy Architecture Conference reinforced the importance of
human agency in the built environment, denounced the disconnection between the occupants and
the building, confirmed the consideration of dynamic and responsible interaction between
inhabitants and architecture, and applauded rehumanizatison of architecture through inhabitants’
increased autonomy rather than automation (Cole et al. 2010). A 2014 review of the current
status and future agenda for green building research also explicitly identified the behavioral and
cultural factors as crucial factors to achieve the desired performance of green buildings. Besides,
attitudes and behaviors of occupants play a critical role in promoting green buildings (Zuo and
Zhao 2014). The human factors along the life cycle of a building have been reinforced in this
work.
This work could potentially add a new dimension within user experience in relevant
technical standards. Examining current industry technical standards available for assessing the
sustainability of construction works and buildings, it seems that most of their focus is paid to the
technical sustainability. One suite is the ISO standards for sustainability in buildings and
construction works: the ISO 15392 Sustainability in building construction are general principle
guidelines to assess the environmental performance of a building’s construction and the
environmental declaration of building products. They both has a focus on environmental life
cycle assessment of building products. Another suite of EU standards is the EN 15643 series,
which covers the “sustainability of construction works” at different scales. Unlike the ISO suite,
the EU series puts extra effort in assessing social and economic impacts. One example is the
adaptability (clause 7.3 in EN 16309), which aims to assess the building’s ability: 1) to
accommodate individual user requirements; 2) to accommodate the change of user requirements;
3) to accommodate technical changes; and 4) to accommodate the change of use.
8
2. CURRENT UNDERSTANDING
To identify research gaps and detail research questions, literature reviews were conducted to
better understand the background and current understanding of these research topics. Available
studies were reviewed and grouped into following categories: 1) impacts that green buildings
have on users; 2) green buildings and users’ pro-environmental attitudes and/or behaviors; 3) the
relationships between green building design and users’ sustainable behaviors; 4) the meaning and
communication roles of architecture and education of sustainability from green buildings. The
first section (Chapter 2.1) provides a brief background in recent scholarly thinking on relevant
topics, while the next three sections provide more in-depth reviews of relevant studies and
concluded with analysis from this study’s perspective.
2.1 Impacts of Green Building on Users
Studies on the impacts of green buildings on occupants are most widely carried out as Post-
Occupancy Evaluation (POE) studies. Topics covered include office layout, furnishing,
workspace, thermal comfort, air quality, lighting, acoustics, cleaning & maintenance,
accessibility, IT/data projection, security (Blyth and Gilby 2006, CBE 2015). Evaluation
methods vary from interview, focus group, workshop, to questionnaires (Blyth and Gilby 2006).
Center for Built Environment (CBE) at UC Berkley maintains a large commercial database on
occupant indoor environmental quality survey. Another POE methodology is the UK’s Building
Use Studies (BUS) methodology, it also maintains a commercial database of 650 non-domestic
buildings from 17 countries and 50 domestic projects from the UK (Arup 2015). Many specific
studies have looked at occupants’ satisfaction on green buildings (Abdul-Muhmin 2007, Lee and
Kim 2008, Altomonte and Schiavon 2013, Hua et al. 2014, Liang et al. 2014). Ouf et al. (2013)
composed a set of indicators measuring occupant satisfaction, health, and productivity, and the
9
satisfaction indicators include beauty, serenity, and color, which are not commonly measured by
other methodology. Another group of studies looked at the impacts that green buildings have on
the well-being of occupants, including mental and physical health, productivity at the green
workplace (Lee 2007, Singh et al. 2010, Gou et al. 2014). Biophilic architects proposed that
integrating natural contents (e.g., calm water features and vegetative elements) in the built
environment could counter the negative effects on human functioning (e.g., reducing stress) due
to reducing opportunities for contact with natural contents in modern urban life (Joye 2007).
The relationships between the green buildings and occupants are mostly studied by
focusing on how the occupants’ behaviors impact on green building performance (Kashif et al.
2013, Lee and Malkawi 2014), instead of the other direction – the influence that green buildings
have on the occupants’ behaviors. Many have identified that, due to the actual behavior of
occupants, the actual performance (e.g., electrical consumption) of green buildings could not
meet the initial forecast (Browne and Frame 1999, Hoes et al. 2009, Masoso and Grobler 2010).
A new building science called occupancy analytics was proposed by Bacon (2013), recognizing
the need to understand the poor performance of current building stocks when society has
invested significantly in improved asset specification. Zeiler et al. (2013) proposed a human-in-
the-loop strategy to integrate the occupants into the buildings’ performance control loop, to solve
the occupants’ complaints on comfort and unnecessary high-energy consumption of HVAC
system.
2.2 Green Building and Users’ Pro-Environmental Attitudes and/or Behaviors
Several studies used office buildings as the research setting to identify whether occupants in
green buildings embrace more pro-environmental attitudes and/or behaviors. The study by
McCunn and Gifford (2012) was carried out in Canada with 77 employees surveyed from 15
10
LEED certified buildings. The occupants’ environmental attitudes were measured by New
Ecological Paradigm (NEP) scale (Dunlap, Van Liere et al. 2000), they were also asked about
their pro-environmental behavior using the General Measure of Ecological Behavior scale (GEB)
(Kaiser 1998). With correlation analysis, the results showed green design attributes in offices do
not have a significant effect on either employee environmental attitudes or behavior.
The study by Rashid et al. (2012) was carried out in the U.S. with 175 employees
surveyed from a single LEED-certified building. Based on correlation and regression analysis, it
was found that no direct effects of green office design features on occupants’ environmental
awareness. The independent variable were named as green design features by the author in the
study, including measurement on following variables: 1) having sufficient storage and furniture
in the workspace, 2) enjoying the outside view, 3) having enough privacy, 4) socializing in the
lounge/break room, 5) having easy access to equipment and to coworkers. In contrast, the study
by McCunn and Gifford (2012) measured a more comprehensive list of green design features.
The dependent variable in Rashid et al. (2012)’s study – named environmental awareness
measured eight items (including, for example, asking if this building has a positive effect on the
environment, helps conserve energy, provides a healthy work environment, increases company
reputation). These items, in my point of view, are more of a personal evaluation of the building
instead of a measurement of personal environmental awareness.
Azizi and Wilkinson (2015) carried out a comparative study in two green (both a certified
and non-certified) and one conventional office buildings in Malaysia to examine whether
occupants’ motivation to practice energy-saving behavior are different in green and conventional
buildings. The NEP scale was deliberately not used as it was considered too long, instead, simple
questions were asked (e.g., rating the importance of knowing that energy scarcity is a global
11
issue). Through Man U Whitney test, no significant difference in the response between green and
conventional buildings was found regarding motivational factors such as knowing that energy
scarcity is a global issue. On the other hand, occupants feel more motivated to practice energy-
saving behaviors in the certified green buildings provided that they know the building is
designed green.
Other than using office buildings, some researchers used academic buildings. One study
compared a green and a conventional academic building in Canada to study differences in
environmental attitudes of the students (Lynam 2007). A mixed method research approach was
used by collecting both questionnaires on environmental attitudes of students within two
buildings (by NEP Scale) and qualitative interviews (Lynam 2007). Grounded theory was used to
analyze the qualitative data and one-tail t-test was used to compare mean NEP scores of students
in green vs. conventional building (whereas the null hypothesis was no difference in the NEP
scores) (Lynam 2007). The results from the interviews showed that green buildings carried a
stronger pro-environmental messages to occupants so long as the green building occupants have
some awareness of the building’s green status (Lynam 2007). However, the results from
quantitative examination came as a surprise where the students in conventional buildings hold
more pro-environmental attitudes, which, actually might be explained from the interview,
because groups, organizations, as well as staff/ faculty members in the conventional building
conveyed stronger pro-environmental messages than those in the green building.
Using academic buildings in Sydney, Australia, a questionnaire survey was distributed to
two academic buildings, one natural ventilated (NV) and one mixed-mode (MM) building
(whereas NV is considered as a green building) (Deuble and de Dear 2009). The questionnaire
measured the POE by the BUS methods and environmental attitude by NEP scale. Using a linear
12
regression model, the study confirmed occupant satisfaction levels on the POE were positively
associated with environmental attitudes. An earlier study carried out in the same two buildings
showed the occupants from NV building has a significantly higher mean NEP score than MM
building.
Other than the above studies on non-domestic buildings, studies focusing on residential
buildings/communities in the U.S. and Australia were found. An empirical study in Florida
aimed to compare the environmental knowledge, attitudes and behaviors of homeowners in four
master-planned golf communities: two green communities (one certified by the Florida Green
Building Coalition and one non-certified) and two conventional communities (Hostetler and
Noiseux 2010). Measuring of environmental knowledge was based on previous survey, attitudes
were measured by NEP scale, and behaviors were measured using the questionnaire developed
by Youngentob and Hostetler (2005). ANCOVA analysis was carried out to account for the
significant differences of demographic variables and their significant correlation with survey
questions. Chi-square test, Fisher’s Exact test; and Wilcoxon-Mann-Whitney, ANOVA was used
for categorical and non-categorical responses, respectively. The results showed green
homeowners reported more environmental knowledge and behaviors in only a few questions and
no differences in attitudes were found.
The studies by Hyde and his research group focused on residential buildings in
Queensland, Australia. Upadhyay et al. (2010) proposed a framework for assessment of
sustainable housing from environmental quality of life (QoLe) approach, in order to evaluate
both design and attitude impacts concurrently, to test if there is an alignment between occupant
environmental attitudes, satisfaction and sustainable architectural design, and to study whether
environmental preservation attitude correlates with high QoLe in sustainable housing (Upadhya
13
et al. 2010). The underlying justification is that “sustainable development requires not only
technological sustainability, but also behavioral sustainability, mainly focusing on pro-
environmental attitudes and behavioral aspects” (Upadhyay et al. 2010, p.4).
O'Callaghan and Hyde (2011) applied the multiple regression to understand whether
sustainably designed homes truly achieve lower levels of impact on the environment and also to
what extent occupant attitudes play a role in any improvement. The independent variables
include sustainable design and environmental attitudes, except other demographic factors,
whereas the dependent variable is the utility usage. The interaction between sustainable design
and environmental attitudes are possible taking into account the potential rebound effects. That is
to reveal if those with high environmental attitudes and more sustainable homes produce lower
utility usage and if the opposite is true. Proposed measurement of independent variables includes
National Australian Built Environment Rating System for sustainable design; NEP scale or
Environmental attitudes inventory (EAI) scale for measuring environmental attitudes
(O'Callaghan and Hyde 2011).
Following their proposed framework, empirical data were collected from both a
sustainable and a conventional community in Queensland (O'Callaghan et al. 2012).
Environmental attitudes were measured by EAI (Milfont and Duckitt 2010). Hierarchical
multiple regression was used, whereas the next step independent variable (e.g., environmental
attitudes) were entered into the regression only after the previous step independent variable (e.g.,
sustainable design) had been statistically accounted for (O'Callaghan et al. 2012). The results
showed a significant difference in energy consumption between sustainably designed and
contemporary homes, and more positive attitudes to environmental conservation correlated with
lower energy use (O'Callaghan et al. 2012). Though environmental attitudes were not found to be
14
a statistically significant predictor of energy use when analyzed with other predictor variables,
suggesting that technological factors have a much higher weighting relative to occupants’
attitudinal factors in estimating the resource usage of housing (O'Callaghan et al. 2012). The
study used the attitudes towards the environment as an indicator of behavior, which I will show
in the next section that attitudes are most often treated as antecedent of behavior in many
environmental behavior studies.
Overall, at a whole building/community scale, studies about the potential effects of a
green building/community on the occupants’ attitudes and/or behaviors showed different
findings and could be grouped into: 1) more positive pro-environmental attitudes/behaviors in
green than in conventional built environment (Deuble and de Dear 2009 & 2012, O'Callaghan et
al. 2012); and 2) generally no difference regarding pro-environmental attitudes/behaviors
between green and conventional built environment, including Hostetler and Noiseux (2010),
McCunn and Gifford (2012), and Rashid et al. (2012) (Table 9 in Appendix B).
2.3 Relationships between Green Building Design and Sustainable Behaviors
A possible theoretical explanation for the relationships between green building designs and pro-
environmental behavior is the perceived behavioral control–one of the antecedents in predicting
behavioral intention and behaviors. Perceived behavioral control measures how the person
perceives the easiness of conducting a certain behavior. In the green building context, this
question applies to whether a particular green design can facilitate a corresponding behavior. The
relationships between typical green designs and their corresponding sustainable behaviors are
illustrated. To identify relevant studies, an eco-centric viewpoint is considered when referring to
sustainable behaviors, following several main focus of existing green building programs on
energy, water, transport, waste, indoor environmental quality issues. Specifically, sustainable
15
behaviors include for example: those aiming at contributing to a reduction in energy and water
consumption; reduction of automobile dependency; promotion of the 3R principle
(reduce/recycle/reuse) of waste treatment, except correctly categorize waste; and maintaining
their satisfaction of indoor environmental quality while not increasing energy cost indirectly.
Different names for physical environment were used in previous studies: contextual
factors (Wu et al. 2013), situation factor (Tang et al. 2011), microscopic factors (Lee et al. 2015).
For the review in this section, sustainable physical environment regarding structure and elements
that are part of a building and its surrounding site that are designed to work together with the
corresponding sustainable behavior are identified.
2.3.1 Energy and Water
O'Callaghan et al. (2012) showed that sustainable housing design was a significant indicator in
determining utility consumption in energy and water. The study used both the sustainable
housing design (technical side) and the occupants’ pro-environmental attitudes (non-technical
side) as independent variables to predict utility consumption. The housing design variables were
indicated by a dummy variable and were not further categorized into different aspects. The
interaction effects between the two independent variables might be more of interest to
investigate. A further correlation analysis carried out in the study showed that pro-environmental
attitudes of occupants were significantly correlated with the sustainable housing design
O'Callaghan et al. (2012). This multicollinearity issue was not further explored though, which
could be studied through the mediating effect of sustainable housing design on attitudes of
occupants. Other studies included the physical environment as control variables. For example,
the apartment type (studio, 1/2/3 bedrooms) was found to have predictive power for electricity
16
consumption (Hewitt et al. 2016). Andersen et al. (2009) found that the presence of a wood-
burning stove had a large impact on the control of the heating in Danish dwellings.
2.3.2 Indoor Environmental Quality
Earlier studies indicated that design features such as a spacious common room and access view
to the natural environment reduces occupants’ stress level and increases work productivity (Azizi
et al. 2015). Heerwagen and Diamond (1992) examined the three types of behavior adjustments
(personal, environmental, psychological) in green buildings. Advocates for personal adjustments
believe that it not only helps reduce energy consumptions in buildings, but also creates healthier
personal actions for the occupants since there is more muscle movement (Healey and Webster-
Mannison 2012). The findings showed that the green buildings encouraged more personal
adjustments than environmental adjustments, thus indirectly reducing the energy consumption
from the environmental adjustment. Azizi et al. (2015) found that within the same building, more
personal adjustments were made in spaces where occupants had limited access to the control
systems, such as in open plan space; whereas in private offices, the occupants made more
environmental adjustments than personal adjustments.
2.3.3 Transportation
A wide range of sustainable transportation technologies and alternative fuel options have been
proposed by previous studies (Paudel and Kreutzmann 2015). Lee et al. (2015) studied the
physical environment that could boost pedestrian volume for the development of sustainable
cities; it was found that the planning factors at a neighborhood scale, such as domain attributes
(diversity), the network attributes (global and local integration) and the accessibility (distance to
and number of public transportation) affected pedestrian volume. Building attributes such as the
17
form of the ground level and façade of the building also had a significant effect on pedestrian
volume (Lee et al. 2015).
2.3.4 Waste Treatment
Wu et al. (2013) reported that people chose the correct disposal bins more often in a sustainable
building than in a conventional building. However, the detailed green building design was not
measured and related to the disposal behavior. Instead, Wu et al. (2013) raised a hypothesis that
taking the availability of bins into account would result in a larger gap between proper disposal
rates between green building and the conventional building. The behavior observation implies
further design of waste bins could encourage the correct disposal of waste. An example is
provided by Greaves et al. (2013), where transparent bins are implemented in an office building
to make clearer and visual instructions on users’ waste categorization behaviors.
The available space to store recyclables in a household is found to be a significant
predictor for recycling participation both in western societies (do Valle et al. 2004) and in rural
Chinese villages (Tang et al. 2011). The physical proximity of containers (e.g., to provide
curbside collection for the household) is a determinant that justifies the recycling behavior
(Ludwig et al. 1998). On the contrary, Rhodes et al. (2014) found that proximity to the recycling
depot did not relate to behavior. Although they found that those who lived closer to the depot had
larger planning-behavior relations than those who lived further away.
These studies concerning relationships between green designs and sustainable behaviors
were grouped (Table 10, Appendix B). Combining these studies, a sample checklist for
facilitating sustainable behaviors through green designs are prepared (Table 11, Appendix B).
Only green designs with a corresponding behavior are identified. A wide range of passive
technologies defined during the design phase such as appropriate orientation, ventilation path,
18
and raised roof will not be included. More examples include such as installation of photovoltaics
(PV) panel, which is also not listed since the PV operation relies less on user’s behavioral inputs.
Another example is the installation of rainwater harvesting systems that might have a less
behavioral input while the successful implementation of low-flow showerheads and toilets
requires a corresponding behavioral response (e.g., whether people are taking longer showers or
flush toilet multiple times as counter-effecting). On the contrary, the presence of solar shading
could be a potential green design as building users directly control (behave on) the solar shading.
2.4 Sustainable Communication and Education of Green Building
While the relationships between green building/design and sustainable behavior are discussed in
Chapter 2.3 with support from empirical studies, at a deep philosophical level, Neisser discussed
the meanings of a certain environment and how they are experienced – “In the normal
environment most perceptible objects and events are meaningful. They afford various
possibilities for action, carry implications about what has happened or what will happen, belong
coherently to a larger context, and possess an identity that transcends their simple physical
properties. These meanings can be, and are perceived.” (Neisser1976, p.71).
Many scholars have argued that green buildings can and even should be used as
educational tools to increase environmental awareness (Cranz et al. 2014). Goodsel (2000)
repeated three levels of mnemonic meaning from the built environment and they will be detailed
in Chapter 5. Buildings are viewed as communicative and a visual persuasion by Ragsdale
(2011), whereas persuasion, refers to “messages that are designed to change attitudes, beliefs,
values and behavior” (Ragsdale 2011, p21). Ragsdale grounds his theory based on several
classical works to demonstrate that architecture influences the human mind, attitude, and
behavior (Ruskin 1989, Roth 1993). A framework was proposed to assess the likely effectiveness
19
of the visual persuasiveness of architecture, for a wide variety of architectures such as museums,
cathedrals, performing halls, government buildings, universities, but not green buildings in
particular (Ragsdale 2011).
The green building communities realize the importance of using the building as a
communication medium, though they are still striving to find the most appropriate expression of
a green building. Architects are also not united on the way to express the sustainability of a
building (Cranz et al. 2014). Ken Yeang, a green architect, specifically argued that a green
building should not “look like a modernist building; it should be something new” (Cranz et al.
2014, p.5).
There are different sensory cues that a user can feel and perceive the sustainability of a
green building even if he/she may not be formally educated and/or aware of the sustainable
design. One study investigated the relative impact of visual and auditory information on the
perception of running tap water, finding that auditory information can play a significant role in
the everyday experience of running tap water even though participants are normally unaware of
the effect of audition (Golan and Fenko 2013).
Among all the sensory cues that a building can be felt by its users and those passing by,
the focus of this work is to use building and building elements as visual objects to communicate
its meaning and educate people. A visual object is anything that has to do with vision, it is
communicative, symbolic, culturally representative, and deductive by the viewer (Barnes 2007).
It could be mediated visuals (e.g., graphic designs, paintings, photographs, and films) or
unmediated lived-in visuals: viewers stay within the visuals such as natural landscape and/or the
man-made built environment. Visual impacts mean the power of the visual object to move
feelings and produce behaviors (Barnes 2007). Idler (2014) stated that visual appeal can–more
20
than anything–attract attention. Selective attention enables us to gather relevant information and
guides our behavior (Carrasco 2011). Joffe (2008) highlighted the “vividness effect” – that visual
material appears to be especially memorable and the salience that this confers may make it
particularly forceful.
Case studies on how to make green design more visible include using signage and labels
to demonstrate green design in Riverview Elementary school Washington (Shiever and
Boettcher, 2011). The architects placed schematic drawings of the high insulation wall
construction, daylight design, green roof, and the geothermal heat exchange system (Cranz et al.
2014). Another green commercial building in California tried to make its green design visible,
with all its construction materials (e.g., from insulation to wood and finishes) selected for their
educational value and were left exposed where possible (Cranz et al. 2014).
This chapter provides key findings from empirical studies on relevant. It is found that the
pro-environmental behavior of the users due to exposure of green products/technologies and
initiatives are diverse and no single trend can be detected. While empirical studies on the
influence of green buildings/communities on people’s pro-environmental attitudes and behaviors
yielded different findings, the relationships between green building design and people’s pro-
environmental behavior were reviewed in more detail. It can be seen that different aspects of
sustainable behaviors are closely tied to their corresponding physical environment. Finally, the
communication and meaning of architecture have been reviewed and it is ascertained that the
influential design of a green building is a research topic worth to be discovered.
The next chapter discusses two challenges in studying influential green design, its
communication and influence on building users’ awareness, perception, knowledge, and
behaviors, from both theoretical and methodological stands.
21
3. RESEARCH CHALLENGES AND APPROACHES
The research questions illustrated in Chapter 1.2 can broadly fall into the study of architectural
determinism. It is a stream of environmental determinism, first raised and criticized by Broady in
his 1966 paper, entitled “Social Theory In Architectural Design” (Broady 1966). Broady
castigates architects and planners for being too idealist in believing that architecture has the
power to redeem men or transform society (Lee 1971). Formally stated, architectural
determinism, in Broady’s writing, holds that physical structures determine social behavior, and
that the relationship between these two factors is one-way, where the social behavior is the
dependent variable.
Lee (1971) opposed Broady’s criticism against architectural determinism and argued that
it is a valid formulation of the relationship between a human and its environment, and that social
planning determines the probability of a behavioral occurrence. The Psychology Dictionary
adopted a similar definition of architectural determinism. While promoting the concept of
architectural determinism, Lee (1971) stated two key points: (1) built environment influences
behavior but is not the only enforcing factor on behavior; and (2) human behavior not only
responds to, but also interacts with the environment. The focus of this work is to extract the
effect of buildings upon people’s mind, perception and behaviors. The other direction will not be
examined here.
I uphold Lee’s point of view that the architecture and the building design do not have the
power to determine the way people behave. However, they can encourage, facilitate, reinforce, or
impede certain types of behaviors, and they provide cues to remind people to behave in a certain
way. At the same time, it is admitted that architecture is not the only factor that determines actual
behaviors. To avoid the use of “determinism”, which implicates a strong and sometimes
22
confusing tone, I will use a new term—“influential (building) design”—meaning that building
elements and characteristics could have the potential to influence people’s perception and
behavior. Architecture as a whole is a cultural product of a society and potentially yielding
deeper influences across a broader geographical scale and wider temporal scale, which is not
studied here.
3.1 Theoretical Challenges
The studies reviewed in Chapter 2 showed that how buildings expresses meaning, distributes
messages, and influences human minds, attitudes, and behaviors. Nevertheless, few credible
mechanisms exist by which architecture can invade people’s minds and have strong and
systematic effects on their behaviors, individually or collectively (Hillier 2015). Such theoretical
difficulty can be generalized into philosophical debates, such as whether and how physical
objects could affect the mind (Hillier 2015). On the other hand, the extreme opposite of
architectural determinism can be formulated as following: it does not matter how a building is
designed, how the streets are laid out, and how people are placed within the space, and that the
physical environment is attitudinally and/or behaviorally neutral. Such a proposition, however, is
even less credible, based on the over four decades of research in environment-behavior. Previous
studies found that the physical setting offers a useful unit of analysis for understanding how
certain types of places elicit certain types of recurring (Barker 1976) and predictable (Thompson
2013) behaviors.
The influential design provides a third path out of the two extreme points of view. And
the TPB originated by Ajzen (2005) is proposed to provide explanations on the mechanism
regarding green building design and its influence on people’s pro-environmental behavior.
Another theory that has a potential to study influential design is Gibson’s affordance theory
23
(Gibson 1979), which has been further applied in product design. Koutamanis (2006) first
investigated the applicability of affordance theory to architecture and buildings, with the
distinction between the affordances of building’s elements and spaces.
The TPB is proposed as an explainable model regarding the effects of green building
design on peoples’ pro-environmental behaviors, consisting the first conceptual study (Chapter
4). The affordance theory is explored in Chapter 6 in the empirical study, in regards to the two
affordances a green building should bear: the provision of sustainable education to users and the
facilitation of its occupants’ sustainable behavior.
3.2 Methodological Challenges
The skepticism against architectural determinism is also grounded in a main methodological
issue: the causality and the variable problems. There is difficulty in determining the cause and
effect factors: if a study finds an association between a design and a social outcome, how can one
be sure that the former is determining, or even contributing, to the latter? As found by the
empirical study of Deuble and de Dear (2012), while more environmentally-concerned occupants
tolerate their buildings featuring green design, the causality remains moot.
There is a challenge in establishing the linkage between architecture and any social
outcome due to the variable definition and selection. Leaman and Bordass (1999) argued that
buildings are complex systems made up of physical and human elements with many associations,
interactions, interfaces, and feedbacks. It is often fruitless to try to separate different variables
and treat them as independent as many statistical methods require. What factors are responsible
for the increasing productivity in a new office building, is it the new furniture, the indoor plants,
or more natural light? Or simply because any type of change has been made (Leaman and
Bordass 1999). Most studies on a building’s effects have selected and defined architecture-
24
related factors as independent variables, though they are likely to operate as dependent variables
of the social process in which architecture is embedded. The variable problem, if unsolved, then
lead to the causality problem such as how to allocate the causes of a certain social outcome to
architectural variables.
Hillier (2015) argued that the solution to the variable and causality problems lies in a key
difficulty: controlling the architectural variables. Architectural variables include factors that are
related to the building design and operation. For example, design elements include overall and
detailed layout, landscaping, density, indoor daylight and views, and building façade; and
operational factors include thermal conditions, regular maintenance, and adjustability of personal
space. The difficulty in separating design elements applies particularly in a cross-sectional study,
that is, how to arrive with sufficient precision, at descriptions of the differences between two
different built environments. The failure to control the architectural variables with sufficient
precision was challenged in studies linking architecture and social outcomes (Hillier 2015).
These studies tend to treat physical environment at a gross level, e.g., a courtyard, a section of
walkway, and such gross level descriptions have failed to distinguish architectural effects from
other social process (Hillier 2015).
The solution then is to select a finer level of analysis, with physical and social data
collected at that level (Hillier 2015). The validity of the study could be reinforced through proper
study design and analysis. To differentiate and scale down the level of analysis, I propose to
separate green design into two categories to extract the possible effects on peoples’ sustainable
behaviors from these two different architectural variables. Namely, the visual green design and
the conceptual-only green design. A hierarchical linear regression (HLR) model was proposed to
25
address the effects of spatial layout on behavioral variables, consisting of the second conceptual
study (Chapter 5).
3.3 The Proposed Research Framework and Research Scope
Through insights gained from current research’s understanding and with the research needs
outlined in the sub-chapter 3.2, an overall research framework has been developed (Figure 1).
The framework begins from the center (the research topic) and formulates the two challenges
described in the previous section. The two conceptual studies that provide solutions to the
research challenges are depicted in the two dark gray blocks, connecting the central research
question. The empirical study (Chapter 6) serves as an extension of exploring the affordance
theory, with two affordances of green buildings identified: affording sustainable education and
the sustainable behavior (the light gray block).
The second study (Chapter 5) investigates one of the two communication channels
identified in the first study (Chapter 4) – the passive instruction from the building and the
building design. And the influences of green building designs are separated into two categories.
The third study (Chapter 6) connects with the two conceptual studies at two points. First, the
affordance of sustainable behaviors that a green building shall possess can be connected with one
antecedent in the TPB model—the perceived behavioral control—whether certain green design
facilitates any corresponding sustainable behavior. The affordance of sustainable behaviors is not
empirically tested in Chapter 6, though. Second, the third study asks the users about their
perceptions on different green design elements. While their perceptions are mostly intrigued by
the visual sensory cues, the study further scrutinizes the perception at different spatial scales.
26
Figure 1. The conceptual framework for the research, including three individual chapters, with Chapter 4 and Chapter 5 providing
possible solutions to the research challenges and Chapter 6 as an empirical extension.
27
Within the life cycle of a building, there are different stakeholders and feedback loops
involved (Figure 2). The scope covered in this study includes the user stage along the whole life
cycle of the building. The reasons to focus on users among all the stakeholders are due to the
research goal and questions asked. Though not studied here, the feedback loop includes: 1)
building users and the building itself (e.g., directly changing the interiors according to users’
needs); 2) building users express their needs to internal property management/maintenance
group/building managers; 3) building users and external third party auditors and/or researchers
on any topics regarding POE; and 4) the internal/external parties and the groups of decision
makers (designers and paying clients) who are responsible for new building design and/or
existing building renovation.
Figure 2. The feedback loops in studying the influential building designs and the stakeholders
covered in this research.
28
The questionnaire survey involved in this research was approved by the IRB office at
Michigan State University. The hard-copy of questionnaires will be stored in the dry-lab of the
Landscape Ecology & Ecosystem Science lab in the Geography building at Michigan State
University for three years and the electronic copy of the data entry will be stored on the hard
driver of the lab computer without any identification of participants’ ID during or after the
survey.
While this chapter presents the research needs and proposes the overall research
framework, the next three chapters present three studies regarding the framework and scope
outlined here.
The first study (Chapter 4) has future implications to solve the lack of theories regarding
influential design. Essentially, the debate on whether and how architecture might influence
people’s mind and behaviors can be answered by studying how the architecture communicates its
messages to the audiences. The TPB, as a classical behavioral model in communication science,
is the explicit theoretical basis for 1,264 studies listed in the Web of Science core collection from
1985 to April 2015. The proposed study demonstrates the potential of using TPB as an approach
to solving the theoretical challenges.
The second study (Chapter 5) has future implications to solve the methodological
challenges. Hierarchical Linear Regression helps to differentiate the effects of architectural
variables from other social-economic factors through a varying intercept model for different
buildings. It extracts the effectiveness of the buildings themselves by estimating the coefficients
for group-level predictors, i.e., building-level characteristics. The finer level of analysis is
realized in Hierarchical Linear Regression through the separation of green building designs into
either visual green design or conceptual-only green design. Furthermore, Hierarchical Linear
29
Regression is innovative in addressing the variation through spatial differentiations of occupants
from different buildings.
The third study (Chapter 6) extends the two conceptual studies in Chapter 5 and 6, and
explores the affordance theory empirically. Similar to the approach chosen toward solving the
methodological challenge, this study particularly separates different categories of green designs
at a finer level of analysis. It investigates how people perceive different design elements, and
whether and through which channel they become aware of a building’s green status and what are
their knowledge about green buildings, depending on their awareness.
30
4. GREEN BUILDINGS NEED GREEN OCCUPANTS: USING THE THEORY OF
PLANNED BEHAVIOR TO STUDY COMMUNICATION OF SUSTAINABILITY
FROM GREEN BUILDINGS
The following chapter contains material reproduced from an article published in the
Architectural Science Review with the citation:
[Wu, S.R., G. Martin, J. Chen, and S. Grady. 2016. Green buildings need green occupants: a
research framework through the lens of the Theory of Planned Behaviour. Architectural Science
Review DOI: 10.1080/00038628.2016.1197097]
31
4.1 Introduction
In this chapter, a green building is defined at a more general scope, as any new, existing, or
renovated building that is either certified, or plans to be certified, by an authorized green
building certification body; or, that is planned, designed, constructed, maintained and/or
renovated according to an established guideline, which shall address sustainability as defined in
the first chapter.
Studies on the performance of green buildings have been widely conducted through the
POE with a wide range of topics covered. Studies on the relationships between green buildings
and occupants’ behaviors have mostly focused on investigating the impacts of the occupants’
behaviors on building performance (Kashif et al. 2013, Lee and Malkawi 2014). However,
considering the potential of green design to educate building occupants about sustainability
through exposure and immersion in a green building (Lyman 2007), it is critical to understand
the influences of green buildings on the occupants’ behaviors. Such understanding will add a
new dimension to existing topics of the POE.
This new dimension also matches with the two themes that are increasingly popular in
sustainability science: effective communication and behavioral change (Kaluarachchi and Jones
2013). Behavior is the aggregated response of a person resulting as a consequence of complex
interactions between internal and external factors (Gill et al. 2010). In the context of green
buildings, Williams and Dair (2007) argued that technical sustainability alone, without
behavioral sustainability (i.e. the sustainable actions of those living, working, and/or staying in a
building), will not ensure the initially designed parameters (e.g., energy consumption reduction)
of green buildings (Browne and Frame 1999, Hoes et al. 2009, Masoso and Grobler 2010).
32
In communication science, Bamberg et al. (2003) stated that an introduction of new
information may change the cognitive foundation of intentions and behaviors. New information
is an external factor that interacts with internal (e.g., emotional, moral) factors to create a
consequent behavior, which, in the green building context, can be understood as green messages
communicated to the occupants. Green messages are defined here as the green design ideas
embedded within the building, with a potential to be communicated to and realized by the
building users. Previous studies have demonstrated that architecture influences human minds,
attitudes, and behaviors: “All architecture proposes an effect on the human mind” (Ruskin 1989);
“architecture constantly touches us, shapes our behavior, and conditions our psychological
mood” (Roth 1993, p.1).
In order to investigate the influences of green buildings on the occupants’ changing pro-
environmental behaviors, this chapter provides a framework to answer the following questions:
Do green buildings communicate green messages to their occupants? If they do, how so? Lastly,
how do they influence occupants’ pro-environmental behaviors?
4.2 Background Understanding from Communication Science
The theory of planned behavior (TPB) from communication science was used as the theoretical
foundation in this study. The TPB is a widely accepted behavioral model for explaining and
predicting behaviors through considering three core constructs: attitudes, subjective norms, and
perceived behavioral control. It is arguably the most widely researched behavioral model
(Armitage and Conner 2001) and is the theoretical basis for 1,311 studies from the Web of
Science core collection between 1985 to August 2015. The TBP has been extensively applied in
empirically based, environmental behavior studies (Chang et al. 2014, Greaves et al. 2013,
33
Kumar 2012). One study (Lee et al. 2013) in the field of architectural science explored the
behavioral intentions of interior designers when they chose sustainable materials.
It is essential to identify the communication channels of a building to answer the first two
research questions - whether and how green buildings communicate green messages to their
occupants. In the persuasive communication (i.e. influential communication that affects people’s
attitudes and behaviors), different medium factors are used to communicate the messages
including 1) mass media (print, digital, and visual); and 2) face-to-face interpersonal
transmission (Oskamp 1991, p.175-177). According to different communication medium
involved, it is assumed that green buildings communicate messages through two communication
channels: active instruction and passive instruction.
Active instruction is defined here as those deliberate interventions incorporating
communication medium of “face-to-face interpersonal transmission” (Oskamp 1991, p.175).
Examples include education programs, incentives, feedback interventions and engagement
events used to actively educate and influence building users. For example, the basic idea of
comparative feedback is to evoke a feeling of competition, social comparison or social pressure
which then leads to changed behavior to correspond more closely to the norm (Mulville et al.
2013). Comparative feedback interventions considering the consumption of an individual or a
group in relation to an average have been successful in reducing energy consumption in
households (Abrahamse et al. 2005). Except self vs. others comparison, self vs. self-comparison
is shown to be effective as well (Brandon and Lewis 1999). Active messages are conveyed
through verbal and/or non-verbal communication by human interactions, including stakeholders
involved during the occupancy stage (e.g., owners, building managers, occupants).
34
In contrast, passive instruction incorporates all other kinds of non-human communication
mediums. Examples include a mural advertising green building concepts, a digital dashboard
showing building energy consumption, posters suggesting sustainable practices, and waste
categorization bins facilitating recycling behaviors. Passive messages are conveyed from the
building itself (e.g., the overall design, site, structure, construction materials, decorations,
furniture, and vegetation), through green design implemented during the building planning,
construction, occupancy, and renovation. Any passive instruction can be reinforced to become an
active instruction in the presence of face-to-face interpersonal transmission, such as volunteers
distributing flyers and talking with occupants about tips to save energy. Importantly, the major
characteristics in distinguishing the passive instruction from active instruction are the absence of
deliberate interventions. Buildings that instruct passively are not intended to communicate a
message but often do so none-the-less (Mitchell 2006).
The passive instruction utilizes the building itself – a form of lived-in visual (Ragsdale
2011), as a communication medium when seeing at a whole building scale. Though, at a smaller
scale (i.e. building elements), the green design that manifests the green status of a building, can
be separated into the visually-evident green design and conceptual only green design. Conceptual
herein means that the design provides no visual evidence of its green features. Many of the
designs, such as those contributing to the building energy efficiency, have no visual attributes to
make them visually evident (Lyman 2007). The persuasive power of visual green design might
be an important area of research as previous studies have shown that the visualization of
sustainability is effective in sustainable education and communication (Ma 2008; Mann 2011).
35
4.3 Relevant Studies
This sub-chapter provides current understanding to answer the first and second research
questions and to identify the potential of visual persuasion of green buildings and designs. And
the focus is given to building occupants, among all building users, in other words, those full-time
building occupants. As the pro-environmental behaviors of full-time occupants (instead of short-
term users such as visitors) are more important in building performance. Reviews are grouped
into:
(1) Influences of green buildings on occupants’ pro-environmental attitudes and behaviors: to
understand the potential effectiveness of active and passive instructions, if any. These
studies were named as green building–green occupant studies. While the name implies a
multidirectional relationship, the focus of this study was to identify the influences of
green building on green occupants.
(2) The TPB and its explanatory potential on green building–green occupant studies: to
diagnose the mechanisms of behavioral changes, and to explain findings from previous
green building–green occupant studies through this behavioral model.
(3) Visual persuasion of green building design: to learn how previous studies have used
buildings, in particular, green building and green design, as a visual persuasion tool to
influence people.
4.3.1 Green Building-Green Occupant Studies
Detailed reviews of individual studies on green building–green occupant are provided in Chapter
2.2. This section provides further analysis, specifically according to the definitions on
active/passive instruction.
36
Most of the studies listed in Chapter 2.2 have incorporated passive instructions of green
buildings. They focused mostly on the general environmental attitudes of occupants, instead of
the attitude(s) toward a specific behavior and did not measure behavioral intentions and/or actual
behaviors. These studies concluded with different findings (Figure 3). Studies examining the
active instruction included Kaluarachchi and Jones (2013) who investigated the effectiveness of
several engagement events in a year-long initiative in the UK, aiming to promote low-carbon
home adaptations and stimulate behavioral changes among the elderly. Lynam (2007) aimed to
examine whether green academic buildings communicated a more pro-environmental message to
occupants in comparison to conventional academic buildings. An unexpected result of the study
was that the conventional building occupants held stronger pro-environmental attitudes than
those in the green building, apparently due to a more active involvement from the staff and their
interaction with students concerning the environment (Lynam 2007) – which is an active
instruction. This study indicated that there might be a stronger potential of persuasive power
through active instruction than merely passive instruction through green building alone.
All of the green building–green occupant studies differed in geographic location, the
scale of the study, data collection methods, analysis approach and statistic modeling. Most
studies were carried out in developed countries, without a single one in a country where green
buildings are rapidly developing such as Brazil, China, or the United Arab Emirates (USGBC
2015). Both non-residential and residential buildings/communities were studied. All residential
studies embraced a broader geographical scale (i.e. in terms of green communities, or all homes
within a city (Daniel et al. 2014)), than studies on the non-residential buildings (i.e. in terms of
individual buildings). All studies except Kaluarachchi and Jones (2013) collected cross-sectional
data instead of longitudinal data. These studies were either conducted on green building
37
occupants only or used a comparative approach (green vs. conventional). Most studies used
quantitative data analysis with statistical methods, falling into two approaches: 1) linear
regression analysis, and 2) two (or multi-group) mean scores comparison on environmental
attitudes of occupants from green vs. conventional buildings.
4.3.2 The TPB for Explaining Green Building–Green Occupant Studies
According to the TPB, intentions and behaviors are a function of three basic determinants: 1) the
personal factor – the individual attitude toward the behavior (Ab), i.e., the person’s positive or
negative evaluation of performing the particular behavior of interest; 2) the subjective norm (SN)
– reflecting social influence, i.e., the person’s perception of social pressure to perform or not
perform the behavior of interest; and 3) the perceived behavioral control (PBC) – dealing with
issues of control, i.e., the sense of self-efficacy or ability to perform the behavior of interest
(Ajzen 2005). Each of the three determinants, Ab, SN, and PBC, can be formulated according to
the beliefs people hold and an evaluation factor for each determinant (equations 1 - 3 in Table 1).
As a general rule, the more favorable the attitude and SN, and the greater the PBC, the stronger
the person’s intentions to perform the behavior of interest should be (Ajzen 2005).
In addition to the three determinants, the background variables might influence the
beliefs people hold, which can be divided into three categories: personal (e.g., values, emotions,
intelligence), social (e.g., age, gender, education) and informational (e.g., experience,
knowledge, media exposure). Unlike the three direct antecedents of behavioral intentions (i.e.
Ab, SN, and PBC), for background factors, Ajzen stated that “…there is no necessary connection
between background factors and beliefs. Whether a given belief is or is not affected by a
particular background factor is an empirical question” (Ajzen 2005, p.134).
38
The TPB model can be used to help explain the different findings from previous green
building–green occupant studies. Such as, why studies that focused on passive instruction
showed different results; and why, on the other hand, studies that focused on active instruction
showed positive findings in influencing occupants’ attitudes and behaviors.
The active and passive instructions are interventions at different positions along the
causal chain in the TPB model (Figure 3). The active instruction is designed to alter Ab, SN, and
PBC directly through deliberate intervention. Active instruction included: 1) intervene/strengthen
the normative beliefs (ni), where teachers in conventional buildings always ask students to
recycle class paper (Lynam 2007); 2) intervene evaluation (ei) and behavioral beliefs (bi) to
increase the positive attitude toward pro-environmental behaviors (Kaluarachchi and Jones
2013); and 3) intervene/increase control beliefs (ci) that lead to stronger PBC where occupants
think they are capable of performing sustainable practices (Kaluarachchi and Jones 2013). The
passive instruction through daily exposure to a green building can be considered as a background
factor under the informational category. Different empirical studies came to different conclusions
because background factors do not necessarily influence beliefs (Ajzen 2005).
While the TPB predicts intentions and behaviors from attitudes, numerous research
showed that people’s behavior also has a reciprocal effect on their attitudes (Oskamp 1991). This
adds another causal link in the TPB: behaviors at time 1 (t1) cause attitudes at t2, which is
different from the initial attitudes at t0 that are used to predict intentions (and behaviors) at t1.
Unfortunately, the causal links could not be empirically supported through the reviewed studies
without behavioral data at t1.
Besides the multidirectional relationship between attitudes and behaviors, the green
building–green occupant relationships are also multidirectional when introducing temporal
39
differentiation. This is conceptualized through adding a link from the constructs of behavior
and/or intention to the background factors (e.g., information category). The new link indicates
that the attitudes and behaviors at a certain time might influence the future green building
development and design. Furthermore, when considering a relatively short temporal scale, the
multidirectional relationships between green building and occupants are also manifested in the
fact that occupants’ pro-environmental attitudes and behaviors extensively influence the actual
building performance during the operation, especially in residential buildings where occupants
have more decision power. Some of the studies reviewed here (e.g., Azizi and Wilkinson 2015,
Daniel et al. 2014) have shown such multidimensional relationships.
4.3.3 Visual Persuasion of Green Building and Green Design
A visual object is anything that has to do with vision, it is communicative, symbolic, culturally
representative, and deductive by the viewer (Barnes 2007). It could be mediated visuals (e.g.,
graphic designs, paintings, photographs, films) or unmediated lived-in visuals, such as natural
landscape and/or man-made built environments. Joffe (2008) highlighted the ‘vividness effect’ –
where visual materials appear to be especially memorable and the salience that this confers may
make it particularly forceful. McKenzie-Mohr (2000) applied vivid communication in promoting
sustainable behaviors by using community-based social marketing.
It is argued that buildings are a form of lived-in visuals and communicate themselves
with a visual persuasion. Persuasion refers to ‘messages that are designed to change attitudes,
beliefs, values and behavior’ (Ragsdale 2011). A framework was proposed by Ragsdale (2011)
to assess the effectiveness of the visual persuasiveness of a wide variety of architecture, such as
museums, cathedrals, performing halls, government buildings, and universities, but not green
buildings.
40
Two kinds of green design were identified in section 4.2: the visually-evident green
design and the conceptual-only green design. Visual green design vividly speaks of a building’s
green status (e.g., on-site renewable energies, interior design elements, interpretive signage,
transparent waste bins, green-roofs/spaces, calm water features and vegetation (Joye 2007)). The
conceptual-only green design is more difficult to be recognized, does not have the vividness
effect, and might be weaker in the persuasive effect. The conceptual-only green design may be
implemented throughout any stages of a green building’s life cycle, such as implementing a
waste management plan, using low-emitting materials during construction, or controlling indoor
pollutants during operation (USGBC 2010). Lyman (2007) showed that the more visual elements
used, the more evident a green building would become. Both visually-evident and conceptual-
only green designs discussed here are passive instruction. On the other hand, with the wide
adoption of multi-media techniques, active instruction tends to combine visual aids frequently.
The persuasive power of a visual object was demonstrated in few studies, though not
combining green design with visual persuasion. O'Brien and Gunay (2014) identified the
visibility of energy use as an important factor that adjusted the occupants’ behavior in office.
Bartram et al. (2010) showed the potential of visualization real-time feedback of energy use in
influencing occupant conservative behavior. They piloted informative art into existing designs by
using ambient canvas to visualize energy use. These studies demonstrated the value and
necessity in further understanding visual persuasion in green building–green occupant
relationships.
The basic layout of the TPB is originated from Ajzen (2005). Following the definition of
active and passive instruction given in this study, dashed-lines indicate that the informational
background factor (i.e. passive instruction) studied here does not necessary influence beliefs.
41
Solid bold lines indicate an established causal relationship in the TPB. The active instruction (i.e.
deliberate intervention) is designed to alter the beliefs – the necessary antecedents of Ab, SN,
and PBC. bi: behavioral belief; ei: subjective evaluation; ni: normative belief; mi: the motivation
to comply; ci: control belief; pi: the power/importance. A detailed description of the three
equations is provided in Table 1.
Table 1. A detailed description of the three equations for measuring Ab, SN, and PBC in the
TPB.
Description
Equation 1
Attitude
∝ ∑ (bi ei)
For each behavior leading to outcome i, the behavioral belief (bi) (i.e. degree of
confidence about the evaluation) is multiplied by the subjective evaluation (ei) (i.e.
positively or negatively evaluation) and the resulting products are summed (Ajzen
2005).
Equation 2
SN
∝ ∑ (ni mi)
For each referent i (e.g., a person’s co-workers, close friend), the normative belief (ni)
(i.e. does the referent think I should perform the behavior) is multiplied by the
motivation to comply (mi) (i.e. to what extent I should comply with the referent) and the
resulting products are summed (Ajzen 2005).
Equation 3
PBC
∝ ∑ (ci pi)
For each behavior there are presence or absence of a given factor i (e.g., the availability
of recycling bins to perform recycling), the control belief (ci) (i.e. is the factor present or
not) is multiplied by the power (pi) (i.e. how important the presence of the factor is to
facilitate or inhibit performance of behavior) and the resulting products are summed
(Ajzen 2005).
42
Figure 3. Results of the literature reviews on green building–green occupant studies through the lens of the theory of planned
behavior.
43
4.4 A Framework Incorporating the TPB for Green Building–Green Occupant
Following concepts in communication science and through previous green building–green
occupant studies reviewed, the first and second research questions could be answered: green
buildings can communicate green messages to their occupants through two communication
channels – active and passive instructions. A specific framework is needed to address the third
research question. The green building–green occupant studies carried out within the study area of
architectural science provided insight for the research framework proposed in Figure 4, which
was designed to advance knowledge in green building–green occupant studies through
incorporating the TPB with following four perspectives.
Frist, the TPB model is integrated as a theoretical foundation, as it can help to 1) disclose
the behavioral change mechanisms – the effects, if any, of how a green building might
communicate messages and cause behavioral changes in occupants; and 2) reveal the
consistencies between the attitude and behavior – a subject of debate for decades (Oskamp 1991,
pp266). It is the behavior, not the attitude, which determines the technical performance of the
green building. Thus, it will be advantageous if one can measure both attitudes and behavioral
changes.
Second, it is necessary to collect longitudinal data to reflect the changing beliefs,
attitudes, and behaviors of occupants. This will detect the effectiveness of active instruction
while occupants are involved in an intervention, such as when they are personally asked to
follow recycling guidelines; and similarly, detect the effectiveness of passive instruction when
occupants are exposed to a changing physical environment.
Third, it is suggested to use actual behavioral measurement schemes in addition to self-
reported measurements on the behavior. Examples include behavioral observations, such as
44
counting the unnecessary lights/computers turned on. Physical measurements of changes in
resource consumption, waste generation, and recycling rates can also be used to validate the
quality of self-reported data and examine the effectiveness of active/passive instruction more
accurately.
Finally, the use of a building and its elements (e.g., green design) for visual persuasion as
a communication medium shall be studied to fill in the current research gap on the visual
persuasion of green building design.
4.4.1 The Framework
The above four perspectives were taken into consideration when developing a framework to
address the question – how do green buildings influence occupants’ pro-environmental
behaviors? The TPB model is used to examine changes in the pro-environmental behaviors of
occupants, with two different communication channels. Two illustrating questions (Q.A and
Q.B) are provided to demonstrate the framework. Q.A assesses the effectiveness of active
instruction and answers the question: Whether deliberately designed intervention methods to
encourage a targeted behavior can enhance the occupants’ positive attitude, SN, and PBC toward
the specific behavior? Q.A does not require the presence of green building design. Q.B, on the
other hand, assesses the effectiveness of passive instruction and answers the question: Does
exposing visual or conceptual-only green designs to occupants enhance their positive attitude,
SN, and PBC toward more pro-environmental behaviors in general; and do visual and
conceptual-only green design engender comparative differences in their persuasive power? Q.B
requires the presence of green building design.
This framework can be applied in an intervention study design with a longitudinal cohort
of building occupants in the real world. To assess Q.A, a cohort of building occupants can be
45
surveyed in the same building, before and after an active instruction implementation (pre- and
post-intervention survey), with the same set of questions (Figure 4a). To assess Q.B, a
prospective cohort of building occupants can be surveyed in a conventional building (pre-move
survey), and again after their move into a green building or after a green renovation in the same
building (post-move survey), with the same set of questions. The questions to measure the
constructs in the TPB can be self-reported, with the net change scores obtained as the differences
between pre- and post-move surveys (Figure 4b).
The frequency of distributing pre- and post-surveys, and the intended duration of the
intervention studies should be formulated according to individual study goals. For example, the
pre-move survey can be taken multiple times before the occupants move out; and the post-move
survey can be repeated at specified intervals (e.g., every 1, 3, 6 months) after moving into the
green building. The temporal differences from the initial moving-in period to a longer term
residence can be examined through measuring at different times along the cohort study.
Figure 4.a on the top of Figure 4 discloses the effectiveness of active instruction. If the
active instruction is effective, mean scores for constructs of the TPB model from post-
intervention survey (indicated by black bold subscript 2) should be higher than that from pre-
intervention survey (indicated by light grey subscript 1); The TPB model as a whole should be
able to explain more variance for model 2 (post-intervention) than for model 1 (pre-intervention).
The Figure 4.b on the bottom discloses the effectiveness of passive instruction, the effectiveness
should be differentiated for visual or conceptual-only green design (as indicated by v/c starting
from the background factor).
46
Figure 4. The modified theory of planned behavior framework to disclose effectiveness of active
instruction (Figure 4a) and passive instruction (Figure 4b). The subscript 1/2 represents the pre-
and post-intervention measurement for each construct. Δ indicates the net change after the
exposure to the green building, to capture the effects of passive instruction – the informational
background factor under the TPB model.
4.4.2 Sample Questionnaires
Based on Ajzen (n.d.), self-reported sample questionnaires for measuring all the constructs of the
TPB were developed for Q.A and Q.B (Table 2 and Table 3). For the final construct of the TPB,
the actual behavior can also be measured with in-situ observations and/or physical measurements
on building performance. The seven-point Likert scale is employed and questions are to be
answered before and after active instruction (i.e. deliberate intervention) to detect the
differences. The sample questionnaires need to be modified, validated, and pre-tested for future
studies.
To develop a full questionnaire, one can follow the recommendations of Francis et al.
(2004), who provided example questions and explicitly listed procedures in constructing the TPB
questionnaire (e.g., the identification of a reference group through elicitation study). In the
47
sample questionnaire in Table 2, co-workers were used as an example for the reference group
(i.e. those who are likely to apply social pressure toward others with respect to the studied
behavior). According to Francis et al. (2004), the psychological (internal) constructs of the TPB
model – the attitude, SN, PBC, and intention – can be measured directly by asking about the
overall attitude (Table 3); or measured indirectly by asking for behavioral beliefs and outcome
evaluations (Table 2), as indicated in equations 1 - 3 in Table 1 .
All measures in a questionnaire should refer to the same level of generality to meet the
principle of compatibility(Ajzen 2005). The sample questionnaires were developed at different
generalities for the two questions (Q.A & Q.B), targeting specific or general beliefs and
behaviors. Unlike passive instruction which does not intentionally communicate a message, the
active instruction works most efficiently when specific intervention method(s) are designed for a
targeted behavior (Ajzen 2005). The questions for assessing active instruction are developed at a
specific scope (Table 2). Waste categorization was used as a targeted behavior in the sample
questionnaire, assuming a corresponding intervention of educating people on correct waste
categorization. On the other hand, it is developed at a general scope for assessing passive
instruction (Table 3) by asking occupants questions within the building as well as on general
daily routine.
Other aspects that need to be considered include: the sampling method with randomized
selection in experimental study designs; the mode of the survey (e.g., mail, online, or face-to-
face); the disclosure of the survey objectives before- and/or post-survey; and the appropriate
design of the survey to avoid the Hawthorne effect (i.e. where occupants report what they think
the researcher want to hear).
48
Table 2. Sample questionnaire designed for measuring the effectiveness of active instruction,
using the example of waste categorization as a targeted behavior.
Construct Indirect measures Possible questions
Attitude Behavioral belief
(bi)
By doing waste categorization I can help to reduce environmental
impacts from this building.
Likely 7 : 6 : 5 : 4 : 3 : 2 : 1 unlikely
Outcome evaluation
(ei)
Reducing environmental impacts from this building is:
Good 7 : 6 : 5 : 4 : 3 : 2 : 1 bad
Subjective
norms 1
Injunctive normative
belief (ni)
My co-workers think that I should do waste categorization whenever
possible.
Agree 7 : 6 : 5 : 4 : 3 : 2 : 1 disagree
Motivation to
comply (mi)
When it comes to matters of waste categorization, I want to do what
my co-workers think I should do.
Agree 7 : 6 : 5 : 4 : 3 : 2 : 1 disagree
Descriptive
normative belief 3
Most of my co-workers do waste categorization in the building.
Agree 7 : 6 : 5 : 4 : 3 : 2 : 1 disagree
Identification with
the reference group
When it comes to matters of waste categorization, how much do you
want to be like your co-workers?
Very much 7 : 6 : 5 : 4 : 3 : 2 : 1 not at all
Perceived
behavioral
control 2
Control belief (ci) This building already provides me, or will very likely in the near
future (e.g., within the forthcoming month) provide me with the
necessary provisions (e.g., waste categorization bins) for me to do the
waste categorization.
Agree 7 : 6 : 5 : 4 : 3 : 2 : 1 disagree
Power of control
factor (pi)
Having the necessary provisions would enable me to do waste
categorization whenever possible.
Agree 7 : 6 : 5 : 4 : 3 : 2 : 1 disagree
Intention I intend to do waste categorization whenever possible in this building.
Agree 7 : 6 : 5 : 4 : 3 : 2 : 1 disagree
Behavior Currently, I am frequently engaging in waste categorization in this
building.
Agree 7 : 6 : 5 : 4 : 3 : 2 : 1 disagree
Note:
1. Suppose the reference group is coworkers in a green office building.
2. Suppose an example control factor for the waste categorization behavior is the provisions of waste
categorize bins.
3. The descriptive normative belief (what others do) are included other than injunctive normative belief
(what you are supposed to do).
49
Table 3. Sample questionnaire designed for measuring the effectiveness of passive instruction,
differentiating visual and conceptual-only green design.
Construct Direct measures Possible questions
Informational
background
factor -
Passive
instruction
Visually-
evident green
design
Do you feel the green features added to the building and surrounding site
are visually persuasive in representing the green icon of the building?
(Visual green features such as: on-site renewable energies (e.g., solar
panel), landscape artwork, outdoor views, indoor vegetation, green-
space/green-roof, and interior design elements promoting sustainability.)
Very persuasive 7 : 6 : 5 : 4 : 3 : 2 : 1 not persuasive at all
Conceptual-
only green
design 1
To what extent are you familiar with the green designs implemented
within the building?
Very familiar 7 : 6 : 5 : 4 : 3 : 2 : 1 not familiar at all
Attitude Within the
studied building
I think engaging in pro-environmental behavior 2 within the building I
reside in is;
Good 7 : 6 : 5 : 4 : 3 : 2 : 1 bad
General daily
behavior
I think engaging in pro-environmental behavior daily is:
Good 7 : 6 : 5 : 4 : 3 : 2 : 1 bad
Subjective
norms
Injunctive norm
– within the
studied building
Most people who are important to me in this building think that I should
engage in pro-environmental behaviors in this building.
Agree 7 : 6 : 5 : 4 : 3 : 2 : 1 disagree
Injunctive norm
– general
Most people who are important to me in my life think that I should
engage in pro-environmental behaviors.
Agree 7 : 6 : 5 : 4 : 3 : 2 : 1 disagree
Descriptive
norm – within
the studied
building
Most people who are important to me in this building engage in pro-
environmental behaviors in this building.
Agree 7 : 6 : 5 : 4 : 3 : 2 : 1 disagree
Descriptive
norm – general
Most people who are important to me in my life engage in pro-
environmental behaviors.
Agree 7 : 6 : 5 : 4 : 3 : 2 : 1 disagree
Perceived
behavioral
control
Within the
studied building
I can easily have access to necessary equipment, provisions, and
resources (e.g., easy access to recycling facilities, experts to ask) in order
to behave pro-environmentally in this building.
Agree 7 : 6 : 5 : 4 : 3 : 2 : 1 disagree
I am fully capable of engaging in pro-environmental behaviors in this
building if I want.
Agree 7 : 6 : 5 : 4 : 3 : 2 : 1 disagree
It is up to me whether I engage in pro-environmental behaviors in this
building.
Agree 7 : 6 : 5 : 4 : 3 : 2 : 1 disagree
I am in full control over whether I engage in pro-environmental
behaviors in this building.
Agree 7 : 6 : 5 : 4 : 3 : 2 : 1 disagree
Intention Within the
studied building
I intend to engage in pro-environmental behaviors within the building.
Likely 7 : 6 : 5 : 4 : 3 : 2 : 1 unlikely
General daily
behavior
I intend to engage in daily pro-environmental behaviors.
Likely 7 : 6 : 5 : 4 : 3 : 2 : 1 unlikely
Behavior Within the
studied building
Currently, the frequency of me engaging in pro-environmental behaviors
in the building that I am residing is:
Frequently 7 : 6 : 5 : 4 : 3 : 2 : 1 un-frequently
General daily
behavior
Currently, the frequency of me engaging in daily pro-environmental
behaviors is:
Frequently 7 : 6 : 5 : 4 : 3 : 2 : 1 un-frequently
50
Table 3 (cont’d) Note:
1. A more complex and categorized version to measure ‘conceptual-only green design’ is presented in
Table 4. Similarly, visual green elements can be extended to more complex questions.
2. Whenever ‘pro-environmental behavior’ is used in the question, it does not mean any
specific/targeting behavior.
In the building context, using an office building for example, pro-environmental behaviors can
include: 1) regarding resource conservation: turning off computers and lights when they are not in
use; not wasting water and reporting a leaking; printing as less as possible and printing on both sides
whenever applicable; 2) regarding waste & recycling: reusing office supplies whenever possible (e.g.,
refilling pens); involving in recycling programs; categorizing waste whenever possible.
For the general daily behavior, pro-environmental behaviors could include: 1) regarding resource
conservation: waiting a full load before doing laundry; taking a short shower to conserve water;
switching the light off when not in use; 2) regarding waste & recycling: bringing empty bottles to
recycle; collecting and recycling used paper; not putting dead batteries in the garbage; refusing
paper/plastic bag whenever possible; 3) mobility & transportation: trying not to drive my car if public
transportation, walking, and bicycling is efficient
Table 4. Alternative questions to be asked according to the LEED scheme for a more complex
and categorized version to measure conceptual-only green design.
Indicators Example questions, according to LEED (USGBC 2014)
Conceptual-only
green design
(example
questions on
water efficiency
(WE), energy
saving (ES),
materials and
resources (MR)
and indoor
environmental
quality (IEQ))
PIC_WE-Q1: Are you aware the building minimizes or eliminates the use of potable
water for landscape irrigation?
PIC_WE-Q2: Are you aware the building use innovative wastewater technologies
PIC_ES-Q1: Are you aware the building has increasing levels of energy performance
PIC_ES-Q2: Are you aware the building’s relevant systems (e.g., HVAC) do not
contain HCFCs or halons to reduce ozone depletion?
PIC_MR-Q1: Are you aware the building use salvaged, refurbished or reused materials,
products, and furnishings?
PIC_MR-Q2: Are you aware the building materials have recycled content?
PIC_IEQ-Q1: Are you aware the building installed a permanent carbon dioxide (CO2)
monitoring system?
PIC_IEQ-Q2: Are you aware the building uses low-emitting materials?
PIC_IEQ-Q3: Are you aware the building introduces daylight and views into the
regularly occupied areas of the building.
4.5 Discussion
It is clear that green buildings can communicate green messages to their occupants through two
plausible communication channels: active and passive instructions. Through the lens of the TPB,
active and passive instructions are found to differ in the persuasive power since they are
interventions located at different positions along the causal chain in the TPB model. Active
instruction shows a stronger persuasive power since it is designed to directly alter the Ab, SN,
and PBC – the three antecedents of the behavior in the TPB.
51
To advance green building–green occupant studies, a framework was proposed with two
illustrating questions through incorporating the TPB. This framework separately investigates the
effectiveness of active and passive instructions on changing beliefs and behaviors. The
combination of the two instructions in a building (i.e. interaction effects) was not considered in
the proposed framework. Possible results include green building–green occupant links or green
building–gray occupant links (Table 5). The proposed framework and associated sample
questionnaires can be incorporated into existing POE methods. The identification of changing
behaviors inspired by the active/passive instruction is essential, as behaviors toward sustainable
living are critical to achieving the success of a green building (Zuo and Zhao 2014). It reinforces
the importance of human dimension in the built environment, especially with consideration of
the dynamic interaction between human and architecture (Cole et al. 2010).
Table 5. Possible results of studying the effects of active or passive instruction, or an
interaction between active and passive instruction.
Possible
results
Passive instruction only Active instruction only Passive × Active
(interaction)
Green
building -
green
occupant
Green design alone may boost the
environmental awareness and
attitude of people and lead to pro-
environmental behaviors.
If designed correctly, the
active instruction should be
effective, as being said “If
you give me any normal
human being and a couple
of weeks… I can change his
behavior from what it is
now to whatever you want
it to be, if it’s physically
possible” (Oskamp 1991,
p.207).
It is very likely that the
combination of green
physical space and the
intervention will lead to
synergistic effects since
the technical
sustainability provide
necessary opportunity to
adopt ‘behavioral
sustainability’.
Green
building -
gray
occupant
Green design alone cannot
promote the ‘behavioral
sustainability’ of occupants, and
future design and management of
green buildings may need to
incorporate other factors (e.g.,
from active instruction) to ensure
the behavioral sustainability.
The active instruction is not
effective, maybe due to the
fact that the technical side
of the green building does
not match with the local
customs, culture?
Something wrong with
the design of the
intervention, or people do
not appreciate the
technical sustainability
part of the building.
Note:
These possible insights are not confirmed by empirical studies. The connection of conventional building-green occupant was left out as the aim of the study is to find
out possible influence from the green building on occupants’ changing pro-environmental behaviors.
52
A longitudinal approach was suggested for the framework to capture the changing
behaviors resulting from the active/passive instruction. Multidirectional green building–green
occupant relationships discussed in this chapter might also be studied with the longitudinal
approach. A proper study design is important to isolate the effects of buildings in passive
instruction, which could be isolated from other background factors by controlling for personal
and social-demographic factors whenever possible. One could control the intra-study differences
by collecting data from the same cohort to a certain extent. Though any other changes occurring,
especially those building-related along the time, will potentially introduce bias and affect the
overall results. This can be controlled by introducing other mediating variables, for example,
satisfaction with the building.
The framework was designed with reference to the findings of studies which
demonstrated a positive correlation between attitudes toward the environment and the actual
environmental behaviors and/or behavioral intentions (Abdul-Muhmin 2007; Kaiser et al. 1999;
Polonsky et al. 2012; Tan 2011). Contrarily, a criticism raised by other studies is that concerns
for the environment do not always translate into pro-environmental behaviors (Steg and Vlek
2009; Stern 2000). Empirically, low correlations between attitude and actual behavior were
found (Hines et al. 1987; Mainieri et al. 1997; Valkila and Saari 2013). These findings open up
questions for future work include the following perspectives to be considered.
First, knowledge about green building: previous studies showed the positive relationships
between environmental knowledge and attitudes (Molla et al. 2014, Polonsky et al. 2012) or
behavior (Edgerton 2009). Future research can include this as a background factor in the TPB
model under the informational category, similar to the passive instruction.
53
Second, satisfaction with the building: Rashid et al. (2012) found that the occupants’
satisfaction with the workspace-related features affected their environmental awareness. It may
be reasonable to assume that the satisfaction toward the green building alters the occupants’
positive/negative evaluation of the building, which mediates the influences from the building.
Third, the scale and background: previous studies on the behavioral changes were
conducted at a broad scale (e.g., the whole residential communities) or fine scale (e.g., the
individual building). The proposed framework targeted at building-scale and did not examine
how people could be affected by the surrounding sustainable physical environment at different
scales. Furthermore, the influences of green buildings may differ significantly based on local
culture and social norms. The contextual adjustment at different scale may affect both the
development of green buildings and the behavioral changes.
Fourth, types of building: the proposed framework and the questionnaires did not target a
particular type of building, but can be used in both commercial and non-commercial structures.
Andersson et al. (2005) pointed out that people behave differently in their home and the
workplace. In reality, occupants can be differentiated as either passive green building occupants
(e.g., who happen to work or live in a green building) versus active green building occupants
(e.g., green home-owners who decide to install the PV, the thermal mavericks who conserve
more energy due to their lower expectations on thermal comfort (Daniel et al. 2014)).
Finally, the intensity of the active and passive instructions: while some plausible routes of
the two instruction of a building were identified, the intensity of instruction was not investigated.
For example, green certified buildings have different certification levels (e.g., silver, gold, or
platinum under the LEED system). Whether different levels of exposure to green design may
54
result in different levels of changes in the occupants’ pro-environmental behavior is an important
area of future research.
4.6 Chapter Conclusions
Ideas from communication science were synthesized in seeking answers to the questions: Do
green buildings communicate green messages to their occupants? If they do, how so? Lastly,
how do they influence occupants’ pro-environmental behaviors? It was evident that green
buildings can communicate green messages to their occupants through two plausible
communication channels – active instruction and passive instruction. By the definition of
active/passive instruction given in this study, most previous green building–green occupant
studies focused on studying the effects of passive instruction when looking at how green
buildings might influence occupants. Possible explanations for the different findings from
previous studies were provided through the lens of the TPB model. The active/passive
instructions posit differently along the causal chain in the TPB model. As a potential persuasive
medium, the visual persuasion of green buildings has not been studied. A research framework
was proposed, along with sample questionnaires for two illustrating questions to investigate the
last research question. The adoption of the framework to add a new dimension to existing POE
methods holds great potential and is a research priority in the future.
55
5. THE INFLUENCE OF GREEN BUILDING DESIGN – SEPARATING TO
CONCEPTUAL VS. VISUAL ELEMENTS
The following chapter contains material reproduced from an article presented at the 49th
International Conference of the Architectural Science Association 2015 and published in the
conference proceedings, with the citation:
[Wu, S.R., M. Green, J. Chen, A. Yang, and Y. Tang. 2015. Green building design and visual
persuasion on occupants’ pro-environmental behaviors. In proceedings of the 49th International
conference of the Architectural Science Association, pp. 133-142, December 2-4, 2015,
Melbourne.]
56
5.1 Introduction
Buildings visually represent themselves, demonstrating a distinctive feature as a communicating
medium. Previous studies have already shown that the visualization of sustainability is effective
in sustainable education and communication. Using residential buildings in Hong Kong as study
sites, Ma (2008) demonstrated the importance of transmitting sustainability through visual means
and revealing interrelationships among the persuasive power of design and the experience of
people. Mann (2011) suggested communicating sustainability by visualizing sustainability
through visual aids. To utilize this distinctive feature, the visual persuasion of a green building is
worthy of study.
The aim of this chapter is to identify the potential influence of green building design on
changing occupants’ pro-environmental behavior, especially, at two finer level of analysis – the
conceptual only and visually available green design. A preliminary survey of people who work
in the Melbourne Council House 2 (CH2) is presented, identifying the potential of green design’s
visual persuasion in influencing people’s pro-environmental behaviors. Supported by findings
from the preliminary survey, a hypothetical dataset is simulated, using a hierarchical regression
model with Bayesian inference, to demonstrate a potential solution to the methodological
challenges raised in Chapter 2.
5.2 Visual Persuasion of Architectural Elements
Idler (2014) stated that “visual appeal can – more than anything – attract attention.” Selective
attention enables us to gather relevant information and guides our behavior (Carrasco 2011). Joffe
(2008) highlighted the emotional power of visual forms and the “vividness effect” – where the
visual material appears to be especially memorable, making it particularly forceful. While
57
numerous literature studied such visual impacts of mediated visuals, fewer studied the unmediated
lived-in visuals.
Ragsdale (2011) pointed out that the elements of architecture influence our attitudes and
behavior, and answered the question on why are some buildings more persuasive than others and
how do architecture convey meaning, which, in turn, results in social influence. In a green
building context, one can ask whether and how the meaning conveyed by green design is
persuasive and whether the occupants adopt pro-environmental behaviors as a result.
According to Rapoport (1990) and Goodsel (2000), there are three levels of mnemonic
meaning from the built environment: low, middle, and high/cosmological level. The low level
communicates basic everyday ideas. The middle level indicates a more subtle meaning
embedded in the environment including such as power, status, and identity. The high level
cosmologically evokes an emotional response to ideas of culture. Examples of the three level
meanings include doors of the building indicating where to enter; exterior architectural
sculptures depicting mythological figures and interior paintings portraying heroes and legends;
and capitols’ domes whose rising rounded point repeats an accenting expression of sacred
importance (Goodsel 2000). Hershberger (1974) identified two categories of meaning that can be
derived from architectural structures – representational and responsive (Figure 5). Assuming that
the concept of sustainability is a deliberately embedded meaning in the green building design,
could it communicate such a middle-level meaning to its occupants and trigger consequent
behavioral responses? The possibility of green designs conveying high-level meaning (e.g., Gaia)
is not illustrated in the Figure.
The distinctive power of buildings as visual objects and use for visual persuasion have
been discussed in some general architectural studies. However, to date, no single specific study
58
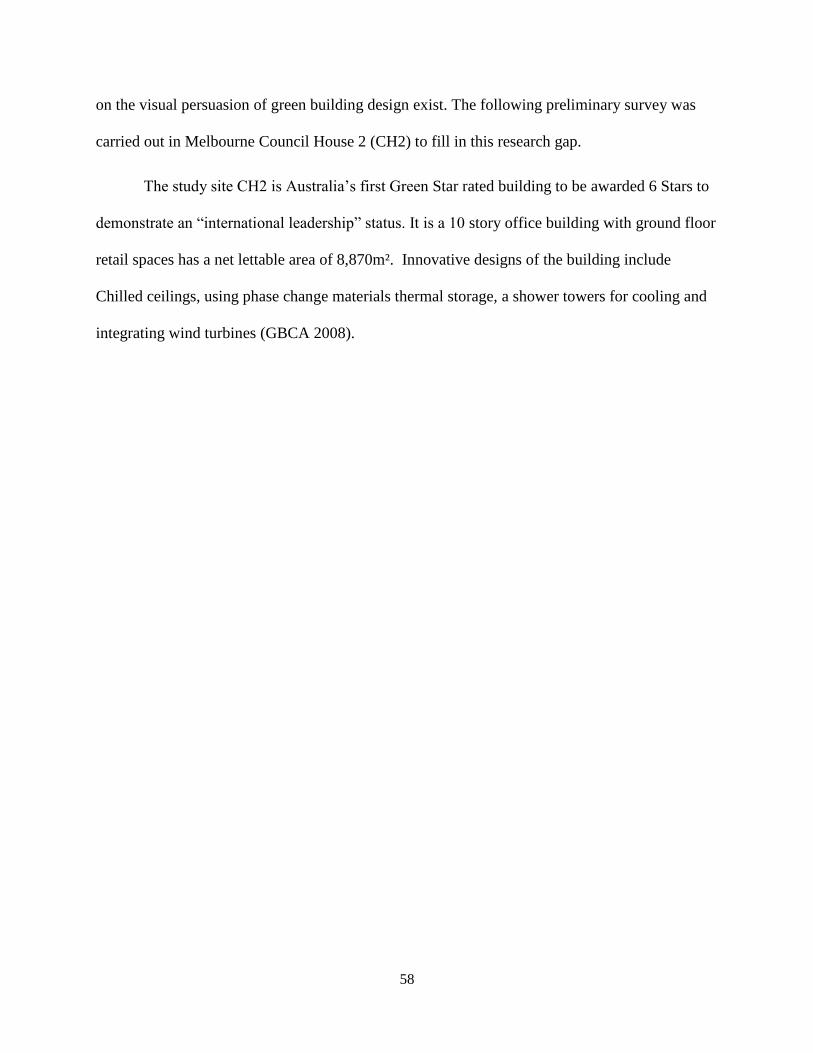
on the visual persuasion of green building design exist. The following preliminary survey was
carried out in Melbourne Council House 2 (CH2) to fill in this research gap.
The study site CH2 is Australia’s first Green Star rated building to be awarded 6 Stars to
demonstrate an “international leadership” status. It is a 10 story office building with ground floor
retail spaces has a net lettable area of 8,870m². Innovative designs of the building include
Chilled ceilings, using phase change materials thermal storage, a shower towers for cooling and
integrating wind turbines (GBCA 2008).
59
Figure 5. The three levels of meaning conveyed from the building elements, and two types of elements under the green building
context – the visually available and conceptual only green design. An example of low-level meaning (adapted from Hershberger
(1974)) and an example of middle-level meaning using a green design example.
60
5.3 A Preliminary Survey
To uncover the visual persuasion of buildings, it is necessary to separate the green design
elements into (Figure 5). the visual green design element; and 2) the conceptual-only green
design elements Visual green design such as on-site renewable energies, interior design
elements like wall paintings, interpretive signage, green-roofs/spaces, calm water features, and
vegetation (Joye 2007) all vividly speak of a building’s green status. On the other hand,
conceptual-only green design such as low VOC materials applied, and energy efficient
appliances installed do not have the vividness effect. The occupants’ awareness on conceptual-
only green design might be weaker compared to those eye-catching visual elements. It is
reasonable to assume that visual green design is equal to a layer of conceptual green design plus
a layer of vividness effect.
A simple two questions survey was distributed randomly to people who work in the CH2
during a weekday in April 2015. A total of 11 people answered the questionnaire. The first
question asked was, “Do you feel that you are becoming more pro-environmental since you
moved to this green building (pro-environmental behaviors such as minimize water/energy use
when possible, recycle and categorize waste, use public transportation instead of car)?” Four
answers can be chosen, namely “no changes”, “slight”, ”moderately”, and ”strongly more pro-
environmental”. If the answer was other than “no changes”, then the second question being asked
was, “Do you think the exposure to different types of green design (visual vs. conceptual)
resulted in your different level of pro-environmental behavior (visual exposure such as the
building has solar panel, and other exterior/interior visual features (e.g., the wood shading in the
west façade in CH2), conceptual exposure such as that you know the building uses recycled
water, but they do not express themselves visually and vividly)?”. Four answers can be chosen,
61
namely “no differences”, “conceptual exposure is slightly more persuasive”, “visual exposure is
slightly more persuasive”, and “visual exposure is certainly more persuasive”.
Out of the 11 people, three answered “no changes” on the first question, thus, the second
question was not applicable to them. Six answered “moderately more pro-environmental” (Table
6). This showed that majority of the occupants might be positively influenced by the CH2 and
behave more like a green occupant, to some extent. Among the eight people who were becoming
more pro-environmental since moving into the CH2, four answered that visual green design is
slightly more persuasive than conceptual green design in influencing their pro-environmental
behaviors, two answered visual green design is certainly more persuasive. The overall trend
matches with the hypothesis that visual persuasion is a more powerful tool in influencing
occupants’ pro-environmental behavior (Table 6).
Table 6. The result of the preliminary survey from Melbourne Council House 2. The contingent
2 by 2 table shows the answers on the first and second question.
2nd question: Persuasive power of visual vs. conceptual green design on changing pro-environmental behaviors
No differences
Conceptual
exposure is
slightly more persuasive
Visual
exposure is
slightly more persuasive
Visual
exposure is
certainly more persuasive
Sum
1st q
ues
tion:
Pro
-
envir
onm
enta
l beh
avio
rs
since
moved
into
the
CH
2
No changes 3 0 0 0 3
Slightly more
pro-environ.
0 1 0 0 1
Moderately
more pro-
environ.
0 1 4 1 6
Strongly more
pro-environ.
0 0 0 1 1
Sum 3 2 4 2 11
62
5.4 Hypothetical Data Simulation
Though with a small sample from only one green building, the above preliminary results ensured
the necessity of separating the green designs to conceptual vs. visual elements. A hypothetical
example and simulated data were used to demonstrate one possible analysis approach to answer:
While controlling for personal background factors, what is the effects of: 1) the presentation of
objective building characteristics (i.e. visual and conceptual green design); and 2) the subjective
viewpoints of individual occupant (i.e. awareness and perception of visual and conceptual green
design) in influencing the occupants’ pro-environmental behaviors.
Ideally, longitudinal data should be collected from the same cohort of building occupants
before and after moving into the green building. In real cases, cross-sectional data are more
feasible, thus, an analysis method for a comparative study of different buildings was proposed in
the following.
Leaman and Bordass (1999) argued that buildings are complex systems made up of
physical and human elements and their many associations, interactions, interfaces, and feedbacks
and it is often fruitless to try and separate out different variables and treat them as `independent’
as many statistical methods require. Nevertheless, statistical analysis is a powerful tool in
answering a wide range of research questions. In previous studies reviewed in Chapter 2.2, some
of them used two (or a multi-) group comparison on environmental attitudes scores (Daniel et al.
2014, Deuble and de Dear 2009, Hostetler and Noiseux 2010). Others used classic regression
analysis (Deuble and de Dear 2012, O'Callaghan et al. 2012, Rashid et al. 2012). The
hypothetical data simulation with the hierarchical regression model is demonstrated in this
chapter, as a possible solution to the methodological challenges.
63
One of the most distinctive feature of a hierarchical regression is that when the study
sample are collected from different clusters/levels (e.g., buildings in this example), it is a method
for compromising between: 1) excluding a categorical predictor (e.g., building index) from a
model (complete pooling); or 2) estimating separate models within each level of the categorical
predictor (no pooling, e.g., a separate regression for each building) (Gelman and Hill 2006). In
the data simulation, a varying intercept hierarchical model was used to extract following effects.
First, to extract the effectiveness of the buildings themselves by estimating the coefficients for
the group-level predictors, i.e., the building-level characteristics (i.e. whether or not the building
has the visual/conceptual green design or both). From the statistical perspective, group-level
predictors play a special role in hierarchical modeling by reducing the unexplained group-level
variation and thus reducing the group-level standard deviation (Gelman and Hill 2006). Second,
to extract the effects due to the awareness and different perception that individual occupant holds
within the same building, while controlling for personal factors. These two individual predictors
were selected due to the fact that, while occupants are exposed to the same green design in a
building, their awareness of the green design and perception of the green design are different,
which may result in their different responses to behavioral changes.
Specific questionnaires (e.g., on how to measure the pro-environmental behaviors) were
not provided. For the simulation, it is assumed the scores on independent variables are either 1)
binary (for objective building characteristics, and occupants’ awareness on green design), or 2)
seven points Likert scale (occupant’s subjective perception, e.g., from not persuasive at all to
very persuasive) assuming a normal distribution. One personal background factor was assumed
for demonstration purposes, i.e., the educational level. Fifteen buildings with different
characteristics were simulated, some with visually green design only, some with conceptual
64
green design only, and others with both features (Figure 6). Different sample sizes were
simulated for each building, ranging from 6 to 29, with a total of 273 samples.
Hierarchical regression is, in essence, a Bayesian inference (in comparison to frequentist
inference), the parameters estimation is non-point estimation by Markov Chain Monte Carlo
(MCMC) simulation. Following steps were carried out for the simulation: 1) set-up fake dataset;
2) specify “true” parameters; 3) specify the hierarchical model in Winbugs and call from R using
R2winbugs package (Gelman et al., 2015). Two hierarchical model were simulated, the first
model without including the group/building-level indicators (Figure 7) and second model
including group indicators. The model setup and the simulation results for the second model are
provided in Appendix C.
65
Figure 6. The hierarchical regression model simulating the individuals clustering in 15 buildings with different characteristics – a
building either having conceptual-only green design or visually available green designs.
66
Figure 7. The simulation results with likelihood, prior, and posterior shown for the hierarchical regression model – a screenshot
showing results for the estimated parameter of the model without group-level indicators.
67
5.5 Discussion
To identify how a green building may encourage occupants’ pro-environmental behaviors,
previous relevant studies were reviewed, all which came to different results and conclusions.
Studies on visual persuasion and communication roles of buildings were also reviewed, as a
potential powerful persuasive medium, the visual persuasion of green buildings has not yet been
studied.
A simple preliminary survey was carried out in the CH2 to find out the possible influence
from the green design on influencing occupants’ pro-environmental behavior, and in particular,
the effectiveness of the visual green design. The results showed it is likely that occupants could
be influenced by the green design and behave accordingly, and the visual green design might
have a higher persuasion power than conceptual-only green design. The preliminary survey with
a small sample size restricted us in using a statistical analysis to come up with more scientific
rigorous conclusions. Besides, the small sample size could not serve the representativeness of a
larger population; the single study site also limited us from generalizing the findings to other
locations.
Bear in mind that with the limitations of the preliminary survey, its results nevertheless
ensured a future full study is necessary to detail the research questions in more depth. Unlike the
analysis method applied to previous studies, the use of hierarchical regression model is proposed
to match the sampling procedure that occupants are clustered within each building. A fake data
simulation with varying intercept model including objective building characteristics as group-
level predictors and subjective viewpoint of occupants as individual-level predictors were
demonstrated. The fake data simulation certainly does not hold any empirical values, and the
validity of any study design and analysis could only be achieved through a real study in the
68
future. The hypothetical example shown, however, is innovative in that it addressed the variation
through spatial differentiations of occupants from different buildings.
There are several important factors that can be scrutinized by future studies. First is the
level (intensity) of the green design exposed to the occupants. For example, green certified
buildings have different certification levels. This can be solved by using a scale (e.g., 0 to 5) to
represent the intensity instead of using binary variables to represent the existence of
visual/conceptual green design, as did in the fake data simulation. Second is occupants’
satisfaction with the physical and non-physical environment. Rashid et al. (2012) found that the
occupants’ satisfaction with the workspace related features affects their environmental
awareness. Leaman and Bordass (1999) found that some employers in a building always kept the
light on just to annoy the manager. Third, only the potential of visual green design is explored,
other sensorial cues (e.g., auditory information provided, feeling of different material texture,
e.g., brick vs. steel) are not explored here and shall be part of future studies. This study looks at
the effect of the green building itself (i.e. the physical environment), instead of looking into the
administrative and behavioral environment within the building, such as influence from the social
norms. Future studies can incorporate different perspectives to find out the potential
effectiveness of different means (physical vs. administrative and behavioral) of green built
environment on influencing occupants’ behaviors.
5.6 Chapter Conclusions
It is of interest to know whether and how green building design can communicate green
messages to the occupants and lead to their pro-environmental behaviors. The distinctive power
of building elements as visual objects and their use for visual persuasion have not been studied in
the context of green buildings. A preliminary survey was carried out in Melbourne CH2 and the
69
results showed the potential of using green building design as a persuasion tool to influence the
occupants’ behaviors. This finding ensured the necessity of a future full-study to extract: 1) the
effectiveness of the (visual) green building design on persuading occupants to behave more pro-
environmentally at the building-level; and 2) the effects due to the occupants’ awareness and
perception of the green design at the individual-level.
70
6. HOW GREEN BUILDINGS AFFORD COMMUNICATION OF GREEN DESIGN TO
THE USERS? A SURVEY STUDY ON A LEED CERTIFIED BUILDING
6.1 Introductions
Throughout this study, green buildings refer more specifically to those certified under the
Leadership in Energy and Environmental Design (LEED) system by the US Green Building
Council (USGBC). The real benefits of green buildings have been studied extensively, mostly
using Post-occupancy Evaluation, covering a wide range of topics (Lee and Kim 2008, Hostetler
and Noiseux 2010, Deuble and de Dear 2012, Altomonte and Schiavon 2013, Kaluarachchi and
Jones 2013). Most of these studies can be asked in a similar way as to “whether the green
building can afford x”, where “x” can be anything from a better indoor environment, improved
satisfaction of the building users, to the provision of sustainable education for users.
I suggest that the affordance theory, originated by Gibson (1979), has great potential in
guiding the development, design, and evaluation of green buildings. Gibsonian natural
environment’s affordance was enriched through integrating affordance concepts for man-made
objects in the product design field (Norman 1988, Tweed 2001, Galvao and Sato 2005, Hsiao et
al. 2012). Normanian perceived affordance is adopted by this study, which is a result of the
mental interpretation of things—the perceived properties of the thing that determine how the
thing could possibly be used (Norman 1988).
Pertaining to architecture and urban planning, several studies have proposed the
affordance-based design approach (Clark and Uzzell 2002, Maier et al. 2009). At a building
scale, two affordances have been proposed: one concerning the building product, and another on
the building space (Koutamanis 2006). The affordance of a building product is similar to that
defined in Norman, such as doors afford entrance. The affordance of space involves a higher
71
degree of abstraction as space generally lacks the interfaces allowing direct interaction with
objects (Koutamanis 2006). Practically, the concept of affordance can be understood through “x-
able” (Maier et al. 2009), such as “walk-able, step-able, sit-able, lean-able, eat-able” of different
spaces in a building (Kim et al. 2011).
Using the idea of “x-ability” provided by a building, the goal of this study is to identify
whether and how a green building affords successful communication of green design to its users.
Previous studies have compared the pro-environmental attitudes and/or behaviors from
occupants in a conventional vs. a green building (Deuble and de Dear 2012, Brown and
Gorgolewski 2014, Azizi et al. 2015). It is argued that through studying how the green designs
are disseminated and communicated, their effects can be more clearly extracted for the attitudinal
and behavioral changes of users. Thus, the focus of this study is to extract following three “x-
ability” of a green building, with an extension to future importance:
1) The “aware-ability”—testing the awareness—whether the building users are aware of the
building being green? In detail, the study answers:
1.1) what is the general awareness level among the building users and through which
communication channels do they gain awareness; and
1.2) how do personal background factors affect the awareness?
2) The “know-ability”—testing the knowledge—whether the green building facilitates the
generation of green building knowledge among the users? In detail, the study answers:
2.1) what is the knowledge level about green buildings among the users; and
2.2) whether it is independent from the awareness?
3) The “perceive-ability”—asking the perception—which green design features are mostly
perceived by the building users? Similar to the two affordances proposed in (Koutamanis, 2006),
72
people can perceive the green design from the building product and/or the building space. The
perceive-ability indicates the order of how different green designs catch one’s attention, in other
words, which green design(s) are more perceivable among all those selected by the users. In
detail, the study answers:
3.1) what are the most perceivable green designs and how users perceive them differently
according to their spatial scales within the building—product-related vs. space-related
green designs; and
3.2) whether people perceive green designs differently according to their awareness?
4) In regards to “perceive-ability”, which studies the status quo of an existing building, the
relative importance of different green designs for future implementation—asking the
importance—is also examined from the users’ perspective. In detail, the study answers:
4.1) what are the most important green designs that users think should be implemented in
future design; and
4.2) whether users prioritize green design features differently according to their
knowledge about green buildings?
6.2 Methods
6.2.1 The Research Setting
With the emergence of green buildings, and green campus activities across the US and the world,
it is argued that such advance can be part of the larger cultural project of sustainability, above
and beyond technical innovations. In the US, universities can voluntarily participate in the
Sustainability Tracking, Assessment & Rating System™, which is a transparent, self-reporting
framework for colleges and universities to measure their sustainability performance (AASHE
2015). There is also the annual Princeton review of green colleges, with testimonies such as
73
“Colleges train the next generation of leaders who will ultimately be responsible for putting
green ideas into practice.” (Princeton review 2015, p3).
The young generations (as one of the targeted population for this study) is the foremost
important groups in preparation for a sustainable future. It is hoped that studying the campus
buildings and providing feedback for future improvements can partly educate students about
sustainability issues. These young people will join different industries after graduation, and will
be the next generation of industrial leaders, who will make decisions and collectively change the
current unsustainable practices within industries, technically, behaviorally, and psychologically.
A residential dining hall (named as Brody hereafter) at Michigan State Universiy (MSU)
was selected as the study site. Until August 2016, MSU has a total of 10 buildings on campus
that are LEED certified, and 1,559,273 square feet of MSU-owned space has been LEED
registered (MSUIPF 2016). There is a USGBC student chapter on campus promoting continuous
improvement of building performance. MSU is one of the nation’s top sustainable campuses and
has been recognized by “The Princeton Review’s Guide to Green Colleges” (MSUtoday 2014).
MSU also uses the least electricity per square foot among the Big Ten universities
(MSUsustainability 2016).
The building itself is a stand-alone addition to the original building and was built in 2011,
at a size of 33,832 sq.ft. The building is certified at the silver level of LEED and is a multi-
functional building used for housing, lecturing, and studying. It has the largest dining hall on
MSU campus on the second floor. It is hoped that studying the campus building can indirectly
educate students about sustainability. Indeed, several respondents mentioned in the commentary
page that they had learned about the green design through completing the survey. There are
several other LEED buildings that might have been chosen as the study site, although it was
74
found that they are smaller is size, mainly used for academic purposes, and also under a high-
level security that discourages external users. Brody, however, has a well-mixed user groups,
including students, staff, faculty, local residents and external visitors who visit for a variety of
reasons (e.g., classes, food, conferences).
A site visit was offered to the researchers by the campus sustainability manager to
introduce the buildings’ green features. The lighting system is automatic and whenever the pre-
defined indoor luminance level is reached, the artificial lighting is not used. People are provided
with natural light and outside views in most spaces of the building, with daylight and outdoor
views provided for over 75% of the space (USGBC 2016b). Due to its unique culinary service
provided, the daily operation incorporates relevant sustainable features such as sourcing food
from local organic farms, organizing a “healthy food for you” section by the chef. The building
achieves 4 out of 5 credits in the water efficiency category in LEED, and the kitchen employs
100% food waste recycling system (USGBC 2016b). Other than the green building technologies
employed, the layout and the furniture are specifically designed for catering different purposes
and improving user experiences. There are sofa tables for group chatting, and tall tables and
chairs for individual study. The sustainability manager mentioned the overall layout as a green
design as it mimics several smaller restaurants within a bigger restaurant, with each section
separated by internal decorative walls, or wood screens. Such a design does not earn direct
credits from LEED certification, though, it features the concept of design for the real people and
real world.
75
6.2.2 The Working Procedures
The research procedures and logics are illustrated (Figure 8) to provide schematic views. The
focus of this study investigates sustainable communication and how people perceive the green
design, as well as testing people’s knowledge regarding the green building design.
Figure 8. The working procedures and logics for understanding major aspects that the green
building shall afford, including the aware-ability, the know-ability, and the perceive-ability, as
well as how people prioritize each design for future implementation.
This study is explorative and observational in nature as it uses a survey study on a
particular building, with mixed research methods, to identify associations among variables
without extracting casual relationships. A survey questionnaire was prepared on the four aspects:
76
testing the awareness, testing the knowledge, asking the perception of selected green designs and
their future importance. Finally, personal background factors were answered.
The scope of this study assumes the built environment is static during the study. Figure 2
in Chapter 3 illustrates the overall feedback loops with a temporal scale, and environment-user
dynamics incorporate both how the environment impacts the users as well as how the users can
change and alter the environment, which is not studied in detail in this empirical study. Such
mutual dynamics could be investigated with a longitudinal approach using the research
framework proposed in Chapter 4.
Before preparing the questionnaire, the background information on the study site was
searched through the archival method (e.g., searching the building’s website, the university’s
Infrastructure Planning and Facilities website, relative media reports, and the USGBC project
archival). Following the site visit and a semi-structured interview with the sustainability
manager, a total of 11 green designs that have a potential to be perceived by the users were listed
(Figure 9).
The survey was carried out around the final exam week of the spring semester in 2016.
The sampling method was convenience sampling where several researchers were presented at the
entrance of the building every day from 11AM to 6PM for three days, approaching each person
as they entered the building. Convenience sampling was selected as the sampling method since
the researchers could not proactively seek out the population that uses the building, which is
dynamic and changing over time. Not every single person coming into the building could be
approached, especially during peak times. The questionnaire was handed out in person and the
respondent could either sit at the provided table to finish it or take it elsewhere and return it later
on. Researchers particularly mentioned to the respondents that they should complete the
77
questionnaire on their own. It is assumed that the samples are independent of each other, and that
there is independence within each sample.
6.2.3 The Questionnaire
The questionnaire sent out include the four major sections (6.2.3.1 to 6.2.3.4) as well as a
background information section (6.2.3.5). The study’s purpose and definitions on terminologies
are provided on the cover page. Such an explanation is considered appropriate to familiarize the
respondents with relevant information. The questions were coded before analysis. A total of 177
questionnaires were returned and those with low-quality data are discarded, defined as those with
over 80% of the data entry missing for either one of the four sections (Figure 8). After discarding
the low-quality questionnaires, a total of 153 were used for analysis later on. Other than the low-
quality questionnaires discarded, there were occasional missing data among those 153 samples,
and they were treated as the following. There were four samples among the 153 with missing
data on the section of future importance (two samples with one missing value and another two
samples with two missing values among the 11 elements). In these four cases, a score 0 (least
importance) was substituted for missing values for conservative estimation. There were nine
samples with missing data on the section of perceive-ability (with either one or two missing
values) and the mean value was replaced.
Aware-ability—awareness about the building being a green building: Respondents self-
reported whether or not they were aware that the Brody is a green building, if they were aware,
then the respondents answered through which channel(s) they had become aware: the university
website, this building’s own website, media reports, word of mouth, the educational signs in the
building, and/or others as they specified. The respondent who was aware that Brody is green was
later on coded as awareness = 1, and awareness = 0 for those who were not aware.
78
Know-ability—knowledge about green buildings: The respondent’s knowledge of the
green building was tested by two questions. First, they were asked whether they can recognize
the certification logo that represents the green building certification schemes most widely
adopted in the U.S., three other logos were presented together with the correct answer—LEED
logo: the Energy Star logo, the Green Seal logo, and the Green Star logo (representing the
Australian green building certification scheme). Alternatively, they can have chosen “I do not
know” without further answering the second question, which tested whether they knew the
certification level of the studied building. The first question was short-named as “LEED” for
further analysis, coded with 1 for the correct answer and 0 for all other answers. The second
question was short-named as “level”, coded with 1 for knowing the level and 0 otherwise.
Perceive-ability—perception about different green design features: Among the total 11
green designs listed, the respondents were encouraged to choose no more than five items that
they thought were most perceivable and caught their attention as green designs. This would keep
a relatively short time for the respondents to answer the questionnaire to remain accuracy, as
well as to focus on the most perceivable items. The coding schemes made sure that no matter
how many features were chosen, all the features were summed up to a total of 15 points. If five
features were chosen (as the majority respondents), then 5, 4, 3, 2, and 1 point(s) were attributed
to each of them in order. If over eight (including eight) were chosen, the first eight features were
selected (discarding the last three, which were comparatively less perceivable), with the
following scores attributed to each feature: 3.275, 2.875, 2.475, 2.075, 1.675, 1.275, 0.875, and
0.475 point(s). The coding ensured the same gap between each selected design with a total of 15
points. Similar schemes were applied when different numbers of items were chosen. The
different points attributed to each feature were used for calculating the relative perceive-ability.
79
According to the two affordances of a building (Koutamanis 2006), the 11 green design
features can be presumably categorized as either building product-related or space-related,
underlying different spatial scales. The feature Vw, St, and L/O are exclusively related to
building space, while Ltg, En, Mtl, Edu, and Veg are features that specifically related to building
products. The remaining features lie in between, which are the building product with a larger
spatial scale.
Future importance of selected green design: The respondents filled in a 0 to 5 scale
regarding how each green design feature should be integrated into the future design in a similar
type of building. Here, 0 means the feature is not at all important to a green building, and 1 to 5
means slightly, somewhat, moderately, very and extremely important, respectively.
Background factors: Respondents answered questions regarding: the frequency of using
the building, the length of using the building from the first time they used it, the usage (i.e. for
what reasons they use the building), their age, gender, role/occupation, the prior knowledge on
green building/design topics, and the self-reported environmental consciousness on a 0 to 5
scale. For non-numeric factors, they were coded for further analysis. The frequency was coded
as: 1 = 1st visit, 2 = occasional, 3 = monthly, 4 = weekly, and 5 = daily. The usage is transferred
to: for food only = 1, for other reasons = 2. Gender was transferred to: female = 1, male = 2, and
others = 3. The prior knowledge was transferred to: layman = 1, familiar with the topic = 2, and
the expert = 3.
80
Figure 9. The photo elicitation shown to the respondents regarding the selected green design features implemented in the study site.
The short-name for each feature follows the full name in the bracket.
81
6.2.4 Analysis
The R programming language was used for statistical analysis (Rdevelopmentcoreteam 2008).
For descriptive correlational analysis, all coded categorical data are treated as factors, the
mixed.cor() function and pairs.panels() function provided by “psych” package (Revelle 2014)
were used for calculating correlation between variables.
The analysis on perceive-ability and future importance were stratified according to
awareness and the knowledge, respectively, for the following reasons. Being aware that Brody is
green does not require deliberate acquirement of knowledge, whereas the knowledge on green
buildings requires more active and intentional acquisition of knowledge on the topic. In
corollary, the perception about the green designs is instinctive and is subconscious measures
regarding people’s impressions about the building’s green designs. The weight placed on certain
design’s future importance, however, involves more rational thinking and reasoning about what
should be implemented to achieve a green building, which, might be affected by one’s
understanding and knowledge about green buildings. Thus, it is aimed to find out the differences
in how people perceive about the current design according to the awareness—a type of
perceptual knowledge; and differences in how people prioritize different green design according
to their actual knowledge on green buildings —a type of rational knowledge.
Aware-ability: The communication channels were counted to identify the effectiveness of
each channel. To extract the effects of background factors on the awareness, the descriptive
correlation matrix was constructed first, then those factors with relatively higher correlation with
awareness were explored further. Two-way independence test (i.e. Chi-square test) between
awareness and the extracted factors was carried out first. Then conditional associations were
performed on those factors that were not independent from awareness: given factor1, what are the
82
conditional associations between awareness and factor2, so on so forth. The background factors
that were highly correlated with awareness were studied together with the communication
channels to extract their potential interactions. Practically, for analysis and graphic output, the
original frequency with 5 categories were combined into three categories as: 1 = 1st-time visit +
occasional user (2 + 21 samples), 3 = monthly and weekly users (19 + 21 samples), and 5 = daily
users (90 samples).
Know-ability: The knowledge level was counted as the percentage of people who could
answer the questions correctly. To study the relationships between awareness and the knowledge
(with two variables—knowing LEED logo and certification level of Brody—“LEED” and
“level”), conditional independence tests were performed on the three-way tables. Furthermore,
log-linear models were fitted against all possible combinations of independence, using loglm()
function from the vcd package in R (Meyer et al. 2015), including: the mutual independence, the
joint independence, the conditional independence, the all two-way associations, and the saturated
three-way associations (Friendly 2016). The best-fitted model was then identified through
ANOVA(), through analysis of Deviance for model selection (Sakate and Kashid 2014).
Perceive-ability: The most perceivable green designs (top five) were identified through
frequency analysis (i.e. how many times each feature has been selected), as well as calculating
the mean score of each feature regarding its relative perceive-ability. Exploratory factor analysis
was carried out on the 11 green design features to study how people perceived green designs at
different spatial scales. Two factors were to be extracted – the product or the space-related green
designs. Two algorithms were performed, one with the traditional factanal() function with
varimax rotation, returning factors that were orthogonal; and the other using fa.poly() function
from the psych package with oblimin rotation, allowing the factors not to be orthogonal. The
83
fa.poly() function is specifically useful for the factor structure of categorical items (Revelle,
2011).
With the reduced dimension of perception data from the exploratory factor analysis, the
question of whether people perceive green design features differently according to their
awareness was tested using two-sample test of proportion (using the prop.test() function in R),
and Mann-Whitney U test (using wilcox.test() function in R). The proportion test was used to
compare the frequency (i.e. the proportion of people who select a specific feature). The Mann-
Whitney U test was used to compare the distribution shape and the locations of the perceive-
ability scores. The 11 green designs were re-grouped according to the reduced dimension, using
average score from the original variables when forming a new variable.
Future importance of selected green design: The most prioritized green designs for future
buildings were identified through comparing the mean scores (on a scale of 0 to 5 that each
feature receives). The descriptive correlation matrix was constructed for: 1) the current
perception and future importance of each green design; 2) within future importance for each
green design; and 3) the knowledge on green buildings and on prioritizing future green design.
Unlike perception, which involves two different measurements—the frequency and
relative perceive-ability, for future importance, no frequency was measured. It was tested with
Kruskal-Wallis test (using kruskal.test() function) to identify whether people prioritize each
green design differently according to their knowledge. There were three groups of knowledge—
not knowing the correct answers for either of the knowledge test, knowing one of them, and
knowing both. Kruskal-Wallis test was used to test the null hypothesis that multiple
population distribution functions are identical against the alternative hypothesis that they differ
by location (Hollander and Wolfe 1973).
84
6.3 Results
The raw data were coded according to the analysis plan outlined in the previous section. No data
transformation was performed and due to non-normality of most categorical variables, non-
parametric statistical methods were employed (e.g., Mann-Whitney U Test, Kruskal-Wallis test).
Overall, no abnormal patterns are found within the demographic and background factors. The
majority of respondents are undergraduate students (n=122). Most of them used the building on a
daily basis (n=89). Most people (n=117) come here for food only, while others also visit the
building for other purposes such as using the lecture rooms on the first floor. Five people
claimed to be experts regarding prior knowledge about green buildings before taking this survey,
89 were of laymen, and the remaining claimed to be familiar with the topic. Most people stated
they were moderately environmentally conscious (n=76), followed by very conscious (n=36),
and somehow conscious (n=22). The differentiation between the user groups and their potential
effects to the aware-ability, know-ability, perceive-ability, and future importance were not
statistically tested, due to the significantly unequal sample size of each group (Table 7). The
potential effects of background factors were investigated under each “x-ability” (sections 6.3.2 to
6.3.5). Descriptively, the percentage of respondents according to their user groups had been
calculated according to their awareness (Table 7).
85
Table 7. Background characteristics and the percentage of respondents who are aware or not
aware about the Brody being green based on different user groups.
Total (# of
people)
Aware (%)
(92 are aware)
Not aware (%)
(61 are not aware)
Frequency % Frequency %
Frequency of
using the
building
1st time user 2 1 1.1 1 1.6
Occasionally 21 6 6.5 15 2.5
Monthly 19 15 16.3 4 6.5
Weekly 21 11 12.0 10 16.4
Daily 90 59 64.1 31 51.0
Time spent
using the
building
≤ 1 yr 80 50 54.3 30 49.2
> 1 yr, ≤ 2 yrs 37 21 22.8 16 26.2
> 2 yrs, ≤ 3 yrs 19 10 10.9 9 14.8
> 3 yrs 17 11 12.0 6 9.8
Occupation/r
ole on
campus
Undergraduate 122 77 83.6 45 73.8
Graduate 5 3 3.3 2 3.3
Faculty/staff 6 3 3.3 3 4.9
Local residents 11 6 6.5 5 8.2
External visitors 9 3 3.3 6 9.8
Why use the
building
For food 117 73 79.3 44 72.1
Other reasons 36 19 20.7 17 27.9
Age
≤ 25 128 81 88 47 77
> 25, ≤ 40 7 3 3.3 4 6.6
> 40 18 8 8.7 10 16.4
Gender
Female 84 51 55.4 33 54.1
Male 68 40 43.5 28 45.9
Other 1 1 1.1 0 0.0
6.3.1 Aware-ability
Out of the 153 samples, 92 respondents were aware that the building is a green building. Out of
all the communication channels that people had become aware, over one-third of the respondents
selected the educational signs in the building as the only channel that they become aware (36 out
of 92), followed by word of mouth (21), while 11 choose both of them. The university websites
appear to be a less effective channel, and the media coverage is the least helpful.
Among all the background factors, awareness was most correlated with the prior green
building knowledge (the more knowledgeable about green buildings, the more chances a person
is aware of Brody being green). The awareness was also weakly correlated with the frequency of
using the building, as well as the environmental consciousness a person holds. The chi-square
test between awareness and the above three background factors showed that the null hypothesis
86
of independence was accepted between awareness and environmental consciousness, which was
discarded in further analysis. For the frequency and prior knowledge, their independence with
awareness was rejected (with both of the test p-value less than 0.001).
The analysis of the conditional associations between awareness, the frequency, and the
prior knowledge showed that when the respondents were laymen about green buildings (i.e. prior
knowledge =1), the awareness increased with the increase of frequency of using the building
from very rare (=1) to more frequent (=3), but not further (frequency = 5) (Figure 10).
Contrarily, for people who were either familiar or expert in the green building before this survey,
their awareness of Brody being green and the frequency remained statistically independent
(Figure 10).
The most effective channel—the educational signs—was tested against the frequency of
using the building, and it was found that noticing the signs were not independent of the
frequency. Their interactions yielded similar patterns as the prior knowledge (Figure 10). For
those people who did not see the educational signs in the building: 1) when their frequency of
visiting the building increased from 1 to 3, statistically, the probability of becoming aware of
Brody being green increased at alpha = 0.05 level; 2) the awareness became independent from
the frequency when it further increased from 3 to 5 (i.e. daily users).
87
Figure 10. Conditional independence plot visualizing the relationships between the frequency
(three levels: 1 = rare, 3 = monthly and weekly, 5 = daily) and the awareness (two levels: yes or
no), given respondents’ prior knowledge about green buildings (three levels: laymen, familiar, or
experts).
6.3.2 Know-ability
Less than a third respondent could answer either of the two knowledge questions correctly:
recognizing the LEED logo (K1) or knowing the certification level of the building (K2). Less
than 10% of the respondents could answer both questions correctly. Among all 109 people who
could not recognize LEED logo, 49 people answered “I do not know”. Among the 60 people
whose answers were incorrect, 45 chose the “Green Seal” logo () as LEED, and 9 were confused
with the “Energy Star” logo.
88
The conditional independence test found that regardless of whether or not people can
recognize LEED logo, being aware of Brody as a green building was independent from knowing
its certification level. The log-linear models revealed that the joint independence model had the
best fit, indicating there was an association between the two knowledge variables, whereas the
awareness was independent of both of the two knowledge variables, as well as independent of
their combinations. All two-way independence model also obtained a good fit.
The mosaic plots provided a "lack of fit" indication (Meyer et al., 2015), with each
colored residual violating the null hypotheses of independence. Both the mutual independence
model (Figure 11.a) and the conditional independence model (Figure 11.b) could not capture the
interactions between the two knowledge variables (K1 and K2) conditioned on people’s
awareness (Figure 11).
89
Figure 11. Mosaic plot showing the lack of fit for the two log-linear models (the
mutual/conditional independence model) investigating independence between the two knowledge
variables (K1 and K2) and the awareness. Figure 11.a indicates that when awareness = 1, K1 and
K2 are positively associated (the blue color). Figure 11.b indicates that when awareness = 0, K1
and K2 are negatively associated (the red color).
90
6.3.3 Perceive-ability
The frequency analysis found that Edu (educational signs), Vw (outside view), and Veg (indoor
vegetation) were the mostly perceived green designs with 101, 103, and 104 people choosing
them. Ltg (lighting) and Win (tall window) followed, both with 81 people selecting them. About
60-65 people also chose En (efficient HVAC), Tran (bike rack), St (external site), and L/O
(overall layout). The least selected were Mtl (low-emitting furniture) and Stwy (stairway). The
top five selected features also scored the highest regarding their relative perceive-ability, with the
order slightly changed.
The explorative factor analysis indicated that the pre-assumed spatial patterns were
supported to some extent. Two algorithms show slightly different results, though the major trend
was similar. The first factor extracted was related to building space: Win (tall window), Vw
(outside views), St (external site), Stwy (stairway) and L/O (overall layout) fell under this factor
under oblimin rotation, while Win, St, and L/O were also supported by the varimax algorithm.
The second factor extracted was related to building product: Ltg (lighting), En (efficient HVAC),
and Mtl (low-emitting furniture) fell under this factor with both algorithms. One product-related
feature—Edu (educational signs), however, was not identified as a variable under the second
factor. Tran (bike rack) was not grouped to either factor for both algorithms. Similar results were
found for Veg (indoor vegetation) with the varimax rotation.
The original 11 green designs were re-grouped to five new variables for the test on the
proportion and distribution (Figure 12). Tran (bike rack) was left out as it did not belong to either
factor and the least perceived. Five new variables included: Edu (educational signs), Vw (outside
views), Veg (indoor vegetation), S, and P. The first three used their original name and were
among the most perceived features and not combined with any other features; S indicated the
91
new variable combining space-related features (Win (tall window), St (external site), Stwy
(stairway), and L/O (overall layout)); and P indicated the variable combining product-related
features (Ltg (lighting), En (HVAC), and Mtl (low-emitting furniture)).
The two-sample test of proportion (with two-sided tests) indicated that, statistically, the
proportion of people selecting Edu differed significantly according to their awareness at P-value
= 0.0022. The respondents’ preference on Vw , Veg, S, and P did not differ significantly
according to their awareness at alpha = 0.1 level.
When comparing the distribution shape and center location using the Mann-Whitney U
Test, Edu showed significant differences within the two different awareness groups, so did S,
where both had a P-value less than 0.05 (Figure 12). Their pattern reversed: Edu received higher
scores for people who were aware of Brody being green, whereas S received higher scores for
people who were not aware of Brody being green. For Vw, Veg, and P, no differences were
found among the two awareness groups.
92
Figure 12. The perceive-ability on the new, reduced five variables according to people’s
awareness. The Edu (educational signs), Vw (outside views), and Veg (indoor vegetation) are the
original features, P combines product-related variables, and S combines space-related variables.
6.3.4 Future Importance
The importance given to future design was not found to be significantly correlated with the
current perception about the 11 green designs. The correlation within future importance
themselves found that Win (tall window) and Vw (outside views) had the highest correlation at
0.68. The second highest correlation (0.60) was between Stwy (stairway) and L/O (overall
layout). The highly correlated groups were either between features regarding building space, or
between building products, but not between the two groups.
Different findings were observed on how people prioritize future designs from how they
perceive current green designs in Brody. The most important green designs that should be
93
implemented were En (efficient HVAC), Ltg (lighting), Veg (indoor vegetation), Tran (bike
rack), and Edu (educational signs) (Table 8). Only Edu, Ltg, and Veg were overlapped with the
top five perceived features.
When grouping the future importance into the three knowledge groups, people who could
answer correctly on one of the two knowledge questions always weighted the highest priority to
each of the 11 green designs (Table 8), instead of those who were the most knowledgeable
(answering both questions correctly). Such differences were not statistically significant, though.
The Kruskal-Wallis test found that, for all the 11 features, at alpha = 0.1 level, only E showed a
different distribution among the three groups of knowledge (Table 8).
Table 8. The perceive-ability for each green design feature implemented in Brody, and the
prioritizing of each of them for future design (Knwl = knowledge: knwl = 0 means knowing
neither, knwl = 1 means knowing either one, knwl = 2 means knowing both questions).
The 11 green design
features
Perceived green
design Future importance
Freque
ncy
(out of
153)
Perceive-
ability
score
Future
importa
nce
Knwl = 0
(n = 104)
Knwl =
1
(n = 34)
Knwl =
2
(n = 15)
Kruskal
-Wallis
test (p-
value)
Ltg
(lighting system) 81 1.75 3.61 3.36 4.29 3.87 0.93
En
(efficient HVAC) 60 1.02 3.69 3.45 4.29 3.93 0.55
Mtl
(low-emitting furniture) 40 0.61 2.78 2.67 3.15 2.73 0.75
Edu
(educational signs) 101 2.22 3.11 3.06 3.32 3.00 0.84
Win
(tall window) 81 1.39 2.84 2.78 3.24 2.33 0.09
Vw
(outside view) 103 1.96 2.99 2.87 3.35 3.00 0.89
Tran
(bike rack) 65 1.03 3.23 2.99 3.76 3.67 0.17
St
(external site) 63 1.02 2.72 2.65 3.03 2.47 0.41
Veg
(indoor vegetation) 104 2.13 3.27 3.22 3.44 3.20 0.58
Stwy
(stairway) 47 0.74 2.37 2.29 2.79 1.93 0.89
L/O
(overall layout) 63 1.14 2.92 2.92 2.97 2.80 0.57
94
6.4 Discussion
Due to an extremely unequal sample size for most of the user characteristics, no statistical test
was performed on the several affordances studied, instead, the correlational analysis revealed
that for know-ability, perceive-ability, and how people weigh future important, no significant
correlation was found between the user characteristics and the studied affordances. Such findings
suggest that using the building as a medium to communicate sustainability might not be affected
by user’s gender, age, occupation. On the other hand, assuming that people become more
familiar with the building when they visit the building more frequently, then this factor—users’
familiarity with the building could potentially yield interactions with the green design
implemented within the building to affect their awareness and to promote their knowledge. And
such interaction needs to be studied in future research with a larger sample size, which will
enable more robust statistical analysis.
6.4.1 Aware-ability
The overall aware-ability that Brody affords was satisfying, and 60% of the respondents were
aware of its green status. This finding is similar to a similar study conducted earlier (Cranz et al.
2014), with a different target population. Educational signs within the building were proven to be
the most effective communication channel, reinforcing the integration of “a comprehensive
signage program built into the building's spaces to educate the occupants and visitors of the
benefits of green buildings” from the innovation category in LEED (USGBC 2016c).
The frequency of using the building was found to be an important factor to affecting
awareness. When people did not have prior knowledge, the more frequent they visited the
building, the higher the chance that they became aware of the building being green. This
phenomenon can be explained by looking at the correlation between the frequency of building
95
use and noticing the educational signs in the building. When one visits the building more often,
the chance of him/her noticing the educational signs becomes higher, resulting in their
awareness. For those who did not see the educational signs, their awareness increased along with
frequency probably due to other communication channels (e.g., word of mouth).
Unsurprisingly, the three background factors that had relative more associations with the
awareness included prior knowledge, the frequency of building use, and the environmental
consciousness. Other individual factors not considered here, such as comfort and satisfaction
might be explored in future. Deep-level cultural influence was not studied, similarly, the effects
of social norms can be further studied. Since the process of how knowledge is learned,
perception is felt, behaviors are conducted in a setting are generally in accordance with the
norms of a given socio-cultural system.
6.4.2 Know-ability
The know-ability the building affords was unsatisfactory compared with aware-ability. Programs
driving the green university movement in the U.S. exist (AmericanSchool&University 2008).
The Center for Green Schools at USGBC also claims that education is the core reason for
greening schools as “tomorrow’s future leaders are in school today” (USGBC 2011).
Nevertheless, the effective way of achieving the sustainable education needs to be further
researched.
An unexpectedly large number of people confused the “Green Seal” logo with LEED,
though it was initially expected that the “Energy Star” logo would be the most chosen incorrect
answer as most people are aware of the logo in their daily life (USEPA 2015). When people
know more about the “Energy Star”, they could be more confirmative that it is not for green
96
buildings alone. On the other hand, the “Green Seal” logo is less used in consumer products
directly, and the word “green” might be misleading, resulting in more people choosing this logo.
Konwing the LEED logo did not affect the conditional independence between the
awareness and knowing the certification level. This is probably due to the following reasons.
Although the LEED badge on the first floor clearly indicated the building’s certification level,
people might not have carefully read over the whole sign, instead, they might have glanced over
it and seen the “LEED” instead of the smaller character “Silver” underneath the logo. Thus, how
to implement a well-designed and successful “comprehensive signage program” suggested by
LEED (USGBC 2016c) remains a future research and practical priority.
The log-linear models indicated that when people were aware of Brody being green, the
independence between the two knowledge variables did not hold. There was an interaction
between people who were aware of the building being green, as well as being the most
knowledgeable. How awareness might stimulate people’s desire to learn more about a green
building needs to be further studied.
6.4.3 Perceive-ability
The findings indicate that people’s appraisal of most green design features were not affected by
their awareness of the green status of the building. Their attention to educational signs, however,
differed significantly based on awareness. This might be explained by the fact that those who
paid attention to the educational signs became aware of the building being green.
When a certain green design feature was perceived and selected, the perceive-ability
order became a different type of decision. While the proportion of people who chose space-
related factors did not differ significantly among the two awareness groups, the perceive-ability
order, did show differences. Those who were not aware of the building being green tend to prefer
97
space-related features more than those who were aware. The question remains whether higher
priority given to the space-related features makes people neglect smaller-scale products, such as
the educational signs, which was the most effective communication channels to raise the
awareness.
Presumably, before conducting the survey, the Ltg, En, Mtl, and Edu were specifically
related to building products. However, Edu was not identified as a variable under the product-
related latent factor. This could be explained by the fact that Ltg, En, and Mtl are very specific
green building technologies/materials, compared to Edu, which is for educational purpose, as
well as to the space-related features, which are not specifically designed to improve a specific
sustainable aspect. Another interesting finding also suggested a spatial dimension, where the
most significant negative correlation found among all 11 designs was between the educational
signs and the access to outside views.
The above findings indicate a hypothesis that can be explored in future regarding the
different spatial perspective of a person: whether those who tend to notice features at an overall
spatial scale might neglect small-scale products. Previous studies already demonstrated the
spatial differentiations among occupants in one building when studying their satisfaction (Hua et
al. 2014). At a larger geographical (i.e. regional) scale, the spatial pattern was supported
conceptually and empirically by Cidell and Beata (2009, 2013), where the researchers concluded
that the LEED credits are found to be grouped into spatially-specific credits (e.g., sustainable
sites, water efficiency, and energy and atmosphere) and non-spatial credits (e.g., materials and
resources, indoor environmental quality, and innovation and design) (Cidell and Beata 2009,
2013).
98
6.4.4 Future Importance
The correlation between the importance given to future design shows that people tend to either
give priority to space-related features or product-related features without a crossover. This
indicates that most people might be either a space perspective person or a product perspective
person, but not both at the same time.
The knowledge level did not appear to affect people’s views on future design. People
who were more knowledgeable did not tend to think a particular green design shall be more
important. Statistically, only the the Win (tall window) stands out at alpha = 0.1 level, and people
who were most knowledgeable gave the lowest priority to this feature. Giving a more detailed
look at the distribution of how the most knowledgeable people prioritized the feature, it showed a
reversed bell shape. The reasons why the most knowledgeable people tended to hold strong
feelings – either positive or negative views toward the large windows remain unexplained and
will need further study to explain such patterns.
A noticeable finding was that people give exceptionally high weight to energy-related
design (En), on the other hand, En received a low perceive-ability among all green design
features in Brody. The possible explanation is that under the current policy emphasis on energy
efficiency, people instinctively feel that a green building should incorporate such a feature. On
the other hand, energy efficiency features are not as visible as other green design features, for
example, the indoor vegetation, which received both high scores in perceive-ability in Brody and
importance for future design. The un-visibility of energy efficient features might have prohibited
them from being perceived directly by users, which indirectly demonstrates the importance of
using appropriate signs to educate people.
99
The transportation-related design (Tran) also highlighted similar patterns as the feature
En. While people might have acknowledged the importance of alternative and less emission-
intensive transportations, they did not perceive it in the current building, probably due to
following reasons: first, the bike rack is not located near the building, but within several
hundreds of yards away from the building; second, people may not relate the transportation as an
essential part of green buildings; finally, while people tended to acknowledge the importance of
sustainable transportation, their current actual behavior did not choose such alternatives, possibly
affecting their current perception.
6.5 Chapter Conclusions
Using a LEED certified building, this chapter explicitly studied several affordances that a green
building shall convey: the aware-ability of the building being green, the know-ability of the
users’ knowledge about green building topics, the perceive-ability at different spatial scale of
selected green designs, and their weighted importance for future implementation from users’
perspective. The following users characteristics—gender, age, occupation/their role on campus,
time spent since using the building, and reasons for visiting the building—did not contribute to
significant differences in the outcome of the affordance studied. Though the frequency of using
the building and users’ prior knowledge on green building topics did affect the outcomes to some
extent and resulted in interactions with different green design features, especially the educational
signs presented in the building.
The results demonstrated that the aware-ability achieved was satisfactory and the
educational signs were the most effective communication channel. The know-ability, however,
achieved a low score and more effort is needed to promote knowledge distribution using a green
building as a teaching tool. The spatial patterns (at building product scale vs. spatial scale)
100
among different green designs were supported to some extent. The perceive-ability generally did
not differ according to people’s awareness. Regarding the future importance, people who were
more knowledgeable about green buildings did not tend to think a particular green design was
more important. The potential of using the affordance theory to guide and evaluate a green
building and its designs has been demonstrated. When using the affordance theory for future
green building design, a special attention is needed to specify the affordance through building
product and/or building space. Similarly, a future research need is to inveistigate users’ spatial
perspective: whether those who tend to notice green design features at a building scale might
neglect small-scale building products.
101
7. CONCLUSIONS
7.1 Summary
This work improved the understanding of how a green building can be used as a medium to
communicate sustainability and influence the users’ pro-environmental behaviors, as well as
their awareness, knowledge, perception toward green building/design. The current understanding
gained through relevant literature review showed that: 1) green buildings have the potential to
promote people’s pro-environmental attitudes and behaviors; 2) there exist links between how
certain green design features are implemented and how they facilitate corresponding behaviors;
and 3) the communicational and educational roles of buildings have been demonstrated among
different building types, though less is studied in the context of green buildings. To
systematically investigate the research topic, the concept of influential design was proposed and
defined, raising two research challenges – theoretically and methodologically. An overall
research framework was proposed incorporating the feedback loops between design-
environment-use, with a focus on user experience.
The first study adopted the theory of planned behavior (TPB) from the communication
science and provided a possible theoretical basis for studying influential design. It answered the
questions on how green buildings communicate messages based on ideas from persuasive
communication. The results identified two communication channels of a building: active
instruction through face-to-face interpersonal transmission and passive instruction from the
building itself. Previous studies were explained through the lens of the TPB where the
active/passive instructions were found to locate at different positions along the causal chain of
the TPB. Furthermore, a framework incorporating the TPB was proposed as a theoretical
102
foundation to differentiate the two communication schemes and to help understand the role of
visual persuasion of green building designs.
The second study proposed the hierarchical modelling to provide a possible solution to
the methodological challenge. After analysis of the preliminary survey of employees working in
a certified green building, it was ascertained that: 1) people were positively influenced and
became more pro-environmental after moving into the green building; and 2) the visually-
available green design elements were more persuasive than conceptual-only green design. A
hypothetical hierarchical model was then demonstrated with simulated data to take account for 1)
building level variations separating the visual and/or conceptual-only green designs; and 2)
individual variations within each building considering their awareness about the building being
green, perception toward the green design, and other personal background factors.
Finally, the affordance theory was used to evaluate the affordance that a green building
shall support using a survey study in a LEED certified residential dining hall—the Brody hall at
Michigan State University. A post-occupancy survey was performed on four aspects: the aware-
ability, the know-ability, the perceive-ability, and the future importance. The results suggested
that the building was satisfactory in promoting awareness while not promoting the users’
knowledge about green buildings. Whether and how people perceive different green design
elements indicate that people are dichotomous in the spatial evaluation of those elements. They
either tend to notice the building product at a smaller spatial scale or building space at a larger
spatial scale. Similarly, people give more weights to either the product-related or to the space-
related green designs when choosing the most important aspects to be integrated into future
green building design.
103
7.2 Philosophical, Theoretical and Methodological Contributions
The philosophical root of this research about the promotion, communication, and education of
sustainability from built environment indicates a cultural assumption of sustainable development
originated from western society. While this sustainable viewpoint swept across the world, one
might ask questions such as whose buildings and whose value are based upon for the scholarly
thinking and who set up the criteria for determining the sustainability of the built environment.
The justification for such commonly adopted (and accepted) sustainability concepts is not a topic
studied here. This research, however, transfers a message of shifting attention from technical
sustainability to the root of any environmental crisis—a crisis of mind (Palmer and Finlay 2003).
Similarly, Roslin (1996) argues that an ecologically aware society “has as much, if not more,
potential for the conservation of resources than technical innovation”.
The empirical findings in the spatial perspective (either product-focused or spatially-
focused) from the green building users indicate that people tend to be dichotomous in spatial
thinking and cognition. The relationships between the green design and the user behaviors found
in Chapter 2 also reinforce the importance, as well as the potential manipulation of space for
influential design. The spatial perspective identified in this research can contribute to theoretical
research in general. For example, it is necessary to involve the spatial scale for the two
antecedents of behavioral intention from the TPB—the subjective norms and the perceived
behavioral control. Similarly, the physical proximity and the spatial location and/or distance of
certain facilities in promoting perceived behavioral control might be considered.
The simulated hierarchical model in Chapter 5 aimed at the methodological contributions.
The variable and causality issues were scrutinized by: 1) separating different design elements;
and 2) clustering the analysis according to the individual building, as well as individuals within a
104
building. Furthermore, the feedback loops introduced in this research and empirically tested in
Chapter 6 can be used by one of the systematic building assessment methods—the whole
building Life Cycle Assessment (LCA). Specifically, future research can gain insights upon the
user experience extracted in this work and add in the environment-user dynamics to the whole
building LCA. At a practical level, it is suggested to incorporate the sustainable communication
and education credit into the current green building rating systems, ensuring the achievement of
a virtuous cycle of green buildings and green users.
7.3 Limitations and Future Work
Types of stakeholders not considered: Within the whole building life cycle, there are feedback
loops. In this work, all three studies focused on the users in the study scope. This was decided
according to the research goal, and the research questions. However, other scopes are also
essential to be considered in future research in order to understand more about the research area
of the influential design. For example, it is important to consider how designers initially encode
their ideas (e.g., sustainability) through design element embedded within the building and how
users decode and interpret them. It is essential to include different stakeholders, including
designers, maintenance, and renovation groups to study the influential design.
Building user groups not included: In the empirical study, convenience sampling
schemes were adopted, thus, not all the users and user groups could be covered. First, there is the
non-observation problems where not every single user of the building could have been possibly
covered. Second, there is the non-response bias, where around 20% of people who took the
questionnaire have not finished it and/or returned. Furthermore, there are individuals who should
have been on the sampling list but were missing and a large number of users were not covered
105
temporally. Lastly, due to the heterogeneity among building users, those inherently more
influential in distributing feedback on future design/improvement were not covered.
Non-generalization due to the nature of survey study: The empirical study is based on a
survey study, where the particular building site is in a fixed geographical location and the survey
population targeted particular user groups. Such non-probability sampling
techniques cannot give generalized answers to other building sites and building users.
Causal relationships not extracted: As stated in Chapter 4.2, to study influential building
design, essentially, the causes from the building elements to the social outcome is needed. This
problem is not solved by the second study where the analysis was tested against a hypothetical
data simulation without real experimental data. The causality also cannot be confirmed by an
observational study used in this explorative study. Although a “control” group from the
conventional building is formed when comparing pro-environmental behaviors among pre-
existing occupants from different buildings, there are many differences between the groups that
cannot be controlled and measured. Thus, the effectiveness/influence of green buildings to
occupants cannot be formally stated, in other words, the differences found between buildings
may or may not be due to the presence of green design to occupants. When the situation allows, a
longitudinal approach shall be utilized as the consideration of the whole feedback loop requires
long-term efforts across the whole building life cycle, which crosses different temporal scales.
Types of buildings not differentiated: Throughout the two conceptual studies, the types of
buildings are not differentiated, and the targeted building in the empirical study is restricted to
the residential hall on campus. Other types of buildings, both residential and non-residential,
need to be further studied. LEED-certified residential buildings in the US witnessed a significant
increase from 31 in 2006 to 18,481 in 2013 (USGBC 2014). With the increase in residential
106
buildings being built/renovated as green buildings, it is urgent to further research on using the
building as a teaching tool and communicate sustainability.
Green building achievement levels not differentiated: Green buildings have different
levels of achievement, shown by certification levels for those certified buildings, e.g., silver,
gold or platinum for LEED system. Although it is arguable that different levels of certification
(thus different levels of experience with green design features within the building) might result in
different levels of awareness, perception, knowledge, and behavior, this topic is not scrutinized
in this work.
Geographical and cultural differences to be considered: It is not answered in this work as
to how people are affected by the surrounding built environment and landscape at different scale.
In previous studies that look into the behavioral changes after the adoption of green technologies,
different results were found in different countries (Keirstead 2007, Andersen 2013). The
influence of an individual green building may differ significantly in different places based on
local culture and social norms, which could be considered as a confounding issue, meaning that
the contextual background affects both the development of green buildings and the behavioral
changes of people. Future studies from different geographical locations are encouraged, but not
included in this study.
The spatial cognition within a building: The third study empirically observed people’s
perceive-ability about green designs at different spatial scales, or, in the geographical sense,
perceive-ability relates to the cognitive process about spatial properties of objects. Spatial
properties can be referred to the two fundamental and generic features: the structuring and the
scaling effects (Amedeo 2009). This study only considered the scaling effects (e.g., relative size)
107
of different green designs, while the structuring effects (e.g., the arrangement, the configuration,
the connection, and separation) and the influence on perceive-ability can be studied in the future.
7.4 Outlook
This research studied the connection of design, in the green building context, to the building
users. It extends previous scholarly thinking on environmental determinism, and a new study
area has been proposed—the influential design. It is hoped that this work will shed light on
influential (green) design. The studies and surveys performed in this research are expected to add
a new dimension to existing POE methods. Relevant studies are encouraged in developing
countries where large-scale (sustainable) urban transformation and/or renewal are in progress.
109
Appendix A. Definitions of Terminologies
Active instruction
In this study, it is defined: deliberate interventions incorporating communication medium of
‘face-to-face interpersonal transmission’ (Orr 1999) to influence building users’ behaviors.
Affordance
The actionable properties that the environment offers to the people (adopted from Gibson 1979).
Affordance theory
People recognize opportunities for action in the environment by perceiving the affordances of
either object within the environment or the environment itself (Gibson 1979).
Architectural determinism
The environment facilitates or inhibits behavior, providing opportunities that influence
the probability that behaviors will or will not occur (PsychologyDictionary 2016).
Aware-ability
In this study, awareness is defined as the building users are aware about the fact that the building
is (or is not) a LEED certified green building. In corollary, “Aware-ability” is used specifically
in the empirical study and means the ability/affordance of the LEED certified building to
promote awareness among users.
Behaviors
Behavior is the aggregated response of a person resulting as a consequence of complex
interactions between internal and external factors (Kaluarachchi and Jones 2013).
Conceptual only green design
110
In this study, it is defined: the design provides no visual evidence of its green features. Examples
include implementing a waste management plan, using low-emitting materials during
construction, and controlling indoor pollutants.
Environment-Behavior research
Studies that try to understand the relationship between form (e.g., the building structure) and
function (e.g., user behavior) (Memmott and Keys 2015).
Environmental determinism
The environmental determinism (also as climatic determinism or geographical determinism)
states there is a link between the behavioral patterns of people and the geographical area they
inhabit (Lynch 1960).
Green building
Buildings that are healthier, apply more resource-efficient models of design, construction,
operation, renovation, maintenance, and demolition in comparison to conventional buildings. It
is used interchangeably with sustainable buildings throughout the dissertation. Buildings that are
not green are named as conventional buildings.
Green designs
Elements of a building that make it be green. It is used interchangeable with green building
designs throughout the paper.
Influential (building) design
It means that building design has the potential to influence building users’ awareness, perception,
knowledge, and behavior. They can encourage, facilitate, reinforce, or impede certain types of
111
behaviors, and provide cues to remind people to behave in a certain way. Meanwhile, it is
admitted they are not the only reasons that determine the actual behaviors.
Know-ability
This word is used specifically for the empirical study and means how the LEED certified
building is educating the users about green building knowledge and ideas through users’
observing or experiencing the building, and/or intentionally studying and investigating about the
topic.
Passive instruction
In this study, it is defined: passive instruction incorporates non-human communication mediums,
specifically, utilizes the building itself to influence building users’ behaviors.
Perception
The process of achieving awareness and comprehending sensory information, incorporating both
the content of a scene and a very quick unconscious assessment of what it is possible to do in the
setting (Kaplan & Kaplan 1989).
Perceive-ability
This word is used specifically for the empirical study and indicates the order of how different
green designs catch one’s attention, in other words, which green design(s) are more perceivable
among all those selected by the users.
Persuasion (and visual persuasion)
Persuasion refers to messages that are designed to change attitudes, beliefs, values and behavior
(Ragsdale 2011). Similarly, visual persuasion in this study is defined: the visual green design
that is designed to change attitudes, beliefs, values and behavior. The meaning of “that are
112
designed” refers to that when the building is designed in that particular way, it inherently entails
an encoding process of designers choosing a particular design, element, materials and layout to
express the green status of the building, regardless of whether it is decoded by the users.
Physical settings
In this study, physical settings remind people of what is expected of them through certain cues
embedded into them, such as a certain type of behavior or response. This term is used
interchangeably with built environment/physical environment throughout the dissertation. The
above definition relates to the definition of behavior setting in the Environment-Behavior
research, which is an ecological unit consisting of interactions between a person’s behavior and
objects, time, and the immediate environment (Memmott and Keys 2015).
Sustainable behaviors
In this study, it is defined: behaviors by individuals or groups taken at the scale of a building and
its surrounding site. The behaviors could be supported or interfered by the physical environment.
They aim at contributing to a reduction in energy and water consumption, reduction of
automobile dependency, promotion of 3R principle (reduce/recycle/reuse) of waste treatment,
encourage to correctly categorize waste, and maintaining occupants’ satisfaction of indoor
environment quality while not increasing energy cost indirectly.
Sustainability
Sustainability is defined according to the ISO 15392 – Sustainability in Building Construction as
“a state in which components of the ecosystem and their functions are maintained for the present
and future generations, whereas components of the ecosystem include plants and animals, as well
as humans and their physical environment.” For humans, sustainability requires a balancing of
113
key elements of human needs: the economic, environmental, social and cultural conditions for
societies’ existence.
The theory of planned behavior (TPB)
The TPB is a classical behavioral model for explaining and predicting behaviors through
considering three core constructs of attitudes, subjective norms, and perceived behavioral
control.
Visual green design
In this study, it is defined: those design elements that speaks of a building’s green status.
Examples include on-site renewable energies, interior design elements, interpretive signage,
transparent waste bins, green-roofs/spaces, and indoor vegetation.
114
Appendix B. Results and Analysis from In-depth Review of Previous Studies
B.1 Green Buildings and Pro-Environmental Behaviors Table 9. Previous studies on relationships between green building and occupants’ pro-environmental attitudes/behaviors and other
general environmental attitudes/behaviors studies. Study Data
collection
Analysis
approach
Independent
variables
Dependent
variables
Location Major findings
(McCunn and
Gifford 2012)
Questionnaire
survey
Correlation
analysis
n.a. n.a. 15 LEED office
buildings, Canada
Neither engagement nor environmental attitudes
were correlated with green design features
(Rashid et al.
2012)
Questionnaire
survey
Ccorrelation
analysis,
multiple
regression
Individual
workspace,
departmental
spaces
Environme
ntal
awareness,
organizatio
nal image
One LEED office
building, the US
Individual workspace and department space affect
satisfaction then indirectly affect environmental
attitude and organizational image
(O'Callaghan
et al. 2012)
Questionnaire
survey
Hierarchical
multiple
regression
Sustainable
design,
environmenta
l attitudes
Utility
usage
One green and one
conventional residential
community, Australia
Positive attitudes to environmental conservation
correlated with lower energy use. Attitudes were
not found to be a statistically significant predictor
of energy use when analyzed with other predictors.
(Lynam
2007)
Mixed
method:
questionnaire
survey and
qualitative
interviews
Grounded
theory
method;
t-test for
quantitative
survey data
n.a. n.a One green and one
conventional academic
building in Canada
Analysis from interview showed green buildings
send out pro-environmental messages to occupants
so long as the occupants have awareness of the
building's green status. The results from
quantitative showed students in conventional
buildings hold more pro-environmental attitudes.
(Deuble and
de Dear
2012)
Questionnaire
survey
Linear
regression
Environment
al attitude
(NEP)
Forgivenes
s factor
Two academic
buildings, Sydney,
Australia
Occupant satisfaction levels on the POE were
positively associated with environmental attitudes,
though, ‘the question of causality remains moot’.
(Hostetler
and Noiseux
2010)
Questionnaire
survey
ANCOVA;
Man U
Whitney
n.a. n.a. Two green and two
conventional residential
communities, Florida
Green homeowners reported more pro-
environmental behaviors in only a few questions
while no differences in attitudes
(Azizi and
Wilkinson
2015)
Questionnaire
survey
Man U
Whitney test
n.a. n.a. One certified green, one
non-certified green, one
conventional office
building, Malaysia
Occupants were motivated to practice energy-
saving behaviors in green buildings provided that
they know the building is designed green.
(Daniel et al.
2014)
Questionnaire
survey
Paired T-test n.a. n.a. Low-energy dwellings
in Melbourne and
Darwin, Australia
Occupants of low-energy dwellings showed higher
biocentric concern and lower anthropocentric
concern compared with control sample from the
general population.
115
B.2 Relationships between Green Building Designs and Sustainable Behaviors
Table 10. Associations between green designs and sustainable behaviors from previous research. Catego
ry
Examples of desired sustainable
behaviors
Relationships between Sustainable behaviors and green designs Source
Energy Promote the use of energy-recovery
ventilation systems in four LEED-Gold
residential towers in Toronto;
Occupants’ comments include: “Tried to clean, way too difficult, did not bother”, “The
ventilation is really loud”, “Noisy fan, have to adjust TV when it comes on in winter”.
(Brown and
Gorgolewski
2014)
Promote the use of mechanical
ventilation with heat recovery system in
low-carbon houses in UK
Through interviews, occupants did not understand the controls and filter cleaning
procedure of the MVHR.
(Carmona-
Andreu et al.
2013)
Indoor
Enviro
nment
Qualit
y
(IEQ)
Encourage the occupants to practice pro-
environmental and healthy adjustments
in response to discomfort (e.g.,
overheating/overcooling) that is
supported by design attributes in the
green buildings: such as promote
“personal adjustment” (i.e. clothing
adjustment, walking around, consuming
hot/cold drinks) instead of
“environmental adjustment” (e.g., adjust
temperature, open/close window)
Have spacious common spaces for occupants to retreat.
Have space for occupants to walk more around in the building to heat up their body.
(Azizi et al.
2015)
The appropriately designed physical environment can encourage occupants to make
healthy adjustments such as by walking around more.
Occupants in commercial buildings engaged in less personal adjustments (i.e. drink
beverages; dress in layers, walk around more) than environmental adjustments and due to
the lack of physical environment such as a place to buy coffee and a place to retreat.
(Moezzi and
Goins 2011)
Personal adjustments were made more than environmental adjustments in spaces which
occupants have limited access to the control systems such as the open plan space. While
in private offices within the building, the occupants made more environmental
adjustments than personal adjustments.
(Heerwagen
and
Diamond
1992)
Transp
ortatio
n
Promoting pedestrian volume (at
neighborhood scale)
Planning factors such as density, diversity, accessibility, distance to transit, network
attributes affect pedestrian volume.
(Ewing et al.
2008)
Besides above factors, following building related attributes increase pedestrian volume:
the existence of openings and transparency of the ground floor.
(Lee et al.
2015)
Water N.A. Rainwater and recycled water are used within sustainable houses and not connected to
town mains, and the local area water restrictions do not apply to residents in the
sustainable houses thus they have increased water usage.
(O'Callagha
n and Hyde
2011)
Waste Promote correct food disposal behavior
(correctly choose disposal bins) in
academic buildings
The cafe at the sustainable building employs both constraining (e.g., no bottled drinks
are available for purchase) and suggestive approaches which could be shaping and
influencing user behavior.
(Wu et al.
2013)
Promoting recycling behavior in
households
The physical proximity of containers is the fundamental reason that justifies the success
of recycling behavior, e.g., to provide curbside collection for the household.
(Ludwig et
al. 1998)
Promoting recycling behavior in
households
The existence of some available space in the household is a significant predictor of
recycling participation.
(do Valle et
al. 2004)
Situation factor includes: 1) Recycling takes up too much time; 2) Recycling takes up too
much room, and 3) Recycling is too complicated all prohibit recycling behaviors in rural
households.
(Tang et al.
2011)
116
Table 11. A sample checklist of associations between green designs and sustainable behaviors
that might be implemented in an office building. Sustainable behaviors Green design features
Energy Reset thermostat to save energy HVAC system that can be regulated by end users
Turn off light when absent Warning stickers around the switch
Unplug cell phone chargers, computers etc.
when not in use
Warning stickers around the switch
Using natural light whenever possible Certain distance within windows;
Presence of daylight duct
Taking less elevator Appealing interior design around stairs
Water Reducing flushing water Dual-flush toilet
Reduce bottled water consumption Provision of water filtration bottle
IEQ Clothing adjustment when feeling cold/hot Provision of individual hangers and space
Moving to a different location when feeling
thermal, lighting, acoustic discomfort
Provision of open space, places of respite
Having choice where to get work done when
feeling dissatisfied with IEQ in personal space
Provision of comfortable open rooms with
essential equipment
Adjusting shadings when overheating is felt Solar shading for windows
Reduce A-C usage when feeling hot Accessible windows for passive ventilation
Walking outside when feeling
stress/discomfort inside
Pleasant walking paths around the site
Transportat
ion
Bicycling when weather allows Bicycle facilities; Changing rooms and shower
Using public transportation Access to quality transit
Waste-
reduce
Double page printing when applicable Default setting on printers
Waste-
reuse
Reusing for packaging Box in common place for reusable packaging
materials
Reusing paper that has been printed only on
one side
Provision of a paper box in printing room
Waste-
recycle
Recycling paper Recycling bins in the printing room
Recycling cardboard Recycling bins in places with more accessibility
Recycling aluminum cans and plastic bottles Recycling bins in common places
Waste –
treatment
Composting organic waste Provision of composting bins and easy access to
on-site compost facility
Separating hazardous waste such as batteries Provision of collection box for hazardous waste
Not mixing different source of waste,
categorize waste and do it correctly
Provision of bins and clear guidance on waste
categorization
117
Appendix C. Simulation Results of the Hierarchical Model
Figure 13. The hierarchical regression model setup with Winbugs and simulation results for the
model with group-level indicators (g1 and g2).
119
BIBLIOGRAPHY
AASHE (Association for the Advancement of Sustainability in Higher Education). (2015).
The Sustainability Tracking, Assessment & Rating System™. [Online] Available:
https://stars.aashe.org/pages/participate/reporting-process.html.
Abdul-Muhmin, A. G. (2007). "Explaining consumers’ willingness to be environmentally
friendly." International Journal of Consumer Studies 31(3): 237-247.
Altomonte, S. and S. Schiavon (2013). "Occupant satisfaction in LEED and non-LEED certified
buildings." Building and Environment 68(0): 66-76.
Andersen, R. V., J. Toftum, K. K. Andersen and B. W. Olesen (2009). "Survey of occupant
behavior and control of indoor environment in Danish dwellings." Energy and Buildings
41(1): 11-16.
Andersson, L., S. Shivarajan, and G. Blau. (2005). "Enacting Ecological Sustainability in the
MNC: A Test of an Adapted Value-Belief-Norm Framework." Journal of Business Ethics
59(3): 295-305.
Ajzen, I. (2005). Attitudes, Personality and Behavior. Milton-Keynes, UK: McGraw-Hill.
Ajzen, I. n.d. Constructing a theory of planned behavior questionnaire. [Online] Available:
http://people.umass.edu/aizen/pdf/tpb.measurement.pdf
Amedeo, D., R.G. Golledge, and R.J. Stimson (2009). Person-Environment-Behavior Research.
New York: The Guilford Press.
Armitage, C. J. and M. Conner. (2001). "Efficacy of the theory of planned behaviour: a meta
analytic review." British Journal of Social Psychology 40(4): 471-499.
Arup. (2015). "BUS methodology." [Online] Available: http://www.busmethodology.org.uk/.
Azizi, N. S. M. and S. Wilkinson (2015). "Motivation Factors in Energy Saving Behavior
between Occupants in Green and Conventional Buildings - Malaysia Case Study."
International Journal of Environmental Science and Development 6(7): 491-497.
Azizi, N. S. M., S. Wilkinson and E. Fassman (2015). "An analysis of occupants response to
thermal discomfort in green and conventional buildings in New Zealand." Energy and
Buildings 104: 191-198.
Bacon, M. (2013). "Occupancy analytics: a new basis for low-energy–low-carbon hospital
design and operation in the UK." Architectural Engineering and Design Management 10(1-
2): 146-163.
120
Bamberg, S., I. Ajzen, and P. Schmidt. (2003). "Choice of travel mode in the Theory of Planned
Behavior: The roles of past behavior, habit, and reasoned action." Basic and Applied Social
Psychology 25(3): 175-187.
Barker, R. G. (1976). On the Nature of the Environment. In Environmental psychology: People
and their physical settings. pp. 12-26. New York: Holt, Rinehart & Winston.
Barnes, S. B. (2007). Visual Impact: The Power of Visual Persuasion. New York: Hampton Pr.
Bartram, L., J. Rodgers, and K. Muise. (2010). "Chasing the negawatt: Visualization for
sustainable living." Computer Graphics and Applications, IEEE 30(3): 8-14.
Blight, T. S. and Coley D. A. (2013). "Sensitivity analysis of the effect of occupant behaviour on
the energy consumption of passive house dwellings." Energy and Buildings 66(2013): 183–
192.
Blyth, A. and A. Gilby (2006). Guide to Post Occupancy Evaluation. [Online] Available:
http://www.smg.ac.uk/documents/POEBrochureFinal06.pdf
Broady, M. (1966). "Social theory in architectural design." Architectural Association Quarterly
81(88).
Brown, C. & Gorgolewski, M. (2014). "Assessing occupant satisfaction and energy behaviours
in Toronto's LEED gold high-rise residential buildings". International Journal of Energy
Sector Management (8): 505-492.
Browne, S. and I. Frame (1999). "Green buildings need green occupants." Eco-Management and
Auditing 6(2): 80-85.
BSI (British Standards Institution). (2010). Sustainability of Construction Works. Sustainability
Assessment of Buildings. General Framework. BS EN 15643-1:2010.
BSI. (2014). BS EN 16309: 2014 Sustainability of construction works - assessment of social
performance of buildings - calculation methodology (+A1:2014)
Carrasco, M. (2011). "Visual attention: The past 25 years." Vision Research 51(13): 1484-1525.
CBE. (2015). Research on Indoor Environmental Quality (IEQ). [Online] Available: http://www.cbe.berkeley.edu/research/research_Indoor Environmental Quality.htm.
Chang, L. H., C. H. Tsai, and S. S. Yeh. (2014). "Evaluation of Green Hotel Guests’ Behavioral
Intention." in Advances in Hospitality and Leisure, Volume 10, J. S. Chen (ed), pp, 75- 89.
Bingley, UK: Emerald Group Publishing Limited.
Cidell, J. & A.Beata. (2009). "Spatial variation among green building certification categories:
Does place matter?" Landscape and Urban Planning 91: 142-151.
121
Cidell, J. & A. Beata. (2013). "Spatial variation among green building certification categories:
Does place matter? A rejoinder to Pushkar." Landscape and Urban Planning 112: 121-122.
Clark, C. & D. L. Uzzell. (2002). "The affordances of the home, neighborhood, school and town
center for adolescents." Journal of Environmental Psychology 22: 95-108.
Cloutier, S., J. Jambeck and N. Scott (2014). "The Sustainable Neighborhoods for Happiness
Index (SNHI): A metric for assessing a community's sustainability and potential influence on
happiness." Ecological Indicators 40: 147-152.
Cole, R. J., Z. Brown and S. McKay (2010). "Building human agency: a timely manifesto."
Building Research & Information 38(3): 339-350.
Connor, J., J. Meil, S. Baer and C. Koffler. (2012). "LCA in construction: status, impact, and
limitations." [Online] Available:
http://www3.cec.org/islandoragb/en/islandora/object/islandora%3A1107
Cranz, G., G. Lindsay, L. Morhayim and A. Lin (2014). "Communicating Sustainability: A
Postoccupancy Evaluation of the David Brower Center." Environment and Behavior 46(7):
826-847.
Daniel, L., T. Williamson, V. Soebarto and D. Chen (2014). "Learning from thermal mavericks
in Australia: comfort studies in Melbourne and Darwin." Architectural Science Review 58(1):
57-66.
Deuble, M. P. and R. de Dear (2009). Do green buildings need green occupants? Proceedings of
Healthy Buildings 2009. Syracuse, NY.
Deuble, M. P. and R. J. de Dear (2012). "Green occupants for green buildings: The missing
link?" Building and Environment 56(0): 21-27.
do Valle, P. O., E. Reis, J. Menezes and E. Rebelo (2004). "Behavioral Determinants of
Household Recycling Participation: The Portuguese Case." Environment and Behavior 36(4):
505-540.
Dunlap, R. E., K. D. Van Liere, A. G. Mertig and R. E. Jones (2000). "New Trends in Measuring
Environmental Attitudes: Measuring Endorsement of the New Ecological Paradigm: A
Revised NEP Scale." Journal of Social Issues 56(3): 425-442.
Edgerton, E., J. McKechnie, and K. Dunleavy. (2009). "Behavioral determinants of household
participation in a home composting scheme." Environment and Behavior 41(2): 151-169.
Francis, J., M. P. Eccles, M. Johnston, A. E. Walker, J. M. Grimshaw, R. Foy, E. F. S. Kaner, L.
Smith, and D. Bonetti. (2004). Constructing questionnaires based on the theory of planned
behavior: A manual for health services researchers. Centre for Health Services Research.
Friendly, M. (2016). Working with categorical data with R and the vcd and vcdExtra packages.
122
Galvao, A. B. & K. Sato (2005). Affordances in product architecture: linking technical functions
and user requirements. ASME Conference on Design Theory and Methodology. Long Beach.
GBCA (Green Building Council Australia) 2008. Green Building Council Australia - Council
House 2. [Online]. Available:
http://www.gbca.org.au/uploads/73/1609/Council_House_2.pdf
Gelman, A. and Hill, J. (2006) Data Analysis Using Regression and Multilevel/Hierarchical
Models, Cambridge University Press, New York, 252-271.
Gelman, A., Sturtz, S., Ligges, U., Gorjan, G. and Kerman, J. (2015) Package ‘R2WinBUGS’.
[Online]. Available: http://cran.r-project.org/web/packages/R2WinBUGS/R2WinBUGS.pdf
Gesche M.H., Cooper J., and Jones K. (2013) "Domestic energy consumption – What role do
comfort, habit, and knowledge about the heating system play?" Energy and Buildings
66(2013): 626-636.
Gibson, J. J. (1979). The Ecological Approach to Visual Perception. Boston: Houghton Mifflin.
Gill, Z. M., M. J. Tierney, I. M. Pegg, and N. Allan. (2010). "low-energy dwellings: the
contribution of behaviors to actual performance." Building Research and Information 38(5):
491-508.
Golan, A. and A. Fenko (2013). "Toward a Sustainable Faucet Design: Effects of Sound and
Vision on Perception of Running Water." Environment and Behavior 47(5) 570–592.
Goodsel, C. (2000). Mnemonic Meanings of the American Capitol. Culture-Meaning-
Architecture: Critical Reflections on the Work of Amos Rapoport K. D. Moore. Aldershot:
Ashgate Pub Ltd.
Gou, Z., D. Prasad and S. S.-Y. Lau (2014). "Impacts of green certifications, ventilation and
office types on occupant satisfaction with indoor environmental quality." Architectural
Science Review 57(3): 196-206.
Greaves, M., L. D. Zibarras and C. Stride (2013). "Using the theory of planned behavior to
explore environmental behavioral intentions in the workplace." Journal of Environmental
Psychology 34(0): 109-120.
Haldi, F. and Robinson D. (2011) "The impact of occupants' behaviour on building energy
demand." Journal of Building Performance Simulation 4(4):323-338
Healey, K. and Webster-Mannison, M. (2012). "Exploring the influence of qualitative factors on
the thermal comfort of office occupants." Architectural Science Review 55(3): 169-175.
Heerwagen, J. and R. Diamond (1992). Adaptations and coping: occupant response todiscomfort
in energy efficient buildings. ACEEE 1992 Summer Study Energy Efficiency Building.
Berkeley.
123
Hershberger, R. G. (1974). Designing for Human Behavior: Architecture and the Behavioral
Sciences. pp. 147-156. Stroudsburg: Hutchinson & Ross.
Hewitt, E. L., C. J. Andrews, J. A. Senick, R. E. Wener, U. Krogmann and M. Sorensen Allacci
(2016). "Distinguishing between green building occupants’ reasoned and unplanned
behaviors." Building Research & Information 44(2): 119-134.
Hillier, B. (2015). Space Is the Machine: A Configurational Theory of Architecture, CreateSpace
Independent Publishing Platform.
Hines, J. M., H. R. Hungerford, and A. N. Tomera. (1987). "Analysis and synthesis of research
on responsible environmental behavior: A meta-analysis." The Journal of Environmental
Education 18(2): 1-8.
Hoes, P., J. L. M. Hensen, M. G. L. C. Loomans, B. de Vries and D. Bourgeois (2009). "User
behavior in whole building simulation." Energy and Buildings 41(3): 295-302.
Hoffman, A. J. and R. Henn (2008). "Overcoming the Social and Psychological Barriers to
Green Building." Organization & Environment 21(4): 390-419.
Hollander, M. & Wolfe, D. A. (1973). Nonparametric Statistical Methods. New York: John
Wiley & Sons.
Hostetler, M. and K. Noiseux (2010). "Are green residential developments attracting
environmentally savvy homeowners?" Landscape and Urban Planning 94(3–4): 234-243.
Hsiao, S.-W., C.-F. Hsu, and Y.-T. Lee (2012). "An online affordance evaluation model for
product design." Design Studies 33: 126-159.
Hua, Y., Ö. Göçer and K. Göçer (2014). "Spatial mapping of occupant satisfaction and indoor
environment quality in a LEED platinum campus building." Building and Environment
79(0): 124-137.
Idler, S. (2014). Visual Appeal vs. Functionality in Web Design. [Online] Available;
http://blog.usabilla.com/visual-appeal-vs-functionality-web-design/ 2015.
ISO. (2008). ISO 15392: 2008 Sustainability in building construction - General principles.
Joffe, H. (2008). "The Power of Visual Material: Persuasion, Emotion and Identification."
Diogenes 55(1): 84-93.
Joye, Y. (2007). "Architectural lessons from environmental psychology: The case of biophilic
architecture." Review of General Psychology 11(4): 305-328.
Kaluarachchi, Y. and K. Jones (2013). "Promoting low-carbon home adaptations and behavioral
change in the older community." Architectural Engineering and Design Management 10(1-
2): 131-145.
124
Kaiser, F. G., S. Wölfing, and U. Fuhrer (1999). "Environmental attitude and ecological
behavior." Journal of Environmental Psychology 19(1): 1-19.
Kashif, A., S. Ploix, J. Dugdale and X. H. B. Le (2013). "Simulating the dynamics of occupant
behavior for power management in residential buildings." Energy and Buildings 56(0): 85-
93.
Kim, J. and R. Kaplan (2004). "Physical and Psychological Factors in Sense of Community:
New Urbanist Kentlands and Nearby Orchard Village." Environment and Behavior 36(3):
313-340.
Kim, Y.S., J.Y. Jeong, M.K. Kim, S.W. Lee, and M. Kim (2011). Personal Cognitive
Characteristics in Affordance Perception: Case Study in a Lobby. Fukuda, S. (ed.) Emotional
Engineering: Service Development. London: Springer.
Koutamanis, A. (2006). Buildings and Affordances. Design Computing and Cognition ’06. J. S.
Gero. pp. 345-364. Dordrecht, Netherlands: Springer.
Lazzarin, R. M., F. Busato and F. Castellotti (2008). "Life cycle assessment and life cycle cost of
buildings' insulation materials in Italy." International Journal of Low-Carbon Technologies
3(1): 44-58.
Leaman, A. and B. Bordass (1999). "Productivity in buildings: the ‘killer’ variables." Building
Research & Information 27(1): 4-19.
Lee, E., A. Allen, and B. Kim (2013). "Interior design practitioner motivations for specifying
sustainable materials: Applying the Theory of Planned Behavior to residential design."
Journal of Interior Design 38(4): 1-16.
Lee, G., Y. Jeong and S. Kim (2015). "The Effect of the Built Environment on Pedestrian
Volume in Microscopic Space - Focusing on the Comparison Between OLS and Poisson
Regression." Journal of Asian Architecture and Building Engineering 14(2): 395-402.
Lee, T. L. (1971). "Psychology and Architectural Determinism, Part 1." Architect's Journal
Information Library August: 253-262.
Lee, Y. S. (2007). The Relationship Between Indoor Environmental Quality and Worker
Satisfaction and Performance in LEED Certified Buildings University of Minnesota.
Lee, Y. S. and S.-K. Kim (2008). "Indoor Environmental Quality in LEED-Certified Buildings in
the U.S." Journal of Asian Architecture and Building Engineering 7(2): 293-300.
Lee, Y. S. and A. M. Malkawi (2014). "Simulating multiple occupant behaviors in buildings: An
agent-based modeling approach." Energy and Buildings 69(0): 407-416.
Liang, H. H., C. P. Chen, R. L. Hwang, W. M. Shih, S. C. Lo and H. Y. Liao (2014).
"Satisfaction of occupants toward indoor environment quality of certified green office
buildings in Taiwan." Building and Environment 72(0): 232-242.
125
Leaman, A. and Bordass. B. (1999) "Productivity in buildings: the killer variable." Building
Research & Information 27(1): 4-19.
Leaman, A., F. Stevenson and Bordass. B. (2010) "Building evaluation: practice and principles."
Building Research & Information 38(5): 564-577.
Lister, N. M. and P. Stevens (1996). "Environmental Education: Teaching Sustainability through
Design." Ontario Eco-Architecture 2: 104-117.
Ludwig, T., T. Gray and A. Rowell (1998). "Increasing recycling in academic buildings: A
systematic replication. ." Journal of Applied Behavior Analysis 31(4): 683-686.
Lynam, S. (2007). Academic architecture: buildings to communicate a pro-environmental
message. Master of Arts in Environmental Education and Communication, Royal Roads
University.
Lynch, K. (1960). The Image of the City, Cambridge MA: The MIT Press.
Ma, M. (2008). "A Semiotic Phenomenology of Visual Rhetoric: Communication and Perception
of Attributes of Cultural Sustainability in the Visual Environment of Public Housing." PhD
diss., North Carolina State University.
Mainieri, T., E. G. Barnett, T. R. Valdero, J. B. Unipan, and S. Oskamp. (1997). "Green buying:
The influence of environmental concern on consumer behavior." The Journal of Social
Psychology 137(2): 189-204.
Mann, S. (2011). Sustainable Lens: A Visual Guide. CreateSpace.
Maier, J. R. A., G. M. Fadel and D. G. Battisto (2009). "An affordance-based approach to
architectural theory, design, and practice." Design Studies 30(4): 393-414.
Meyer, D., A. Zeileis and K. Hornik (2015). vcd: Visualizing Categorical Data. R package.
version 1.4-1.
Masoso, O. T. and L. J. Grobler (2010). "The dark side of occupants’ behavior on building
energy use." Energy and Buildings 42(2): 173-177.
McCunn, L. J. and R. Gifford (2012). "Do green offices affect employee engagement and
environmental attitudes?" Architectural Science Review 55(2): 128-134.
McKenzie-Mohr D. (2000). "Promoting Sustainable Behavior: An Introduction to Community-
Based Social Marketing" Journal of Social Issues 56(3): 543–554
Milfont, T. L. and J. Duckitt (2010). "The environmental attitudes inventory: A valid and reliable
measure to assess the structure of environmental attitudes." Journal of Environmental
Psychology 30(1): 80-94.
126
Millera, W., Buysb L., and Bellc J. (2012) "Performance evaluation of eight contemporary
passive solar homes in subtropical Australia." Building and Environment 56(2012): 57–68.
Mitchell, A. (2006). "The Hidden Curriculum: An Exploration onto the Potential for Green
Buildings to Silently Communicate a Pro-environmental Message." Master thesis, University
of British Columbia.
Molla, A., A. Abareshi, and V. Cooper. (2014). "Green IT beliefs and pro-environmental IT
practices among IT professionals." Information Technology & People 27(2): 129-154.
MSUIPF (2016). "LEED certification". [Online]. Available:
http://ipf.msu.edu/green/practices/leed-certification.html
MSUsustainability (2016). "Sustainability, campus". [Online]. Available:
http://sustainability.msu.edu/campus/index.php
MSUtoday (2014). "MSU ‘Green’ Efforts Earn National Recognition". [Online]. Available:
http://msutoday.msu.edu/news/2014/msu-green-efforts-earn-national-recognition/
Neisser, U. (1976). Cognition and reality: principles and implications of cognitive psychology.
San Francisco: Freeman.
Norman, D. (1988). The Design of Everyday Things. New York: Basic Books.
O'Brien, W., and H. B. Gunay. (2014). "The contextual factors contributing to occupants'
adaptive comfort behaviors in offices – A review and proposed modeling framework."
Building and Environment 77(0): 77-87.
O'Callaghan, B., H. J. Green, R. A. Hyde, D. Wadley and A. Upadhyay (2012). "Exploring the
influence of housing design and occupant environmental attitudes on energy and water
usage." Architectural Science Review 55(3): 176-185.
O'Callaghan, B. and R. Hyde (2011). Evaluating the Impact of Sustainable House Design and
Environmental Attitudes on Resource Usage. 6th World Sustainable Building Conference.
Helsinki, Finland, Finnish Association of Civil Engineers R/L and Vtt Technical Research
Centre of Finland.
Orr, D. (1999). Architecture as pedagogy. Reshaping the Built Environment: Ecology, Ethics,
and Economics C. J. Kibert. Washington DC: Island Press.
Ouf, M., M. Issa and S. Mallory-Hill (2013). An Investigation of Indicators, Metrics, and
Methods Used to Measure Green Buildings’ Occupancy and Usage. Portugal Sustainable
Building 2013, Guimarães, Portugal, October 30-September 1, 2013.
Oskamp, S. (1991). Attitudes and Opinions, 2nd Edition. New York: Pearson.
Owens, S. and Driffill L. (2008) "How to change attitudes and behaviror in the context of
energy." Energy policy 36(12): 4412–4418
127
Palmer, M. and V. Finlay (2003). Faith in Conservation: New Approaches to Religions and the
Environment. World Bank Publications.
Paudel, A. M. and P. Kreutzmann (2015). "Design and performance analysis of a hybrid solar
tricycle for a sustainable local commute." Renewable and Sustainable Energy Reviews 41:
473-482.
Peponis, J., Z. Craig and K. Yoon (1990). "Finding the Building in Wayfinding" Environment
and Behavior 22: 555-590.
PsychologyDictionary. (2016). "What is architectural determimism?" [Online]. Available:
http://psychologydictionary.org/architectural-determinism/.
Princetion Review. (2015). The Princeton Review's Guide to 353 Green Colleges. [Online].
Available: http://www.princetonreview.com/college-rankings/green-guide/download
Ragsdale, J. D. (2011). Compelling Form: Architecture as Visual Persuasion, Cambridge:
Scholars Publishing.
Rapoport, A. (1990). Environmental Meaning: Preliminary Considerations for a Nonverbal
Communication Approach. The Meaning of the Built Environment: A Nonverbal
Communication Approach. A. Rapoport, University of Arizona Press: 55-86.
Rashid, M., K. Spreckelmeyer and N. J. Angrisano (2012). "Green buildings, environmental
awareness, and organizational image." Journal of Corporate Real Estate 14(1): 21-49.
Revelle, W. (2011). An overview of the psych package. .
Revelle, W. (2014). psych: Procedures for Personality and Psychological Research.
Northwestern University, Evanston, Illinois, USA. [Online]. Available: http://CRAN.R-
project.org/package=psych Version = 1.4.8.
Rhodes, R. E., M. R. Beauchamp, M. Conner, G.-J. de Bruijn, N. Kaushal and A. Latimer-
Cheung (2014). "Prediction of Depot-Based Specialty Recycling Behavior Using an
Extended Theory of Planned Behavior." Environment and Behavior 47(9): 1001-1023.
Roslin, M. (1996). Making connections Proceedings of Evolving Environmental Ideals, 14th
Conference of the International Association for People–Environment Studies, Stockholm.
Roth, L. (1993). Understanding Architecture: Its Elements, History, And Meaning, Boulder:
Westview Press.
Ruskin, J. (1989). The Seven Lamps of Architecture. New York: Dover Publications.
Sakate, D. M. and D. N. Kashid (2014). A deviance-based criterion for model selection in GLM.
Statistics 48: 34-48.
128
Shiever, S., and Boettcher, B. (2011). Real solutions for integrating sustainability as a learning
tool. Chicago, IL: School & College Building Expo. [Online] Available from http://prezi.com
Singh, A., M. Syal, S. C. Grady and S. Korkmaz (2010). "Effects of Green Buildings on
Employee Health and Productivity." American Journal of Public Health 100(9): 1665-1668.
Steg, L., and C. Vlek. (2009). "Encouraging pro-environmental behavior: An integrative review
and research agenda." Journal of Environmental Psychology 29(3): 309-317.
Stern, P. C. (2000). "New environmental theories: Toward a coherent theory of environmentally
significant behavior." Journal of Social Issues 56(3): 407-424.
Tan, B. C. (2011). "The role of perceived consumer effectiveness on Value-Attitude-Behavior
model in green buying behavior context." Australian Journal of Basic & Applied Sciences
5(12): 102-117.
Tang, Z., X. Chen and J. Luo (2011). "Determining Socio-Psychological Drivers for Rural
Household Recycling Behavior in Developing Countries: A Case Study From Wugan,
Hunan, China." Environment and Behavior 43(6): 848-877.
Taylor, S., and P. Todd. (1995). "An integrated model of waste management behavior: A test of
household recycling and composting intentions." Environment and Behavior 27(5): 603-630.
Tweed, C. (2001). Highlighting the affordances of designs. Vries, B., J. Leeuwen, and H. Achten
(eds.) Computer Aided Architectural Design Futures. Proceedings of the Ninth International
Conference held at the Eindhoven University of Technology, Eindhoven, The Netherlands,
on July 8–11, 2001. Dordrecht, Netherlands: Springer.
Upadhyay, A., R. Hyde and D. Wadley (2010). Towards a new paradigm for the assessment of
sustainable housing: An environmental Quality of Life (QoLe) approach. 44th Annual
Conference of the Australian and New Zealand Architectural Science Association
(ANZAScA 2010). New Zealand, UNITEC Institute of Technology.
U.S. EPA. (2015). National Awareness of ENERGY STAR® for 2014: Analysis of 2014 CEE
Household Survey. EPA Office of Air and Radiation, Climate Protection Partnerships
Division.
U.S. EPA. (2016). Green Building [Online]. Available:
https://archive.epa.gov/greenbuilding/web/html/
USGBC (2010). Green Building and LEED Core Concepts Guide: Second Edition. Washington,
DC: U.S. Green Building Council.
USGBC (2011). Best of Green Schools 2011 List Recognizing Leadership in Creating
Sustainable Learning Environments.
USGBC (2015). Infographic: LEED in the World. [Online]. Available:
http://www.usgbc.org/articles/infographic-leed-world.
129
USGBC (2016a). Module 3: LEED Process & Project Surroundings. [Online]. Available:
http://www.usgbc.org/education/sessions/all-inclusive-leed-v4-green-associate-exam-
prep/module-3-leed-process-project-sur
USGBC (2016b). Michigan State University Brody Hall [Online]. Available:
http://www.usgbc.org/projects/michigan-state-university-brody-hall.
USGBC (2016c). Innovation: Green Building Education [Online]. Available:
http://www.usgbc.org/credits/new-construction-core-and-shell-schools-new-construction-
retail-new-construction-healthca-56.
Valkila, N., and A. Saari. 2013. "Attitude–behavior gap in energy issues: Case study of three
different Finnish residential areas." Energy for Sustainable Development 17(1): 24-34.
Ward Thompson, C. (2013). "Activity, exercise and the planning and design of outdoor spaces."
Journal of Environmental Psychology 34: 79-96.
Williams, K., and Dair C. 2007. "A framework of sustainable behaviours that can be enabled
through the design of neighbourhood-scale developments." Sustainable Development 15(3):
160–173.
Wu, D. L., A. DiGiacomo and A. Kingstone (2013). "A Sustainable Building Promotes Pro-
Environmental Behavior: An Observational Study on Food Disposal." PLoS ONE 8(1):
e53856.
Wu, S. R., M. Green, J. Chen, A. Yang, and Y. Tang. (2015). Green building design and visual
persuasion on occupants’ pro-environmental behaviors. In proceedings of the 49th
International conference of the Architectural Science Association, pp. 133-142, December 2-
4, 2015, Melbourne.
Wu, S. R., M. Greaves, J. Chen., and S. Grady. (2016). Green buildings need green occupants: A
research framework through the lens of the Theory of Planned Behavior. Architectural
Science Review. http://dx.doi.org/10.1080/00038628.2016.1197097
Zeiler, J. (2006). Inquiry by Design. Revised edition. New York: W.W. Norton & Company.
Zeiler, W., D. Vissers, R. Maaijen and G. Boxem (2013). "Occupants’ behavioral impact on
energy consumption: ‘human-in-the-loop’ comfort process control." Architectural
Engineering and Design Management 10(1-2): 108-130.
Zuo, J., and Z. Y. Zhao. 2014. " Green Building research–current status and future agenda: A
review." Renewable and Sustainable Energy Reviews 30(0): 271-281.