90
Regional Office for Asia and the Pacific Green jobs mapping study in Malaysia

i
Regional Office for Asia and the Pacific
Green jobs mapping study in Malaysia

ii

iii
Green jobs mapping study in Malaysia
Regional Office for Asia and the Pacific

iv
Copyright © International Labour Organization 2014
First published 2014
Publications of the International Labour Office enjoy copyright under Protocol 2 of the Universal Copyright
Convention. Nevertheless, short excerpts from them may be reproduced without authorization, on condition that
the source is indicated. For rights of reproduction or translation, application should be made to ILO Publications
(Rights and Permissions), International Labour Office, CH-1211 Geneva 22, Switzerland, or by email:
[email protected]. The International Labour Office welcomes such applications.
Libraries, institutions and other users registered with reproduction rights organizations may make copies in
accordance with the licences issued to them for this purpose. Visit www.ifrro.org to find the reproduction rights
organization in your country.
Green jobs mapping study in Malaysia / ILO Regional Office for Asia and the Pacific. - Bangkok: ILO, 2014
xiv, 75 p.
ISBN: 9789221285434 (print)
ISBN: 9789221285441 (web pdf)
ISBN: 9789221289661 (CD-ROM)
ILO Regional Office for Asia and the Pacific
green jobs / environmental protection / skill / occupational change / skilled worker / retraining / training needs /
Malaysia
13.01.3
ILO Cataloguing in Publication Data
The designations employed in ILO publications, which are in conformity with United Nations practice, and the
presentation of material therein do not imply the expression of any opinion whatsoever on the part of the
International Labour Office concerning the legal status of any country, area or territory or of its authorities, or
concerning the delimitation of its frontiers.
The responsibility for opinions expressed in signed articles, studies and other contributions rests solely with
their authors, and publication does not constitute an endorsement by the International Labour Office of the
opinions expressed in them.
Reference to names of firms and commercial products and processes does not imply their endorsement by the
International Labour Office, and any failure to mention a particular firm, commercial product or process is not a
sign of disapproval.
ILO publications and electronic products can be obtained through major booksellers or ILO local offices in
many countries, or direct from ILO Publications, International Labour Office, CH-1211 Geneva 22,
Switzerland, or ILO Regional Office for Asia and the Pacific, 11th Floor, United Nations Building, Rajdamnern
Nok Avenue, Bangkok 10200, Thailand, or by email: [email protected]. Catalogues or lists of new
publications are available free of charge from the above address, or by email: [email protected]
Visit our website: www.ilo.org/publns or www.ilo.org/asia
Cover photos: © ILO; © PEMANDU
Printed in Thailand

i
Foreword
Climate change and environmental degradation pose a severe threat to sustainable economic
development in many parts of the Asia-Pacific region including Malaysia. In this regard, the
government of Malaysia has committed to reducing greenhouse gases (GHG) up to 40 per
cent in terms of emission intensity relative to gross domestic product (GDP) by the year 2020
compared to 2005. The transition to a green economy is progressing with the implementation
of various environment and climate change related policies and measures to drive greater
environmentally sustainable economic growth in Malaysia. This structural change towards a
greener and more sustainable economic growth path will create demand for new green
technologies, green skills and green jobs and will have implications on the employment and
labour market dynamics in Malaysian economic sectors. It is important to ensure that any
new jobs created for workers in these environment-related sectors and green sub-sectors are
decent and sustainable and that existing decent work deficits are addressed.
This publication was produced under the International Labour Organization’s (ILO) Green
Jobs Programme for Asia and the Pacific which has created the momentum for developing
new and successful partnerships between the ILO and the Ministry of Human Resources
(MoHR) and the Ministry of Energy, Green Technology and Water (KeTTHA) to promote
green jobs throughout the country. The mapping study was conducted to estimate and identify
green jobs in Malaysia and identified potential challenges to developing a greener economy
with green jobs and decent work. The report provides ILO constituents with the information
and statistical data necessary to assess the economic and employment impacts of a green
development strategy and provides key information on the sectors which promote
environmentally-friendly decent work (green jobs). It includes policy recommendations for
the Government and social partners to identify entry points for further green job creation that
can drive a just transition towards a green economy.
The study is part of the ILO’s wider efforts to develop the research and analysis capacities of
constituents in the Asia and Pacific region in regards to green jobs and green skills. Similar
green job mapping studies have also been undertaken in Bangladesh, Indonesia and the
Philippines and it is envisioned that the results will lay the foundation for further economic
studies on the labour market and the development of green skills programmes at the national
level.
ILO Regional Office for Asia and the Pacific

ii
iii
Contents
Foreword .................................................................................................................................................. i
Contents………………………………………………………………………………………………..iii
Abbreviations ........................................................................................................................................ vii
1. Introduction ......................................................................................................................................... 1
1.1 The purpose of the report .............................................................................................................. 1
1.2 Defining green jobs ....................................................................................................................... 1
1.3 Structure of the report ................................................................................................................... 3
2. An overview of the approach .............................................................................................................. 4
2.1 Preparing sector profiles ............................................................................................................... 5
2.2 Developing environment screening criteria .................................................................................. 5
2.3 Decent work criteria ...................................................................................................................... 6
2.4 Estimating employment in green sectors/sub-sectors ................................................................... 8
2.5 How to estimate green jobs? ....................................................................................................... 10
2.6 Challenges and assumptions ....................................................................................................... 11
3. The economy and employment structure in Malaysia ...................................................................... 12
3.1 Introduction ................................................................................................................................. 12
3.2 An overview of the status of employment maintained in the economy ...................................... 12
3.3 Employment profile of the different economic sectors ............................................................... 13
3.4 The informal sector ..................................................................................................................... 14
4. Responding to a changing climate while ensuring sustainable development ................................... 17
4.1 The environmental goods and services industry in Malaysia ..................................................... 20
5. List of key economic sectors ............................................................................................................. 24
6. Proposed key economic sectors and industries for further characterization of green jobs ............... 25
6.1 Agriculture, including fishery and forestry ................................................................................. 25
6.1.1 Importance of the sector and key trends ...................................................................... 25
6.1.2 Key trends towards sustainability ................................................................................ 26
6.1.3 Identified sub-sectors and screening criteria ................................................................ 28
6.1.4 Estimating environment-related employment .............................................................. 29
6.1.5 Decent work ................................................................................................................. 30
6.1.6 Estimating green jobs ................................................................................................... 31
6.2 Energy ......................................................................................................................................... 32
6.2.1 Importance of the sector and key trends ...................................................................... 32

iv
6.2.2 Key trends towards sustainability ................................................................................ 33
6.2.3 Identified sub-sectors and screening criteria ................................................................. 33
6.2.4 Estimating environment-related employment ............................................................... 34
6.2.5 Decent work .................................................................................................................. 36
6.2.6 Estimating green jobs .................................................................................................... 36
6.3 Water and wastewater management ............................................................................................ 37
6.3.1 Importance of the sector and key trends ....................................................................... 37
6.3.2 Key trends towards sustainability ................................................................................. 39
6.3.3 Identified sub-sectors and screening criteria ................................................................. 40
6.3.4 Estimating environment-related employment ............................................................... 41
6.3.5 Decent work .................................................................................................................. 42
6.3.6 Estimating green jobs .................................................................................................... 42
6.4 Solid waste management ............................................................................................................. 42
6.4.1 Importance of the sector and key trends ....................................................................... 42
6.4.2 Key trends towards sustainability ................................................................................. 44
6.4.3 Identified sub-sectors and screening criteria ................................................................. 45
6.4.4 Estimating environment-related employment ............................................................... 46
6.4.5 Decent work .................................................................................................................. 46
6.4.6 Estimating green jobs .................................................................................................... 47
6.5 Transport ..................................................................................................................................... 47
6.5.1 Importance of the sector and key trends ....................................................................... 47
6.5.2 Key trends towards sustainability ................................................................................. 49
6.5.3 Identified sub-sectors and screening criteria ................................................................. 50
6.5.4 Estimating environment-related employment ............................................................... 51
6.5.5 Decent work .................................................................................................................. 51
6.5.6 Estimating green jobs .................................................................................................... 51
6.6 Construction ................................................................................................................................ 52
6.6.1. Importance of the sector and key trends ....................................................................... 52
6.6.2 Focus on buildings ........................................................................................................ 53
6.6.3 Key trends toward sustainability ................................................................................... 53
6.6.4 Estimating environment-related employment ............................................................... 56
6.6.5 Decent work .................................................................................................................. 58
6.6.6 Estimating green jobs .................................................................................................... 60

v
7. Conclusion and recommendations .................................................................................................... 61
8. Bibliography ..................................................................................................................................... 63
Annex I. Sub-sector environmental screening indicators green jobs mapping study in Malaysia ........ 65
Annex II. Summary of green jobs estimations from the green jobs mapping study in Malaysia ....... 723
Tables
Table 1. Sustainable sub-sectors in agriculture sector and the environmental screening criteria ......... 28
Table 2. Sustainable sub-sectors in energy and the environmental screening criteria .......................... 34
Table 3. Estimated jobs from government investments in renewable energy and energy efficiency .. 35
Table 4 Wages of workers under the electricity, gas, steam and air conditioning supply sector .......... 36
Table 5. Development expenditure for water infrastructure and utilities from 2001–10...................... 38
Table 6. Sustainable sub-sectors in water sectors and environmental screening criteria ...................... 40
Table 7. Sustainable sub-sectors in solid waste management and environmental screening criteria ... 45
Table 8. Malaysia air emission loads and pollutant sources 2007 ........................................................ 50
Table 9. Sustainable sub-sectors in transport sector and environmental screening criteria .................. 51
Table 10. Value of construction work done by project owners and construction sub-sectors in 2010 . 53
Table 11. Sustainable sub-sectors in construction sector and environmental screening criteria .......... 56
Table 12. Construction sector jobs forecast (Frost & Sullivan) ............................................................ 58
Table 13. Number of establishments, gross outputs and employment by size group 2010 .................. 59
Table 14. Salaries and wages of full time employees by category of workers 2010 ............................ 59
Figures
Figure 1. Definition of green jobs ........................................................................................................... 2
Figure 2. Poverty line incomes for Malaysia in Malaysian ringgit (MYR) ............................................ 8
Figure 3. Characterization of green jobs ................................................................................................. 9
Figure 4. Steps to characterize and estimate green jobs.......................................................................... 9
Figure 5. Estimates of employed persons by industry in Malaysia, 2007–11. ..................................... 14
Figure 6. Informal employment rebounded in 2010. ............................................................................ 15
Figure 7. Environmental industries in Malaysia ................................................................................... 21
Figure 8. Malaysian environmental market 2009 ................................................................................. 22
Figure 9. Emerging segments in environmental industry 2009 (MYR millions) .................................. 23

vi
Figure 10. Total energy generation in 2011 .......................................................................................... 35
Figure 11. Percentage distribution of key indicators by type 2010 ....................................................... 47
Figure 12. New registered motor vehicles by type in 2010 .................................................................. 48
Figure 13. Current growth trends in private vehicle ownership in Malaysia ........................................ 48
Figure 14. Performance of the construction sub-sector by gross output 2005–10 ................................ 52
Figure 15. Employment by sub-sector 2010 ........................................................................................ 57

vii
Abbreviations
ACEM Association of Consulting Engineers Malaysia
C&E consulting and engineering
CBD Convention on Biological Diversity
CCD Convention to Combat Desertification
CO2 carbon dioxide
DNSWM Department of National Solid Waste Management
DySAM Dynamic Social Accounting Matrix
EE energy efficiency
EGS environmental goods and services
EMU Electric Multiple Unit
EPPs entry point projects
EQ environmental quality
ETP Economic Transformation Programme
FAMA Federal Agricultural Marketing Authority
FIT feed-in tariff
FMU Forest Management Unit
GBI green building index
GDP gross domestic product
GHG greenhouse gas
GNI gross national income
GW gigawatt
GWh gigawatt-hours
HS Codes Harmonized System Codes
IAEA International Atomic Energy Association
IGES Institute for Global Environmental Strategies
ILO International Labour Organization
IN innovation
ITT integrated transport terminal
ITTO International Tropical Timber Organization
JKR JabatanKerja Raya Purtajaya
JPM Jabatan Perdana Menteri
KeTTHA Ministry of Energy, Green Technology and Water

viii
KPIs Key Performance Indicators
LAs local authorities
LCA life cycle assessment
LNG liquefied natural gas
LRT Light Rail Transit
MC&I Malaysian Criteria and Indicators
MI mixed income
MNRE Ministry of Natural Resources and Environment
MoHR Ministry of Human Resources
MoSTE Ministry of Science, Technology and the Environment
MPOB Malaysian Palm Oil Board
MR material and resources
MTCS Malaysian Timber Certification Scheme
MTUC Malaysian Trades Union Congress
MW megawatt
MWh megawatt hour
MYR Malaysian ringgit
NCS National Competency Standards
NEEMP National Energy Efficiency Master Plan
NEM New Economic Model
NGOs non-governemental organizations
NKEAs National Key Economic Areas
NKRAs National Key Results Areas
NOSS National Occupational Skills Standards
NSCCC National Steering Committee on Climate Change
NWRP National Water Resources Policy
OSH occupational safety and health
PAM Pertubuhan Akitek Malaysia
PFI Private Finance Initiative
PLI poverty line income
PRFs permanent reserved forests
PTC Public Transport Commission
PV photovoltaic
ix
RAP road area pricing
RDF refuse derived fuel
RSPO Roundtable on sustainable palm oil
SALM Skim Akreditasi Ladang Malaysia (Malaysian Farm Accreditation Scheme)
SEDA Sustainable Energy Development Authority
SHE safety, health and environment
SM site planning and management
SOPs Standard Operating Procedures
SPAN Suruhanjaya Perkhidmatan Air Negara
SRIs strategic reform initiatives
SWM solid waste management
SWPCM Act Solid Waste and Public Cleansing Management Act 2007
TNB Tenaga Nasional Berhad
TWh terawatt-hours
UNEP United Nations Environment Programme
UNFCCC United Nations Framework Convention on Climate Change
UNFF United Nations Forum on Forests
WE water efficiency

x

1
1. Introduction
This desk research report undertaken by the Institute for Global Environmental Strategies
(IGES), in collaboration with the International Labour Organization (ILO), is the initial step
in mapping existing green jobs in the Malaysian labour market based on available published
data from government as well as non-government sources. This study will contribute to
building a common understanding on the linkages between economic, social and
environmental policies in Malaysia including through a tripartite consultation process at all
stages of project implementation. The mapping study report will bring qualitative and
quantitative information on the number and types of green jobs in key sectors of the economy
which will be important to prepare for the following step of the green jobs research
programme in Malaysia. Next steps will include, inter alia, the building and use of a Green
Dynamic Social Accounting Matrix (DySAM) and the calculation of the employment and
income distribution impacts of environment driven policies in Malaysia.
1.1 The purpose of the report
The main purpose of the desk research is to propose a conceptual framework for the
characterization of green jobs in Malaysia and the selection of technical indicators in the
environment and labour fields respectively that are to be used for this process. The report
shall bring an initial estimation of direct green jobs at the country level as well as a review of
the decent work challenges that may be linked to green jobs. The ILO methodology was used
for the mapping of green jobs.
The desk research covers the specific following tasks:
Propose a list of key priority economic sectors and industries for the further
characterization of green jobs.
Review and propose possible indicators for the characterization of green jobs in selected
economic sectors and industries, including green products, services and practices.
Compile existing information on the numbers of green jobs by selected sector on the basis
of the identified indicators for characterizing green jobs.
Make recommendations for the conduct of the proposed establishment surveys.
1.2 Defining green jobs
The International Labour Organization and United Nations Environment Programme (UNEP)
define green jobs as the direct employment in economic sectors and activities, which reduce
their negative environmental impacts, ultimately resulting in levels that are sustainable
(reference). This includes but is not limited to jobs that work towards protecting ecosystems
and biodiversity, reducing energy, materials and water consumption, de-carbonizing the
economy and minimizing all forms of waste and pollution. Moreover, a job is to be a green
job if it is decent work in the sense of the ILO.
The above definition is a “framework” definition for green jobs which will require further
refinements at the national level and the setting of technical indicators in the environment and
1

2
labour fields for further characterization. The present report will propose environment-related
indicators and labour-based indicators to be considered by ILO constituents and other
partners for a country-based approach on qualification and quantification of green jobs.
Figure 1. Definition of green jobs
Source: ILO, 2010
A green job must provide decent work as well as contribute directly to lessen environmental
impacts, see figure 1 above. Green jobs are identified by applying screening criteria to
employment and economic data. More precisely, the screening criteria to be applied for the
identification of green jobs across the economy relate to the following two dimensions of
these jobs:
Environmentally sustainable activities, products and services.
Conditions for decency of work.
Environmentally sustainable activities, products and services fall into one or more of the
following six groups:
Mitigation actions. These involve activities, products and services to reduce emissions of
greenhouse gases (GHGs) by sources or enhance their removal from the atmosphere by
sink.1 Mitigation actions include enhancing renewable energy supplies, promoting energy
efficiency and energy conservation, prevention of direct emissions of GHGs through the
prevention of deforestation, protection of natural carbon sinks, etc.
Adaptation to climate change and disaster risk management. Actions include coastal
management, adaptation of agricultural practices to climate change, sustainable fisheries
and all forms of activities, structural and non-structural measures, geared to avoid or to
limit adverse impacts of hazards.
Biodiversity, desertification, ecosystem services, and environmental quality based
services. All activities linked to protecting ecosystems and habitats, and prevention of land
degradation from human activities.
Water and natural resource management. Products and services that promote water
efficiency, the sustainable use of wetlands and other systems, conservation of wildlife,
sustainable practices in agriculture including organic farming and crop rotations,
sustainable forestry and sustainable practices in forestry management among others.
1 A sink refers to forests, vegetation or soils that can absorb CO2.
Environment
related jobs Decent jobs Green
jobs

3
Pollution prevention and control. Products and services that reduce or eliminate the
creation of waste materials; collect, reuse, remanufacture, recycle, or compost waste
materials or wastewater.
Environmental compliance, education and training, and public awareness. These are
products and services that:
o enforce environmental regulations;
o provide education and training related to green technologies and practices; and
o increase public awareness of environmental issues.
1.3 Structure of the report
This report is structured as follows:
An overview of the approach.
An overview of the Malaysian economy and structure of employment.
An overview of the socio-economic implications of climate change and sustainable
development agenda in Malaysia.
An overview of the key priority economic sectors and industries for the further
characterization of green jobs.
Review of possible indicators for the characterization of green jobs in selected economic
sectors and industries, including review of possible green products, services and practices.
Compilation of existing information on the number of green jobs by selected sector on the
basis of the identified indicators for characterizing green jobs.
Some recommendations for the conduct of the proposed establishment surveys.

4
2. An overview of the approach
While green jobs exist and can further flourish in all sectors and industries, the desk research
will be limited to selected key priority sectors where the potential for green jobs is high; the
process can be replicated to cover the sectors not included here. Similarly, the consultations
with resource persons to further understand and acquire data on existing green jobs or green
jobs screening criteria will be done by clusters to cover more sectors with near-like
circumstances efficiently. The approach of how to estimate existing green jobs will be
streamlined so transferability to sectors not considered in the desk research will not be a
problem.
For this desk research, a preliminary look on the general terms of linkages between the
environment, including implications of climate change and the economy will be reviewed to:
o Propose a list of key economic sectors and industries for the further
characterization of green jobs.
o Propose clusters of key industries and economic sectors for the conduct of focus
group discussions and the conduct of establishment surveys.
The method for the subsequent tasks is explained in more detail, specifically:
The process by which sectors/sub-sectors were identified.
How the screening criteria were developed.
How environment-related employment was estimated, given the available data
disclosing assumptions and key caveats to the job estimates.
How decent work was defined and its corresponding criteria were developed.
The preliminary results from the desk research will be substantiated by stakeholder
consultations and actual surveys later on. The subsequent sections in this report are structured
as follows:
Task Description Output
Task 1 Understanding the overall structure of the domestic
economy and total employment
Overview of the economic structure
Task 2 Identifying environment-related economic activity and
employment
Sector profiles including total
employment generated by the sector
Task 3 Developing screening criteria for identifying economic
activities that support “core” environment-related
employment
Screening criteria and list of identified
“core” sectors
Task 4 Estimating “core” environmental employment using the
screening criteria
Estimates of jobs in “core” sectors
Task 5 Screening “core” jobs using decent work criteria Decent work criteria and estimates of
“green jobs”
Task 6 Summary
Note: Tasks 2 to 5 will be done for all sectors. The environmental screening criteria will be different depending
on the sector being analysed, but the decent work criteria is applicable to all sectors.

5
2.1 Preparing sector profiles
Based on available economic and employment statistics, identified key priority sectors for
climate change adaptation and mitigation, and other relevant resources, this task considers the
size and distribution of environment-related employment in the Malaysian context to:
Identify economic sectors and activities that have strong links to the environment; and
Prepare sector profiles explaining the structure of each sector of interest.
2.2 Developing environment screening criteria
The screening criteria attempt to cover a comprehensive set of environmental impacts
including:
Mitigation actions. These involve human interventions to reduce emissions of GHGs
by sources or enhance their removal from the atmosphere by sinks. Mitigation actions
include enhancing renewable energy supply, promoting energy efficiency and energy
conservation, prevention of direct emissions of GHGs through the prevention of
deforestation, protection of natural carbon sinks, etc.
Adaptation to climate change and disaster risk management. Actions include
coastal management, adaptation of agricultural practices to climate change,
sustainable fisheries and all forms of activities, structural and non-structural measures,
geared to avoid or to limit adverse impacts of hazards.
Biodiversity, desertification, ecosystem services, and environmental quality
based services. All activities linked to protecting ecosystems and habitats, and
prevention of land degradation from human activities.
Water and natural resource management. Products and services that promote
water efficiency, sustainable use of wetlands and other systems, conservation of
wildlife, sustainable practices in agriculture including organic farming and crop
rotations, sustainable forestry and sustainable practices in forestry management
among others.
Pollution prevention and control. Products and services that reduce or eliminate the
creation of waste materials; collect, reuse, remanufacture, recycle, or compost waste
materials or wastewater.
Environmental compliance, education and training, and public awareness. These
are products and services that:
o enforce environmental regulations;
o provide education and training related to green technologies and practices; and
o increase public awareness of environmental issues.
Screening criteria of different types covering the above mentioned environmental indicators
are applied sequentially to the data gathered for each sector.
The first screening criterion is compliance with international and/or national
environmental laws. Activities and enterprises whose performance is not consistent
with national laws on pollution control, technologies, etc. cannot be considered to be
providing “core environmental” jobs and need to be excluded.

6
The second step is to consider implementation of voluntary environmental
standards and associated management systems linked to the production of green
goods and services (e.g. jobs sustained by forestry management practice that are not
consistent with internationally or nationally recognized standards of good forest
stewardship cannot be considered to be ‘core’ environmental jobs).
The third step is to screen for the existence of government and/or public/private
strategic plans and targets for environmental management. These can signal
national aspirations and desired direction of travel (e.g. plans for promotion of solar
photovoltaic (PV) and conversion of public transport fleets to alternative fuels).
The fourth step is to consider performance benchmarks or minimum performance
thresholds for industries or sectors established by the government and/or private
sector (e.g. examine energy intensity (megawatt hour per job, MWh/job), and include
in core employment only those jobs associated with activities that fall within the top
quartile). In this instance, in circumstances where national or voluntary standards and
codes are absent, the analyst is making a proposal for what constitutes “good”
environmental performance. This contrasts with the steps above where a standards-
based approach is being followed.
The fifth step is to consider activity-based approaches, whereby activities are
considered as providing core environmental jobs because of their low resource use
and/or positive environmental impacts (e.g. bee-keeping/honey production, climate
change adaptation programmes).
The above methodology is being followed with the understanding that, ideally, a whole life
cycle assessment (LCA) would be needed to make informed decisions. However, the
complexity of this procedure and the costs involved makes the undertaking of LCAs clearly
not a realistic option on a large scale basis. The LCA approach assesses the environmental
aspects and potential impacts associated with a product, process or service to avoid a narrow
outlook on environmental impacts by:
compiling an inventory of relevant energy and material inputs and environmental
releases;
evaluating the potential environmental impacts associated with identified inputs and
releases; and
interpreting the results to help make a more informed decision.
2.3 Decent work criteria
Decent work has been defined by the ILO and endorsed by the international community as
being productive work for men and women in conditions of freedom, equity, security and
human dignity. Decent work involves opportunities for work that are productive and deliver a
fair income; provide security in the workplace and social protection for workers and their
families; offer better prospects for personal development and encourage social integration;
give people the freedom to express their concerns, to organize and to participate in decisions
that affect their lives; and guarantee equal opportunities and equal treatment for all.

7
In Malaysia, the Decent Work Agenda has well been articulated by the Ministry of Human
Resources (MoHR) under its deliverables within the national developmental policies.
MoHR’s strategic objectives 2007–10 articulated the dimensions of decent work:
to create employment opportunities and ensuring workers’ rights;
to maintain harmonious industrial relations environment;
to resolve industrial disputes fairly and equitably;
to implement dynamic occupational safety and health practices;
to develop nationwide competitive manpower; and
to provide social safety network.
The labour statistics consider the following elements of decent work indicators for
monitoring and assessing progress on the Decent Work Agenda:
employment opportunities;
adequate earnings and productive work;
decent hours;
work to be abolished;
stability and security of work;
equal opportunity and treatment in employment;
safe work environment;
social security;
social dialogues, workers and employers representation; and
economic and social context for decent work.
There were more than 600 registered unions in Malaysia as of 2010.2 Generally, trade unions
and employers’ organizations participate in tripartite discussions with the Government on
labour related matters. Amendments to the Employment Act of 1955, Industrial Relations Act
of 1967, the Trade Union Act of 1959, among other important policies and legislations aimed
to improve the welfare of Malaysian workers, are discussed following a tripartite approach.
One of the contentious issues before was the demand of unions for minimum wage
legislation. This was recently resolved with the announcement of minimum wage policy by
the Prime Minister on 1 May 2012. The minimum wage was set at Malaysian ringgit (MYR)
900 per month (MYR4.33 per hour) for Peninsular Malaysia, and MYR800 per month
(MYR3.85 per hour) for East Malaysia, consisting of Sabah, Sarawak, and Federal Territory
of Labuan. Some allowances or fixed cash payments are allowed to be considered in the
calculation for a minimum wage so as not to burden employers with a big jump in basic
salaries, and to ensure employees do not lose out on existing benefits.
The national minimum wage policy is part of the Strategic Reform Initiatives (SRIs) for
Human Capital Development under the Economic Transformation Programme (ETP) aiming
to enable Malaysia’s economic transformation by addressing the issue of over-dependence on
cheap unskilled/low-skilled foreign workers, ensuring more jobs to the locals, and promoting
industries’ up-scaling in terms of value added, technology, productivity, business models, etc.
The minimum wage policy is also seen as part of the government’s plan to transform
2 Malaysian Trades Union Congress (MTUC). 2010. Memorandum to the Minister of Human Resources on the need to
develop strategies to prevent exploitation and poverty, presented during the World Day for decent work on 7 October.
8
Malaysia into a high-income nation by 2020, which would require the average annual income
to rise to the equivalent of US$15,000.
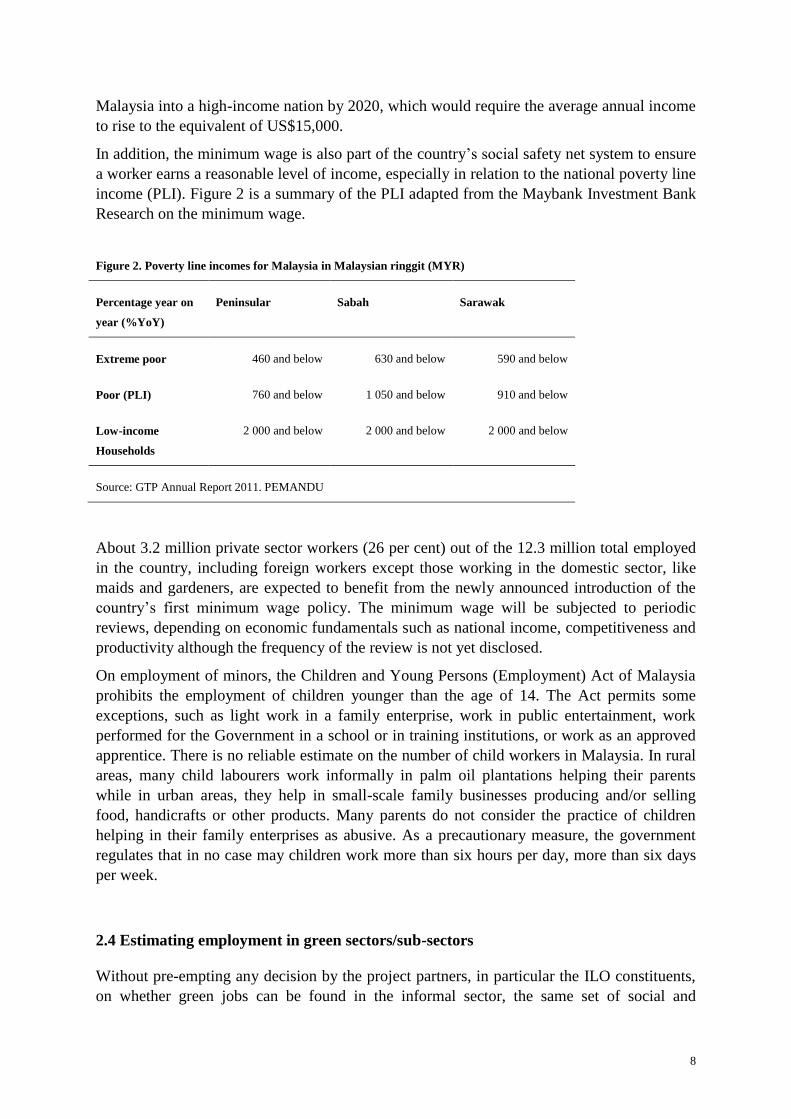
In addition, the minimum wage is also part of the country’s social safety net system to ensure
a worker earns a reasonable level of income, especially in relation to the national poverty line
income (PLI). Figure 2 is a summary of the PLI adapted from the Maybank Investment Bank
Research on the minimum wage.
Figure 2. Poverty line incomes for Malaysia in Malaysian ringgit (MYR)
Percentage year on
year (%YoY)
Peninsular Sabah Sarawak
Extreme poor 460 and below 630 and below 590 and below
Poor (PLI) 760 and below 1 050 and below 910 and below
Low-income
Households
2 000 and below 2 000 and below 2 000 and below
Source: GTP Annual Report 2011. PEMANDU
About 3.2 million private sector workers (26 per cent) out of the 12.3 million total employed
in the country, including foreign workers except those working in the domestic sector, like
maids and gardeners, are expected to benefit from the newly announced introduction of the
country’s first minimum wage policy. The minimum wage will be subjected to periodic
reviews, depending on economic fundamentals such as national income, competitiveness and
productivity although the frequency of the review is not yet disclosed.
On employment of minors, the Children and Young Persons (Employment) Act of Malaysia
prohibits the employment of children younger than the age of 14. The Act permits some
exceptions, such as light work in a family enterprise, work in public entertainment, work
performed for the Government in a school or in training institutions, or work as an approved
apprentice. There is no reliable estimate on the number of child workers in Malaysia. In rural
areas, many child labourers work informally in palm oil plantations helping their parents
while in urban areas, they help in small-scale family businesses producing and/or selling
food, handicrafts or other products. Many parents do not consider the practice of children
helping in their family enterprises as abusive. As a precautionary measure, the government
regulates that in no case may children work more than six hours per day, more than six days
per week.
2.4 Estimating employment in green sectors/sub-sectors
Without pre-empting any decision by the project partners, in particular the ILO constituents,
on whether green jobs can be found in the informal sector, the same set of social and

9
environmental criteria will be applied both to formal and informal sectors in estimating green
jobs. The authors duly recognize that the decisions on the characterization of green jobs in the
informal sector lie fully with the project partners.
Through the years, the trend of informal employment in Malaysia has been decreasing.
Nevertheless, its contribution remains important as informal workers are involved in making
and providing a wide range of products and services – from hawkers selling food, to those
involved in cottage industries and labour-intensive work sub-contracted from factories as
well as knowledge-based services. It should be noted that informality in itself is not
necessarily an indicator of negative conditions of work although it may be difficult for
informal workers to collectively organize themselves to improve their working conditions.
Thus, based on the environmental screening criteria and decent work criteria, the
characterization of green jobs is illustrated in figures 3 and 4.
Figure 3. Characterization of green jobs
.Necessary
Source: ILO, 2010
Environment
related jobs Decent
jobs Green
jobs
Mitigation of GHG emissions Climate change adaptation and resilience Biodiversity, desertification, ecosystem services, environmental quality based services Water and natural resource management Pollution prevention and control Environmental compliance, education and training, etc.
Wage rate Working conditions, rights and standards Social protection and representation Informal employment Youth and child employment Gender ratio Working hours

10
Figure 4. Steps to characterize and estimate green jobs.
Source: ILO, 2010
2.5 How to estimate green jobs?
In terms of quantification of green jobs, the approach followed by this report is based on the
following two dimensions of green jobs: (1) the output approach, which identifies
establishments that produce certified green goods and services and counts the associated jobs.
Various approaches may be considered in relation to the scoping of the associated labour
force; and (2) the process approach, which identifies jobs associated with environmentally-
friendly production processes and practices, irrespective of whether the sectors concerned are
considered to be environmentally-friendly or not.
A comprehensive mapping study would largely rely on the collection of data and information
from surveys of a representative sample of establishments across all sectors of the economy,
including green sectors. Instead, the desk study approach followed in this report offers to
estimate the number of green jobs following the best appropriate method considering data
availability. To facilitate initial estimation considering the vast data gaps in each sector of
interest, the following methods were employed – using ratios, applying assumptions and
considering “what-if” scenarios in sectors that have no available data on environment-related
“core” sub-sector. In some cases, combinations of methods were applied to obtain a range of
estimates. The results may not reflect the actual number of jobs created but it may serve as an
initial ball park figure for consideration then modified later after actual surveys and focus
group discussions have been conducted.
Method 1: Using ratios
In cases where the percentage of the size of environment-related “core” sub-sector relative to
the whole sector size is available, it can be used to deduce the percentage employment of the
environment-related “core” sub-sector as a fraction of the sector as a whole. Similarly, data

11
from small scale surveys establishing such ratios could be projected to the economy as a
whole.
For example, the number of jobs is calculated by using the ratio of the sector’s green revenue
to the revenue per employee of that sector.3
Method 2: Using assumptions
In some cases, it is necessary to use initial default values (e.g. assumed number of jobs
created per hectare in the agriculture sector, assumed average jobs per megawatt (MW)
produced in the energy sector) used in previous studies.
Method 3: Using “what-if” scenarios
This is applied in cases where there is no available data to jumpstart the estimation yet the
government has commitments to pursue sustainable practices towards greening the sector of
interest, “what-if” scenarios are applied to explore the effects on green job creation potential
of the said sector. It should be noted that in this desk research, many assumptions are made to
illustrate “what-if” scenarios and should not be taken as is without further validation.
2.6 Challenges and assumptions
Currently there is no sufficient labour market information on existing green jobs in Malaysia
although some policies have already been implemented by public and private organizations
promoting green jobs. A number of studies have also been carried out to estimate green jobs.4
Available data are not enough and do not necessarily correspond to the sector/sub-sector of
interest. The main challenges in data handling are the following:
Lack of data of actual job estimates.5 In many cases there is no information of job
estimates in the sector/sub-sector of interest. There are also no available estimates for
activities within a sector/sub-sector which has the potential to generate green jobs, e.g.
provision of energy efficient lighting systems in buildings within the construction
industry.
Data disaggregation. For example, the job estimate for transport is combined with
warehousing and communications.
Lack of information on what has been implemented on the ground. There is
considerable information on government policy initiatives and strategies, including
financing, towards climate change programmes, for example, but very little information is
available on the actual projects implemented much less on the corresponding green jobs
generated.
How to deal with job estimates of “short-term green projects”. For example, there are
cases of isolated or short-term environmental projects such as tree planting on a certain
piece of land which could generate temporary green jobs.
3 Based on Frost & Sullivan. 4 Although most, if not all, previous studies only considered the environmental aspects of green jobs. 5 It may be possible that data exist but are not available online. This will be verified during the focus group discussions and
actual surveys.
12
3. The economy and employment structure in Malaysia
3.1 Introduction
This section provides a brief profile of the economic and employment structure of the
Malaysian economy including an overview on the following:
an overview of the status of employment maintained in the economy;
employment profile of the different economic sectors; and
briefing on the informal economy.
3.2 An overview of the status of employment maintained in the economy
Malaysia’s economy grew by 4.7 per cent in the first quarter of 2012 as compared to 5.2 per
cent in the preceding quarter. The country is one of the best performers in Asia, with gross
domestic product (GDP) growing an average 6.5 per cent annually from 1957 to 2005.
Growth was accompanied by a dramatic reduction in poverty, from 12.3 per cent in 1984 to
2.3 per cent in 2009. It is now an upper-middle income economy with a current gross national
income of US$7,900 per capita attempting to achieve high-income status of US$15,000 –
US$20,000 per capita by 2020. However, pockets of poverty exist, 3.8 per cent of households
experience the incidence of poverty while 0.7 per cent experience incidence of hardcore
poverty, and income inequality remains high relative to the developed countries Malaysia
aspires to emulate.
The 2010 census set the population at 28,334,135. The average annual population growth rate
in 1991–2000 was 2.6 per cent, with inflation averaging at a low of 2.9 per cent per annum,
and similarly unemployment averaged 3.1 per cent.
Malaysia is a highly open economy and a leading exporter of electrical appliances, electronic
parts and components, palm oil, and natural gas. The country progressed from being a
producer of raw materials in the 1970s to being a multi-sector economy. The economy
evolved from capital-led growth in 1991 to growth based more on capital, labour and total
factor productivity. Economic structure has continued to develop from manufacturing to
services. Now Malaysia is going towards knowledge-based services and moving farther up
the value added production chain.
The quality of the labour force has improved with the share having educational attainment at
tertiary level increasing from 13.9 per cent in 2000 to 20.0 per cent in 2005. As industries
shifted towards higher value added products and activities, they faced a shortage of experts
and specialists in specific areas. To overcome the shortage, companies engaged foreign
experts and specialists. While the labour shortage was triggered by structural changes due to
a mismatch between skills and labour demand, its prevalence was later perceived more of a
business-oriented decision as hiring foreign workers was deemed more cost effective. The
government amended the labour code (namely the Employment Act) to protect local workers
from being displaced by foreign workers. No employer could terminate the contract of a
13
Malaysian and then hire a foreign worker; during down periods, when employers need to
retrench workers, all foreign workers must be dismissed before a Malaysian is dismissed.6
As of December 2005, there were 1.8 million foreign workers in the country, of which 32 per
cent are in the manufacturing sector. A large number of foreign workers are employed in
tasks which require lower skills. There are 35,480 professional expatriates working mostly in
the services sector (52.6 per cent) and manufacturing sector (40.6 per cent).The Malaysian
government regulates the migration of foreign workers by charging levies to companies who
employ foreign labourers, where the magnitude of the levies vary according to several factors
and has been revised upwards over time.7 In the Tenth Malaysia Plan, a multi-tiered levy
mechanism was introduced. This new levy system is implemented to encourage less use of
low skill migrant labourers.
In 2011, 12.2 million Malaysians were gainfully employed while the unemployment rate was
3.3 per cent. The number of new vacancies reported by occupation was about 1.3 million
while the total jobseekers were only 0.3 million. Most hiring activities come from the
manufacturing, agriculture and construction sectors. The mismatch between available jobs
and expectations of people seeking work was partly explained by a government survey in
2008 which reported that graduates were unwilling to take on jobs deemed dirty, difficult or
dangerous and many had “unrealistic” pay expectations. As most Malaysians are becoming
highly educated, the government, in parallel, is aiming to generate more appropriate high
skilled jobs, preferably green jobs, in growing and emerging sectors.
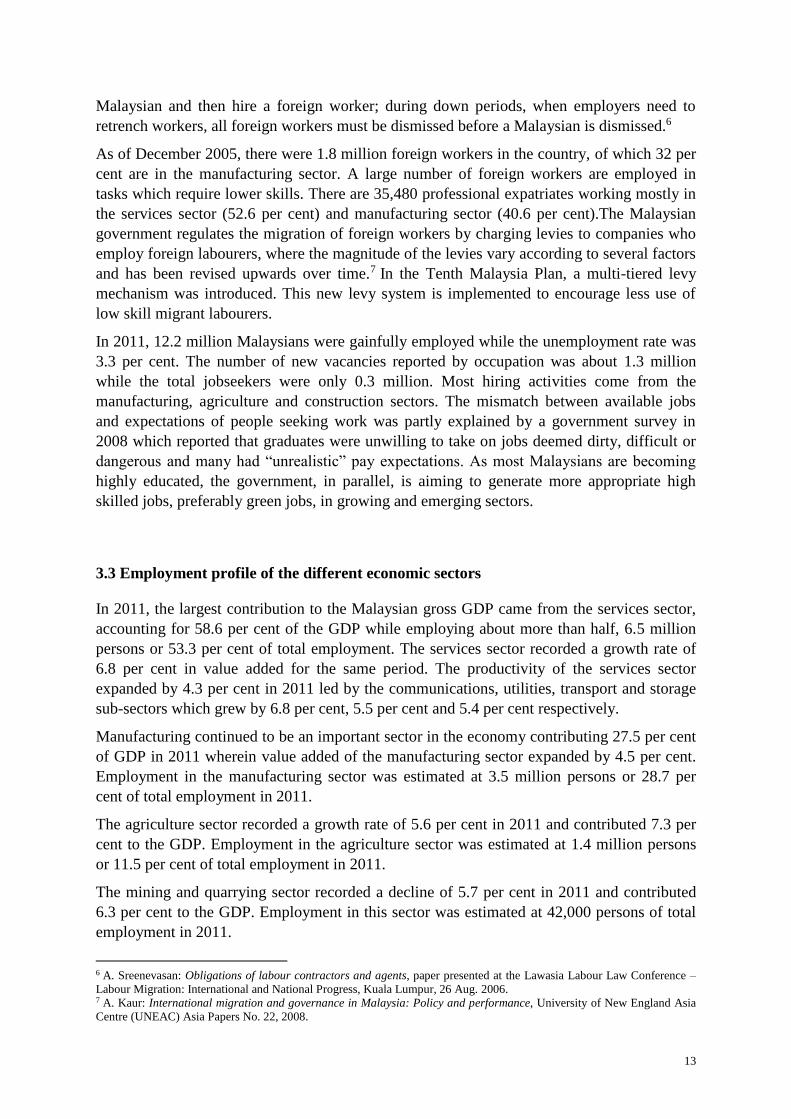
3.3 Employment profile of the different economic sectors
In 2011, the largest contribution to the Malaysian gross GDP came from the services sector,
accounting for 58.6 per cent of the GDP while employing about more than half, 6.5 million
persons or 53.3 per cent of total employment. The services sector recorded a growth rate of
6.8 per cent in value added for the same period. The productivity of the services sector
expanded by 4.3 per cent in 2011 led by the communications, utilities, transport and storage
sub-sectors which grew by 6.8 per cent, 5.5 per cent and 5.4 per cent respectively.
Manufacturing continued to be an important sector in the economy contributing 27.5 per cent
of GDP in 2011 wherein value added of the manufacturing sector expanded by 4.5 per cent.
Employment in the manufacturing sector was estimated at 3.5 million persons or 28.7 per
cent of total employment in 2011.
The agriculture sector recorded a growth rate of 5.6 per cent in 2011 and contributed 7.3 per
cent to the GDP. Employment in the agriculture sector was estimated at 1.4 million persons
or 11.5 per cent of total employment in 2011.
The mining and quarrying sector recorded a decline of 5.7 per cent in 2011 and contributed
6.3 per cent to the GDP. Employment in this sector was estimated at 42,000 persons of total
employment in 2011.
6 A. Sreenevasan: Obligations of labour contractors and agents, paper presented at the Lawasia Labour Law Conference –
Labour Migration: International and National Progress, Kuala Lumpur, 26 Aug. 2006. 7 A. Kaur: International migration and governance in Malaysia: Policy and performance, University of New England Asia
Centre (UNEAC) Asia Papers No. 22, 2008.
14
A more detailed breakdown of employment and labour estimates by industry and other
indicators are presented in figure 5.
Figure 5. Estimates of employed persons by industry in Malaysia, 2007–11
Source: Economic Planning Unit and Ministry of Human Resources, Government of Malaysia
3.4 The informal sector
Informal sector is defined in Malaysia as those enterprises that are not registered with the
Companies Commission of Malaysia with all or at least one product or service is for sale or
barter transaction; employ ten workers or less, workers are not covered by social security, and
are involved in non-agricultural activities.

15
Measuring the prevalence of informal employment is important for understanding the
distribution of economic risks and sources of income inequality, including factors
contributing to the economic vulnerability of women. Informal employment is often, but not
always, more precarious with lower earnings. Households which depend on informal
employment for their primary source of income often face higher risks of poverty.8
There was no official information on the informal sector in Malaysia prior to 2004. In 2004, a
pioneer study was done to test the data collection method while the pilot test covered the
whole of Malaysia in 2006. Prior to 2009, estimates were based on mixed income (MI)
wherein the ratio of MI to GDP provides estimates of the contribution of the informal sector
to the GDP. The Informal Sector Survey was undertaken regularly since 2009 as part of a
module under the Labour Force Survey with the estimation of the informal sector using the
labour input method; however, data are not available online.9
In 2005, the informal sector contributed approximately about 10.7 per cent to the GDP. Based
on the 2006 pilot informal sector study which covered about 25,344 households, the leading
products or services produced were food (16.3 per cent), private services (14.1 per cent), and
construction (13.3 per cent). The distribution of informal sector by place of operation was
from home (24 per cent), no fixed place (16.7 per cent), construction site (11.1 per cent) and
factory (10.8 per cent).
Figure 6. Informal employment rebounded in 2010
The number of own account workers and unpaid family member rose significantly in the year
to mid-2010, at the same time as formal employment was recovering as shown in figure 6.
These sorts of employment arrangements tend to offer lower wages, poorer conditions, fewer
non-wage benefits, and greater uncertainty over future income. Often unemployed workers
turn to this sort of work after losing better quality formal sector jobs and being unable to find
new ones, and when they lack alternative income sources such as formal social protection
8 M. Chen, J. Vanek, F, Lund, J. Heintz, R. Jhabvala, and C. Bonner: Progress of the world’s women 2005: Women, work,
and poverty (New York, United Nations Fund for Women, 2005). 9 R. Ridzuan and S. Ponggot: Informal sector in Malaysia (Malaysia, Department of Statistics, 2009).

16
mechanisms. The growth in informal employment may also reflect firms’ uncertain outlook
translating into an unwillingness to commit to formally rehiring workers.

17
4. Responding to a changing climate while ensuring sustainable
development
Malaysia has been an active participant, often taking a leading role on behalf of developing
countries, in many international environmental discussions since the 1970s. Principles of
sustainable development have been enshrined into Malaysia’s five-year development plans
since the adoption and implementation of Agenda 21 at the Rio Earth Summit in 1992.
Malaysian representatives to the Rio+20 in 2012 made important statements charting the way
forward in implementing the outcomes of the conference which are intricately linked to the
unfulfilled commitments and promises of the Rio Summit in 1992.
Malaysia is a signatory to the United Nations Framework Convention on Climate Change
(UNFCCC) and the Kyoto Protocol. In terms of per capita emissions, Malaysia stood at 10.8
tonne equivalent CO2 per capita equivalent (e CO2/capita e) while its carbon intensity
emission was at 0.58 CO2/GDP.10 Even if Malaysia is not a significant emitter of GHGs, it is
not exempt from the impacts of climate change. A review of economic impacts of climate
change in Asia shows that inaction will have significant economic costs.11 In Malaysia, the
initial national communication to the UNFCCC estimated that a 1oC rise in temperature
would reduce power output by 2 per cent, causing a loss of about US$12.4 million per year
for an electricity generation capacity of 6,600 megawatts. Actions taken by Malaysia are seen
in the National Policy on Climate Change as well as a voluntary pledge of reducing of up to
40 per cent in terms of emission intensity relative to GDP by the year 2020 compared to
2005.
At the national level, climate change related concerns are addressed through various sectors
such as energy; forestry and natural resource management; land-use planning; agriculture;
solid waste; and drainage and irrigation. Often, climate change actions are guided by
Malaysia’s international obligations and commitments, not only to the UNFCCC but also to
its commitments to the United Nations Convention on Biological Diversity (CBD), and
United Nations Convention to Combat Desertification (CCD). In 1994, the National Steering
Committee on Climate Change (NSCCC) was established under the Ministry of Science,
Technology and the Environment (MoSTE). Subsequently, the Ministry of Natural Resources
and Environment (MNRE) was established on 27 March 2004, following the formation of a
new cabinet by the Prime Minister. The Secretary General of the MNRE chairs the NSCCC,
which also acts as the focal point for the UNFCCC. The Committee consists of
representatives from relevant ministries and agencies, the private sector and non-
governmental organizations (NGOs).
Malaysia’s Vision 2020 is to achieve high-income status through inclusive and sustainable
growth. Current GDP per capita is US$7,900 compared with the high income target range of
US$15,000 to US$20,000 in 2020. According to the Tenth Malaysia Plan, achieving the goal
of high-income status by 2020 will require, among other things, average growth of 6 per cent
over the plan period of 2011–15. Such growth rates require a marked improvement on the 4.4
10 Asian Development Bank and United Nations Development Programme: Proceedings of the economics of climate change
in Malaysia, inception workshop. 25-26 Jan. 2011, Putrajaya. 11 Institute for Global Environmental Strategies: Climate change policies in the Asia and the Pacific: Re-uniting climate
change and sustainable development (Kanagawa, IGES, 2008).
18
per cent achieved from 2006–10 during the Ninth Malaysia Plan, but are less than the rates
seen in the early 1990s.
One challenge is not only to boost the level of growth but also to ensure that the process of
growth is inclusive. Inclusive growth policies enable the benefits of growth to be shared
across all communities. Another is to achieve sustainable growth, ensuring that the wealth of
current generations grows in a way that does not come at the expense of future generations. It
also includes putting in place appropriate incentives to promote green innovation and
conservation of biodiversity. Indeed, Malaysian policy-makers are faced with the challenge
of moving the economy away from competing on costs and natural resources to an economy
that is driven by productivity, innovation and that can attract and retain capital, sustainable
companies and the best human resource talent. It implies a shift from affirmative action being
ethnically-based to being need-based, becoming more competitive, market orientated and
investor friendly.12
The Malaysian Government responded to the Vision 2020 challenge by introducing four
interrelated programmes:
1Malaysia, introduced in 2009, focused on building support for a “People First,
Performance Now” concept.
Government Transformation Programme (GTP), was announced in early 2010 and
aims to improve the efficiency of delivery of government services in six National Key
Results Areas (NKRAs). The NKRAs are reducing crime, fighting corruption,
improving student outcomes, raising living standards of low-income households,
improving rural basic infrastructure and improving urban public transport.
The Tenth Malaysia Plan (10MP) covering the period of 2011–15. The 10MP
incorporates macroeconomic and socio-economic targets and development
expenditure allocations within a framework of “10 Big Ideas”. In particular, it targets
a revival of private investment, improvement in productivity and rationalization of the
role of the government. Accordingly, relative to the outcomes for the Ninth Malaysia
Plan, the 10MP average growth target of 6 per cent includes considerably stronger
contributions from capital growth and total factor productivity. The plan also foresees
a continued shift towards services within the economy, with a notable rise in growth
in transportation, storage and communication, for example. However, manufacturing
is also expected to grow strongly, by around 5.7 per cent per year relative to 1.3 per
cent over 2006–10.
The Economic Transformation Programme (ETP), which was launched in October
2010. The ETP report incorporates policies and projects, thinking “big” in terms of
the macro-enabling environment and cross-cutting issues and thinking “small” about
the micro-enabling environment and specific projects. The National Economic
Advisory Council’s first report on the New Economic Model (NEM), delivered in
April 2010 focused on cross-cutting issues. Grouped under eight Strategic Reform
Initiatives, it set out policy options to improve the enabling environment for the
investment and productivity improvements needed to reach the macro targets of the
10MP and the Vision 2020 objectives. The ETP combines these policies with the
project focus of the National Key Economic Areas (NKEAs).
12 ILO: Introduction to policies and programmes for green jobs (Bangkok, ILO, 2012).

19
The plan involves investments worth approximately MYR1.4 trillion (US$523 billion) with
an objective to grow the gross national income (GNI) at 6 per cent annually to hit MYR1.7
trillion (US$523 billion) by 2020 from MYR660 billion (US$188 billion) in 2009. As an
initial catalyst towards economic transformation, 131 Entry Point Projects (EPPs) would be
carried out across 12 NKEAs, with 60 business opportunities being made available as a result
of it. A total of 12 NKEAs were identified including 11 economic sectors – oil, gas and
energy, financial services, palm oil, wholesale and retail trade, tourism, electronics and
electrical, business services, education, communications content and infrastructure,
healthcare, agriculture – and one geographic sector – the greater Kuala Lumpur conurbation.
Note that job creation may be subject to resource reallocation effects of projects. For
example, implementing a number of large infrastructure projects may contribute to rising
construction or labour costs, impacting the returns on other NKEA projects and private sector
investments more generally. In addition, some of the projects may lead to creative
destruction, which, while increasing productivity, can lead to offsetting falls in output and
employment.
The role of green technology is critical to the success of the Vision 2020. In 2009, the
Ministry of Energy, Green Technology and Water (KeTTHA) was created to mainstream
green technologies and push towards greater green growth and green jobs. KeTTHA defines
green technology as products, equipment or systems which minimize environmental
degradation, have low or zero GHG emissions, are safe to use for all forms of life, minimize
the use of energy and resources and promote the use of renewable sources for energy.
Similarly, promotion and transition towards green jobs will also ensure the sustainability and
higher value addition to created jobs.
One key national policy expected to generate green jobs is the National Green Technology
Policy developed by KeTTHA. The Green Technology and Climate Change Council will be
the main driver of the policy intended to accelerate national economic development and
promote sustainable development. The Green Technology Policy will promote significant
progress and develop new green technologies in four main sectors:
energy;
buildings;
water; and
waste management.
It mandates strategic green technology hubs to be built across the country under the direction
of the Malaysian Green Technology Corporation. The policy also calls for the design and
enhancement of green skills training and education programmes, including the expansion of
local research institutes and institutions of higher learning to expand research, development
and innovation activities on green technology towards commercialization, as well as wide-
spread public awareness campaigns to increase the awareness of green technology by the
public.
KeTTHA is also currently developing a Green Jobs Framework for Action to provide policy
coherence and to guide programmes for green jobs. In addition, KeTTHA and the Ministry of
Human Resources facilitate inter-ministerial coordination through the Joint Secretariat of the
Working Group on Green Jobs which have conducted an occupational analysis to develop; an
20
Occupational Analysis for Green Jobs; National Competency Standards (NCS); and National
Occupational Skills Standards (NOSS) to support further green job creation in the country.
4.1 The environmental goods and services industry in Malaysia
Malaysia was ranked 54th out of the 163 examined countries in the 2010 Environmental
Performance Index. The country performed better than the United States (US) or Belgium in
addressing environmental challenges. Along with the improving environmental performance
is the growing capability to produce environmental goods and services.
Based on the Asia-Pacific Economic Cooperation study in 2010 on Malaysia’s
Environmental Industry the environmental goods and services (EGS) industry in Malaysia is
relatively well-structured and vibrant. 13 Growth in Malaysian EGS segments before the
global recession averaged 6–8 per cent per annum from 2004 to 2008, with the total growing
from MYR5,500 million to MYR6,900 million.14 Analysis of 11 service and equipment
segments reveals an environmental industry generating revenue of MYR7,060 million in
2009 and employing an estimated 29,700 workers in about 2,700 private companies. The
revenue generated makes up 1.38 per cent of Malaysia’s GDP and growth in the
environmental industry was slightly faster than the 5–6 per cent annual growth of Malaysia’s
GDP from 2006 to 2008. Emerging segments (principally export-driven solar energy
equipment) accounted for another MYR3,760 million in 2009, bringing the total of EGS and
emerging segments to MYR10,790 million in 2009, or 2.1 per cent of GDP. By far the largest
contributors to revenue and employment in the Malaysian environmental industry can be
described as environmental infrastructure service companies. Three environmental
infrastructure segments – water utilities, wastewater treatment and waste management –
accounted for 76 per cent of total EGS revenue in 2009.
Drivers of the environmental market in Malaysia are principally federal laws and regulations,
self-imposed international standards of multinational corporations, and the budgets of federal,
state and local government, as well as the demand for and provision of basic environmental
infrastructure services. Although the Malaysian Department of Environment has been in
existence since 1974, and has the authority to enforce a broad suite of regulations and
standards covering all environmental media, many Malaysian companies cite inconsistent or
non-existent enforcement as one of the problems inhibiting development of the EGS industry
in Malaysia. Malaysian officials contend that regulations and standards are in place
(including guidelines), but that awareness and implementation of these regulations and
standards may not be adequately widespread.
Environmental industry analysts have long stated that the best determinant of an economy’s
environmental industry competitiveness internationally is the consistency and development of
its own domestic market, driven mainly by enforcement of environmental laws and
regulations. The Malaysian Government’s efforts to take control of its environmental
infrastructure and cede control and responsibility to privately managed companies are notable
in its relatively advanced state.
13 Biofuels are excluded from the EGS analysis as it is not broadly accepted globally as environmentally preferable, although
the Malaysian palm oil industry has made considerable efforts to promote biofuel. Sustainable agriculture, sustainable
forestry and ecotourism are not included also in the EGS analysis due to difficulty in gathering data. 14 The section on EGS in Malaysia is based heavily on the case study available at: http://egs.apec.org/more-articles/279-
malaysia-environmental-industry-2010-case-study [accessed 15 Jan. 2011].
21
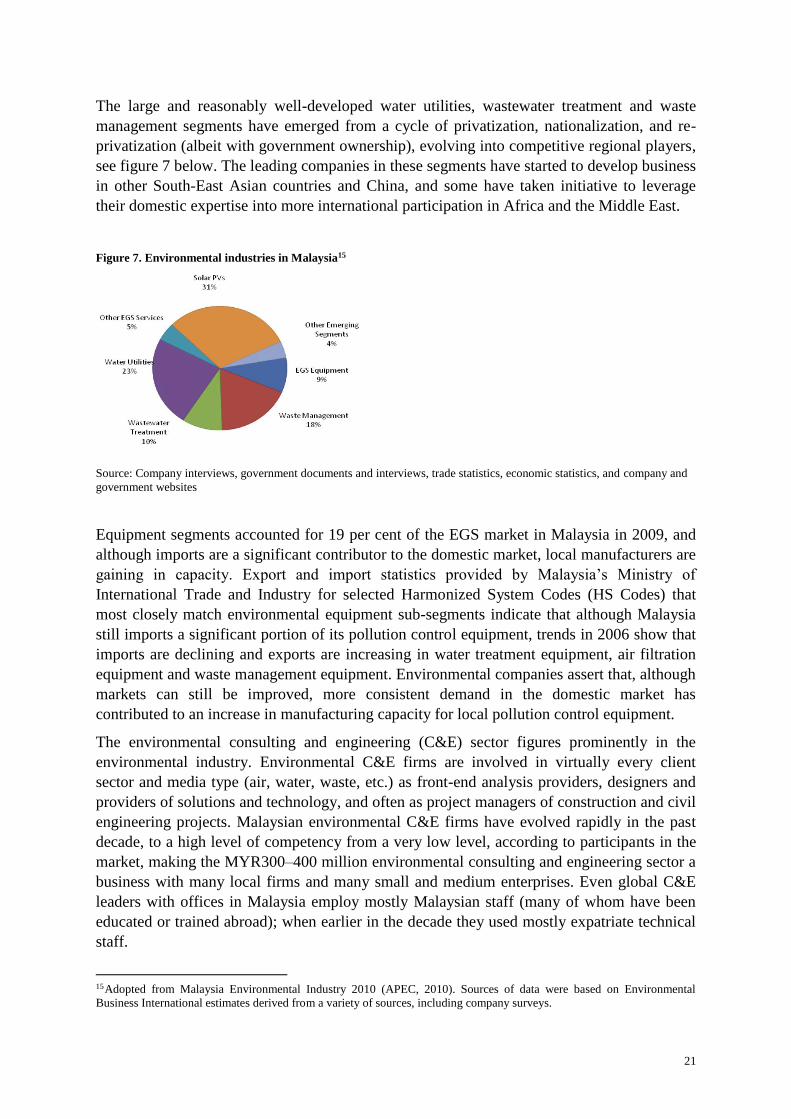
The large and reasonably well-developed water utilities, wastewater treatment and waste
management segments have emerged from a cycle of privatization, nationalization, and re-
privatization (albeit with government ownership), evolving into competitive regional players,
see figure 7 below. The leading companies in these segments have started to develop business
in other South-East Asian countries and China, and some have taken initiative to leverage
their domestic expertise into more international participation in Africa and the Middle East.
Figure 7. Environmental industries in Malaysia15
Source: Company interviews, government documents and interviews, trade statistics, economic statistics, and company and
government websites
Equipment segments accounted for 19 per cent of the EGS market in Malaysia in 2009, and
although imports are a significant contributor to the domestic market, local manufacturers are
gaining in capacity. Export and import statistics provided by Malaysia’s Ministry of
International Trade and Industry for selected Harmonized System Codes (HS Codes) that
most closely match environmental equipment sub-segments indicate that although Malaysia
still imports a significant portion of its pollution control equipment, trends in 2006 show that
imports are declining and exports are increasing in water treatment equipment, air filtration
equipment and waste management equipment. Environmental companies assert that, although
markets can still be improved, more consistent demand in the domestic market has
contributed to an increase in manufacturing capacity for local pollution control equipment.
The environmental consulting and engineering (C&E) sector figures prominently in the
environmental industry. Environmental C&E firms are involved in virtually every client
sector and media type (air, water, waste, etc.) as front-end analysis providers, designers and
providers of solutions and technology, and often as project managers of construction and civil
engineering projects. Malaysian environmental C&E firms have evolved rapidly in the past
decade, to a high level of competency from a very low level, according to participants in the
market, making the MYR300–400 million environmental consulting and engineering sector a
business with many local firms and many small and medium enterprises. Even global C&E
leaders with offices in Malaysia employ mostly Malaysian staff (many of whom have been
educated or trained abroad); when earlier in the decade they used mostly expatriate technical
staff.
15Adopted from Malaysia Environmental Industry 2010 (APEC, 2010). Sources of data were based on Environmental
Business International estimates derived from a variety of sources, including company surveys.

22
The following figures are an estimate of market size, number of companies and employment
by segment in the Malaysian environmental industry. Market statistics are presented in two
groups: (1) traditional or core EGS segments, pertaining mostly to air, water and waste
issues; and (2) emerging segments like renewable energy, energy efficiency and other green
sectors. This is done because in most economies while all these markets are related, there is a
distinction in policy between traditional EGS and emerging green segments. Companies in
the traditional EGS and emerging green companies are often different entities.
The data below summarize market drivers, leading companies, and major trends by segment.
Figure 8. Malaysian environmental market 2009
Market size
(MYR million)
No. of companies No. of employees
E Q U I P M E N T
Water equipment and chemicals 950 200 1 820
Air pollution control 180 80 270
Instruments and monitoring systems 170 60 320
Waste management equipment 300 140 580
S E R V I C E S
Solid waste management 1 800 1 100 14 400
Hazardous waste management (scheduled waste) 150 100 800
Consulting and engineering 340 290 1 550
Remediation/industrial services 70 80 280
Analytical services 150 60 750
Wastewater treatment (municipal and individual) 1 130 400 4 120
Water utilities 2 560 200 4 820
Core environmental goods and services 7 800 2 710 29 710
Source: IGES, 2012
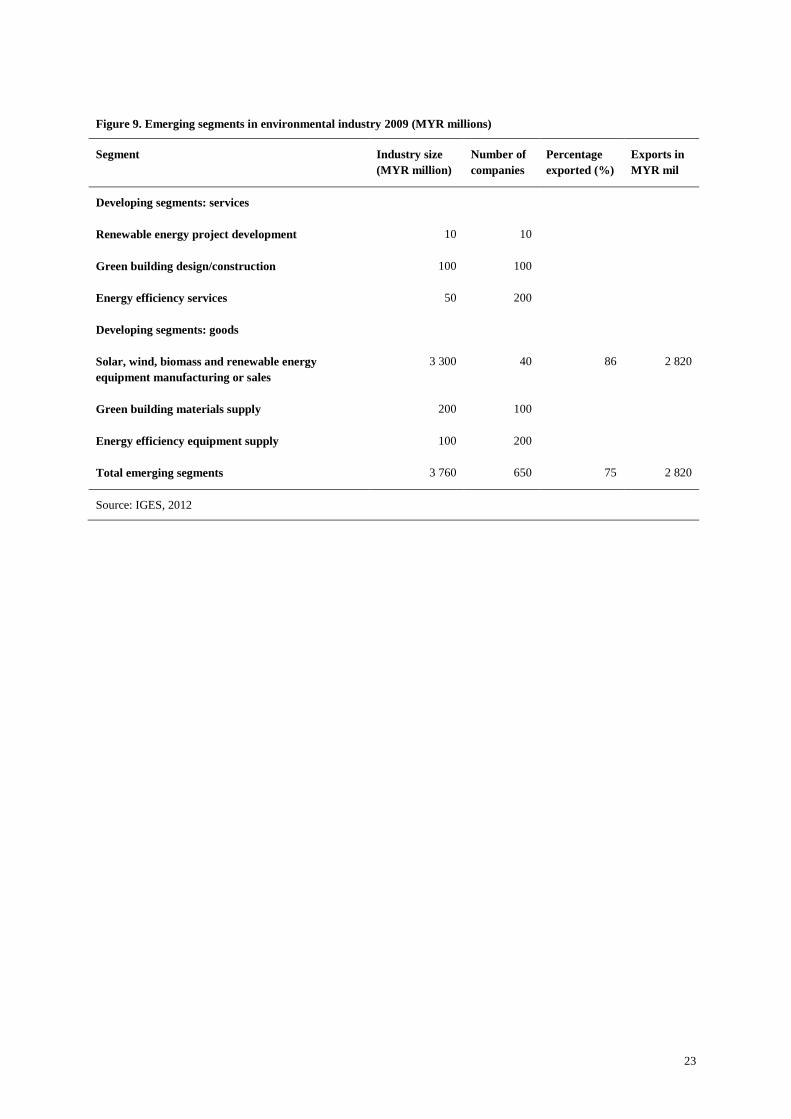
23
Figure 9. Emerging segments in environmental industry 2009 (MYR millions)
Segment Industry size
(MYR million)
Number of
companies
Percentage
exported (%)
Exports in
MYR mil
Developing segments: services
Renewable energy project development 10 10
Green building design/construction 100 100
Energy efficiency services 50 200
Developing segments: goods
Solar, wind, biomass and renewable energy
equipment manufacturing or sales
3 300 40 86 2 820
Green building materials supply 200 100
Energy efficiency equipment supply 100 200
Total emerging segments 3 760 650 75 2 820
Source: IGES, 2012
24
5. List of key economic sectors
Green jobs can exist and flourish in all sectors, although green jobs will concentrate in
specific (green) segments such as renewable energy and energy efficiency, natural resource
management, recycling, sustainable agriculture, sustainable tourism, etc. To illustrate, the
following sectors are selected to elaborate under what conditions green jobs exists. Green
jobs will be found where there are measures taken to: a) mitigate GHG emissions; b) adapt to
climate change and enhance disaster risk management; c) protect biodiversity, reduce
desertification and promote environmental quality based services; d) promote water and
natural resource management; and e) reduce pollution, etc.
The selection of sectors to focus for the green jobs mapping is in line with the Government’s
Tenth Malaysia Plan for 2011–15 which outlined a programme of economic reforms expected
to facilitate the growth of new industrial sectors, particularly in green technologies, the
National Green Technology Policy of 2010 and KeTTHA’s promotion of the development of
new green technologies in four main sectors: energy, buildings, water and waste
management. The current comparative advantage in the production of environmental goods
and services in key industries is also an important factor. Further, based from the review of
the Malaysian economy, job generation of key sectors and priority key areas identified to
mainstream climate change in the country’s development plan, the following sectors and sub-
sectors are added: agriculture, including fishery and forestry, transport, and solid waste
management.
In sum, the green jobs will be elaborated in the following sectors:
agriculture, including fishery and forestry;
energy;
buildings;
transport;
water and wastewater management; and
solid waste management.
25
6. Proposed key economic sectors and industries for further
characterization of green jobs
Malaysia’s Vision 2020 aims to achieve high-income status through inclusive and sustainable
growth thus moving the economy away from competing on costs and natural resources to an
economy that is driven by productivity, innovation and harnessing the best human resource
talents. In parallel, there is a need for better integration of the employment and livelihood
dimensions into climate and other environment related policies, while also a need to
harmonize employment and social policies with the environmental agenda.
The presence of green jobs can be viewed as the extent of how environmental concepts and
policies have been mainstreamed and operationalized in the different economic sectors. The
subsequent discussions give an overview of the characterization as well as current status of
green jobs in some key sectors based on available data.
6.1 Agriculture, including fishery and forestry
The agriculture sector recorded a growth rate of 5.6 per cent in 2011 and contributed 7.3 per
cent to the GDP.16 Though its share of the economy has declined over time, agriculture is still
an important economic sector in Malaysia in employment terms. Employment in the
agriculture sector was estimated at 1.4 million persons or 11.5 per cent of total employment
in 2011.
6.1.1 Importance of the sector and key trends
Based on the National Census 2011 a total of 8,829 establishments were involved in the
agriculture sector that covers the crops sub-sector (6,348), livestock (1,089), fisheries
(855) and forestry and logging (537) in 2010. The concentration of agriculture
establishments are in Johor (1,316) and Sabah (1,311) followed by Perak (1,174), Pahang
(923) and Selangor (916).
The value of gross output from the Economic Census 2011 for the agriculture sector was
MYR53,452.10 million. The crops sub-sector in the agriculture sector is the main
contributor with MYR37,275.60 million, followed by forestry & logging (MYR8,111.0
million), livestock (MYR6,591.5 million) and fisheries (MYR1,474.1 million).
In 2010, a total of MYR31,075.9 million value added has been produced from overall
inputs consumed in the agriculture sector of MYR22,376.1 million. The crops sub-sector
generated the highest value added (222.4 per cent) from input consumption at
MYR11,560.4 million, followed by forestry and logging (70.8 per cent), fisheries (45.4
per cent) and livestock (30.5 per cent).
The total employment in the agriculture sector in 2010 based on the National Census
2011 was 390,708 persons. Note that about 1 million farmers, fishermen, or forestry
16 E. Lindsay: “Malaysia’s GDP driven mainly by services, manufacturing sectors”, in Borneo Post Online, 20 Apr. 2012,
http://www.theborneopost.com/2012/04/20/malaysias-gdp-driven-mainly-by-services-manufacturing-sectors/ [accessed 15
May 2012].

26
workers are not included in this census as they are not registered with business agencies.
The paid employee categories were 384,769 (98.5 per cent), and only 5,939 persons (1.5
per cent) were working proprietors, active business partners and unpaid family workers.
From the total employment, 318,583 (81.5 per cent) were male workers and the rest (18.5
per cent) were females.
The crops sub-sector provided the highest job opportunities in the agriculture sector
compared to other sub-sectors with a total of 335,096 persons of the overall total
employment. The livestock, forestry and logging and fisheries sub-sector recorded the
number of employees of 20,056, 24,048 and 11,508 persons respectively.
A total of 72 industries were covered in the crops sub-sector in the Economic Census
2011. The palm oil industry is the major contributor of output and value added of
MYR34,699.6 million and MYR24,046.6 million respectively. The palm oil industry is an
important industry in Malaysia. It is the fourth largest contributor to the national
economy. Rubber recorded the output of MYR1,111.2 million and the value added of
MYR858.4 million. The industry that contributed the lowest output and value added is
recorded in the growing of plants for ornamental purposes industry at MYR53.8 million
and MYR23.6 million respectively and growing of pineapple at MYR53.1 million and
MYR25.2 million.
The total number of employment recorded for the crops sub-sector was 335,096 persons
of which 80.5 per cent were males and the rest (19.5 per cent) were females. The majority
were full time employees 328,133 persons, followed by working proprietors, active
partners and unpaid family workers of 3,848 and part time workers at 3,115 persons. The
industry that provided the highest job opportunities in the crops sub-sector was palm oil
industry with 300,465 persons or 89.7 per cent.
In 2011, total agricultural land in the country was about 6.8 million hectares, of which 5
million hectares or 73.2 per cent are planted with palm oil with 40 per cent belonging to
smallholders making them a force to be reckoned with in the country’s palm oil industry.
Malaysia has 19.42 million hectares of forest with 5.88 million hectares in Peninsular
Malaysia, 4.30 million hectares in Sabah and 9.24 million hectares in Sarawak.17
6.1.2 Key trends towards sustainability
The Fourth National Agricultural Policy covers 2011 to 2020. The policy framework over the
next ten years aims to create value based on consumers’ need for quality, safety, nutrition,
functionality and environmental sustainability hinged on increased productivity and
competitiveness of domestic food production based on innovation-based growth.
To ensure food safety and quality, the Agriculture and Agro-based Industry Ministry has
introduced farm accreditation schemes to ensure that farmers adopt good farming
practices, including soil and water management, judicious use of fertilizers and pesticides,
waste disposal and proper post handling. These practices include Good Agricultural
Practices, Good Hygiene Practices and Hazard Analysis and Critical Control Point
systems. As the demand for safe food increases, it is expected that more farmers will
adopt these accredited schemes.
17 Malaysian Timber Council: Malaysia sustainable forest management (Kuala Lumpur, Malaysian Timber Council, 2007).

27
Traceability along the supply chain will be introduced to improve food safety and to
ensure consumer confidence in food labeling. It will require close collaboration among
various government ministries, namely the Agriculture and Agro-based Industry Ministry,
Health Ministry which enforces the Food Act, Domestic Trade, Cooperatives and Consu-
merism Ministry as well as food producers and those who process them.
Research and development on green technology is intensified.
Organic products, biodegradable packaging materials, energy-efficient farming and
processing machinery as well as products which utilize agricultural by-products will be
promoted to lessen the carbon footprint of food production.
The Malaysian Palm Oil Board (MPOB) in 2010 developed the Malaysian Palm Oil
Sustainability Manual which contains a set of guidelines meant to guide the palm oil
industry to develop and implement standard operating procedures (SOPs). 18 The
foundation of good practices throughout the oil palm supply chain will be based on the
elements of the MPOB Codes of Practice as listed below:
o Code of Good Nursery Practice for the Oil Palm Nurseries.
o Code of Good Agricultural Practice for the Estates and Smallholdings.
o Code of Good Milling Practice for the Oil Palm Mills.
o Code of Good Crushing Practice for the Palm Kernels Crushers.
o Code of Good Refinery Practice for the Refineries.
o Code of Good Practice for the Handling, Transportation and Storage of Products
from Oil Palm.
In addition, membership of the Roundtable for Sustainable Palm Oil (RSPO) is
continuously encouraged to mainstream the production of certified sustainable palm oil.
Of the total 19.42 million hectares of forested land, 74 per cent or 14.29 million hectares
are gazette as Permanent Reserved Forests (PRFs) under the National Forestry Act 1984
and relevant state enactments and ordinances. Another 1.83 million hectares outside the
PRFs are gazette as National Parks and Wildlife Sanctuaries under various legislations.
These 16.12 million hectares are forests to be maintained in perpetuity by law.
Malaysia developed a set of Malaysian Criteria and Indicators (MC&I) for Sustainable
Forest Management, based on the International Tropical Timber Organization’s (ITTO)
Criteria and Indicators for Sustainable Management of Natural Topical Forests, at the
national and forest management unit levels (FMU) to assess and monitor its progress
towards the attainment of sustainable forest management.19 The MC&I formulated at the
national level provided a common framework for monitoring, evaluating and reporting
progress towards the attainment of sustainability of forest resources, especially to the
ITTO and the United Nations Forum on Forests (UNFF). Those formulated at the forest
management unit level together with the standards of performance will be used to assess
directly the sustainability of forest resource management, conservation and development
at the field level.
18 Malaysian Palm Oil Board (MPOB): Malaysian palm oil sustainability manual, 2010, www.mpob.gov.my [accessed 15
May 2012]. 19 Based on Malaysian Criteria and Indicators for Forest Management Certification, Second Draft Apr. 2010.

28
6.1.3 Identified sub-sectors and screening criteria
The following sub-sectors are identified as possible guides to sustainable practices in
agriculture, fishery and forestry to ensure their operations and employment are
environmentally sustainable, see table 1. Noting the significant palm oil cultivation and
production in Malaysia, it has its own screening criteria.
Table 1. Sustainable sub-sectors in agriculture sector and the environmental screening criteria
Sub-sector Proposed screening criteria Justification
Farming Malaysian Farm Accreditation
Scheme (Skim Akreditasi
Ladang Malaysia SALM)
Certify farms which adopt good agricultural practices (GAP),
operate in an environmentally-friendly way and yielding products
that are of high quality, safe and suitable for consumption.
Organic Farming Standard for Skim Organic
Malaysia (SOM)
The SOM standard is a standard that sets out the requirements for
the production of, the labelling and claims for organically produced
foods. The requirements cover all stages of production, including
farm operations, preparation, storage, transport and labelling.
Fishery Aquafarm Certification
Scheme (SPLAM)
The Malaysia Aquafarm Certification Scheme is a voluntary scheme
managed by the Department of Fisheries Malaysia for aquafarmers
to promote good farming practices, i.e., more responsible and
environmental friendly practices at the farm level to ensure product
quality and safety, consistency in production and remain
competitive in the global market. Important elements incorporated
into the scheme are ISO 9002, SSOP (Standard Sanitary and
Operating Procedures), Product Standards and Specifications,
compliance with the Aquaculture’s Code of Practice (COP) and
Good Aquaculture Practices (GAqp) and other terms and conditions
as determined by the Department of Fisheries Malaysia.
Forestry Malaysian Timber
Certification Scheme (MTCS)
Forest Steward Council (FSC)
The Malaysian Timber Certification Council (MTCC) is an
independent organisation established to develop and operate the
Malaysian Timber Certification Scheme (MTCS) in order to provide
independent assessments of forest management practices in
Malaysia as well as to meet the demand for certified timber
products.
Oil Palm RSPO (Roundtable on
Sustainable Palm Oil)
principles and criteria for
sustainable palm oil
production (RSPO P& C)
Malaysian Palm Oil
Sustainability Manual
Renewable Energy Fund
The Roundtable on Sustainable Palm Oil (RSPO) is a global, multi-
stakeholder initiative on sustainable palm oil. Multi-stakeholder
representation is mirrored in the governance structure of RSPO such
that seats in the Executive Board and project level Working Groups
are fairly allocated to each sector and include environmental NGOs,
banks and investors, growers, processors, manufacturers and
retailers of palm oil products and social NGOs that have produced
global guidelines for producing palm oil sustainably. Transparency
and traceability is assured through RSPO Supply Chain
Certification.
The Manual is based on the Malaysian Palm Oil Board’s six Codes
of Practice which was launched in August 2007 containing
guidelines pertaining to legality of new plantings as related to land
use history, guidelines for best practices, worker’s safety and
welfare, worker’s housing, guidelines for environmental protection,
conservation of biodiversity and wildlife, provisions for
unproductive sites, greenhouse gases, mechanisms for clean
development, etc.

29
6.1.4 Estimating environment-related employment
Sustainable agriculture
The number of farms having the SALM accreditation is comparatively very small as the
scheme is on a voluntary basis. In June 2006, a total of 182 farms were accredited (from
about 1,000 applicants) under the SALM scheme in Malaysia (Chen and Zin, 2006). SALM-
registered farms get priority in the local market because they qualify as preferred suppliers
and offer a degree of differentiation. However no premiums are offered to products from
certified farms. SALM-registered farms are eligible to qualify for the “Malaysia Best” logo, a
branding exercise administered by the Federal Agricultural Marketing Authority (FAMA).
Unfortunately, there are no available data on the number of workers employed in SALM-
accredited farms.
Organic farming
In 2001, the Department of Agriculture reported that there were 27 organic producers in
Malaysia farming 131 hectares of agricultural land. These data should be updated through
interviews to be able to come up with valid employment estimate.
Sustainable fisheries
The number of fishermen has declined over the past decade and about 20 per cent of the total
110,000 workers estimated to be involved in fishing are foreign nationals, mostly working on
trawlers and purse seiners. About 22,000 of the fisheries workers are estimated to be
employed in the aquaculture sector.20
Sustainable forestry
Based on data from the Malaysian Timber Certification Council, a total of nine Certificates
for Forest Management have been issued to Forest Management Units (FMUs) covering 4.65
million hectares or 32 per cent of total permanent reserved forests (PRFs) in Malaysia. Eight
of the certified FMUs (Pahang, Selangor, Terengganu, Kedah, Perak, Negeri Sembilan,
Kelantan and Johor) are in Peninsular Malaysia, while the Segaliud Lokan Forest Reserve is
located in Sabah. All certified FMUs under the MTCS are now considered PEFC-certified.
The MTCS-certified logs originating from these FMUs and their downstream products are
now eligible to carry the PEFC Logo. A total of 171 timber companies have been awarded
the PEFC Certificate for Chain-of-Custody under the MTCS, making them eligible to use the
PEFC logo on their products, once these manufacturers start processing PEFC-certified logs
obtained from the PEFC-certified FMUs or use PEFC-certified timber in their manufacturing
activities or trading operations, and have signed the Logo Usage Licence with MTCC.
Most of these companies are manufacturers and exporters of sawn timber, while some also
manufacture and export S4S, solid finger-jointed timber, solid wood moulding and plywood.
Information on direct employment, however, is not available.
Sustainable palm oil
Currently the Roundtable for Sustainable Palm Oil (RSPO) has 108 members registered in
Malaysia representing various areas of the supply chain – oil palm growers, palm oil
20 World fishing and aquaculture, Malaysia, 2008, http://www.worldfishing.net/features101/new-horizons/malaysia
[accessed 15 May 2012].
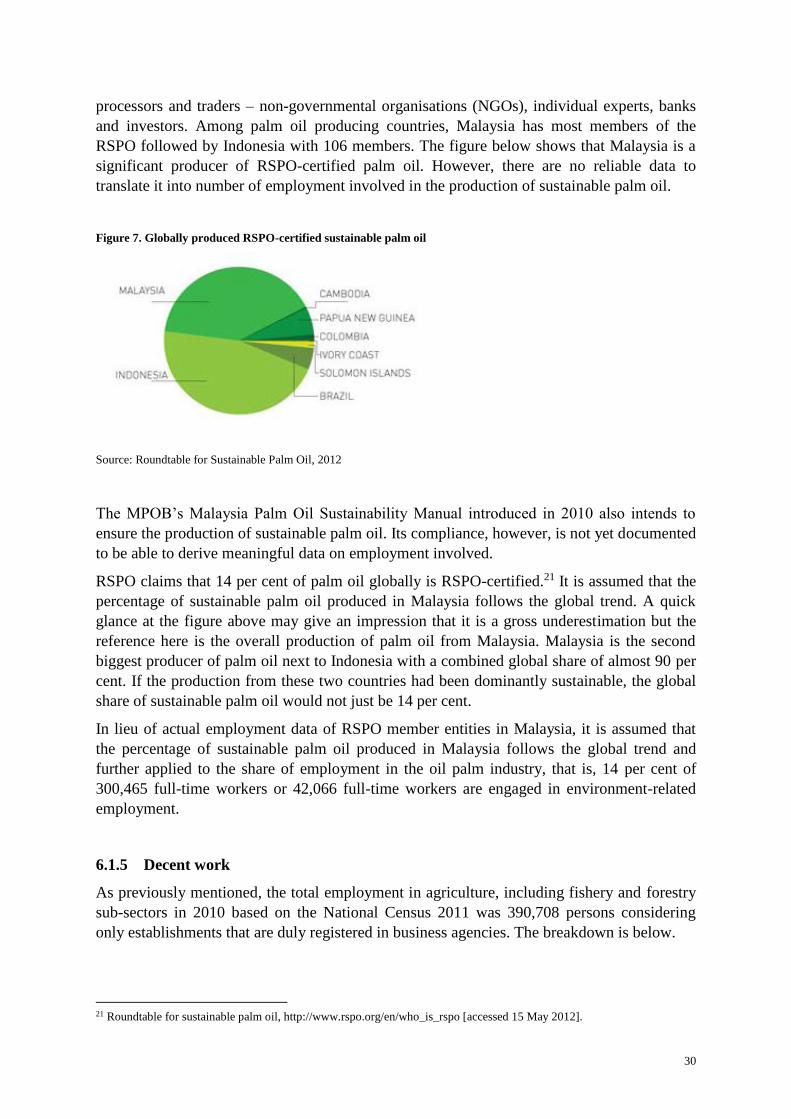
30
processors and traders – non-governmental organisations (NGOs), individual experts, banks
and investors. Among palm oil producing countries, Malaysia has most members of the
RSPO followed by Indonesia with 106 members. The figure below shows that Malaysia is a
significant producer of RSPO-certified palm oil. However, there are no reliable data to
translate it into number of employment involved in the production of sustainable palm oil.
Figure 7. Globally produced RSPO-certified sustainable palm oil
Source: Roundtable for Sustainable Palm Oil, 2012
The MPOB’s Malaysia Palm Oil Sustainability Manual introduced in 2010 also intends to
ensure the production of sustainable palm oil. Its compliance, however, is not yet documented
to be able to derive meaningful data on employment involved.
RSPO claims that 14 per cent of palm oil globally is RSPO-certified.21 It is assumed that the
percentage of sustainable palm oil produced in Malaysia follows the global trend. A quick
glance at the figure above may give an impression that it is a gross underestimation but the
reference here is the overall production of palm oil from Malaysia. Malaysia is the second
biggest producer of palm oil next to Indonesia with a combined global share of almost 90 per
cent. If the production from these two countries had been dominantly sustainable, the global
share of sustainable palm oil would not just be 14 per cent.
In lieu of actual employment data of RSPO member entities in Malaysia, it is assumed that
the percentage of sustainable palm oil produced in Malaysia follows the global trend and
further applied to the share of employment in the oil palm industry, that is, 14 per cent of
300,465 full-time workers or 42,066 full-time workers are engaged in environment-related
employment.
6.1.5 Decent work
As previously mentioned, the total employment in agriculture, including fishery and forestry
sub-sectors in 2010 based on the National Census 2011 was 390,708 persons considering
only establishments that are duly registered in business agencies. The breakdown is below.
21 Roundtable for sustainable palm oil, http://www.rspo.org/en/who_is_rspo [accessed 15 May 2012].

31
Sub-sector/Industry Number of full-time workers
Palm oil 300 465
Other crops 34 631
Forestry and logging 24 048
Fishery 11 508
It is assumed that the establishments covered in the Census survey comply with decent work
criteria. Further, considering the full-time status of the workers listed above, which comes
with social security, health and other benefits, all of the 390,708 persons are assumed to have
decent work.
Informal employment abounds in the agriculture sector. While informality of employment
does not necessarily indicate negative conditions at work, it is the absence of data that
precludes inclusion in the decent work estimates. The incidence of poverty in the entire
agricultural sector decreased significantly while the incidence of poverty among oil palm
smallholders was the lowest of all agricultural sub-sectors. There are 680,000 smallholders in
Malaysia. 22 While most Malaysians are observed to be reluctant to work in oil palm
plantations due to tough working conditions and poor wages, those that do actively seek
employment generally originate from comparatively poor and remote areas where there are
few opportunities for formal employment. However, palm oil cultivation has played a
significant role in poverty alleviation among smallholders and the rural population in
Malaysia.
6.1.6 Estimating green jobs
Based on the discussions above, a rough estimate of green jobs from the palm oil industry can
be assumed as 14 per cent of the registered full-time workers or 42,066 workers satisfying
both the environment and decent work criteria.
As for the other sub-sectors – sustainable fishery, sustainable forestry, and organic agriculture
– while there are no specific data available on the number of workers employed, it may be
possible to take an optimistic assumption considering the policies supporting sustainability
that the Malaysian Government has put in place and have been operational for quite some
time. Thus, it is assumed that those covered by the census survey are doing green jobs –
70,187 persons.
In total, it is estimated that there are 112,253 persons or 8 per cent of the total 1.4 million
employed in agriculture sector working on green jobs. This needs to be checked through
further interviews and additional data.
22 M.N. Kailany: Smallholders in Malaysia (Kuala Lumpur, RSPO, 2011),
http://rt9.rspo.org/ckfinder/userfiles/files/P7_6_Mohd_Nor_Kailany.pdf [accessed 15 May 2012].

32
6.2 Energy
Energy demand grows in parallel with economic growth in Malaysia, even more so as the
country strives to become a high-income economy. Based on the Economic Transformation
Programme (ETP), the combined oil, gas and energy sectors represented MYR127 billion (or
19 per cent of GDP) in 2009. In 2011, electricity demand grew 3.1 per cent largely due to
strong performances of the commercial and domestic sectors. By 2020, it is forecasted that
the total installed capacity will increase by 16 per cent compared to 2012. An estimated 10.8
gigawatts of new energy generation capacity will be needed by 2020 given that 7.7 gigawatts
of existing capacity are due for retirement.23
The National Energy Policy has three principal objectives that guide future energy sector
developments based on supply, utilization and the environment:
For supply, the main aim is to extend the life of domestic resources and diversify
away from oil to promote other energy forms.
Utilization depends heavily on the industry and consumers to integrate energy
efficiency programmes and develop demand-side initiatives to curb consumption.
Energy and the environment are linked at every level, thus the requirement for
mandatory assessment to address negative impacts.
6.2.1 Importance of the sector and key trends
Malaysia is blessed with fossil fuel resources, namely oil and gas that has fuelled the
nation to the state it is now. The current energy mix is dependent on fossil fuels, about 94
per cent of the total. Oil and gas reserves are projected to decline by 1 to 2 per cent per
year on average in the coming decade. With the depletion in piped gas from local sources,
the use of liquefied natural gas (LNG) could prove to be one of the future solutions for
electricity generation.
Of the estimated additional new capacity in 2020, gas and coal will likely continue to be
the dominant source, with coal probably taking up a bigger share on the basis of rising
gas prices. Malaysia is targeting a 5 per cent annual growth for the oil, gas and energy
sector in the decade from 2010 to 2020. With this trend, reducing energy-related GHG
emissions will remain a challenge.
The government is studying nuclear as a long-term fuel option for power generation.
Based on the outcome of the studies and guidance by the International Atomic Energy
Association (IAEA) as well as acceptance of the population, the government will then
decide on embarking on the nuclear route for power generation.
Previously, overdependence on fossil fuel sources stunted the growth of the renewable
energy sector. Recently, with increased awareness of the need to diversify energy sources
as well as the value of building a sustainable energy platform for growth, development of
renewable energy and promotion of energy efficiency and energy conservation have been
intensified.
Malaysia has the world’s second-largest manufacturing complex for PV cells at 900 MW
capacity (second to Suntech in China), run by the US company First Solar Inc., now the
23 Based on the speech of Y.B. Dato Sri Ptere Chin FahKui on “The Future of Energy in Malaysia”, 24 Apr. 2012,
http://www.kettha.gov.my/en/content/future-energy-malaysia [accessed 15 May 2012].

33
global leader in production of PV panels. Former number one producer Q-Cells of
Germany also has a 300 MW plant in Malaysia, and top-ten firm, Sunpower, is building a
plant. According to United Nations Commodity Trade data, Malaysia exported US$840
million in solar equipment in 2009. Data compiled by Photon International indicate that
Malaysia accounted for 8 per cent of the global production of PV products in 2009, and
with the new Q-Cells plant accounts for 9 per cent of global capacity. PV exports
accounted for MYR2.8 billion, or more than 10 times the estimated value of exports of
goods and services in traditional environmental goods and services segments.
6.2.2 Key trends towards sustainability
The National Renewable Energy Policy and Action Plan were approved by the
Government on 2 April 2010. The Renewable Energy Act, which is one of the pillars of
the policy, introduced the implementation of the Feed-in Tariff (FIT) system. The FIT is a
premium in which the renewable power is sold according to each source. The introduction
of the Renewable Energy Act also provided a mandatory requirement for the utility
companies to accept and buy renewable energy power. Both the Renewable Energy Act
and the FIT System were enforced on 1 December 2011.
On 1 September 2011, the Sustainable Energy Development Authority of Malaysia
(SEDA Malaysia) was officially established to undertake the role of a one stop centre to
promote sustainable energy and to help facilitate the renewable energy industry in
Malaysia.
The Small Renewable Energy Programme allows renewable projects with up to 10 MW
of capacity to sell their electricity output to Tenaga Nasional Berhad (TNB), under 21-
year license agreements. In 2005 there were 28 approved biomass projects involving the
installation of 194 MW of grid-connected capacity. There were also four approved
landfill gas-based projects, with 9 MW of capacity, and 18 mini-hydroelectric projects
offering 69.9 MW of total capacity.
The National Energy Efficiency Master Plan (NEEMP) was developed to strategize
efforts to address issues on energy security, global warming and climate change. NEEMP
has a set target for a period of ten years starting from 2012, with estimated accumulated
energy savings from industrial, commercial and residential sectors will be 79.8 terawatt-
hours (TWh) which is also expected to reduce 59.16 million tonnes of CO2 and save an
equivalent 3.6 gigawatts (GW) generation capacity based on current generation load.
The Malaysian government has started to implement the B5 mandate (a blend of 5 per
cent palm methyl esters in diesel) in stages within the country, but domestic
consumption is not expected to increase sharply in the near term.
Other polices relevant to the green jobs in the energy sector include the National Policy
on Climate Change (2009), National Green Technology Policy (2009), and Clean Air
Action Plan (2011–15).
6.2.3 Identified sub-sectors and screening criteria
Based on the above-mentioned policy trends and enabling environment as well as relevant
studies, six sub-sectors for green jobs in energy are identified, namely energy efficiency,
solar photovoltaics, hydropower, biomass and biogas.
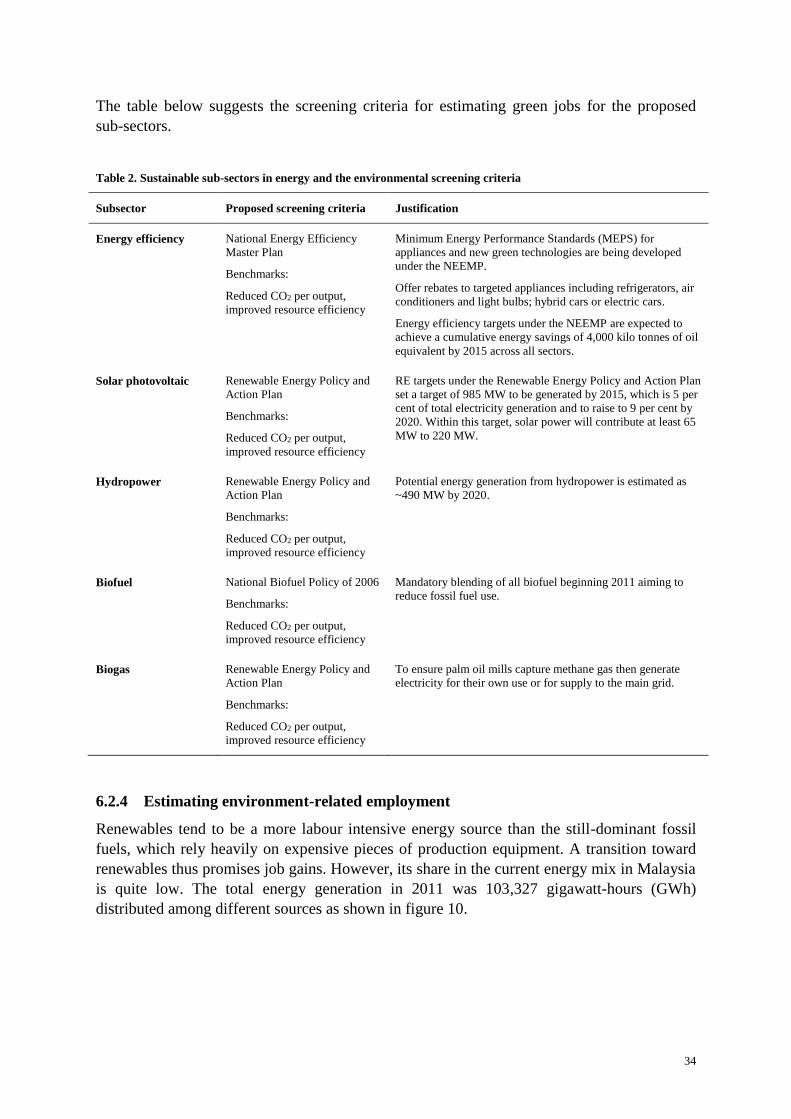
34
The table below suggests the screening criteria for estimating green jobs for the proposed
sub-sectors.
Table 2. Sustainable sub-sectors in energy and the environmental screening criteria
Subsector Proposed screening criteria Justification
Energy efficiency
National Energy Efficiency
Master Plan
Benchmarks:
Reduced CO2 per output,
improved resource efficiency
Minimum Energy Performance Standards (MEPS) for
appliances and new green technologies are being developed
under the NEEMP.
Offer rebates to targeted appliances including refrigerators, air
conditioners and light bulbs; hybrid cars or electric cars.
Energy efficiency targets under the NEEMP are expected to
achieve a cumulative energy savings of 4,000 kilo tonnes of oil
equivalent by 2015 across all sectors.
Solar photovoltaic Renewable Energy Policy and
Action Plan
Benchmarks:
Reduced CO2 per output,
improved resource efficiency
RE targets under the Renewable Energy Policy and Action Plan
set a target of 985 MW to be generated by 2015, which is 5 per
cent of total electricity generation and to raise to 9 per cent by
2020. Within this target, solar power will contribute at least 65
MW to 220 MW.
Hydropower Renewable Energy Policy and
Action Plan
Benchmarks:
Reduced CO2 per output,
improved resource efficiency
Potential energy generation from hydropower is estimated as
~490 MW by 2020.
Biofuel National Biofuel Policy of 2006
Benchmarks:
Reduced CO2 per output,
improved resource efficiency
Mandatory blending of all biofuel beginning 2011 aiming to
reduce fossil fuel use.
Biogas Renewable Energy Policy and
Action Plan
Benchmarks:
Reduced CO2 per output,
improved resource efficiency
To ensure palm oil mills capture methane gas then generate
electricity for their own use or for supply to the main grid.
6.2.4 Estimating environment-related employment
Renewables tend to be a more labour intensive energy source than the still-dominant fossil
fuels, which rely heavily on expensive pieces of production equipment. A transition toward
renewables thus promises job gains. However, its share in the current energy mix in Malaysia
is quite low. The total energy generation in 2011 was 103,327 gigawatt-hours (GWh)
distributed among different sources as shown in figure 10.
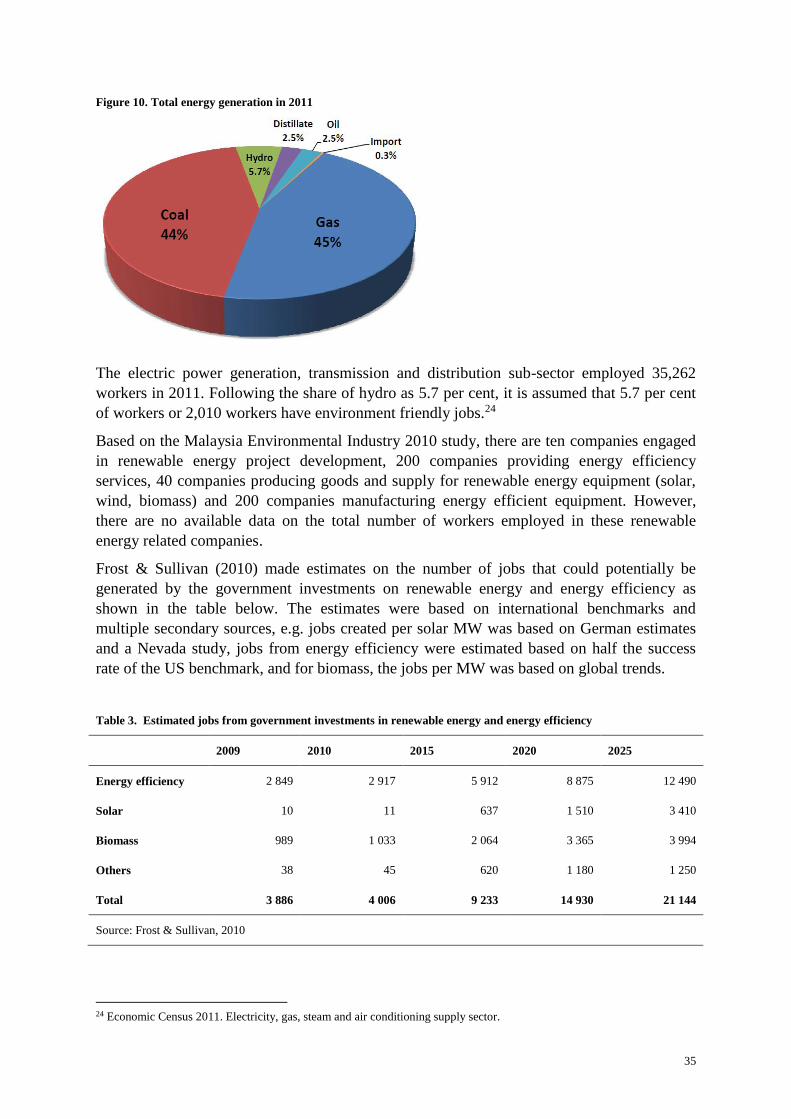
35
Figure 10. Total energy generation in 2011
The electric power generation, transmission and distribution sub-sector employed 35,262
workers in 2011. Following the share of hydro as 5.7 per cent, it is assumed that 5.7 per cent
of workers or 2,010 workers have environment friendly jobs.24
Based on the Malaysia Environmental Industry 2010 study, there are ten companies engaged
in renewable energy project development, 200 companies providing energy efficiency
services, 40 companies producing goods and supply for renewable energy equipment (solar,
wind, biomass) and 200 companies manufacturing energy efficient equipment. However,
there are no available data on the total number of workers employed in these renewable
energy related companies.
Frost & Sullivan (2010) made estimates on the number of jobs that could potentially be
generated by the government investments on renewable energy and energy efficiency as
shown in the table below. The estimates were based on international benchmarks and
multiple secondary sources, e.g. jobs created per solar MW was based on German estimates
and a Nevada study, jobs from energy efficiency were estimated based on half the success
rate of the US benchmark, and for biomass, the jobs per MW was based on global trends.
Table 3. Estimated jobs from government investments in renewable energy and energy efficiency
2009 2010 2015 2020 2025
Energy efficiency 2 849 2 917 5 912 8 875 12 490
Solar 10 11 637 1 510 3 410
Biomass 989 1 033 2 064 3 365 3 994
Others 38 45 620 1 180 1 250
Total 3 886 4 006 9 233 14 930 21 144
Source: Frost & Sullivan, 2010
24 Economic Census 2011. Electricity, gas, steam and air conditioning supply sector.

36
The Frost & Sullivan estimates may no longer be valid. In one PV company alone, First Solar
Malaysia employs 3,500 workers as of November 2012 from 109 in 2007.
6.2.5 Decent work
Based on the employment profile under the electricity, gas, steam and air conditioning supply
sector wherein power generation, transmission and distribution accounts for 85.80 per cent,
the salaries and wages of workers are listed below:
Table 4. Wages of workers under the electricity, gas, steam and air conditioning supply sector
Category of workers Paid fulltime employees Salaries and wages Average salaries
and wages
received per
annum (MYR) Number % MYR millions %
Managerial, professional and
executive
6 466 16.0 921.5 30.6 142 515
Technical and supervisory 18 943 46.7 1 416.9 47.1 74 800
Clerical and related
occupations
6 883 17.0 377.7 12.5 54 868
General workers 8 241 20.3 294.9 9.8 35 788
Total 40 533 100.0 3 011 100.0 74 286
Source: IGES, 2012
The salary even for general workers is quite high. A majority of the workers, 73.40 per cent
have SPM/SPMV qualifications while 13.9 per cent have a STPM diploma or equivalent
qualification and 12.70 per cent have university degree diploma or higher qualification. As
full-time employees, it follows that they also have full social and health benefits. Thus, it is
assumed that workers in this sector have decent work conditions.
6.2.6 Estimating green jobs
With the combined environment and decent work criteria, it is roughly estimated that there
are about 5,510 existing greens jobs in the energy sector – 2,010 in power generation,
transmission and distribution and 3,500 in PV manufacturing. Note that this could be a very
low estimate considering the number of companies in renewable energy and energy
efficiency industries for which employment data are not available. Further surveys and
interviews are needed to refine the estimates.
37
6.3 Water and wastewater management
Malaysia receives an average annual rainfall of 3,000 mm. Water resources development has
been a catalyst for the socio-economic development of the country during the past decades.
Dams and kilometres of pipelines and canals divert water from rivers to sustain domestic,
industrial and agricultural needs. Lately, the water situation for the country has changed from
one of relative abundance to one of scarcity. Population growth, urbanization,
industrialization and the expansion of irrigated agriculture are imposing rapidly growing
demands and pressures on the water resources, besides contributing to the rising water
pollution. Water management is becoming increasingly comprehensive and complicated due
to large concentrations of population, commercial activities and industries around the cities
and towns, increasing water consumption, increasing water pollution, increasing land use
conflicts and climate change impacts. At the same time, any new development of water
resources to meet the ever-increasing demand faces rigorous scrutiny from environmentalists
and conservationists.
Surface water provides 97 per cent of water supply for domestic, industrial, and agricultural
use. About 80 per cent of the water withdrawn from the river system is used for irrigation
purposes. In the future, the percentage of water use for domestic and industrial uses is
expected to command a bigger share of the water withdrawn from surface water sources.
Potable water supply coverage extends to most areas throughout the country with the
exception of a few isolated spots where the water supply network coverage remains difficult
or inaccessible due to physical or geographical factors. Groundwater wells or rural water
supply scheme systems will be provided in those spots (IGES, 2012).
The role of KeTTHA is to: (i) formulate and implement of national water policy; (ii) plan and
develop strategic directions; (iii) formulate licensing and supervising policy and framework;
(iv) plan, evaluate and monitor development projects; (v) create a regulatory system that is
dynamic and progressive; and (vi) ensure a suitable environment for the development of the
water service industry.
6.3.1 Importance of the sector and key trends
Because of the strong water-development linkage, water is a cutting-cross factor for all
sectors of national development. In 1995, total water withdrawal was estimated at 12.5
km3, or less than 3 per cent of available resources. Seventy-six per cent of water was used
for agriculture, 11 per cent for municipal water supplies and 13 per cent for industries.
Thus, only less than 1 per cent of the available water resources are used for the drinking
water supply. According to the United Nations’ Joint Monitoring Programme for Water
Supply and Sanitation, 100 per cent of the Malaysian population had access to an
improved water source and 96 per cent had access to improved sanitation in 2008.
The Federal Government allocated MYR4 billion for water supply projects under the
Eighth Malaysia Plan (2001–05). This is almost double the allocation under the Seventh
Malaysia Plan. The Eighth Malaysia Plan also recommends water demand management
as a tool to ‘stretch’ existing supplies and delay the development of large capital-intensive
projects. The table below shows the development expenditure and allocation for water
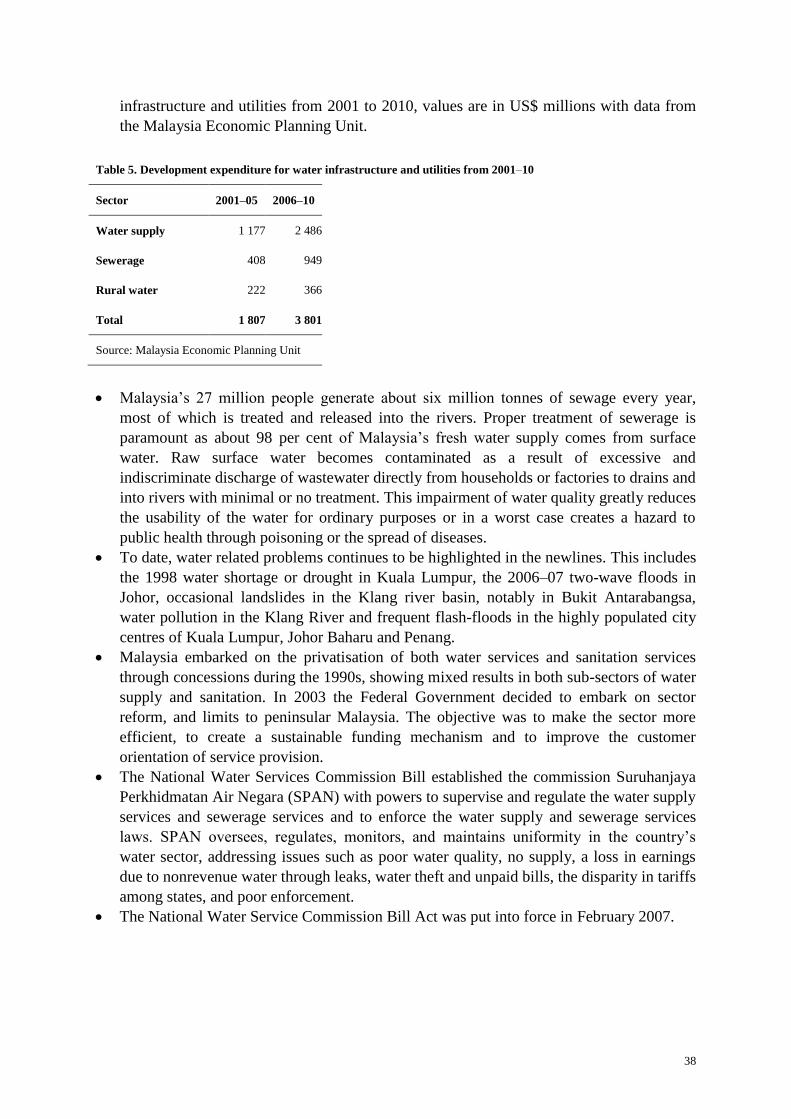
38
infrastructure and utilities from 2001 to 2010, values are in US$ millions with data from
the Malaysia Economic Planning Unit.
Table 5. Development expenditure for water infrastructure and utilities from 2001–10
Sector 2001–05 2006–10
Water supply 1 177 2 486
Sewerage 408 949
Rural water 222 366
Total 1 807 3 801
Source: Malaysia Economic Planning Unit
Malaysia’s 27 million people generate about six million tonnes of sewage every year,
most of which is treated and released into the rivers. Proper treatment of sewerage is
paramount as about 98 per cent of Malaysia’s fresh water supply comes from surface
water. Raw surface water becomes contaminated as a result of excessive and
indiscriminate discharge of wastewater directly from households or factories to drains and
into rivers with minimal or no treatment. This impairment of water quality greatly reduces
the usability of the water for ordinary purposes or in a worst case creates a hazard to
public health through poisoning or the spread of diseases.
To date, water related problems continues to be highlighted in the newlines. This includes
the 1998 water shortage or drought in Kuala Lumpur, the 2006–07 two-wave floods in
Johor, occasional landslides in the Klang river basin, notably in Bukit Antarabangsa,
water pollution in the Klang River and frequent flash-floods in the highly populated city
centres of Kuala Lumpur, Johor Baharu and Penang.
Malaysia embarked on the privatisation of both water services and sanitation services
through concessions during the 1990s, showing mixed results in both sub-sectors of water
supply and sanitation. In 2003 the Federal Government decided to embark on sector
reform, and limits to peninsular Malaysia. The objective was to make the sector more
efficient, to create a sustainable funding mechanism and to improve the customer
orientation of service provision.
The National Water Services Commission Bill established the commission Suruhanjaya
Perkhidmatan Air Negara (SPAN) with powers to supervise and regulate the water supply
services and sewerage services and to enforce the water supply and sewerage services
laws. SPAN oversees, regulates, monitors, and maintains uniformity in the country’s
water sector, addressing issues such as poor water quality, no supply, a loss in earnings
due to nonrevenue water through leaks, water theft and unpaid bills, the disparity in tariffs
among states, and poor enforcement.
The National Water Service Commission Bill Act was put into force in February 2007.
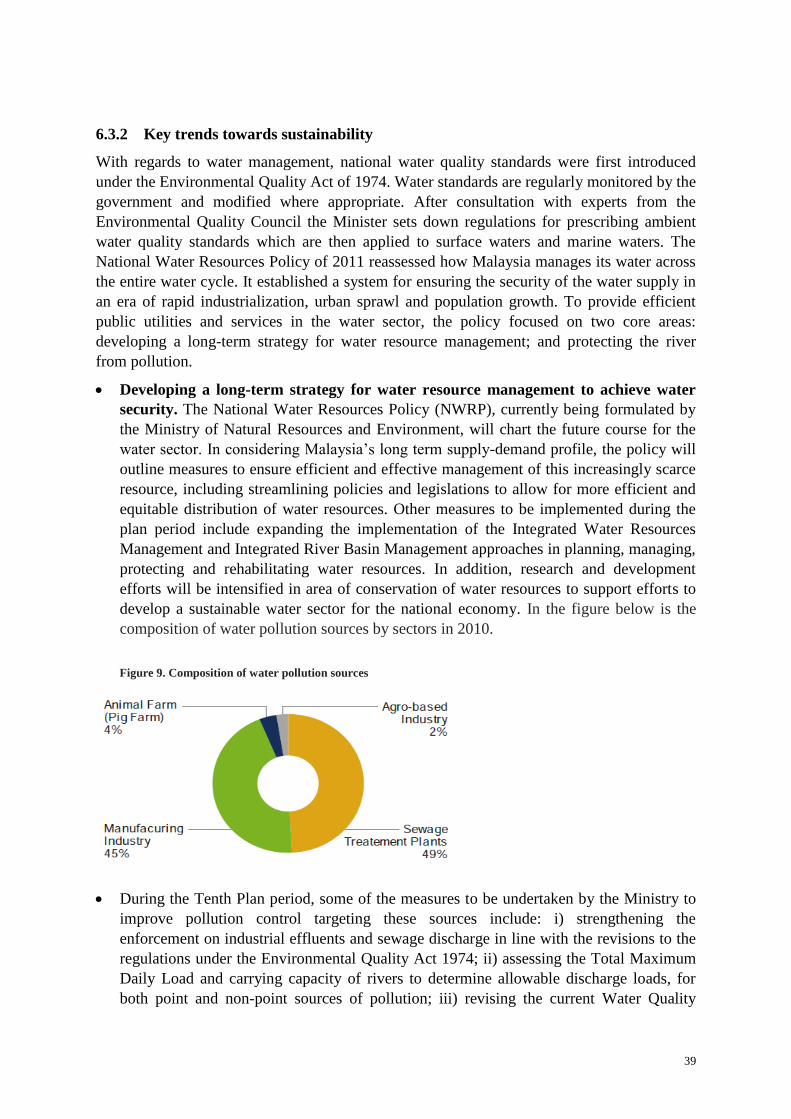
39
6.3.2 Key trends towards sustainability
With regards to water management, national water quality standards were first introduced
under the Environmental Quality Act of 1974. Water standards are regularly monitored by the
government and modified where appropriate. After consultation with experts from the
Environmental Quality Council the Minister sets down regulations for prescribing ambient
water quality standards which are then applied to surface waters and marine waters. The
National Water Resources Policy of 2011 reassessed how Malaysia manages its water across
the entire water cycle. It established a system for ensuring the security of the water supply in
an era of rapid industrialization, urban sprawl and population growth. To provide efficient
public utilities and services in the water sector, the policy focused on two core areas:
developing a long-term strategy for water resource management; and protecting the river
from pollution.
Developing a long-term strategy for water resource management to achieve water
security. The National Water Resources Policy (NWRP), currently being formulated by
the Ministry of Natural Resources and Environment, will chart the future course for the
water sector. In considering Malaysia’s long term supply-demand profile, the policy will
outline measures to ensure efficient and effective management of this increasingly scarce
resource, including streamlining policies and legislations to allow for more efficient and
equitable distribution of water resources. Other measures to be implemented during the
plan period include expanding the implementation of the Integrated Water Resources
Management and Integrated River Basin Management approaches in planning, managing,
protecting and rehabilitating water resources. In addition, research and development
efforts will be intensified in area of conservation of water resources to support efforts to
develop a sustainable water sector for the national economy. In the figure below is the
composition of water pollution sources by sectors in 2010.
Figure 9. Composition of water pollution sources
During the Tenth Plan period, some of the measures to be undertaken by the Ministry to
improve pollution control targeting these sources include: i) strengthening the
enforcement on industrial effluents and sewage discharge in line with the revisions to the
regulations under the Environmental Quality Act 1974; ii) assessing the Total Maximum
Daily Load and carrying capacity of rivers to determine allowable discharge loads, for
both point and non-point sources of pollution; iii) revising the current Water Quality

40
Index to incorporate additional parameters, such as biological parameters, for more
accurate river water classification; iv) developing the National Marine Water Quality
Index to replace the current Marine Water Quality Criteria and Standard, which was
developed in 2008; and v) expanding outreach and awareness programmes targeting
various segments of the society.
By streamlining polices and legislation it allows for the more efficient and equitable
distribution of water resources contributing to an overall higher standard of living for all
in society while generating thousands of new green jobs in the water management,
conservation, monitoring, purification, distribution and sewage sectors.
Great emphasis has been placed on the conservation and preservation of water. The
enactment and enforcement of the SPAN Act in 2007 aimed to address all previous
deficiencies and to provide a holistic approach to the planning and development, operation,
maintenance, and provision of water supply; the management, ownership and control of
rivers and raw water sources; the provision, operation and maintenance of sewerage services;
planning and development of new utility infrastructure for rural and urban areas; the
coordination and integration of all such related services; and the regulation and licensing of
water services operator and providers.
6.3.3 Identified sub-sectors and screening criteria
Based on the above-mentioned policy trends and enabling environment as well as relevant
studies (e.g. Kamarudin, 2012), three sub-sectors for the water sector were identified, namely
water management, wastewater management and water use reduction. Table 6 suggests the
screening criteria for green job estimation for the proposed sub-sectors.
Table 6. Sustainable sub-sectors in water sectors and environmental screening criteria
Sub-sector Proposed screening criteria Justification
Water management
National Water Quality
Standards under
Environmental Quality Act
1974
Interim National Water
Quality Standards 2006
Benchmarks:
Reduced CO2 per output,
improved resource efficiency,
reduced water use
Water Services Industry Act 2006 to regulate water supply
services and sewage services.
National Water Services Commission Act.
National Water Resources Policy 2011 focusing on both a
long-term strategy for water resource management and to
protect the river from pollution.
Waste water
management
Water Services Industry Act
2006
National Water Services
Commission Act
Benchmarks:
Reduced CO2 per output,
improved efficiency, reduced
water use
The National Water Resource Policy of 2010 outlined the
implementation of an integrated tariff for both water and
sewage services moving away from flat rate tariffs.
41
Sub-sector Proposed screening criteria Justification
Water use reduction SuruhanjayaPerkhidmatan Air
Negara (SPAN) Act in 2007
Water Conservation Policy
Adoption of water conservation technologies (e.g. sensor
taps, dual-flush toilets, etc.).
6.3.4 Estimating environment-related employment
The large and reasonably well-developed segments of water utilities and wastewater
treatment have evolved and emerged from a cycle of privatization, nationalization and re-
privatization (albeit with government ownership), and now the leading companies have
aspirations to be competitive regional players.
Based on the EGS data in 2009, employment in water and wastewater management providing
environment friendly services and products are as follows:
Water equipment and chemicals 1,020 persons
Wastewater treatment (municipal and individual) 4,120 persons
Water utilities 4,820 persons
Total 9,960 persons
The water utilities segment is led by the following companies, which are state corporatized
and privatized water management companies:
SAJ Holdings Sdn. Bhd.
Air Kelantan Sdn. Bhd.
Laku Management Sdn. Bhd.
PerbadananBekalan Air Pulau Pinang Sdn. Bhd.
Syarikat Bekalan Air Selangor Sdn. Bhd. (SYABAS).
Syarikat Air Terengganu Sdn. Bhd.
Syarikat Air Melaka Berhad.
Konsortium ABASS Sdn. Bhd. (KPS).
The wastewater treatment segment is led by the following companies:
Indah Water Konsortium Sdn. Bhd.
Taliworks Corporation Berhad.
Veolia Water Malaysia (VWS Industrial Services).
200–300+ others.
The water equipment and chemicals segment is led by the following companies:
Nalco Industrial Services Malaysia Sdn. Bhd.
Biwater (Malaysia) Sdn. Bhd.
Kurita Water.
Organo Asia.
42
Ionics Technology Sdn. Bhd.
Envirogard Sdn. Bhd.
Water Engineering Technology Sdn. Bhd.
Universal Environmental Resources Sdn. Bhd.
KIJ Ultra Supreme Filtration Sdn. Bhd.
Tsurumi Pump (M) Sdn. Bhd.
Sime Group.
Berjaya Group.
YTL Group.
6.3.5 Decent work
According to the ILO (2011), a number of indicators show that health, safety and training are
important employment issues that are often marginalized in the water sector. Workers are
subject to poor conditions in dangerous environments that often include pollutants, working
underground or in confined spaces together with the traditional hazards of industrial plants.
For Malaysia, information is not available for the estimation of those jobs which do not
satisfy the occupational safety and health (OSH) standards for the decent work criteria and
need to be filled in the gap by expert opinion, government statistics or surveys. It is assumed
that the companies covered in the EGS survey comply with decent work criteria.
6.3.6 Estimating green jobs
There are about 9,960 green jobs in the water and wastewater sector based on the
assumptions discussed.
6.4 Solid waste management
Waste management in Malaysia is clearly divided into scheduled or hazardous waste and
solid waste. Scheduled waste is under the purview of Department of Environment, Ministry
of Natural Resource and Environment, whereas solid waste falls under the jurisdiction of the
newly established Department of National Solid Waste Management, Ministry of Housing
and Local Government. The Environmental Quality Act 1974 laid down the regulations
pertaining to scheduled waste management while the Solid Waste and Public Cleansing
Management Act 2007 ensures that solid waste is properly managed.
6.4.1 Importance of the sector and key trends
Scheduled waste
In the scheduled waste sector, one priority area set by the Department of the Environment is
waste from electrical and electronic equipment known as e-waste, due to the huge amount
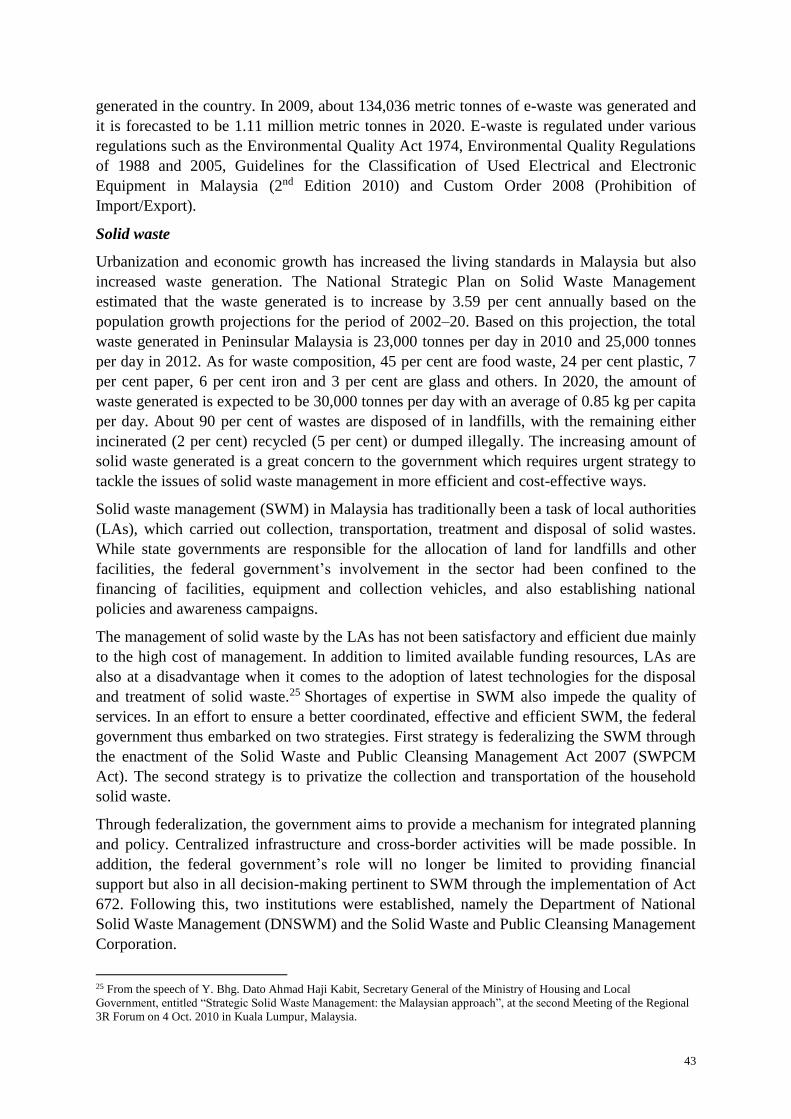
43
generated in the country. In 2009, about 134,036 metric tonnes of e-waste was generated and
it is forecasted to be 1.11 million metric tonnes in 2020. E-waste is regulated under various
regulations such as the Environmental Quality Act 1974, Environmental Quality Regulations
of 1988 and 2005, Guidelines for the Classification of Used Electrical and Electronic
Equipment in Malaysia (2nd Edition 2010) and Custom Order 2008 (Prohibition of
Import/Export).
Solid waste
Urbanization and economic growth has increased the living standards in Malaysia but also
increased waste generation. The National Strategic Plan on Solid Waste Management
estimated that the waste generated is to increase by 3.59 per cent annually based on the
population growth projections for the period of 2002–20. Based on this projection, the total
waste generated in Peninsular Malaysia is 23,000 tonnes per day in 2010 and 25,000 tonnes
per day in 2012. As for waste composition, 45 per cent are food waste, 24 per cent plastic, 7
per cent paper, 6 per cent iron and 3 per cent are glass and others. In 2020, the amount of
waste generated is expected to be 30,000 tonnes per day with an average of 0.85 kg per capita
per day. About 90 per cent of wastes are disposed of in landfills, with the remaining either
incinerated (2 per cent) recycled (5 per cent) or dumped illegally. The increasing amount of
solid waste generated is a great concern to the government which requires urgent strategy to
tackle the issues of solid waste management in more efficient and cost-effective ways.
Solid waste management (SWM) in Malaysia has traditionally been a task of local authorities
(LAs), which carried out collection, transportation, treatment and disposal of solid wastes.
While state governments are responsible for the allocation of land for landfills and other
facilities, the federal government’s involvement in the sector had been confined to the
financing of facilities, equipment and collection vehicles, and also establishing national
policies and awareness campaigns.
The management of solid waste by the LAs has not been satisfactory and efficient due mainly
to the high cost of management. In addition to limited available funding resources, LAs are
also at a disadvantage when it comes to the adoption of latest technologies for the disposal
and treatment of solid waste.25 Shortages of expertise in SWM also impede the quality of
services. In an effort to ensure a better coordinated, effective and efficient SWM, the federal
government thus embarked on two strategies. First strategy is federalizing the SWM through
the enactment of the Solid Waste and Public Cleansing Management Act 2007 (SWPCM
Act). The second strategy is to privatize the collection and transportation of the household
solid waste.
Through federalization, the government aims to provide a mechanism for integrated planning
and policy. Centralized infrastructure and cross-border activities will be made possible. In
addition, the federal government’s role will no longer be limited to providing financial
support but also in all decision-making pertinent to SWM through the implementation of Act
672. Following this, two institutions were established, namely the Department of National
Solid Waste Management (DNSWM) and the Solid Waste and Public Cleansing Management
Corporation.
25 From the speech of Y. Bhg. Dato Ahmad Haji Kabit, Secretary General of the Ministry of Housing and Local
Government, entitled “Strategic Solid Waste Management: the Malaysian approach”, at the second Meeting of the Regional
3R Forum on 4 Oct. 2010 in Kuala Lumpur, Malaysia.

44
The role of the DNSWM is to prepare national policies and strategies, including decisions on
the location, type and size of new treatment facilities and the coverage area of each facility.
The Corporation on the other hand serves as the enforcement agency to ensure proper
implementation and enforcement of SWM laws. The Corporation also ensures compliance
with standards, specifications and codes of practice relating to SWM services. Although the
LAs no longer have a legal and direct role, their cooperation is still necessary to ensure SWM
being managed in a holistic manner.
The main objectives of the privatization of waste collection are cost reduction and service
quality improvement. Key Performance Indicators (KPIs) are set and included in the
concession agreement, with which the concessionaires will be able to carry out their
responsibilities in an effective and efficient manner. In addition, penalties on non-compliance
of the KPIs are imposed to ensure fairer competitions.
6.4.2 Key trends towards sustainability
Currently there are 290 landfills, of which 176 are still in operation. Out of this, only seven
are sanitary. To address this situation, Malaysia has planned three major steps to prevent
pollution from landfilling: i) safe closure of non-sanitary landfills that are not in operation; ii)
upgrading of landfills that are in operation to be sanitary; and iii) building new sanitary
landfills.
As landfilling has its constraints, in particular in land appropriation, generation of methane, a
greenhouse gas with high global warming potential, and pollution of underground water, etc.,
the government plans to embark on the adoption of new technologies in improving treatment
and disposal process of solid waste, such as thermal treatment technology, anaerobic digester,
material recovery facility and Refuse Derived Fuel (RDF). The government is actively
assessing business models for building plants with new technologies and operation by public-
private partnership to reduce government’s capital and operating expenditure. With this end,
the government has established the National Solid Waste Technology Assessment Committee
with the function to assess and endorse proposed SWM technologies based on the financial
model and cost-benefit analysis.
Closely related to waste management is the government’s strategy to support environmentally
sound activities such as recycling. Waste minimization using the 3Rs concept (reduce, reuse
and recycle) will continue to remain as a high priority in holistic waste management
planning. For e-waste, measures taken to encourage recycling are directed to licensing
recovery facilities and stopping e-waste generated from being exported outside the country.
Currently there are 138 e-waste recovery facilities in Malaysia, 16 out of which are the full
recovery facilities and the others are the partial recovery facilities. E-waste is allowed to be
exported if local recovery facilities do not have the capacity to carry out such activities.
For solid waste, the SWPCM Act addresses solid waste management in a comprehensive
manner, from waste generation to collection, treatment and disposal, with emphasis on the
3Rs. The SWPCM Act provides a wide range of instruments to supplement traditional
regulatory tools, including powers to establish take-back systems and deposit-refund systems
and powers to require manufacturers to use recycled materials, restrict the use of certain
materials, and reduce waste generation. The SWPCM Act also includes provisions that enable
45
the government to impose any type of sorting of waste for recycling or special treatment and
direct the flow of waste to facilities dedicated for such purpose.
To support the implementation of the SWPCM Act in particular on the 3Rs provision, a new
collection system of household solid waste will be carried out from September 2012 starting
with cities, followed by the municipalities and lastly at the district level. The new collection
system includes once a week collection of recyclables. This requires the households to
separate at source. In addition, all the new sanitary landfills to be constructed will have a
sorting facility on site where all coming waste will go through the sorting machines before
dumped into the landfills.
6.4.3 Identified sub-sectors and screening criteria
Based on the above-mentioned policy trends and enabling environment as well as relevant
studies, three sub-sectors for waste management are identified, namely recycling, waste
disposal and treatment. Table 7 suggests the screening criteria for green job estimation for the
proposed sub-sectors.
Table 7. Sustainable sub-sectors in solid waste management and environmental screening criteria
Sub-sector Proposed screening criteria Justification
Recycling
SWPCM Act of 2007
Environmental Quality Regulations 1988
Environmental Quality Regulations 2005 with
provisions on e-waste
Guidelines for the Classification of Used Electrical
and Electronic Equipment in Malaysia 2010
Reduce, Reuse, Recycle Programme
Benchmarks:
Amount of waste diverted from landfill (per cent of
total waste, recycling or composting rate).
SWPCM Act addresses SWM in a
comprehensive manner, from waste
generation to collection, treatment and
disposal, with emphasis on 3Rs.
Recycling campaign by the Ministry of
Housing and Local Government.
Environmental Quality Regulations 1988
has provisions on the collection, treatment,
recycling and disposal of scheduled waste
including e-waste.
Waste disposal SWPCM Act of 2007
National Strategic Plan for Solid
Waste Management 2005
Benchmarks:
Amount of waste diverted from landfill (per cent of
total waste, recycling or composting rate)
Waste treatment Renewable Energy Act Adoption of waste to energy technology to
generate energy from incineration plant;
capturing methane gas from landfilling;
converting waste into gas and oil; and
composting.

46
6.4.4 Estimating environment-related employment
From the EGS data in 2009, the following are the numbers of environment-related
employment in the solid waste sector:
Waste management equipment 580 persons
Solid waste management services 14,400 persons
Hazardous waste management services (scheduled waste) 800 persons
Total 15,780 persons
6.4.5 Decent work
In the recycling trade, full-time scavengers and part-time municipal collection workers play
an important role in collecting saleable items from garbage and disposal sites and selling to
traders and middlemen, and eventually to manufacturers.26 This job is featured as informal
and dirty causing health problems with risk of diseases. Most of the jobs are taken by
immigrants. Prices offered by traders and middlemen vary from MYR0.2 cent/kg for glass,
0.1 cent/kg for papers, and 0.5 cent/kg for metals. Incomes from scavenging ranges from
MYR900–1500 per month, above the minimum salary level in Malaysia, which is set as
MYR900 per month for peninsular Malaysia. Since these jobs represent a source of income
for workers that often have low education or poor backgrounds, they are important for
poverty alleviation. However, from an OSH viewpoint, these jobs should not be regarded as
decent work and should be excluded from environmentally-related jobs estimation.
ALAM Flora Sdn. Bhd., a subsidiary of DRB–HICOM Berhad, is the largest Solid Waste
Management Company in Malaysia operating in the central and eastern regions of Peninsular
Malaysia, covering the states of Selangor, Pahang, Terengganu, Kelantan and Federal
Territory of Putrajaya and Federal Territory of Kuala Lumpur. ALAM Flora has a total
workforce of more than 3,400 full-time employees and has been operational since 1997.
Alam Flora via its MBM-Alam Flora joint venture initiative based in Bahrain commenced
operations on 1 February 2003. Providing cleansing and waste collection services to the
Island of Golden Smiles, the endeavour simultaneously placed ALAM Flora on the map for
being a major player in solid waste management in the region.
SWM Environment Sdn. Bhd. (formerly known as Southern Waste Management Sdn. Bhd.
(SWM)) was established to manage the storage, collection, transfer, haulage, intermediate
processing and disposal of solid waste in the southern region of Peninsular Malaysia in 1996
in line with the Malaysian Government's decision on the National Privatisation of Solid
Waste Management. SWM has grown into an established solid waste collection and
management services concessionaire with a workforce of more than 5,000 full-time
employees serving 25 local councils throughout the states of Johor, Malacca, and Negeri
Sembilan. With the passing of the Solid Waste and Public Cleansing Management Act 2007,
SWM claims to be poised to be a major solid waste collection and management services
provider in the states of Johor, Malacca and Negeri Sembilan providing an integrated waste
management service.
26 S. Siwar: Solid waste management: Recycling, green jobs and challenges in Malaysia (Institute for Environment and
Development, University Kebangsaan Malaysia, 2008), presented at the ILO Research Conference: Green Jobs for Asia and
the Pacific, Niigata, Japan, 21-23 Apr. 2010.

47
Based on the profile of the two major solid waste management service providers, it is
assumed that those companies considered in the EGS survey comply with decent work
criteria.
6.4.6 Estimating green jobs
With the assumption above wherein solid waste management companies included in the EGS
survey also satisfy the decent work criteria, the number of green jobs in the sector is
estimated at 15,780.
6.5 Transport
The role of the transport sector is crucial in a country like Malaysia, which has a very open
economy and generates a huge volume of trade – totalling more than 391 million tonnes in
2009 – to be transported to both domestic and global markets. An efficient and reliable
transport system is also essential to improve the standard and sustainability of quality of life.
One of the key aims under the Ninth Plan and continued in the Tenth Plan, is the focus on
providing good quality public transport.
6.5.1 Importance of the sector and key trends
As an overview of the whole sector, census data combine transportation and storage services.
Based on the census results in 2011, analysing 2010 data, a total of 40,599 establishments
were recorded as operating in the transportation and storage services in 2010 employing
about 312,962 persons, of which 85.2 per cent or 266,536 persons were paid full-time
employees. The value of gross output grew 5.9 per cent in 2010 (MYR76,319) compared to
2003 figures (MYR50,970). The summary of the performance of transportation and storage
services is presented in the figure below.
Figure 11. Percentage distribution of key indicators by type 2010

48
From the figures above, the most number of establishments (89.2 per cent) which employs
about half of the total employment (48 per cent) in the sector are engaged in the land
transport sub-sector. Industries included under land transport are train services, bus services,
freight transport by road, taxis and rental of cars and other land transport. Taxis and rental
cars accounted for about half the number of establishments, with 17,232 followed by bus
services and freight transport by road, 10,325 establishments or 28.5 per cent and 7,761
establishments or 21.4 per cent respectively.
Another growing trend is private vehicle ownership which is associated with externalities
such as traffic congestion, road accidents, inadequate parking space, air pollution and
increased carbon dioxide emissions. The motorization growth rate in Malaysia is more than
10 per cent per annum, one of the fastest growth rates in the world. In fact, there are more
privately owned vehicles in Malaysia than registered drivers, 17.4 million private vehicles
and 11.7 million registered drivers out of the total population of population of 28.3 million in
2010, see figure 12. The dependence on private automobiles, as shown in figure 13, is driven
partly by increasing affluence, rapid urban development, growing population and inadequate
public transport facilities and services.
Figure 12. New registered motor vehicles by type in 2010
Figure 13. Current growth trends in private vehicle ownership in Malaysia
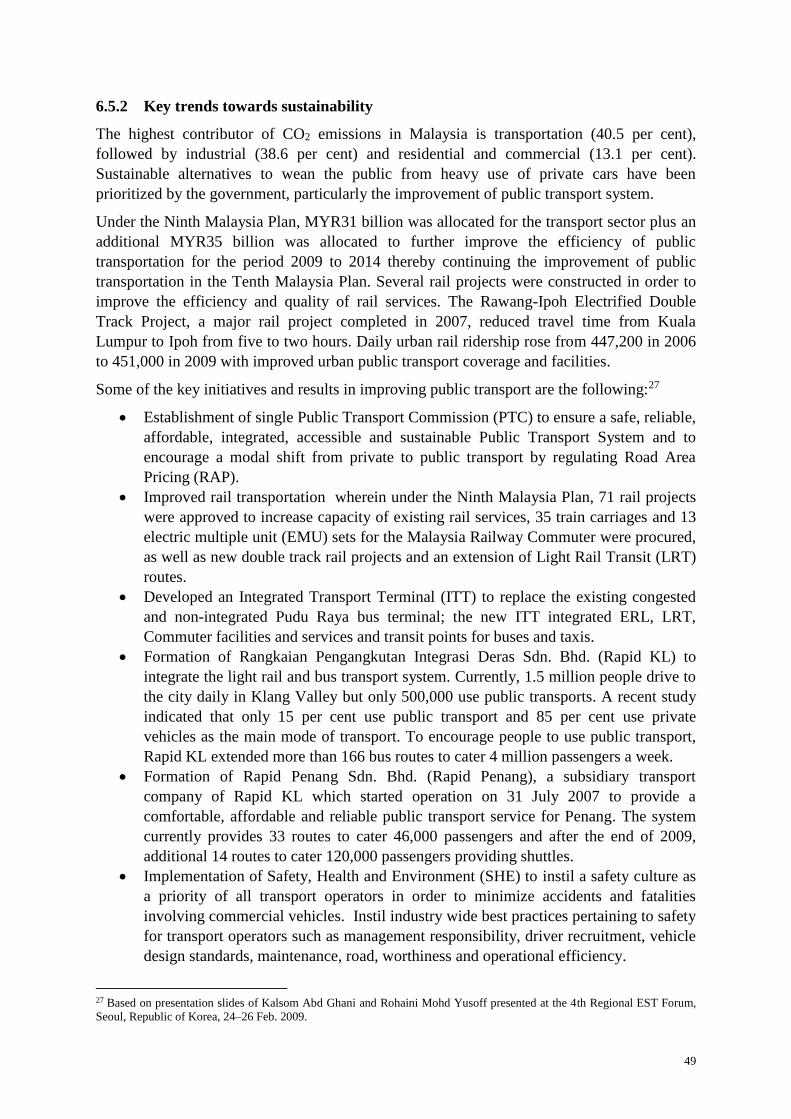
49
6.5.2 Key trends towards sustainability
The highest contributor of CO2 emissions in Malaysia is transportation (40.5 per cent),
followed by industrial (38.6 per cent) and residential and commercial (13.1 per cent).
Sustainable alternatives to wean the public from heavy use of private cars have been
prioritized by the government, particularly the improvement of public transport system.
Under the Ninth Malaysia Plan, MYR31 billion was allocated for the transport sector plus an
additional MYR35 billion was allocated to further improve the efficiency of public
transportation for the period 2009 to 2014 thereby continuing the improvement of public
transportation in the Tenth Malaysia Plan. Several rail projects were constructed in order to
improve the efficiency and quality of rail services. The Rawang-Ipoh Electrified Double
Track Project, a major rail project completed in 2007, reduced travel time from Kuala
Lumpur to Ipoh from five to two hours. Daily urban rail ridership rose from 447,200 in 2006
to 451,000 in 2009 with improved urban public transport coverage and facilities.
Some of the key initiatives and results in improving public transport are the following:27
Establishment of single Public Transport Commission (PTC) to ensure a safe, reliable,
affordable, integrated, accessible and sustainable Public Transport System and to
encourage a modal shift from private to public transport by regulating Road Area
Pricing (RAP).
Improved rail transportation wherein under the Ninth Malaysia Plan, 71 rail projects
were approved to increase capacity of existing rail services, 35 train carriages and 13
electric multiple unit (EMU) sets for the Malaysia Railway Commuter were procured,
as well as new double track rail projects and an extension of Light Rail Transit (LRT)
routes.
Developed an Integrated Transport Terminal (ITT) to replace the existing congested
and non-integrated Pudu Raya bus terminal; the new ITT integrated ERL, LRT,
Commuter facilities and services and transit points for buses and taxis.
Formation of Rangkaian Pengangkutan Integrasi Deras Sdn. Bhd. (Rapid KL) to
integrate the light rail and bus transport system. Currently, 1.5 million people drive to
the city daily in Klang Valley but only 500,000 use public transports. A recent study
indicated that only 15 per cent use public transport and 85 per cent use private
vehicles as the main mode of transport. To encourage people to use public transport,
Rapid KL extended more than 166 bus routes to cater 4 million passengers a week.
Formation of Rapid Penang Sdn. Bhd. (Rapid Penang), a subsidiary transport
company of Rapid KL which started operation on 31 July 2007 to provide a
comfortable, affordable and reliable public transport service for Penang. The system
currently provides 33 routes to cater 46,000 passengers and after the end of 2009,
additional 14 routes to cater 120,000 passengers providing shuttles.
Implementation of Safety, Health and Environment (SHE) to instil a safety culture as
a priority of all transport operators in order to minimize accidents and fatalities
involving commercial vehicles. Instil industry wide best practices pertaining to safety
for transport operators such as management responsibility, driver recruitment, vehicle
design standards, maintenance, road, worthiness and operational efficiency.
27 Based on presentation slides of Kalsom Abd Ghani and Rohaini Mohd Yusoff presented at the 4th Regional EST Forum,
Seoul, Republic of Korea, 24–26 Feb. 2009.

50
The Clean Air Action Plan was also included in the Ninth Malaysia Plan aimed to reduce
emissions from motor vehicles and industries, tackle the haze problem, enhance human
capital and capacity building as well as generate more public awareness. From the table
below, note that motor vehicles are the biggest source of carbon oxides and nitrogen oxides.
Table 8. Malaysia air emission loads and pollutant sources in 2007
Pollutant Overall emission
load (tonnes)
Motor vehicles
%
Industries % Power plants % Others %
CO 1 774 396 98 1 1 -
SO2 158 120 16 23 41 20
PM 38 763 28 40 14 18
NOx 563 078 70 12 16 2
Source: Department of Environment of Malaysia
To reduce carbon emissions, cleaner fuel has been promoted – lead free gasoline since 2000,
ENVO diesel (5 per cent palm oil and 95 per cent petroleum diesel) since March 2006 and
the adoption of EURO 2M fuel since 2007. The promotion of green vehicles is also underway
to reduce fossil fuel use and carbon emissions.
6.5.3 Identified sub-sectors and screening criteria
Following the strategic priorities set by the government to: (i) upgrade the quality of transport
infrastructure nationwide; (ii) improve public transport services; (iii) encourage the public to
use public transportation; (iv) reduce the number of vehicles on the road to ease traffic
congestion; (v) reduce air pollution; and (vi) assist the public to enjoy a better healthy
lifestyle, the proposed sub-sectors and screening criteria are as follows:

51
Table 9. Sustainable sub-sectors in transport sector and environmental screening criteria
Sub-sector Proposed screening criteria Justification
Public transport
systems
(LRT, MRT, bus
systems)
Benchmarks:
Reduced CO2 per output,
improved resource efficiency
Increased sustainability (e.g. reduced emissions, environmental
impact) over conventional (fossil fuel) energy production.
Vehicle retro-
fitting
Benchmarks:
Reduced CO2 per output,
improved resource efficiency
Reduced emissions and higher vehicle mileages.
Cleaner fuels
Benchmarks:
Reduced CO2 per output,
improved resource efficiency
Government guidelines:
EURO 4M
Shift to CNG, LPG
Use of biofuels
Reduced emissions
Electric vehicles
Benchmarks:
Reduced CO2 per output,
improved resource efficiency
Reduced emissions, reduced pollution, reduction of fossil fuel
consumption
6.5.4 Estimating environment-related employment
There were 36,224 establishments operating in land transport in 2010 dominated by taxi and
rental cars accounting to 47.6 per cent, followed by bus services (28.5 per cent), freight
transport by road (21.4 per cent) and train services and other transport (2.5 per cent). The
total number of persons working in these services was 150,248 persons. Those that serve on
public transport, bus services and train services, or 46,577 workers could be considered as
having environment friendly jobs.
6.5.5 Decent work
The average annual salary per employee in the land transport services is MYR23,233. It is
above the monthly rate of minimum wage workers earning MYR900 per month. Assuming
compliance of land transport establishments to the decent work criteria, all the jobs counted
in this census for land transport could be considered as decent.
6.5.6 Estimating green jobs
Those that provide public transport services which also satisfy the decent work criteria are
considered as green jobs. Based on the discussions above, it can be said that there are 46,577
green jobs in the transport sector.

52
6.6 Construction
The Economic Census conducted in 2011 for reference year 2010 on the construction sector
indicates that it posted a double digit growth rate in 2010 with 11.1 per cent average annual
growth of gross output. The projects under the second fiscal stimulus package, i.e. upgrading
roads, repairs on schools and government quarters created that growth as well as the
allocations of the Ninth Malaysia Plan that need to be expedited before the end of fiscal
year.28 The sector employed 974,488 persons in 2010 with an increase of 422,733 persons (12
per cent) from 551,755 persons in 2005. Similarly, the total salaries and wages paid also
posted an increase of MYR8.9 billion (12.7 per cent) to record MYR19.8 billion in 2010 in
comparison with MYR10.9 billion in 2005.
6.6.1. Importance of the sector and key trends
The construction sector in Malaysia was dominated by the non-residential sub-sector in 2010,
which increased to MYR27.0 billion (29.6 per cent) in 2010 as compared to MYR10.8 billion
(20.0 per cent) in 2005. The significant increase is credited to rapid construction of industrial
buildings, office buildings and retail buildings especially in Klang Valley. The performance
of other sub-sectors in 2005 and 2010 is illustrated in the figure below.
Figure 14. Performance of the construction sub-sector by gross output 2005–1029
In terms of project ownership, private owned construction projects contributed MYR63.4
billion (70.4 per cent), almost two-thirds of total value of work done while the remaining
one-third was owned by the government valued at MYR26.7 billion (29.6 per cent). The high
contribution of privately owned construction projects was driven by the Private Finance
Initiative (PFI) which was identified as a cornerstone of privatization projects under the five-
year plan by the government. Note in table 10 that government projects were concentrated on
civil engineering projects while private owned leaned more on non-residential projects.
28 Projects under the Ninth Malaysia Plan were double tracking rails, Penang Second Bridge, new Low Cost Carrier (LCCT)
and construction activities in the five Economic Corridors – Iskandar Malaysia (IM), Northern Corridor 29 National Census 2011: Construction
53
Table 10. Value of construction work done by project owners and construction sub-sectors in 2010
Sub-sector Value of construction work done
Total Project owner
Government (GOCP) Private (POCP)
MYR billion MYR billion % share MYR billion % share
Total 90.1 26.7 29.6 63.4 70.4
Non-residential 28.1 10.3 38.6 17.8 28.1
Civil engineering 25.6 11.3 42.3 14.4 22.7
Residential 20.2 2.6 9.7 17.6 27.7
Special trades 16.2 2.5 9.4 13.6 21.5
6.6.2 Focus on buildings
Buildings, either commercial, government or high-rise buildings consume much energy and
resources and emit significant amounts of greenhouse gasses and wastes. In Malaysia, the
energy consumption in this sector was 7,750 GWh in 2008 while emitting 5,301 kilotonnes of
CO2 emissions mainly from electricity utilization. Although the overall CO2 emissions of the
building sector are less than the other sectors (e.g. industry and transport), the annual growth
of the sector at 6.4 per cent annually merits urgent interventions.30
In 2008, the service sector building stock amounted to about 37.806 million square meters in
floor area, of which 11 per cent of buildings were considered energy efficient only
consuming 136 kW/m2/year and below. There is huge potential for improvements by
facilitating the widespread application of energy efficiency technologies and practices in the
sector. Green buildings offer a solution to consuming less energy as well as other resources
during the construction and maintenance stages.
6.6.3 Key trends toward sustainability
The National Policy on Climate Change (2009) through the Strategic Thrust for Renewable
Energy and Energy Efficiency promoted green buildings in commercial, institutional,
industrial and residential sectors through:
application of low or zero energy concepts in the design and construction of new
buildings;
retrofitting of efficient ventilation and cooling systems as well as lighting systems;
energy conservation practices in buildings;
retrofitting existing buildings to include energy efficient features and to generate
renewable energy; and
development of a green building index.
30 Danish Environmental Cooperation Programme, Reference Scenario Assumptions and Results, Malaysian Renewable
Energy and Energy Efficiency Component, Revised May 2005.

54
Green Building Index (GBI)
The Green Building Index (GBI) Malaysia was developed by Pertubuhan Akitek Malaysia
(PAM) and the Association of Consulting Engineers Malaysia (ACEM). It was officially
launched in 2009. The creation of the GBI was a professional driven initiative aimed to lead
the Malaysian property industry towards becoming more environmentally-friendly and
resource efficient. The initiative was fully supported by key players in Malaysia’s building
and property industry – developers, architects, engineers, planners, designers, contractors – as
well as by the government and general public. The rating system provided opportunities for
developers to design and construct green, sustainable buildings that can provide energy
savings, water savings, a healthier indoor environment, better connectivity to public transport
and the adoption of recycling and greenery for their projects.
GBI Malaysia rating is based on six criteria:
Energy efficiency (EE): Improve energy consumption by optimizing building
orientation, minimizing solar heat gain through the building envelope, harvesting
natural lighting, adopting the best practices in building services including the use of
renewable energy, and ensuring proper testing, commissioning and regular
maintenance.
Indoor environmental quality (EQ): Achieve good quality performance in indoor
air quality, acoustics, visual and thermal comfort. These will involve the use of low
volatile organic compound materials, application of quality air filtration, proper
control of air temperature, movement and humidity.
Sustainable site planning and management (SM): Selecting appropriate sites with
planned access to public transportation, community services, open spaces and
landscaping. Avoiding and conserving environmentally sensitive areas through the
development of existing sites and brownfields. Implementing proper construction
management, storm water management and reducing the strain on existing
infrastructure capacity.
Material and resources (MR): Promote the use of environmentally-friendly
materials sourced from sustainable sources and recycling. Implement proper
construction waste management with storage, collection and re-use of recyclables and
construction formwork and waste.
Water efficiency (WE): Rainwater harvesting, water recycling and water-saving
fittings.
Innovation (IN): Innovative design and initiatives that meet the objectives of the
GBI.
Achieving points in these targeted areas will mean that the building will likely be more
environmentally-friendly than those that do not address the problem issues. Under the GBI
assessment framework, points will also be awarded for achieving and incorporating
environmentally-friendly features which are above current industry practice. GBI will
provide an assessable differentiation to promote environmentally-friendly buildings for the
future of Malaysia. It is a benchmarking rating system that incorporates internationally
recognized best practices in environmental design and performance.
The assessment process involves an assessment at design stage (Design Assessment) leading
to the award of the provisional GBI rating. The final award is given one year after the

55
building is first occupied (Completion and Verification Assessment or CVA). Buildings will
also have to be re-assessed every three years in order to maintain their GBI rating to ensure
that buildings are well-maintained. Buildings are awarded GBI Malaysia31 – Platinum, Gold,
Silver or Certified ratings depending on the scores achieved.
The government supports green building initiatives through tax exemption equivalent to 100
per cent of the amount of qualifying expenditure and is allowed to set-off 100 per cent of the
statutory income for each year of assessment valid to buildings awarded GBI certificate from
24 October 2009 until 31 December 2014. Qualifying expenditure means an additional
expenditure incurred in relation to construction of a building, alteration, renovation, extension
or improvement of an existing building. Any unutilized qualifying expenditure can be carried
forward to subsequent years of assessment until the amount is fully exempted. Buyers of
buildings and residential properties awarded GBI certificates acquired from property
developers are eligible for stamp duty exemption on instruments of transfer of ownership of
such buildings. The amount of exemption is on the additional cost incurred to obtain the GBI
certificate. The exemption is given only once for the first transfer of ownership of the
building and for sales and purchase agreements executed from 24 October 2009 until 31
December 2014.
The government also embarked on demonstration building projects that exhibit energy
efficiency and other criteria for green buildings. Notable examples are the Low Energy Office
of the Ministry of Energy, Green Technology and Water and the Zero Energy Office of the
Malaysian Green Technology and Diamond Building of the Energy Commission of Malaysia.
Under the Tenth Malaysia Plan, the government introduced the AFFIRM framework –
Awareness, Faculty, Finance, Infrastructure, Research and Marketing – to develop a complete
ecosystem for environmental sustainability covering green building initiatives, including:
Green townships (starting in Putrajaya and Cyberjaya).
Revision of the Uniform Building By-Laws to incorporate the Malaysian Standard:
Code of Practice on Energy Efficiency and Renewable Energy for Non-Residential
Buildings (MS1525).32
Wider adoption of the GBI to benchmark energy consumption in new and existing
buildings.
The government introduced tax breaks for green buildings and sustainable design elements
such as solar water heaters, rainwater harvesting and water conservation facilities, see table
11. The goal is to initially reduce energy and water consumption by 10 per cent in Putrajaya
government buildings by establishing a Taskforce Committee lead by JabatanKerja Raya
Purtajaya (JKR) and supported by KeTTHA, Jabatan Perdana Menteri (JPM) and other
agencies and building users who will provide technical assistance and basic training to
building managers while monitoring programme implementation. Seminars are organized for
31 Building owners, developers and consultants can make an application for GBI Malaysia assessment via the submission of
an application form and payment of the requisite fee to Green Building Index Sdn. Bhd. (GBISB). Applicants may then
choose to appoint a GBI accredited facilitator to provide professional services. GBISB will appoint accredited certifiers to
assess the projects. Upon completion of the assessment process, the certifier’s report will be forwarded to the GBI
Accreditation Panel to register and award the certification. 32 The GBI Rating tool for Non-Residential Existing Building, launched on 26 April 2010 was turned to the Code of Practice
on the Use of Renewable Energy and Energy Efficiency in Non-Residential Buildings under MS 1525:2001.
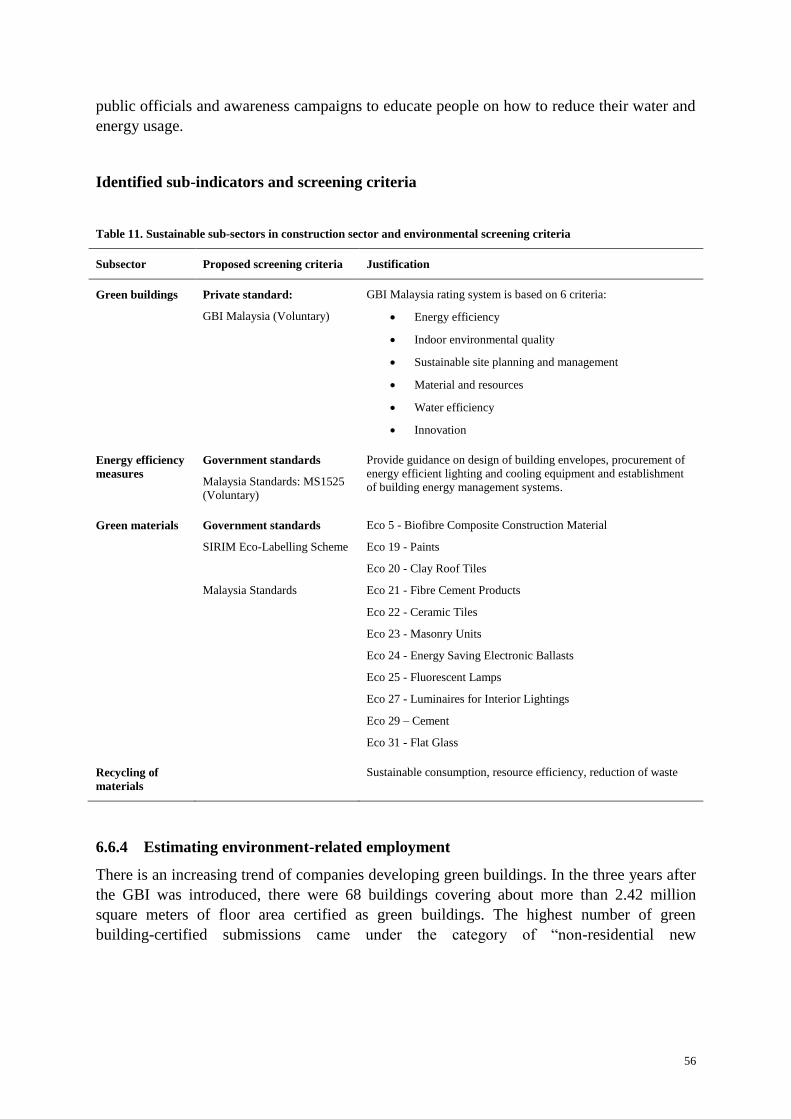
56
public officials and awareness campaigns to educate people on how to reduce their water and
energy usage.
Identified sub-indicators and screening criteria
Table 11. Sustainable sub-sectors in construction sector and environmental screening criteria
Subsector Proposed screening criteria Justification
Green buildings Private standard:
GBI Malaysia (Voluntary)
GBI Malaysia rating system is based on 6 criteria:
Energy efficiency
Indoor environmental quality
Sustainable site planning and management
Material and resources
Water efficiency
Innovation
Energy efficiency
measures
Government standards
Malaysia Standards: MS1525
(Voluntary)
Provide guidance on design of building envelopes, procurement of
energy efficient lighting and cooling equipment and establishment
of building energy management systems.
Green materials Government standards
SIRIM Eco-Labelling Scheme
Malaysia Standards
Eco 5 - Biofibre Composite Construction Material
Eco 19 - Paints
Eco 20 - Clay Roof Tiles
Eco 21 - Fibre Cement Products
Eco 22 - Ceramic Tiles
Eco 23 - Masonry Units
Eco 24 - Energy Saving Electronic Ballasts
Eco 25 - Fluorescent Lamps
Eco 27 - Luminaires for Interior Lightings
Eco 29 – Cement
Eco 31 - Flat Glass
Recycling of
materials
Sustainable consumption, resource efficiency, reduction of waste
6.6.4 Estimating environment-related employment
There is an increasing trend of companies developing green buildings. In the three years after
the GBI was introduced, there were 68 buildings covering about more than 2.42 million
square meters of floor area certified as green buildings. The highest number of green
building-certified submissions came under the category of “non-residential new

57
construction”. There are currently 542 GBI Facilitators and 15 GBI Commission Specialists
or Certifiers.33
In terms of overall employment in the construction sector, the non-residential sub-sector led
in terms of employment with a total of 285,695 persons (29.3 per cent). Next highest was the
civil engineering sub-sector with 251,793 persons (25.8 per cent), then the residential sub-
sector with 223,163 persons (22.9 per cent) and the special trades with 213,837 persons (22.0
per cent), as suggested by figure 15.
Figure 15. Employment by sub-sector 2010 34
The total number of paid full time employees in 2010 was 946,108 persons. The majority of
the employees were categorized as construction/operative workers totalling 811,980 persons
(85.8 per cent). The managerial and professional group accounted for 35,616 persons (3.8 per
cent), technical and supervisory 38,521 persons (4.1 per cent) while clerical and general
workers were 59,991 persons (6.3 per cent).
It is not clear though how many are working on green buildings and those who have the
required “green skills” but are not practicing because of circumstances beyond their control.
To have a rough estimate of the number of persons working on environment-related
employment, the following scenarios and assumptions are considered below.
Scenario Assumptions Estimate (in persons)
1 Based on 2008 data, 11 per cent of 37.806 million
square meters of building floor area are considered
energy efficient, consuming 136 kW/m2/year or
less
Assuming 60 per cent of residential buildings are
high-rise apartments and condominium
developments (Mat Noor and Chris, 2011)
Assuming the same ratio applies to 2010 data, 11
per cent of non-residential and 60 per cent of
residential workers work on energy efficient
buildings
Non-residential workers: 285,695
Residential workers: 133,898
Total: 419,593
11 per cent of total: 46,155
33 The roles and responsibility of GBI Certifiers are to perform the detailed assessment and accreditation of building projects
submitted to the GBI accreditation panel for GBI certification. 34 National Census 2011: Construction

58
2 Assuming the same building stock in 2008, 37.806
million square meters of floor area
Green buildings cover 2.42 million square meters,
(6.4 per cent)
Assuming 60 per cent of residential buildings are
high-rise apartments and condominium
developments
6.4 per cent of total: 26,854
Frost & Sullivan (2009) estimated green jobs in the building sector using ratios of revenues to
employees that were projected to grow in line with the growth of the market size and these
were computed for each sub-sector i.e. building construction services, green building
materials and green building management. It also assumed that 6 per cent of the total market
size for building construction services valued at US$1.12 billion as per the ETP report by
PEMANDU will go green as there are 6 per cent certified green professionals as per
association data. The number of jobs for green building materials includes suppliers of green
building materials manufactured within Malaysia as well as imported materials. Table 12
below shows the baseline (2009) and forecast of a number of jobs that will be generated for
the period between 2010 and 2025 in the construction sector.
Table 12. Construction sector jobs forecast (Frost & Sullivan)
Number of jobs 2009 2010 2015 2020 2025
Building construction services market 1 000 1 025 13 251 14 993 16 963
Building materials market 1 253 1 290 7 568 8 789 10 233
Building management market 7 810 8 591 14 087 25 492 51 273
Total 10 063 10 906 34 906 49 274 78 469
Three estimates are presented following different approaches ranging from about 10,906 to
46,155 environmentally-friendly jobs in the building sub-sector for 2010. To put it in context
with the whole construction sector, its share ranges from 1.11 per cent to 4.74 per cent.
6.6.5 Decent work
The table 13 below shows that a total of 22,140 establishments are engaged in the
construction sector of which 18,499 establishments (83.6 per cent) employ less than 50
persons; employing a total of 220,014 (22.6 per cent) while 1,650 establishments (7.4 per
cent) employing 100–499 persons employed a total of 332,014 persons (34.1 per cent) and
contributed MYR31.1 (34 per cent) to gross output.
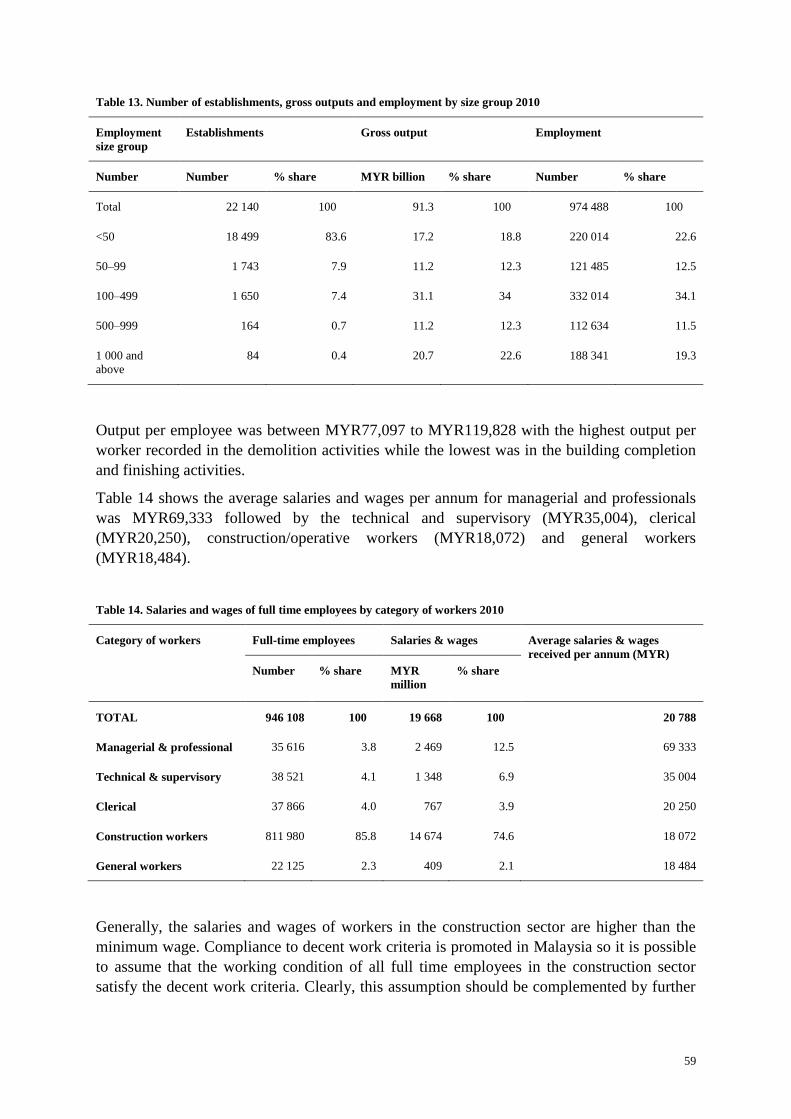
59
Table 13. Number of establishments, gross outputs and employment by size group 2010
Employment
size group
Establishments Gross output Employment
Number Number % share MYR billion % share Number % share
Total 22 140 100 91.3 100 974 488 100
<50 18 499 83.6 17.2 18.8 220 014 22.6
50–99 1 743 7.9 11.2 12.3 121 485 12.5
100–499 1 650 7.4 31.1 34 332 014 34.1
500–999 164 0.7 11.2 12.3 112 634 11.5
1 000 and
above
84 0.4 20.7 22.6 188 341 19.3
Output per employee was between MYR77,097 to MYR119,828 with the highest output per
worker recorded in the demolition activities while the lowest was in the building completion
and finishing activities.
Table 14 shows the average salaries and wages per annum for managerial and professionals
was MYR69,333 followed by the technical and supervisory (MYR35,004), clerical
(MYR20,250), construction/operative workers (MYR18,072) and general workers
(MYR18,484).
Table 14. Salaries and wages of full time employees by category of workers 2010
Category of workers Full-time employees Salaries & wages Average salaries & wages
received per annum (MYR)
Number % share MYR
million
% share
TOTAL 946 108 100 19 668 100 20 788
Managerial & professional 35 616 3.8 2 469 12.5 69 333
Technical & supervisory 38 521 4.1 1 348 6.9 35 004
Clerical 37 866 4.0 767 3.9 20 250
Construction workers 811 980 85.8 14 674 74.6 18 072
General workers 22 125 2.3 409 2.1 18 484
Generally, the salaries and wages of workers in the construction sector are higher than the
minimum wage. Compliance to decent work criteria is promoted in Malaysia so it is possible
to assume that the working condition of all full time employees in the construction sector
satisfy the decent work criteria. Clearly, this assumption should be complemented by further

60
research and consultation with relevant partners, including the constituents and
representatives from the construction and building sector.
6.6.6 Estimating green jobs
Considering the environmentally-friendly jobs that satisfy the decent work criteria from the
above discussions, it is estimated that there are about 10,906 to 46,155 green jobs in the
construction sector which ranges from 1.11 per cent to 4.74 per cent of the overall
construction employment. Further consultations and establishment surveys are needed to
verify the estimates.

61
7. Conclusion and recommendations
This desk research presented a very preliminary basis to explore the possibility of mapping
green jobs in Malaysia. The first two sections laid out the necessary definitions and approach
to the methodology on how the estimation of green jobs will be done.
The sectors profiled in the study have been identified previously by the Malaysian
Government as priority growth areas for green technology development thereby creating
more future green jobs. Nonetheless, a brief discussion on the linkages of economy-
employment-environment and putting it in context to the current government plans provide a
certain degree of clarity why those sectors were chosen in the first place. The non-selection of
other sectors not included in this study does not diminish the existence of and potential to
generate green jobs.
The abundance of available data from the National Census and other affiliate statistical
agencies as well as previous studies is commendable. However, the environmental indicators
are not yet embedded in the indicators used in the establishment or labour force survey so
there is still some disconnect in defining if a service or job is environmentally-friendly or not.
The analysis of different sectors also presented different approaches in estimating the existing
green jobs based on the appropriate method and available data at hand. It should be stressed
that the objective of the mapping exercise is not to establish the accuracy of the green jobs
estimates but to consider those numbers as guides in framing strategies to further clarify what
green jobs are in the context of that particular sector and find ways how to effectively green
that sector.
A matrix of sub-sector environmental screening indicators is provided as well as decent work
criteria as a guide to be able to do a preliminary estimate of green jobs. It should be noted that
the estimates are only as good as the data used. As available and reliable data are scarce, even
non-existent in some cases, very rough assumptions were made to generate indicative
estimates. The estimates should not be viewed as is, or as absolute values, but more as an
indication of a possible range of green jobs within the selected sector or industry.
Overall, the validity of the assumptions made is hinged on rational scenarios but more
information is needed to validate it. The subsequent activities, consultations, focus group
discussions and actual establishment surveys will provide the necessary data and insights to
refine and further validate both the indicators used and the resulting green jobs estimates.

62

63
8. Bibliography
Chen, M.; Vanek, J.; Lund, F.; Heintz, J.; Jhabvala, R.; Bonner, C. 2005. Progress of the
world’s women 2005: Women, work, and poverty (New York, United Nations Fund for
Women).
Chen, S.S.; Zin, H.M. 2006. Good agriculture practice as data source for LCIs on food
agriculture produce. Available at: http://www.aist-
riss.jp/old/lca/asianetwork/symposium/report/2006/powerpoint/07zin.pdf [15 May 2012].
Institute for Global Environmental Strategies (IGES). 2008. Climate change policies in the
Asia and the Pacific: Re-uniting climate change and sustainable development. IGES White
Paper (Hayama, IGES). Available at:
http://pub.iges.or.jp/modules/envirolib/upload/1565/attach/01_front.pdf [15 May 2012].
–. 2009. Outlook on water environmental management in Asia. Water Environment
Partnership in Asia (WEPA) (Hayama, IGES). Available at:
http://pub.iges.or.jp/modules/envirolib/upload/2388/attach/outlook_of_water_environmental_
management_strategies_in_asia.pdf [15 May 2012].
International Labour Organization (ILO). 2012. Introduction to policies and programmes for
Green Jobs (Bangkok, ILO).
Kailany, M.N. 2011. Smallholders in Malaysia. Presented at the ninth Roundtable on
Sustainable Palm Oil, Kuala Lumpur, Malaysia, 23–27 Sep. Available at:
http://rt9.rspo.org/ckfinder/userfiles/files/P7_6_Mohd_Nor_Kailany.pdf [15 May 2012].
Kaur, A. 2008. International migration and governance in Malaysia: Policy and
performance, Asia Papers No. 22 (Armidale, University of New England). Available at:
http://www.une.edu.au/__data/assets/pdf_file/0004/22288/No22.pdf [15 May 2012].
Lindsay, E. 2012. “Malaysia’s GDP driven mainly by services, manufacturing sectors”, in
Borneo Post Online, 20 Apr. Available at:
http://www.theborneopost.com/2012/04/20/malaysias-gdp-driven-mainly-by-services-
manufacturing-sectors/ [15 May 2012].
Malaysian Palm Oil Board (MPOB), 2010. Malaysian palm oil sustainability manual.
Available at: www.mpob.gov.my [15 May 2012].
Mat Noor. N.A., Eves, C. 2011. Malaysia high-rise residential property management: 2004–
2010 trends & scenario. Non-referred paper presented at the 17th Pacific Rim Real Estate
Society Conference, 16–19 Jan.
Ridzuan, R.; Ponggot, S. 2009. Informal sector in Malaysia (Kuala Lumpur, Department of
Statistics, Malaysia).
Siwar, S. 2008. Solid waste management: Recycling, green jobs and challenges in Malaysia.
Presented at the ILO Research Conference Green Jobs for Asia and the Pacific, Niigata,
Japan, 21–23 Apr. 2010.
Sreenevasan, A. 2006. Obligations of labour contractors and agents. Presented at the
Lawasia Labour Law Conference – Labour Migration: International and National Progress,
Kuala Lumpur, 26 Aug.

64
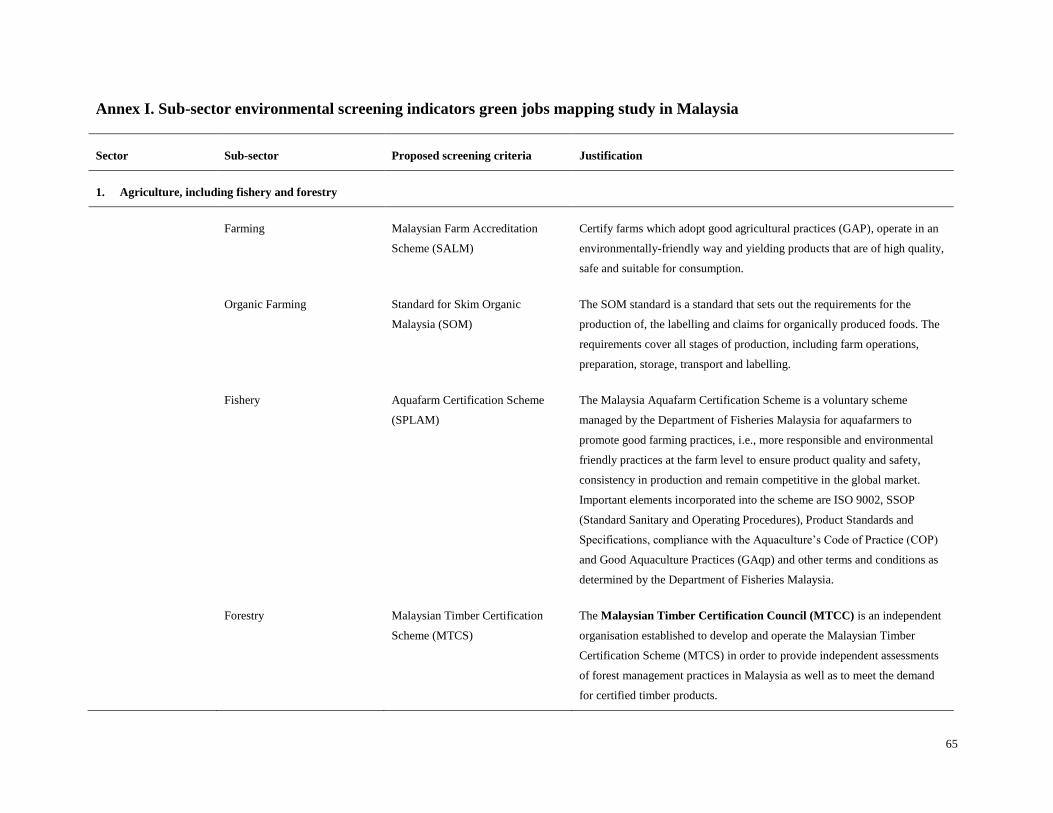
65
Annex I. Sub-sector environmental screening indicators green jobs mapping study in Malaysia
Sector Sub-sector Proposed screening criteria Justification
1. Agriculture, including fishery and forestry
Farming Malaysian Farm Accreditation
Scheme (SALM)
Certify farms which adopt good agricultural practices (GAP), operate in an
environmentally-friendly way and yielding products that are of high quality,
safe and suitable for consumption.
Organic Farming Standard for Skim Organic
Malaysia (SOM)
The SOM standard is a standard that sets out the requirements for the
production of, the labelling and claims for organically produced foods. The
requirements cover all stages of production, including farm operations,
preparation, storage, transport and labelling.
Fishery Aquafarm Certification Scheme
(SPLAM)
The Malaysia Aquafarm Certification Scheme is a voluntary scheme
managed by the Department of Fisheries Malaysia for aquafarmers to
promote good farming practices, i.e., more responsible and environmental
friendly practices at the farm level to ensure product quality and safety,
consistency in production and remain competitive in the global market.
Important elements incorporated into the scheme are ISO 9002, SSOP
(Standard Sanitary and Operating Procedures), Product Standards and
Specifications, compliance with the Aquaculture’s Code of Practice (COP)
and Good Aquaculture Practices (GAqp) and other terms and conditions as
determined by the Department of Fisheries Malaysia.
Forestry Malaysian Timber Certification
Scheme (MTCS)
The Malaysian Timber Certification Council (MTCC) is an independent
organisation established to develop and operate the Malaysian Timber
Certification Scheme (MTCS) in order to provide independent assessments
of forest management practices in Malaysia as well as to meet the demand
for certified timber products.

66
Forest Steward Council (FSC)
Oil Palm RSPO (Roundtable on Sustainable
Palm Oil) principles and criteria for
sustainable palm oil production
(RSPO P& C)
Malaysian Palm Oil Sustainability
Manual
Renewable Energy Fund
The Roundtable on Sustainable Palm Oil (RSPO) is a global, multi-
stakeholder initiative on sustainable palm oil. Multi-stakeholder
representation is mirrored in the governance structure of RSPO such that
seats in the Executive Board and project level Working Groups are fairly
allocated to each sector and include environmental NGOs, banks and
investors, growers, processors, manufacturers and retailers of palm oil
products and social NGOs. Produced global guidelines for producing palm
oil sustainably. transparency and traceability is assured through RSPO
Supply Chain Certification
The Manual is based on the Malaysian Palm Oil Board’s six Code of
Practice which was launched in August 2007 containing guidelines
pertaining to legality of new plantings as related to land use history,
guidelines for best practices, worker’s safety and welfare, worker’s housing,
guidelines for environmental protection, conservation of biodiversity and
wildlife, provisions for unproductive sites, greenhouse gases, mechanisms
for clean development, etc.
2. Energy
Energy efficiency
National Energy Efficiency Master
Plan
Benchmarks:
Reduced CO2 per output, improved
resource efficiency
Minimum Energy Performance Standards (MEPS) for appliances and new
green technologies are being developed under the NEEMP.
Offer rebates to targeted appliances including refrigerators, air conditioners
and light bulbs; hybrid cars or electric cars.
Energy efficiency targets under the NEEMP are expected to achieve a
cumulative energy saving of 4,000 kilo tonnes of oil equivalent by 2015
across all sectors.
Solar photovoltaic Renewable Energy Policy and RE targets under the Renewable Energy Policy and Action Plan set a target
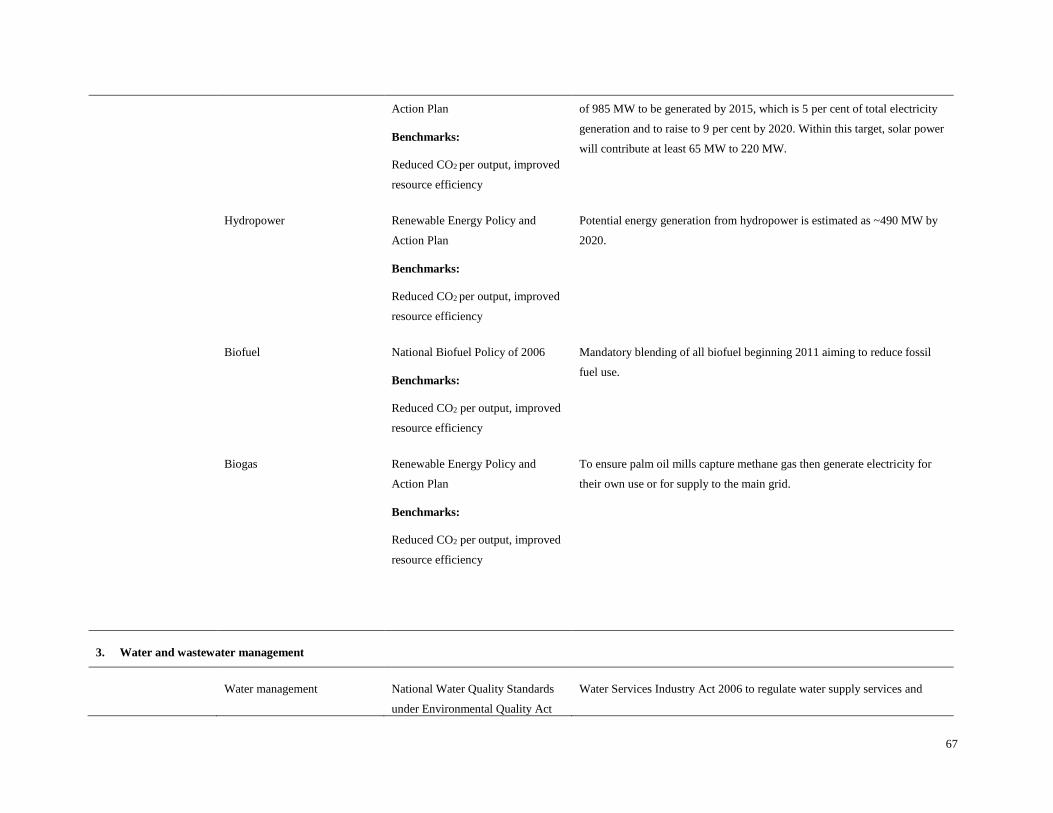
67
Action Plan
Benchmarks:
Reduced CO2 per output, improved
resource efficiency
of 985 MW to be generated by 2015, which is 5 per cent of total electricity
generation and to raise to 9 per cent by 2020. Within this target, solar power
will contribute at least 65 MW to 220 MW.
Hydropower Renewable Energy Policy and
Action Plan
Benchmarks:
Reduced CO2 per output, improved
resource efficiency
Potential energy generation from hydropower is estimated as ~490 MW by
2020.
Biofuel National Biofuel Policy of 2006
Benchmarks:
Reduced CO2 per output, improved
resource efficiency
Mandatory blending of all biofuel beginning 2011 aiming to reduce fossil
fuel use.
Biogas Renewable Energy Policy and
Action Plan
Benchmarks:
Reduced CO2 per output, improved
resource efficiency
To ensure palm oil mills capture methane gas then generate electricity for
their own use or for supply to the main grid.
3. Water and wastewater management
Water management National Water Quality Standards
under Environmental Quality Act
Water Services Industry Act 2006 to regulate water supply services and

68
1974
Interim National Water Quality
Standards 2006
Benchmarks:
Reduced CO2 per output, improved
resource efficiency, reduced water
use
sewage services.
National Water Services Commission Act.
National Water Resources Policy 2011 focusing on both a long-term
strategy for water resource management and to protect the river from
pollution.
Waste water management Water Services Industry Act 2006
National Water Services
Commission Act
Benchmarks:
Reduced CO2 per output, improved
efficiency, reduced water use
The National Water Resource Policy 2010 outlines the implementation of an
integrated tariff for both water and sewage services moving away from flat
rate tariffs.
Water use reduction Suruhanjaya Perkhidmatan Air
Negara (SPAN) Act in 2007
Water Conservation Policy
Adoption of water conservation technologies (e.g. sensor taps, dual-flush
toilets, etc.).
4. Solid waste management
Recycling
SWPCM Act of 2007
Environmental Quality Regulations
SWPCM Act addresses SWM in a comprehensive manner, from waste
generation to collection, treatment and disposal, with emphasis on 3Rs.

69
1988
Environmental Quality Regulations
2005 with provisions on e-waste
Guidelines for the Classification of
Used Electrical and Electronic
Equipment in Malaysia 2010
Reduce, Reuse, Recycle
Programme
Benchmarks:
Amount of waste diverted from
landfill (per cent of total waste,
recycling or composting rate)
Recycling campaign by the Ministry of Housing and Local Government.
Environmental Quality Regulations 1988 has provisions on the collection,
treatment, recycling and disposal of scheduled waste including e-waste.
Waste disposal SWPCM Act of 2007
National Strategic Plan for Solid
Waste Management 2005
Benchmarks:
Amount of waste diverted from
landfill ( per cent of total waste,
recycling or composting rate)
Waste treatment Renewable Energy Act Adoption of waste to energy technology to generate energy from
incineration plants; capturing methane gas from landfilling; converting
waste into gas and oil; and composting.
5. Transport
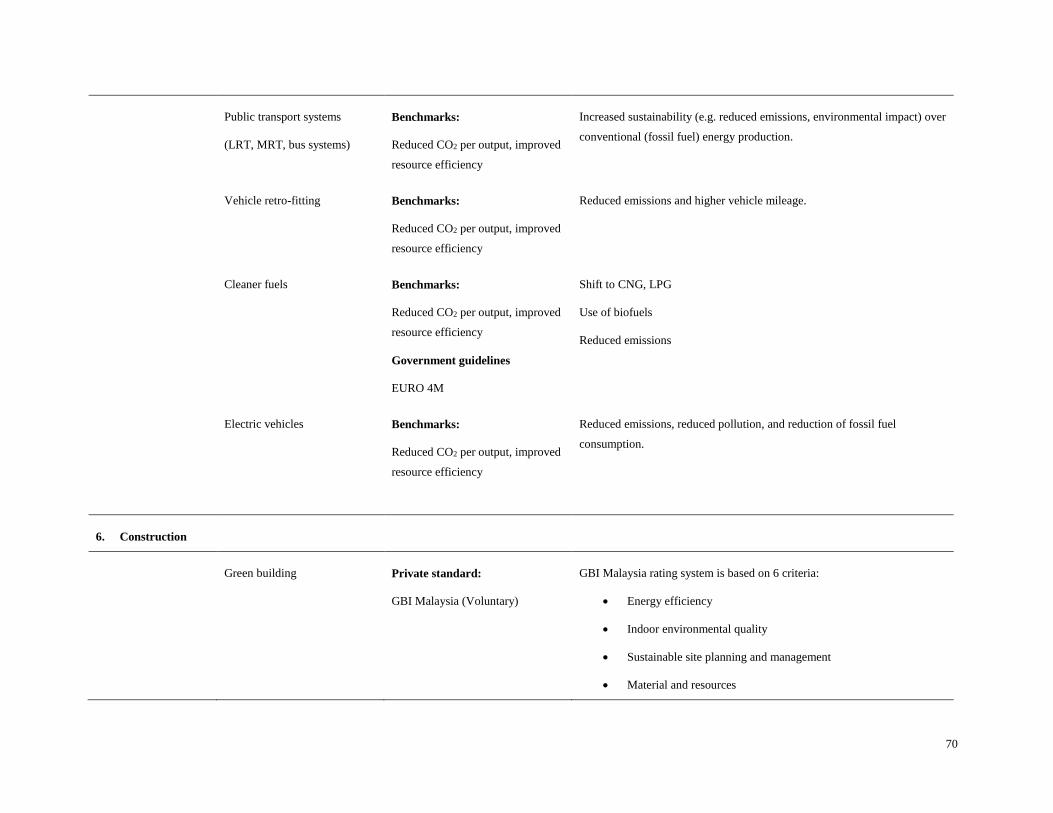
70
Public transport systems
(LRT, MRT, bus systems)
Benchmarks:
Reduced CO2 per output, improved
resource efficiency
Increased sustainability (e.g. reduced emissions, environmental impact) over
conventional (fossil fuel) energy production.
Vehicle retro-fitting Benchmarks:
Reduced CO2 per output, improved
resource efficiency
Reduced emissions and higher vehicle mileage.
Cleaner fuels
Benchmarks:
Reduced CO2 per output, improved
resource efficiency
Government guidelines
EURO 4M
Shift to CNG, LPG
Use of biofuels
Reduced emissions
Electric vehicles
Benchmarks:
Reduced CO2 per output, improved
resource efficiency
Reduced emissions, reduced pollution, and reduction of fossil fuel
consumption.
6. Construction
Green building Private standard:
GBI Malaysia (Voluntary)
GBI Malaysia rating system is based on 6 criteria:
Energy efficiency
Indoor environmental quality
Sustainable site planning and management
Material and resources

71
Water efficiency
Innovation
Energy efficiency measures Government standards
Malaysia Standards: MS1525
(Voluntary)
Provide guidance on design of building envelopes, procurement of energy
efficient lighting and cooling equipment and establishment of building
energy management systems.
Green materials Government standards
SIRIM Eco-Labelling Scheme
Malaysia Standards
Eco 5 - Biofibre Composite Construction Materials
Eco 19 - Paints
Eco 20 - Clay Roof Tiles
Eco 21 - Fibre Cement Products
Eco 22 - Ceramic Tiles
Eco 23 - Masonry Units
Eco 24 - Energy Saving Electronic Ballasts
Eco 25 - Fluorescent Lamps
Eco 27 - Luminaires and Light Source for Interior Lightings
Eco 29 – Cement
Eco 31 - Flat Glass
Recycling of materials Sustainable consumption, resource efficiency, less waste.
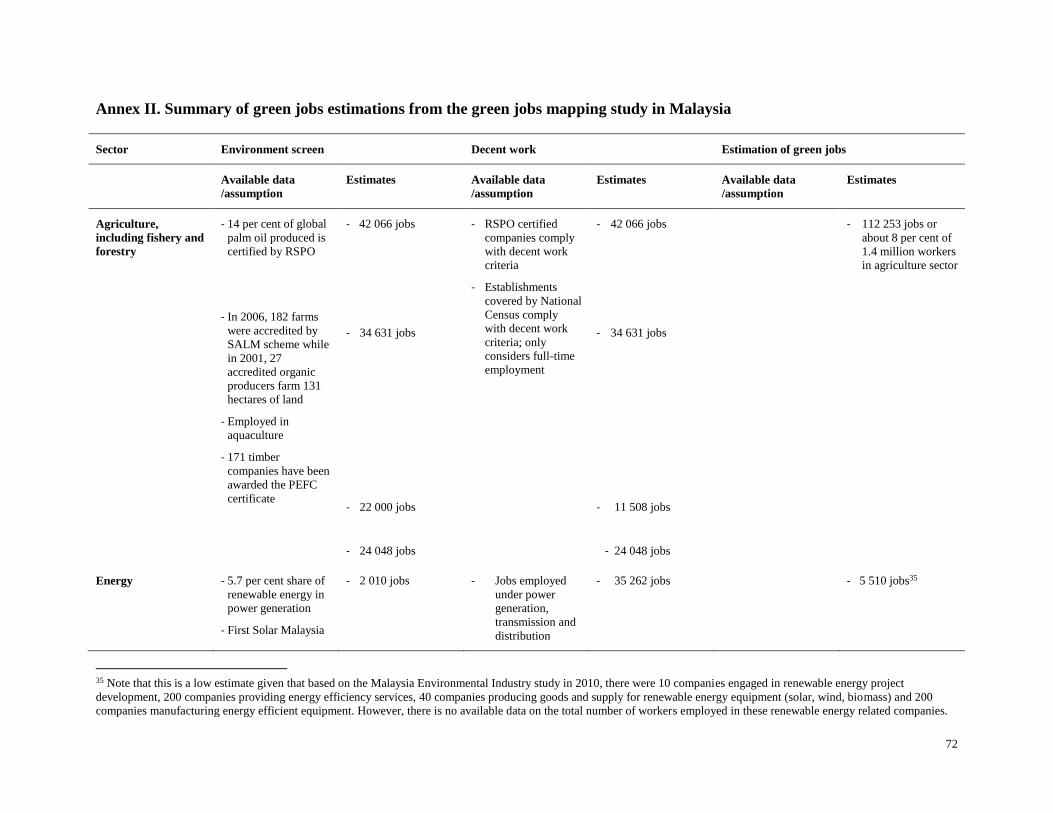
72
Annex II. Summary of green jobs estimations from the green jobs mapping study in Malaysia
Sector Environment screen Decent work Estimation of green jobs
Available data
/assumption
Estimates Available data
/assumption
Estimates Available data
/assumption
Estimates
Agriculture,
including fishery and
forestry
- 14 per cent of global
palm oil produced is
certified by RSPO
- In 2006, 182 farms
were accredited by
SALM scheme while
in 2001, 27
accredited organic
producers farm 131
hectares of land
- Employed in
aquaculture
- 171 timber
companies have been
awarded the PEFC
certificate
- 42 066 jobs
- 34 631 jobs
- 22 000 jobs
- 24 048 jobs
- RSPO certified
companies comply
with decent work
criteria
- Establishments
covered by National
Census comply
with decent work
criteria; only
considers full-time
employment
- 42 066 jobs
- 34 631 jobs
- 11 508 jobs
- 24 048 jobs
- 112 253 jobs or
about 8 per cent of
1.4 million workers
in agriculture sector
Energy - 5.7 per cent share of
renewable energy in
power generation
- First Solar Malaysia
- 2 010 jobs
- Jobs employed
under power
generation,
transmission and
distribution
- 35 262 jobs - 5 510 jobs35
35 Note that this is a low estimate given that based on the Malaysia Environmental Industry study in 2010, there were 10 companies engaged in renewable energy project
development, 200 companies providing energy efficiency services, 40 companies producing goods and supply for renewable energy equipment (solar, wind, biomass) and 200
companies manufacturing energy efficient equipment. However, there is no available data on the total number of workers employed in these renewable energy related companies.

73
Sector Environment screen Decent work Estimation of green jobs
- 3 500 jobs
Water and
wastewater
management
- data based on EGS
2009 survey
- 9 960 jobs - Companies covered
by the EGS survey
comply with decent
work criteria
- 9 960 jobs - 9 960 jobs
Solid waste
management
- data based on EGS
2009 survey
- 15 780 jobs - Companies covered
by the EGS survey
comply with decent
work criteria
- 15 780 jobs - 15 780 jobs
Transport - those that provide
public transport
services
- 46 577 jobs - Average annual
salary is above min.
wage, assumed that
other decent work
criteria are also
availed
- 46 577 jobs - 46 577 jobs
Construction - F&S estimates
- Based on 2008 data,
11 per cent of 37.806
million m2 of
building floor area
considered energy
efficient, consuming
136 kW/m2/year
- Green buildings
cover 2.42 million
m2,
- 10 906 jobs
- 46 155 jobs
- 26 854 jobs
- Average annual
salary is above min.
wage, assumed that
other decent work
criteria are also
availed
- 552 028 jobs - 10 906 to 46 155
jobs
(1.11 per cent to
4.74 per cent of
total jobs)

74

75

76
ILO Regional Office for Asia and the Pacific
United Nations Building
Rajdamnern Nok Avenue
Bangkok 10200
Thailand
Tel.: +662 288 1234
Fax: +662 288 3062
Email: [email protected]
www.ilo.org/asia ISBN 9789221285441
Green jobs mapping study in Malaysia
The purpose of this research was to propose a conceptual framework for the characterisation of
green jobs in Malaysia and the selection of technical indicators in the environmental and
labour fields to be used for this process. The report offers an initial estimation of direct green
jobs at the country level as well as a review of the decent work challenges that may be linked
to green jobs. The ILO standard methodology for the mapping of green jobs has been
followed.


