140
2020 ANNUAL REPORT Green Living with Propane

2 0 2 0 A N N U A L R E P O R T
Green Livingwith Propane

Despite tremendous headwinds from near record warm temperatures during the heating season, followed by the unprecedented health and economic crisis from Covid-19, fiscal 2020 was a very successful year for Suburban Propane. We adapted our business practices and protocols to help protect the health and safety of our employees, adjusted to the shifting customer demand patterns and continued to deliver the essential services that our customers and local communities count on. As an organization, we delivered the strongest second half performance in our history and continued to execute on our long-term strategic growth initiatives. In particular, we invested excess cash flow in a balanced way to strengthen our balance sheet with total debt reduction of nearly $19 million, and funded $27 million in strategic acquisitions. This included our first step toward building a renewable energy platform – a strategic transformation that is in line with the commitment within our Go Green with Suburban Propane pillar to innovate and invest in the transition to a sustainable energy future. We continue to manage the business for long-term sustainability and growth. With the successful end to fiscal 2020, our business is very well positioned to carry that momentum in fiscal 2021 and build on our successes for the next phase of growth for Suburban Propane and our valued Unitholders.
AK
TX
LAMS
AL GA
FL
AR TN
SC
NC
VA
WV
OH
KY
INIL
MIWI
MO
IA
MN
NY
PA
MDDE
NJ
MACT RI
VTNH ME
WA
OR ID
MT
CA
NVUT
WY
AZ
CO
NM
SD
NE
KS
OK
ND
Michael A. StivalaPresident & Chief Executive Officer
A Master Limited Partnership since 1996,Suburban Propane Partners, L.P. (NYSE: SPH) hasbeen in the customer service business since 1928.
A value and growth-oriented company headquartered in Whippany, New Jersey, Suburban Propane is managed for long-term, consistent performance.
Suburban Propane is a nationwide marketer and distributor of adiverse array of energy-related products, specializing in propane,fuel oil and refined fuels, as well as marketing natural gas andelectricity in deregulated markets. With approximately 3,200 full-time employees, Suburban Propane maintains business operations in 41 states, providing dependable service to approximately 1 million residential, commercial, industrial and agricultural customers through approximately 700 locations.
According to Department of Energy statistics, approximately5 percent of U.S. households depend on propane as their primaryspace heating fuel. Propane is an abundant, clean-burning,environmentally safe fuel with 100 percent of Suburban Propane’ssupply produced in North America. As one of the largest retailmarketers of propane in the United States, Suburban Propane had retail propane sales of 402.9 million gallons in fiscal 2020.
It is the mission of Suburban Propane to serve ourcustomers, employees and communities by maintainingthe highest level of safety standards, ethical principles,satisfaction & total value in all that we do.
KEY INVESTMENT CONSIDERATIONS• Attractive tax-advantaged current yield
• Investor-friendly partnership structure• MLP is controlled by Unitholders through
independently elected Board of Supervisors• No incentive distribution rights (IDRs)• Streamlined capital structure enhances cost of capital
• Leading propane MLP with relatively stable cash flows• Diversity of geography and customer base• Flexible cost structure
• Strong financial position and balanced approachto distribution policy
• Experienced and proven management team
Partnership Profile
Proudly Serving Customers Since 1928
“
”

Advancements in our Corporate Environmental, Social and Governance (ESG) Initiatives: The Three Pillars of the Suburban Propane Experience
Go Green with Suburban Propane Pillar: “Serving communities today, leading the way to a sustainable tomorrow.”
Suburban Propane is committed to leading the way in advocating for the versatile, affordable and clean-burning attributes of propane, and investing in innovative solutions that contribute to the goals of reducing the nation’s carbon footprint and greenhouse gas emissions. Recognized for its low environmental impact by the Clean Air Act Amendments, propane can offer immediate opportunities to reduce carbon emissions over other traditional fossil fuels. Propane is non-toxic, doesn’t produce sulfur dioxide (a primary cause of the greenhouse effect) and emits 60% to 70% fewer smog producing hydrocarbons than gasoline and diesel when used in the transportation sector. Propane has proven to be a positive contributor to the goal of lowering the carbon footprint given its versatile, clean burning qualities, and is a necessary part of the transition to a low carbon economy. With advancements in new technologies for the production of propane from renewable sources, propane is also on a pathway to carbon neutrality.
During fiscal 2020, Suburban Propane advanced our efforts to lead the way in the propane industry toward solutions that can further reduce the carbon intensity of propane. First, we arranged for the supply of approximately 1.0 million gallons of renewable propane, produced from waste fats and oils, to meet customer demand for a renewable energy source. Second, we acquired a 39% equity stake in Oberon Fuels, a development-stage producer of a low carbon transportation fuel which, when blended with propane, can significantly reduce its carbon intensity. With this investment, Suburban Propane will have the exclusive rights to market and sell the Oberon-produced fuel known as renewable dimethyl ether, or rDME, in North America.

Advancements in our Corporate Environmental, Social and Governance (ESG) Initiatives: The Three Pillars of the Suburban Propane Experience
SuburbanCares Pillar: “SuburbanCares about our people and the communities we serve.”
This pillar highlights our continued dedication to giving back to the local communities throughout our 41-state operating footprint, as well as the many employee-focused initiatives that make Suburban Propane a great place to work. Suburban Propane has an unparalleled record of employee longevity supported by its devotion to career development, and a rich tradition of community involvement demonstrated through our national partnership with the American Red Cross and countless local community sponsorships and events. The SuburbanCares Pillar also encompasses our efforts to hire and support our Military Veterans community through our Heroes Hired Here initiative.
During fiscal 2020, Suburban Propane had so many proud moments in which we were called upon to support frontline activities associated with COVID-19 by providing vital temporary heat and power generation for makeshift testing tents, hospital sites, shelters and food distribution centers. We also partnered with a number of major regional food service brands to provide support to frontline health care workers and first responders in multiple locations throughout the country. Our efforts were recognized by S&P Global as a finalist in their 2020 Corporate Social Responsibility category. We also expanded our efforts to support the American Red Cross, especially given the need for blood donations during the pandemic. Most importantly, we put the health and safety of our employees at the forefront of our decision making process, and continue to advance our efforts around career development and diversity.
Our Commitment to Excellence Pillar: “Delivering excellence locally, backed by our strong national presence.”
This pillar showcases Suburban Propane’s 90-year plus legacy, our unwavering commitment to the highest standards for safety and the peace of mind that comes from the flexibility, reliability and dependability that underscores our commitment to excellence in customer service. We are dedicated to providing the highest quality service to our customers and the local communities we serve, and adhering to the highest ethical and safety standards in every interaction.
During fiscal 2020, we delivered on that commitment to excellence as we adapted our business model and operating protocols due to the COVID-19 pandemic to ensure safe, seamless and outstanding service to our cus-tomers when they needed us most. We also made investments in new technology for our drivers and service technicians to drive incremental operating efficiencies and enhance the overall customer experience.
UNITED STATES SECURITIES AND EXCHANGE COMMISSION
Washington, D.C. 20549
FORM 10-K
☒ Annual Report Pursuant to Section 13 or 15(d) of the Securities Exchange Act of 1934 For the fiscal year ended September 26, 2020
☐ Transition Report Pursuant to Section 13 or 15(d) of the Securities Exchange Act of 1934 Commission File Number: 1-14222
SUBURBAN PROPANE PARTNERS, L.P. (Exact name of registrant as specified in its charter)
Delaware 22-3410353 (State or other jurisdiction of (I.R.S. Employer
incorporation or organization) Identification No.)
240 Route 10 West Whippany, NJ 07981
(973) 887-5300 (Address, including zip code, and telephone number,
including area code, of registrant’s principal executive offices)
Securities registered pursuant to Section 12(b) of the Act:
Title of each class Trading Symbol Name of exchange on which registered Common Units SPH New York Stock Exchange
Securities registered pursuant to Section 12(g) of the Act: None
Indicate by check mark if the registrant is a well-known seasoned issuer, as defined in Rule 405 of the Securities Act. Yes ☒ No ☐
Indicate by check mark if the registrant is not required to file reports pursuant to Section 13 or Section 15(d) of the Act. Yes ☐ No ☒
Indicate by check mark whether the registrant (1) has filed all reports required to be filed by Section 13 or 15(d) of the Securities Exchange Act of 1934 during the preceding 12 months (or for such shorter period that the registrant was required to file such reports), and (2) has been subject to such filing requirements for the past 90 days. Yes ☒ No ☐
Indicate by check mark whether the registrant has submitted electronically every Interactive Data File required to be submitted pursuant to Rule 405 of Regulation S-T (§232.405 of this chapter) during the preceding 12 months (or for such shorter period that the registrant was required to submit such files). Yes ☒ No ☐
Indicate by check mark whether the registrant is a large accelerated filer, an accelerated filer, a non-accelerated filer, a smaller reporting company, or an emerging growth company. See the definitions of “large accelerated filer,” “accelerated filer,” “smaller reporting company,” and “emerging growth company” in Rule 12b-2 of the Exchange Act.
Large accelerated filer ☒ Accelerated filer ☐ Non-accelerated filer ☐ Smaller reporting company ☐ Emerging growth company ☐
If an emerging growth company, indicate by check mark if the registrant has elected not to use the extended transition period for complying with any new or revised financial accounting standards provided pursuant to Section 13(a) of the Exchange Act. ☐
Indicate by check mark whether the registrant has filed a report on and attestation to its management’s assessment of the effectiveness of its internal control over financial reporting under Section 404(b) of the Sarbanes-Oxley Act (15 U.S.C. 7262(b)) by the registered public accounting firm that prepared or issued its audit report. ☒
Indicate by check mark whether the registrant is a shell company (as defined in Rule 12b-2 of the Act). Yes ☐ No ☒
The aggregate market value as of March 27, 2020 of the registrant’s Common Units held by non-affiliates of the registrant, based on the reported closing price of such units on the New York Stock Exchange on such date ($14.57 per unit), was approximately $904,410,000. As of November 23, 2020, there were 62,507,331 Common Units of Suburban Propane Partners, L.P. outstanding.
Documents Incorporated by Reference: None Total number of pages (excluding Exhibits): 127

SUBURBAN PROPANE PARTNERS, L.P. AND SUBSIDIARIES
INDEX TO ANNUAL REPORT ON FORM 10-K Page PART I
ITEM 1. BUSINESS ............................................................................................................................................................. 1
ITEM 1A. RISK FACTORS.................................................................................................................................................... 9
ITEM 1B. UNRESOLVED STAFF COMMENTS ................................................................................................................. 21
ITEM 2. PROPERTIES ........................................................................................................................................................ 21
ITEM 3. LEGAL PROCEEDINGS ...................................................................................................................................... 21
ITEM 4. MINE SAFETY DISCLOSURES .......................................................................................................................... 21
PART II
ITEM 5. MARKET FOR THE REGISTRANT’S COMMON UNITS, RELATED UNITHOLDER MATTERS AND ISSUER PURCHASES OF UNITS .................................................................................................................. 22
ITEM 6. SELECTED FINANCIAL DATA ......................................................................................................................... 23
ITEM 7. MANAGEMENT’S DISCUSSION AND ANALYSIS OF FINANCIAL CONDITION AND RESULTS OF OPERATIONS .................................................................................................................................................. 26
ITEM 7A. QUANTITATIVE AND QUALITATIVE DISCLOSURES ABOUT MARKET RISK....................................... 39
ITEM 8. FINANCIAL STATEMENTS AND SUPPLEMENTARY DATA ....................................................................... 41
ITEM 9. CHANGES IN AND DISAGREEMENTS WITH ACCOUNTANTS ON ACCOUNTING AND FINANCIAL DISCLOSURE .................................................................................................................................................. 42
ITEM 9A. CONTROLS AND PROCEDURES ...................................................................................................................... 42
ITEM 9B. OTHER INFORMATION ..................................................................................................................................... 43
PART III
ITEM 10. DIRECTORS, EXECUTIVE OFFICERS AND PARTNERSHIP GOVERNANCE ............................................ 44
ITEM 11. EXECUTIVE COMPENSATION ......................................................................................................................... 50
ITEM 12. SECURITY OWNERSHIP OF CERTAIN BENEFICIAL OWNERS AND MANAGEMENT AND RELATED UNITHOLDER MATTERS ............................................................................................................................. 79
ITEM 13. CERTAIN RELATIONSHIPS AND RELATED TRANSACTIONS, AND DIRECTOR INDEPENDENCE .... 81
ITEM 14. PRINCIPAL ACCOUNTING FEES AND SERVICES ........................................................................................ 82
PART IV
ITEM 15. EXHIBITS, FINANCIAL STATEMENT SCHEDULES ..................................................................................... 83
ITEM 16. FORM 10-K SUMMARY...................................................................................................................................... 83
SIGNATURES.................................................................................................................................................................................. 87

DISCLOSURE REGARDING FORWARD-LOOKING STATEMENTS
This Annual Report on Form 10-K contains forward-looking statements (“Forward-Looking Statements”) as defined in the Private Securities Litigation Reform Act of 1995, Section 27A of the Securities Act of 1933, as amended, and Section 21E of the Securities Exchange Act of 1934, as amended, relating to future business expectations and predictions and financial condition and results of operations of Suburban Propane Partners, L.P. (the “Partnership”). Some of these statements can be identified by the use of forward-looking terminology such as “prospects,” “outlook,” “believes,” “estimates,” “intends,” “may,” “will,” “should,” “could,” “anticipates,” “expects” or “plans” or the negative or other variation of these or similar words, or by discussion of trends and conditions, strategies or risks and uncertainties. These Forward-Looking Statements involve certain risks and uncertainties that could cause actual results to differ materially from those discussed or implied in such Forward-Looking Statements (statements contained in this Annual Report identifying such risks and uncertainties are referred to as “Cautionary Statements”). The risks and uncertainties and their impact on the Partnership’s results include, but are not limited to, the following risks:
• The impact of weather conditions on the demand for propane, fuel oil and other refined fuels, natural gas and electricity;
• The impact of the COVID-19 pandemic and the corresponding government response, including the impact across the Partnership’s businesses on demand and operations, as well as on the operations of the Partnership’s suppliers, customers and other business partners, and the effectiveness of the Partnership’s actions taken in response to these risks;
• Volatility in the unit cost of propane, fuel oil and other refined fuels, natural gas and electricity, the impact of the Partnership’s hedging and risk management activities, and the adverse impact of price increases on volumes sold as a result of customer conservation;
• The ability of the Partnership to compete with other suppliers of propane, fuel oil and other energy sources;
• The impact on the price and supply of propane, fuel oil and other refined fuels from the political, military or economic instability of the oil producing nations, global terrorism and other general economic conditions, including the economic instability resulting from natural disasters such as pandemics, including the COVID-19 pandemic;
• The ability of the Partnership to acquire sufficient volumes of, and the costs to the Partnership of acquiring, transporting and storing, propane, fuel oil and other refined fuels;
• The ability of the Partnership to acquire and maintain reliable transportation for its propane, fuel oil and other refined fuels;
• The ability of the Partnership to retain customers or acquire new customers;
• The impact of customer conservation, energy efficiency and technology advances on the demand for propane, fuel oil and other refined fuels, natural gas and electricity;
• The ability of management to continue to control expenses;
• The impact of changes in applicable statutes and government regulations, or their interpretations, including those relating to the environment and climate change, derivative instruments and other regulatory developments on the Partnership’s business;
• The impact of changes in tax laws that could adversely affect the tax treatment of the Partnership for income tax purposes;
• The impact of legal proceedings on the Partnership’s business;
• The impact of operating hazards that could adversely affect the Partnership’s operating results to the extent not covered by insurance;
• The Partnership’s ability to make strategic acquisitions and successfully integrate them;
• The ability of the Partnership to continue to combat cybersecurity threats to its networks and information technology;
• The impact of current conditions in the global capital and credit markets, and general economic pressures;
• The operating, legal and regulatory risks the Partnership may face; and
• Other risks referenced from time to time in filings with the Securities and Exchange Commission (“SEC”) and those factors listed or incorporated by reference into this Annual Report under “Risk Factors.”
Some of these Forward-Looking Statements are discussed in more detail in “Management’s Discussion and Analysis of Financial Condition and Results of Operations” in this Annual Report. Reference is also made to the risk factors discussed in Item 1A of this Annual Report. On different occasions, the Partnership or its representatives have made or may make Forward-Looking Statements in other filings with the SEC, press releases or oral statements made by or with the approval of one of the Partnership’s authorized executive officers. Readers are cautioned not to place undue reliance on Forward-Looking Statements, which reflect management’s view only as of the date made. The Partnership undertakes no obligation to update any Forward-Looking Statement or Cautionary Statement, except as required by law. All subsequent written and oral Forward-Looking Statements attributable to the Partnership or persons acting on its behalf are expressly qualified in their entirety by the Cautionary Statements in this Annual Report and in future SEC reports. For a more complete

discussion of specific factors which could cause actual results to differ from those in the Forward-Looking Statements or Cautionary Statements, see “Risk Factors” in this Annual Report.

1
PART I
ITEM 1. BUSINESS
Development of Business
Suburban Propane Partners, L.P. (the “Partnership”), a publicly traded Delaware limited partnership, is a nationwide marketer and distributor of a diverse array of products meeting the energy needs of our customers. We specialize in the distribution of propane, fuel oil and refined fuels, as well as the marketing of natural gas and electricity in deregulated markets. In support of our core marketing and distribution operations, we install and service a variety of home comfort equipment, particularly in the areas of heating and ventilation. We believe, based on LP/Gas Magazine dated February 2020, that we are the third largest retail marketer of propane in the United States, measured by retail gallons sold in the calendar year 2019. As of September 26, 2020, we were serving the energy needs of approximately 1.0 million residential, commercial, industrial and agricultural customers through approximately 700 locations in 41 states with operations principally concentrated in the east and west coast regions of the United States, as well as portions of the midwest region of the United States and Alaska. We sold approximately 402.9 million gallons of propane and 26.0 million gallons of fuel oil and refined fuels to retail customers during the year ended September 26, 2020. Together with our predecessor companies, we have been continuously engaged in the retail propane business since 1928.
We conduct our business principally through Suburban Propane, L.P., a Delaware limited partnership, which operates our propane business and assets (the “Operating Partnership”), and its direct and indirect subsidiaries. Our general partner, and the general partner of our Operating Partnership, is Suburban Energy Services Group LLC (the “General Partner”), a Delaware limited liability company whose sole member is the Chief Executive Officer of the Partnership. Since October 19, 2006, the General Partner has no economic interest in either the Partnership or the Operating Partnership (which means that the General Partner is not entitled to any cash distributions of either partnership, nor to any cash payment upon the liquidation of either partnership, nor any other economic rights in either partnership) other than as a holder of 784 Common Units of the Partnership. Additionally, under the Third Amended and Restated Agreement of Limited Partnership (the “Partnership Agreement”) of the Partnership, there are no incentive distribution rights for the benefit of the General Partner. The Partnership owns (directly and indirectly) all of the limited partner interests in the Operating Partnership. The Common Units represent 100% of the limited partner interests in the Partnership.
Direct and indirect subsidiaries of the Operating Partnership include Suburban Heating Oil Partners, LLC, which owns and operates the assets of our fuel oil and refined fuels business; Agway Energy Services, LLC, which owns and operates the assets of our natural gas and electricity business; and Suburban Sales and Service, Inc., which conducts a portion of our service work and appliance and parts business. Our fuel oil and refined fuels, natural gas and electricity and services businesses are structured as either limited liability companies that are treated as corporations or corporate entities (collectively referred to as “Corporate Entities”) and, as such, are subject to corporate level income tax.
During fiscal 2020, our Operating Partnership acquired a 39% equity interest in Oberon Fuels, Inc. (“Oberon”), which is a development-stage producer of an innovative, low carbon renewable dimethyl ether (“rDME”) transportation fuel. Oberon is focused on the research and development of practical and affordable pathways to zero-emission transportation through its proprietary production process. Oberon's rDME fuel is a cost-effective, low-carbon, zero-soot alternative to petroleum diesel, and when blended with propane can significantly reduce its carbon intensity.
Suburban Energy Finance Corp., a direct 100%-owned subsidiary of the Partnership, was formed on November 26, 2003 to serve as co-issuer, jointly and severally with the Partnership, of the Partnership’s senior notes. Suburban Energy Finance Corp. has nominal assets and conducts no business operations.
In this Annual Report, unless otherwise indicated, the terms “Partnership,” “Suburban,” “we,” “us,” and “our” are used to refer to Suburban Propane Partners, L.P. and its consolidated subsidiaries, including the Operating Partnership. The Partnership and the Operating Partnership commenced operations in March 1996 in connection with the Partnership’s initial public offering of Common Units.
We currently file Annual Reports on Form 10-K, Quarterly Reports on Form 10-Q and current reports on Form 8-K with the SEC. You may read and print copies of any materials that we file with the SEC on the SEC’s EDGAR database at www.sec.gov.
Upon written request or through an information request link from our website at www.suburbanpropane.com, we will provide, without charge, copies of our Annual Report on Form 10-K for the year ended September 26, 2020, each of the Quarterly Reports on Form 10-Q, current reports filed or furnished on Form 8-K and all amendments to such reports as soon as is reasonably practicable after such reports are electronically filed with or furnished to the SEC. Requests should be directed to: Suburban Propane Partners, L.P., Investor Relations, P.O. Box 206, Whippany, New Jersey 07981-0206. The information contained on our website is not included as part of, or incorporated by reference into, this Annual Report on Form 10-K.
2
Our Strategy
Our business strategy is to deliver increasing value to our Unitholders through initiatives, both internal and external, that are geared toward achieving sustainable profitable growth. In pursuing this strategy, we also consider the interests of our employees, customers and the communities in which we operate, as exemplified by our Three Pillars program as described below. The following are key elements of our strategy:
Internal Focus on Driving Operating Efficiencies, Right-Sizing Our Cost Structure and Enhancing Our Customer Mix. We focus internally on improving the efficiency of our existing operations, managing our cost structure and improving our customer mix. Through investments in our technology infrastructure, we continue to seek to improve operating efficiencies and the return on assets employed. We have developed a streamlined operating footprint and management structure to facilitate effective resource planning and decision making. Our internal efforts are particularly focused in the areas of route optimization, forecasting customer usage, inventory control, cash management and customer tracking. We will continue to pursue operational efficiencies while staying focused on providing exceptional service to our customer base. Our systems platform is advanced and scalable and we will seek to leverage that technology for enhanced routing, forecasting and customer relationship management.
Growing Our Customer Base by Improving Customer Retention and Acquiring New Customers. We set clear objectives to focus our employees on seeking new customers and retaining existing customers by providing highly responsive customer service. We believe that customer satisfaction is a critical factor in the growth and success of our operations. “Our Business is Customer Satisfaction” is one of our core operating philosophies. We measure and reward our customer service centers based on a combination of profitability of the individual customer service center and net customer growth. We have made investments in training our people both on techniques to provide exceptional customer service to our existing customer base, as well as advanced sales training focused on growing our customer base.
Selective Acquisitions of Complementary Businesses or Assets. Externally, we seek to extend our presence or diversify our product offerings through selective acquisitions. Our acquisition strategy is to focus on businesses with a relatively steady cash flow that will extend our presence in strategically attractive markets, complement our existing business segments or provide an opportunity to diversify our operations. We are very patient and deliberate in evaluating acquisition candidates.
Pursue Strategic Investments in the Transformation to a Renewable Energy Platform. We are committed to promoting the inherent environmental benefits of using propane in multiple applications as a clean energy source for a sustainable future, and to invest in innovative solutions to further reduce the carbon footprint. In line with this commitment, which we call Go Green with Suburban Propane, we have made investments in an innovative producer of a renewable energy transportation fuel and we will seek additional opportunities to further build out our renewable energy platform.
Selective Disposition of Non-Strategic Assets. We continuously evaluate our existing facilities to identify opportunities to optimize our return on assets by selectively divesting operations in slower growing markets, generating proceeds that can be reinvested in markets that present greater opportunities for growth. Our objective is to maximize the growth and profit potential of all of our assets.
The Three Pillars of the Suburban Propane Experience. We execute the foregoing strategy under our corporate branding initiative known as the Three Pillars of the Suburban Propane Experience. The three essential pillars emphasize:
• Suburban Commitment: our value proposition for our customers, employees and the communities we serve and, in particular, the reliability dependability and flexibility in our commitment to excellence in safety and customer service;
• SuburbanCares: our devotion to the safety and career development of our people, as well as our philanthropic activities at the local and national levels; and
• Go Green with Suburban Propane: our commitment to promote the inherent clean burning qualities of propane as a versatile energy solution that supports a sustainable future, and to invest in innovation solutions to further reduce the carbon footprint.
Business Segments
As described below, we manage and evaluate our operations in four operating segments, three of which are reportable segments: Propane, Fuel Oil and Refined Fuels and Natural Gas and Electricity. See the Notes to the Consolidated Financial Statements included in this Annual Report for financial information about our business segments.
3
Propane
Propane is a by-product of natural gas processing and petroleum refining. It is a clean burning energy source recognized for its transportability and ease of use relative to alternative forms of stand-alone energy sources. Propane use falls into three broad categories:
• residential and commercial applications;
• industrial applications; and
• agricultural uses.
In the residential and commercial markets, propane is used primarily for space heating, water heating, clothes drying and cooking. Industrial customers use propane generally as a motor fuel to power over-the-road vehicles, forklifts and stationary engines, to fire furnaces, as a cutting gas and in other process applications. In the agricultural market, propane is primarily used for tobacco curing, crop drying, poultry brooding and weed control.
Propane is extracted from natural gas or oil wellhead gas at processing plants or separated from crude oil during the refining process. It is normally transported and stored in a liquid state under moderate pressure or refrigeration for ease of handling in shipping and distribution. When the pressure is released or the temperature is increased, propane becomes a flammable gas that is colorless and odorless, although an odorant is added to allow its detection. Propane is non-toxic, clean burning and, when consumed, produces virtually no particulate matter or sulfur dioxide (contributors to climate change).
Product Distribution and Marketing
We distribute propane through a nationwide retail distribution network consisting of approximately 700 locations in 41 states as of September 26, 2020. Our operations are principally concentrated in the east and west coast regions of the United States, as well as portions of the midwest region of the United States and Alaska. As of September 26, 2020, we serviced approximately 855,000 propane customers. Typically, our customer service centers are located in suburban and rural areas where natural gas is not readily available. Generally, these customer service centers consist of an office, appliance showroom, warehouse and service facilities, with one or more 18,000 to 30,000 gallon storage tanks on the premises. Approximately 60% of our residential customers receive their propane supply through an automatic delivery system. These deliveries are scheduled through proprietary computer technology, based upon each customer’s historical consumption patterns and prevailing weather conditions. Additionally, we offer our customers a budget payment plan whereby the customer’s estimated annual propane purchases and service contracts are paid for in a series of estimated equal monthly payments over a twelve-month period. From our customer service centers, we also sell, install and service equipment to customers who purchase propane from us including heating and cooking appliances and, at some locations, propane fuel systems for motor vehicles.
We sell propane primarily to seven customer markets: residential, commercial, industrial (including engine fuel), government, agricultural, other retail users and wholesale. Nearly all of the propane gallons sold by us in fiscal 2020 was to retail customers: 45% to residential customers, 35% to commercial customers, 9% to industrial customers, 4% to government customers, 4% to agricultural customers and 3% to other retail users. Nominal amounts of the propane gallons sold by us in fiscal 2020 were for risk management activities and wholesale customers. No single customer accounted for 10% or more of our propane revenues during fiscal 2020.
Retail deliveries of propane are usually made to customers by means of bobtail and rack trucks. Propane is pumped from bobtail trucks, which have capacities typically ranging from 2,400 gallons to 3,500 gallons of propane, into a stationary storage tank on the customers’ premises. The capacity of these storage tanks ranges from approximately 100 gallons to approximately 1,200 gallons, with a typical tank having a capacity of 300 to 400 gallons. As is common in the propane industry, we own a significant portion of the storage tanks located on our customers’ premises. We also deliver propane to retail customers in portable cylinders, which typically have a capacity of 5 to 35 gallons. When these cylinders are delivered to customers, empty cylinders are refilled in place or transported for replenishment at our distribution locations. We also deliver propane to certain other bulk end users in larger trucks known as transports, which have an average capacity of approximately 9,000 gallons. End users receiving transport deliveries include industrial customers, large-scale heating accounts, such as local gas utilities that use propane as a supplemental fuel to meet peak load delivery requirements, and large agricultural accounts that use propane for crop drying.
Supply
Our propane supply is purchased from approximately 50 oil companies and natural gas processors at approximately 150 supply points located in the United States and Canada. We make purchases primarily under one-year agreements that are subject to annual renewal, and also purchase propane on the spot market. Supply contracts generally provide for pricing in accordance with posted prices at the time of delivery or the current prices established at major storage points, and some contracts include a pricing formula that typically is based on prevailing market prices. Some of these agreements provide maximum and minimum seasonal purchase guidelines. Propane

4
is generally transported from refineries, pipeline terminals, storage facilities (including our storage facility in Elk Grove, California) and coastal terminals to our customer service centers by a combination of common carriers, owner-operators and railroad tank cars. See Item 2 of this Annual Report.
Historically, supplies of propane have been readily available from our supply sources. Although we make no assurance regarding the availability of supplies of propane in the future, we currently expect to be able to secure adequate supplies during fiscal 2021. During fiscal 2020, Crestwood Equity Partners L.P. (“Crestwood”), Targa Liquids Marketing and Trade LLC (“Targa”), and Enterprise Products Partners L.P. (“Enterprise”) provided approximately 24%, 17%, and 10% of our total propane purchases, respectively. No other single supplier accounted for 10% or more of our propane purchases in fiscal 2020. The availability of our propane supply is dependent on several factors, including the severity of winter weather, the magnitude of competing demands for available supply (e.g., crop drying and exports), the availability of transportation and storage infrastructure and the price and availability of competing fuels, such as natural gas and fuel oil. We believe that if supplies from Crestwood, Targa, or Enterprise were interrupted, we would be able to secure adequate propane supplies from other sources without a material disruption of our operations. Nevertheless, the cost of acquiring and transporting such propane might be higher and, at least on a short-term basis, our margins could be affected. Over 85% of our total propane purchases were from domestic suppliers in fiscal 2020.
We seek to reduce the effect of propane price volatility on our product costs and to help ensure the availability of propane during periods of short supply. We enter into propane forward options and swap agreements with third parties to purchase and sell propane at fixed prices in the future. These activities are monitored by our senior management through enforcement of our Hedging and Risk Management Policy. See Items 7 and 7A of this Annual Report.
We own and operate a large propane storage facility in Elk Grove, California. We also operate smaller storage facilities in other locations and have rights to use storage facilities in additional locations. These storage facilities enable us to buy and store large quantities of propane particularly during periods of low demand, which generally occur during the summer months. This practice helps ensure a more secure supply of propane during periods of intense demand or price instability. As of September 26, 2020, the majority of the storage capacity at our facility in Elk Grove, California was leased to third parties.
Competition
According to the US Census Bureau’s 2019 American Community Survey, propane ranks as the third most important source of residential energy in the nation, with about 5% of all households using propane as their primary space heating fuel. This level has not changed materially over the previous two decades. As an energy source, propane competes primarily with natural gas, electricity and fuel oil, principally on the basis of price, availability and portability.
Propane is more expensive than natural gas on an equivalent British Thermal Unit (“BTU”) basis in locations serviced by natural gas, but it is an alternative or supplement to natural gas in rural and suburban areas where natural gas is unavailable or portability of product is required. Historically, the expansion of natural gas into traditional propane markets has been inhibited by the capital costs required to expand pipeline and retail distribution systems, and in some territories, geological and activist challenges. The increasing availability of natural gas extracted from shale deposits in the United States may accelerate the extension of natural gas pipelines in the future. Although the extension of natural gas pipelines to previously unserved geographic areas tends to displace propane distribution in those areas, we believe new opportunities for propane sales may arise as new neighborhoods are developed in geographically remote areas.
Propane has some relative advantages over other energy sources. For example, in certain geographic areas, propane is generally less expensive to use than electricity for space heating, water heating, clothes drying and cooking. Utilization of fuel oil is geographically limited (primarily in the northeast), and even in that region, propane and fuel oil are not significant competitors because of the cost of converting from one to the other.
In addition to competing with suppliers of other energy sources, our propane operations compete with other retail propane distributors. The retail propane industry is highly fragmented and competition generally occurs on a local basis with other large full-service multi-state propane marketers, thousands of smaller local independent marketers and farm cooperatives. Based on industry statistics contained in the 2018 Annual Retail Propane Sales Report, as published by the Propane Education & Research Council in December 2019, and LP/Gas Magazine dated February 2019, the ten largest retailers, including us, account for approximately 35% of the total retail sales of propane in the United States. Each of our customer service centers operates in its own competitive environment because retail marketers tend to locate in close proximity to customers in order to lower the cost of providing service. Our typical customer service center has an effective marketing radius of approximately 50 miles, although in certain areas the marketing radius may be extended by one or more satellite offices. Most of our customer service centers compete with five or more marketers or distributors.

5
Fuel Oil and Refined Fuels
Product Distribution and Marketing
We market and distribute fuel oil, kerosene, diesel fuel and gasoline to approximately 38,000 residential and commercial customers primarily in the northeast region of the United States. Sales of fuel oil and refined fuels for fiscal 2020 amounted to 26.0 million gallons. Approximately 69% of the fuel oil and refined fuels gallons sold by us in fiscal 2020 were to residential customers, principally for home heating, 6% were to commercial customers, and 7% to other users. Sales of diesel and gasoline accounted for the remaining 18% of total volumes sold in this segment during fiscal 2020. Fuel oil has a more limited use, compared to propane, and is used almost exclusively for space and water heating in residential and commercial buildings. We sell diesel fuel and gasoline to commercial and industrial customers for use primarily to operate motor vehicles.
Approximately 45% of our fuel oil customers receive their fuel oil under an automatic delivery system. These deliveries are scheduled through proprietary computer technology, based upon each customer’s historical consumption patterns and prevailing weather conditions. Additionally, we offer our customers a budget payment plan whereby the customer’s estimated annual fuel oil purchases are paid for in a series of estimated equal monthly payments over a twelve-month period. From our customer service centers, we also sell, install and service equipment to customers who purchase fuel oil from us including heating appliances.
Deliveries of fuel oil are usually made to customers by means of tankwagon trucks, which have capacities ranging from 2,500 gallons to 3,000 gallons. Fuel oil is pumped from the tankwagon truck into a stationary storage tank that is located on the customer’s premises, which is owned by the customer. The capacity of customer storage tanks ranges from approximately 275 gallons to approximately 1,000 gallons. No single customer accounted for 10% or more of our fuel oil revenues during fiscal 2020.
Supply
We obtain fuel oil and other refined fuels in pipeline, truckload or tankwagon quantities, and have contracts with certain pipeline and terminal operators for the right to temporarily store fuel oil at 13 terminal facilities that we do not own. We have arrangements with certain suppliers of fuel oil, which provide open access to fuel oil at specific terminals throughout the northeast. Additionally, a portion of our purchases of fuel oil are made at local wholesale terminal racks. In most cases, the supply contracts do not establish the price of fuel oil in advance; rather, prices are typically established based upon market prices at the time of delivery plus or minus a differential for transportation and volume discounts. We purchase fuel oil from approximately 20 suppliers at approximately 50 supply points. While fuel oil supply is more susceptible to longer periods of supply constraint than propane, we believe that our supply arrangements will provide us with sufficient supply sources. Although we make no assurance regarding the availability of supplies of fuel oil in the future, we currently expect to be able to secure adequate supplies during fiscal 2021.
Competition
The fuel oil industry is a mature industry with total demand expected to remain relatively flat to moderately declining. The fuel oil industry is highly fragmented, characterized by a large number of relatively small, independently owned and operated local distributors. We compete with other fuel oil distributors offering a broad range of services and prices, from full service distributors to those that solely offer the delivery service. We have developed a wide range of sales programs and service offerings for our fuel oil customer base in an attempt to be viewed as a full service energy provider and to build customer loyalty. For instance, like most companies in the fuel oil business, we provide home heating equipment repair service to our fuel oil customers on a 24-hour a day basis. The fuel oil business unit also competes for retail customers with suppliers of alternative energy sources, principally natural gas, propane and electricity.
Natural Gas and Electricity
We market natural gas and electricity through our 100%-owned subsidiary, Agway Energy Services, LLC (“AES”), in the deregulated markets of New York, Pennsylvania and Maryland primarily to residential and small commercial customers. Historically, local utility companies provided their customers with all three aspects of electric and natural gas service: generation, transmission and distribution. However, under deregulation, public utility commissions in several states are licensing energy service companies, such as AES, to act as alternative suppliers of the commodity to end consumers. In essence, the local utility companies distribute electricity and natural gas on their distribution systems and we make arrangements for the supply of electricity or natural gas to specific delivery points. The business strategy of this segment is to expand its market share by concentrating on growth in the customer base and expansion into other deregulated markets that are considered strategic markets.

6
We serve approximately 45,000 natural gas and electricity customers in New York, Pennsylvania and Maryland. An Order from the New York Public Service Commission (“NY PSC“) regarding low income consumers went into effect in 2018 and required that all energy service companies (“ESCOs”) stop serving low-income consumers. As a result, AES returned approximately 7,200 of our customers to local utility service. A second order (“Reset Order”) issued by the NY PSC in 2016 attempted to impose rules that would have allowed the NY PSC to regulate ESCO pricing, which was subsequently challenged and struck down by the New York Supreme Court. On appeal, the New York State Court of Appeals issued a ruling in 2019 that held that the NY PSC cannot regulate ESCO pricing, but does have the ability to restrict an ESCO’s access to the utility distribution system if the NY PSC determines that an ESCO’s pricing is not “just and reasonable.” In December 2019, the NY PSC issued an Order that imposed product, pricing, and other requirements on ESCOs (“Second Reset Order”). AES was specifically and solely exempted from complying with the criteria concerning product offerings during the pendency of further rulemaking proceedings. In September 2020, the NY PSC issued another Order reaffirming the Second Reset Order, including the exemption that allows AES to maintain its existing business model in New York while rulemaking proceedings continue. Separately, the State of New York issued a State of Emergency Order in March of 2020 due to the COVID-19 pandemic. Under New York laws, telemarketers are prevented from making sales calls during states of emergency. As a result, AES halted all telemarketing sales efforts in New York in March, and this condition continues to remain in effect as of the date of this Annual Report.
During fiscal 2020, we sold approximately 1.9 million dekatherms of natural gas and 251.0 million kilowatt hours of electricity through the natural gas and electricity segment. Approximately 87% of our customers were residential households and the remainder were small commercial and industrial customers. New accounts are obtained through numerous marketing and advertising programs, including telemarketing and direct mail initiatives. Most local utility companies have established billing service arrangements whereby customers receive a single bill from the local utility company, which includes distribution charges from the local utility company, as well as product charges for the amount of natural gas or electricity provided by AES and utilized by the customer. We have arrangements with several local utility companies that provide billing and collection services for a fee. Under these arrangements, we are paid by the local utility company for all or a portion of customer billings after a specified number of days following the customer billing with no further recourse to AES.
Supply of natural gas is arranged through annual supply agreements with major national wholesale suppliers. Pricing under the annual natural gas supply contracts is based on posted market prices at the time of delivery, and some contracts include a pricing formula that typically is based on prevailing market prices. The majority of our electricity requirements are purchased through the New York Independent System Operator (“NYISO”) and PJM Interconnection (“PJM”) under annual supply agreements, as well as purchase arrangements through other national wholesale suppliers on the open market. Electricity pricing under the NYISO and PJM agreements are based on local market indices at the time of delivery. Competition is primarily with local utility companies, as well as other marketers of natural gas and electricity providing similar alternatives as AES.
All Other
We sell, install and service various types of whole-house heating products, air cleaners, humidifiers and space heaters to the customers of our propane, fuel oil, natural gas and electricity businesses. Our supply needs are filled through supply arrangements with several large regional equipment manufacturers and distribution companies. Competition in this business is primarily with small, local heating and ventilation providers and contractors, as well as, to a lesser extent, other regional service providers. The focus of our ongoing service offerings are in support of the service needs of our existing customer base within our propane, refined fuels and natural gas and electricity business segments. Additionally, we have entered into arrangements with third-party service providers to complement and, in certain instances, supplement our existing service capabilities.
Seasonality
The retail propane and fuel oil distribution businesses, as well as the natural gas marketing business, are seasonal because the primary use of these fuels is for heating residential and commercial buildings. Historically, approximately two-thirds of our retail propane volume is sold during the six-month peak heating season from October through March. The fuel oil business tends to experience greater seasonality given its more limited use for space heating, and approximately three-fourths of our fuel oil volumes are sold between October and March. Consequently, sales and operating profits are concentrated in our first and second fiscal quarters. Cash flows from operations, therefore, are greatest during the second and third fiscal quarters when customers pay for product purchased during the winter heating season. We expect lower operating profits and either net losses or lower net income during the period from April through September (our third and fourth fiscal quarters).
Weather conditions have a significant impact on the demand for our products, in particular propane, fuel oil and natural gas, for both heating and agricultural purposes. Many of our customers rely on propane, fuel oil or natural gas primarily as a heating source. Accordingly, the volume sold is directly affected by the severity of the winter weather in our service areas, which can vary substantially from year to year. In any given area, sustained warmer than normal temperatures will tend to result in reduced propane, fuel oil and natural gas consumption, while sustained colder than normal temperatures will tend to result in greater consumption.

7
Trademarks and Tradenames
We utilize a variety of trademarks and tradenames owned by us, including “Suburban Propane.” We regard our trademarks, tradenames and other proprietary rights as valuable assets and believe that they have significant value in the marketing of our products and services.
Government Regulation; Environmental, Health and Safety Matters
Our operations are subject to numerous federal, state and local environmental, health and safety laws and regulations. Generally, these laws and regulations impose limitations on the discharge of hazardous materials and pollutants and establish standards for the handling, transportation, distribution, treatment, storage and disposal of hazardous materials and solid and hazardous wastes and can require the investigation, assessment, cleanup, or monitoring of, or compensation for, environmental impacts, including natural resource damages. Notably, these laws include the federal Comprehensive Environmental Response, Compensation, and Liability Act (“CERCLA”); Resource Conservation and Recovery Act (“RCRA”); Clean Air Act; Clean Water Act; National Environmental Policy Act, and their implementing regulations, as well as equivalent state and laws and regulations. Additionally, there are environmental laws and regulations specific to the sale of electricity and natural gas in the retail energy market by our wholly owned subsidiary Agway Energy Services, LLC. Under the various laws and regulations to which we are subject, we must maintain various permits and comply with various monitoring and reporting requirements.
We own real property at locations where hazardous materials may be or may have been present as a result of prior activities. We expect that we will be required to expend funds to participate in the remediation of certain sites, including sites where we have been designated as a potentially responsible party under applicable laws and at sites with aboveground and underground fuel storage tanks. We will also incur other expenses associated with environmental compliance. We continually monitor our operations with respect to potential environmental issues, including changes in legal requirements and remediation technologies. As of September 26, 2020, we had accrued environmental liabilities of $1.7 million representing the total estimated future liability for remediation and monitoring of all of our properties.
Estimating the extent of our responsibility at a particular site, and the method and ultimate cost of remediation and monitoring of that site, requires making numerous assumptions. As a result, the ultimate cost to remediate and monitor any site may differ from current estimates, and will depend, in part, on whether there is additional contamination, not currently known to us, relating to that site. However, we believe that our past experience provides a reasonable basis for estimating these liabilities. As additional information becomes available, estimates are adjusted as necessary. While we do not anticipate that any such adjustment would be material to our financial statements, the result of ongoing or future environmental studies or other factors could alter this expectation and require recording additional liabilities. We currently cannot determine whether we will incur additional environmental liabilities or the extent or amount of any such liabilities, or the extent to which such additional liabilities would be subject to any contractual indemnification protections.
Certain rules and procedures imposed by the National Fire Protection Association (“NFPA”), as well as comparable state regulations govern the safe handling of propane and establish industry standard for propane storage, distribution and equipment installation and operation in all of the states in which we operate. In some states these laws are administered by state agencies, and in others they are administered on a municipal level.
The NFPA’s rules and procedures, as well as comparable state regulations govern the safe handling of distillates (fuel oil, kerosene and diesel fuel) and gasoline and establish the industry standard for fuel oil, kerosene, diesel fuel and gasoline storage, distribution and equipment installation and operation in all of the states in which we sell those products. In some states these laws are administered by state agencies and in others they are administered on a municipal level.
With respect to the transportation of propane, distillates and gasoline by truck, we are subject to laws and regulations that cover the transportation of hazardous materials and are administered, respectively, by the Federal Motor Carrier Safety Administration and the Pipeline and Hazardous Materials Safety Administration of the United States Department of Transportation (“DOT”), or similar state agencies. We conduct ongoing training programs to help ensure that our operations are in compliance with these and other applicable safety laws and regulations. We maintain various permits that are necessary to operate our facilities, some of which may be material to our operations. In compliance with the DOT’s pipeline safety regulations for “jurisdictional” propane systems that serve multiple customers, we provide training and written instruction for our employees, provide customers with periodic awareness notices and safety information, have established written procedures to minimize the hazards resulting from gas pipeline emergencies and keep records of inspections.
Our operations are subject to workplace safety standards under the Federal Occupational Safety and Health Act of 1970 (“OSHA”) and comparable state laws that regulate the protection of worker health and safety. Compliance with these standards is monitored through required workplace injury and illness recordkeeping, and reporting. We believe that our operations are in compliance, in all material respects, with applicable worker health and safety standards. We are also subject to laws and regulations governing the security of hazardous materials, including propane, under the Federal Homeland Security Act of 2002, as administered by the Department of Homeland Security (“DHS”). The DHS promulgated the Chemical Facility Anti-Terrorism Standards (“CFATS”) to identify and secure
8
chemical facilities that present the greatest security risk using a risk-based tiering structure. We have a number of facilities registered with the DHS. Currently, we have submitted all required Top-Screens as defined by DHS and have developed approved Site Security Plans for our regulated or “tiered” facilities. Less than 5% of our facilities are designated as tiered facilities. We expect to continue to incur minor costs associated with administrative controls and enhanced physical security measures for those tiered facilities that are subject to ongoing compliance activity.
The U.S. Environmental Protection Agency (“EPA”) issued an Endangerment Finding under the Clean Air Act, determining that emissions of carbon dioxide, methane and four other greenhouse gases (“GHGs”) threaten the public health and welfare of current and future generations. Based on these findings, the EPA has begun adopting and implementing regulations to restrict emissions of GHGs from certain industries and require reporting by certain regulated facilities. These regulations impact both our core business, as well as the retail sale of electricity and natural gas by AES. The EPA’s authority to regulate GHGs has been upheld by the U.S. Supreme Court. Changes in the EPA administration may result in the prioritization of climate change mitigation and adaptation measures and a push for significant reduction in GHG emissions. We may incur costs associated with operational changes required to comply with any such new regulations over the coming years.
Both Houses of the United States Congress have considered adopting legislation to reduce emissions of GHGs, but have not yet succeeded in passing federal climate change legislation, due in large part to political challenges. Changes to the political landscape may result in national climate change legislation. At this time, we cannot speculate as to the extent of impact any such legislation may have on our business or results of operations.
Regardless of what happens at the national level, numerous states and municipalities have begun to adopt laws and policies to regulate GHG emissions. These regulatory actions could require us to incur increased expenses or lost revenue. We cannot predict whether or in what form additional climate change laws and regulations will be enacted and what effect such laws and regulations may have on our business, financial condition or operations in the future. These local, state, and prospective national laws and regulations have sparked a shift in our industry toward the next generation of clean energy. We are an industry leader in this regard by making strategic investments so we can be positioned to have an adequate clean energy supply as these laws and regulations become operative. For example, we have taken a 39% equity stake in Oberon and we have also executed agreements to purchase and distribute renewable propane. We are committed to increasing the availability of both rDME blended propane and renewable propane in the coming years.
The adoption of federal, state or local climate change legislation or regulatory programs to reduce emissions of GHGs could require us to incur increased capital and operating costs, with resulting impact on product price. We cannot predict whether or in what form climate change legislation provisions and renewable energy standards may be enacted and what effect such regulation may have on our business, financial condition or operations in the future. In addition, a consequence of climate change is increased volatility in seasonal temperatures. It is difficult to predict how the market for our products would be affected by increased temperature volatility, although if there is an overall trend of warmer winter temperatures, it could adversely affect our business.
Future developments, such as stricter environmental, health or safety laws and regulations, could affect our operations. We do not anticipate that the cost of our compliance with environmental, health and safety laws and regulations, including RCRA and CERCLA, as currently in effect and applicable to known sites will have a material adverse effect on our financial condition or results of operations. However, there can be no assurance that our financial condition or operations will not be materially adversely affected by future discovery of, presently unknown, environmental liabilities or future environmental regulations.
Many of the states in which we do business have passed laws prohibiting “unfair or deceptive practices” in transactions between consumers and sellers of products used for residential purposes, which give the Attorney General or other officials of that state the authority to investigate alleged violations of those laws. From time to time, we receive inquiries or requests for additional information under these laws from the offices of Attorneys General or other government officials in connection with the sale of our products to residential customers. Based on information to date, and because our policies and business practices are designed to comply with all applicable laws, we do not believe that the costs or liabilities associated with such inquiries or requests will result in a material adverse effect on our financial condition or results of operations; however, there can be no assurance that our financial condition or results of operations may not be materially and adversely affected as a result of current or future government investigations or civil litigation derived therefrom.
See the Risk Factor entitled “The ability of AES to acquire and retain retail natural gas and electricity customers is highly competitive, price sensitive and may be impacted by changes in state regulations” for a description of certain regulatory and litigation impacts on our AES business.
Employees
As of September 26, 2020, we had 3,169 full time employees, of whom 583 were engaged in general and administrative activities (including fleet maintenance), 36 were engaged in transportation and product supply activities and 2,550 were customer service center employees, as well as 105 part time employees. As of September 26, 2020, 73 of our employees were represented by 8 different local

9
chapters of labor unions. We believe that our relations with both our union and non-union employees are satisfactory. In addition, we hire temporary workers to meet peak seasonal demands. ITEM 1A. RISK FACTORS
The following is a cautionary discussion of the most significant risks, uncertainties and assumptions that we believe are significant to our business and should be considered carefully in conjunction with all of the other information set forth in this Annual Report on Form 10-K. The risks described below are not an exhaustive list of all of the risks that we face. The risks described below are organized by category of risks to the Partnership, but are not necessarily listed by order of priority or materiality. In addition to the factors discussed elsewhere in this Annual Report on Form 10-K, the factors described in this item could, individually or in the aggregate, cause our actual results to differ materially from those described in any forward-looking statements. Should unknown risks or uncertainties materialize or underlying assumptions prove inaccurate, actual results could materially differ from past results and/or those anticipated, estimated or projected. Achievement of future results is subject to risks, uncertainties and potentially inaccurate assumptions. In this case, the trading price of our Common Units could decline and you might lose part or all of the value in our Common Units. Investing in our Common Units involves a high degree of risk. Past financial performance may not be a reliable indicator of future performance and historical trends should not be used to anticipate results or trends in future periods. You should carefully consider the specific risk factors set forth below as well as the other information contained or incorporated by reference in this Annual Report. Some factors in this section are Forward-Looking Statements. See “Disclosure Regarding Forward-Looking Statements” above.
RISKS RELATED TO OUR BUSINESS
Because weather conditions may adversely affect demand for propane, fuel oil and other refined fuels and natural gas, our results of operations and financial condition are vulnerable to warm winters and natural disasters.
Weather conditions have a significant impact on the demand for propane, fuel oil and other refined fuels and natural gas for both heating and agricultural purposes. Many of our customers rely on propane, fuel oil or natural gas primarily as a heating source. The volume of propane, fuel oil and natural gas sold is at its highest during the six-month peak heating season of October through March and is directly affected by the severity and length of the winter months. Typically, we sell approximately two-thirds of our retail propane volume and approximately three-fourths of our retail fuel oil volume during the peak heating season. Weather conditions can vary substantially from year to year in the regions in which we operate, which could significantly impact the demand for our products and our financial performance and condition. The agricultural demand for propane is also affected by the weather, as dry or warm weather during the harvest season may reduce the demand for propane used in some crop drying applications for which we service.
Actual weather conditions can vary substantially from year to year, significantly affecting our financial performance. For example, average temperatures in our service territories were 10%, 6% and 7% warmer than normal for fiscal 2020, fiscal 2019 and fiscal 2018, respectively, as measured by the number of heating degree days reported by the National Oceanic and Atmospheric Administration (“NOAA”). Furthermore, variations in weather in one or more regions in which we operate can significantly affect the total volume of propane, fuel oil and other refined fuels and natural gas we sell and, consequently, our results of operations. Variations in the weather in the northeast, where we have a greater concentration of propane accounts and substantially all of our fuel oil and natural gas operations, generally have a greater impact on our operations than variations in the weather in other regions. We can give no assurance that the weather conditions in any quarter or year will not have a material adverse effect on our operations, or that our available cash will be sufficient to pay principal and interest on our indebtedness and distributions to Unitholders.
If the frequency or magnitude of significant weather conditions or natural disasters such as floods, droughts, wildfires, hurricanes or earthquakes increase, as a result of climate change or for other reasons, our results of operations and our financial performance could be negatively impacted by the extent of damage to our facilities or to our customers’ residential homes and business structures or of disruption to the supply of the products we sell.
Deterioration of general economic conditions have harmed and could continue to harm our business and results of operations.
Our business and results of operations have been, and may continue to be, adversely affected by changes in national or global economic conditions, including inflation, interest rates, availability of capital markets, consumer spending rates, unemployment rates, energy availability and costs, the negative impacts caused by pandemics and public health crises (including the COVID-19 outbreak), and the effects of governmental initiatives to manage economic conditions.
Volatility in financial markets and deterioration of national and global economic conditions have impacted, and may continue to impact, our business and operations in a variety of ways, including as follows:
10
• certain of our commercial and industrial customers have temporarily curtailed or suspended operations in light of the pandemic;
• our consumers may reduce their discretionary spending, or may forego certain purchases altogether, during economic downturns, and may reduce or delay their payments for our products as a result of significant unemployment due to COVID-19;
• if the deterioration of the economy continues to impact our customers, it could lead to increases in customer payment default rates and related challenges in collecting on accounts receivable;
• if a significant percentage of our workforce is unable to work, including because of illness or travel or government restrictions in connection with COVID-19, our operations may be negatively impacted;
• a shutdown of one or a multiple of our customer service centers or the production facilities of our suppliers due to government restrictions or illness in connection with COVID-19 could significantly impact our operations;
• decreased demand in the residential, commercial, industrial, government, agricultural or wholesale markets (including due to COVID-19) may adversely affect our propane, fuel oil and refined fuels, and natural gas and electricity businesses;
• volatility in commodity and other input costs could substantially impact our result of operations;
• if our indebtedness increases or our Consolidated EBITDA declines, it could adversely affect our liquidity and lead to increased risks of default under our Credit Agreement; and
• it may become more costly or difficult to obtain debt or equity financing to fund investment opportunities, or to refinance our debt in the future, in each case on terms and within a time period acceptable to us.
Disruption of our supply chain could have an adverse impact on our business and our operating results.
Damage or disruption to our supply chain, including third-party production or transportation and distribution capabilities, due to weather, including any potential effects of climate change, natural disaster, fire or explosion, terrorism, pandemics (such as the COVID-19 outbreak), strikes, government action, economic and operational considerations of producers and refineries, or other reasons beyond our control or the control of our suppliers and business partners, could impair our ability to acquire sufficient supplies of the products we sell.
In particular, we are actively monitoring the ongoing COVID-19 outbreak and its potential impact on our supply chain. Although we source our propane, fuel oil and refined fuels, and natural gas from a broad group of suppliers, due to restrictions resulting from the outbreak, global supply of these fuels may become constrained, which may cause the price to increase and/or adversely affect our ability to acquire adequate supplies to meet customer demand.
Sudden increases in our costs to acquire and transport propane, fuel oil and other refined fuels and natural gas due to, among other things, our inability to obtain adequate supplies from our usual suppliers, or our inability to obtain adequate supplies of such products from alternative suppliers, may adversely affect our operating results.
Our profitability in the retail propane, fuel oil and refined fuels and natural gas businesses is largely dependent on the difference between our costs to acquire and transport product and retail sales price. Propane, fuel oil and other refined fuels and natural gas are commodities, and the availability of those products, and the unit prices we need to pay to acquire and transport those products, are subject to volatile changes in response to changes in production and supply or other market conditions over which we have no control, including the severity and length of winter weather, natural disasters, the price and availability of competing alternative energy sources, competing demands for the products (including for export) and infrastructure (including highway, rail, pipeline and refinery) constraints. Our supply of these products from our usual sources may be interrupted due to these and other reasons that are beyond our control, necessitating the transportation of product, if it is available at all, by truck, rail car or other means from other suppliers in other areas, with resulting delay in receipt and delivery to customers and increased expense. As a result, our costs of acquiring and transporting alternative supplies of these products to our facilities may be materially higher at least on a short-term basis. Because we may not be able to pass on to our customers immediately, or in full, all increases in our wholesale and transportation costs of propane, fuel oil and other refined fuels and natural gas, these increases could reduce our profitability. In addition, our inability to obtain sufficient supplies of propane, fuel oil and other refined fuels and natural gas in order for us to fully meet our customer demand for these products on a timely basis could adversely affect our revenues, and consequently our profitability.
In general, product supply contracts permit suppliers to charge posted prices at the time of delivery or the current prices established at major supply points, including Mont Belvieu, Texas, and Conway, Kansas. We engage in transactions to manage the price risk associated with certain of our product costs from time to time in an attempt to reduce cost volatility and to help ensure availability of

11
product. We can give no assurance that future increases in our costs to acquire and transport propane, fuel oil and natural gas will not have a material adverse effect on our profitability and cash flow, or that our available cash will be sufficient to pay principal and interest on our indebtedness and distributions to our Unitholders.
High prices for propane, fuel oil and other refined fuels and natural gas can lead to customer conservation, resulting in reduced demand for our product.
Prices for propane, fuel oil and other refined fuels and natural gas are subject to fluctuations in response to changes in wholesale prices and other market conditions beyond our control. Therefore, our average retail sales prices can vary significantly within a heating season or from year to year as wholesale prices fluctuate with propane, fuel oil and natural gas commodity market conditions. During periods with high product costs for propane, fuel oil and other refined fuels and natural gas, our selling prices generally increase. High prices can lead to customer conservation, resulting in reduced demand for our products.
Because of the highly competitive nature of the retail propane and fuel oil businesses, we may not be able to retain existing customers or acquire new customers, which could have an adverse impact on our operating results and financial condition.
The retail propane and fuel oil industries are mature and highly competitive. We expect overall demand for propane and fuel oil to be relatively flat to moderately declining over the next several years. Year-to-year industry volumes of propane and fuel oil are expected to be primarily affected by weather patterns and from competition intensifying during warmer than normal winters, as well as from the impact of a sustained higher commodity price environment on customer conservation and the impact of perceived uncertainty about the economy on customer buying habits.
Propane and fuel oil compete with electricity, natural gas and other existing and future sources of energy, some of which are, or may in the future be, less costly for equivalent energy value. For example, natural gas currently is a significantly less expensive source of energy than propane and fuel oil on an equivalent BTU basis. As a result, except for some industrial and commercial applications, propane and fuel oil are generally not economically competitive with natural gas in areas where natural gas pipelines already exist. The gradual expansion of the nation’s natural gas distribution systems has made natural gas available in many areas that previously depended upon propane or fuel oil. We expect this trend to continue, and, with the increasingly abundant supply of natural gas from domestic sources, perhaps accelerate. Propane and fuel oil compete to a lesser extent with each other due to the cost of converting from one source to the other.
In addition to competing with other sources of energy, our propane and fuel oil businesses compete with other distributors of those respective products principally on the basis of price, service and availability. Competition in the retail propane business is highly fragmented and generally occurs on a local basis with other large full-service multi-state propane marketers, thousands of smaller local independent marketers and farm cooperatives. Our fuel oil business competes with fuel oil distributors offering a broad range of services and prices, from full service distributors to those offering delivery only. In addition, our existing fuel oil customers, unlike our existing propane customers, generally own their own tanks, which can result in intensified competition for these customers.
As a result of the highly competitive nature of the retail propane and fuel oil businesses, our growth within these industries depends on our ability to acquire other retail distributors, open new customer service centers, add new customers and retain existing customers. We can give no assurance that we will be able to acquire other retail distributors, add new customers and retain existing customers.
Energy efficiency, general economic conditions and technological advances have affected and may continue to affect demand for propane and fuel oil by our retail customers.
The national trend toward increased conservation and technological advances, including installation of improved insulation and the development of more efficient furnaces and other heating devices, has adversely affected the demand for propane and fuel oil by our retail customers which, in turn, has resulted in lower sales volumes to our customers. In addition, perceived uncertainty about the economy may lead to additional conservation by retail customers seeking to further reduce their heating costs, particularly during periods of sustained higher commodity prices. Future technological advances in heating, conservation and energy generation and continued economic weakness may adversely affect our volumes sold, which, in turn, may adversely affect our financial condition and results of operations.
Current conditions in the global capital and credit markets, and general economic pressures, may adversely affect our financial position and results of operations.
Our business and operating results are materially affected by worldwide economic conditions. Current conditions in the global capital and credit markets and general economic pressures have led to wavering consumer and business confidence and increased market volatility, which have affected business activity generally. This situation, especially when coupled with increasing energy prices, may
12
cause our customers to experience cash flow shortages which in turn may lead to delayed or cancelled plans to purchase our products, and affect the ability of our customers to pay for our products. In addition, any disruptions in the U.S. residential mortgage market (as a result of changes in tax laws or otherwise) and the rate of mortgage foreclosures may adversely affect retail customer demand for our products (in particular, products used for home heating and home comfort equipment) and our business and results of operations.
The risk of terrorism, political unrest and the current hostilities in the Middle East or other energy producing regions may adversely affect the economy and the price and availability of propane, fuel oil and other refined fuels and natural gas.
Terrorist attacks, political unrest and the current hostilities in the Middle East or other energy producing regions may adversely impact the price and availability of propane, fuel oil and other refined fuels and natural gas, as well as our results of operations, our ability to raise capital and our future growth. The impact that the foregoing may have on our industry in general, and on us in particular, is not known at this time. An act of terror could result in disruptions of crude oil or natural gas supplies and markets (the sources of propane and fuel oil), and our infrastructure facilities could be direct or indirect targets. Terrorist activity may also hinder our ability to transport propane, fuel oil and other refined fuels if our means of supply transportation, such as rail or pipeline, become damaged as a result of an attack. A lower level of economic activity could result in a decline in energy consumption, which could adversely impact our revenues or restrict our future growth. Instability in the financial markets as a result of terrorism could also affect our ability to raise capital. Terrorist activity, political unrest and hostilities in the Middle East or other energy producing regions could likely lead to increased volatility in prices for propane, fuel oil and other refined fuels and natural gas. We have opted to purchase insurance coverage for terrorist acts within our property and casualty insurance programs, but we can give no assurance that our insurance coverage will be adequate to fully compensate us for any losses to our business or property resulting from terrorist acts.
Our financial condition and results of operations may be adversely affected by governmental regulation and associated environmental and health and safety costs.
Our business is subject to a wide and ever increasing range of federal, state and local laws and regulations related to environmental, health and safety matters including those concerning, among other things, the investigation and remediation of contaminated soil, groundwater and other environmental sources, and the transportation of hazardous materials. These requirements are complex, changing and tend to become more stringent over time. In addition, we are required to maintain various permits that are necessary to operate our facilities, some of which are material to our operations. There can be no assurance that we have been, or will be, at all times in complete compliance with all legal, regulatory and permitting requirements or that we will not incur significant costs in the future relating to such requirements. Violations could result in penalties, or the curtailment or cessation of operations.
Moreover, currently unknown environmental issues, such as the discovery of contamination, could result in significant expenditures, including the need to comply with future changes to environmental laws and regulations or the interpretation or enforcement thereof. Such expenditures, if required, could have a material adverse effect on our business, financial condition or results of operations.
The ability of AES to acquire and retain retail natural gas and electricity customers is highly competitive, price sensitive and may be impacted by changes in state regulations.
The deregulated retail natural gas and electricity industries in which AES participates are highly competitive. New York has proposed major new regulation of these industries, and other states have changed business rules to provide further protections to consumers. An Order from the New York Public Service Commission (“NY PSC“) regarding low income consumers went into effect in 2018 and required that all energy service companies (“ESCOs”) stop serving low-income consumers. As a result, AES returned approximately 7,200 of our customers to local utility service. A second order (“Reset Order”) issued by the NY PSC in 2016 attempted to impose rules that would have allowed the NY PSC to regulate ESCO pricing, which was subsequently challenged and struck down by the New York Supreme Court. On appeal, the New York State Court of Appeals issued a ruling in 2019 that held that the NY PSC cannot regulate ESCO pricing, but does have the ability to restrict an ESCO’s access to the utility distribution system if the NY PSC determines that an ESCO’s pricing is not “just and reasonable.” In December 2019, the NY PSC issued an Order that imposed product, pricing, and other requirements on ESCOs (“Second Reset Order”). AES was specifically and solely exempted from complying with the criteria concerning product offerings during the pendency of further rulemaking proceedings. In September 2020, the NY PSC issued another Order reaffirming the Second Reset Order, including the exemption that allows AES to maintain its existing business model in New York while rulemaking proceedings continue. Separately, the State of New York issued a State of Emergency Order in March of 2020 due to the COVID-19 pandemic. Under New York laws, telemarketers are prevented from making sales calls during states of emergency. As a result, AES halted all telemarketing sales efforts in New York in March 2020, and this condition continues to remain in effect as of the date of this Annual Report. At this time, we are unable to predict the ultimate outcome of the rulemaking, or the impact of such eventual outcome on AES’ business, but it could impact the ability of AES to acquire and retain natural gas and electricity customers.

13
These industries have also seen an increase in the number of class action lawsuits brought against retailers and relating to their pricing policies and practices. Two such lawsuits were commenced against AES in 2017 and 2018, involving New York and Pennsylvania customers. AES filed motions to dismiss both actions on procedural and substantive grounds, and the federal district court in the Pennsylvania action granted AES’ motion in its entirety in September 2018. The Pennsylvania court also denied Plaintiff’s motion to amend his complaint and reverse the dismissal order in November 2018, which the plaintiff appealed. In August 2020 this appeal was denied by the Third Circuit Court of Appeals. In the New York action, the federal district court granted AES’ dismissal motion in part in October 2018, but allowed plaintiff’s statutory consumer fraud and breach of contract causes of action to proceed. While AES believes the remaining claims in the New York action are devoid of merit and intends to vigorously defend itself in the matter, we are unable to predict at this time the ultimate outcome of the New York action. However, if we are ultimately unable to successfully defend our AES business in this class action lawsuit, a decision rendered against AES could have an adverse impact on our business and operations.
Costs associated with lawsuits, investigations or increases in legal reserves that we establish based on our assessment of contingent liabilities could adversely affect our operating results to the extent not covered by insurance.
Our operations expose us to various claims, lawsuits and other legal proceedings that arise in and outside of the ordinary course of our business. We may be subject to complaints and/or litigation involving our customers, employees and others with whom we conduct business, including claims for bodily injury, death and property damage related to operating hazards and risks normally associated with handling, storing and delivering combustible liquids such as propane, fuel oil and other refined fuels or claims based on allegations of discrimination, wage and hourly pay disputes, and various other claims as a result of other aspects of our business. We could be subject to substantial costs and/or adverse outcomes from such complaints or litigation, which could have a material adverse effect on our financial condition, cash flows or results of operations.
From time to time, our Partnership and/or other companies in the segments in which we operate may be reviewed or investigated by government regulators, which could lead to tax assessments, enforcement actions, fines and penalties or the assertion of private litigation claims. It is not possible to predict with certainty the outcome of claims, investigations and lawsuits, and we could in the future incur judgments, taxes, fines or penalties or enter into settlements of lawsuits or claims that could have an adverse impact on our financial condition or results of operations. We are self-insured for general and product, workers’ compensation and automobile liabilities up to predetermined amounts above which third-party insurance applies. We cannot guarantee that our insurance will be adequate to protect us from all material expenses related to potential future claims for personal injury and property damage or that these levels of insurance will be available at economical prices, or that all legal matters that arise will be covered by our insurance programs.
As required by U.S. generally accepted accounting principles (“GAAP”), we establish reserves based on our assessment of actual or potential loss contingencies, including contingencies related to legal claims asserted against us. Subsequent developments may affect our assessment and estimates of such loss contingencies and require us to make payments in excess of our reserves, which could have an adverse effect on our financial condition or results of operations.
If we are unable to make acquisitions on economically acceptable terms or effectively integrate such acquisitions into our operations, our financial performance may be adversely affected.
The retail propane and fuel oil industries are mature. We expect overall demand for propane and fuel oil to be relatively flat to moderately declining over the next several years. With respect to our retail propane business, it may be difficult for us to increase our aggregate number of retail propane customers except through acquisitions. As a result, we may engage in strategic transactions involving the acquisition of or investment in other retail propane and fuel oil distributors, other energy-related businesses or other related cross-functional lines of business. The competition for these acquisitions is intense and we can make no assurance that we will be able to successfully acquire other businesses on economically acceptable terms or, if we do, that we can integrate the operations of acquired businesses effectively or to realize the expected benefits of such transactions within the anticipated timeframe, or at all, such as cost savings, synergies, sales and growth opportunities. In addition, the integration of an acquired business may result in material unanticipated challenges, expenses, liabilities or competitive responses, including:
• a failure to implement our strategy for a particular strategic transaction, including successfully integrating the acquired business into our existing infrastructure, or a failure to realize value from a strategic investment;
• inconsistencies between our standards, procedures and policies and those of the acquired business; • costs or inefficiencies associated with the integration of our operational and administrative systems;
14
• an increased scope and complexity of our operations which could require significant attention from management and could impose constraints on our operations or other projects;
• unforeseen expenses, delays or conditions, including required regulatory or other third-party approvals or consents, or provisions in contracts with third parties that could limit our flexibility to take certain actions;
• an inability to retain the customers, employees, suppliers and/or business partners of the acquired business or generate new customers or revenue opportunities through a strategic transaction;
• the costs of compliance with local laws and regulations and the implementation of compliance processes, as well as the assumption of unexpected liabilities, litigation, penalties or other enforcement actions; and
• higher than expected costs arising due to unforeseen changes in tax, trade, environmental, labor, safety, payroll or pension policies.
Any one of these factors could result in delays, increased costs or decreases in the amount of expected revenues related to combining the businesses or derived from a strategic transaction and could adversely impact our financial condition or results of operations.
The adoption of climate change legislation could negatively impact our operations and result in increased operating costs and reduced demand for the products and services we provide.
The EPA issued an Endangerment Finding under the federal Clean Air Act, which determined that emissions of GHGs, such as carbon dioxide, present an endangerment to public health and the environment because emissions of such gases may be contributing to the warming of the earth’s atmosphere, volatility in seasonal temperatures, increased frequency and severity of storms, floods and other climatic changes. Based on these findings, the EPA has begun adopting and implementing regulations to restrict emissions of GHGs from certain industries and require reporting by certain regulated facilities. The EPA’s authority to regulate GHGs has been upheld by the U.S. Supreme Court. Changes in the EPA administration may result in the prioritization of climate change mitigation and adaptation measures and a push for significant reduction in GHG emissions.
Both Houses of the United States Congress also have considered adopting legislation to reduce emissions of GHGs. Although Congress has not yet enacted comprehensive federal legislation to address climate change, numerous states and municipalities have adopted laws and policies on climate change and GHG emission reduction targets. For example, in July 2019, the Climate Leadership and Community Protection Act was signed into law in New York, establishing a statewide climate action framework which includes a target to reduce net greenhouse gas emissions to zero by 2050.
While propane is considered a clean alternative to fuel and demand for propane may increase over other non-renewable sources of energy if new climate change legislation is enacted, the adoption of federal, state or local climate change legislation or regulatory programs to reduce emissions of GHGs could require us to incur increased capital and operating costs, with resulting impact on product price and demand. We cannot predict whether, when or in what form climate change legislation provisions and renewable energy standards may be enacted. In addition, a possible consequence of climate change is increased volatility in seasonal temperatures. It is difficult to predict how the market for our fuels would be affected by increased temperature volatility, although if there is an overall trend of warmer winter temperatures, it could adversely affect our business.
Our use of derivative contracts involves credit and regulatory risk and may expose us to financial loss.
From time to time, we enter into hedging transactions to reduce our business risks arising from fluctuations in commodity prices and interest rates. Hedging transactions expose us to risk of financial loss in some circumstances, including if the other party to the contract defaults on its obligations to us or if there is a change in the expected differential between the price of the underlying commodity or financial metric provided in the hedging agreement and the actual amount received. Transactional, margin, capital, recordkeeping, reporting, clearing and other requirements imposed on parties to derivatives transactions as a result of legislation and related rulemaking may increase our operational and transactional cost of entering into and maintaining derivatives contracts and may adversely affect the number and/or creditworthiness of derivatives counterparties available to us. If we were to reduce our use of derivatives as a result of regulatory burdens or otherwise, our results of operations could become more volatile and our cash flow could be less predictable.

15
We face risks related to our reliance on particular management information systems and communication networks to effectively manage all aspects of our delivery of propane.
We depend heavily on the performance and availability of our management information systems, websites and network infrastructure to attract and retain customers, process orders, manage inventory and accounts receivable collections, maintain distributor and customer information, maintain cost-efficient operations, assist in delivering our products on a timely basis and otherwise conduct our business. We have centralized our information systems and we rely on third-party communications service and system providers to provide technology services and link our systems with the business locations these systems were designed to serve. Any failure or disruption in the availability or operation of those management information systems, loss of employees knowledgeable about such systems, termination of our relationship with one or more of these key third-party providers or failure to continue to modify such systems effectively as our business expands could create negative publicity that damages our reputation or otherwise adversely impact our ability to manage our business effectively. We may experience system interruptions or disruptions for a variety of reasons, including as the result of network failures, power outages, cyber attacks, employee errors, software errors, an unusually high volume of visitors attempting to access our systems, or localized conditions such as fire, explosions or power outages or broader geographic events such as earthquakes, storms, floods, epidemics, strikes, acts of war, civil unrest or terrorist acts. Because we are dependent in part on independent third parties for the implementation and maintenance of certain aspects of our systems and because some of the causes of system interruptions may be outside of our control, we may not be able to remedy such interruptions in a timely manner, or at all. Our systems’ business continuity plans and insurance programs seek to mitigate such risks, but they cannot fully eliminate the risks as a failure or disruption could be experienced in any of our information systems.
We face risks related to cybersecurity breaches of our systems and information technology.
Cybersecurity threats to network and data security are becoming increasingly diverse and sophisticated. As threats become more frequent, intense and sophisticated, the costs of proactive defensive measures may increase as we seek to continue to protect our management information systems, websites and network. Third parties may have the technology or expertise to breach the security that we use to protect our customer transaction data and our security measures may not prevent physical security or cybersecurity breaches, which could result in significant harm to our business, our reputation or our results of operations. We rely on encryption and/or authentication technology licensed from and, at times, administered by independent third parties to secure transmission of confidential information, including personally identifiable information. Our outsourcing agreements with these third-party service providers generally require that they utilize adequate security systems to protect our confidential information. However, advances in computer capabilities, new discoveries in the field of cryptography or other cybersecurity developments could render our security systems and information technology, or those used by our third-party service providers, vulnerable to a breach. In addition, anyone who is able to circumvent our security measures could misappropriate proprietary information or cause interruptions in our operations. Risks of cybersecurity incidents caused by malicious third parties using sophisticated, targeted methods to circumvent firewalls, encryption, and other security defenses, could include hacking, viruses, malicious software, ransomware, phishing attacks, denial of service attacks and other attempts to capture, disrupt or gain unauthorized access to data are rapidly evolving and could lead to disruptions in our management information systems, websites or other data processing systems, unauthorized release of confidential or otherwise protected information or corruption of data. The techniques used by third parties change frequently and may be difficult to detect for long periods of time. In addition, dependence upon automated systems may further increase the risk that operational system flaws, employee tampering or manipulation of those systems will result in losses that are difficult to detect or recoup. To the extent customer data is hacked or misappropriated, we could be subject to liability to affected persons. Any successful efforts by individuals to infiltrate, break into, disrupt, damage or otherwise steal from us or our third-party service providers’ security or information systems could damage our reputation and expose us to increased costs, litigation or other liability that could adversely impact our financial condition or results of operations.
RISKS RELATED TO OUR INDEBTEDNESS AND ACCESS TO CAPITAL
We face risks related to our current and future debt obligations that may limit our ability to make distributions to Unitholders, as well as our financial flexibility.
As of September 26, 2020, our long-term debt consisted of $525.0 million in aggregate principal amount of 5.5% senior notes due June 1, 2024, $250.0 million in aggregate principal amount of 5.75% senior notes due March 1, 2025, $350.0 million in aggregate principal amount of 5.875% senior notes due March 1, 2027 and $94.6 million outstanding under our $500.0 million senior secured revolving credit facility. The payment of principal and interest on our debt will reduce the cash available to make distributions on our Common Units. In addition, we will not be able to make any distributions to holders of our Common Units if there is, or after giving effect to such distribution, there would be, an event of default under the indentures governing the senior notes and the senior secured revolving credit facility. The amount of distributions that we may make to holders of our Common Units is limited by the senior notes, and the amount of distributions that the Operating Partnership may make to us is limited by our revolving credit facility.

16
The revolving credit facility and the senior notes both contain various restrictive and affirmative covenants applicable to us, the Operating Partnership and its subsidiaries, respectively, including (i) restrictions on the incurrence of additional indebtedness, and (ii) restrictions on certain liens, investments, guarantees, loans, advances, payments, mergers, consolidations, distributions, sales of assets and other transactions. The revolving credit facility contains certain financial covenants:
• requiring our consolidated interest coverage ratio, as defined, to be not less than 2.5 to 1.0 as of the end of any fiscal quarter; • prohibiting our total consolidated leverage ratio, as defined, from being greater than 5.75 to 1.0 as of the end of any fiscal
quarter; • prohibiting the senior secured consolidated leverage ratio, as defined, of the Operating Partnership from being greater than
3.25 to 1.0 as of the end of any fiscal quarter.
Under the indentures governing the senior notes, we are generally permitted to make cash distributions equal to available cash, as defined, as of the end of the immediately preceding quarter, if no event of default exists or would exist upon making such distributions, and our consolidated fixed charge coverage ratio, as defined, is greater than 1.75 to 1. We and the Operating Partnership were in compliance with all covenants and terms of the senior notes and the revolving credit facility as of September 26, 2020.
The amount and terms of our debt may also adversely affect our ability to finance future operations and capital needs, limit our ability to pursue acquisitions and other business opportunities and make our results of operations more susceptible to adverse economic and industry conditions. In addition to our outstanding indebtedness, we may in the future require additional debt to finance acquisitions or for general business purposes; however, credit market conditions may impact our ability to access such financing. If we are unable to access needed financing or to generate sufficient cash from operations, we may be required to abandon certain projects or curtail capital expenditures. Additional debt, where it is available, could result in an increase in our leverage. Our ability to make principal and interest payments depends on our future performance, which is subject to many factors, some of which are beyond our control. As interest expense increases (whether due to an increase in interest rates and/or the size of aggregate outstanding debt), our ability to fund distributions on our Common Units may be impacted, depending on the level of revenue generation, which is not assured.
Our operating results and ability to generate sufficient cash flow to pay principal and interest on our indebtedness, and to pay distributions to Unitholders, may be affected by our ability to continue to control expenses.
The propane and fuel oil industries are mature and highly fragmented with competition from other multi-state marketers and thousands of smaller local independent marketers. Demand for propane and fuel oil is expected to be affected by many factors beyond our control, including, but not limited to, the severity and length of weather conditions during the peak heating season, customer energy conservation driven by high energy costs and other economic factors, as well as technological advances impacting energy efficiency. Accordingly, our propane and fuel oil sales volumes and related gross margins may be negatively affected by these factors beyond our control. Our operating profits and ability to generate sufficient cash flow may depend on our ability to continue to control expenses in line with sales volumes. We can give no assurance that we will be able to continue to control expenses to the extent necessary to reduce any negative impact on our profitability and cash flow from these factors.
Disruptions in the capital and credit markets, including the availability and cost of debt and equity issuances for liquidity requirements, may adversely affect our ability to meet long-term commitments and our ability to hedge effectively, any of which could adversely affect our results of operations, cash flows and financial condition.
We rely on our ability to access the capital and credit markets at rates and terms reasonable to us. A disruption in the capital and credit markets could impair our ability to access capital and credit markets at rates and terms acceptable to us or not at all. This could limit our ability to refinance long-term debt at or in advance of maturities or could force us to access capital and credit markets at rates or terms normally considered to be unreasonable.
RISKS RELATED TO OUR COMMON UNITS
Cash distributions are not guaranteed and may fluctuate with our performance and other external factors.
Cash distributions on our Common Units are not guaranteed, and depend primarily on our cash flow and our cash on hand. Because they are not directly dependent on profitability, which is affected by non-cash items, our cash distributions might be made during periods when we record losses and might not be made during periods when we record profits.
The amount of cash we generate may fluctuate based on our performance and other factors, including:
• the impact of the risks inherent in our business operations, as described above;
• required principal and interest payments on our debt and restrictions contained in our debt instruments;
17
• issuances of debt and equity securities;
• our ability to control expenses;
• fluctuations in working capital;
• capital expenditures; and
• financial, business and other factors, a number of which may be beyond our control.
Our Partnership Agreement gives our Board of Supervisors broad discretion in establishing cash reserves for, among other things, the proper conduct of our business. These cash reserves will affect the amount of cash available for distributions.
Unitholders have limited voting rights.
A Board of Supervisors governs our operations. Unitholders have only limited voting rights on matters affecting our business, including the right to elect the members of our Board of Supervisors every three years and the right to vote on the removal of the general partner.
It may be difficult for a third party to acquire us, even if doing so would be beneficial to our Unitholders.
Some provisions of our Partnership Agreement may discourage, delay or prevent third parties from acquiring us, even if doing so would be beneficial to our Unitholders. For example, our Partnership Agreement contains a provision, based on Section 203 of the Delaware General Corporation Law, that generally prohibits us from engaging in a business combination with a 15% or greater Unitholder for a period of three years following the date that person or entity acquired at least 15% of our outstanding Common Units, unless certain exceptions apply. Additionally, our Partnership Agreement sets forth advance notice procedures for a Unitholder to nominate a Supervisor to stand for election, which procedures may discourage or deter a potential acquirer from conducting a solicitation of proxies to elect the acquirer’s own slate of Supervisors or otherwise attempting to obtain control of the Partnership. These nomination procedures may not be revised or repealed, and inconsistent provisions may not be adopted, without the approval of the holders of at least 66-2/3% of the outstanding Common Units. These provisions may have an anti-takeover effect with respect to transactions not approved in advance by our Board of Supervisors, including discouraging attempts that might result in a premium over the market price of the Common Units held by our Unitholders.
Unitholders may not have limited liability in some circumstances.
A number of states have not clearly established limitations on the liabilities of limited partners for the obligations of a limited partnership. Our Unitholders might be held liable for our obligations as if they were general partners if:
• a court or government agency determined that we were conducting business in the state but had not complied with the state’s limited partnership statute; or
• Unitholders’ rights to act together to remove or replace the General Partner or take other actions under our Partnership Agreement are deemed to constitute “participation in the control” of our business for purposes of the state’s limited partnership statute.
Unitholders may have liability to repay distributions.
Unitholders will not be liable for assessments in addition to their initial capital investment in the Common Units. Under specific circumstances, however, Unitholders may have to repay to us amounts wrongfully returned or distributed to them. Under Delaware law, we may not make a distribution to Unitholders if the distribution causes our liabilities to exceed the fair value of our assets. Liabilities to partners on account of their partnership interests and nonrecourse liabilities are not counted for purposes of determining whether a distribution is permitted. Delaware law provides that a limited partner who receives a distribution of this kind and knew at the time of the distribution that the distribution violated Delaware law will be liable to the limited partnership for the distribution amount for three years from the distribution date. Under Delaware law, an assignee who becomes a substituted limited partner of a limited partnership is liable for the obligations of the assignor to make contributions to the partnership. However, such an assignee is not obligated for liabilities unknown to him at the time he or she became a limited partner if the liabilities could not be determined from the partnership agreement.
18
Our limited partner interest and Unitholders’ percentage of ownership may be diluted in the future and additional taxable income may be allocated to each Unitholder.
Our Partnership Agreement generally allows us to issue additional limited partner interests and other equity securities without the approval of our Unitholders. Therefore, when we issue additional Common Units or securities ranking above or on a parity with the Common Units, each Unitholder’s partnership interest will be diluted proportionately, and the amount of cash distributed on each Common Unit and the market price of Common Units could decrease. Similarly, our Unitholders’ percentage of ownership may be diluted in the future due to equity issuances or equity awards that we have granted or will grant to our supervisors, officers and employees. In addition, we have engaged in and may continue to undertake acquisitions financed in part through public or private offerings of securities, or other arrangements. The issuance of additional Common Units will also diminish the relative voting strength of each previously outstanding Common Unit. In addition, the issuance of additional Common Units, or other equity securities, will, over time, result in the allocation of additional taxable income, representing built-in gains at the time of the new issuance, to those Unitholders that existed prior to the new issuance.
TAX RISKS TO OUR UNITHOLDERS
Our tax treatment depends on our status as a partnership for U.S. federal income tax purposes. The Internal Revenue Service (“IRS”) could treat us as a corporation, which would substantially reduce the cash available for distribution to Unitholders.
The anticipated after-tax economic benefit of an investment in our Common Units depends largely on our being treated as a partnership for U.S. federal income tax purposes. If less than 90% of the gross income of a publicly traded partnership, such as Suburban Propane Partners, L.P., for any taxable year is “qualifying income” within the meaning of Section 7704 of the Internal Revenue Code, that partnership will be taxable as a corporation for U.S. federal income tax purposes for that taxable year and all subsequent years.
If we were treated as a corporation for U.S. federal income tax purposes, then we would pay U.S. federal income tax on our net income at the corporate tax rate, which is currently a maximum of 21%, and would likely pay additional state and local income and franchise tax at varying rates. Because a tax would be imposed upon us as a corporation, our cash available for distribution to Unitholders would be substantially reduced. Treatment of us as a corporation would result in a material reduction in the anticipated cash flow and after-tax return to Unitholders and thus would likely result in a substantial reduction in the value of our Common Units.
The tax treatment of publicly traded partnerships or an investment in our Common Units could be subject to potential legislative, judicial or administrative changes and differing interpretations thereof, possibly on a retroactive basis.
The present U.S. federal income tax treatment of publicly traded partnerships, including Suburban Propane Partners, L.P., or an investment in our Common Units may be modified by legislative, judicial or administrative changes and differing interpretations thereof at any time. Any modification to the U.S. federal income tax laws or interpretations thereof may or may not be applied retroactively. Moreover, any such modification could make it more difficult or impossible for us to meet the exception that allows publicly traded partnerships that generate qualifying income to be treated as partnerships (rather than as corporations) for U.S. federal income tax purposes, affect or cause us to change our business activities, or affect the tax consequences of an investment in our Common Units.
In addition, because of widespread state budget deficits and other reasons, several states are evaluating ways to subject partnerships to entity-level taxation through the imposition of state income, franchise and other forms of taxation.
If the IRS makes audit adjustments to our income tax returns for tax years beginning after 2017, it (and some states) may collect any resulting taxes (including any applicable penalties and interest) directly from the Partnership, in which case cash available to service debt or to pay distributions to our Unitholders, could be substantially reduced.
Pursuant to the Bipartisan Budget Act of 2015, if the IRS makes audit adjustments to our income tax returns for tax years beginning after 2017, it may collect any resulting taxes (including any applicable penalties and interest) directly from us. We will generally have the ability to allocate any such tax liability to our current and former Unitholders in accordance with their interests in us during the year under audit. However, we may not be able to (or may not choose to) so allocate that tax liability, and may not be able to (or may choose not to) similarly allocate state income or similar tax liability resulting from adjustments in states in which we do business in the year under audit or in the adjustment year; accordingly, our current Unitholders may bear some or all of the audit adjustment, even if such Unitholders did not own units during the tax year under audit. If we make payments of taxes, penalties and interest resulting from audit adjustments, cash available to service debt or to make distributions to our Unitholders could be reduced.

19
A successful IRS contest of the U.S. federal income tax positions we take may adversely affect the market for our Common Units, and the cost of any IRS contest will reduce our cash available for distribution to our Unitholders.
We have not requested a ruling from the IRS with respect to our treatment as a partnership for U.S. federal income tax purposes or any other matter affecting us. The IRS may adopt positions that differ from the positions we take. It may be necessary to resort to administrative or court proceedings to sustain some or all of the positions we take. A court may not agree with the positions we take. Any contest with the IRS may materially and adversely impact the market for our Common Units and the price at which they trade. In addition, our costs of any contest with the IRS will be borne indirectly by our Unitholders because the costs will reduce our cash available for distribution.
A Unitholder’s tax liability could exceed cash distributions on its Common Units.
Because our Unitholders are treated as partners, a Unitholder is required to pay U.S. federal income taxes and state and local income taxes on its allocable share of our income, without regard to whether we make cash distributions to the Unitholder. We cannot guarantee that a Unitholder will receive cash distributions equal to its allocable share of our taxable income or even the tax liability to it resulting from that income.
Ownership of Common Units may have adverse tax consequences for tax-exempt organizations and foreign investors.
Investment in Common Units by certain tax-exempt entities and foreign persons raises issues specific to them. For example, virtually all of our taxable income allocated to organizations exempt from U.S. federal income tax, including individual retirement accounts and other retirement plans, will be unrelated business taxable income and thus will be taxable to them. Further, with respect to taxable years beginning after December 31, 2017, a tax-exempt entity with more than one unrelated trade or business (including by attribution from an investment in a partnership such as ours that is engaged in one or more unrelated trades or businesses) is required to compute the unrelated business taxable income of such tax-exempt entity separately with respect to each such trade or business (including for purposes of determining any net operating loss deduction). As a result, for taxable years beginning after December 31, 2017, it may not be possible for tax-exempt entities to utilize losses from an investment in our partnership to offset unrelated business taxable income from another unrelated trade or business and vice versa.
Distributions to foreign persons will be reduced by withholding taxes at the highest applicable effective tax rate, and foreign persons will be required to file U.S. federal income tax returns and pay tax on their share of our taxable income. A foreign person who sells or otherwise disposes of a Common Unit will also be subject to U.S. federal income tax on the gain realized from the sale or disposition of that Common Unit. The Tax Cuts and Jobs Act imposes a 10% withholding tax on the amount realized on the disposition of a partnership interest by a foreign person if any gain on the transfer of such interest would be treated as giving rise to effectively connected income. Such withholding tax obligation is currently suspended in the case of a disposition of certain publicly traded partnership interests until further guidance is provided.
The ability of a Unitholder to deduct its share of our losses may be limited.
Various limitations may apply to the ability of a Unitholder to deduct its share of our losses. For example, in the case of taxpayers subject to the passive activity loss rules (generally, individuals and closely held corporations), any losses generated by us will only be available to offset our future income and cannot be used to offset income from other activities, including other passive activities or investments. Such unused losses may be deducted when the Unitholder disposes of its entire investment in us in a fully taxable transaction with an unrelated party, such as a sale by a Unitholder of all of its Common Units in the open market. A Unitholder’s share of any net passive income may be offset by unused losses from us carried over from prior years, but not by losses from other passive activities, including losses from other publicly-traded partnerships.
The tax gain or loss on the disposition of Common Units could be different than expected.
A Unitholder who sells Common Units will recognize a gain or loss equal to the difference between the amount realized and its adjusted tax basis in the Common Units. Prior distributions in excess of cumulative net taxable income allocated to a Common Unit which decreased a Unitholder’s tax basis in that Common Unit will, in effect, become taxable income if the Common Unit is sold at a price greater than the Unitholder’s tax basis in that Common Unit, even if the price is less than the original cost of the Common Unit. A portion of the amount realized, if the amount realized exceeds the Unitholder’s adjusted basis in that Common Unit, will likely be characterized as ordinary income. Furthermore, should the IRS successfully contest some conventions used by us, a Unitholder could recognize more gain on the sale of Common Units than would be the case under those conventions, without the benefit of decreased income in prior years. In addition, because the amount realized will include a holder’s share of our nonrecourse liabilities, if a Unitholder sells its Common Units, such Unitholder may incur a tax liability in excess of the amount of cash it receives from the sale.

20
Reporting of partnership tax information is complicated and subject to audits.
We intend to furnish to each Unitholder, within 90 days after the close of each calendar year, specific tax information, including a Schedule K-1 that sets forth its allocable share of income, gains, losses and deductions for our preceding taxable year. In preparing these schedules, we use various accounting and reporting conventions and adopt various depreciation and amortization methods. We cannot guarantee that these conventions will yield a result that conforms to statutory or regulatory requirements or to administrative pronouncements of the IRS. Further, our income tax return may be audited, which could result in an audit of a Unitholder’s income tax return and increased liabilities for taxes because of adjustments resulting from the audit.
We treat each purchaser of our Common Units as having the same tax benefits without regard to the actual Common Units purchased. The IRS may challenge this treatment, which could adversely affect the value of the Common Units.
Because we cannot match transferors and transferees of Common Units and because of other reasons, uniformity of the economic and tax characteristics of the Common Units to a purchaser of Common Units of the same class must be maintained. To maintain uniformity and for other reasons, we have adopted certain depreciation and amortization conventions that may be inconsistent with Treasury Regulations. A successful IRS challenge to those positions could adversely affect the amount of tax benefits available to a Unitholder. It also could affect the timing of these tax benefits or the amount of gain from the sale of Common Units, and could have a negative impact on the value of our Common Units or result in audit adjustments to a Unitholder’s income tax return.
We prorate our items of income, gain, loss and deduction between transferors and transferees of our Common Units each month based upon the ownership of our Common Units on the first day of each month, instead of on the basis of the date a particular Common Unit is transferred. The IRS may challenge this treatment, which could change the allocation of items of income, gain, loss and deduction among our Unitholders.
We prorate our items of income, gain, loss and deduction between transferors and transferees of our Common Units each month based upon the ownership of our Common Units on the first day of each month, instead of on the basis of the date a particular Common Unit is transferred. Treasury Regulations provide a safe harbor pursuant to which publicly traded partnerships may use a similar monthly simplifying convention to allocate tax items among transferors and transferees of our Common Units. However, if the IRS were to challenge our proration method, we may be required to change the allocation of items of income, gain, loss and deduction among our Unitholders.
Unitholders may have negative tax consequences if we default on our debt or sell assets.
If we default on any of our debt obligations, our lenders will have the right to sue us for non-payment. This could cause an investment loss and negative tax consequences for Unitholders through the realization of taxable income by Unitholders without a corresponding cash distribution. Likewise, if we were to dispose of assets and realize a taxable gain while there is substantial debt outstanding and proceeds of the sale were applied to the debt, Unitholders could have increased taxable income without a corresponding cash distribution.
There are state, local and other tax considerations for our Unitholders.
In addition to U.S. federal income taxes, Unitholders will likely be subject to other taxes, such as state and local taxes, unincorporated business taxes and estate, inheritance or intangible taxes that are imposed by the various jurisdictions in which we do business or own property, even if the Unitholder does not reside in any of those jurisdictions. A Unitholder will likely be required to file state and local income tax returns and pay state and local income taxes in some or all of the various jurisdictions in which we do business or own property and may be subject to penalties for failure to comply with those requirements. It is the responsibility of each Unitholder to file all U.S. federal, state and local income tax returns that may be required of each Unitholder.
A Unitholder whose Common Units are loaned to a “short seller” to cover a short sale of Common Units may be considered as having disposed of those Common Units. If so, that Unitholder would no longer be treated for tax purposes as a partner with respect to those Common Units during the period of the loan and may recognize gain or loss from the disposition.
Because lending a partnership interest is not tax free, a Unitholder whose Common Units are loaned to a “short seller” to cover a short sale of Common Units may be considered as having disposed of the loaned Common Units. In that case, a Unitholder may no longer be treated for tax purposes as a partner with respect to those Common Units during the period of the loan to the short seller and may recognize gain or loss from such disposition. Moreover, during the period of the loan to the short seller, any of our income, gain, loss or deduction with respect to those Common Units may not be reportable by the Unitholder and any cash distribution received by the Unitholder as to those Common Units could be fully taxable as ordinary income. Unitholders desiring to ensure their status as partners and avoid the risk of gain recognition from a loan to a short seller should consult their own tax advisors to discuss whether it is advisable to modify any applicable brokerage account agreements to prohibit their brokers from borrowing their Common Units.

21
ITEM 1B. UNRESOLVED STAFF COMMENTS
None.
ITEM 2. PROPERTIES
As of September 26, 2020, we owned approximately 74% of our customer service center and satellite locations and leased the balance of our retail locations from third parties. We own and operate a 22 million gallon refrigerated, aboveground propane storage facility in Elk Grove, California. Additionally, we own our principal executive offices located in Whippany, New Jersey.
The transportation of propane requires specialized equipment. The trucks and railroad tank cars utilized for this purpose carry specialized steel tanks that maintain the propane in a liquefied state. As of September 26, 2020, we had a fleet of 11 transport truck tractors, of which we owned 8, and 23 railroad tank cars, of which we owned none. In addition, as of September 26, 2020 we had 1,149 bobtail and rack trucks, of which we owned 37%, 111 fuel oil tankwagons, of which we owned 50%, and 1,286 other delivery and service vehicles, of which we owned 35%. We lease the vehicles we do not own. As of September 26, 2020, we also owned approximately 790,000 customer propane storage tanks with typical capacities of 100 to 500 gallons, 54,000 customer propane storage tanks with typical capacities of over 500 gallons and 271,000 portable propane cylinders with typical capacities of five to ten gallons.
ITEM 3. LEGAL PROCEEDINGS
Our operations are subject to operating hazards and risks normally incidental to handling, storing and delivering combustible liquids such as propane. We have been, and will continue to be, a defendant in various legal proceedings and litigation as a result of these operating hazards and risks, and as a result of other aspects of our business. In this regard, our natural gas and electricity business is currently a defendant in a putative class action suit in the Northern District of New York. The complaint alleges a number of claims under various consumer statutes and common law in New York and Pennsylvania regarding pricing offered to electricity customers in those states. The complaint was dismissed in part by the district court, but causes of action based on the New York consumer statute and breach of contract were allowed to proceed. Based on the nature of the allegations under this suit, we believe that the suit is without merit and we are defending against it vigorously. Accordingly, we have determined, based on the allegations and discovery to date in the suit, that no reserve for a loss contingency is required. We are unable to reasonably estimate the possible loss or range of loss, if any, arising from the action. Although any litigation is inherently uncertain, based on past experience, the information currently available to us, and the amount of our accrued insurance liabilities, we do not believe that currently pending or threatened litigation matters, or known claims or known contingent claims, will have a material adverse effect on our results of operations, financial condition or cash flow.
ITEM 4. MINE SAFETY DISCLOSURES
None.
22
PART II
ITEM 5. MARKET FOR THE REGISTRANT’S COMMON UNITS, RELATED UNITHOLDER MATTERS AND ISSUER PURCHASES OF UNITS
(a) Our Common Units, representing limited partner interests in the Partnership, are listed and traded on the New York Stock Exchange (“NYSE”) under the symbol SPH. As of November 23, 2020, there were 558 Unitholders of record (based on the number of record holders and nominees for those Common Units held in street name).
(b) Not applicable.
(c) On July 23, 2020, we announced that our quarterly distribution was reduced from $0.60 per Common Unit to $0.30 per Common Unit effective for the distribution payable in respect of the third quarter of fiscal 2020. This proactive step will reduce our annual cash requirements by approximately $75 million, and contribute to our efforts to accelerate debt reduction, further strengthen our balance sheet and enhance our financial flexibility to support our strategic growth initiatives. On October 22, 2020, we announced that our Board of Supervisors declared a quarterly distribution of $0.30 per Common Unit for the first three months ended September 26, 2020. This quarterly distribution rate equates to an annualized rate of $1.20 per Common Unit.
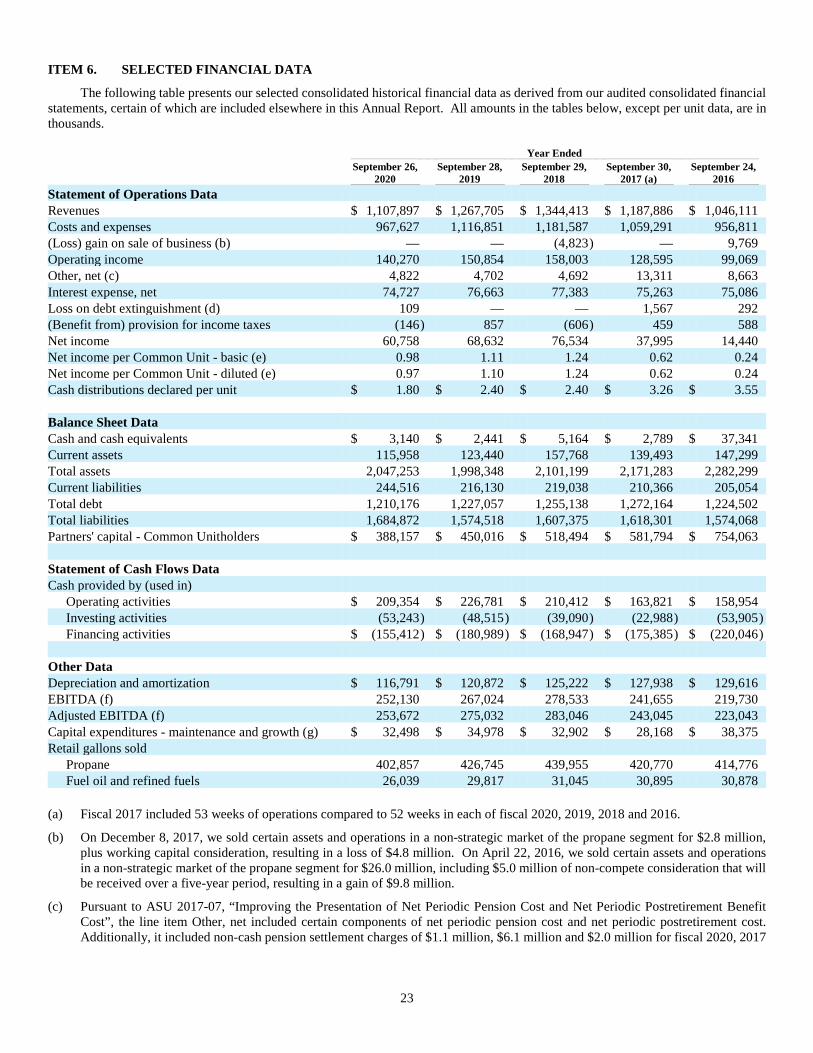
23
ITEM 6. SELECTED FINANCIAL DATA
The following table presents our selected consolidated historical financial data as derived from our audited consolidated financial statements, certain of which are included elsewhere in this Annual Report. All amounts in the tables below, except per unit data, are in thousands.
Year Ended
September 26,
2020 September 28,
2019 September 29,
2018 September 30,
2017 (a) September 24,
2016
Statement of Operations Data Revenues $ 1,107,897 $ 1,267,705 $ 1,344,413 $ 1,187,886 $ 1,046,111 Costs and expenses 967,627 1,116,851 1,181,587 1,059,291 956,811 (Loss) gain on sale of business (b) — — (4,823 ) — 9,769 Operating income 140,270 150,854 158,003 128,595 99,069 Other, net (c) 4,822 4,702 4,692 13,311 8,663 Interest expense, net 74,727 76,663 77,383 75,263 75,086 Loss on debt extinguishment (d) 109 — — 1,567 292 (Benefit from) provision for income taxes (146 ) 857 (606 ) 459 588 Net income 60,758 68,632 76,534 37,995 14,440 Net income per Common Unit - basic (e) 0.98 1.11 1.24 0.62 0.24 Net income per Common Unit - diluted (e) 0.97 1.10 1.24 0.62 0.24 Cash distributions declared per unit $ 1.80 $ 2.40 $ 2.40 $ 3.26 $ 3.55 Balance Sheet Data Cash and cash equivalents $ 3,140 $ 2,441 $ 5,164 $ 2,789 $ 37,341 Current assets 115,958 123,440 157,768 139,493 147,299 Total assets 2,047,253 1,998,348 2,101,199 2,171,283 2,282,299 Current liabilities 244,516 216,130 219,038 210,366 205,054 Total debt 1,210,176 1,227,057 1,255,138 1,272,164 1,224,502 Total liabilities 1,684,872 1,574,518 1,607,375 1,618,301 1,574,068 Partners' capital - Common Unitholders $ 388,157 $ 450,016 $ 518,494 $ 581,794 $ 754,063 Statement of Cash Flows Data Cash provided by (used in)
Operating activities $ 209,354 $ 226,781 $ 210,412 $ 163,821 $ 158,954 Investing activities (53,243 ) (48,515 ) (39,090 ) (22,988 ) (53,905 ) Financing activities $ (155,412 ) $ (180,989 ) $ (168,947 ) $ (175,385 ) $ (220,046 )
Other Data Depreciation and amortization $ 116,791 $ 120,872 $ 125,222 $ 127,938 $ 129,616 EBITDA (f) 252,130 267,024 278,533 241,655 219,730 Adjusted EBITDA (f) 253,672 275,032 283,046 243,045 223,043 Capital expenditures - maintenance and growth (g) $ 32,498 $ 34,978 $ 32,902 $ 28,168 $ 38,375 Retail gallons sold
Propane 402,857 426,745 439,955 420,770 414,776 Fuel oil and refined fuels 26,039 29,817 31,045 30,895 30,878
(a) Fiscal 2017 included 53 weeks of operations compared to 52 weeks in each of fiscal 2020, 2019, 2018 and 2016.
(b) On December 8, 2017, we sold certain assets and operations in a non-strategic market of the propane segment for $2.8 million, plus working capital consideration, resulting in a loss of $4.8 million. On April 22, 2016, we sold certain assets and operations in a non-strategic market of the propane segment for $26.0 million, including $5.0 million of non-compete consideration that will be received over a five-year period, resulting in a gain of $9.8 million.
(c) Pursuant to ASU 2017-07, “Improving the Presentation of Net Periodic Pension Cost and Net Periodic Postretirement Benefit Cost”, the line item Other, net included certain components of net periodic pension cost and net periodic postretirement cost. Additionally, it included non-cash pension settlement charges of $1.1 million, $6.1 million and $2.0 million for fiscal 2020, 2017
24
and 2016, respectively, to accelerate the recognition of actuarial losses in our defined benefit pension plans as a result of the level of lump sum retirement benefit payments made.
(d) We recognized a loss on debt extinguishment during the following periods:
• On March 5, 2020 the Partnership and the Operating Partnership entered into a Third Amended and Restated Credit Agreement (the “Credit Agreement”) that provides for a $500.0 million revolving credit facility (the “Revolving Credit Facility”), of which $94.6 million, $113.5 million, $143.6 million, $162.6 million and $100.0 million was outstanding as of September 26, 2020, September 28, 2019, September 29, 2018, September 30, 2017, and September 24, 2016, respectively. The Revolving Credit Facility matures on the earlier of (a) the date that is ninety-one (91) days prior to maturity of the 2024 Senior Notes (unless the notes have been refinanced prior to such date) and (b) March 5, 2025. At the time of the execution of the Credit Agreement, $183.9 million was outstanding under the Operating Partnership’s revolving credit facility of the previous credit agreement, which was rolled into the Revolving Credit Facility under the Credit Agreement. The Credit Agreement amends and restates the previous credit agreement to, among other things, extend the maturity, lower borrowing costs, and amend certain affirmative and negative covenants, including an increase to the maximum permitted Total Consolidated Leverage Ratio from 5.50x to 5.75x. Borrowings under the Revolving Credit Facility may be used for general corporate purposes, including working capital, capital expenditures and acquisitions. The Operating Partnership has the right to prepay any borrowings under the Revolving Credit Facility, in whole or in part, without penalty at any time prior to maturity. In connection with the execution of the Credit Agreement, the Partnership recognized a non-cash charge of $0.1 million to write-off a portion of unamortized debt origination costs of the previous credit agreement. On March 3, 2016, we entered into a Second Amended and Restated Credit Agreement and we recognized a non-cash charge of $0.3 million to write-off a portion of unamortized debt origination costs of the previous credit agreement.
• On February 14, 2017, we repurchased, satisfied and discharged all of our previously outstanding 2021 Senior Notes with net proceeds from the issuance of the 2027 Senior Notes and borrowings under the revolving credit facility, as described and defined below, pursuant to a tender offer and redemption. In connection with this tender offer and redemption during the second quarter of fiscal 2017, we recognized a loss on the extinguishment of debt of $1.6 million, consisting of $15.1 million for the redemption premium and related fees, as well as the write-off of $2.3 million and ($15.8) million in unamortized debt origination costs and unamortized premium, respectively.
(e) Computations of basic earnings per Common Unit were performed by dividing net income by the weighted average number of outstanding Common Units, and restricted units granted under our 2009 and 2018 Restricted Unit Plans (which we collectively refer to as the “Restricted Unit Plans” or the “RUP”) to retirement-eligible grantees. Computations of diluted earnings per Common Unit were performed by dividing net income by the weighted average number of outstanding Common Units and unvested restricted units granted under our Restricted Unit Plans.
(f) EBITDA represents net income before deducting interest expense, income taxes, depreciation and amortization. Adjusted EBITDA represents EBITDA, excluding the unrealized net gain or loss from mark-to-market activity for derivative instruments and other items, as applicable, as provided in the table below. Our management uses EBITDA and Adjusted EBITDA as supplemental measures of operating performance and we are including them because we believe that they provide our investors and industry analysts with additional information to evaluate our operating results. EBITDA and Adjusted EBITDA are not recognized terms under US GAAP and should not be considered as an alternative to net income or net cash provided by operating activities determined in accordance with US GAAP. Because EBITDA and Adjusted EBITDA as determined by us excludes some, but not all, items that affect net income, they may not be comparable to EBITDA and Adjusted EBITDA or similarly titled measures used by other companies.

25
The following table sets forth our calculations of EBITDA and Adjusted EBITDA:
Year Ended
September 26,
2020 September 28,
2019 September 29,
2018 September 30,
2017 September 24,
2016
Net income $ 60,758 $ 68,632 $ 76,534 $ 37,995 $ 14,440 Add:
(Benefit from) provision for income taxes (146 ) 857 (606 ) 459 588 Interest expense, net 74,727 76,663 77,383 75,263 75,086 Depreciation and amortization 116,791 120,872 125,222 127,938 129,616
EBITDA 252,130 267,024 278,533 241,655 219,730 Unrealized non-cash losses (gains) on changes in fair value of derivatives 382 8,008 (310 ) (6,277 ) 1,190 Pension settlement charge 1,052 — — 6,100 2,000 Loss on debt extinguishment 109 — — 1,567 292 Loss (gain) on sale of business — — 4,823 — (9,769 ) Multi-employer pension plan withdrawal charge — — — — 6,600 Product liability settlement — — — — 3,000 Adjusted EBITDA $ 253,673 $ 275,032 $ 283,046 $ 243,045 $ 223,043 (g) Our capital expenditures fall generally into two categories: (i) maintenance expenditures, which include expenditures for repair
and replacement of property, plant and equipment; and (ii) growth capital expenditures which include new propane tanks and other equipment to facilitate expansion of our customer base and operating capacity.

26
ITEM 7. MANAGEMENT’S DISCUSSION AND ANALYSIS OF FINANCIAL CONDITION AND RESULTS OF OPERATIONS
The following is a discussion of our financial condition and results of operations, which should be read in conjunction with our consolidated financial statements and notes thereto included elsewhere in this Annual Report.
Executive Overview
The following are factors that regularly affect our operating results and financial condition. In addition, our business is subject to the risks and uncertainties described in Item 1A of this Annual Report.
COVID-19 Pandemic
The COVID-19 pandemic has resulted in increased unemployment, commodity and stock market volatility, and uncertainty about conditions that will prevail in the months ahead. Certain of our commercial and industrial customers have temporarily curtailed or suspended operations in light of the pandemic, many in response to temporary governmental measures seeking to manage the spread and impact of the COVID-19 virus. We have seen a slowing in cash collections on outstanding accounts receivable as well, which we believe is in response to general economic conditions and uncertainty. As a result, we experienced lower revenues in certain customer sectors, and we are closely monitoring credit and collections activities. We took decisive action to adapt our business model and modify our operating protocols in order to help protect the health and safety of our employees, while ensuring seamless delivery of our essential services to the customers and communities we serve. We have also seen restrictions on our ability to decline business or to enforce our collection rights with respect to certain customers who refuse to pay for or negotiate a payment plan for products or services rendered in certain states in which we operate. While we expect that many of these effects will not be permanent, it is impossible to predict their duration. We have developed, implemented and continue to refine alternative operational plans, inclusive of manpower levels, to address different customer demand scenarios, and we continue to evaluate the potential impact of the COVID-19 pandemic on future cash flows and access to adequate liquidity as we navigate through fiscal 2021.
Product Costs and Supply
The level of profitability in the retail propane, fuel oil, natural gas and electricity businesses is largely dependent on the difference between retail sales price and our costs to acquire and transport products. The unit cost of our products, particularly propane, fuel oil and natural gas, is subject to volatility as a result of supply and demand dynamics or other market conditions, including, but not limited to, economic and political factors impacting crude oil and natural gas supply or pricing. We enter into product supply contracts that are generally one-year agreements subject to annual renewal, and also purchase product on the open market. We attempt to reduce price risk by pricing product on a short-term basis. Our propane supply contracts typically provide for pricing based upon index formulas using the posted prices established at major supply points such as Mont Belvieu, Texas, or Conway, Kansas (plus transportation costs) at the time of delivery.
To supplement our annual purchase requirements, we may utilize forward fixed price purchase contracts to acquire a portion of the propane that we resell to our customers, which allows us to manage our exposure to unfavorable changes in commodity prices and to assure adequate physical supply. The percentage of contract purchases, and the amount of supply contracted for under forward contracts at fixed prices, will vary from year to year based on market conditions.
Changes in our costs to acquire and transport products can occur rapidly over a short period of time and can impact profitability. There is no assurance that we will be able to pass on product acquisition and transportation cost increases fully or immediately, particularly when such costs increase rapidly. Therefore, average retail sales prices can vary significantly from year to year as our costs fluctuate with the propane, fuel oil, crude oil and natural gas commodity markets and infrastructure conditions. In addition, periods of sustained higher commodity and/or transportation prices can lead to customer conservation, resulting in reduced demand for our product.
Seasonality
The retail propane and fuel oil distribution businesses, as well as the natural gas marketing business, are seasonal because these fuels are primarily used for heating in residential and commercial buildings. Historically, approximately two-thirds of our retail propane volume is sold during the six-month peak heating season from October through March. The fuel oil business tends to experience greater seasonality given its more limited use for space heating and approximately three-fourths of our fuel oil volumes are sold between October and March. Consequently, sales and operating profits are concentrated in our first and second fiscal quarters. Cash flows from operations, therefore, are greatest during the second and third fiscal quarters when customers pay for product purchased during the winter heating season. We expect lower operating profits and either net losses or lower net income during the period from April through

27
September (our third and fourth fiscal quarters). To the extent necessary, we will reserve cash from the second and third quarters for distribution to holders of our Common Units in the fourth quarter and the following fiscal year first quarter.
CARES Act
On March 27, 2020, Congress passed and the President of the United States signed into law the Coronavirus Aid, Relief, and Economic Security Act (the “CARES Act”) to provide emergency economic assistance to those affected by COVID-19. We are taking advantage of certain of the benefits offered under the CARES Act, including but not necessarily limited to:
• deferral of our contribution of the employer portion of the social security payroll tax that is otherwise due with respect to wages accrued between March 27, 2020 and December 31, 2020; and
• deferral until January 1, 2021, of any, or a portion of, minimum required contributions to our defined benefit pension plan that would otherwise be due during calendar year 2020.
Weather
Weather conditions have a significant impact on the demand for our products, in particular propane, fuel oil and natural gas, for both heating and agricultural purposes. Many of our customers rely heavily on propane, fuel oil or natural gas as a heating source. Accordingly, the volume sold is directly affected by the severity of the winter weather in our service areas, which can vary substantially from year to year. In any given area, sustained warmer than normal temperatures will tend to result in reduced propane, fuel oil and natural gas consumption, while sustained colder than normal temperatures will tend to result in greater consumption.
Hedging and Risk Management Activities
We engage in hedging and risk management activities to reduce the effect of price volatility on our product costs and to ensure the availability of product during periods of short supply. We enter into propane forward, options and swap agreements with third parties, and use futures and options contracts traded on the New York Mercantile Exchange (“NYMEX”) to purchase and sell propane, fuel oil, crude oil and natural gas at fixed prices in the future. The majority of the futures, forward and options agreements are used to hedge price risk associated with propane and fuel oil physical inventory, as well as, in certain instances, forecasted purchases of propane or fuel oil. In addition, we sell propane and fuel oil to customers at fixed prices, and enter into derivative instruments to hedge a portion of our exposure to fluctuations in commodity prices as a result of selling the fixed price contracts. Forward contracts are generally settled physically at the expiration of the contract whereas futures, options and swap contracts are generally settled at the expiration of the contract through a net settlement mechanism. Although we use derivative instruments to reduce the effect of price volatility associated with priced physical inventory and forecasted transactions, we do not use derivative instruments for speculative trading purposes. Risk management activities are monitored by an internal Commodity Risk Management Committee, made up of six members of management and reporting to our Audit Committee, through enforcement of our Hedging and Risk Management Policy.
Critical Accounting Policies and Estimates
Our significant accounting policies are summarized in Note 2—Summary of Significant Accounting Policies included within the Notes to Consolidated Financial Statements section elsewhere in this Annual Report.
Certain amounts included in or affecting our consolidated financial statements and related disclosures must be estimated, requiring management to make certain assumptions with respect to values or conditions that cannot be known with certainty at the time the financial statements are prepared. The preparation of financial statements in conformity with US GAAP requires management to make estimates and assumptions that affect the reported amounts of assets and liabilities and disclosure of contingent assets and liabilities at the date of the financial statements and the reported amounts of revenues and expenses during the reporting period. We are also subject to risks and uncertainties that may cause actual results to differ from estimated results. Estimates are used when accounting for depreciation and amortization of long-lived assets, employee benefit plans, self-insurance and litigation reserves, environmental reserves, allowances for doubtful accounts, asset valuation assessments and valuation of derivative instruments. We base our estimates on historical experience and on various other assumptions that are believed to be reasonable under the circumstances, the results of which form the basis for making judgments about the carrying values of assets and liabilities that are not readily apparent from other sources. Any effects on our business, financial position or results of operations resulting from revisions to these estimates are recorded in the period in which the facts that give rise to the revision become known to us. Management has reviewed these critical accounting estimates and related disclosures with the Audit Committee of our Board of Supervisors. We believe that the following are our critical accounting estimates:
Allowances for Doubtful Accounts. We maintain allowances for doubtful accounts for estimated losses resulting from the inability of our customers to make required payments. We estimate our allowances for doubtful accounts using a specific reserve for

28
known or anticipated uncollectible accounts, as well as an estimated reserve for potential future uncollectible accounts taking into consideration our historical write-offs. If the financial condition of one or more of our customers were to deteriorate resulting in an impairment in their ability to make payments, additional allowances could be required. As a result of our large customer base, which is comprised of approximately 1.0 million customers, no individual customer account is material. Therefore, while some variation to actual results occurs, historically such variability has not been material. Schedule II, Valuation and Qualifying Accounts, provides a summary of the changes in our allowances for doubtful accounts during the period.
Pension and Other Postretirement Benefits. We estimate the rate of return on plan assets, the discount rate used to estimate the present value of future benefit obligations and the expected cost of future health care benefits in determining our annual pension and other postretirement benefit costs. We use the Society of Actuaries’ mortality scale (MP-2019) and other actuarial life expectancy information when developing the annual mortality assumptions for our pension and postretirement benefit plans, which are used to measure net periodic benefit costs and the obligation under these plans. While we believe that our assumptions are appropriate, significant differences in our actual experience or significant changes in market conditions may materially affect our pension and other postretirement benefit obligations and our future expense.
Accrued Insurance. Our accrued insurance represents the estimated costs of known and anticipated or unasserted claims for incidents related to general and product, workers’ compensation and automobile liability. For each claim, we record a provision up to the estimated amount of the probable claim utilizing actuarially determined loss development factors applied to actual claims data. Our insurance provisions are susceptible to change to the extent that actual claims development differs from historical claims development. We maintain insurance coverage wherein our net exposure for insured claims is limited to the insurance deductible, claims above which are paid by our insurance carriers. For the portion of our estimated insurance liability that exceeds our deductibles, we record an asset related to the amount of the liability expected to be paid by the insurance companies. Historically, we have not experienced significant variability in our actuarial estimates for claims incurred but not reported. Accrued insurance provisions for reported claims are reviewed at least quarterly, and our assessment of whether a loss is probable and/or reasonably estimable is updated as necessary. Due to the inherently uncertain nature of, in particular, product liability claims, the ultimate loss may differ materially from our estimates. However, because of the nature of our insurance arrangements, those material variations historically have not, nor are they expected in the future to have, a material impact on our results of operations or financial position.
Loss Contingencies. In the normal course of business, we are involved in various claims and legal proceedings. We record a liability for such matters when it is probable that a loss has been incurred and the amounts can be reasonably estimated. The liability includes probable and estimable legal costs to the point in the legal matter where we believe a conclusion to the matter will be reached. When only a range of possible loss can be established, the most probable amount in the range is accrued. If no amount within this range is a better estimate than any other amount within the range, the minimum amount in the range is accrued.
We contribute to multi-employer pension plans (“MEPPs”) in accordance with various collective bargaining agreements covering union employees. As one of the many participating employers in these MEPPs, we are responsible with the other participating employers for any plan underfunding. Due to the uncertainty regarding future factors that could impact the withdrawal liability, we are unable to determine the timing of the payment of the future withdrawal liability, or additional future withdrawal liability, if any.
Fair Values of Acquired Assets and Liabilities. From time to time, we enter into material business combinations. In accordance with accounting guidance associated with business combinations, the assets acquired and liabilities assumed are recorded at their estimated fair value as of the acquisition date. Fair values of assets acquired and liabilities assumed are based upon available information and may involve us engaging an independent third party to perform an appraisal. Estimating fair values can be complex and subject to significant business judgment. Estimates most commonly impact property, plant and equipment and intangible assets, including goodwill. Generally, we have, if necessary, up to one year from the acquisition date to finalize our estimates of acquisition date fair values.
Results of Operations and Financial Condition
Net income for fiscal 2020 was $60.8 million, or $0.98 per Common Unit, compared to $68.6 million, or $1.11 per Common Unit, in fiscal 2019.
Net income and EBITDA (as defined and reconciled below) for fiscal 2020 included a $1.1 million pension settlement charge and a $0.1 million loss on debt extinguishment. Excluding the effects of the foregoing items and unrealized non-cash mark-to-market adjustments on derivative instruments in both years, Adjusted EBITDA (as defined and reconciled below) amounted to $253.7 million for fiscal 2020, compared to $275.0 million in the prior year.
Retail propane gallons sold in fiscal 2020 of 402.9 million gallons decreased 5.6% compared to the prior year, primarily due to warmer than normal weather conditions during the most critical months for heat-related demand. While average temperatures (as measured by heating degree days) across all of our service territories for fiscal 2020 were 10% warmer than normal and 4% warmer
29
than the prior year, average temperatures during the peak demand months of December through February were 14% warmer than normal -- on par with the warmest temperatures on record.
Revenues for fiscal 2020 of $1,107.9 million decreased 12.6% compared to the prior year, primarily due to lower retail selling prices associated with lower wholesale costs, coupled with lower propane volumes sold.
Cost of products sold for fiscal 2020 of $383.0 million decreased 26.6% compared to the prior year, primarily due to lower wholesale costs and lower volumes sold. Average propane prices (basis Mont Belvieu, Texas) decreased 27.9% compared to the prior year. Cost of products sold for fiscal 2020 included a $0.4 million unrealized non-cash loss attributable to the mark-to-market adjustment for derivative instruments used in risk management activities, compared to an $8.0 million unrealized non-cash loss in fiscal 2019. These unrealized items are excluded from Adjusted EBITDA for both periods in the table below.
Combined operating and general and administrative expenses of $467.9 million for fiscal 2020 decreased 1.3% compared to the prior year, primarily due to lower volume-related variable operating costs and lower variable compensation, partially offset by an increase in accruals for self-insured liabilities and other legal matters.
The unprecedented health and economic crisis from COVID-19 continues to represent a complex uncertainty, which has had a profound negative overall impact on employment and the economy. While our business is considered an essential critical service, our business is not immune to the challenges presented by the dramatic economic slowdown resulting from governmental and voluntary measures instituted to mitigate the spread of the virus. The areas of our business that have been impacted by the economic slowdown are:
• The temporary suspension of business operations by certain of our commercial and industrial customers has resulted in lower demand from these customer markets;
• Depending on the length and depth of the economic slowdown, or the possibility of an economic recession, we could see demand destruction from businesses that are unable to recover, or from conservation efforts by all customer types;
• We are experiencing a slowdown in the rate of cash collections, and a higher amount of bad debts, from all customer types as they deal with their own economic uncertainties;
• In certain states, restrictions were placed on our business that would otherwise allow us to decline or refuse to service certain customers who have not or are unwilling to pay for product delivered or services rendered;
• There may be potential disruptions in the propane supply chain resulting from the combination of lower commodity prices and a lower demand outlook for crude oil, and the resultant impact on propane and fuel oil production and logistics; and
• The potential for increasing costs to implement additional measures to help protect our employees, customers and local communities as state and federal governments provide and update guidance on workplace safety protocols.
Although there is uncertainty related to the anticipated impact of the COVID-19 pandemic on our future results, we believe our efficient and flexible business model, as well as the recent steps taken to strengthen our balance sheet and reduce our cash requirements, leave us well positioned to manage our business through the crisis as it continues to unfold. Nonetheless, as we progress through fiscal 2021, there remains significant uncertainty regarding the length of the economic slowdown and the scope and duration of governmental policies that have been, or may in the future be, instituted to mitigate the spread of COVID-19, the timing of a potential economic recovery and the potential impact on the ability of our customers to recover from the effects of the slowdown. We will continue to adapt to the changing circumstances and make decisions to help ensure the long-term sustainability of our businesses, and our financial flexibility to be opportunistic for strategic growth initiatives.
In response, we developed, implemented and continue to refine alternative operational plans, inclusive of manpower levels, to address different customer demand scenarios, and we continue to evaluate the potential impact of the COVID-19 pandemic on future cash flows and access to adequate liquidity as we progress through fiscal 2021. Moreover, in the face of all of these challenges, we succeeded in accomplishing a number of significant goals in fiscal 2020 that will provide further support for our long-term strategic growth initiatives. The following highlights a few accomplishments for fiscal 2020:
• We made additional meaningful progress towards strengthening our balance sheet by reducing debt by $18.9 million with cash flows from operating activities;
• We successfully refinanced our revolving credit facility which improved our cost of capital, further extended our debt maturities and increased our available borrowing capacity;
• We acquired and successfully integrated two well-run propane businesses;
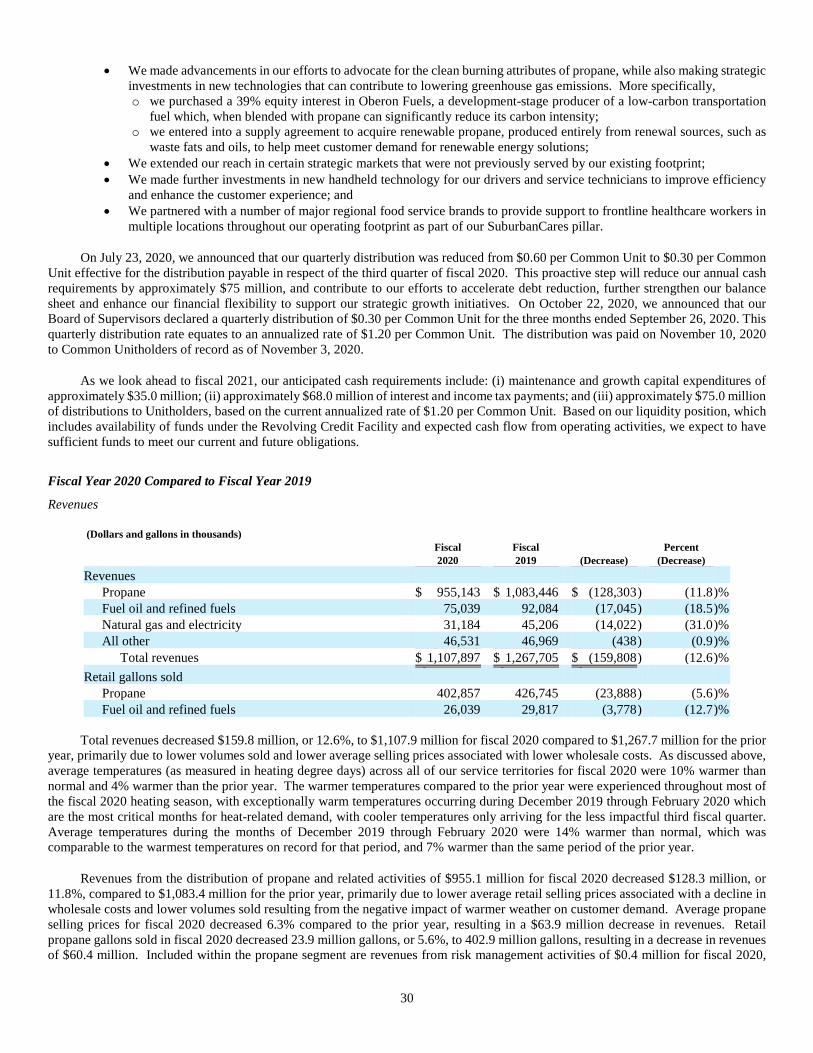
30
• We made advancements in our efforts to advocate for the clean burning attributes of propane, while also making strategic investments in new technologies that can contribute to lowering greenhouse gas emissions. More specifically, o we purchased a 39% equity interest in Oberon Fuels, a development-stage producer of a low-carbon transportation
fuel which, when blended with propane can significantly reduce its carbon intensity; o we entered into a supply agreement to acquire renewable propane, produced entirely from renewal sources, such as
waste fats and oils, to help meet customer demand for renewable energy solutions; • We extended our reach in certain strategic markets that were not previously served by our existing footprint; • We made further investments in new handheld technology for our drivers and service technicians to improve efficiency
and enhance the customer experience; and • We partnered with a number of major regional food service brands to provide support to frontline healthcare workers in
multiple locations throughout our operating footprint as part of our SuburbanCares pillar.
On July 23, 2020, we announced that our quarterly distribution was reduced from $0.60 per Common Unit to $0.30 per Common Unit effective for the distribution payable in respect of the third quarter of fiscal 2020. This proactive step will reduce our annual cash requirements by approximately $75 million, and contribute to our efforts to accelerate debt reduction, further strengthen our balance sheet and enhance our financial flexibility to support our strategic growth initiatives. On October 22, 2020, we announced that our Board of Supervisors declared a quarterly distribution of $0.30 per Common Unit for the three months ended September 26, 2020. This quarterly distribution rate equates to an annualized rate of $1.20 per Common Unit. The distribution was paid on November 10, 2020 to Common Unitholders of record as of November 3, 2020.
As we look ahead to fiscal 2021, our anticipated cash requirements include: (i) maintenance and growth capital expenditures of approximately $35.0 million; (ii) approximately $68.0 million of interest and income tax payments; and (iii) approximately $75.0 million of distributions to Unitholders, based on the current annualized rate of $1.20 per Common Unit. Based on our liquidity position, which includes availability of funds under the Revolving Credit Facility and expected cash flow from operating activities, we expect to have sufficient funds to meet our current and future obligations.
Fiscal Year 2020 Compared to Fiscal Year 2019
Revenues
(Dollars and gallons in thousands) Fiscal Fiscal Percent 2020 2019 (Decrease) (Decrease)
Revenues Propane $ 955,143 $ 1,083,446 $ (128,303 ) (11.8 )% Fuel oil and refined fuels 75,039 92,084 (17,045 ) (18.5 )% Natural gas and electricity 31,184 45,206 (14,022 ) (31.0 )% All other 46,531 46,969 (438 ) (0.9 )%
Total revenues $ 1,107,897 $ 1,267,705 $ (159,808 ) (12.6 )% Retail gallons sold
Propane 402,857 426,745 (23,888 ) (5.6 )% Fuel oil and refined fuels 26,039 29,817 (3,778 ) (12.7 )%
Total revenues decreased $159.8 million, or 12.6%, to $1,107.9 million for fiscal 2020 compared to $1,267.7 million for the prior
year, primarily due to lower volumes sold and lower average selling prices associated with lower wholesale costs. As discussed above, average temperatures (as measured in heating degree days) across all of our service territories for fiscal 2020 were 10% warmer than normal and 4% warmer than the prior year. The warmer temperatures compared to the prior year were experienced throughout most of the fiscal 2020 heating season, with exceptionally warm temperatures occurring during December 2019 through February 2020 which are the most critical months for heat-related demand, with cooler temperatures only arriving for the less impactful third fiscal quarter. Average temperatures during the months of December 2019 through February 2020 were 14% warmer than normal, which was comparable to the warmest temperatures on record for that period, and 7% warmer than the same period of the prior year.
Revenues from the distribution of propane and related activities of $955.1 million for fiscal 2020 decreased $128.3 million, or 11.8%, compared to $1,083.4 million for the prior year, primarily due to lower average retail selling prices associated with a decline in wholesale costs and lower volumes sold resulting from the negative impact of warmer weather on customer demand. Average propane selling prices for fiscal 2020 decreased 6.3% compared to the prior year, resulting in a $63.9 million decrease in revenues. Retail propane gallons sold in fiscal 2020 decreased 23.9 million gallons, or 5.6%, to 402.9 million gallons, resulting in a decrease in revenues of $60.4 million. Included within the propane segment are revenues from risk management activities of $0.4 million for fiscal 2020,

31
which decreased $4.0 million primarily due to a lower notional amount of hedging contracts used in risk management activities that were settled physically.
Revenues from the distribution of fuel oil and refined fuels of $75.0 million for fiscal 2020 decreased $17.0 million, or 18.5%, from $92.1 million for the prior year, primarily due to lower volumes sold resulting from the negative impact of warmer weather on customer demand and lower average selling prices associated with a decline in wholesale costs. Fuel oil and refined fuels gallons sold decreased 3.8 million gallons, or 12.7%, resulting in an $11.6 million decrease in revenues. Average selling prices for fuel oil and refined fuels decreased 6.8%, resulting in a $5.4 million decrease in revenues.
Revenues in our natural gas and electricity segment decreased $14.0 million, or 31.0%, to $31.2 million in fiscal 2020 compared to $45.2 million in the prior year mainly due to a reduction to the customer base resulting from actions taken by the New York State Public Utility Commission to reregulate this segment of our business (see Item 1), as well as lower usage due to warmer weather.
Cost of Products Sold
(Dollars in thousands) Percent Fiscal Fiscal (Decrease) (Decrease) 2020 2019 Increase Increase
Cost of products sold Propane $ 305,754 $ 418,265 $ (112,511 ) (26.9 )% Fuel oil and refined fuels 46,256 63,114 (16,858 ) (26.7 )% Natural gas and electricity 17,269 27,024 (9,755 ) (36.1 )% All other 13,672 13,585 87 0.6 %
Total cost of products sold $ 382,951 $ 521,988 $ (139,037 ) (26.6 )% As a percent of total revenues 34.6 % 41.2 %
The cost of products sold reported in the consolidated statements of operations represents the weighted average unit cost of
propane, fuel oil and refined fuels, natural gas and electricity sold, including transportation costs to deliver product from our supply points to storage or to our customer service centers. Cost of products sold also includes the cost of appliances and related parts sold or installed by our customer service centers computed on a basis that approximates the average cost of the products.
Given the retail nature of our operations, we maintain a certain level of priced physical inventory to help ensure that our field operations have adequate supply commensurate with the time of year. Our strategy has been, and will continue to be, to keep our physical inventory priced relatively close to market for our field operations. Consistent with past practices, we principally utilize futures and/or options contracts traded on the NYMEX to mitigate the price risk associated with our priced physical inventory. Under this risk management strategy, realized gains or losses on futures or options contracts, which are reported in cost of products sold, will typically offset losses or gains on the physical inventory once the product is sold (which may or may not occur in the same accounting period). We do not use futures or options contracts, or other derivative instruments, for speculative trading purposes. Unrealized non-cash gains or losses from changes in the fair value of derivative instruments that are not designated as cash flow hedges are recorded within cost of products sold. Cost of products sold excludes depreciation and amortization; these amounts are reported separately within the consolidated statements of operations.
From a commodity perspective, wholesale propane prices trended lower during the first half of the fiscal year and then stayed fairly range bound in the $0.45 to $0.55 per gallon range, basis Mont Belvieu, Texas. As of September 2020, propane inventory levels in the United States were 6% higher than at September 2019 and 13% above the 5-year average for September, as strong U.S. production outpaced domestic demand and exports. Overall, average posted propane prices (basis Mont Belvieu, Texas) and fuel oil prices during fiscal 2020 were approximately 28.0% lower than the prior year. The net change in the fair value of derivative instruments during the fiscal year resulted in unrealized non-cash losses of $0.4 million and $8.0 million reported in cost of products sold in fiscal 2020 and 2019, respectively, resulting in a year-over-year decrease of $7.6 million in cost of products sold, all of which was reported in the propane segment.
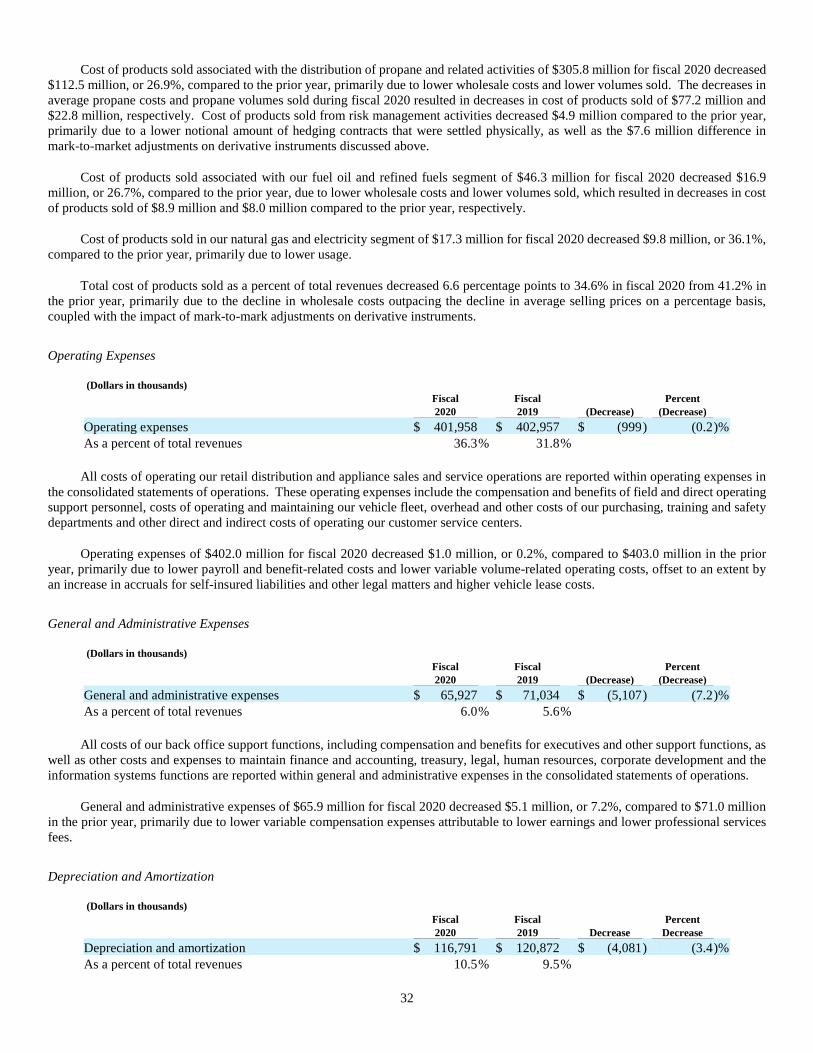
32
Cost of products sold associated with the distribution of propane and related activities of $305.8 million for fiscal 2020 decreased $112.5 million, or 26.9%, compared to the prior year, primarily due to lower wholesale costs and lower volumes sold. The decreases in average propane costs and propane volumes sold during fiscal 2020 resulted in decreases in cost of products sold of $77.2 million and $22.8 million, respectively. Cost of products sold from risk management activities decreased $4.9 million compared to the prior year, primarily due to a lower notional amount of hedging contracts that were settled physically, as well as the $7.6 million difference in mark-to-market adjustments on derivative instruments discussed above.
Cost of products sold associated with our fuel oil and refined fuels segment of $46.3 million for fiscal 2020 decreased $16.9 million, or 26.7%, compared to the prior year, due to lower wholesale costs and lower volumes sold, which resulted in decreases in cost of products sold of $8.9 million and $8.0 million compared to the prior year, respectively.
Cost of products sold in our natural gas and electricity segment of $17.3 million for fiscal 2020 decreased $9.8 million, or 36.1%, compared to the prior year, primarily due to lower usage.
Total cost of products sold as a percent of total revenues decreased 6.6 percentage points to 34.6% in fiscal 2020 from 41.2% in the prior year, primarily due to the decline in wholesale costs outpacing the decline in average selling prices on a percentage basis, coupled with the impact of mark-to-mark adjustments on derivative instruments.
Operating Expenses
(Dollars in thousands) Fiscal Fiscal Percent 2020 2019 (Decrease) (Decrease)
Operating expenses $ 401,958 $ 402,957 $ (999 ) (0.2 )% As a percent of total revenues 36.3 % 31.8 %
All costs of operating our retail distribution and appliance sales and service operations are reported within operating expenses in
the consolidated statements of operations. These operating expenses include the compensation and benefits of field and direct operating support personnel, costs of operating and maintaining our vehicle fleet, overhead and other costs of our purchasing, training and safety departments and other direct and indirect costs of operating our customer service centers.
Operating expenses of $402.0 million for fiscal 2020 decreased $1.0 million, or 0.2%, compared to $403.0 million in the prior year, primarily due to lower payroll and benefit-related costs and lower variable volume-related operating costs, offset to an extent by an increase in accruals for self-insured liabilities and other legal matters and higher vehicle lease costs.
General and Administrative Expenses
(Dollars in thousands) Fiscal Fiscal Percent 2020 2019 (Decrease) (Decrease)
General and administrative expenses $ 65,927 $ 71,034 $ (5,107 ) (7.2 )% As a percent of total revenues 6.0 % 5.6 %
All costs of our back office support functions, including compensation and benefits for executives and other support functions, as
well as other costs and expenses to maintain finance and accounting, treasury, legal, human resources, corporate development and the information systems functions are reported within general and administrative expenses in the consolidated statements of operations.
General and administrative expenses of $65.9 million for fiscal 2020 decreased $5.1 million, or 7.2%, compared to $71.0 million in the prior year, primarily due to lower variable compensation expenses attributable to lower earnings and lower professional services fees.
Depreciation and Amortization
(Dollars in thousands) Fiscal Fiscal Percent 2020 2019 Decrease Decrease
Depreciation and amortization $ 116,791 $ 120,872 $ (4,081 ) (3.4 )% As a percent of total revenues 10.5 % 9.5 %

33
Depreciation and amortization expense of $116.8 million in fiscal 2020 decreased $4.1 million from $120.9 million in the prior year, primarily as a result of accelerated depreciation expense recorded in the prior year for assets taken out of service.
Interest Expense, net
(Dollars in thousands) Fiscal Fiscal Percent 2020 2019 Decrease Decrease
Interest expense, net $ 74,727 $ 76,663 $ (1,936 ) (2.5 )% As a percent of total revenues 6.7 % 6.0 %
Net interest expense of $74.7 million for fiscal 2020 decreased $1.9 million from $76.7 million in the prior year, driven primarily
by a decrease in benchmark interest rates on outstanding borrowings under our Revolving Credit Facility, and a lower average level of outstanding borrowings under that facility. During fiscal 2020, we reduced total outstanding borrowings by $18.9 million with cash flows from operating activities. See Liquidity and Capital Resources below for additional discussion.
Loss on Debt Extinguishment
In connection with the refinancing of our previous revolving credit facility during the second quarter of fiscal 2020, we recognized a non-cash charge of $0.1 million to write-off a portion of unamortized debt origination costs.
Net Income and Adjusted EBITDA
Net income for fiscal 2020 amounted to $60.8 million, or $0.98 per Common Unit, compared to $68.6 million, or $1.11 per Common Unit, in fiscal 2019. Earnings before interest, taxes, depreciation and amortization (“EBITDA”) for fiscal 2020 amounted to $252.1 million, compared to $267.0 million for fiscal 2019.
Net income and EBITDA for fiscal 2020 included (i) a $1.0 million pension settlement charge; and (ii) a loss on debt extinguishment of $0.1 million. Excluding the effects of these items, as well as the unrealized non-cash mark-to-market adjustments on derivative instruments in both years, Adjusted EBITDA amounted to $253.7 million for fiscal 2020, compared to Adjusted EBITDA of $275.0 million for fiscal 2019.
EBITDA represents net income before deducting interest expense, income taxes, depreciation and amortization. Adjusted EBITDA represents EBITDA excluding the unrealized net gain or loss on mark-to-market activity for derivative instruments and other items, as applicable, as provided in the table below. Our management uses EBITDA and Adjusted EBITDA as supplemental measures of operating performance and we are including them because we believe that they provide our investors and industry analysts with additional information to evaluate our operating results. EBITDA and Adjusted EBITDA are not recognized terms under US GAAP and should not be considered as an alternative to net income or net cash provided by operating activities determined in accordance with US GAAP. Because EBITDA and Adjusted EBITDA as determined by us excludes some, but not all, items that affect net income, they may not be comparable to EBITDA and Adjusted EBITDA or similarly titled measures used by other companies.
The following table sets forth our calculations of EBITDA and Adjusted EBITDA:
(Dollars in thousands) Year Ended September 26, September 28, 2020 2019
Net income $ 60,758 $ 68,632 Add:
(Benefit from) provision for income taxes (146 ) 857 Interest expense, net 74,727 76,663 Depreciation and amortization 116,791 120,872
EBITDA 252,130 267,024 Unrealized non-cash losses on changes in fair value of derivatives
382
8,008
Pension settlement charge 1,051 — Loss on debt extinguishment 109 — Adjusted EBITDA $ 253,672 $ 275,032
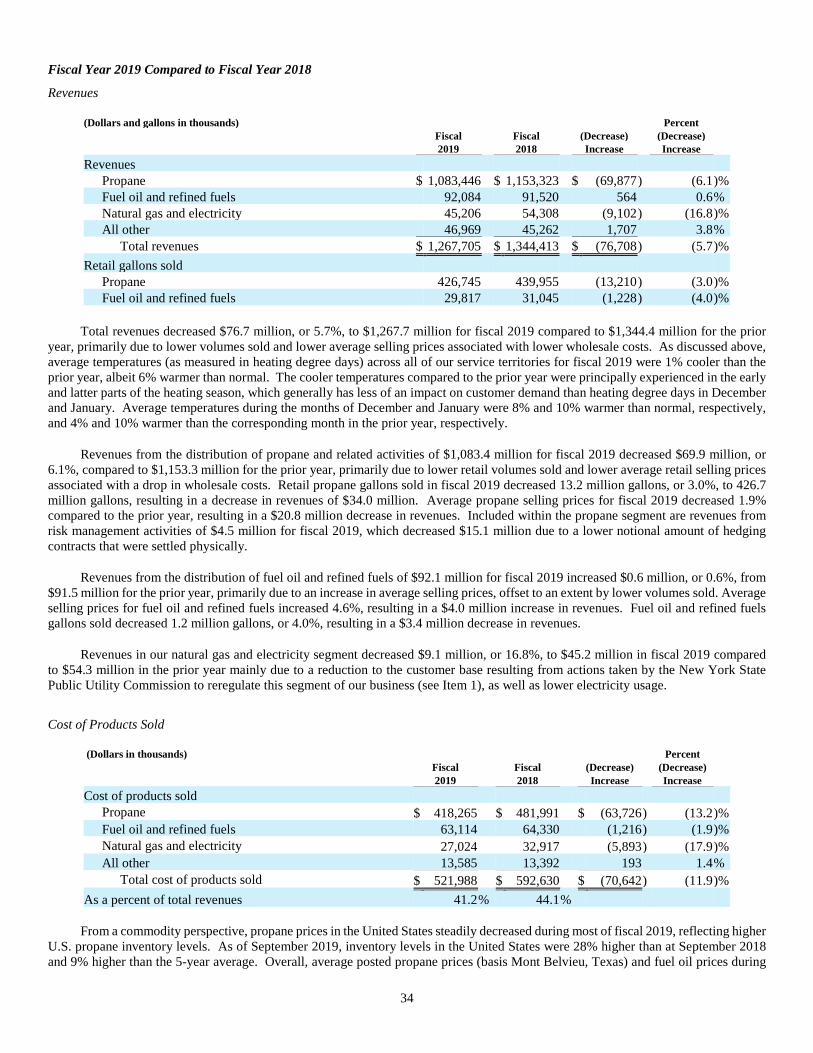
34
Fiscal Year 2019 Compared to Fiscal Year 2018
Revenues
(Dollars and gallons in thousands) Percent Fiscal Fiscal (Decrease) (Decrease) 2019 2018 Increase Increase
Revenues Propane $ 1,083,446 $ 1,153,323 $ (69,877 ) (6.1 )% Fuel oil and refined fuels 92,084 91,520 564 0.6 % Natural gas and electricity 45,206 54,308 (9,102 ) (16.8 )% All other 46,969 45,262 1,707 3.8 %
Total revenues $ 1,267,705 $ 1,344,413 $ (76,708 ) (5.7 )% Retail gallons sold
Propane 426,745 439,955 (13,210 ) (3.0 )% Fuel oil and refined fuels 29,817 31,045 (1,228 ) (4.0 )%
Total revenues decreased $76.7 million, or 5.7%, to $1,267.7 million for fiscal 2019 compared to $1,344.4 million for the prior
year, primarily due to lower volumes sold and lower average selling prices associated with lower wholesale costs. As discussed above, average temperatures (as measured in heating degree days) across all of our service territories for fiscal 2019 were 1% cooler than the prior year, albeit 6% warmer than normal. The cooler temperatures compared to the prior year were principally experienced in the early and latter parts of the heating season, which generally has less of an impact on customer demand than heating degree days in December and January. Average temperatures during the months of December and January were 8% and 10% warmer than normal, respectively, and 4% and 10% warmer than the corresponding month in the prior year, respectively.
Revenues from the distribution of propane and related activities of $1,083.4 million for fiscal 2019 decreased $69.9 million, or 6.1%, compared to $1,153.3 million for the prior year, primarily due to lower retail volumes sold and lower average retail selling prices associated with a drop in wholesale costs. Retail propane gallons sold in fiscal 2019 decreased 13.2 million gallons, or 3.0%, to 426.7 million gallons, resulting in a decrease in revenues of $34.0 million. Average propane selling prices for fiscal 2019 decreased 1.9% compared to the prior year, resulting in a $20.8 million decrease in revenues. Included within the propane segment are revenues from risk management activities of $4.5 million for fiscal 2019, which decreased $15.1 million due to a lower notional amount of hedging contracts that were settled physically.
Revenues from the distribution of fuel oil and refined fuels of $92.1 million for fiscal 2019 increased $0.6 million, or 0.6%, from $91.5 million for the prior year, primarily due to an increase in average selling prices, offset to an extent by lower volumes sold. Average selling prices for fuel oil and refined fuels increased 4.6%, resulting in a $4.0 million increase in revenues. Fuel oil and refined fuels gallons sold decreased 1.2 million gallons, or 4.0%, resulting in a $3.4 million decrease in revenues.
Revenues in our natural gas and electricity segment decreased $9.1 million, or 16.8%, to $45.2 million in fiscal 2019 compared to $54.3 million in the prior year mainly due to a reduction to the customer base resulting from actions taken by the New York State Public Utility Commission to reregulate this segment of our business (see Item 1), as well as lower electricity usage.
Cost of Products Sold
(Dollars in thousands) Percent Fiscal Fiscal (Decrease) (Decrease) 2019 2018 Increase Increase
Cost of products sold Propane $ 418,265 $ 481,991 $ (63,726 ) (13.2 )% Fuel oil and refined fuels 63,114 64,330 (1,216 ) (1.9 )% Natural gas and electricity 27,024 32,917 (5,893 ) (17.9 )% All other 13,585 13,392 193 1.4 %
Total cost of products sold $ 521,988 $ 592,630 $ (70,642 ) (11.9 )% As a percent of total revenues 41.2 % 44.1 %
From a commodity perspective, propane prices in the United States steadily decreased during most of fiscal 2019, reflecting higher U.S. propane inventory levels. As of September 2019, inventory levels in the United States were 28% higher than at September 2018 and 9% higher than the 5-year average. Overall, average posted propane prices (basis Mont Belvieu, Texas) and fuel oil prices during

35
fiscal 2019 were 32.8% and 3.9% lower than the prior year, respectively. The net change in the fair value of derivative instruments during the period resulted in unrealized non-cash losses of $8.0 million and unrealized non-cash gains of $0.3 million reported in cost of products sold in fiscal 2019 and 2018, respectively, resulting in a year-over-year increase of $8.3 million in cost of products sold, all of which was reported in the propane segment.
Cost of products sold associated with the distribution of propane and related activities of $418.3 million for fiscal 2019 decreased $63.7 million, or 13.2%, compared to the prior year, primarily due to lower wholesale costs and lower volumes sold. The decreases in average propane costs and propane volumes sold during fiscal 2019 resulted in decreases in cost of products sold of $46.2 million and $14.5 million, respectively. Cost of products sold from risk management activities decreased $11.3 million compared to the prior year, primarily due to a lower notional amount of hedging contracts that were settled physically.
Cost of products sold associated with our fuel oil and refined fuels segment of $63.1 million for fiscal 2019 decreased $1.2 million, or 1.9%, compared to the prior year, primarily due to lower volumes sold, which was offset to an extent by higher average wholesale costs. Lower volumes sold resulted in a decrease in cost of products sold of $2.5 million over the prior year.
Cost of products sold in our natural gas and electricity segment of $27.0 million for fiscal 2019 decreased $5.9 million, or 17.9%, compared to the prior year, primarily due to lower electricity usage.
Total cost of products sold as a percent of total revenues decreased 2.9 percentage points to 41.2% in fiscal 2019 from 44.1% in the prior year, primarily due to the decline in wholesale costs outpacing the decline in average selling prices on a percentage basis, offset to an extent by an increase in propane costs resulting from risk management activities, net of the impact of mark-to-mark adjustments on derivative instruments.
Operating Expenses
(Dollars in thousands) Fiscal Fiscal Percent 2019 2018 Increase Increase
Operating expenses $ 402,957 $ 397,489 $ 5,468 1.4 % As a percent of total revenues 31.8 % 29.6 %
Operating expenses of $403.0 million for fiscal 2019 increased $5.5 million, or 1.4%, compared to $397.5 million in the prior year, primarily due to higher payroll and benefit-related costs and higher vehicle repairs and maintenance costs, offset to an extent by lower bad debt expense.
General and Administrative Expenses
(Dollars in thousands) Fiscal Fiscal Percent 2019 2018 Increase Increase
General and administrative expenses $ 71,034 $ 66,246 $ 4,788 7.2 % As a percent of total revenues 5.6 % 4.9 %
General and administrative expenses of $71.0 million for fiscal 2019 increased $4.8 million, or 7.2%, compared to $66.2 million in the prior year, primarily due to higher variable compensation expenses under long-term incentive plans and higher professional services fees for marketing and advertising initiatives.
Depreciation and Amortization
(Dollars in thousands) Fiscal Fiscal Percent 2019 2018 Decrease Decrease
Depreciation and amortization $ 120,872 $ 125,222 $ (4,350 ) (3.5 )% As a percent of total revenues 9.5 % 9.3 %
Depreciation and amortization expense of $120.9 million in fiscal 2019 decreased $4.4 million from $125.2 million in the prior
year, primarily as a result of accelerated depreciation expense recorded in the prior year for assets taken out of service.
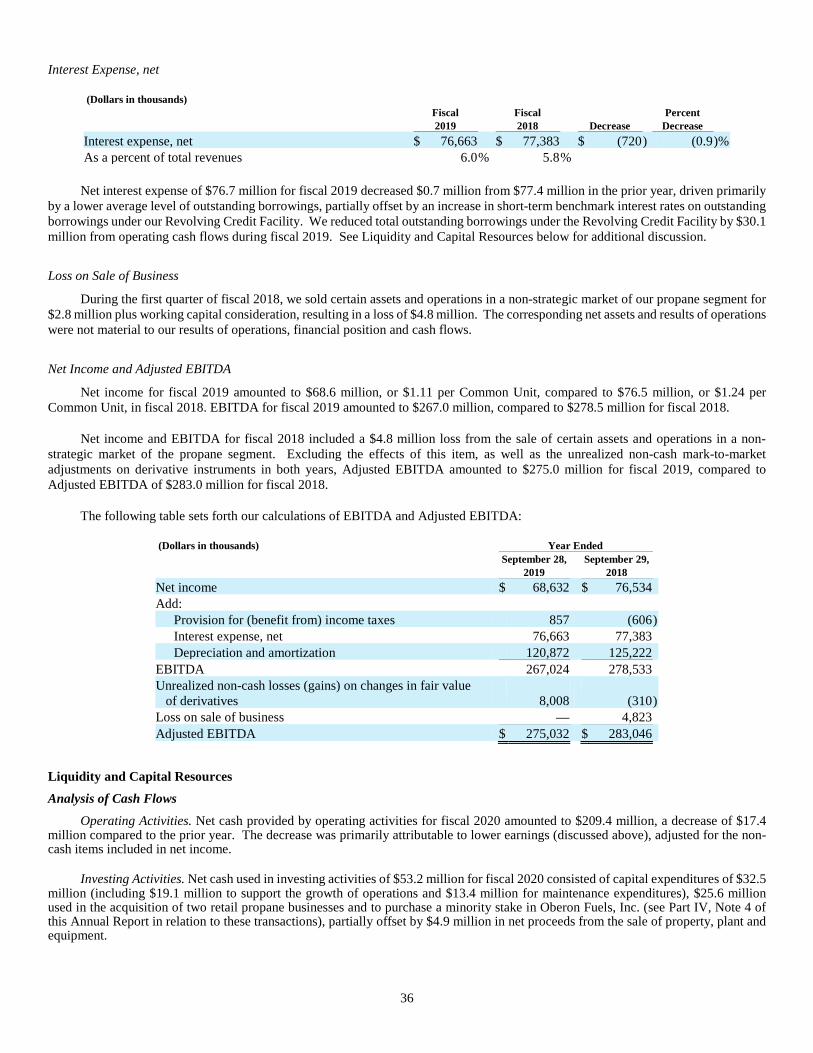
36
Interest Expense, net
(Dollars in thousands) Fiscal Fiscal Percent 2019 2018 Decrease Decrease
Interest expense, net $ 76,663 $ 77,383 $ (720 ) (0.9 )% As a percent of total revenues 6.0 % 5.8 %
Net interest expense of $76.7 million for fiscal 2019 decreased $0.7 million from $77.4 million in the prior year, driven primarily
by a lower average level of outstanding borrowings, partially offset by an increase in short-term benchmark interest rates on outstanding borrowings under our Revolving Credit Facility. We reduced total outstanding borrowings under the Revolving Credit Facility by $30.1 million from operating cash flows during fiscal 2019. See Liquidity and Capital Resources below for additional discussion.
Loss on Sale of Business
During the first quarter of fiscal 2018, we sold certain assets and operations in a non-strategic market of our propane segment for $2.8 million plus working capital consideration, resulting in a loss of $4.8 million. The corresponding net assets and results of operations were not material to our results of operations, financial position and cash flows.
Net Income and Adjusted EBITDA
Net income for fiscal 2019 amounted to $68.6 million, or $1.11 per Common Unit, compared to $76.5 million, or $1.24 per Common Unit, in fiscal 2018. EBITDA for fiscal 2019 amounted to $267.0 million, compared to $278.5 million for fiscal 2018.
Net income and EBITDA for fiscal 2018 included a $4.8 million loss from the sale of certain assets and operations in a non-strategic market of the propane segment. Excluding the effects of this item, as well as the unrealized non-cash mark-to-market adjustments on derivative instruments in both years, Adjusted EBITDA amounted to $275.0 million for fiscal 2019, compared to Adjusted EBITDA of $283.0 million for fiscal 2018.
The following table sets forth our calculations of EBITDA and Adjusted EBITDA:
(Dollars in thousands) Year Ended September 28, September 29, 2019 2018
Net income $ 68,632 $ 76,534 Add:
Provision for (benefit from) income taxes 857 (606 ) Interest expense, net 76,663 77,383 Depreciation and amortization 120,872 125,222
EBITDA 267,024 278,533 Unrealized non-cash losses (gains) on changes in fair value of derivatives
8,008
(310 )
Loss on sale of business — 4,823 Adjusted EBITDA $ 275,032 $ 283,046
Liquidity and Capital Resources
Analysis of Cash Flows
Operating Activities. Net cash provided by operating activities for fiscal 2020 amounted to $209.4 million, a decrease of $17.4 million compared to the prior year. The decrease was primarily attributable to lower earnings (discussed above), adjusted for the non-cash items included in net income.
Investing Activities. Net cash used in investing activities of $53.2 million for fiscal 2020 consisted of capital expenditures of $32.5 million (including $19.1 million to support the growth of operations and $13.4 million for maintenance expenditures), $25.6 million used in the acquisition of two retail propane businesses and to purchase a minority stake in Oberon Fuels, Inc. (see Part IV, Note 4 of this Annual Report in relation to these transactions), partially offset by $4.9 million in net proceeds from the sale of property, plant and equipment.

37
Net cash used in investing activities of $48.5 million for fiscal 2019 consisted of capital expenditures of $35.0 million (including $21.1 million to support the growth of operations and $13.9 million for maintenance expenditures) and $19.3 million used in the acquisition of three retail propane businesses (see Part IV, Note 4 of this Annual Report), partially offset by $5.8 million in net proceeds from the sale of property, plant and equipment.
Financing Activities. Net cash used in financing activities for fiscal 2020 of $155.4 million reflected the quarterly distribution to Common Unitholders at a rate of $0.60 per Common Unit paid in respect of the fourth quarter of fiscal 2019 and the first two quarters of fiscal 2020, the quarterly distribution at a rate of $0.30 per Common Unit paid in respect of the third quarter of fiscal 2020, net repayments of borrowings under the Revolving Credit Facility of $18.9 million, $2.7 million of debt issuance costs associated with the new Credit Agreement (see Part IV, Note 10 of this Annual Report) and other financing activities of $3.6 million.
Net cash used in financing activities for fiscal 2019 of $181.0 million reflected the quarterly distribution to Common Unitholders at a rate of $0.60 per Common Unit paid in respect of the fourth quarter of fiscal 2018 and the first three quarters of fiscal 2019, net repayments of borrowings under the Revolving Credit Facility of $30.1 million, and other financing activities of $3.0 million.
Summary of Long-Term Debt Obligations and Revolving Credit Lines
As of September 26, 2020, our long-term debt consisted of $525.0 million in aggregate principal amount of 5.5% senior notes due June 1, 2024, $250.0 million in aggregate principal amount of 5.75% senior notes due March 1, 2025, $350.0 million in aggregate principal amount of 5.875% senior notes due March 1, 2027 and $94.6 million outstanding under our Revolving Credit Facility. During fiscal 2020, we repaid $18.9 million under our Revolving Credit Facility with cash flows from operating activities. See Part IV, Note 10 of this Annual Report.
The aggregate amounts of long-term debt maturities subsequent to September 26, 2020 are as follows: fiscal 2021: $-0-; fiscal 2022: $-0-; fiscal 2023: $-0-; fiscal 2024: $619.6 million; fiscal 2025: $250.0 million; and thereafter: $350.0 million.
Partnership Distributions
We are required to make distributions in an amount equal to all of our Available Cash, as defined in our Third Amended and Restated Partnership Agreement, as amended (the “Partnership Agreement”), no more than 45 days after the end of each fiscal quarter to holders of record on the applicable record dates. Available Cash, as defined in the Partnership Agreement, generally means all cash on hand at the end of the respective fiscal quarter, less the amount of cash reserves established by the Board of Supervisors in its reasonable discretion for future cash requirements. These reserves are retained for the proper conduct of our business, the payment of debt principal and interest and for distributions during the next four quarters. The Board of Supervisors reviews the level of Available Cash on a quarterly basis based upon information provided by management.
Pension Plan Assets and Obligations
We have a noncontributory defined benefit pension plan which was originally designed to cover all of our eligible employees who met certain requirements as to age and length of service. Effective January 1, 1998, we amended the defined benefit pension plan to provide benefits under a cash balance formula as compared to a final average pay formula which was in effect prior to January 1, 1998. Our defined benefit pension plan was frozen to new participants effective January 1, 2000 and, in furtherance of our effort to minimize future increases in our benefit obligations, effective January 1, 2003, all future service credits were eliminated. Therefore, eligible participants will receive interest credits only toward their ultimate defined benefit under the defined benefit pension plan. We made contribution payments to the defined benefit pension plan of $3.8 million, $5.4 million and $4.8 million in fiscal 2020, fiscal 2019 and fiscal 2018, respectively. As of September 26, 2020 and September 28, 2019, the plan’s projected benefit obligation exceeded the fair value of plan assets by $35.2 million and $34.6 million, respectively. The net liability recognized in the consolidated financial statements for the defined benefit pension plan increased by $0.6 million during fiscal 2020, which was primarily attributable to the decrease in the discount rate used to measure the benefit obligation. During fiscal 2021, we expect to contribute approximately $6.3 million to the defined benefit pension plan in the form of a minimum funding requirement.
Our investment policies and strategies, as set forth in the Investment Management Policy and Guidelines, are monitored by a Benefits Committee comprised of five members of management. The Benefits Committee employs a liability driven investment strategy, which seeks to increase the correlation of the plan’s assets and liabilities to reduce the volatility of the plan’s funded status. The execution of this strategy has resulted in an asset allocation that is largely comprised of fixed income securities. A liability driven investment strategy is intended to reduce investment risk and, over the long-term, generate returns on plan assets that largely fund the annual interest on the accumulated benefit obligation. For purposes of measuring the projected benefit obligation as of September 26, 2020 and September 28, 2019, we used a discount rate of 2.125% and 2.875%, respectively, reflecting current market rates for debt obligations of a similar duration to our pension obligations. With other assumptions held constant, an increase or decrease of 100 basis points in the discount rate would have an immaterial impact on net pension and postretirement benefit costs.
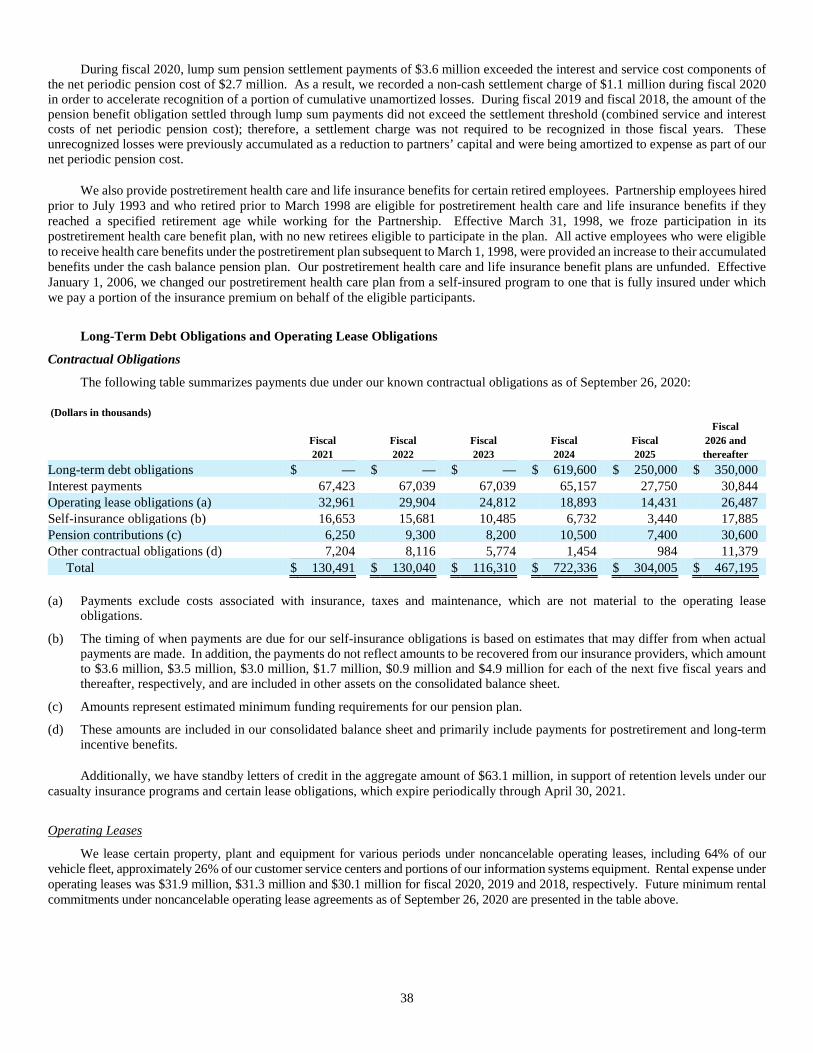
38
During fiscal 2020, lump sum pension settlement payments of $3.6 million exceeded the interest and service cost components of the net periodic pension cost of $2.7 million. As a result, we recorded a non-cash settlement charge of $1.1 million during fiscal 2020 in order to accelerate recognition of a portion of cumulative unamortized losses. During fiscal 2019 and fiscal 2018, the amount of the pension benefit obligation settled through lump sum payments did not exceed the settlement threshold (combined service and interest costs of net periodic pension cost); therefore, a settlement charge was not required to be recognized in those fiscal years. These unrecognized losses were previously accumulated as a reduction to partners’ capital and were being amortized to expense as part of our net periodic pension cost.
We also provide postretirement health care and life insurance benefits for certain retired employees. Partnership employees hired prior to July 1993 and who retired prior to March 1998 are eligible for postretirement health care and life insurance benefits if they reached a specified retirement age while working for the Partnership. Effective March 31, 1998, we froze participation in its postretirement health care benefit plan, with no new retirees eligible to participate in the plan. All active employees who were eligible to receive health care benefits under the postretirement plan subsequent to March 1, 1998, were provided an increase to their accumulated benefits under the cash balance pension plan. Our postretirement health care and life insurance benefit plans are unfunded. Effective January 1, 2006, we changed our postretirement health care plan from a self-insured program to one that is fully insured under which we pay a portion of the insurance premium on behalf of the eligible participants.
Long-Term Debt Obligations and Operating Lease Obligations
Contractual Obligations
The following table summarizes payments due under our known contractual obligations as of September 26, 2020: (Dollars in thousands) Fiscal
Fiscal Fiscal Fiscal Fiscal Fiscal 2026 and 2021 2022 2023 2024 2025 thereafter
Long-term debt obligations $ — $ — $ — $ 619,600 $ 250,000 $ 350,000 Interest payments 67,423 67,039 67,039 65,157 27,750 30,844 Operating lease obligations (a) 32,961 29,904 24,812 18,893 14,431 26,487 Self-insurance obligations (b) 16,653 15,681 10,485 6,732 3,440 17,885 Pension contributions (c) 6,250 9,300 8,200 10,500 7,400 30,600 Other contractual obligations (d) 7,204 8,116 5,774 1,454 984 11,379
Total $ 130,491 $ 130,040 $ 116,310 $ 722,336 $ 304,005 $ 467,195 (a) Payments exclude costs associated with insurance, taxes and maintenance, which are not material to the operating lease
obligations.
(b) The timing of when payments are due for our self-insurance obligations is based on estimates that may differ from when actual payments are made. In addition, the payments do not reflect amounts to be recovered from our insurance providers, which amount to $3.6 million, $3.5 million, $3.0 million, $1.7 million, $0.9 million and $4.9 million for each of the next five fiscal years and thereafter, respectively, and are included in other assets on the consolidated balance sheet.
(c) Amounts represent estimated minimum funding requirements for our pension plan.
(d) These amounts are included in our consolidated balance sheet and primarily include payments for postretirement and long-term incentive benefits.
Additionally, we have standby letters of credit in the aggregate amount of $63.1 million, in support of retention levels under our casualty insurance programs and certain lease obligations, which expire periodically through April 30, 2021.
Operating Leases
We lease certain property, plant and equipment for various periods under noncancelable operating leases, including 64% of our vehicle fleet, approximately 26% of our customer service centers and portions of our information systems equipment. Rental expense under operating leases was $31.9 million, $31.3 million and $30.1 million for fiscal 2020, 2019 and 2018, respectively. Future minimum rental commitments under noncancelable operating lease agreements as of September 26, 2020 are presented in the table above.
39
Off-Balance Sheet Arrangements
Guarantees
Certain of our operating leases, primarily those for transportation equipment with remaining lease periods scheduled to expire periodically through fiscal 2028, contain residual value guarantee provisions. Under those provisions, we guarantee that the fair value of the equipment will equal or exceed the guaranteed amount upon completion of the lease period, or we will pay the lessor the difference between fair value and the guaranteed amount. Although the fair value of equipment at the end of its lease term has historically exceeded the guaranteed amounts, the maximum potential amount of aggregate future payments we could be required to make under these leasing arrangements, assuming the equipment is deemed worthless at the end of the lease term, was approximately $25.2 million. The fair value of residual value guarantees for outstanding operating leases was de minimis as of September 26, 2020 and September 28, 2019.
Recently Issued/Adopted Accounting Pronouncements
See Part IV, Note 2 of this Annual Report.
ITEM 7A. QUANTITATIVE AND QUALITATIVE DISCLOSURES ABOUT MARKET RISK
Commodity Price Risk
We enter into product supply contracts that are generally one-year agreements subject to annual renewal, and also purchase product on the open market. Our propane supply contracts typically provide for pricing based upon index formulas using the posted prices established at major supply points such as Mont Belvieu, Texas, or Conway, Kansas (plus transportation costs) at the time of delivery. In addition, to supplement our annual purchase requirements, we may utilize forward fixed price purchase contracts to acquire a portion of the propane that we resell to our customers, which allows us to manage our exposure to unfavorable changes in commodity prices and to ensure adequate physical supply. The percentage of contract purchases, and the amount of supply contracted for under forward contracts at fixed prices, will vary from year to year based on market conditions. In certain instances, and when market conditions are favorable, we are able to purchase product under our supply arrangements at a discount to the market.
Product cost changes can occur rapidly over a short period of time and can impact profitability. We attempt to reduce commodity price risk by pricing product on a short-term basis. The level of priced, physical product maintained in storage facilities and at our customer service centers for immediate sale to our customers will vary depending on several factors, including, but not limited to, price, supply and demand dynamics for a given time of the year. Typically, our on hand priced position does not exceed more than four to eight weeks of our supply needs, depending on the time of the year. In the course of normal operations, we routinely enter into contracts such as forward priced physical contracts for the purchase or sale of propane and fuel oil that, under accounting rules for derivative instruments and hedging activities, qualify for and are designated as normal purchase or normal sale contracts. Such contracts are exempted from fair value accounting and are accounted for at the time product is purchased or sold under the related contract.
Under our hedging and risk management strategies, we enter into a combination of exchange-traded futures and options contracts and, in certain instances, over-the-counter options and swap contracts (collectively, “derivative instruments”) to manage the price risk associated with physical product and with future purchases of the commodities used in our operations, principally propane and fuel oil, as well as to help ensure the availability of product during periods of high demand. In addition, we sell propane and fuel oil to customers at fixed prices, and enter into derivative instruments to hedge a portion of its exposure to fluctuations in commodity prices as a result of selling the fixed price contracts. We do not use derivative instruments for speculative or trading purposes. Futures and swap contracts require that we sell or acquire propane or fuel oil at a fixed price for delivery at fixed future dates. An option contract allows, but does not require, its holder to buy or sell propane or fuel oil at a specified price during a specified time period. However, the writer of an option contract must fulfill the obligation of the option contract, should the holder choose to exercise the option. At expiration, the contracts are settled by the delivery of the product to the respective party or are settled by the payment of a net amount equal to the difference between the then market price and the fixed contract price or option exercise price. To the extent that we utilize derivative instruments to manage exposure to commodity price risk and commodity prices move adversely in relation to the contracts, we could suffer losses on those derivative instruments when settled. Conversely, if prices move favorably, we could realize gains. Under our hedging and risk management strategy, realized gains or losses on derivative instruments will typically offset losses or gains on the physical inventory once the product is sold to customers at market prices, or delivered to customers as it pertains to fixed price contracts.
Futures are traded with brokers of the NYMEX and require daily cash settlements in margin accounts. Forward contracts are generally settled at the expiration of the contract term by physical delivery, and swap and options contracts are generally settled at expiration through a net settlement mechanism. Market risks associated with our derivative instruments are monitored daily for compliance with our Hedging and Risk Management Policy which includes volume limits for open positions. Open inventory positions are reviewed and managed daily as to exposures to changing market prices.

40
Credit Risk
Exchange-traded futures and options contracts are guaranteed by the NYMEX and, as a result, have minimal credit risk. We are subject to credit risk with over-the-counter forward, swap and options contracts to the extent the counterparties do not perform. We evaluate the financial condition of each counterparty with which we conduct business and establish credit limits to reduce exposure to the risk of non-performance by our counterparties.
Interest Rate Risk
A portion of our borrowings bear interest at prevailing interest rates based upon, at the Operating Partnership’s option, LIBOR, plus an applicable margin or the base rate, defined as the higher of the Federal Funds Rate plus ½ of 1% or the agent bank’s prime rate, or LIBOR plus 1%, plus the applicable margin. The applicable margin is dependent on the level of our total consolidated leverage (the total ratio of debt to consolidated EBITDA). Therefore, we are subject to interest rate risk on the variable component of the interest rate. From time to time, we enter into interest rate swap agreements to manage a part of our variable interest rate risk. The interest rate swaps have been designated as a cash flow hedge. Changes in the fair value of the interest rate swaps are recognized in other comprehensive income (“OCI”) until the hedged item is recognized in earnings. At September 26, 2020, we were not party to any interest rate swap agreement.
Derivative Instruments and Hedging Activities
All of our derivative instruments are reported on the balance sheet at their fair values. On the date that derivative instruments are entered into, we make a determination as to whether the derivative instrument qualifies for designation as a hedge. Changes in the fair value of derivative instruments are recorded each period in current period earnings or OCI, depending on whether a derivative instrument is designated as a hedge and, if so, the type of hedge. For derivative instruments designated as cash flow hedges, we formally assess, both at the hedge contract’s inception and on an ongoing basis, whether the hedge contract is highly effective in offsetting changes in cash flows of hedged items. Changes in the fair value of derivative instruments designated as cash flow hedges are reported in OCI to the extent effective and reclassified into earnings during the same period in which the hedged item affects earnings. The mark-to-market gains or losses on ineffective portions of cash flow hedges are immediately recognized in earnings. Changes in the fair value of derivative instruments that are not designated as cash flow hedges, and that do not meet the normal purchase and normal sale exemption, are recorded in earnings as they occur. Cash flows associated with derivative instruments are reported as operating activities within the consolidated statement of cash flows.
Sensitivity Analysis
In an effort to estimate our exposure to unfavorable market price changes in commodities related to our open positions under derivative instruments, we developed a model that incorporates the following data and assumptions:
A. The fair value of open positions as of September 26, 2020.
B. The market prices for the underlying commodities used to determine A. above were adjusted adversely by a hypothetical 10% change and compared to the fair value amounts in A. above to project the potential negative impact on earnings that would be recognized for the respective scenario.
Based on the sensitivity analysis described above, the hypothetical 10% adverse change in market prices for open derivative instruments as of September 26, 2020 indicates an increase in potential future net losses of $1.4 million. See also Item 7A of this Annual Report. The above hypothetical change does not reflect the worst case scenario. Actual results may be significantly different depending on market conditions and the composition of the open position portfolio.
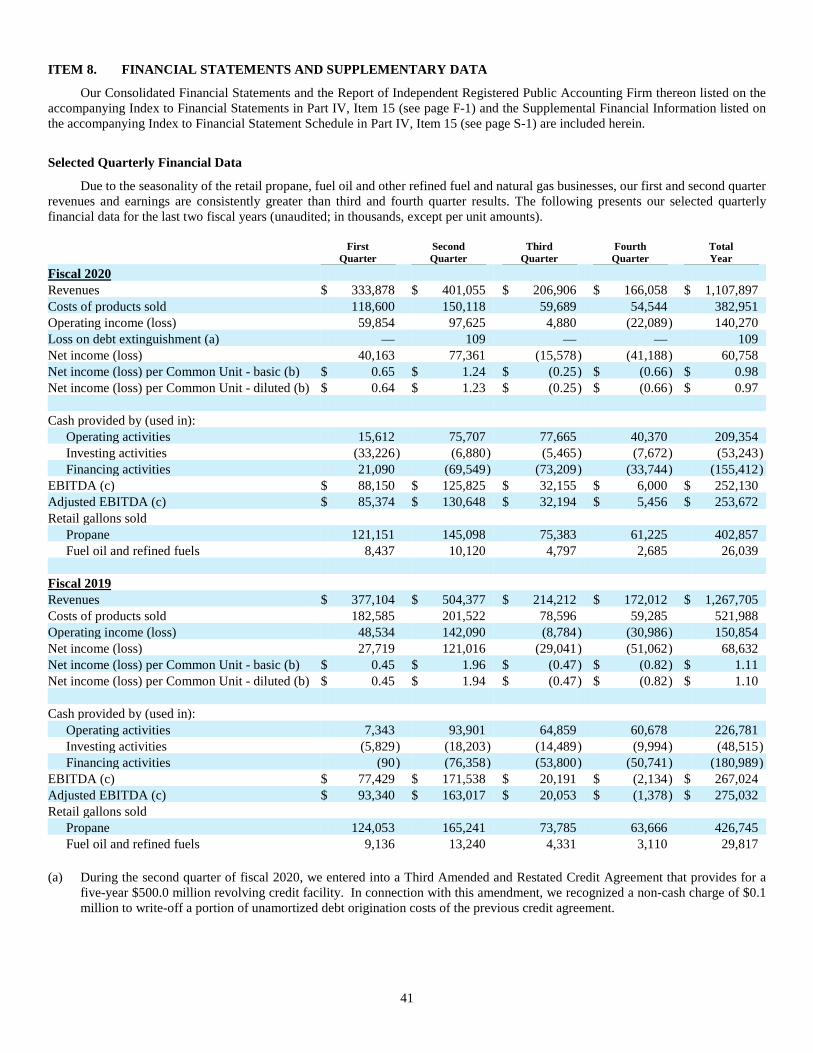
41
ITEM 8. FINANCIAL STATEMENTS AND SUPPLEMENTARY DATA
Our Consolidated Financial Statements and the Report of Independent Registered Public Accounting Firm thereon listed on the accompanying Index to Financial Statements in Part IV, Item 15 (see page F-1) and the Supplemental Financial Information listed on the accompanying Index to Financial Statement Schedule in Part IV, Item 15 (see page S-1) are included herein.
Selected Quarterly Financial Data
Due to the seasonality of the retail propane, fuel oil and other refined fuel and natural gas businesses, our first and second quarter revenues and earnings are consistently greater than third and fourth quarter results. The following presents our selected quarterly financial data for the last two fiscal years (unaudited; in thousands, except per unit amounts).
First
Quarter Second Quarter
Third Quarter
Fourth Quarter
Total Year
Fiscal 2020 Revenues $ 333,878 $ 401,055 $ 206,906 $ 166,058 $ 1,107,897 Costs of products sold 118,600 150,118 59,689 54,544 382,951 Operating income (loss) 59,854 97,625 4,880 (22,089 ) 140,270 Loss on debt extinguishment (a) — 109 — — 109 Net income (loss) 40,163 77,361 (15,578 ) (41,188 ) 60,758 Net income (loss) per Common Unit - basic (b) $ 0.65 $ 1.24 $ (0.25 ) $ (0.66 ) $ 0.98 Net income (loss) per Common Unit - diluted (b) $ 0.64 $ 1.23 $ (0.25 ) $ (0.66 ) $ 0.97 Cash provided by (used in):
Operating activities 15,612 75,707 77,665 40,370 209,354 Investing activities (33,226 ) (6,880 ) (5,465 ) (7,672 ) (53,243 ) Financing activities 21,090 (69,549 ) (73,209 ) (33,744 ) (155,412 )
EBITDA (c) $ 88,150 $ 125,825 $ 32,155 $ 6,000 $ 252,130 Adjusted EBITDA (c) $ 85,374 $ 130,648 $ 32,194 $ 5,456 $ 253,672 Retail gallons sold
Propane 121,151 145,098 75,383 61,225 402,857 Fuel oil and refined fuels 8,437 10,120 4,797 2,685 26,039
Fiscal 2019 Revenues $ 377,104 $ 504,377 $ 214,212 $ 172,012 $ 1,267,705 Costs of products sold 182,585 201,522 78,596 59,285 521,988 Operating income (loss) 48,534 142,090 (8,784 ) (30,986 ) 150,854 Net income (loss) 27,719 121,016 (29,041 ) (51,062 ) 68,632 Net income (loss) per Common Unit - basic (b) $ 0.45 $ 1.96 $ (0.47 ) $ (0.82 ) $ 1.11 Net income (loss) per Common Unit - diluted (b) $ 0.45 $ 1.94 $ (0.47 ) $ (0.82 ) $ 1.10 Cash provided by (used in):
Operating activities 7,343 93,901 64,859 60,678 226,781 Investing activities (5,829 ) (18,203 ) (14,489 ) (9,994 ) (48,515 ) Financing activities (90 ) (76,358 ) (53,800 ) (50,741 ) (180,989 )
EBITDA (c) $ 77,429 $ 171,538 $ 20,191 $ (2,134 ) $ 267,024 Adjusted EBITDA (c) $ 93,340 $ 163,017 $ 20,053 $ (1,378 ) $ 275,032 Retail gallons sold
Propane 124,053 165,241 73,785 63,666 426,745 Fuel oil and refined fuels 9,136 13,240 4,331 3,110 29,817
(a) During the second quarter of fiscal 2020, we entered into a Third Amended and Restated Credit Agreement that provides for a
five-year $500.0 million revolving credit facility. In connection with this amendment, we recognized a non-cash charge of $0.1 million to write-off a portion of unamortized debt origination costs of the previous credit agreement.

42
(b) Basic net income (loss) per Common Unit is computed by dividing net income (loss) by the weighted average number of outstanding Common Units, and restricted units granted under the Restricted Unit Plans to retirement-eligible grantees. Computations of diluted net income per Common Unit are performed by dividing net income by the weighted average number of outstanding Common Units and unvested restricted units granted under our Restricted Unit Plans. Diluted loss per Common Unit for the periods where a net loss was reported does not include unvested restricted units granted under our Restricted Unit Plans as their effect would be anti-dilutive.
(c) EBITDA represents net income before deducting interest expense, income taxes, depreciation and amortization. Adjusted EBITDA represents EBITDA excluding the unrealized net gain or loss on mark-to-market activity for derivative instruments and other items, as applicable, as provided in the table below. Our management uses EBITDA and Adjusted EBITDA as supplemental measures of operating performance and we are including them because we believe that they provide our investors and industry analysts with additional information to evaluate our operating results. EBITDA and Adjusted EBITDA are not recognized terms under US GAAP and should not be considered as an alternative to net income or net cash provided by operating activities determined in accordance with US GAAP. Because EBITDA and Adjusted EBITDA as determined by us excludes some, but not all, items that affect net income, they may not be comparable to EBITDA and Adjusted EBITDA or similarly titled measures used by other companies. The following table sets forth our calculations of EBITDA and Adjusted EBITDA:
First
Quarter Second Quarter
Third Quarter
Fourth Quarter
Total Year
Fiscal 2020 Net income (loss) $ 40,163 $ 77,361 $ (15,578 ) $ (41,188 ) $ 60,758 Add:
(Benefit from) provision for income taxes (359 ) — 106 107 (146 ) Interest expense, net 19,072 19,176 18,474 18,005 74,727 Depreciation and amortization 29,274 29,288 29,153 29,076 116,791
EBITDA 88,150 125,825 32,155 6,000 252,130 Unrealized non-cash (gains) losses on changes in fair value of derivatives (2,776 ) 4,714 (861 ) (695 ) 382 Loss on debt extinguishment — 109 — — 109 Pension settlement charge — — 900 151 1,051 Adjusted EBITDA $ 85,374 $ 130,648 $ 32,194 $ 5,456 $ 253,672 Fiscal 2019 Net income (loss) $ 27,719 $ 121,016 $ (29,041 ) $ (51,062 ) $ 68,632 Add:
Provision for income taxes 151 252 175 279 857 Interest expense, net 19,488 19,647 18,906 18,622 76,663 Depreciation and amortization 30,071 30,623 30,151 30,027 120,872
EBITDA 77,429 171,538 20,191 (2,134 ) 267,024 Unrealized non-cash losses (gains) on changes in fair value of derivatives 15,911 (8,521 ) (138 ) 756 8,008 Adjusted EBITDA $ 93,340 $ 163,017 $ 20,053 $ (1,378 ) $ 275,032
ITEM 9. CHANGES IN AND DISAGREEMENTS WITH ACCOUNTANTS ON ACCOUNTING AND FINANCIAL DISCLOSURE
None.
ITEM 9A. CONTROLS AND PROCEDURES
Evaluation of Disclosure Controls and Procedures
The Partnership maintains disclosure controls and procedures (as defined in Rules 13a-15(e) and 15d-15(e) of the Securities Exchange Act of 1934 (the “Exchange Act”)) that are designed to provide reasonable assurance that information required to be disclosed in the Partnership’s filings and submissions under the Exchange Act is recorded, processed, summarized and reported within the periods specified in the rules and forms of the SEC and that such information is accumulated and communicated to the Partnership’s

43
management, including its principal executive officer and principal financial officer, as appropriate, to allow timely decisions regarding required disclosure.
Before filing this Annual Report, the Partnership completed an evaluation under the supervision and with the participation of the Partnership’s management, including the Partnership’s principal executive officer and principal financial officer, of the effectiveness of the design and operation of the Partnership’s disclosure controls and procedures as of September 26, 2020. Based on this evaluation, the Partnership’s principal executive officer and principal financial officer concluded that as of September 26, 2020, such disclosure controls and procedures were effective to provide the reasonable assurance level described above.
Changes in Internal Control Over Financial Reporting
There have not been any changes in our internal control over financial reporting (as defined in Rules 13a-15(f) and 15d-15(f) of the Exchange Act) during the quarter ended September 26, 2020, that have materially affected, or are reasonably likely to materially affect, our internal control over financial reporting. Management’s Report on Internal Control over Financial Reporting is included below.
Management’s Report on Internal Control Over Financial Reporting
Management of the Partnership is responsible for establishing and maintaining adequate internal control over financial reporting. The Partnership's internal control over financial reporting is designed to provide reasonable assurance as to the reliability of the Partnership's financial reporting and the preparation of financial statements for external purposes in accordance with generally accepted accounting principles.
Because of its inherent limitations, internal control over financial reporting may not prevent or detect misstatements. Also, projections of any evaluation of effectiveness to future periods are subject to the risk that controls may become inadequate because of changes in conditions, or that the degree of compliance with the policies or procedures may deteriorate.
The Partnership’s management has assessed the effectiveness of the Partnership’s internal control over financial reporting as of September 26, 2020. In making this assessment, the Partnership used the criteria established by the Committee of Sponsoring Organizations of the Treadway Commission (“COSO”) in “Internal Control-Integrated Framework (2013).” These criteria are in the areas of control environment, risk assessment, control activities, information and communication, and monitoring. The Partnership's assessment included documenting, evaluating and testing the design and operating effectiveness of its internal control over financial reporting.
Based on the Partnership’s assessment, as described above, management has concluded that, as of September 26, 2020, the Partnership’s internal control over financial reporting was effective.
Our independent registered public accounting firm, PricewaterhouseCoopers LLP, issued an attestation report dated November 25, 2020 on the effectiveness of our internal control over financial reporting, which is included herein.
ITEM 9B. OTHER INFORMATION
None.
44
PART III
ITEM 10. DIRECTORS, EXECUTIVE OFFICERS AND PARTNERSHIP GOVERNANCE
Partnership Management
Our Partnership Agreement provides that all management powers over our business and affairs are exclusively vested in our Board of Supervisors and, subject to the direction of the Board of Supervisors, our officers. No Unitholder has any management power over our business and affairs or actual or apparent authority to enter into contracts on behalf of or otherwise to bind us. Under the current Partnership Agreement, members of our Board of Supervisors are elected by the Unitholders for three-year terms.
All eight of our current Supervisors, namely Messrs. Harold R. Logan Jr., Lawrence C. Caldwell, Matthew J. Chanin, Terence J. Connors, William M. Landuyt, Michael A. Stivala, John Hoyt Stookey and Ms. Jane Swift, were elected to their current three-year terms at the Tri-Annual Meeting of our Unitholders held on May 15, 2018.
Four Supervisors, who are not officers or employees of the Partnership or its subsidiaries, currently serve on the Audit Committee with authority to review, at the request of the Board of Supervisors, specific matters as to which the Board of Supervisors believes there may be a conflict of interest, or which may be required to be disclosed pursuant to Item 404(a) of Regulation S-K adopted by the SEC, in order to determine if the resolution or course of action in respect of such conflict proposed by the Board of Supervisors is fair and reasonable to us. Under the Partnership Agreement, any matter that receives the “Special Approval” of the Audit Committee (i.e., approval by a majority of the members of the Audit Committee) is conclusively deemed to be fair and reasonable to us, is deemed approved by all of our partners and shall not constitute a breach of the Partnership Agreement or any duty stated or implied by law or equity as long as the material facts known to the party having the potential conflict of interest regarding that matter were disclosed to the Audit Committee at the time it gave Special Approval. The Audit Committee also assists the Board of Supervisors in fulfilling its oversight responsibilities relating to (i) integrity of the Partnership’s financial statements and internal control over financial reporting; (ii) the Partnership’s compliance with applicable laws, regulations and its code of conduct; (iii) independence and qualifications of the independent registered public accounting firm; (iv) performance of the internal audit function and the independent registered public accounting firm; and (v) accounting complaints.
The Board of Supervisors has determined that all four current members of the Audit Committee, Terence J. Connors, Lawrence C. Caldwell, William M. Landuyt and Jane Swift, are independent and (with the exception of Ms. Swift) audit committee financial experts within the meaning of the NYSE corporate governance listing standards and in accordance with Rule 10A-3 of the Exchange Act, Item 407 of Regulation S-K and the Partnership’s criteria for Supervisor independence (as discussed in Item 13, herein) as of the date of this Annual Report.
Mr. Logan, Chairman of the Board, presides at regularly scheduled executive sessions of the non-management Supervisors, all of whom are independent, held as part of the regular meetings of the Board of Supervisors. Investors and other parties interested in communicating directly with the non-management Supervisors as a group may do so by writing to the Non-Management Members of the Board of Supervisors, c/o Company Secretary, Suburban Propane Partners, L.P., P.O. Box 206, Whippany, New Jersey 07981-0206.
At its regular meeting held on November 11, 2020, the Partnership’s Board of Supervisors unanimously elected Matthew J. Chanin, as its new Chairman effective January 1, 2021. Mr. Logan, the current Chairman, is an original member of the Board since the Partnership’s initial public offering in 1996 and he will continue to serve in the capacity as Supervisor on the Board of Supervisors, and remain a member of the Nominating/Governance and Compensation Committees. Mr. Logan made the decision to relinquish the role at this time in order to facilitate an effective transition of leadership on the Board.

45
Board of Supervisors and Executive Officers of the Partnership
The following table sets forth certain information with respect to the members of the Board of Supervisors and our executive officers as of November 25, 2020. Officers are appointed by the Board of Supervisors for one-year terms and Supervisors (other than those elected by the Board to fill vacancies) are elected by the Unitholders for three-year terms.
Name Age Position With the Partnership Michael A. Stivala ................................ 51 President and Chief Executive Officer; Member of the Board of Supervisors Michael A. Kuglin ................................ 50 Chief Financial Officer & Chief Accounting Officer Steven C. Boyd ..................................... 56 Chief Operating Officer Douglas T. Brinkworth ......................... 59 Senior Vice President – Product Supply, Purchasing & Logistics Neil E. Scanlon ..................................... 55 Senior Vice President – Information Services Daniel S. Bloomstein ............................ 47 Vice President and Controller A. Davin D’Ambrosio ........................... 56 Vice President and Treasurer Bryon L. Koepke ................................... 48 Vice President – General Counsel and Secretary Keith P. Onderdonk .............................. 56 Vice President – Operational Support Michael A. Schueler.............................. 54 Vice President – Product Supply Francesca Cleffi .................................... 50 Vice President – Human Resources Harold R. Logan, Jr. .............................. 76 Member of the Board of Supervisors (Chairman) John Hoyt Stookey ................................ 90 Member of the Board of Supervisors Jane Swift .............................................. 55 Member of the Board of Supervisors Lawrence C. Caldwell ........................... 74 Member of the Board of Supervisors Matthew J. Chanin ................................ 66 Member of the Board of Supervisors (Chairman of the Compensation Committee) Terence J. Connors ............................... 66 Member of the Board of Supervisors (Chairman of the Audit Committee) William M. Landuyt.............................. 65 Member of the Board of Supervisors
Mr. Stivala has served as our President since April 2014 and as our Chief Executive Officer since September 2014. Mr. Stivala has served as a Supervisor since November 2014. From November 2009 until March 2014, he was our Chief Financial Officer, and, before that, our Chief Financial Officer and Chief Accounting Officer since October 2007. Prior to, that he was our Controller and Chief Accounting Officer since May 2005 and Controller since December 2001. Before joining the Partnership, he held several positions with PricewaterhouseCoopers LLP, an international accounting firm, most recently as Senior Manager in the Assurance practice. Mr. Stivala currently serves on the Board of Directors of Oberon Fuels, Inc., in which we currently own a 39% equity stake. In addition, Mr. Stivala is a member of the Regional Council of the New Jersey Region of the American Red Cross and a member of the Global Industry Council of the World LPG Association.
Mr. Stivala’s qualifications to sit on our Board include his nineteen years of experience in the propane industry, including as our current President and Chief Executive Officer and, before that, as our Chief Financial Officer for almost seven years, which day to day leadership roles have provided him with intimate knowledge of our operations.
Mr. Kuglin has served as our Chief Financial Officer & Chief Accounting Officer since September 2014 and was our Vice President – Finance and Chief Accounting Officer from April 2014 through September 2014. Prior to that, he served as our Vice President and Chief Accounting Officer since November 2011, our Controller and Chief Accounting Officer since November 2009 and our Controller since October 2007. For the eight years prior to joining the Partnership he held several financial and managerial positions with Alcatel-Lucent, a global communications solutions provider. Prior to Alcatel-Lucent, Mr. Kuglin held several positions with the international accounting firm PricewaterhouseCoopers LLP, most recently as Manager in the Assurance practice. Mr. Kuglin is a Certified Public Accountant and a member of the American Institute of Certified Public Accountants.
Mr. Boyd has served as our Chief Operating Officer since October 2017 and before that was our Senior Vice President – Operations (September 2015 – October 2017) and our Senior Vice President – Field Operations since April 2014. Previously he was our Vice President – Field Operations (formerly Vice President – Operations) since October 2008, our Southeast and Western Area Vice President since March 2007, Managing Director – Area Operations since November 2003 and Regional Manager – Northern California since May 1997. Mr. Boyd held various managerial positions with predecessors of the Partnership from 1986 through 1996.
Mr. Brinkworth has served as our Senior Vice President – Product Supply, Purchasing & Logistics since April 2014 and was previously our Vice President – Product Supply (formerly Vice President – Supply) since May 2005. Mr. Brinkworth joined the Partnership in April 1997 after a nine-year career with Goldman Sachs and, since joining the Partnership, has served in various positions in the product supply area.
46
Mr. Scanlon became our Senior Vice President – Information Services in April 2014, after serving as our Vice President – Information Services since November 2008. Prior to that, he served as our Assistant Vice President – Information Services since November 2007, Managing Director – Information Services from November 2002 to November 2007 and Director – Information Services from April 1997 until November 2002. Prior to joining the Partnership, Mr. Scanlon spent several years with JP Morgan & Co., most recently as Vice President – Corporate Systems and earlier held several positions with Andersen Consulting, an international systems consulting firm, most recently as Manager.
Mr. Bloomstein joined the Partnership as its Controller in April 2014 and was promoted to Vice President and Controller in October 2017. For the ten years prior to joining the Partnership, he held several executive financial and accounting positions with The Access Group, a network of professional services companies, and with Dow Jones & Company, Inc., a global news and financial information company. Mr. Bloomstein started his career with the international accounting firm PricewaterhouseCoopers LLP, working his way to the level of Manager in the Assurance practice. Mr. Bloomstein is a Certified Public Accountant and a member of the American Institute of Certified Public Accountants.
Ms. Cleffi has served as our Vice President – Human Resources since November 2020. Prior to that appointment she served as our Managing Director – Human Resources since June 2020 and before that she served as our Managing Director – Compensation, Talent Management and Operational Human Resources since October 2017. Prior to that, Ms. Cleffi served as our Director – Compensation and Talent Management from October 2007 to October 2017. Ms. Cleffi joined the Partnership in October 1992 and has held various positions in the Human Resources area since that time.
Mr. D’Ambrosio has served as our Treasurer since November 2002 and was promoted to Vice President in October 2007. He served as our Assistant Treasurer from October 2000 to November 2002 and as Director of Treasury Services from January 1998 to October 2000. Mr. D’Ambrosio joined the Partnership in May 1996 after ten years in the commercial banking industry.
Mr. Koepke became our Vice President – General Counsel and Secretary in October 2019, after serving as our Vice President – Deputy General Counsel and Assistant Secretary since March 2019. For the nineteen years prior to joining the Partnership, Mr. Koepke served several years as senior in-house legal counsel for Avis Budget Group, Inc. and Caterpillar Inc. and as a senior attorney for the U.S. Securities and Exchange Commission.
Mr. Onderdonk has served as our Vice President – Operational Support since November 2015 and before that was our Assistant Vice President – Financial Planning and Analysis since November 2013. Prior to that, he served as our Managing Director, Financial Planning and Analysis from November 2010 to November 2013. Mr. Onderdonk joined the Partnership in September 2001 after fourteen years in the consumer products industry.
Mr. Schueler has served as our Vice President – Product Supply since October 2017 and before that was our Managing Director – Product Supply since November 2013. Mr. Schueler joined the Partnership as Director – Product Resources in July 2005 following a nine-year career at Public Service Enterprise Group and prior to that, eight years at Kraft Foods.
Mr. Logan has served as a Supervisor since March 1996 and was elected as Chairman of the Board of Supervisors in January 2007. Mr. Logan co-founded, and from 2006 to the present has been serving as a Director of, Basic Materials and Services LLC, an investment company that, until it went inactive in May 2018, invested in companies that provide specialized infrastructure services and materials for the pipeline construction industry and the sand/silica industry. From 2003 to September 2006, Mr. Logan was a Director and Chairman of the Finance Committee of the Board of Directors of TransMontaigne Inc., which provided logistical services (i.e. pipeline, terminaling and marketing) to producers and end-users of refined petroleum products. From 1995 to 2002, Mr. Logan was Executive Vice President/Finance, Treasurer and a Director of TransMontaigne Inc. From 1987 to 1995, Mr. Logan served as Senior Vice President – Finance and a Director of Associated Natural Gas Corporation, an independent gatherer and marketer of natural gas, natural gas liquids and crude oil. Mr. Logan is also a Director of Cimarex Energy Co. and Hart Energy Publishing LLP, and, through May 2019, was a Director of InfraREIT, Inc. and through May 2017, was a Director of Graphic Packaging Holding Company.
Over the past forty plus years, Mr. Logan’s education, investment banking/venture capital experience and business/financial management experience have provided him with a comprehensive understanding of business and finance. Most of Mr. Logan’s business experience has been in the energy industry, both in investment banking and as a senior financial officer and director of publicly-owned energy companies. Mr. Logan’s expertise and experience have been relevant to his responsibilities of providing oversight and advice to the managements of public companies, and is of particular benefit in his role as our Chairman. Since 1996, Mr. Logan has been a director of ten public companies and has served on audit, compensation and governance committees.
Mr. Stookey has served as a Supervisor since March 1996. He was Chairman of the Board of Supervisors from March 1996 through January 2007. From 1986 until September 1993, he was the Chairman, President and Chief Executive Officer of Quantum Chemical Corporation, a predecessor of the Partnership. He served as non-executive Chairman and a Director of Quantum from its

47
acquisition by Hanson plc, a global diversified industrial conglomerate, in September 1993 until October 1995, at which time he retired. Since then, Mr. Stookey has served as a trustee of a number of non-profit organizations, including founding and serving as non-executive Chairman of Per Scholas Inc. (a non-profit organization dedicated to training inner city individuals to become computer and software technicians), The Berkshire Choral Festival and also currently serves on the Board of Directors and Audit Committee of The Berkshire Taconic Community Foundation, the Board of Directors of The Clark Foundation and The Robert Sterling Clark Foundation and as a Life Trustee of the Boston Symphony Orchestra. Mr. Stookey has served as a director of ten New York Stock Exchange-listed companies and 18 private companies throughout his career.
Mr. Stookey’s qualifications to sit on our Board include his extensive experience as Chief Executive Officer of four corporations (including a predecessor of the Partnership) and his many years of service as a director of publicly-owned corporations and non-profit organizations.
Ms. Swift has served as a Supervisor since April 2007. In July 2019, Ms. Swift was appointed President and Executive Director of LearnLaunch Institute, a not-for-profit educational institution in Boston, Massachusetts. From January 2018 through February 2019, Ms. Swift served as Executive Chair of Ultimate Medical Academy, a not-for-profit healthcare educational institution with a national presence. From August 2011 through April 2017, Ms. Swift served as the CEO of Middlebury Interactive Languages, LLC, a marketer of world language products. From 2010 through July 2011, she served as Senior Vice President – ConnectEDU Inc., a private education technology company. In 2007, Ms. Swift founded WNP Consulting, LLC, a provider of expert advice and guidance to early stage education companies. From 2003 to 2006 she was a General Partner at Arcadia Partners, a venture capital firm focused on the education industry. Prior to joining Arcadia, Ms. Swift served for fifteen years in Massachusetts state government, becoming Massachusetts’ first woman governor in 2001. Ms. Swift also provides consulting services to various clients, including Whiteboard Advisors, a leading education research, consulting and communications firm in the United States. She has previously served on the boards of K12, Inc., Animated Speech Company, The Young Writers Project, Sally Ride Science Inc., Teachers of Tomorrow and eDynamics Learning. Ms. Swift currently serves on the boards of two privately held companies, Academic Programs International in Austin, Texas and Climb Credit, Inc. in Brooklyn, New York. Ms. Swift also currently serves on several not-for-profit and advisory boards, including School of Leadership Afghanistan; and Vote, Run, Lead.
Ms. Swift’s qualifications to sit on our Board include her strong skills in public policy and government relations and her extensive knowledge of regulatory matters arising from her fifteen years in state government.
Mr. Caldwell has served as a Supervisor since November 2012. He was a Co-Founder of New Canaan Investments, Inc. (“NCI”), a private equity investment firm, where he was one of three senior officers of the firm from 1988 to 2005. NCI was an active “fix and build” investor in packaging, chemicals, and automotive components companies. Mr. Caldwell held a number of board directorships and senior management positions in these companies until he retired in 2005. The largest of these companies was Kerr Group, Inc., a plastic closure and bottle company where Mr. Caldwell served as Director for eight years and Chief Financial Officer for six years. From 1985 to 1988, Mr. Caldwell was head of acquisitions for Moore McCormack Resources, Inc., an oil and gas exploration, shipping, and construction materials company. Mr. Caldwell also currently serves on the Board of Trustees and as Chairman of the Investment Committee of Historic Deerfield, and on the Board of Directors of the Leventhal Map Center; both of which non-profit institutions focus on enriching educational programs for K-12 children locally and nationwide.
Mr. Caldwell's qualifications to sit on our Board include over forty years of successful investing in and managing of a broad range of public and private businesses in a number of different industries. This experience has encompassed both turnaround situations, and the building of companies through internal growth and acquisitions.
Mr. Chanin has served as a Supervisor since November 2012. He was Senior Managing Director of Prudential Investment Management, a subsidiary of Prudential Financial, Inc., from 1996 until his retirement in January 2012, after which he continued to provide consulting services to Prudential until December 2016. He headed Prudential’s private fixed income business, chaired an internal committee responsible for strategic investing and was a principal in Prudential Capital Partners, the firm’s mezzanine investment business. He currently provides consulting services to two clients, and, until October 2017, served as a Director of two private companies that were in Prudential Capital Partners funds’ portfolios.
Mr. Chanin’s qualifications to sit on our Board include 35 years of investment experience with a focus on highly structured private placements in companies in a broad range of industries, with a particular focus on energy companies. He has previously served on the audit committee of a public company board and the compensation committee for a private company board. Mr. Chanin has earned an MBA and is a Chartered Financial Analyst.

48
Mr. Connors has served as a Supervisor since January 2017. Mr. Connors retired in September 2015 from KPMG LLP after nearly forty years in public accounting. Prior to joining KPMG in 2002 he was a partner with another large international accounting firm. During his career, he served as a senior audit and global lead partner for numerous public companies, including Fortune 500 companies. At KPMG he was a professional practice partner, SEC Reviewing Partner and was elected to serve as a member of KPMG’s board of directors (2011-2015), where he chaired the Audit, Finance & Operations Committee. Mr. Connors currently serves as a director and audit committee chairman of FS Credit Real Estate Income Trust, Inc., a commercial mortgage nontraded real estate investment trust, and AdaptHealth Corp., a leading provider of home healthcare equipment and services in the United States. He previously served as a director and audit committee chairman of Cardone Industries, Inc., one of the largest privately-held automotive parts remanufacturers in the world.
Mr. Connors’ qualifications to sit on our Board, and serve as Chairman of its Audit Committee, include his extensive experience as a lead audit partner for numerous public companies across a variety of industries, which enables him to provide helpful insights to the Board in connection with its oversight of financial, accounting and internal control matters.
Mr. Landuyt has served as a Supervisor since January 1, 2017. Since 2003, Mr. Landuyt has served as a Managing Director at Charterhouse Strategic Partners, LLC, and its predecessors (“Charterhouse”), private equity firms with a focus on build-ups, management buyouts, and growth capital investments primarily in the business services and healthcare services sectors, and has served on the Boards of Directors of a number of portfolio companies of those firms. From 1996 to 2003, Mr. Landuyt served as Chairman of the Board, President and Chief Executive Officer of Millennium Chemicals, Inc. (“Millennium”), and from 1983 to 1996 he served as Finance Director of Hanson plc and several other senior executive positions with Hanson Industries, the U.S. subsidiary of Hanson plc (collectively, “Hanson,”), including Vice President and Chief Financial Officer and ultimately Director, President and Chief Executive Officer. Hanson and Millennium were both previous owners of the Partnership or its predecessor through 1996 and 1999, respectively. He joined Hanson after spending six years as a Certified Public Accountant and auditor at Price Waterhouse & Co., where he rose to the position of Senior Manager. Mr. Landuyt has previously served on the Boards of Directors (including their Audit and Compensation Committees) of public companies, including Bethlehem Steel Corp., MxEnergy Holdings, Inc., a leading retail marketer of natural gas and electricity contracts, and Top Image Systems, Inc. Mr. Landuyt is also“/s/ PricewaterhouseCoopers LLP the Co-Founder and Executive Director of Celtic Charms, Inc., a non-profit therapeutic horsemanship center serving people with physical and cognitive disabilities and disorders.
Mr. Landuyt’s qualifications to sit on our Board include forty years of financial and executive management experience for both public and private companies, including extensive experience with mergers and acquisitions and corporate governance. Additionally, his specific responsibility for supervision of the Partnership’s predecessors, as well as his subsequent board-level involvement in the distribution, petrochemical and retail energy sectors through Charterhouse’s investments in those sectors, gives Mr. Landuyt extensive expertise in areas directly relevant to the business of the Partnership.
Delinquent Section 16(a) Reports
Section 16(a) of the Exchange Act requires our Supervisors, executive officers and holders of ten percent or more of our Common Units to file initial reports of ownership and reports of changes in ownership of our Common Units with the SEC. Supervisors, executive officers and ten percent Unitholders are required to furnish the Partnership with copies of all Section 16(a) forms that they file. Based on a review of these filings, we believe that all such filings were timely made during fiscal year 2020.
Codes of Ethics and of Business Conduct
We have adopted a Code of Ethics that applies to our principal executive officer, principal financial officer and principal accounting officer, and a Code of Business Conduct that applies to all of our employees, officers and Supervisors. A copy of our Code of Ethics and our Code of Business Conduct is available without charge from our website at www.suburbanpropane.com or upon written request directed to: Suburban Propane Partners, L.P., Investor Relations, P.O. Box 206, Whippany, New Jersey 07981-0206. Any amendments to, or waivers from, provisions of our Code of Ethics or our Code of Business Conduct will be posted on our website.

49
Corporate Governance Guidelines
We have adopted Corporate Governance Guidelines and Principles in accordance with the NYSE corporate governance listing standards in effect as of the date of this Annual Report. In addition, we have adopted certain Corporate Governance Policies, including an Equity Holding Policy for Supervisors and Executives and an Incentive Compensation Recoupment Policy. A copy of our Corporate Governance Guidelines and Principles, as well as a copy of the Corporate Governance Policies, is available without charge from our website at www.suburbanpropane.com or upon written request directed to: Suburban Propane Partners, L.P., Investor Relations, P.O. Box 206, Whippany, New Jersey 07981-0206.
Audit Committee Charter
We have adopted a written Audit Committee Charter in accordance with the NYSE corporate governance listing standards in effect as of the date of this Annual Report. The Audit Committee Charter is reviewed periodically to ensure that it meets all applicable legal and NYSE listing requirements. A copy of our Audit Committee Charter is available without charge from our website at www.suburbanpropane.com or upon written request directed to: Suburban Propane Partners, L.P., Investor Relations, P.O. Box 206, Whippany, New Jersey 07981-0206.
Compensation Committee Charter
Three Supervisors, who are not officers or employees of the Partnership or its subsidiaries, currently serve on the Compensation Committee. The Board of Supervisors has determined that all three current members of the Compensation Committee, Matthew J. Chanin, Harold R. Logan, Jr. and John Hoyt Stookey, are independent.
We have adopted a Compensation Committee Charter in accordance with the NYSE corporate governance listing standards in effect as of the date of this Annual Report. A copy of our Compensation Committee Charter is available without charge from our website at www.suburbanpropane.com or upon written request directed to: Suburban Propane Partners, L.P., Investor Relations, P.O. Box 206, Whippany, New Jersey 07981-0206.
During fiscal 2020, the Compensation Committee independently retained Willis Towers Watson, a human resources consulting firm, to assist the Compensation Committee in developing certain components of the compensation packages for the Partnership’s executive officers. See Item 11 below.
Nominating/Governance Committee Charter
The Nominating/Governance Committee participates in Board succession planning and development and identifies individuals qualified to become Board members, recommends to the Board the persons to be nominated for election as Supervisors at any Tri-Annual Meeting of the Unitholders and the persons (if any) to be elected by the Board to fill any vacancies on the Board, develops and recommends to the Board changes to the Partnership’s Corporate Governance Guidelines and Principles when appropriate, and oversees the annual evaluation of the Board. The Committee’s current members are Harold R. Logan, Jr. (its Chairman), Lawrence C. Caldwell, Matthew J. Chanin, Terence J. Connors, William M. Landuyt, John Hoyt Stookey and Jane Swift, all of whom are independent in accordance with our Corporate Governance Guidelines and Principles and the rules of the NYSE.
We have adopted a written Nominating/Governance Committee Charter. A copy of our Nominating/Governance Committee Charter is available without charge from our website at www.suburbanpropane.com or upon written request directed to: Suburban Propane Partners, L.P., Investor Relations, P.O. Box 206, Whippany, New Jersey 07981-0206.
NYSE Annual CEO Certification
The NYSE requires the Chief Executive Officer of each listed company to submit a certification indicating that the company is not in violation of the Corporate Governance listing standards of the NYSE on an annual basis. Our Chief Executive Officer submits his Annual CEO Certification to the NYSE each December. In December 2019, our Chief Executive Officer, Michael A. Stivala, submitted his Annual CEO Certification to the NYSE without qualification.
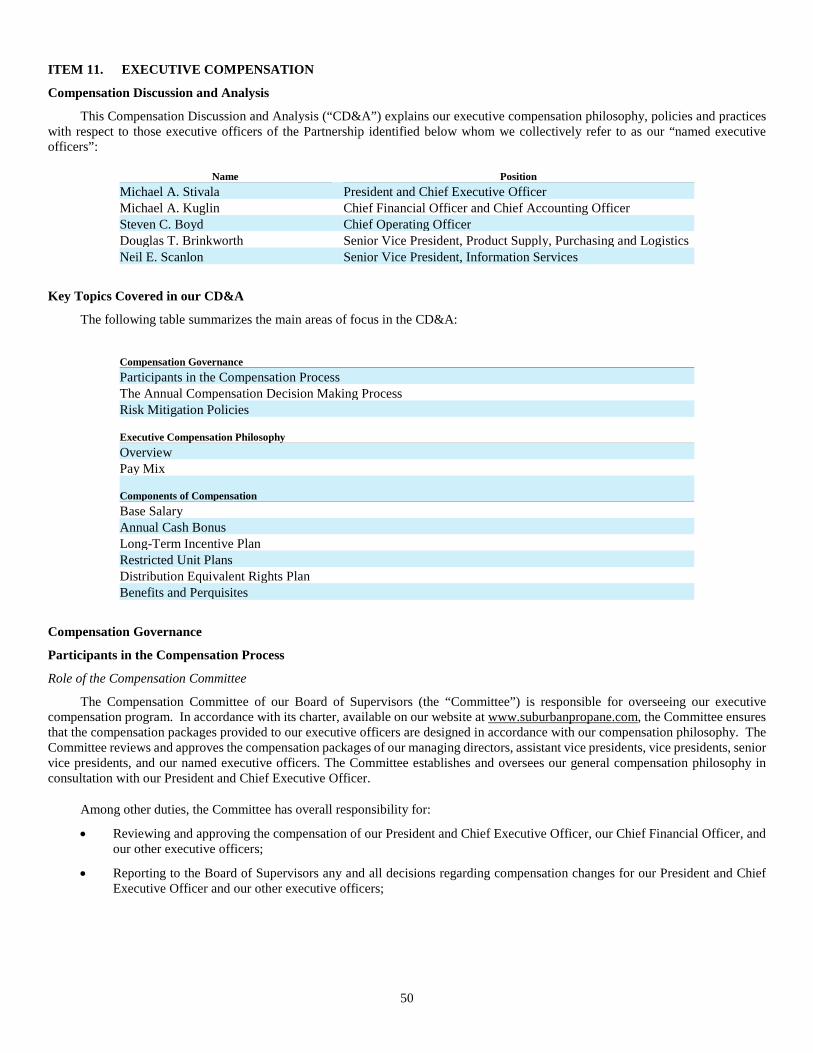
50
ITEM 11. EXECUTIVE COMPENSATION
Compensation Discussion and Analysis
This Compensation Discussion and Analysis (“CD&A”) explains our executive compensation philosophy, policies and practices with respect to those executive officers of the Partnership identified below whom we collectively refer to as our “named executive officers”:
Name Position Michael A. Stivala President and Chief Executive Officer Michael A. Kuglin Chief Financial Officer and Chief Accounting Officer Steven C. Boyd Chief Operating Officer Douglas T. Brinkworth Senior Vice President, Product Supply, Purchasing and Logistics Neil E. Scanlon Senior Vice President, Information Services
Key Topics Covered in our CD&A
The following table summarizes the main areas of focus in the CD&A:
Compensation Governance Participants in the Compensation Process The Annual Compensation Decision Making Process Risk Mitigation Policies
Executive Compensation Philosophy Overview Pay Mix
Components of Compensation Base Salary Annual Cash Bonus Long-Term Incentive Plan Restricted Unit Plans Distribution Equivalent Rights Plan Benefits and Perquisites
Compensation Governance
Participants in the Compensation Process
Role of the Compensation Committee
The Compensation Committee of our Board of Supervisors (the “Committee”) is responsible for overseeing our executive compensation program. In accordance with its charter, available on our website at www.suburbanpropane.com, the Committee ensures that the compensation packages provided to our executive officers are designed in accordance with our compensation philosophy. The Committee reviews and approves the compensation packages of our managing directors, assistant vice presidents, vice presidents, senior vice presidents, and our named executive officers. The Committee establishes and oversees our general compensation philosophy in consultation with our President and Chief Executive Officer.
Among other duties, the Committee has overall responsibility for:
• Reviewing and approving the compensation of our President and Chief Executive Officer, our Chief Financial Officer, and our other executive officers;
• Reporting to the Board of Supervisors any and all decisions regarding compensation changes for our President and Chief Executive Officer and our other executive officers;

51
• Evaluating and approving awards under our annual cash bonus plan, awards under our Long-Term Incentive Plan, grants under our Restricted Unit Plans, and grants under our Distribution Equivalent Rights Plan, as well as all other executive compensation policies and programs;
• Approving, administering and interpreting the compensation plans that constitute each component of our executive officers’ compensation packages;
• Engaging consultants, when appropriate, to provide independent, third-party advice on executive officer-related compensation; and
• Planning for anticipated and unexpected leadership changes by engaging in a continual process of management succession planning.
Role of the President and Chief Executive Officer
The role of our President and Chief Executive Officer in the executive compensation process is to recommend individual pay adjustments, grants of restricted units under the Partnership’s Restricted Unit Plans and other adjustments to the compensation packages of the executive officers, other than for himself, to the Committee based on market conditions, the Partnership’s performance, and individual performance. When recommending individual pay adjustments for the executive officers, our President and Chief Executive Officer presents the Committee with information comparing each executive officer’s current compensation to the mean compensation figures for comparable positions included in benchmarking data utilized by the Committee.
Role of Outside Consultants
Prior to each Committee meeting at which executive compensation packages are reviewed, members of the Committee are provided with benchmarking data from the Mercer Human Resource Consulting, Inc. (“Mercer”) database for comparison. The Committee’s sole use of the Mercer database is to compare and contrast our executive officers’ current base salaries and total direct compensation to the data provided in the Mercer benchmarking database, which is derived from a proprietary database of surveys from over 1,948 organizations and approximately 1,551 positions that may or may not include similarly-sized national propane marketers. The use of the Mercer database provides a broad base of compensation benchmarking information for companies of a size similar to that of the Partnership. There was no formal consultancy role played by Mercer. Therefore, prior to the Committee’s meetings, neither the Committee members nor our President and Chief Executive Officer met with representatives from Mercer.
In addition to using the benchmarking data from the Mercer benchmarking database, the Committee has utilized, since fiscal 2013, the services of Willis Towers Watson (“WTW”), a human resources consulting firm, in developing compensation packages for each of our named executive officers. During fiscal 2019, the Committee engaged WTW to provide current benchmarking recommendations for each of our executive officers. These recommendations were reviewed by the Committee to evaluate and approve compensation packages for each of our named executive officers for fiscal 2020. WTW benchmarked the base salaries and total direct compensation of our executive officers in comparison to comparable positions, using market data for similarly-sized companies which were collected by WTW from multiple survey sources across several industries, inclusive of other energy companies in the United States.
Our Unitholders: Say-on-Pay
At their 2018 Tri-Annual Meeting, our Unitholders overwhelmingly approved an advisory resolution approving executive compensation (commonly referred to as “Say-on-Pay”). As a result, the Committee determined that no major revisions of its executive compensation practices were required. However, the Committee periodically evaluates its compensation practices for possible improvement. The following represents the 2018 Say-on-Pay voting results:
For Against Abstain Broker Non-Votes 20,477,392 2,064,445 711,994 31,836,738
52
The Annual Compensation Decision Making Process
Fiscal 2020 Committee Meetings
The Committee usually holds three regularly-scheduled meetings during the fiscal year: one in October or November, one in January and one in July, and may meet at other times during the year as warranted. During fiscal 2020, the Committee chose to meet in November and July as a result of there being no compensation-related business to discuss in January. The Committee finalized the fiscal 2020 compensation packages for each of our named executive officers at its November 12, 2019 meeting.
As in past fiscal years and as referred to above, the Committee was provided with a comprehensive analysis of each executive officer’s past and current compensation - including benchmarking data for comparison - to enable it to assess and determine each executive’s compensation package for fiscal 2020. The Committee considered a number of factors in establishing the fiscal 2020 executive compensation packages; including, but not limited to, experience, scope of responsibility and individual performance.
Prior to making its decisions regarding each named executive officer’s fiscal 2020 compensation package, the Committee reviewed the total cash compensation opportunity that was provided to each named executive officer during the previously completed fiscal year. At that time, “total cash compensation opportunity” consisted of base salary, an annual cash bonus, a cash settled long-term incentive, and distribution equivalent rights payments. The Committee then compared each named executive officer’s total cash compensation opportunity to the total mean cash compensation opportunity for the parallel position in the Mercer benchmarking database and to the recommendations provided by WTW. In summary, in approving the fiscal 2020 compensation packages for our named executive officers, the Committee based its final decisions on both the information contained in the Mercer benchmarking database and, in particular, on recommendations made by WTW.
Our Approach to Setting Compensation Packages
The Committee has adopted an informal policy of only considering adjustments to the base salaries of our named executive officers every two years (unless specific circumstances warrant adjustments); however, the Committee conducts an annual review of the compensation packages of all of our executive officers. In reviewing and determining the compensation packages of our named executive officers, the Committee considers a number of factors related to each executive; including, but not limited to, years of experience in current position, scope and level of responsibility, influence over the affairs of the Partnership and individual performance. The relative importance assigned to each of these factors by the Committee may differ from executive to executive and from year to year. As a result, different weights may be given to different components of compensation among each of our named executive officers.
As previously stated, the Committee reviewed benchmarking data from Mercer and WTW for comparison. This benchmarking data is just one of a number of factors considered by the Committee, but, in some cases, is not necessarily the most persuasive factor. The Committee compared total cash compensation opportunities, comprising base salary, annual cash bonuses, cash settled long-term incentives and distribution equivalent rights payments, as well as total direct compensation (which includes grants under our Restricted Unit Plans) to the total mean cash compensation opportunity and total direct compensation opportunity for the parallel position in the Mercer benchmarking database, and to the recommendations provided by WTW.
Compensation Peer Group
The Committee bases its benchmarking on a broad base of companies of similar size to the Partnership, and does not rely solely on a peer group of other propane marketers. The Committee takes this approach because it believes that the proximity of our headquarters to New York City and the need to realistically compete for skilled executives in an environment shared by numerous other enterprises seeking similarly skilled employees requires a broader review of the market. Furthermore, similarly-sized propane marketers (of which there are only two) compete for executives in different economic environments and have different ownership structures which may influence the comparability of compensation data for executive officer positions. This benchmarking approach has been in place for a number of years.
The compensation packages of the named executive officers of Ferrellgas Partners, L.P. and AmeriGas Partners, L.P. were included in the benchmarking studies provided by WTW for fiscal 2020 and fiscal 2018 and was reviewed by the Committee as part of its decision-making process in establishing executive compensation for fiscal 2020, fiscal 2019, and fiscal 2018.
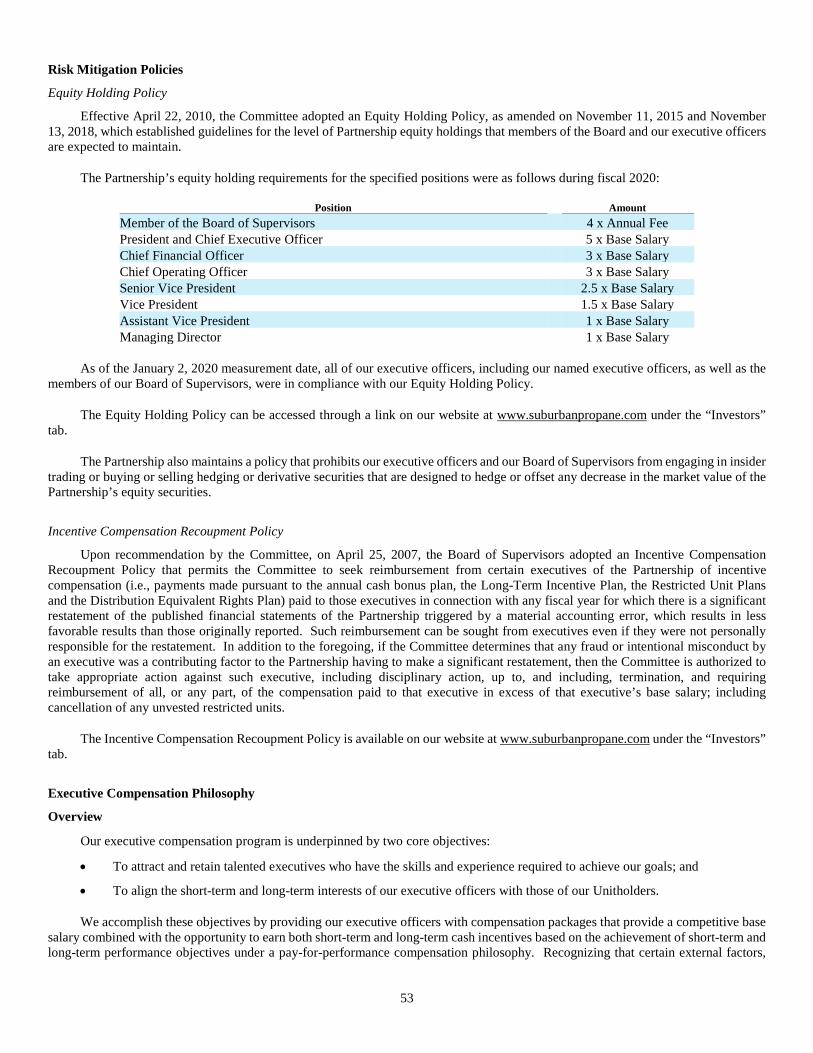
53
Risk Mitigation Policies
Equity Holding Policy
Effective April 22, 2010, the Committee adopted an Equity Holding Policy, as amended on November 11, 2015 and November 13, 2018, which established guidelines for the level of Partnership equity holdings that members of the Board and our executive officers are expected to maintain.
The Partnership’s equity holding requirements for the specified positions were as follows during fiscal 2020:
Position Amount Member of the Board of Supervisors 4 x Annual Fee President and Chief Executive Officer 5 x Base Salary Chief Financial Officer 3 x Base Salary Chief Operating Officer 3 x Base Salary Senior Vice President 2.5 x Base Salary Vice President 1.5 x Base Salary Assistant Vice President 1 x Base Salary Managing Director 1 x Base Salary
As of the January 2, 2020 measurement date, all of our executive officers, including our named executive officers, as well as the members of our Board of Supervisors, were in compliance with our Equity Holding Policy.
The Equity Holding Policy can be accessed through a link on our website at www.suburbanpropane.com under the “Investors” tab.
The Partnership also maintains a policy that prohibits our executive officers and our Board of Supervisors from engaging in insider trading or buying or selling hedging or derivative securities that are designed to hedge or offset any decrease in the market value of the Partnership’s equity securities.
Incentive Compensation Recoupment Policy
Upon recommendation by the Committee, on April 25, 2007, the Board of Supervisors adopted an Incentive Compensation Recoupment Policy that permits the Committee to seek reimbursement from certain executives of the Partnership of incentive compensation (i.e., payments made pursuant to the annual cash bonus plan, the Long-Term Incentive Plan, the Restricted Unit Plans and the Distribution Equivalent Rights Plan) paid to those executives in connection with any fiscal year for which there is a significant restatement of the published financial statements of the Partnership triggered by a material accounting error, which results in less favorable results than those originally reported. Such reimbursement can be sought from executives even if they were not personally responsible for the restatement. In addition to the foregoing, if the Committee determines that any fraud or intentional misconduct by an executive was a contributing factor to the Partnership having to make a significant restatement, then the Committee is authorized to take appropriate action against such executive, including disciplinary action, up to, and including, termination, and requiring reimbursement of all, or any part, of the compensation paid to that executive in excess of that executive’s base salary; including cancellation of any unvested restricted units.
The Incentive Compensation Recoupment Policy is available on our website at www.suburbanpropane.com under the “Investors” tab.
Executive Compensation Philosophy
Overview
Our executive compensation program is underpinned by two core objectives:
• To attract and retain talented executives who have the skills and experience required to achieve our goals; and
• To align the short-term and long-term interests of our executive officers with those of our Unitholders.
We accomplish these objectives by providing our executive officers with compensation packages that provide a competitive base salary combined with the opportunity to earn both short-term and long-term cash incentives based on the achievement of short-term and long-term performance objectives under a pay-for-performance compensation philosophy. Recognizing that certain external factors,

54
such as the severity and unpredictability of winter weather patterns, may have a significant influence on annual financial performance in any given year, the Committee evaluates additional factors in determining the amount of incentive compensation earned. We also provide our executive officers with equity-based compensation opportunities that are intended to align their interests with those of our Unitholders. The various components of compensation provided to our executive officers are specifically linked to either short-term or long-term performance measures, and encourage equity ownership in the Partnership. Therefore, our executive compensation packages are designed to achieve our overall goal of sustainable, profitable growth by rewarding our executive officers for behaviors that facilitate our achievement of this goal.
The principal components of the compensation we provide to our named executive officers are as follows:
Component Purpose Features
Base Salary • To reward individual performance, experience and scope of responsibility • To be competitive with market pay practices
• Reviewed and approved annually • Market benchmarked • Mean market salary data is considered in determining reasonable levels
Annual cash incentive
• To drive and reward the delivery of financial and operating performance during a particular fiscal year
• Paid in cash • Based on annual EBITDA performance compared to budgeted EBITDA and other qualitative factors
Long-term incentives
• To ensure alignment of our executive officers' interests with the long-term interests of our Unitholders • To reward activities and practices that are conducive to sustainable, profitable growth and long-term value creation • To attract and retain skilled individuals
• Participants are selected by the Committee • Annual awards of phantom units settled in cash • Measured over a three-year period based on the level of our average distributable cash flow over such three-year measurement period and other qualitative factors
Restricted units • To retain the services of the recipient over the vesting period • To further align the long-term interests of the recipient with the long-term interests of our Unitholders through encouragement of equity ownership • To mitigate potential shortfalls in total cash compensation of our executive officers when compared to benchmarked total cash compensation • To provide an adequate compensation package in connection with an internal promotion • To reward outstanding performance
• Participants are selected by the Committee • No pre-determined frequency or amounts of awards • Plan provides the Committee flexibility to respond to different facts and circumstances • Awards normally vest in equal thirds on the first three anniversaries of the date of grant • Awards are settled in Common Units
Distribution Equivalent Rights
• To drive and reward behaviors that lead to distribution sustainability and growth • To further align the interests of the recipients with the interests of our Unitholders • To encourage our executives to retain their holdings of our Common Units by providing them with funds to settle the income and FICA taxes on their vested restricted units
• Participants are selected by the Committee • Paid in cash • Payments are made upon a distribution to Unitholders and based on the number of Participants' unvested restricted units

55
We align the short-term and long-term interests of our named executive officers with the short-term and long-term interests of our Unitholders by:
• Providing our named executive officers with an annual incentive target that encourages them to achieve or exceed targeted financial results and operating performance for a particular fiscal year;
• Providing a long-term incentive plan that encourages our named executive officers to implement activities and practices conducive to sustainable, profitable growth;
• Providing our named executive officers with restricted units in order to encourage the retention of the participating executive officers and to align their interests with those of our Unitholders by offering an opportunity to increase their equity ownership in the Partnership, while simultaneously encouraging behaviors conducive to the long-term appreciation of our Common Units; and
• Providing our named executive officers with distribution equivalent rights to encourage behaviors conducive to distribution sustainability and growth.
Pay Mix
Under our compensation structure, each named executive officer’s “total cash compensation opportunity” consists of a mix of base salary, cash bonus, cash-settled long-term incentives, and distribution equivalent rights payments. In addition to the total cash compensation opportunity, each named executive officer is eligible to receive grants of restricted units under our Restricted Unit Plans which, when combined with the total cash compensation opportunity, represents the “total direct compensation opportunity.” This “mix” varies depending on his or her position. The base salary for each executive officer is the only fixed component of compensation, and the Restricted Unit Plan awards are the only non-cash compensation component. All other cash compensation, including annual cash bonuses and long-term incentive compensation, is variable in nature as it is dependent upon achievement of certain performance measures.
In allocating among these components, in order to align the interests of our senior executive officers - the executive officers having the greatest ability to influence our performance - with the interests of our Unitholders, the Committee considers it crucial to emphasize the performance-based elements of the total cash compensation opportunities provided to them. Therefore, during fiscal 2020, at least 46% of the total cash compensation opportunity for our named executive officers was performance-based under our annual cash bonus and long-term incentive plans, neither of which provide for guaranteed minimum payments.
The following table summarizes each of the components of total cash compensation as a percentage of each named executive officer’s total cash compensation opportunity for fiscal 2020, as well as the total cash compensation opportunity and the non-cash Restricted Unit Plan grants each as a percentage of the total direct compensation opportunity for fiscal 2020:
Name
Base Salary Cash Bonus
Target
Cash Settled
Long-Term Incentive
Distribution Equivalent
Rights
Total Cash Compensation Opportunity
as a Percentage of Total Direct
Compensation
Non-Cash Restricted Unit Plan
Grants as a Percentage of Total Direct
Compensation Michael A. Stivala 35% 35% 17% 13% 65% 35% Michael A. Kuglin 39% 31% 16% 14% 64% 36% Steven C. Boyd 39% 31% 16% 14% 64% 36% Douglas T. Brinkworth 39% 31% 16% 14% 63% 37% Neil E. Scanlon 39% 31% 15% 15% 62% 38%

56
Components of Compensation
Base Salary
Consistent with what has come to be the Committee’s informal policy of only considering adjustments to the base salaries of our named executive officers every two years (unless specific circumstances were deemed by the Committee to necessitate a base salary adjustment), at its November 12, 2019 meeting, the Committee approved new fiscal 2020 base salaries for our named executive officers.
The following base salaries were in effect during fiscal 2020 and fiscal 2019 for our named executive officers:
Name Fiscal 2020
Base Salary Fiscal 2019
Base Salary Michael A. Stivala $ 600,000 $ 550,000 Michael A. Kuglin $ 400,000 $ 365,000 Steven C. Boyd $ 400,000 $ 365,000 Douglas T. Brinkworth $ 360,000 $ 335,000 Neil E. Scanlon $ 320,000 $ 300,000
The base salaries paid to our named executive officers in fiscal 2020, fiscal 2019 and fiscal 2018 are reported in the column titled
“Salary” in the Summary Compensation Table below.
In accordance with the Committee’s informal policy of considering executive pay increases every other year, at its November 10, 2020 meeting, the Committee determined that the fiscal 2021 base salaries of our named executive officers will remain the same as in fiscal 2020.
Annual Cash Bonus Plan
The Committee uses the annual cash bonus plan (which falls within the Securities and Exchange Commission’s definition of a “Non-Equity Incentive Plan” for the purposes of the Summary Compensation Table and otherwise) to provide a cash incentive award to certain hourly and salaried employees; including our named executive officers, for the attainment of EBITDA targets for the particular fiscal year, in accordance with the annual budget approved by our Board of Supervisors at the beginning of the fiscal year, and other qualitative factors.
Components of Annual Cash Bonus Plan
Definitions
Actual EBITDA: represents net income before deducting interest expense, income taxes, depreciation and amortization.
Actual Adjusted EBITDA: represents Actual EBITDA adjusted for various items; including, but not limited to, unrealized (non-cash) gains or losses on changes in the fair value of derivative instruments; gains or losses on sale of business; acquisition and integration-related costs; multi-employer pension plan withdrawal charges; pension settlement charges; and losses on debt extinguishment.
Budgeted EBITDA: represents our target budgeted EBITDA developed using a bottom-up process factoring in reasonable growth targets from the prior year’s performance, while at the same time attempting to reach a balance between a target that is reasonably achievable, yet not assured.
The annual cash bonus plan contains two separate measurement components as follows:
• Performance-based component in which Actual Adjusted EBITDA is compared to Budgeted EBITDA; and,
• Scorecard-based component in which up to 35% of the target cash bonus may be awarded by the Committee, as an enhancement to the performance-based component, based on their evaluation of several qualitative scorecard items that include the following: key safety statistics compared to the prior year, customer base trends compared to the prior year, Actual Adjusted EBITDA compared to the prior year, distributable cash flow compared to the prior year, and, in the case of our named executive officers, achievement of corporate and individual goals. The Committee uses its discretion regarding how much weight to place on any one, or several, of the qualitative scorecard items in determining the amount, if any, of the scorecard-based component to award in any fiscal year.

57
The following table sets forth the percentages of target cash bonuses participants will earn under the performance-based component of the annual cash bonus plan at various levels of Adjusted EBITDA in relation to Budgeted EBITDA:
Performance-Based Component
Actual Adjusted EBITDA as a % of
Budgeted EBITDA % of Target Cash Bonus Earned Maximum 120% and above 120 %
119 % 119 % 118 % 118 % 117 % 117 % 116 % 116 % 115 % 115 % 114 % 114 % 113 % 113 % 112 % 112 % 111 % 111 % 110 % 110 % 109 % 109 % 108 % 108 % 107 % 107 % 106 % 106 % 105 % 105 % 104 % 104 % 103 % 103 % 102 % 102 % 101 % 101 %
Target 100 % 100 % 99 % 98 % 98 % 96 % 97 % 94 % 96 % 92 % 95 % 90 % 94 % 88 % 93 % 86 % 92 % 84 % 91 % 82 % 90 % 80 % 89 % 77 % 88 % 74 % 87 % 71 % 86 % 68 % 85 % 65 % 84 % 62 % 83 % 59 % 82 % 56 % 81 % 53 %
Entry 80 % 50 % Below 80% 0 %

58
Fiscal 2020 Annual Cash Bonus
For fiscal 2020, our Budgeted EBITDA was $285 million. Our Actual Adjusted EBITDA was such that each of our executive officers earned 77% of his or her target cash bonus for the performance-based component of the annual cash bonus plan. During the previous two fiscal years, our Actual Adjusted EBITDA was such that each of our named executive officers earned 94% and 101% of his target cash bonus for fiscal 2019 and fiscal 2018, respectively. Additionally, for fiscal 2020, fiscal 2019 and fiscal 2018, based on the Committee’s evaluation of the qualitative scorecard-based components discussed above, the Committee awarded each of our named executive officers 0%, 0% and 10%, respectively, of the target cash bonuses for the scorecard-based component of the annual cash bonus plan. Accordingly, based on the performance of the Partnership, and the named executive officers, in fiscal 2021, 77% of target cash bonuses will be paid out in relation to fiscal 2020, in fiscal 2020, 94% of target cash bonuses were paid out in relation to fiscal 2019 and in fiscal 2019, 111% of target cash bonuses were paid out in relation to fiscal 2018.
The fiscal 2020 target cash bonuses established for each named executive officer and the actual cash bonuses earned by each of them during fiscal 2020 are summarized as follows:
Name
Fiscal 2020 Target Cash Bonus as a
Percentage of Base Salary
Fiscal 2020 Target Cash
Bonus
Fiscal 2020
Actual Cash Bonus Earned at
77% Michael A. Stivala 100% $ 600,000 $ 462,000 Michael A. Kuglin 80% $ 320,000 $ 246,400 Steven C. Boyd 80% $ 320,000 $ 246,400 Douglas T. Brinkworth 80% $ 288,000 $ 221,760 Neil E. Scanlon 80% $ 256,000 $ 197,120
The Use of Discretion
The Committee retains the right to exercise its broad discretionary powers to decrease or increase the annual cash bonus paid to a particular named executive officer, upon the recommendation of our President and Chief Executive Officer, or to the named executive officers as a group, when the Committee determines that an adjustment is warranted. The Committee has not exercised this authority since fiscal 2017.
If the Committee were to exercise its discretionary authority, any such discretionary bonuses provided to our named executive officers would be reported in the column titled “Bonus” in the Summary Compensation table below. The bonus payments earned by our named executive officers under the annual cash bonus plan for fiscal 2020, fiscal 2019 and fiscal 2018 are reported in the column titled “Non-Equity Incentive Plan Compensation” in the Summary Compensation Table below.
At its November 10, 2020 meeting, the Committee approved the following fiscal 2021 target cash bonus opportunities for our named executive officers:
Name
Fiscal 2021 Target Cash Bonus as a
Percentage of Base Salary
Fiscal 2021 Target Cash Bonus
Michael A. Stivala 100% $ 600,000 Michael A. Kuglin 80% $ 320,000 Steven C. Boyd 80% $ 320,000 Douglas T. Brinkworth 80% $ 288,000 Neil E. Scanlon 80% $ 256,000
Long-Term Incentive Plan
To complement the annual cash bonus plan, which focuses on our short-term performance goals, the Long-Term Incentive Plan, which we hereafter refer to as the “LTIP,” is a phantom unit plan that is designed to motivate our executive officers to focus on our long-term financial goals. Under the LTIP, performance is assessed over a three-year measurement period and, as such, at the beginning of each fiscal year, there are three active award cycles. For example, at the beginning of fiscal 2020 the active award cycles include: the fiscal 2018 award, which started at the beginning of fiscal 2018 and ended at the conclusion of fiscal 2020; the fiscal 2019 award, which started at the beginning of fiscal 2019 and will end at the conclusion of fiscal 2021; and the fiscal 2020 award, which started at the beginning of fiscal 2020 and will end at the conclusion of fiscal 2022. Each of these award cycles were granted pursuant to the provisions of the 2014 Long-Term Incentive Plan (the “2014 LTIP”), and performance will be measured based on the level of our

59
distribution coverage ratio over the respective three-year measurement period (“Distribution Coverage Ratio”), as further described below. At its July 21, 2020 meeting, the Committee re-evaluated the performance criteria of the 2014 LTIP, and authorized a benchmarking study of long-term incentive compensation plan design and performance measures to be performed by WTW in order to ensure that the LTIP continues to be competitive with market practices, and that the performance measures continue to promote behaviors to support the long-term growth and sustainability of the Partnership. At its November 10, 2020 meeting, the Committee adopted the 2021 Long-Term Incentive Plan (the “2021 LTIP”) to replace the 2014 LTIP for future award cycles that begin with the fiscal 2021 award. The 2014 LTIP will continue to be operative for the two outstanding award cycles at the beginning of fiscal 2021 (i.e., the fiscal 2019 and 2020 awards, which will end at the conclusion of fiscal years 2021 and 2022, respectively). For purposes of the 2021 LTIP, performance will be evaluated using two separate measurement components: (i) 75% weight based on the level of average distributable cash flow of the Partnership over the three-year measurement period (the “Distributable Cash Flow Component”); and (ii) 25% weight based on the achievement of certain operating and strategic objectives, set by the Committee, over the three-year measurement period (the “Operating/Strategic Objectives Component”), as further described below.
Performance Condition for 2014 LTIP Under the 2014 LTIP, performance is assessed based on the level of our distribution coverage ratio over a three-year measurement
period (“Distribution Coverage Ratio”). This ratio will be calculated (as shown below) by dividing our Average Distributable Cash Flow generated during an outstanding award’s three-year measurement period by a Baseline Cash Flow set on the initial grant date of the award (i.e., the beginning of the award cycle’s three-year measurement period), as follows:
Average Distributable Cash Flow
(Average Actual Adjusted EBITDA less maintenance capital expenditures, cash interest expense and other adjustments)
Baseline Cash Flow (Total # of Common Units outstanding at beginning of the three-year measurement period times the then annualized distribution rate)
Definitions
Distributable Cash Flow: represents Actual Adjusted EBITDA for a particular fiscal year less maintenance capital expenditures, cash interest expense, and the provision for income taxes for the same fiscal year.
Actual Adjusted EBITDA: represents the same definition as Actual Adjusted EBITDA under the annual cash bonus plan.
Average Distributable Cash Flow: represents average distributable cash flow for each of the three years in a particular award’s three-year measurement period, plus the product of the number of Common Units outstanding at the beginning of the three-year measurement period and the annual differences between the per Common Unit annualized distribution rate at the beginning of the three-year measurement period and the actual per Common Unit distributions paid during each of those three years.
Baseline Cash Flow: represents the total number of Common Units outstanding at the beginning of the three-year measurement period multiplied by the then per Common Unit annualized distribution rate.
The following table summarizes the performance targets and associated level of vesting, based on the achievement level of the
Distribution Coverage Ratio, for the fiscal 2018 and fiscal 2019 awards.
Distribution Coverage Ratio % of Award Earned 1.25 or higher (Maximum) 150%
1.10 (Target) 100% 1.00 (Entry) 50%
Less than 1.00 0%
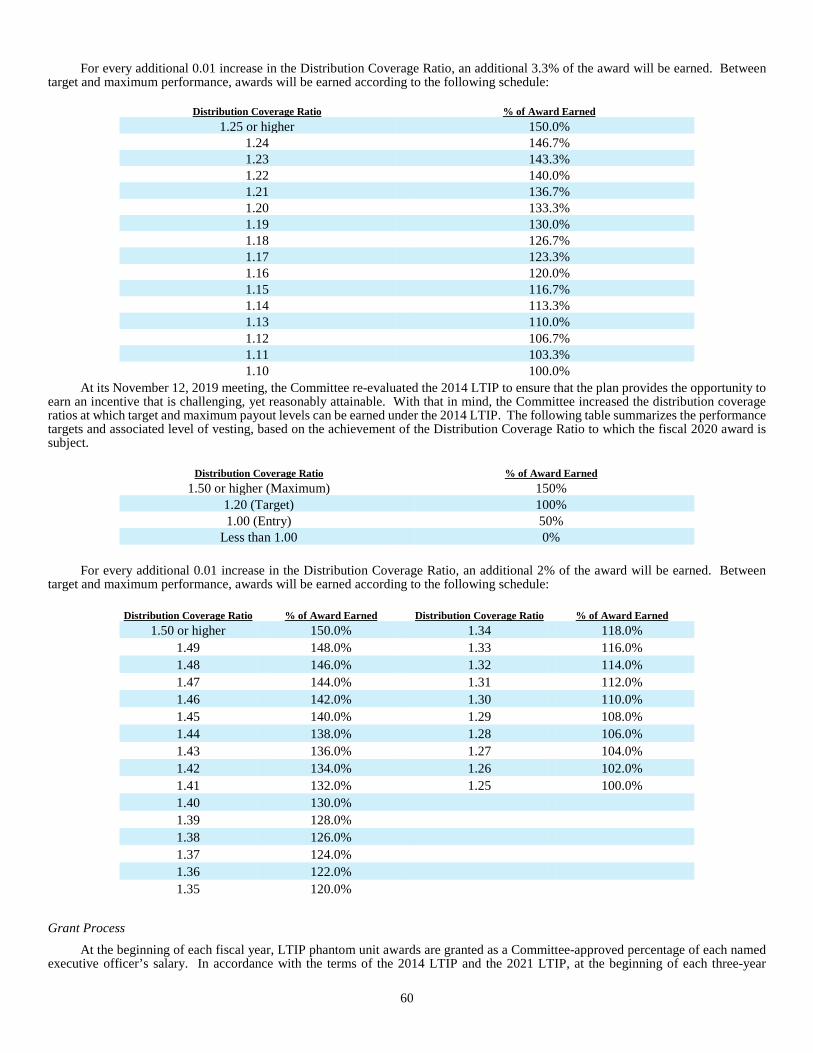
60
For every additional 0.01 increase in the Distribution Coverage Ratio, an additional 3.3% of the award will be earned. Between target and maximum performance, awards will be earned according to the following schedule:
Distribution Coverage Ratio % of Award Earned
1.25 or higher 150.0% 1.24 146.7% 1.23 143.3% 1.22 140.0% 1.21 136.7% 1.20 133.3% 1.19 130.0% 1.18 126.7% 1.17 123.3% 1.16 120.0% 1.15 116.7% 1.14 113.3% 1.13 110.0% 1.12 106.7% 1.11 103.3% 1.10 100.0%
At its November 12, 2019 meeting, the Committee re-evaluated the 2014 LTIP to ensure that the plan provides the opportunity to earn an incentive that is challenging, yet reasonably attainable. With that in mind, the Committee increased the distribution coverage ratios at which target and maximum payout levels can be earned under the 2014 LTIP. The following table summarizes the performance targets and associated level of vesting, based on the achievement of the Distribution Coverage Ratio to which the fiscal 2020 award is subject.
Distribution Coverage Ratio % of Award Earned
1.50 or higher (Maximum) 150% 1.20 (Target) 100% 1.00 (Entry) 50%
Less than 1.00 0% For every additional 0.01 increase in the Distribution Coverage Ratio, an additional 2% of the award will be earned. Between
target and maximum performance, awards will be earned according to the following schedule:
Distribution Coverage Ratio % of Award Earned Distribution Coverage Ratio % of Award Earned 1.50 or higher 150.0% 1.34 118.0%
1.49 148.0% 1.33 116.0% 1.48 146.0% 1.32 114.0% 1.47 144.0% 1.31 112.0% 1.46 142.0% 1.30 110.0% 1.45 140.0% 1.29 108.0% 1.44 138.0% 1.28 106.0% 1.43 136.0% 1.27 104.0% 1.42 134.0% 1.26 102.0% 1.41 132.0% 1.25 100.0% 1.40 130.0% 1.39 128.0% 1.38 126.0% 1.37 124.0% 1.36 122.0% 1.35 120.0%
Grant Process At the beginning of each fiscal year, LTIP phantom unit awards are granted as a Committee-approved percentage of each named
executive officer’s salary. In accordance with the terms of the 2014 LTIP and the 2021 LTIP, at the beginning of each three-year
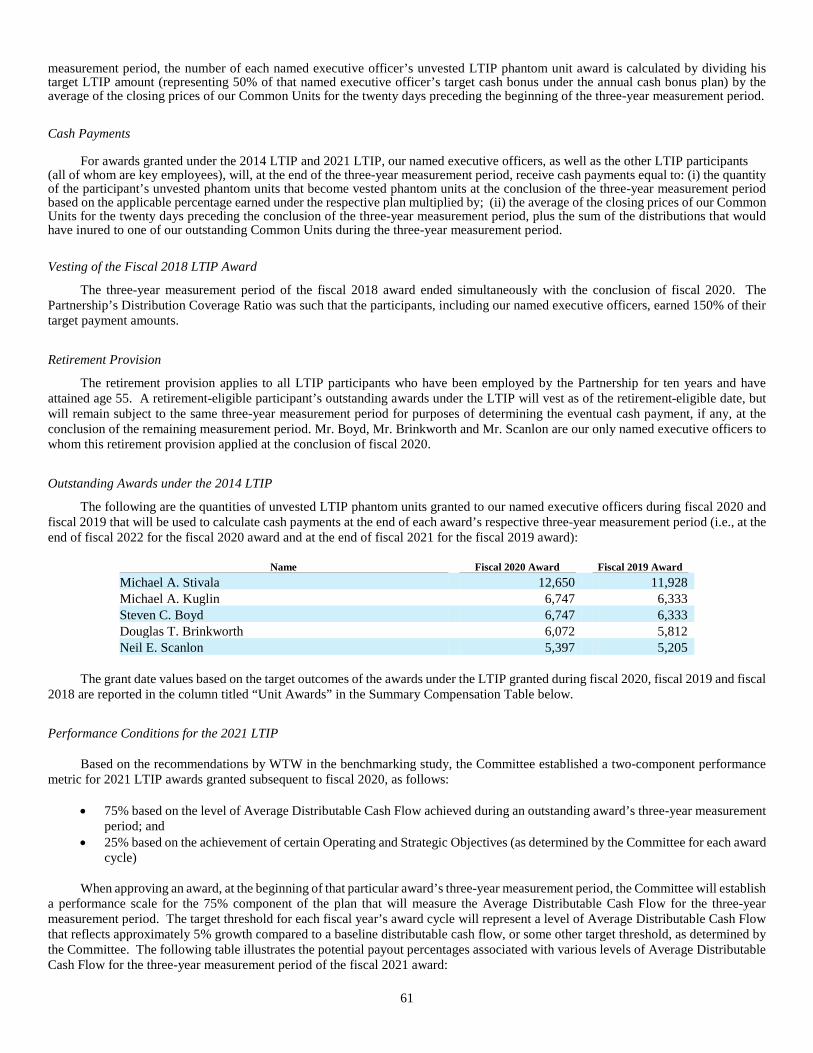
61
measurement period, the number of each named executive officer’s unvested LTIP phantom unit award is calculated by dividing his target LTIP amount (representing 50% of that named executive officer’s target cash bonus under the annual cash bonus plan) by the average of the closing prices of our Common Units for the twenty days preceding the beginning of the three-year measurement period.
Cash Payments
For awards granted under the 2014 LTIP and 2021 LTIP, our named executive officers, as well as the other LTIP participants (all of whom are key employees), will, at the end of the three-year measurement period, receive cash payments equal to: (i) the quantity of the participant’s unvested phantom units that become vested phantom units at the conclusion of the three-year measurement period based on the applicable percentage earned under the respective plan multiplied by; (ii) the average of the closing prices of our Common Units for the twenty days preceding the conclusion of the three-year measurement period, plus the sum of the distributions that would have inured to one of our outstanding Common Units during the three-year measurement period.
Vesting of the Fiscal 2018 LTIP Award
The three-year measurement period of the fiscal 2018 award ended simultaneously with the conclusion of fiscal 2020. The Partnership’s Distribution Coverage Ratio was such that the participants, including our named executive officers, earned 150% of their target payment amounts.
Retirement Provision
The retirement provision applies to all LTIP participants who have been employed by the Partnership for ten years and have attained age 55. A retirement-eligible participant’s outstanding awards under the LTIP will vest as of the retirement-eligible date, but will remain subject to the same three-year measurement period for purposes of determining the eventual cash payment, if any, at the conclusion of the remaining measurement period. Mr. Boyd, Mr. Brinkworth and Mr. Scanlon are our only named executive officers to whom this retirement provision applied at the conclusion of fiscal 2020.
Outstanding Awards under the 2014 LTIP
The following are the quantities of unvested LTIP phantom units granted to our named executive officers during fiscal 2020 and fiscal 2019 that will be used to calculate cash payments at the end of each award’s respective three-year measurement period (i.e., at the end of fiscal 2022 for the fiscal 2020 award and at the end of fiscal 2021 for the fiscal 2019 award):
Name Fiscal 2020 Award Fiscal 2019 Award Michael A. Stivala 12,650 11,928 Michael A. Kuglin 6,747 6,333 Steven C. Boyd 6,747 6,333 Douglas T. Brinkworth 6,072 5,812 Neil E. Scanlon 5,397 5,205
The grant date values based on the target outcomes of the awards under the LTIP granted during fiscal 2020, fiscal 2019 and fiscal 2018 are reported in the column titled “Unit Awards” in the Summary Compensation Table below.
Performance Conditions for the 2021 LTIP
Based on the recommendations by WTW in the benchmarking study, the Committee established a two-component performance metric for 2021 LTIP awards granted subsequent to fiscal 2020, as follows:
• 75% based on the level of Average Distributable Cash Flow achieved during an outstanding award’s three-year measurement period; and
• 25% based on the achievement of certain Operating and Strategic Objectives (as determined by the Committee for each award cycle)
When approving an award, at the beginning of that particular award’s three-year measurement period, the Committee will establish
a performance scale for the 75% component of the plan that will measure the Average Distributable Cash Flow for the three-year measurement period. The target threshold for each fiscal year’s award cycle will represent a level of Average Distributable Cash Flow that reflects approximately 5% growth compared to a baseline distributable cash flow, or some other target threshold, as determined by the Committee. The following table illustrates the potential payout percentages associated with various levels of Average Distributable Cash Flow for the three-year measurement period of the fiscal 2021 award:

62
Average Distributable Cash Flow Performance Scale for the Three-Year
Measurement Period (thousands)
Payout Percentage Maximum Threshold 215,000 150% 213,000 145% 211,000 140% 209,000 135% 207,000 130% 205,000 125% 203,000 120% 201,000 115% 199,000 110% 197,000 105% Target Threshold 195,000 100% 191,000 95% 187,000 90% 183,000 85% 179,000 80% 175,000 75% 171,000 70% 167,000 65% 163,000 60% 159,000 55% 155,000 50%
The Committee will also establish specific Operating and Strategic Objectives for the 25% component of the plan that will measure
the Partnership’s performance in achieving such Operating/Strategic Objectives for the three-year measurement period. At the end of the three-year measurement period, the Committee will evaluate the Partnership’s performance compared to the Operating/Strategic Objectives set at the beginning of the three-year measurement period to determine the amount, if any, of the Operating/Strategic Objectives Component to award. The following are the Operating/Strategic Objectives set by the Committee for the fiscal 2021 award:
1. Achievement of Target Consolidated Leverage Ratio between 3.5x and 4.0x 2. Customer Base Growth 3. Advancements in the Partnership’s Go Green Initiative and Other Strategic Growth Initiatives
The Committee will use its discretion regarding how much weight to place on any one, or several, of the Operating/Strategic Objectives in determining the amount to award, if any, of the 25% Operating/Strategic Objectives Component as follows:
Percentage of
Operating/Strategic Objectives Component Earned
Maximum Threshold 150% 125% Target Threshold 100% 75% Minimum Threshold 50%
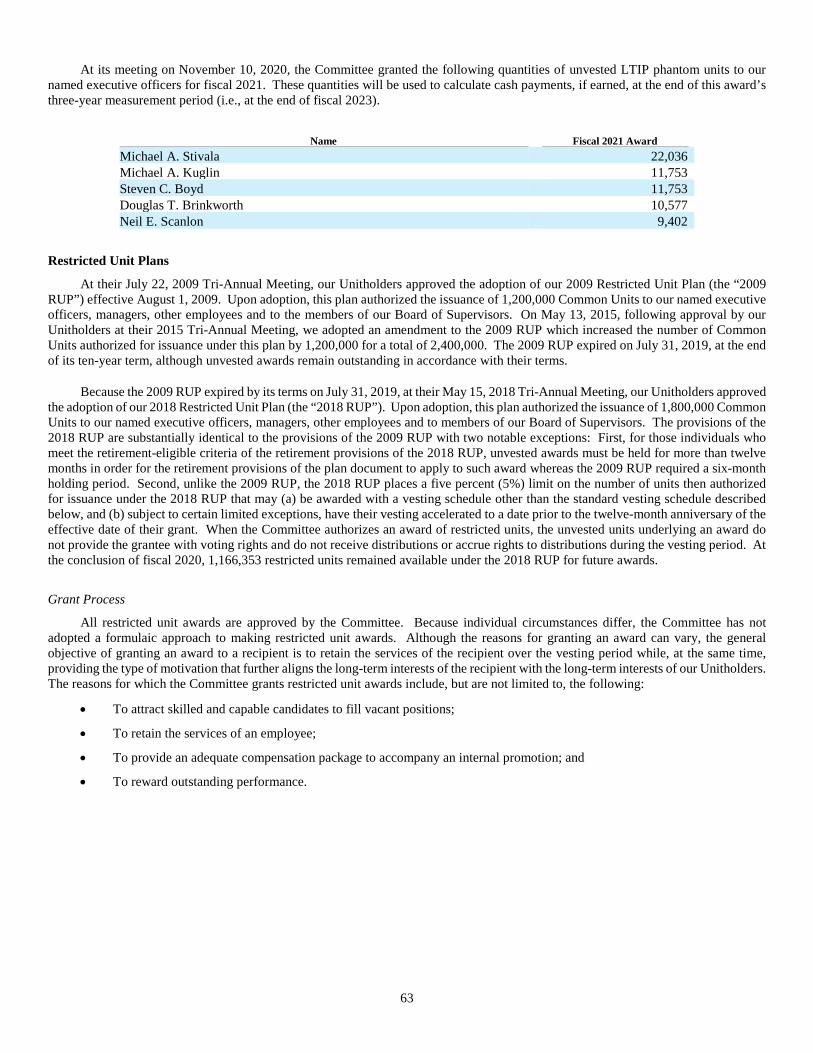
63
At its meeting on November 10, 2020, the Committee granted the following quantities of unvested LTIP phantom units to our named executive officers for fiscal 2021. These quantities will be used to calculate cash payments, if earned, at the end of this award’s three-year measurement period (i.e., at the end of fiscal 2023).
Name Fiscal 2021 Award
Michael A. Stivala 22,036 Michael A. Kuglin 11,753 Steven C. Boyd 11,753 Douglas T. Brinkworth 10,577 Neil E. Scanlon 9,402
Restricted Unit Plans
At their July 22, 2009 Tri-Annual Meeting, our Unitholders approved the adoption of our 2009 Restricted Unit Plan (the “2009 RUP”) effective August 1, 2009. Upon adoption, this plan authorized the issuance of 1,200,000 Common Units to our named executive officers, managers, other employees and to the members of our Board of Supervisors. On May 13, 2015, following approval by our Unitholders at their 2015 Tri-Annual Meeting, we adopted an amendment to the 2009 RUP which increased the number of Common Units authorized for issuance under this plan by 1,200,000 for a total of 2,400,000. The 2009 RUP expired on July 31, 2019, at the end of its ten-year term, although unvested awards remain outstanding in accordance with their terms.
Because the 2009 RUP expired by its terms on July 31, 2019, at their May 15, 2018 Tri-Annual Meeting, our Unitholders approved the adoption of our 2018 Restricted Unit Plan (the “2018 RUP”). Upon adoption, this plan authorized the issuance of 1,800,000 Common Units to our named executive officers, managers, other employees and to members of our Board of Supervisors. The provisions of the 2018 RUP are substantially identical to the provisions of the 2009 RUP with two notable exceptions: First, for those individuals who meet the retirement-eligible criteria of the retirement provisions of the 2018 RUP, unvested awards must be held for more than twelve months in order for the retirement provisions of the plan document to apply to such award whereas the 2009 RUP required a six-month holding period. Second, unlike the 2009 RUP, the 2018 RUP places a five percent (5%) limit on the number of units then authorized for issuance under the 2018 RUP that may (a) be awarded with a vesting schedule other than the standard vesting schedule described below, and (b) subject to certain limited exceptions, have their vesting accelerated to a date prior to the twelve-month anniversary of the effective date of their grant. When the Committee authorizes an award of restricted units, the unvested units underlying an award do not provide the grantee with voting rights and do not receive distributions or accrue rights to distributions during the vesting period. At the conclusion of fiscal 2020, 1,166,353 restricted units remained available under the 2018 RUP for future awards.
Grant Process
All restricted unit awards are approved by the Committee. Because individual circumstances differ, the Committee has not adopted a formulaic approach to making restricted unit awards. Although the reasons for granting an award can vary, the general objective of granting an award to a recipient is to retain the services of the recipient over the vesting period while, at the same time, providing the type of motivation that further aligns the long-term interests of the recipient with the long-term interests of our Unitholders. The reasons for which the Committee grants restricted unit awards include, but are not limited to, the following:
• To attract skilled and capable candidates to fill vacant positions;
• To retain the services of an employee;
• To provide an adequate compensation package to accompany an internal promotion; and
• To reward outstanding performance.
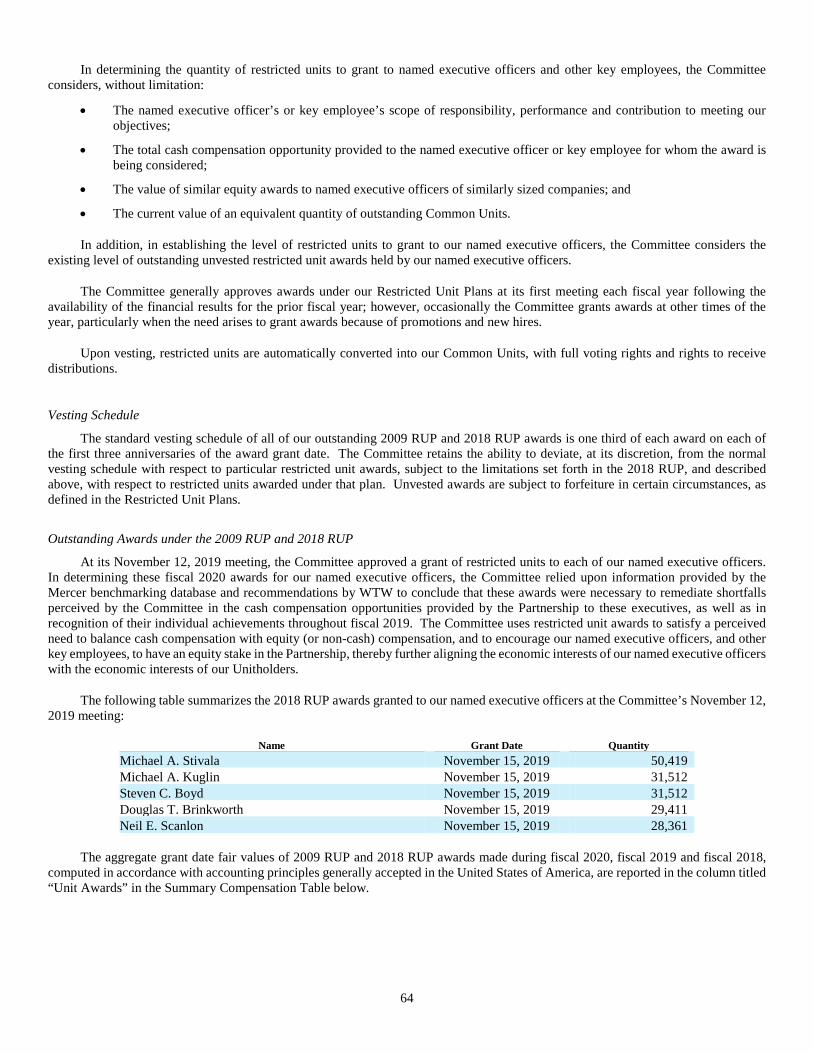
64
In determining the quantity of restricted units to grant to named executive officers and other key employees, the Committee considers, without limitation:
• The named executive officer’s or key employee’s scope of responsibility, performance and contribution to meeting our objectives;
• The total cash compensation opportunity provided to the named executive officer or key employee for whom the award is being considered;
• The value of similar equity awards to named executive officers of similarly sized companies; and
• The current value of an equivalent quantity of outstanding Common Units.
In addition, in establishing the level of restricted units to grant to our named executive officers, the Committee considers the existing level of outstanding unvested restricted unit awards held by our named executive officers.
The Committee generally approves awards under our Restricted Unit Plans at its first meeting each fiscal year following the availability of the financial results for the prior fiscal year; however, occasionally the Committee grants awards at other times of the year, particularly when the need arises to grant awards because of promotions and new hires.
Upon vesting, restricted units are automatically converted into our Common Units, with full voting rights and rights to receive distributions.
Vesting Schedule
The standard vesting schedule of all of our outstanding 2009 RUP and 2018 RUP awards is one third of each award on each of the first three anniversaries of the award grant date. The Committee retains the ability to deviate, at its discretion, from the normal vesting schedule with respect to particular restricted unit awards, subject to the limitations set forth in the 2018 RUP, and described above, with respect to restricted units awarded under that plan. Unvested awards are subject to forfeiture in certain circumstances, as defined in the Restricted Unit Plans.
Outstanding Awards under the 2009 RUP and 2018 RUP
At its November 12, 2019 meeting, the Committee approved a grant of restricted units to each of our named executive officers. In determining these fiscal 2020 awards for our named executive officers, the Committee relied upon information provided by the Mercer benchmarking database and recommendations by WTW to conclude that these awards were necessary to remediate shortfalls perceived by the Committee in the cash compensation opportunities provided by the Partnership to these executives, as well as in recognition of their individual achievements throughout fiscal 2019. The Committee uses restricted unit awards to satisfy a perceived need to balance cash compensation with equity (or non-cash) compensation, and to encourage our named executive officers, and other key employees, to have an equity stake in the Partnership, thereby further aligning the economic interests of our named executive officers with the economic interests of our Unitholders.
The following table summarizes the 2018 RUP awards granted to our named executive officers at the Committee’s November 12, 2019 meeting:
Name Grant Date Quantity
Michael A. Stivala November 15, 2019 50,419 Michael A. Kuglin November 15, 2019 31,512 Steven C. Boyd November 15, 2019 31,512 Douglas T. Brinkworth November 15, 2019 29,411 Neil E. Scanlon November 15, 2019 28,361
The aggregate grant date fair values of 2009 RUP and 2018 RUP awards made during fiscal 2020, fiscal 2019 and fiscal 2018, computed in accordance with accounting principles generally accepted in the United States of America, are reported in the column titled “Unit Awards” in the Summary Compensation Table below.

65
Retirement Provisions
The 2009 RUP and the 2018 RUP contain retirement provisions that provide for the issuance of Common Units (six months and one day after the retirement date of qualifying participants) relating to unvested awards held by a retiring participant who meets all three of the following conditions on his or her retirement date:
• The unvested award has been held by the grantee for at least six months under the 2009 RUP and at least one year under the 2018 RUP;
• The grantee is age 55 or older; and
• The grantee has worked for us, or one of our predecessors, for at least 10 years.
Mr. Boyd, Mr. Brinkworth and Mr. Scanlon are our only named executive officers to whom these retirement provisions applied at the end of fiscal 2020.
At its November 10, 2020 meeting, the Committee granted the following 2018 RUP awards to our named executive officers:
Name Grant Date Quantity Michael A. Stivala November 15, 2020 72,287 Michael A. Kuglin November 15, 2020 45,180 Steven C. Boyd November 15, 2020 45,180 Douglas T. Brinkworth November 15, 2020 42,168 Neil E. Scanlon November 15, 2020 42,168
Distribution Equivalent Rights Plan
In January 2017, the Committee adopted a Distribution Equivalent Rights Plan (the “DER Plan”) as a component of executive compensation based on data provided by WTW that indicated a DER Plan aligned with industry norms (77% of other publicly traded partnerships and 92% of a sample of broader energy/utility companies, at that time, provided such plans to their executives in one form or another). The Committee adopted the DER Plan because the cash compensation resulting from the DER Plan would help, in certain instances, to lessen the gap between the total compensation paid to some of our named executive officers and the benchmark compensation data. Additionally, the Committee intends for the DER Plan to provide our named executive officers with a reasonable balance between performance-based and non-performance based cash opportunities and to assist our named executive officers to obtain funds to settle the taxes on equity-based compensation (i.e., taxes generated when restricted units vest). Most importantly, the Committee believes that this form of compensation further aligns the interests of our named executive officers with the interests of our Unitholders because it provides an incentive for the types of behaviors that lead to distribution sustainability and growth.
The executive officers of the Partnership (as defined in the DER Plan) are eligible for a distribution equivalent right (“DER”) award under the DER Plan at the discretion of the Committee. Once awarded, a DER entitles the grantee to a cash payment each time our Board of Supervisors declares a cash distribution on our Common Units, but only after such distribution is paid to the Unitholders, which cash payment is equal to the amount calculated by multiplying (A) the number of unvested restricted units that have been previously awarded to the grantee under the Restricted Unit Plans and which are held by the grantee on the record date of the distribution, by (B) the amount of the declared distribution per Common Unit. The form of award agreement under the DER Plan expressly provides that the Committee retains the right to cancel, in whole or in part, any DER after its award, with or without cause. DERs also automatically terminate on the first to occur of: (a) the termination of the grantee’s employment with us or our subsidiary (except for those situations when such termination does not result in the forfeiture of the unvested restricted units then held by the grantee), (b) the vesting, termination or forfeiture of all unvested restricted units then held by the grantee, or (c) the grantee becoming employed by us or our subsidiary in a role other than as an executive officer. Pursuant to the terms of the DER Plan, DERs, and cash payments thereunder, are considered to be “incentive compensation” for purposes of our incentive compensation recoupment policy described above.
At its January 17, 2017 meeting, the Committee granted DERs under the DER Plan to all of our named executive officers. The following table summarizes the DER payments made to our named executive officers during fiscal 2020:
Name Payment Amount Michael A. Stivala $ 193,357 Michael A. Kuglin $ 120,020 Steven C. Boyd $ 119,191 Douglas T. Brinkworth $ 113,429 Neil E. Scanlon $ 108,369

66
The DER Plan payments made to our named executive officers during fiscal 2020, fiscal 2019, and fiscal 2018 are reported in the column titled “Non-Equity Incentive Plan Compensation” in the Summary Compensation Table below.
Benefits and Perquisites
Pension Plan
We sponsor a noncontributory defined benefit pension plan that was originally designed to cover all of our eligible employees who met certain criteria relative to age and length of service. Effective January 1, 1998, we amended the plan in order to provide for a cash balance formula rather than the final average pay formula that was in effect prior to January 1, 1998 (the “Cash Balance Plan”). The cash balance formula is designed to evenly spread the growth of a participant’s earned retirement benefit throughout his or her career rather than the final average pay formula, under which a greater portion of a participant’s benefits were earned toward the latter stages of his or her career. Effective January 1, 2000, we amended the Cash Balance Plan to limit participation in this plan to existing participants and no longer admit new participants to the plan. On January 1, 2003, we amended the Cash Balance Plan to cease future service and pay-based credits on behalf of the participants and, from that point on, participants’ benefits have increased only because of interest credits. Of our named executive officers, only Mr. Boyd, Mr. Brinkworth and Mr. Scanlon participate in the Cash Balance Plan.
The changes in the actuarial value, if any, relative to Mr. Boyd’s, Mr. Brinkworth’s and Mr. Scanlon’s participation in the Cash Balance Plan during fiscal 2020, fiscal 2019 and fiscal 2018 are reported in the column titled “Change in Pension Value and Nonqualified Deferred Compensation Earnings” in the Summary Compensation Table below.
Deferred Compensation
All employees, including our named executive officers, who satisfy certain service requirements, are eligible to participate in our IRC Section 401(k) Plan, which we refer to as the “401(k) Plan.” Under the 401(k) Plan, participants may defer a portion of their eligible cash compensation up to the limits established by law. We offer the 401(k) Plan to attract and retain talented employees by providing them with a tax-advantaged opportunity to save for retirement.
For fiscal 2020, fiscal 2019 and fiscal 2018, all of our named executive officers participated in the 401(k) Plan. The benefits
provided to our named executive officers under the 401(k) Plan are provided on the same basis as to other exempt employees of the Partnership. Amounts deferred by our named executive officers under the 401(k) Plan during fiscal 2020, fiscal 2019 and fiscal 2018 are included in the column titled “Salary” in the Summary Compensation Table below.
Our 401(k) Plan provides a match of $0.50 for every dollar contributed up to 6% of each participant’s total base pay, up to a maximum compensation limit of $285,000 for calendar year 2020, $280,000 for calendar year 2019 and $275,000 for calendar year 2018. If, however, Actual Adjusted EBITDA is 115% or more than Budgeted EBITDA, each participant will receive a match of $1 for every dollar contributed up to 6% of each participant’s total base pay, up to the applicable maximum compensation limits. For fiscal 2020, fiscal 2019 and fiscal 2018, the performance conditions that provide for more than the $0.50 match were not met.
The matching contributions made on behalf of our named executive officers for fiscal 2020, fiscal 2019 and fiscal 2018 are reported in the column titled “All Other Compensation” in the Summary Compensation Table below.
Other Benefits
Each named executive officer is eligible to participate in all of our other employee benefit plans, such as the medical, dental, group life insurance and disability plans, on the same basis as other exempt employees. These benefit plans are offered to attract and retain talented employees by providing them with competitive benefits.
There are no post-termination or other special rights provided to any named executive officer to participate in these benefit programs other than the right to participate in such plans for a fixed period of time following termination of employment, on the same basis as is provided to other exempt employees, as required by law.
The costs of all such benefits incurred on behalf of our named executive officers in fiscal 2020, fiscal 2019 and fiscal 2018 are reported in the column titled “All Other Compensation” in the Summary Compensation Table below.
Perquisites
Perquisites represent a minor component of our executive officers’ compensation. Each of our named executive officers is eligible for tax preparation services, a company-provided vehicle, and an annual physical.

67
The following table summarizes both the value and the utilization of these perquisites by our named executive officers in fiscal 2020.
Name
Tax Preparation
Services
Employer Provided Vehicle
Physical Michael A. Stivala $ — $ 18,648 $ 3,150 Michael A. Kuglin $ — $ 17,594 $ 3,150 Steven C. Boyd $ 4,000 $ 8,563 $ — Douglas T. Brinkworth $ 3,200 $ 16,936 $ — Neil E. Scanlon $ 3,200 $ 17,131 $ 3,150
Perquisite-related costs for fiscal 2020, fiscal 2019 and fiscal 2018 are reported in the column titled “All Other Compensation” in the Summary Compensation Table below.
Severance Benefits
We believe that, in most cases, employees should be paid reasonable severance benefits. Therefore, it is the general policy of the Partnership to provide named executive officers who are terminated by us without cause or who choose to terminate their employment with us for good reason with a severance payment equal to, at a minimum, one year’s base salary, unless circumstances dictate otherwise. This policy was adopted because it may be difficult for former named executive officers to find comparable employment within a short period of time. However, depending upon individual facts and circumstances, particularly the severed employee’s tenure with us and the employee’s level, the Partnership may make exceptions to this general policy.
Change of Control
Our executive officers and other key employees have built the Partnership into the successful enterprise that it is today; therefore, we believe that it is important to protect them in the event of a change of control. Further, it is our belief that the interests of our Unitholders will be best served if the interests of our executive officers are aligned with them, and that providing change of control benefits should eliminate, or at least reduce, the reluctance of our executive officers to pursue potential change of control transactions that may be in the best interests of our Unitholders. Additionally, we believe that the severance benefits provided to our executive officers and to our key employees are consistent with market practice and appropriate, both because these benefits are an inducement to accepting employment, and because the executive officers are subject to non-competition and non-solicitation covenants for a period following termination of employment. Therefore, our executive officers and other key employees are provided with severance protection following a change of control, which we refer to as the “Severance Protection Plan.” During fiscal 2020, our Executive Special Severance Plan covered all of our executive officers, including our named executive officers.
Based on the results of the benchmarking study performed by WTW, at its November 12, 2019 meeting, the Committee approved the Executive Special Severance Plan, which became effective January 1, 2020. The Executive Special Severance Plan is intended to provide double-trigger severance benefits to our named executive officers and certain other senior employees of the Partnership in the event that their employment is terminated by us without “cause” or by the participant for “good reason” (as defined in the Executive Special Severance Plan) during the six-month period prior to, or upon or within the 24-month period following, a change of control (defined as described below). Under the Executive Special Severance Plan, a participant is entitled to receive a lump sum cash payment equal to one-fifty-second (1/52nd) of the sum of the participant’s base salary plus target bonus, multiplied by the number of severance weeks available to the participant. The number of severance weeks for each of our named executive officers is 156. In addition to cash severance, participants are also entitled to receive continued health coverage, a pro-rata bonus for the year of termination and outplacement services. Participants must execute a release of claims, inclusive of an 18-month non-competition, non-solicitation and non-disparagement covenant as a condition of receiving severance payments under the plans.
In addition, under the Restricted Unit Plans, upon a change of control, without regard to whether a participant’s employment is terminated, all unvested awards granted under these plans will vest immediately and become distributable to the participants. In addition, under our 2014 and 2021 Long-Term Incentive Plans, upon a change of control and without regard to whether a participant’s employment is terminated, all outstanding, unvested phantom unit awards will vest immediately as if the three-year measurement period for each outstanding award concluded on the date the change of control occurred. Under the 2014 and 2021 Long-Term Incentive Plans, an amount equal to the cash value of 150% of a participant’s unvested phantom units under the respective LTIP, plus a sum equal to 150% of a participant’s unvested LTIP units multiplied by an amount equal to the cumulative, per-Common Unit distribution from the beginning of an unvested award’s three-year measurement period through the date on which a change of control occurred, would become payable to the participants.
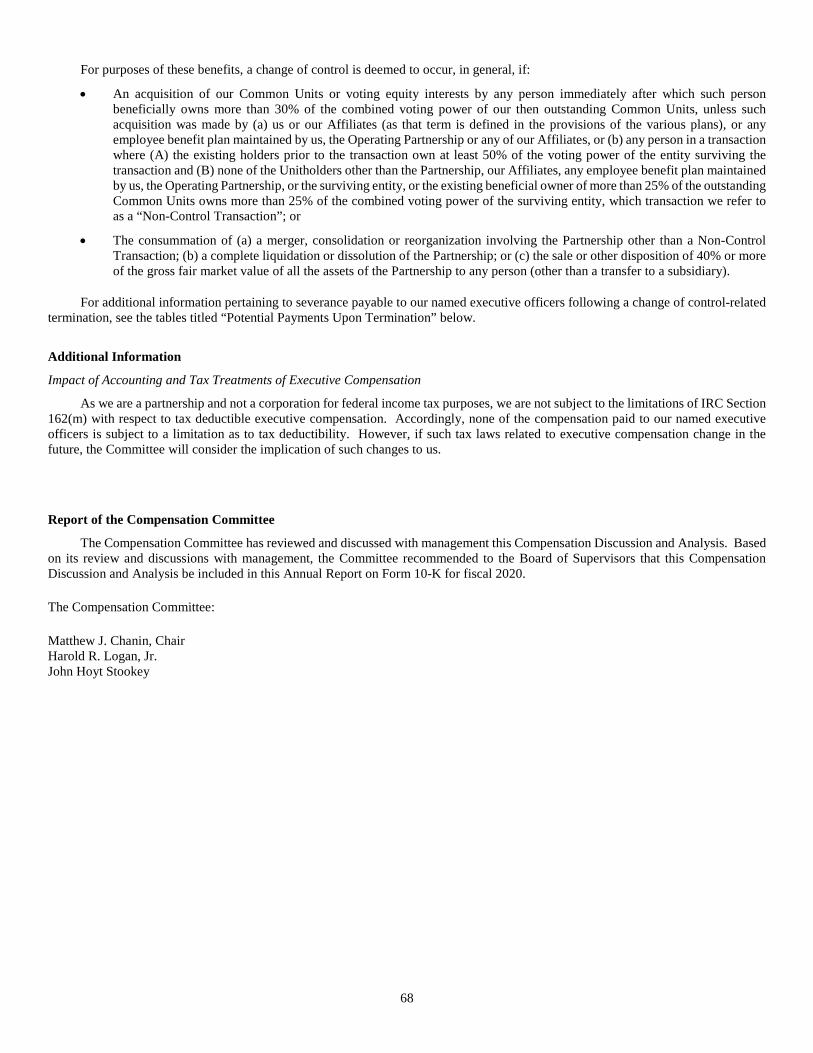
68
For purposes of these benefits, a change of control is deemed to occur, in general, if:
• An acquisition of our Common Units or voting equity interests by any person immediately after which such person beneficially owns more than 30% of the combined voting power of our then outstanding Common Units, unless such acquisition was made by (a) us or our Affiliates (as that term is defined in the provisions of the various plans), or any employee benefit plan maintained by us, the Operating Partnership or any of our Affiliates, or (b) any person in a transaction where (A) the existing holders prior to the transaction own at least 50% of the voting power of the entity surviving the transaction and (B) none of the Unitholders other than the Partnership, our Affiliates, any employee benefit plan maintained by us, the Operating Partnership, or the surviving entity, or the existing beneficial owner of more than 25% of the outstanding Common Units owns more than 25% of the combined voting power of the surviving entity, which transaction we refer to as a “Non-Control Transaction”; or
• The consummation of (a) a merger, consolidation or reorganization involving the Partnership other than a Non-Control Transaction; (b) a complete liquidation or dissolution of the Partnership; or (c) the sale or other disposition of 40% or more of the gross fair market value of all the assets of the Partnership to any person (other than a transfer to a subsidiary).
For additional information pertaining to severance payable to our named executive officers following a change of control-related termination, see the tables titled “Potential Payments Upon Termination” below.
Additional Information
Impact of Accounting and Tax Treatments of Executive Compensation
As we are a partnership and not a corporation for federal income tax purposes, we are not subject to the limitations of IRC Section 162(m) with respect to tax deductible executive compensation. Accordingly, none of the compensation paid to our named executive officers is subject to a limitation as to tax deductibility. However, if such tax laws related to executive compensation change in the future, the Committee will consider the implication of such changes to us.
Report of the Compensation Committee
The Compensation Committee has reviewed and discussed with management this Compensation Discussion and Analysis. Based on its review and discussions with management, the Committee recommended to the Board of Supervisors that this Compensation Discussion and Analysis be included in this Annual Report on Form 10-K for fiscal 2020. The Compensation Committee: Matthew J. Chanin, Chair Harold R. Logan, Jr. John Hoyt Stookey

69
ADDITIONAL INFORMATION REGARDING EXECUTIVE COMPENSATION Summary Compensation Table
The following table sets forth certain information concerning the compensation of each named executive officer during the fiscal years ended September 26, 2020, September 28, 2019 and September 29, 2018:
Name
Year
Salary (1)
Bonus (2)
Unit Awards (3)
Non-Equity Incentive Plan
Compensation (4)
Change in Pension Value
and Nonqualified
Deferred Compensation Earnings (5)
All Other Compensation (6)
Total
(a) (b) (c) (d) (e) (g) (h) (i) (j) Michael A. Stivala 2020 $ 600,000 $ — $ 1,308,038 $ 655,357 $ — $ 56,965 $ 2,620,360 President and Chief Executive Officer 2019 $ 550,000 $ — $ 1,228,007 $ 708,322 $ — $ 53,111 $ 2,539,440 2018 $ 550,000 $ — $ 1,112,369 $ 758,438 $ — $ 57,777 $ 2,478,584 Michael A. Kuglin 2020 $ 400,000 $ — $ 781,676 $ 366,420 $ — $ 53,430 $ 1,601,526 Chief Financial Officer and 2019 $ 365,000 $ — $ 704,002 $ 394,245 $ — $ 51,127 $ 1,514,374 Chief Accounting Officer 2018 $ 365,000 $ — $ 699,628 $ 417,934 $ — $ 50,287 $ 1,532,849 Steven C. Boyd 2020 $ 400,000 $ — $ 781,676 $ 365,591 $ 50,391 $ 46,952 $ 1,644,610 Chief Operating Officer 2019 $ 365,000 $ — $ 704,002 $ 390,101 $ 53,528 $ 43,890 $ 1,556,521 2018 $ 365,000 $ — $ 699,628 $ 411,199 $ — $ 46,674 $ 1,522,501 Douglas Brinkworth 2020 $ 360,000 $ — $ 722,608 $ 335,189 $ 27,969 $ 54,217 $ 1,499,983 Senior Vice President: 2019 $ 335,000 $ — $ 668,546 $ 363,843 $ 29,507 $ 52,212 $ 1,449,108 Product Supply, Purchasing and Logistics 2018 $ 335,000 $ — $ 665,197 $ 382,815 $ — $ 54,897 $ 1,437,909 Neil E. Scanlon 2020 $ 320,000 $ — $ 682,652 $ 305,489 $ 28,099 $ 57,254 $ 1,393,494 Senior Vice President, 2019 $ 300,000 $ — $ 630,457 $ 332,075 $ 29,527 $ 51,675 $ 1,343,734 Information Services 2018 $ 300,000 $ — $ 609,246 $ 347,521 $ — $ 53,469 $ 1,310,236 (1) Includes amounts deferred by named executive officers as contributions to the 401(k) Plan. For more information on the relationship between salaries and other
cash compensation (i.e., annual cash bonuses, LTIP awards, and DER Plan payments), refer to the subheading titled “Components of Compensation” in the “Compensation Discussion and Analysis” above.
(2) This column is reserved for discretionary cash bonuses that are not based on any performance criteria. During fiscal years 2020, 2019 and 2018, the Committee did not provide our named executive officers with non-performance related bonus payments. For more information, refer to the subheading titled “Annual Cash Bonus Plan” in the “Compensation Discussion and Analysis” above.
(3) The amounts reported in this column represent the aggregate grant date fair value, computed in accordance with ASC Topic 718, of restricted unit awards made
during fiscal years 2020, 2019 and 2018, as well as the aggregate grant date fair value of awards made in fiscal years 2020, 2019, and 2018 under the LTIP, based on the target outcome with respect to satisfaction of the performance conditions. These amounts were calculated in accordance with GAAP for financial reporting purposes based on the assumptions described in Note 11 of the Notes to Consolidated Financial Statements included in this Annual Report, but disregarding estimates of forfeiture. For the LTIP awards granted in fiscal 2020, assuming the highest level of performance conditions were achieved, the amounts for Messrs. Stivala, Kuglin, Boyd, Brinkworth and Scanlon would be $586,620, $312,868, $312,868, $281,578, and $250,288, respectively. Because the amounts of actual LTIP payments are predicated on the satisfaction of performance conditions, these amounts are not indicative of payments our named executive officers will ultimately receive under the LTIP at the end of the applicable measurement period. The actual payments earned by our named executive officers for the 2018 LTIP awards (the measurement period of which concluded at the end of fiscal 2020) are reported in the “Equity Vested Table for 2020” below. The specific details regarding these plans are provided in the preceding “Compensation Discussion and Analysis” under the subheadings “Restricted Unit Plan” and “Long-Term Incentive Plan.” The breakdown for each plan with respect to each named executive officer is as follows:
Plan Name Mr. Stivala Mr. Kuglin Mr. Boyd Mr. Brinkworth Mr. Scanlon
2020 RUP $ 916,958 $ 573,098 $ 573,098 $ 534,890 $ 515,794 LTIP 391,080 208,578 208,578 187,718 166,858
Total $ 1,308,038 $ 781,676 $ 781,676 $ 722,608 $ 682,652 2019
RUP $ 867,125 $ 512,404 $ 512,404 $ 492,700 $ 472,981 LTIP 360,882 191,598 191,598 175,846 157,476
Total $ 1,228,007 $ 704,002 $ 704,002 $ 668,546 $ 630,457 2018
RUP $ 756,866 $ 510,889 $ 510,889 $ 491,971 $ 454,117 LTIP 355,503 188,739 188,739 173,226 155,129
Total $ 1,112,369 $ 699,628 $ 699,628 $ 665,197 $ 609,246 (4) The fiscal 2020, fiscal 2019 and fiscal 2018 breakdowns of each named executive officer’s earnings under the annual cash bonus plan and the DER Plan are
presented in the table that follows. For more information regarding the performance measures of the annual cash bonus plan, please refer to the subheading titled “Annual Cash Bonus Plan” and “Distribution Equivalent Rights Plan” in the “Compensation Discussion and Analysis.”

70
2020 Mr. Stivala Mr. Kuglin Mr. Boyd Mr. Brinkworth Mr. Scanlon
Annual Cash Bonus $ 462,000 $ 246,400 $ 246,400 $ 221,760 $ 197,120 DER Payments 193,357 120,020 119,191 113,429 108,369
Total $ 655,357 $ 366,420 $ 365,591 $ 335,189 $ 305,489
2019 Mr. Stivala Mr. Kuglin Mr. Boyd Mr. Brinkworth Mr. Scanlon Annual Cash Bonus $ 517,000 $ 274,480 $ 274,480 $ 251,920 $ 225,600 DER Payments 191,322 119,765 115,621 111,923 106,475
Total $ 708,322 $ 394,245 $ 390,101 $ 363,843 $ 332,075
2018 Mr. Stivala Mr. Kuglin Mr. Boyd Mr. Brinkworth Mr. Scanlon Annual Cash Bonus $ 610,500 $ 324,120 $ 324,120 $ 297,480 $ 266,400 DER Payments 147,938 93,814 87,079 85,335 81,121
Total $ 758,438 $ 417,934 $ 411,199 $ 382,815 $ 347,521 (5) Nothing was reported in this column for fiscal 2018 because there was a decline in value of the participating named executive officers’ Cash Balance Plan holdings.
The declines in pension values for fiscal 2018 were as follows: ($12,346), ($5,376) and ($3,969) for Messrs. Boyd, Brinkworth and Scanlon, respectively. Mr. Stivala and Mr. Kuglin do not participate in the Cash Balance Plan.
(6) The amounts reported in this column consist of the following:
Fiscal 2020 Type of Compensation Mr. Stivala Mr. Kuglin Mr. Boyd Mr. Brinkworth Mr. Scanlon
401(k) Match $ 8,550 $ 8,550 $ 8,550 $ 8,550 $ 8,550 Value of Annual Physical Examination 3,150 3,150 — — 3,150 Value of Partnership Provided Vehicles 18,648 17,594 8,563 16,936 17,131 Tax Preparation Services — — 4,000 3,200 3,200 Cash Balance Plan Administrative Fees — — 762 762 762 Insurance Premiums 26,617 24,136 25,077 24,769 24,461
Total $ 56,965 $ 53,430 $ 46,952 $ 54,217 $ 57,254
Fiscal 2019 Type of Compensation Mr. Stivala Mr. Kuglin Mr. Boyd Mr. Brinkworth Mr. Scanlon
401(k) Match $ 8,400 $ 8,400 $ 8,400 $ 8,400 $ 8,400 Value of Annual Physical Examination — 2,950 — 2,950 — Value of Partnership Provided Vehicles 19,783 17,054 7,761 13,670 16,560 Tax Preparation Services — — 3,500 3,200 3,000 Cash Balance Plan Administrative Fees — — 762 762 762 Insurance Premiums 24,928 22,723 23,467 23,230 22,953
Total $ 53,111 $ 51,127 $ 43,890 $ 52,212 $ 51,675
Fiscal 2018 Type of Compensation Mr. Stivala Mr. Kuglin Mr. Boyd Mr. Brinkworth Mr. Scanlon
401(k) Match $ 8,250 $ 8,250 $ 8,250 $ 8,250 $ 8,250 Value of Annual Physical Examination 2,950 — — 2,950 2,950 Value of Partnership Provided Vehicles 17,410 16,138 7,772 14,115 13,652 Tax Preparation Services — — 3,500 3,000 2,700 Cash Balance Plan Administrative Fees — — 1,500 1,500 1,500 Insurance Premiums 29,167 25,899 25,652 25,082 24,417
Total $ 57,777 $ 50,287 $ 46,674 $ 54,897 $ 53,469
Note: Column (f) was omitted from the Summary Compensation Table because we do not grant options to our employees.

71
Grants of Plan Based Awards Table for Fiscal 2020
The following table sets forth certain information concerning grants of awards made to each named executive officer during the fiscal year ended September 26, 2020:
Plan Grant Approval
LTIP Units
Underlying Equity
Incentive Plan
Awards
Estimated Future Payments Under
Non-Equity Incentive Plan Awards
Estimated Future Payments Under
Equity Incentive Plan Awards
All Other Stock
Awards: Number
of Shares
of Stock
Grant Date Fair Value of
Stock and Option
Name Name Date Date (LTIP) (5) Target Maximum Target Maximum or Units Awards (6) (a) (b) (d) (e) (g) (h) (i) (l)
Michael A. Stivala RUP (1) 15 Nov 19 12 Nov 19 50,419 $ 916,958 Bonus (2) 29 Sep 19 12 Nov 19 $ 600,000 $ 720,000 LTIP (3) 29 Sep 19 12 Nov 19 12,650 $ 391,080 $ 586,620
DER (4) 17 Jan 17 17 Jan 17 $ 193,357 Michael A. Kuglin RUP (1) 15 Nov 19 12 Nov 19 31,512 $ 573,098 Bonus (2) 29 Sep 19 12 Nov 19 $ 320,000 $ 384,000 LTIP (3) 29 Sep 19 12 Nov 19 6,747 $ 208,578 $ 312,867 DER (4) 17 Jan 17 17 Jan 17 $ 120,020 Steven C. Boyd RUP (1) 15 Nov 19 12 Nov 19 31,512 $ 573,098 Bonus (2) 29 Sep 19 12 Nov 19 $ 320,000 $ 384,000 LTIP (3) 29 Sep 19 12 Nov 19 6,747 $ 208,578 $ 312,867
DER (4) 17 Jan 17 17 Jan 17 $ 119,191 Douglas T. Brinkworth RUP (1) 15 Nov 19 12 Nov 19 29,411 $ 534,890 Bonus (2) 29 Sep 19 12 Nov 19 $ 288,000 $ 345,600 LTIP (3) 29 Sep 19 12 Nov 19 6,072 $ 187,718 $ 281,577 DER (4) 17 Jan 17 17 Jan 17 $ 113,429 Neil E. Scanlon RUP (1) 15 Nov 19 12 Nov 19 28,361 $ 515,794 Bonus (2) 29 Sep 19 12 Nov 19 $ 256,000 $ 307,200 LTIP (3) 29 Sep 19 12 Nov 19 5,397 $ 166,858 $ 250,287
DER (4) 17 Jan 17 17 Jan 17 $ 108,369 (1) The quantity reported on these lines represents awards granted under 2018 RUP. 2018 RUP awards vest as follows: one third of the award on the first anniversary
of the grant date, one third of the award on the second anniversary of the grant date, and one third of the award on the third anniversary of the grant date (subject in each case to continued service through each such date). Under 2018 RUP, if a recipient has held an unvested award for at least one year, is 55 years or older, and has worked for the Partnership for at least ten years, an award held by such participant will vest six months and one day following such participant’s retirement if the participant retires prior to the conclusion of the normal vesting schedule, unless the Committee exercises its authority to alter the applicability of the plan’s retirement provisions in regard to a particular award. Mr. Boyd, Mr. Brinkworth and Mr. Scanlon are the only named executive officers who satisfy the age and tenure criteria of the Restricted Unit Plans. A discussion of the general terms of the 2009 RUP (which has expired and under which no additional awards can be granted) and 2018 RUP, and the facts and circumstances considered by the Committee in authorizing these fiscal 2020 awards to our named executive officers, is included in the “Compensation Discussion and Analysis” under the subheading “Restricted Unit Plans.”
(2) Amounts reported on these lines are the targeted and maximum annual cash bonus compensation potential for each named executive officer under the annual cash
bonus plan as described in the “Compensation Discussion and Analysis” under the subheading “Annual Cash Bonus Plan.” Actual amounts earned by the named executive officers for fiscal 2020 were equal to 77% of the “Target” amounts reported on this line. Column (c) (“Threshold $”) was omitted because the annual cash bonus plan does not provide for a guaranteed minimum cash payment. Because 77% of the “Target” awards were earned by our named executive officers during fiscal 2020, 77% of the “Target” amounts reported under column (d) have been reported in the Summary Compensation Table above.
(3) The LTIP is a phantom unit plan. Payments, if earned, are based on a combination of (i) the fair market value of our Common Units at the end of a three-year
measurement period, which, for purposes of the LTIP, is the average of the closing prices for the twenty business days preceding the conclusion of the three-year measurement period, and (ii) cash equal to the distributions that would have inured to the same quantity of outstanding Common Units during the same three-year measurement period. The fiscal 2020 award “Target” and “Maximum” amounts are estimates based upon (i) the fair market value (the average of the closing prices of our Common Units for the twenty business days preceding the first day of fiscal 2020) of our Common Units at the beginning of fiscal 2020, and (ii) the estimated distributions over the course of the award’s three-year measurement period at the then current annualized distribution rate of $2.40 per Common Unit. Column (f) (“Threshold”) was omitted because the LTIP does not provide for a guaranteed minimum cash payment. The “Target” amount represents a hypothetical payment at 100% of target and the “Maximum” amount represents a hypothetical payment at 150% of target. Detailed descriptions of the plan and the calculation of awards are included in the “Compensation Discussion and Analysis” under the subheading “Long-Term Incentive Plan.”
(4) Amounts reported on these lines represent DER Plan payments made during the fiscal year. Detailed descriptions of the DER Plan and the calculation of the
payments are included in the “Compensation Discussion and Analysis” under the subheading “Distribution Equivalent Rights Plan.”

72
(5) This column is frequently used when non-equity incentive plan awards are denominated in units; however, in this case, the numbers reported represent the LTIP phantom units each named executive officer was awarded under the LTIP during fiscal 2020. The amounts in the “Estimated Future Payments Under Equity Incentive Plan Awards” column were based on the probable outcome with respect to satisfaction of the performance conditions and calculated in accordance with GAAP for financial reporting purposes based on the assumptions described in Note 11 of the Notes to Consolidated Financial Statements included in this Annual Report, but disregarding estimates of forfeiture.
(6) The dollar amounts reported in this column represent the aggregate fair value of 2018 RUP awards on the grant date, based on the assumptions described in Note
11 of the Notes to Consolidated Financial Statements included in this Annual Report, but disregarding estimates of forfeiture. The fair value shown may not be indicative of the value realized in the future upon vesting because of the variability in the trading price of our Common Units.
Note: Columns (j) and (k) were omitted from the Grants of Plan Based Awards Table because we do not award options to our employees.
Outstanding Equity Awards at Fiscal Year End 2020 Table The following table sets forth certain information concerning outstanding equity awards under our 2009 RUP, 2018 RUP and
LTIP unit awards for each named executive officer as of September 26, 2020: Stock Awards
Name
Number of Shares or Units of Stock That
Have Not Vested (1)
Market Value of Shares or Units of Stock That
Have Not Vested (2)
Equity Incentive
Plan Awards: Number of Unearned
Shares, Units or Other Rights that Have Not
Vested (3)
Equity Incentive Plan Awards:
Market or Payout Value of
Unearned Shares, Units or
Other Rights That Have Not
Vested (4) (a) (g) (h) (i) (j)
Michael A. Stivala 95,202 $ 1,386,141 24,578 $ 459,520 Michael A. Kuglin 59,062 $ 859,943 13,080 $ 244,531 Steven C. Boyd 59,062 $ 859,943 13,080 $ 244,531 Douglas T. Brinkworth 55,914 $ 814,108 11,884 $ 222,241 Neil E. Scanlon 53,492 $ 778,844 10,602 $ 198,292
(1) The figures reported in this column represent the total quantity of each of our named executive officer’s unvested 2009 RUP and 2018 RUP awards.
The following is a schedule of when the 2009 RUP and 2018 RUP awards reported above will vest:
Name
Number of 2009 RUP
and 2018 RUP Awards That
Have Not Vested
Quantity That Will Vest on
November 15, 2020
Quantity That Will Vest on
November 15, 2021
Quantity That Will Vest on
November 15, 2022
(a) (g) (h) (i) (j) Michael A. Stivala 95,202 45,659 32,738 16,805 Michael A. Kuglin 59,062 28,640 19,918 10,504 Steven C. Boyd 59,062 28,640 19,918 10,504 Douglas T. Brinkworth 55,914 27,255 18,856 9,803 Neil E. Scanlon 53,492 25,896 18,143 9,453
(2) The figures reported in this column represent the figures reported in column (g) multiplied by the average of the highest and the lowest trading prices of our Common Units on September 25, 2020, the last trading day of fiscal 2020.
(3) The amounts reported in this column represent the quantities of phantom units that underlie the outstanding and unvested fiscal 2020 and fiscal 2019 awards under the LTIP. Payments, if earned, will be made to participants at the end of a three-year measurement period and will be based upon the Partnership’s distribution coverage ratio for the three-year measurement period. For more information on the LTIP, refer to the subheading “Long-Term Incentive Plan” in the “Compensation Discussion and Analysis.”
(4) The amounts reported in this column represent the estimated future target payouts of the fiscal 2020 and fiscal 2019 awards granted under the LTIP. These amounts were computed by multiplying the quantities of the unvested phantom units in column (i) by the average of the closing prices of our Common Units for the twenty business days preceding September 26, 2020 (in accordance with the LTIP’s valuation methodology), and by adding to the product of that calculation the product of each year’s underlying phantom units times the sum of the distributions that are estimated to inure to an outstanding Common Unit during each award’s three-year measurement period. Because of the variability of the trading prices of our Common Units, actual payments, if any, at the end of the three-year measurement period may differ. The following chart provides a breakdown of each year’s awards:
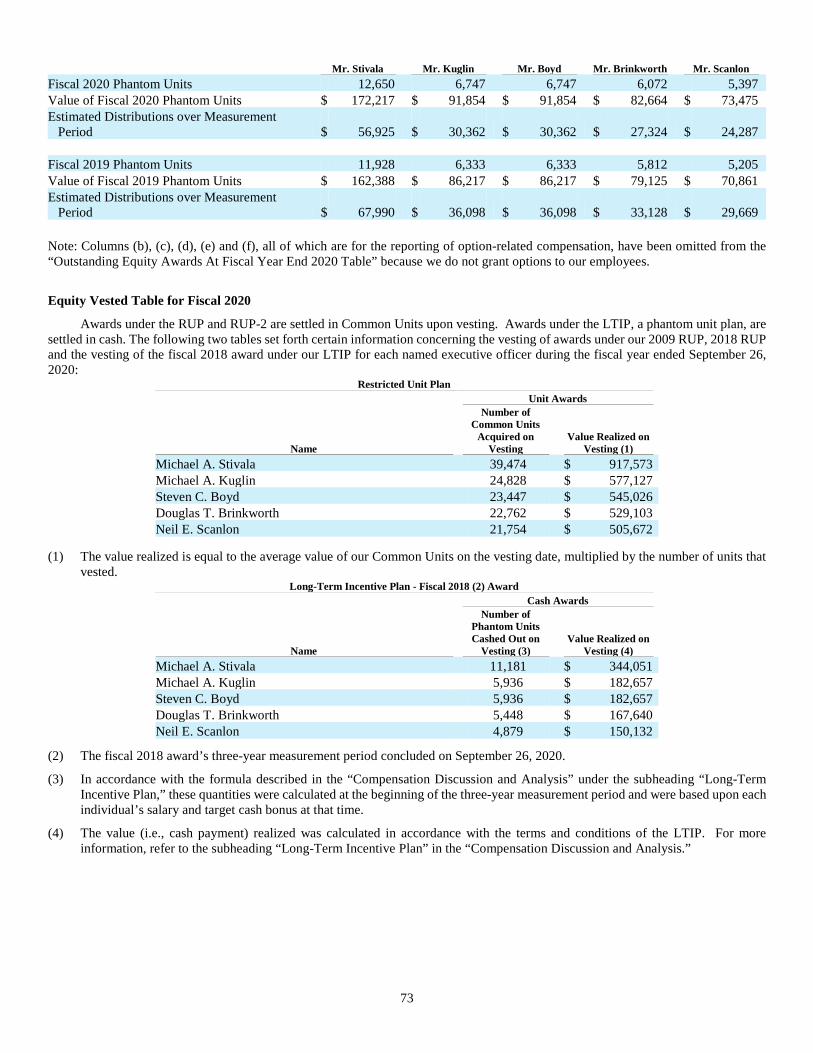
73
Mr. Stivala Mr. Kuglin Mr. Boyd Mr. Brinkworth Mr. Scanlon Fiscal 2020 Phantom Units 12,650 6,747 6,747 6,072 5,397 Value of Fiscal 2020 Phantom Units $ 172,217 $ 91,854 $ 91,854 $ 82,664 $ 73,475 Estimated Distributions over Measurement Period
$ 56,925
$ 30,362
$ 30,362
$ 27,324
$ 24,287
Fiscal 2019 Phantom Units 11,928 6,333 6,333 5,812 5,205 Value of Fiscal 2019 Phantom Units $ 162,388 $ 86,217 $ 86,217 $ 79,125 $ 70,861 Estimated Distributions over Measurement Period
$ 67,990
$ 36,098
$ 36,098
$ 33,128
$ 29,669
Note: Columns (b), (c), (d), (e) and (f), all of which are for the reporting of option-related compensation, have been omitted from the “Outstanding Equity Awards At Fiscal Year End 2020 Table” because we do not grant options to our employees.
Equity Vested Table for Fiscal 2020
Awards under the RUP and RUP-2 are settled in Common Units upon vesting. Awards under the LTIP, a phantom unit plan, are settled in cash. The following two tables set forth certain information concerning the vesting of awards under our 2009 RUP, 2018 RUP and the vesting of the fiscal 2018 award under our LTIP for each named executive officer during the fiscal year ended September 26, 2020:
Restricted Unit Plan Unit Awards
Name
Number of Common Units
Acquired on Vesting
Value Realized on Vesting (1)
Michael A. Stivala 39,474 $ 917,573 Michael A. Kuglin 24,828 $ 577,127 Steven C. Boyd 23,447 $ 545,026 Douglas T. Brinkworth 22,762 $ 529,103 Neil E. Scanlon 21,754 $ 505,672
(1) The value realized is equal to the average value of our Common Units on the vesting date, multiplied by the number of units that vested.
Long-Term Incentive Plan - Fiscal 2018 (2) Award Cash Awards
Name
Number of Phantom Units Cashed Out on
Vesting (3)
Value Realized on Vesting (4)
Michael A. Stivala 11,181 $ 344,051 Michael A. Kuglin 5,936 $ 182,657 Steven C. Boyd 5,936 $ 182,657 Douglas T. Brinkworth 5,448 $ 167,640 Neil E. Scanlon 4,879 $ 150,132
(2) The fiscal 2018 award’s three-year measurement period concluded on September 26, 2020.
(3) In accordance with the formula described in the “Compensation Discussion and Analysis” under the subheading “Long-Term Incentive Plan,” these quantities were calculated at the beginning of the three-year measurement period and were based upon each individual’s salary and target cash bonus at that time.
(4) The value (i.e., cash payment) realized was calculated in accordance with the terms and conditions of the LTIP. For more information, refer to the subheading “Long-Term Incentive Plan” in the “Compensation Discussion and Analysis.”

74
Retirement Benefits Table for Fiscal 2020
The following table sets forth certain information concerning each plan that provides for payments or other benefits at, following, or in connection with retirement for each named executive officer as of the end of the fiscal year ended September 26, 2020:
Name
Plan Name
Number of Years Credited Service
Present Value of Accumulated
Benefit
Payments During Last Fiscal Year
Michael A. Stivala (1) N/A N/A $ — $ —
Michael A. Kuglin (1) N/A N/A $ — $ —
Steven C. Boyd Cash Balance Plan (2) 15 $ 337,269 $ — LTIP (3) N/A $ 244,531 $ — RUP (4) N/A $ 401,128 $ —
Douglas T. Brinkworth Cash Balance Plan (2) 6 $ 204,470 $ — LTIP (3) N/A $ 222,241 $ — RUP (4) N/A $ 385,884 $ —
Neil E. Scanlon Cash Balance Plan (2) 6 $ 174,336 $ — LTIP (3) N/A $ 198,292 $ — RUP (4) N/A $ 365,907 $ —
(1) Because Mr. Stivala and Mr. Kuglin commenced employment with the Partnership after January 1, 2000, the date on which the Cash Balance Plan was closed to new participants, they do not participate in the Cash Balance Plan.
(2) For more information on the Cash Balance Plan, refer to the subheading “Pension Plan” in the “Compensation Discussion and Analysis.”
(3) On September 26, 2020, Mr. Boyd, Mr. Brinkworth and Mr. Scanlon were the only named executive officers who met the retirement criteria of the LTIP. For such participants, outstanding but unvested awards under the LTIP become fully vested. However, payouts of these awards are deferred until the conclusion of each outstanding award’s three-year measurement period, based on the outcome of the distributable cash flow measurement for the 2020 and 2019 awards. The numbers reported on these lines represent the target payout of Mr. Boyd’s, Mr. Brinkworth’s and Mr. Scanlon’s outstanding fiscal 2020 and 2019 awards under the LTIP. Because the ultimate payout, if any, is predicated on the trading prices of the Partnership’s Common Units at the end of the three-year measurement period and the relative distribution coverage for the respective three-year measurement period, the value reported is not indicative of the value that could be realized, if any, in the future upon vesting.
(4) On September 26, 2020, Mr. Boyd, Mr. Brinkworth and Mr. Scanlon were the only named executive officers who met the age and tenure requirements of the retirement provisions of the 2009 RUP and 2018 RUP. These figures were calculated by multiplying the awards that met the holding requirements of the retirement provisions of the 2009 RUP and 2018 RUP by the average of the highest and lowest trading prices of our Common Units on September 25, 2020. At the conclusion of fiscal 2020, taking into consideration the one-year holding requirement of the retirement provisions of 2018 RUP, 27,550 of Mr. Boyd’s, 26,503 of Mr. Brinkworth’s and 25,131 of Mr. Scanlon’s unvested awards were covered under the retirement provisions of our Restricted Unit Plans. For more information on the Restricted Unit Plans and the retirement provisions therein, refer to the subheading “Restricted Unit Plans” in the “Compensation Discussion and Analysis.” For participants who meet the retirement criteria, upon retirement, all Restricted Unit Plan awards vest six months and one day after retirement.

75
Potential Payments Upon Termination
The following table sets forth certain information containing potential payments to the named executive officers in accordance with the provisions of the Severance Protection Plan, the Executive Special Severance Plan, the Restricted Unit Plans and the LTIP for the circumstances listed in the table assuming a September 26, 2020 termination date. For more information on severance and change of control payments, refer to the subheadings “Severance Benefits” and “Change of Control” above.
Executive Payments and Benefits Upon Termination
Death
Disability
Involuntary Termination
Without Cause by the Partnership or by the Executive for Good Reason without a Change of Control Event
Involuntary Termination
Without Cause by the
Partnership or by the Executive for Good Reason with a Change of
Control Event Michael A. Stivala Cash Compensation (1) (2) (3) (4) $ — $ — $ 600,000 $ 3,600,000 Accelerated Vesting of Fiscal 2020, 2019 and 2018 LTIP Awards @ 150% (5)
—
—
—
1,013,205
Accelerated Vesting of Outstanding RUP Awards (6) 1,386,141 1,386,141 — 1,386,141 Medical Benefits (3) — — 26,617 39,925
Total $ 1,386,141 $ 1,386,141 $ 626,617 $ 6,039,271 Michael A. Kuglin Cash Compensation (1) (2) (3) (4) $ — $ — $ 400,000 $ 2,160,000 Accelerated Vesting of Fiscal 2020, 2019 and 2018 LTIP Awards @ 150% (5)
—
—
—
538,769
Accelerated Vesting of Outstanding RUP Awards (6) 859,943 859,943 — 859,943 Medical Benefits (3) — — 24,136 36,204
Total $ 859,943 $ 859,943 $ 424,136 $ 3,594,916 Steven C. Boyd Cash Compensation (1) (2) (3) (4) $ — $ — $ 400,000 $ 2,160,000 Accelerated Vesting of Fiscal 2020, 2019 and 2018 LTIP Awards @ 150% (5)
—
—
—
538,769
Accelerated Vesting of Outstanding RUP Awards (6) 859,943 859,943 401,128 859,943 Medical Benefits (3) — — 25,077 37,615
Total $ 859,943 $ 859,943 $ 826,205 $ 3,596,327 Douglas T. Brinkworth Cash Compensation (1) (2) (3) (4) $ — $ — $ 360,000 $ 1,944,000 Accelerated Vesting of Fiscal 2020, 2019 and 2018 LTIP Awards @ 150% (5)
—
—
—
491,196
Accelerated Vesting of Outstanding RUP Awards (6) 814,108 814,108 385,884 814,108 Medical Benefits (3) — — 24,769 37,153
Total $ 814,108 $ 814,108 $ 770,653 $ 3,286,457 Neil E. Scanlon Cash Compensation (1) (2) (3) (4) $ — $ — $ 320,000 $ 1,728,000 Accelerated Vesting of Fiscal 2020, 2019 and 2018 LTIP Awards @ 150% (5)
—
—
—
438,788
Accelerated Vesting of Outstanding RUP Awards (6) 778,844 778,844 365,907 778,844 Medical Benefits (3) — — 24,461 36,691
Total $ 778,844 $ 778,844 $ 710,368 $ 2,982,323
(1) In the event of death, the named executive officer’s estate is entitled to a payment equal to the decedent’s earned but unpaid salary and pro-rata cash bonus.
(2) In the event of disability, the named executive officer is entitled to a payment equal to his earned but unpaid salary and pro-rata cash bonus.

76
(3) Any severance benefits, unrelated to a change of control event, payable to these officers would be determined by the Committee on a case-by-case basis in accordance with prior treatment of other similarly situated executives and may, as a result, differ substantially from this hypothetical presentation. For purposes of this table, we have assumed that each of these named executive officers would, upon termination of employment without cause or for resignation for good reason, receive accrued salary and benefits through the date of termination plus one times annual salary and continued participation, at active employee rates, in our health insurance plans for one year. In regard to a termination of employment without cause or resignation with good reason in connection to a change of control event, we will provide our named executive officers with eighteen months of insurance coverage.
(4) Each of our named executive officers will receive 156 weeks of base pay plus a sum equal to their annual target cash bonus divided by 52 and multiplied by 156 in accordance with the terms of the Executive Special Severance Plan in the event of a termination without cause or a resignation with good reason in connection to a change of control. For more information on the Executive Special Severance Plan, refer to the subheading “Change of Control” in the “Compensation Discussion and Analysis.”
(5) In the event of a change of control, all awards under the LTIP will vest immediately regardless of whether termination immediately follows. If a change of control event occurred at the conclusion of fiscal 2020, payments would have been equal to 150% of the cash value of a participant’s unvested phantom units plus a sum equal to 150% of a participant’s unvested phantom units multiplied by an amount equal to the cumulative, per-Common Unit distribution from the beginning of an unvested award’s three-year measurement period through the date on which the change of control occurred. If a change of control event occurred on September 26, 2020, the fiscal 2020, fiscal 2019 and fiscal 2018 awards would have been subject to this treatment. For more information, refer to the subheading “Long-Term Incentive Plan” in the “Compensation Discussion and Analysis.”
In the event of death, the inability to continue employment because of permanent disability, or a termination without cause or a good reason resignation unconnected to a change of control event, awards will vest in accordance with the normal vesting schedule and will be subject to the same requirements as awards held by individuals still employed by us and will be subject to the same risks as awards held by all other participants.
(6) The Restricted Unit Plans provide for the vesting of all unvested awards held by a participant at the time of his or her death or at the time he or she becomes permanently disabled the units shall vest six months and one day following the participant’s date of death or the date on which his or her employment was terminated as a result of the disability.
Under circumstances unrelated to a change of control, if a Restricted Unit Plan award recipient’s employment is terminated without cause or he or she resigns for good reason, any restricted unit awards held by such recipient will be forfeited. Because some of Mr. Boyd’s, Mr. Brinkworth’s and Mr. Scanlon’s unvested awards were subject to the retirement provisions on the last day of fiscal 2020, if Mr. Boyd, Mr. Brinkworth or Mr. Scanlon had been terminated without cause on September 26, 2020, 27,550 of Mr. Boyd’s, 26,503 of Mr. Brinkworth’s and 25,131 of Mr. Scanlon’s awards would have vested in accordance with the retirement provisions of the Restricted Unit Plans.
In the event of a change of control, as defined in the 2009 and 2018 Restricted Unit Plan documents, all unvested RUP awards will vest immediately on the date the change of control is consummated, regardless of the holding period and regardless of whether the recipient’s employment is terminated.
CEO PAY RATIO
As required by Section 953(b) of the Dodd-Frank Wall Street Reform and Consumer Protection Act, and SEC rules, we are providing the following information about the relationship of the annual total compensation of our employees and the annual total compensation of Mr. Stivala, our President and Chief Executive Officer (the “CEO):

77
For fiscal 2020, our last completed fiscal year:
• the annual total compensation of the employee identified at median of our company (other than our CEO), was $74,512; and
• the annual total compensation of the CEO for purposes of determining the CEO Pay Ratio was $2,620,360.
Based on this information, for fiscal 2020, the ratio of the annual total compensation of Mr. Stivala, our President and Chief Executive Officer, to the median of the annual total compensation of all employees was estimated to be 35 to 1.
This pay ratio is a reasonable estimate calculated in a manner consistent with Item 402(u) of Regulation S-K based on our payroll and employment records and the methodology described below. The SEC rules for identifying the median compensated employee and calculating the pay ratio based on that employee’s annual total compensation allow companies to adopt a variety of methodologies, to apply certain exclusions, and to make reasonable estimates and assumptions that reflect their compensation practices. As such, the pay ratio reported by other companies may not be comparable to the pay ratio reported above, as other companies may have different employment and compensation practices and may utilize different methodologies, exclusions, estimates and assumptions in calculating their own pay ratios.
To identify the median of the annual total compensation of all our employees, as well as to determine the annual total compensation of the “median employee,” the methodology and the material assumptions, adjustments, and estimates that we used were as follows:
We determined that, as of August 15, 2020, our employee population consisted of approximately 3,234 individuals. We selected August 15, 2020, which is within the last three months of fiscal 2020, as the date upon which we would identify the “median employee” to allow sufficient time to identify the median employee.
To identify the “median employee” from our employee population, we collected all W-2 wages paid to each employee during the twelve-month period ending on August 15, 2020. This included each employee’s actual base salary and any overtime, any cash bonuses, the value of any Restricted Unit Plan awards that vested during the period, and any other miscellaneous forms of W-2-related compensation added to our employees’ earnings record during the period. In making this determination, we annualized the salaries of all newly hired permanent employees during this period.
After we identified our median employee, we calculated such employee’s annual total compensation for fiscal 2020 utilizing the same methodology used to determine the CEO’s compensation, resulting in annual total compensation of $74,512.
SUPERVISORS’ COMPENSATION
The following table sets forth the compensation of the non-employee members of the Board of Supervisors of the Partnership during fiscal 2020.
Supervisor
Fees Earned or
Paid in Cash (1)
Unit Awards (2)
Total Harold R. Logan, Jr. $ 125,000 $ — $ 125,000 Lawrence C. Caldwell $ 90,000 $ — $ 90,000 Matthew J. Chanin $ 105,000 $ — $ 105,000 Terence J. Connors $ 110,000 $ — $ 110,000 William M. Landuyt $ 90,000 $ — $ 90,000 John Hoyt Stookey $ 90,000 $ — $ 90,000 Jane Swift $ 90,000 $ — $ 90,000
(1) This includes amounts earned for fiscal 2020, including quarterly retainer installments for the fourth quarter of 2020 that were
paid in November 2020. It does not include amounts paid in fiscal 2020 for fiscal 2019 quarterly retainer installments. (2) We did not grant restricted unit awards to our non-employee Supervisors during fiscal 2020. At the end of fiscal 2020, Mr. Logan
held 13,034 unvested restricted units and Messieurs Caldwell, Chanin, Connors, Landuyt, Stookey, and Ms. Swift each held 10,138 unvested restricted units.

78
Note: The columns for reporting option awards, non-equity incentive plan compensation, changes in pension value and non-qualified deferred compensation plan earnings and all other forms of compensation were omitted from the Supervisor’s Compensation Table because the Partnership does not provide these forms of compensation to its non-employee supervisors.
Fees and Benefit Plans for Non-Employee Supervisors
Annual Cash Retainer Fees. As the Chairman of the Board of Supervisors, Mr. Logan receives an annual cash retainer of $125,000, payable in quarterly installments of $31,250 each. Each of the other non-employee Supervisors receives an annual cash retainer of $90,000 each, payable in quarterly installments of $22,500. As Chair of the Compensation Committee, Mr. Chanin receives an additional annual cash retainer of $15,000, payable in quarterly installments of $3,750 each. As Chair of the Audit Committee, Mr. Connors receives an additional annual cash retainer of $20,000, payable in quarterly installments of $5,000 each.
Meeting Fees. The members of our Board of Supervisors receive no additional remuneration for attendance at regularly scheduled meetings of the Board or its Committees, other than reimbursement of reasonable expenses incurred in connection with such attendance.
Restricted Unit Plans. Each non-employee Supervisor is eligible to participate in our Restricted Unit Plans. All awards vest in accordance with the provisions of the plan document (see “Compensation Discussion and Analysis” section titled “Restricted Unit Plans” for a description of the vesting schedule). Upon vesting, all awards are settled by issuing Common Units.
Additional Supervisor Compensation. Non-employee Supervisors receive no other forms of remuneration from us. The only perquisite provided to the members of the Board of Supervisors is the ability to purchase propane at the same discounted rate that we offer propane to our employees, the value of which was less than $10,000 in fiscal 2020 for each Supervisor.
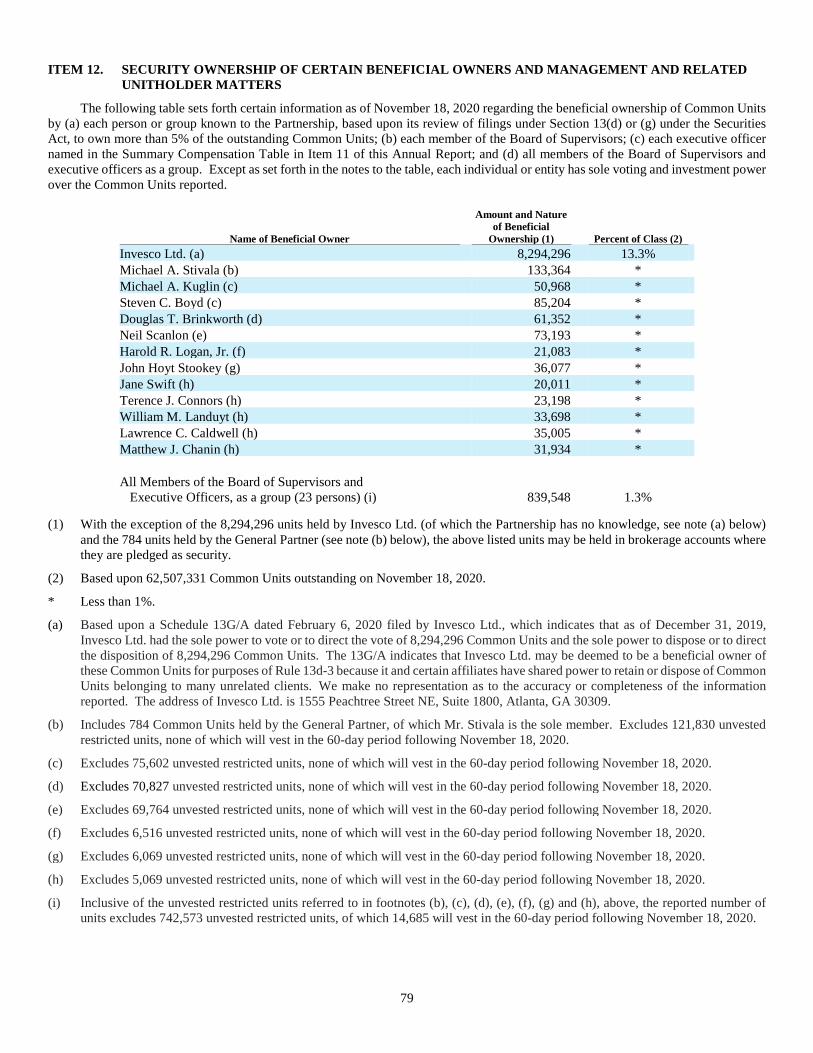
79
ITEM 12. SECURITY OWNERSHIP OF CERTAIN BENEFICIAL OWNERS AND MANAGEMENT AND RELATED UNITHOLDER MATTERS
The following table sets forth certain information as of November 18, 2020 regarding the beneficial ownership of Common Units by (a) each person or group known to the Partnership, based upon its review of filings under Section 13(d) or (g) under the Securities Act, to own more than 5% of the outstanding Common Units; (b) each member of the Board of Supervisors; (c) each executive officer named in the Summary Compensation Table in Item 11 of this Annual Report; and (d) all members of the Board of Supervisors and executive officers as a group. Except as set forth in the notes to the table, each individual or entity has sole voting and investment power over the Common Units reported.
Name of Beneficial Owner
Amount and Nature of Beneficial
Ownership (1) Percent of Class (2) Invesco Ltd. (a) 8,294,296 13.3% Michael A. Stivala (b) 133,364 * Michael A. Kuglin (c) 50,968 * Steven C. Boyd (c) 85,204 * Douglas T. Brinkworth (d) 61,352 * Neil Scanlon (e) 73,193 * Harold R. Logan, Jr. (f) 21,083 * John Hoyt Stookey (g) 36,077 * Jane Swift (h) 20,011 * Terence J. Connors (h) 23,198 * William M. Landuyt (h) 33,698 * Lawrence C. Caldwell (h) 35,005 * Matthew J. Chanin (h) 31,934 * All Members of the Board of Supervisors and Executive Officers, as a group (23 persons) (i)
839,548
1.3%
(1) With the exception of the 8,294,296 units held by Invesco Ltd. (of which the Partnership has no knowledge, see note (a) below) and the 784 units held by the General Partner (see note (b) below), the above listed units may be held in brokerage accounts where they are pledged as security.
(2) Based upon 62,507,331 Common Units outstanding on November 18, 2020.
* Less than 1%.
(a) Based upon a Schedule 13G/A dated February 6, 2020 filed by Invesco Ltd., which indicates that as of December 31, 2019, Invesco Ltd. had the sole power to vote or to direct the vote of 8,294,296 Common Units and the sole power to dispose or to direct the disposition of 8,294,296 Common Units. The 13G/A indicates that Invesco Ltd. may be deemed to be a beneficial owner of these Common Units for purposes of Rule 13d-3 because it and certain affiliates have shared power to retain or dispose of Common Units belonging to many unrelated clients. We make no representation as to the accuracy or completeness of the information reported. The address of Invesco Ltd. is 1555 Peachtree Street NE, Suite 1800, Atlanta, GA 30309.
(b) Includes 784 Common Units held by the General Partner, of which Mr. Stivala is the sole member. Excludes 121,830 unvested restricted units, none of which will vest in the 60-day period following November 18, 2020.
(c) Excludes 75,602 unvested restricted units, none of which will vest in the 60-day period following November 18, 2020.
(d) Excludes 70,827 unvested restricted units, none of which will vest in the 60-day period following November 18, 2020.
(e) Excludes 69,764 unvested restricted units, none of which will vest in the 60-day period following November 18, 2020.
(f) Excludes 6,516 unvested restricted units, none of which will vest in the 60-day period following November 18, 2020.
(g) Excludes 6,069 unvested restricted units, none of which will vest in the 60-day period following November 18, 2020.
(h) Excludes 5,069 unvested restricted units, none of which will vest in the 60-day period following November 18, 2020.
(i) Inclusive of the unvested restricted units referred to in footnotes (b), (c), (d), (e), (f), (g) and (h), above, the reported number of units excludes 742,573 unvested restricted units, of which 14,685 will vest in the 60-day period following November 18, 2020.
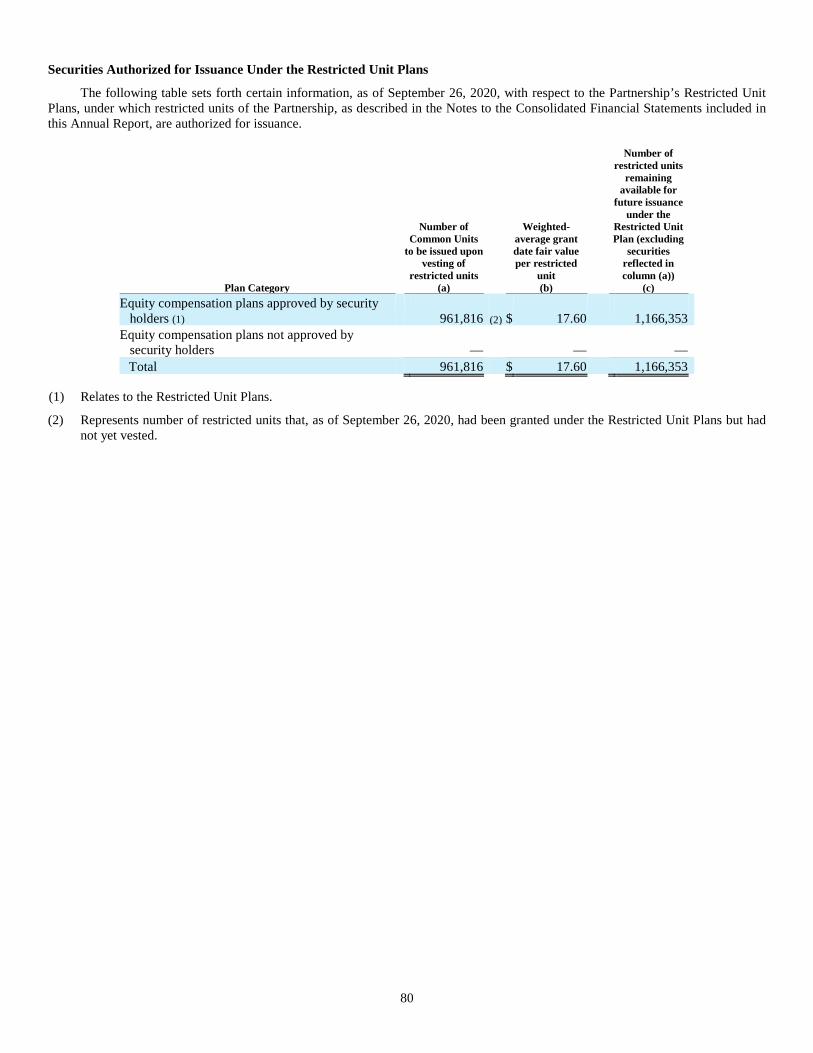
80
Securities Authorized for Issuance Under the Restricted Unit Plans
The following table sets forth certain information, as of September 26, 2020, with respect to the Partnership’s Restricted Unit Plans, under which restricted units of the Partnership, as described in the Notes to the Consolidated Financial Statements included in this Annual Report, are authorized for issuance.
Plan Category
Number of Common Units
to be issued upon vesting of
restricted units (a)
Weighted-average grant date fair value per restricted
unit (b)
Number of restricted units
remaining available for
future issuance under the
Restricted Unit Plan (excluding
securities reflected in column (a))
(c) Equity compensation plans approved by security holders (1) 961,816 (2) $ 17.60 1,166,353 Equity compensation plans not approved by security holders
—
—
—
Total 961,816 $ 17.60 1,166,353
(1) Relates to the Restricted Unit Plans.
(2) Represents number of restricted units that, as of September 26, 2020, had been granted under the Restricted Unit Plans but had not yet vested.
81
ITEM 13. CERTAIN RELATIONSHIPS AND RELATED TRANSACTIONS, AND DIRECTOR INDEPENDENCE
Related Person Transactions
None. See “Partnership Management” under Item 10 above for a description of the Audit Committee’s role in reviewing, and approving or ratifying, related party transactions.
Supervisor Independence
The Corporate Governance Guidelines and Principles adopted by the Board of Supervisors provide that a Supervisor is deemed to be lacking a material relationship to the Partnership and is therefore independent of management if the following criteria are satisfied:
1. Within the past three years, the Supervisor:
a. has not been employed by the Partnership and has not received more than $100,000 per year in direct compensation from the Partnership, other than Supervisor and committee fees and pension or other forms of deferred compensation for prior service;
b. has not provided significant advisory or consultancy services to the Partnership, and has not been affiliated with a company or a firm that has provided such services to the Partnership in return for aggregate payments during any of the last three fiscal years of the Partnership in excess of the greater of 2% of the other company’s consolidated gross revenues or $1 million;
c. has not been a significant customer or supplier of the Partnership and has not been affiliated with a company or firm that has been a customer or supplier of the Partnership and has either made to the Partnership or received from the Partnership payments during any of the last three fiscal years of the Partnership in excess of the greater of 2% of the other company’s consolidated gross revenues or $1 million;
d. has not been employed by or affiliated with an internal or external auditor that within the past three years provided services to the Partnership; and
e. has not been employed by another company where any of the Partnership’s current executives serve on that company’s compensation committee;
2. The Supervisor is not a spouse, parent, sibling, child, mother- or father-in-law, son- or daughter-in-law or brother- or sister-in-law of a person having a relationship described in 1. above nor shares a residence with such person;
3. The Supervisor is not affiliated with a tax-exempt entity that within the past 12 months received significant contributions from the Partnership (contributions of the greater of 2% of the entity’s consolidated gross revenues or $1 million are considered significant); and
4. The Supervisor does not have any other relationships with the Partnership or with members of senior management of the Partnership that the Board determines to be material.
A copy of our Corporate Governance Guidelines is available without charge from our website at www.suburbanpropane.com or upon written request directed to: Suburban Propane Partners, L.P., Investor Relations, P.O. Box 206, Whippany, New Jersey 07981-0206.
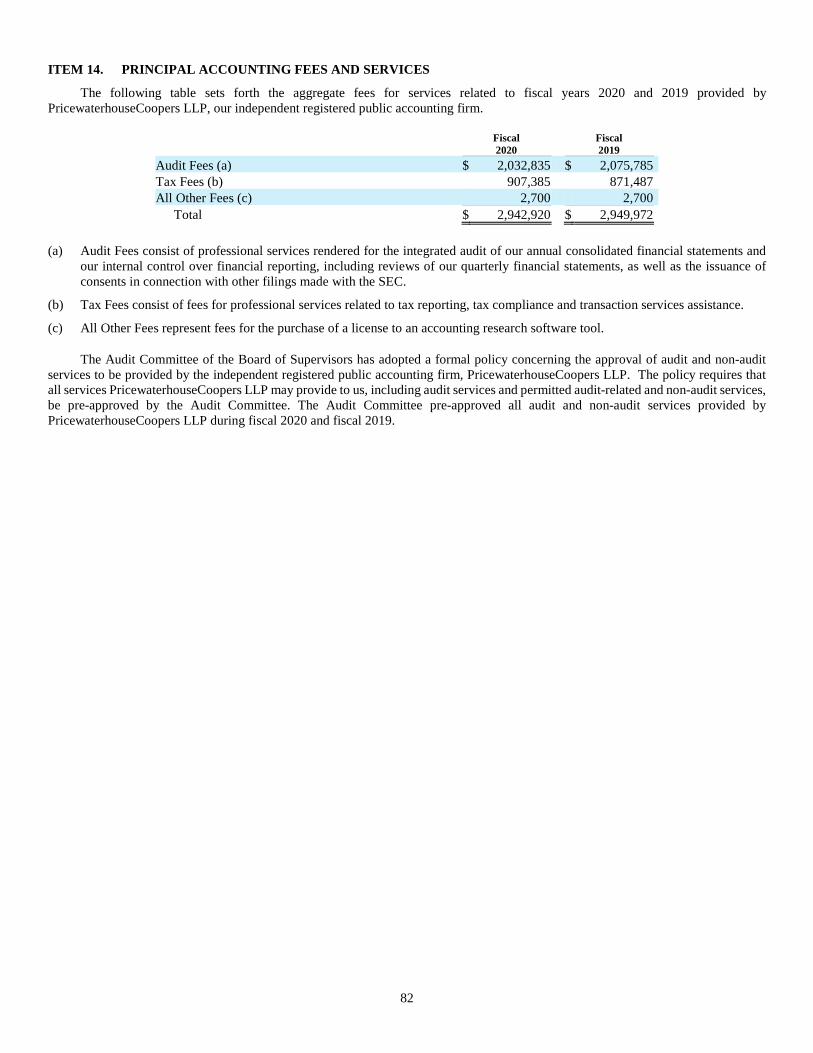
82
ITEM 14. PRINCIPAL ACCOUNTING FEES AND SERVICES
The following table sets forth the aggregate fees for services related to fiscal years 2020 and 2019 provided by PricewaterhouseCoopers LLP, our independent registered public accounting firm.
Fiscal 2020
Fiscal 2019
Audit Fees (a) $ 2,032,835 $ 2,075,785 Tax Fees (b) 907,385 871,487 All Other Fees (c) 2,700 2,700
Total $ 2,942,920 $ 2,949,972 (a) Audit Fees consist of professional services rendered for the integrated audit of our annual consolidated financial statements and
our internal control over financial reporting, including reviews of our quarterly financial statements, as well as the issuance of consents in connection with other filings made with the SEC.
(b) Tax Fees consist of fees for professional services related to tax reporting, tax compliance and transaction services assistance.
(c) All Other Fees represent fees for the purchase of a license to an accounting research software tool.
The Audit Committee of the Board of Supervisors has adopted a formal policy concerning the approval of audit and non-audit services to be provided by the independent registered public accounting firm, PricewaterhouseCoopers LLP. The policy requires that all services PricewaterhouseCoopers LLP may provide to us, including audit services and permitted audit-related and non-audit services, be pre-approved by the Audit Committee. The Audit Committee pre-approved all audit and non-audit services provided by PricewaterhouseCoopers LLP during fiscal 2020 and fiscal 2019.

83
PART IV
ITEM 15. EXHIBITS, FINANCIAL STATEMENT SCHEDULES
(a) The following documents are filed as part of this Annual Report:
1. Financial Statements
See “Index to Financial Statements” set forth on page F-1.
2. Financial Statement Schedule
See “Index to Financial Statement Schedule” set forth on page S-1.
3. Exhibits
See “Index to Exhibits”. Each management contract or compensatory plan or arrangement is identified with a “#”.
ITEM 16. FORM 10-K SUMMARY
None.

84
INDEX TO EXHIBITS
The exhibits listed on this Exhibit Index are filed as part of this Annual Report. Exhibits required to be filed by Item 601 of Regulation S-K, which are not listed below, are not applicable. Exhibit Number Description
3.1
Third Amended and Restated Agreement of Limited Partnership of the Partnership dated as of October 19, 2006, as amended as of July 31, 2007 and January 24, 2018 and as further amended November 11, 2020. (Incorporated by reference to Exhibit 3.1 to the Partnership’s Current Report on Form 8-K filed November 16, 2020).
3.2
Third Amended and Restated Agreement of Limited Partnership of the Operating Partnership dated as of October 19, 2006, as amended as of June 24, 2009 and as further amended as of January 24, 2018. (Incorporated by reference to Exhibit 3.2 to the Partnership’s Current Report on Form 8-K filed January 24, 2018).
3.3
Amended and Restated Certificate of Limited Partnership of the Partnership dated May 26, 1999 (Incorporated by reference to Exhibit 3.2 to the Partnership’s Quarterly Report on Form 10-Q filed August 6, 2009).
3.4
Amended and Restated Certificate of Limited Partnership of the Operating Partnership dated May 26, 1999 (Incorporated by reference to Exhibit 3.3 to the Partnership’s Quarterly Report on Form 10-Q filed August 6, 2009).
4.1
Description of Common Units of the Partnership. (Incorporated by reference to Exhibit 4.1 to the Partnership’s Current Report on Form 8-K filed October 19, 2006).
4.2
Indenture, dated as of May 27, 2014, relating to the 5.50% Senior Notes due 2024, among Suburban Propane Partners, L.P., Suburban Energy Finance Corp. and The Bank of New York Mellon, as Trustee, including the form of 5.50% Senior Notes due 2024. (Incorporated by reference to Exhibit 4.1 to the Partnership’s Current Report on Form 8-K filed May 28, 2014).
4.3
First Supplemental Indenture, dated as of May 27, 2014, relating to the 5.50% Senior Notes due 2024, among Suburban Propane Partners, L.P., Suburban Energy Finance Corp. and The Bank of New York Mellon, as Trustee. (Incorporated by reference to Exhibit 4.2 to the Partnership’s Current Report on Form 8-K filed May 28, 2014).
4.4
Second Supplemental Indenture, dated as of February 25, 2015, to the Indenture, dated as of May 27, 2014, relating to the 5.75% Senior Notes due 2025, among Suburban Propane Partners, L.P., Suburban Energy Finance Corp. and The Bank of New York Mellon, as Trustee. (Incorporated by reference to Exhibit 4.1 to the Partnership’s Current Report on Form 8-K filed February 25, 2015).
4.5
Third Supplemental Indenture, dated as of February 14, 2017, to the Indenture, dated as of May 27, 2014, relating to the 5.875% Senior Notes due 2027, among Suburban Propane Partners, L.P., Suburban Energy Finance Corp. and The Bank of New York Mellon, as Trustee. (Incorporated by reference to Exhibit 4.1 to the Partnership's Current Report on Form 8-K filed February 14, 2017).
10.1
Suburban Propane Partners, L.P. 2009 Restricted Unit Plan, effective August 1, 2009, as amended on November 13, 2012, August 6, 2013 and May 13, 2015. (Incorporated by reference to Exhibit 10.1 to the Partnership’s Current Report on Form 8-K filed May 14, 2015). #
10.2
Suburban Propane Partners, L.P. 2018 Restricted Unit Plan, effective June 1, 2018. (Incorporated by reference to Exhibit 10.1 to the Partnership’s Current Report on Form 8-K filed May 16, 2018). #
10.3
Suburban Propane, L.P. Severance Protection Plan, as amended on January 24, 2008, January 20, 2009 and November 10, 2009. (Incorporated by reference to Exhibit 10.8 to the Partnership’s Annual Report on Form 10-K filed on November 25, 2009). #
10.4
Suburban Propane, L.P. Executive Special Severance Plan, effective January 1, 2020. (Incorporated by reference to Exhibit 10.1 to the Partnership’s Current Report on Form 8-K filed on November 19, 2019). #
10.5
Suburban Propane, L.P. 2014 Long-Term Incentive Plan, effective October 1, 2013, as amended on November 14, 2016, January 22, 2019 and November 12, 2019. (Incorporated by reference to Exhibit 10.5 to the Partnership’s Annual Report on Form 10-K filed on November 27, 2019). #
10.6
Suburban Propane, L.P. 2021 Long-Term Incentive Plan, effective September 27, 2020, (Incorporated by reference to Exhibit 10.1 to the Partnership’s Current Report on Form 8-K filed November 16, 2020). #
10.7
Amended and Restated Retirement Savings and Investment Plan of Suburban Propane (effective as of January 1, 2013). (Incorporated by reference to Exhibit 10.4 to the Partnership’s Annual Report on Form 10-K filed on November 23, 2016). #

85
10.8
First Amendment to the Retirement Savings and Investment Plan of Suburban Propane (effective January 1, 2015). (Incorporated by reference to Exhibit 10.5 to the Partnership’s Annual Report on Form 10-K filed on November 23, 2016). #
10.9
Second Amendment to the Retirement Savings and Investment Plan of Suburban Propane (effective January 1, 2016). (Incorporated by reference to Exhibit 10.6 to the Partnership’s Annual Report on Form 10-K filed on November 23, 2016). #
10.10
Third Amendment to the Retirement Savings and Investment Plan of Suburban Propane (effective August 1, 2016). (Incorporated by reference to Exhibit 10.7 to the Partnership’s Annual Report on Form 10-K filed on November 22, 2017). #
10.11
Fourth Amendment to the Retirement Savings and Investment Plan of Suburban Propane (effective January 1, 2017). (Incorporated by reference to Exhibit 10.8 to the Partnership’s Annual Report on Form 10-K filed on November 22, 2017). #
10.12
Fifth Amendment to the Retirement Savings and Investment Plan of Suburban Propane (effective April 1, 2018). (Incorporated by reference to Exhibit 10.2 to the Partnership’s Quarterly Report on Form 10-Q filed on August 9, 2018). #
10.13
Sixth Amendment to the Retirement Savings and Investment Plan of Suburban Propane (effective January 1, 2019). (Incorporated by reference to Exhibit 10.4 to the Partnership’s Quarterly Report on Form 10-Q filed on August 8, 2019). #
10.14
Suburban Propane Partners, L.P. Distribution Equivalent Rights Plan, effective January 17, 2017, as amended January 22, 2019 (Incorporated by reference to Exhibit 10.2 to the Partnership’s Quarterly Report on Form 10-Q filed February 7, 2019). #
10.15
Third Amendment to the Pension Plan for Eligible Employees of Suburban Propane, L.P. and Subsidiaries (effective June 1, 2017). (Incorporated by reference to Exhibit 10.10 to the Partnership’s Annual Report on Form 10-K filed on November 22, 2017). #
10.16
Fourth Amendment to the Pension Plan for Eligible Employees of Suburban Propane, L.P. and Subsidiaries (effective January 1, 2019). (Incorporated by reference to Exhibit 10.3 to the Partnership’s Quarterly Report on Form 10-Q filed February 7, 2019). #
10.17
Fifth Amendment to the Pension Plan for Eligible Employees of Suburban Propane, L.P. and Subsidiaries (effective January 1, 2019 and October 1, 2019, as applicable). (Incorporated by reference to Exhibit 10.16 to the Partnership’s Annual Report on Form 10-K filed on November 27, 2019). #
10.18
Sixth Amendment to the Pension Plan for Eligible Employees of Suburban Propane, L.P. and Subsidiaries (effective December 20, 2019). (Incorporated by reference to Exhibit 10.1 to the Partnership’s Quarterly Report on Form 10-Q filed February 6, 2020). #
10.19
Second Amended and Restated Credit Agreement, among the Operating Partnership, the Partnership and Bank of America, N.A., as Administrative Agent, and the Lenders party thereto, dated March 3, 2016. (Incorporated by reference to Exhibit 10.1 to the Partnership’s Current Report on Form 8-K filed on March 3, 2016).
10.20
First Amendment, dated as of May 1, 2017, to the Second Amended and Restated Credit Agreement, among the Operating Partnership, the Partnership and Bank of America, N.A., as Administrative Agent, and the Lenders party thereto, dated March 3, 2016. (Incorporated by reference to Exhibit 10.1 to the Partnership’s Current Report on Form 8-K filed on May 4, 2017).
10.21
Third Amended and Restated Credit Agreement among the Operating Partnership, the Partnership and Bank of America, N.A., as Administrative Agent, and the Lenders party thereto, dated March 5, 2020. (Incorporated by reference to Exhibit 10.1 to the Partnership’s Current Report on Form 8-K filed on March 5, 2020).
21.1 Subsidiaries of Suburban Propane Partners, L.P. (Filed herewith).
23.1 Consent of PricewaterhouseCoopers LLP. (Filed herewith).
31.1
Certification of the President and Chief Executive Officer Pursuant to Section 302 of the Sarbanes-Oxley Act of 2002. (Filed herewith).
31.2 Certification of the Chief Financial Officer Pursuant to Section 302 of the Sarbanes-Oxley Act of 2002. (Filed herewith).
32.1
Certification of the President and Chief Executive Officer Pursuant to 18 U.S.C. Section 1350, as Adopted Pursuant to Section 906 of the Sarbanes-Oxley Act of 2002. (Furnished herewith).
32.2
Certification of the Chief Financial Officer Pursuant to 18 U.S.C. Section 1350, as Adopted Pursuant to Section 906 of the Sarbanes-Oxley Act of 2002. (Furnished herewith).

86
99.1
Equity Holding Policy for Supervisors and Executives of Suburban Propane Partners, L.P., as amended on November 10, 2015 and as further amended on November 13, 2018. (Incorporated by reference to Exhibit 99.1 to the Partnership’s Annual Report on Form 10-K filed on November 21, 2018).
99.2 Five-Year Performance Graph (Furnished herewith).
101.INS Inline XBRL Instance Document
101.SCH Inline XBRL Taxonomy Extension Schema Document
101.CAL Inline XBRL Taxonomy Extension Calculation Linkbase Document
101.DEF Inline XBRL Taxonomy Extension Definition Linkbase Document
101.LAB Inline XBRL Taxonomy Extension Label Linkbase Document
101.PRE Inline XBRL Taxonomy Extension Presentation Linkbase Document
104 Cover Page Interactive Data File (embedded in the Inline XBRL document).
87
SIGNATURES
Pursuant to the requirements of Section 13 or 15(d) of the Securities Exchange Act of 1934, the Registrant has duly caused this report to be signed on its behalf by the undersigned, thereunto duly authorized. SUBURBAN PROPANE PARTNERS, L.P. Date: November 25, 2020 By: /s/ MICHAEL A. STIVALA Michael A. Stivala President, Chief Executive Officer and Supervisor
Pursuant to the requirements of the Securities Exchange Act of 1934, this Annual Report has been signed below by the following persons on behalf of the Registrant and in the capacities and on the dates indicated:
Signature Title Date
By: /s/ MICHAEL A. STIVALA President, Chief Executive November 25, 2020 (Michael A. Stivala) Officer and Supervisor
By: /s/ HAROLD R. LOGAN, JR. Chairman and Supervisor November 25, 2020 (Harold R. Logan, Jr.)
By: /s/ LAWRENCE C. CALDWELL Supervisor November 25, 2020 (Lawrence C. Caldwell)
By /s/ MATTHEW J. CHANIN Supervisor November 25, 2020 (Matthew J. Chanin)
By: /s/ TERENCE J. CONNORS Supervisor November 25, 2020 (Terence J. Connors)
By: /s/ WILLIAM M. LANDUYT Supervisor November 25, 2020 (William M. Landuyt)
By: /s/ JOHN HOYT STOOKEY Supervisor November 25, 2020 (John Hoyt Stookey)
By: /s/ JANE SWIFT Supervisor November 25, 2020 (Jane Swift)
By: /s/ MICHAEL A. KUGLIN Chief Financial Officer and November 25, 2020 (Michael A. Kuglin) Chief Accounting Officer
By: /s/ DANIEL S. BLOOMSTEIN Vice President and Controller November 25, 2020 (Daniel S. Bloomstein)

F-1
INDEX TO FINANCIAL STATEMENTS
SUBURBAN PROPANE PARTNERS, L.P. AND SUBSIDIARIES
Page
Report of Independent Registered Public Accounting Firm .......................................................................................................... F-2
Consolidated Balance Sheets – As of September 26, 2020 and September 28, 2019 .................................................................... F-4
Consolidated Statements of Operations – Years Ended September 26, 2020, September 28, 2019 and September 29, 2018 ....... F-5
Consolidated Statements of Comprehensive Income – Years Ended September 26, 2020, September 28, 2019 and September 29, 2018 .................................................................................................................................................................. F-6
Consolidated Statements of Cash Flows – Years Ended September 26, 2020, September 28, 2019 and September 29, 2018 ..... F-7
Consolidated Statements of Partners’ Capital – Years Ended September 26, 2020, September 28, 2019 and September 29, 2018 .................................................................................................................................................................. F-8
Notes to Consolidated Financial Statements .................................................................................................................................. F-9

F-2
Report of Independent Registered Public Accounting Firm To the Board of Supervisors and Unitholders of Suburban Propane Partners, L.P. Opinions on the Financial Statements and Internal Control over Financial Reporting We have audited the accompanying consolidated balance sheets of Suburban Propane Partners, L.P and its subsidiaries (the “Partnership”) as of September 26, 2020 and September 28, 2019, and the related consolidated statements of operations, of comprehensive income, of partners' capital and of cash flows for each of the three years in the period ended September 26, 2020, including the related notes and financial statement schedule listed in the index appearing under Item 15(a)(2) (collectively referred to as the “consolidated financial statements”). We also have audited the Partnership’s internal control over financial reporting as of September 26, 2020, based on criteria established in Internal Control - Integrated Framework (2013) issued by the Committee of Sponsoring Organizations of the Treadway Commission (COSO). In our opinion, the consolidated financial statements referred to above present fairly, in all material respects, the financial position of the Partnership as of September 26, 2020 and September 28, 2019, and the results of its operations and its cash flows for each of the three years in the period ended September 26, 2020 in conformity with accounting principles generally accepted in the United States of America. Also in our opinion, the Partnership maintained, in all material respects, effective internal control over financial reporting as of September 26, 2020 based on criteria established in Internal Control - Integrated Framework (2013) issued by the COSO. Change in Accounting Principle As discussed in Note 2 to the consolidated financial statements, the Partnership changed the manner in which it accounts for leases as of September 29, 2019. Basis for Opinions The Partnership’s management is responsible for these consolidated financial statements, for maintaining effective internal control over financial reporting, and for its assessment of the effectiveness of internal control over financial reporting, included in Management’s Report on Internal Control over Financial Reporting appearing under Item 9A. Our responsibility is to express opinions on the Partnership’s consolidated financial statements and on the Partnership’s internal control over financial reporting based on our audits. We are a public accounting firm registered with the Public Company Accounting Oversight Board (United States) (PCAOB) and are required to be independent with respect to the Partnership in accordance with the U.S. federal securities laws and the applicable rules and regulations of the Securities and Exchange Commission and the PCAOB. We conducted our audits in accordance with the standards of the PCAOB. Those standards require that we plan and perform the audits to obtain reasonable assurance about whether the consolidated financial statements are free of material misstatement, whether due to error or fraud, and whether effective internal control over financial reporting was maintained in all material respects. Our audits of the consolidated financial statements included performing procedures to assess the risks of material misstatement of the consolidated financial statements, whether due to error or fraud, and performing procedures that respond to those risks. Such procedures included examining, on a test basis, evidence regarding the amounts and disclosures in the consolidated financial statements. Our audits also included evaluating the accounting principles used and significant estimates made by management, as well as evaluating the overall presentation of the consolidated financial statements. Our audit of internal control over financial reporting included obtaining an understanding of internal control over financial reporting, assessing the risk that a material weakness exists, and testing and evaluating the design and operating effectiveness of internal control based on the assessed risk. Our audits also included performing such other procedures as we considered necessary in the circumstances. We believe that our audits provide a reasonable basis for our opinions. Definition and Limitations of Internal Control over Financial Reporting A company’s internal control over financial reporting is a process designed to provide reasonable assurance regarding the reliability of financial reporting and the preparation of financial statements for external purposes in accordance with generally accepted accounting principles. A company’s internal control over financial reporting includes those policies and procedures that (i) pertain to the maintenance of records that, in reasonable detail, accurately and fairly reflect the transactions and dispositions of the assets of the company; (ii) provide reasonable assurance that transactions are recorded as necessary to permit preparation of financial statements in accordance with generally accepted accounting principles, and that receipts and expenditures of the company are being made only in
F-3
accordance with authorizations of management and directors of the company; and (iii) provide reasonable assurance regarding prevention or timely detection of unauthorized acquisition, use, or disposition of the company’s assets that could have a material effect on the financial statements. Because of its inherent limitations, internal control over financial reporting may not prevent or detect misstatements. Also, projections of any evaluation of effectiveness to future periods are subject to the risk that controls may become inadequate because of changes in conditions, or that the degree of compliance with the policies or procedures may deteriorate. Critical Audit Matters The critical audit matter communicated below is a matter arising from the current period audit of the consolidated financial statements that was communicated or required to be communicated to the audit committee and that (i) relates to accounts or disclosures that are material to the consolidated financial statements and (ii) involved our especially challenging, subjective, or complex judgments. The communication of critical audit matters does not alter in any way our opinion on the consolidated financial statements, taken as a whole, and we are not, by communicating the critical audit matter below, providing a separate opinion on the critical audit matter or on the accounts or disclosures to which it relates. Accrued Insurance
As described in Notes 2 and 14 to the consolidated financial statements, the Partnership had accrued insurance liabilities of approximately $73 million as of September 26, 2020, which represents the estimated costs of known and anticipated or unasserted claims for incidents related to general and product, workers’ compensation and automobile liabilities. For each claim, the Partnership records a provision up to the estimated amount of the probable claim utilizing actuarially determined loss development factors applied to actual historical claims data. The Partnership is self-insured for these liabilities up to predetermined amounts above which third party insurance applies. The Partnership maintains insurance coverage such that its net exposure for insured claims is limited to the insurance deductible, claims above which are paid by the Partnership’s insurance carriers. For the portion of the estimated liability that exceeds insurance deductibles, the Partnership records an asset within other assets related to the amount of the liability expected to be covered by insurance, which amounted to approximately $18 million as of September 26, 2020.
The principal considerations for our determination that performing procedures relating to accrued insurance is a critical audit matter are there was significant judgment by management in determining the estimate of net exposure for estimated costs of known and anticipated or unasserted claims for self-insured liabilities arising from incidents related to general and product, workers’ compensation, and automobile liabilities. This in turn led to a high degree of auditor judgment, subjectivity, and effort in performing procedures and evaluating audit evidence relating to these determinations and management’s significant assumption for loss development factors. In addition, the audit effort involved the use of professionals with specialized skill and knowledge to assist in performing these procedures and evaluating the audit evidence obtained.
Addressing the matter involved performing procedures and evaluating audit evidence in connection with forming our overall opinion on the consolidated financial statements. These procedures included testing the effectiveness of controls relating to management’s accrued insurance calculation, including controls over the determination of loss development factors. These procedures also included, among others, testing management’s process for determining the net exposure for estimated costs of known and anticipated or unasserted claims for self-insured liabilities arising from incidents related to general and product, workers’ compensation, and automobile liabilities and management’s significant assumption for loss development factors. This included testing the completeness and accuracy of underlying data used by management. Evaluating management’s significant assumption related to loss development factors involved evaluating the historical claims data utilized by management in estimating the costs of known and anticipated or unasserted claims. Professionals with specialized skill and knowledge were used to assist in the evaluation of the appropriateness of the actuarial methods used by management and the reasonableness of management’s significant assumption for loss development factors used to estimate costs of known and anticipated or unasserted claims.
Florham Park, New Jersey
November 25, 2020 We have served as the Partnership’s auditor since 1995.

F-4
SUBURBAN PROPANE PARTNERS, L.P. AND SUBSIDIARIES
CONSOLIDATED BALANCE SHEETS (in thousands)
September 26, September 28, 2020 2019 ASSETS Current assets:
Cash and cash equivalents $ 3,140 $ 2,441 Accounts receivable, less allowance for doubtful accounts of $4,473 and $2,573, respectively 55,441 59,340 Inventories 46,869 45,036 Other current assets 10,508 16,623
Total current assets 115,958 123,440 Property, plant and equipment, net 597,454 627,207 Operating lease right-of-use assets (See Notes 2 and 8) 119,594 — Goodwill 1,103,781 1,098,085 Other intangible assets, net 84,140 128,437 Other assets 26,326 21,179
Total assets $ 2,047,253 $ 1,998,348 LIABILITIES AND PARTNERS' CAPITAL Current liabilities:
Accounts payable $ 31,985 $ 34,085 Accrued employment and benefit costs 35,214 34,688 Accrued insurance 15,400 15,765
Customer deposits and advances 104,427 97,854 Operating lease liabilities (See Notes 2 and 8) 26,436 —
Accrued interest 13,413 14,018 Other current liabilities 17,641 19,720
Total current liabilities 244,516 216,130 Long-term borrowings 1,210,176 1,227,057 Accrued insurance 57,542 51,514 Operating lease liabilities (See Notes 2 and 8) 92,668 — Other liabilities 79,970 79,817
Total liabilities 1,684,872 1,574,518 Commitments and contingencies Partners' capital:
Common Unitholders (62,146 and 61,735 units issued and outstanding at September 26, 2020 and September 28, 2019, respectively) 388,157 450,016 Accumulated other comprehensive loss (25,776 ) (26,186 )
Total partners' capital 362,381 423,830 Total liabilities and partners' capital $ 2,047,253 $ 1,998,348
The accompanying notes are an integral part of these consolidated financial statements.

F-5
SUBURBAN PROPANE PARTNERS, L.P. AND SUBSIDIARIES
CONSOLIDATED STATEMENTS OF OPERATIONS (in thousands, except per unit amounts)
Year Ended September 26, September 28, September 29, 2020 2019 2018
Revenues Propane $ 955,143 $ 1,083,446 $ 1,153,323 Fuel oil and refined fuels 75,039 92,084 91,520 Natural gas and electricity 31,184 45,206 54,308 All other 46,531 46,969 45,262
1,107,897 1,267,705 1,344,413 Costs and expenses
Cost of products sold 382,951 521,988 592,630 Operating 401,958 402,957 397,489 General and administrative 65,927 71,034 66,246 Depreciation and amortization 116,791 120,872 125,222
967,627 1,116,851 1,181,587 Loss on sale of business — — (4,823 ) Operating income 140,270 150,854 158,003 Loss on debt extinguishment 109 — — Interest expense, net 74,727 76,663 77,383 Other, net 4,822 4,702 4,692 Income before (benefit from) provision for income taxes 60,612 69,489 75,928 (Benefit from) provision for income taxes (146 ) 857 (606 ) Net income $ 60,758 $ 68,632 $ 76,534 Net income per Common Unit - basic $ 0.98 $ 1.11 $ 1.24 Weighted average number of Common Units outstanding - basic 62,299 61,992 61,557 Net income per Common Unit - diluted $ 0.97 $ 1.10 $ 1.24 Weighted average number of Common Units outstanding - diluted 62,727 62,366 61,847 The accompanying notes are an integral part of these consolidated financial statements.

F-6
SUBURBAN PROPANE PARTNERS, L.P. AND SUBSIDIARIES
CONSOLIDATED STATEMENTS OF COMPREHENSIVE INCOME (in thousands)
Year Ended September 26, September 28, September 29, 2020 2019 2018
Net income $ 60,758 $ 68,632 $ 76,534 Other comprehensive (loss) income:
Amortization of net actuarial losses and prior service credits into earnings and net change in funded status of benefit plans (641 ) (1,516 ) 4,142 Recognition in earnings of net actuarial loss for pension settlement 1,051 — —
Other comprehensive income (loss) 410 (1,516 ) 4,142 Total comprehensive income $ 61,168 $ 67,116 $ 80,676 The accompanying notes are an integral part of these consolidated financial statements.

F-7
SUBURBAN PROPANE PARTNERS, L.P. AND SUBSIDIARIES
CONSOLIDATED STATEMENTS OF CASH FLOWS (in thousands)
Year Ended September 26, September 28, September 29, 2020 2019 2018
Cash flows from operating activities: Net income $ 60,758 $ 68,632 $ 76,534 Adjustments to reconcile net income to net cash provided by operations:
Depreciation and amortization 116,791 120,872 125,222 Compensation costs recognized under Restricted Unit Plans 9,242 10,521 8,198 Loss on sale of business — — 4,823 Loss on debt extinguishment 109 — — Pension settlement charge 1,051 — — Other, net 923 1,688 1,150
Changes in assets and liabilities: Accounts receivable 4,466 11,821 (5,183 ) Inventories (1,583 ) 14,353 (5,729 ) Other current and noncurrent assets (9,753 ) 8,209 (5,362 ) Accounts payable 1,511 (6,960 ) 809 Accrued employment and benefit costs 526 2,284 5,000 Accrued insurance 5,663 (3,288 ) 1,986 Customer deposits and advances 6,573 2,371 (1,540 ) Contributions to defined benefit pension plan (3,835 ) (5,350 ) (4,764 ) Other current and noncurrent liabilities 16,912 1,628 9,268
Net cash provided by operating activities 209,354 226,781 210,412 Cash flows from investing activities:
Capital expenditures (32,498 ) (34,978 ) (32,902 ) Investment in and acquisition of businesses (25,636 ) (19,300 ) (14,873 ) Proceeds from sale of property, plant and equipment 4,891 5,763 5,885 Proceeds from sale of business — — 2,800
Net cash (used in) investing activities (53,243 ) (48,515 ) (39,090 ) Cash flows from financing activities:
Proceeds from borrowings under revolving credit facility 493,000 370,700 350,100 Repayments of borrowings under revolving credit facility (511,900 ) (400,800 ) (369,145 ) Issuance costs associated with long-term borrowings (2,665 ) — — Partnership distributions (130,206 ) (147,882 ) (147,185 ) Other, net (3,641 ) (3,007 ) (2,717 )
Net cash (used in) financing activities (155,412 ) (180,989 ) (168,947 ) Net increase (decrease) in cash and cash equivalents 699 (2,723 ) 2,375 Cash and cash equivalents at beginning of period 2,441 5,164 2,789 Cash and cash equivalents at end of period $ 3,140 $ 2,441 $ 5,164 Supplemental disclosure of cash flow information: Cash paid for interest $ 72,024 $ 73,221 $ 74,121 The accompanying notes are an integral part of these consolidated financial statements.
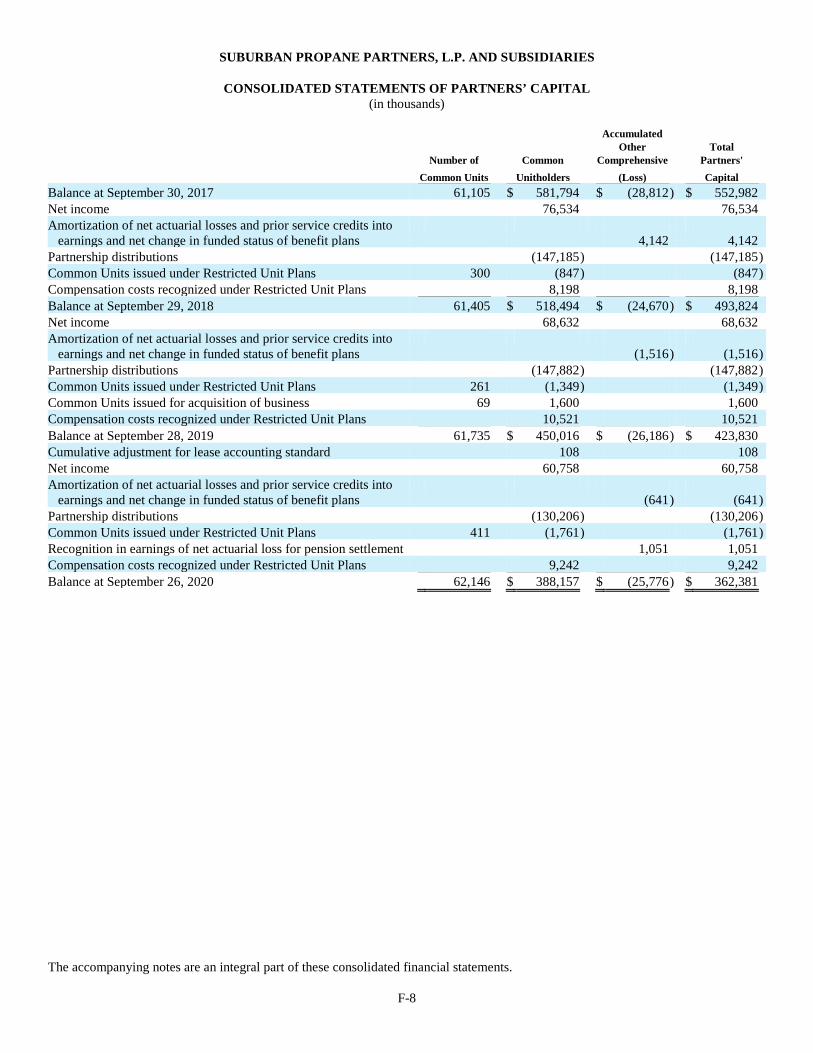
F-8
SUBURBAN PROPANE PARTNERS, L.P. AND SUBSIDIARIES
CONSOLIDATED STATEMENTS OF PARTNERS’ CAPITAL (in thousands)
Accumulated Other Total Number of Common Comprehensive Partners' Common Units Unitholders (Loss) Capital
Balance at September 30, 2017 61,105 $ 581,794 $ (28,812 ) $ 552,982 Net income 76,534 76,534 Amortization of net actuarial losses and prior service credits into earnings and net change in funded status of benefit plans 4,142 4,142 Partnership distributions (147,185 ) (147,185 ) Common Units issued under Restricted Unit Plans 300 (847 ) (847 ) Compensation costs recognized under Restricted Unit Plans 8,198 8,198 Balance at September 29, 2018 61,405 $ 518,494 $ (24,670 ) $ 493,824 Net income 68,632 68,632 Amortization of net actuarial losses and prior service credits into earnings and net change in funded status of benefit plans (1,516 ) (1,516 ) Partnership distributions (147,882 ) (147,882 ) Common Units issued under Restricted Unit Plans 261 (1,349 ) (1,349 ) Common Units issued for acquisition of business 69 1,600 1,600 Compensation costs recognized under Restricted Unit Plans 10,521 10,521 Balance at September 28, 2019 61,735 $ 450,016 $ (26,186 ) $ 423,830 Cumulative adjustment for lease accounting standard 108 108 Net income 60,758 60,758 Amortization of net actuarial losses and prior service credits into earnings and net change in funded status of benefit plans (641 ) (641 ) Partnership distributions (130,206 ) (130,206 ) Common Units issued under Restricted Unit Plans 411 (1,761 ) (1,761 ) Recognition in earnings of net actuarial loss for pension settlement 1,051 1,051 Compensation costs recognized under Restricted Unit Plans 9,242 9,242 Balance at September 26, 2020 62,146 $ 388,157 $ (25,776 ) $ 362,381 The accompanying notes are an integral part of these consolidated financial statements.
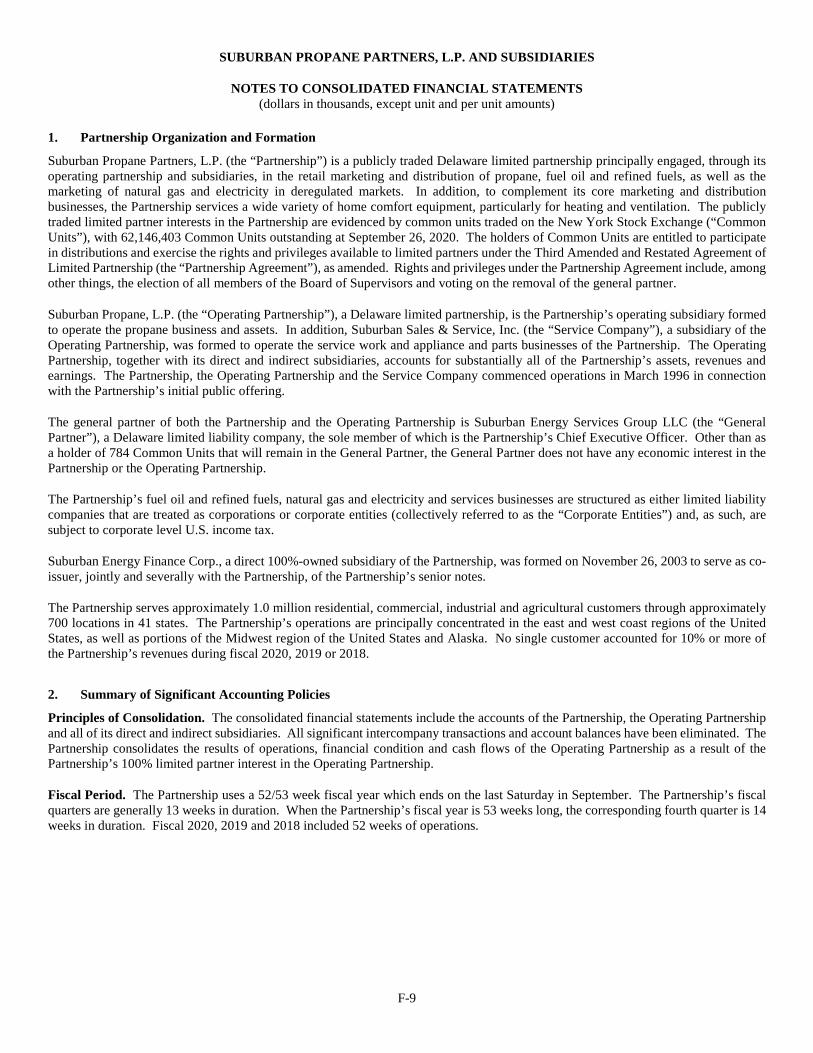
F-9
SUBURBAN PROPANE PARTNERS, L.P. AND SUBSIDIARIES
NOTES TO CONSOLIDATED FINANCIAL STATEMENTS (dollars in thousands, except unit and per unit amounts)
1. Partnership Organization and Formation
Suburban Propane Partners, L.P. (the “Partnership”) is a publicly traded Delaware limited partnership principally engaged, through its operating partnership and subsidiaries, in the retail marketing and distribution of propane, fuel oil and refined fuels, as well as the marketing of natural gas and electricity in deregulated markets. In addition, to complement its core marketing and distribution businesses, the Partnership services a wide variety of home comfort equipment, particularly for heating and ventilation. The publicly traded limited partner interests in the Partnership are evidenced by common units traded on the New York Stock Exchange (“Common Units”), with 62,146,403 Common Units outstanding at September 26, 2020. The holders of Common Units are entitled to participate in distributions and exercise the rights and privileges available to limited partners under the Third Amended and Restated Agreement of Limited Partnership (the “Partnership Agreement”), as amended. Rights and privileges under the Partnership Agreement include, among other things, the election of all members of the Board of Supervisors and voting on the removal of the general partner.
Suburban Propane, L.P. (the “Operating Partnership”), a Delaware limited partnership, is the Partnership’s operating subsidiary formed to operate the propane business and assets. In addition, Suburban Sales & Service, Inc. (the “Service Company”), a subsidiary of the Operating Partnership, was formed to operate the service work and appliance and parts businesses of the Partnership. The Operating Partnership, together with its direct and indirect subsidiaries, accounts for substantially all of the Partnership’s assets, revenues and earnings. The Partnership, the Operating Partnership and the Service Company commenced operations in March 1996 in connection with the Partnership’s initial public offering.
The general partner of both the Partnership and the Operating Partnership is Suburban Energy Services Group LLC (the “General Partner”), a Delaware limited liability company, the sole member of which is the Partnership’s Chief Executive Officer. Other than as a holder of 784 Common Units that will remain in the General Partner, the General Partner does not have any economic interest in the Partnership or the Operating Partnership.
The Partnership’s fuel oil and refined fuels, natural gas and electricity and services businesses are structured as either limited liability companies that are treated as corporations or corporate entities (collectively referred to as the “Corporate Entities”) and, as such, are subject to corporate level U.S. income tax.
Suburban Energy Finance Corp., a direct 100%-owned subsidiary of the Partnership, was formed on November 26, 2003 to serve as co-issuer, jointly and severally with the Partnership, of the Partnership’s senior notes.
The Partnership serves approximately 1.0 million residential, commercial, industrial and agricultural customers through approximately 700 locations in 41 states. The Partnership’s operations are principally concentrated in the east and west coast regions of the United States, as well as portions of the Midwest region of the United States and Alaska. No single customer accounted for 10% or more of the Partnership’s revenues during fiscal 2020, 2019 or 2018.
2. Summary of Significant Accounting Policies
Principles of Consolidation. The consolidated financial statements include the accounts of the Partnership, the Operating Partnership and all of its direct and indirect subsidiaries. All significant intercompany transactions and account balances have been eliminated. The Partnership consolidates the results of operations, financial condition and cash flows of the Operating Partnership as a result of the Partnership’s 100% limited partner interest in the Operating Partnership.
Fiscal Period. The Partnership uses a 52/53 week fiscal year which ends on the last Saturday in September. The Partnership’s fiscal quarters are generally 13 weeks in duration. When the Partnership’s fiscal year is 53 weeks long, the corresponding fourth quarter is 14 weeks in duration. Fiscal 2020, 2019 and 2018 included 52 weeks of operations.

F-10
Revenue Recognition. On the first day of fiscal 2019, the Partnership adopted the new accounting guidance regarding revenue recognition under the Financial Accounting Standards Board (“FASB”) Accounting Standards Update (“ASU”) 2014-09 “Revenue from Contracts with Customers” (“Topic 606”) and all related amendments using the full retrospective method. Topic 606 provides a five-step model to be applied to all contracts with customers. The five steps are to identify the contract(s) with the customer, identify the performance obligations in the contract, determine the transaction price, allocate the transaction price to the performance obligations in the contract and recognize revenue when each performance obligation is satisfied. The adoption of this standard had no impact on the Partnership’s consolidated statements of financial position, operations or cash flows.
Revenue is recognized by the Partnership when goods or services promised in a contract with a customer have been transferred, and no further performance obligation on that transfer is required, in an amount that reflects the consideration expected to be received. Performance obligations are determined and evaluated based on the specific terms of the arrangements and the distinct products and services offered. Due to the nature of the retail business of the Partnership, there are no remaining or unsatisfied performance obligations as of the end of the reporting period, except for tank rental agreements, maintenance service contracts, fixed price contracts and budgetary programs, as described below. The performance obligation associated with sales of propane, fuel oil and refined fuels is met at the time product is delivered to the customer. Revenue from the sale of appliances and equipment is recognized at the time of sale or when installation is complete, as defined by the performance obligations included within the related customer contract. Revenue from repairs, maintenance and other service activities is recognized upon completion of the service. Revenue from the sale of natural gas and electricity is recognized based on customer usage as determined by meter readings for amounts delivered, an immaterial amount of which may be unbilled at the end of each accounting period.
The Partnership defers the recognition of revenue for annually billed tank rent, maintenance service contracts, fixed price contracts and budgetary programs where customer consideration is received at the start of the contract period, establishing contract liabilities which are disclosed as customer deposits and advances on the consolidated balance sheets. Deliveries to customers enrolled in budgetary programs that exceed billings to those customers establish contract assets which are included in accounts receivable on the consolidated balance sheets. The Partnership ratably recognizes revenue over the applicable term for tank rent and maintenance service agreements, which is generally one year, and at the time of delivery for fixed price contracts and budgetary programs.
The Partnership incurs incremental direct costs, such as commissions to its salesforce, to obtain certain contracts. These costs are expensed as incurred, consistent with the practical expedients issued by the FASB, since the expected amortization period is one year or less. The Partnership generally determines selling prices based on, among other things, the current weighted average cost and the current replacement cost of the product at the time of delivery, plus an applicable margin. Except for tank rental agreements, maintenance service contracts, fixed price contracts and budgetary programs, customer payments for the satisfaction of a performance obligation are due upon receipt.
Fair Value Measurements. The Partnership measures certain of its assets and liabilities at fair value, which is defined as the price that would be received to sell an asset or paid to transfer a liability in an orderly transaction between market participants – in either the principal market or the most advantageous market. The principal market is the market with the greatest level of activity and volume for the asset or liability.
The common framework for measuring fair value utilizes a three-level hierarchy to prioritize the inputs used in the valuation techniques to derive fair values. The basis for fair value measurements for each level within the hierarchy is described below with Level 1 having the highest priority and Level 3 having the lowest.
• Level 1: Quoted prices in active markets for identical assets or liabilities.
• Level 2: Quoted prices in active markets for similar assets or liabilities; quoted prices for identical or similar instruments in markets that are not active; and model-derived valuations in which all significant inputs are observable in active markets.
• Level 3: Valuations derived from valuation techniques in which one or more significant inputs are unobservable.
Business Combinations. The Partnership accounts for business combinations using the acquisition method and accordingly, the assets and liabilities of the acquired entities are recorded at their estimated fair values at the acquisition date. Goodwill represents the excess of the purchase price over the fair value of the net assets acquired, including the amount assigned to identifiable intangible assets. The primary drivers that generate goodwill are the value of synergies between the acquired entities and the Partnership, and the acquired assembled workforce, neither of which qualifies as an identifiable intangible asset. Identifiable intangible assets with finite lives are amortized over their useful lives. The results of operations of acquired businesses are included in the consolidated financial statements from the acquisition date. The Partnership expenses all acquisition-related costs as incurred.
Use of Estimates. The preparation of financial statements in conformity with accounting principles generally accepted in the United States of America (“US GAAP”) requires management to make estimates and assumptions that affect the reported amounts of assets and liabilities and disclosure of contingent assets and liabilities at the date of the financial statements and the reported amounts of revenues and expenses during the reporting period. Estimates have been made by management in the areas of self-insurance and
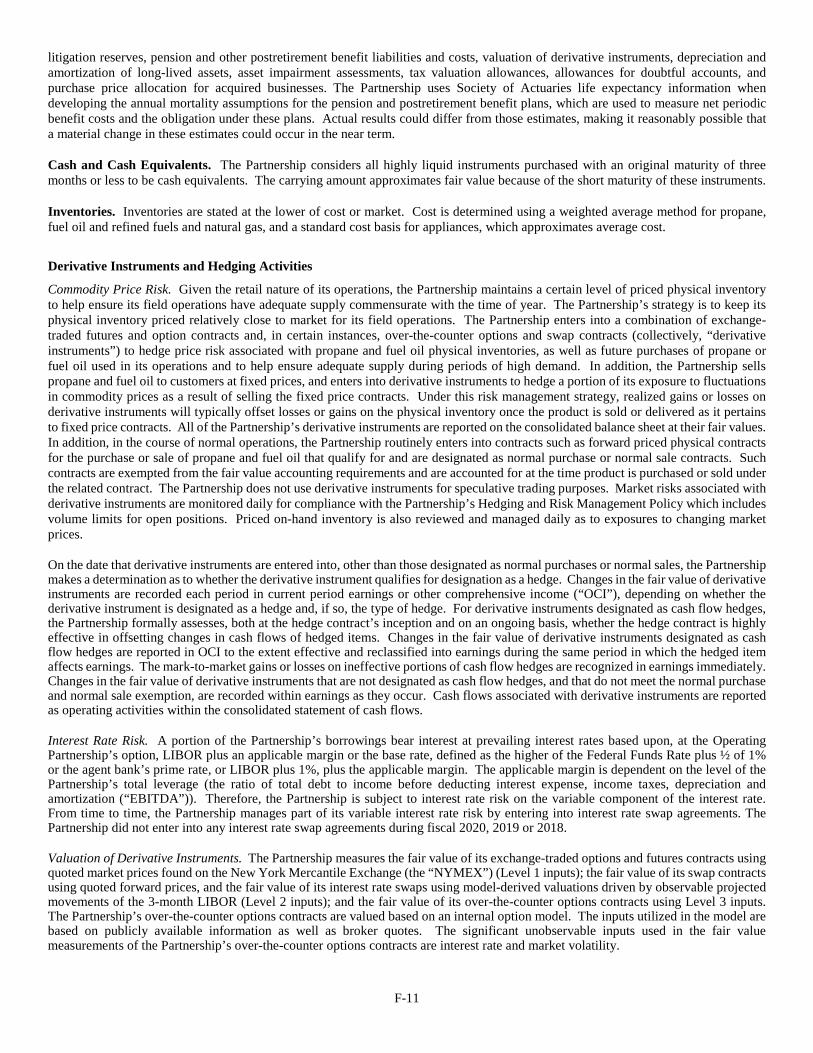
F-11
litigation reserves, pension and other postretirement benefit liabilities and costs, valuation of derivative instruments, depreciation and amortization of long-lived assets, asset impairment assessments, tax valuation allowances, allowances for doubtful accounts, and purchase price allocation for acquired businesses. The Partnership uses Society of Actuaries life expectancy information when developing the annual mortality assumptions for the pension and postretirement benefit plans, which are used to measure net periodic benefit costs and the obligation under these plans. Actual results could differ from those estimates, making it reasonably possible that a material change in these estimates could occur in the near term.
Cash and Cash Equivalents. The Partnership considers all highly liquid instruments purchased with an original maturity of three months or less to be cash equivalents. The carrying amount approximates fair value because of the short maturity of these instruments.
Inventories. Inventories are stated at the lower of cost or market. Cost is determined using a weighted average method for propane, fuel oil and refined fuels and natural gas, and a standard cost basis for appliances, which approximates average cost.
Derivative Instruments and Hedging Activities
Commodity Price Risk. Given the retail nature of its operations, the Partnership maintains a certain level of priced physical inventory to help ensure its field operations have adequate supply commensurate with the time of year. The Partnership’s strategy is to keep its physical inventory priced relatively close to market for its field operations. The Partnership enters into a combination of exchange-traded futures and option contracts and, in certain instances, over-the-counter options and swap contracts (collectively, “derivative instruments”) to hedge price risk associated with propane and fuel oil physical inventories, as well as future purchases of propane or fuel oil used in its operations and to help ensure adequate supply during periods of high demand. In addition, the Partnership sells propane and fuel oil to customers at fixed prices, and enters into derivative instruments to hedge a portion of its exposure to fluctuations in commodity prices as a result of selling the fixed price contracts. Under this risk management strategy, realized gains or losses on derivative instruments will typically offset losses or gains on the physical inventory once the product is sold or delivered as it pertains to fixed price contracts. All of the Partnership’s derivative instruments are reported on the consolidated balance sheet at their fair values. In addition, in the course of normal operations, the Partnership routinely enters into contracts such as forward priced physical contracts for the purchase or sale of propane and fuel oil that qualify for and are designated as normal purchase or normal sale contracts. Such contracts are exempted from the fair value accounting requirements and are accounted for at the time product is purchased or sold under the related contract. The Partnership does not use derivative instruments for speculative trading purposes. Market risks associated with derivative instruments are monitored daily for compliance with the Partnership’s Hedging and Risk Management Policy which includes volume limits for open positions. Priced on-hand inventory is also reviewed and managed daily as to exposures to changing market prices.
On the date that derivative instruments are entered into, other than those designated as normal purchases or normal sales, the Partnership makes a determination as to whether the derivative instrument qualifies for designation as a hedge. Changes in the fair value of derivative instruments are recorded each period in current period earnings or other comprehensive income (“OCI”), depending on whether the derivative instrument is designated as a hedge and, if so, the type of hedge. For derivative instruments designated as cash flow hedges, the Partnership formally assesses, both at the hedge contract’s inception and on an ongoing basis, whether the hedge contract is highly effective in offsetting changes in cash flows of hedged items. Changes in the fair value of derivative instruments designated as cash flow hedges are reported in OCI to the extent effective and reclassified into earnings during the same period in which the hedged item affects earnings. The mark-to-market gains or losses on ineffective portions of cash flow hedges are recognized in earnings immediately. Changes in the fair value of derivative instruments that are not designated as cash flow hedges, and that do not meet the normal purchase and normal sale exemption, are recorded within earnings as they occur. Cash flows associated with derivative instruments are reported as operating activities within the consolidated statement of cash flows.
Interest Rate Risk. A portion of the Partnership’s borrowings bear interest at prevailing interest rates based upon, at the Operating Partnership’s option, LIBOR plus an applicable margin or the base rate, defined as the higher of the Federal Funds Rate plus ½ of 1% or the agent bank’s prime rate, or LIBOR plus 1%, plus the applicable margin. The applicable margin is dependent on the level of the Partnership’s total leverage (the ratio of total debt to income before deducting interest expense, income taxes, depreciation and amortization (“EBITDA”)). Therefore, the Partnership is subject to interest rate risk on the variable component of the interest rate. From time to time, the Partnership manages part of its variable interest rate risk by entering into interest rate swap agreements. The Partnership did not enter into any interest rate swap agreements during fiscal 2020, 2019 or 2018.
Valuation of Derivative Instruments. The Partnership measures the fair value of its exchange-traded options and futures contracts using quoted market prices found on the New York Mercantile Exchange (the “NYMEX”) (Level 1 inputs); the fair value of its swap contracts using quoted forward prices, and the fair value of its interest rate swaps using model-derived valuations driven by observable projected movements of the 3-month LIBOR (Level 2 inputs); and the fair value of its over-the-counter options contracts using Level 3 inputs. The Partnership’s over-the-counter options contracts are valued based on an internal option model. The inputs utilized in the model are based on publicly available information as well as broker quotes. The significant unobservable inputs used in the fair value measurements of the Partnership’s over-the-counter options contracts are interest rate and market volatility.

F-12
Long-Lived Assets
Property, plant and equipment. Property, plant and equipment are stated at cost. Expenditures for maintenance and routine repairs are expensed as incurred while betterments are capitalized as additions to the related assets and depreciated over the asset’s remaining useful life. The Partnership capitalizes costs incurred in the acquisition and modification of computer software used internally, including consulting fees and costs of employees dedicated solely to a specific project. At the time assets are retired, or otherwise disposed of, the asset and related accumulated depreciation are removed from the accounts, and any resulting gain or loss is recognized within operating expenses. Depreciation is determined under the straight-line method based upon the estimated useful life of the asset as follows:
Buildings 40 Years Building and land improvements 20 Years Transportation equipment 3-10 Years Storage facilities 7-30 Years Office equipment 5-10 Years Tanks and cylinders 10-40 Years Computer software 3-7 Years
The weighted average estimated useful life of the Partnership’s storage facilities and tanks and cylinders is approximately 23 years and 28 years, respectively.
The Partnership reviews the recoverability of long-lived assets when circumstances occur that indicate that the carrying value of an asset may not be recoverable. Such circumstances include a significant adverse change in the manner in which an asset is being used, current operating losses combined with a history of operating losses experienced by the asset or a current expectation that an asset will be sold or otherwise disposed of before the end of its previously estimated useful life. Evaluation of possible impairment is based on the Partnership’s ability to recover the value of the asset from the future undiscounted cash flows expected to result from the use and eventual disposition of the asset. If the expected undiscounted cash flows are less than the carrying amount of such asset, an impairment loss is recorded as the amount by which the carrying amount of an asset exceeds its fair value. The fair value of an asset will be measured using the best information available, including prices for similar assets or the result of using a discounted cash flow valuation technique.
Goodwill. Goodwill represents the excess of the purchase price over the fair value of net assets acquired. Goodwill is subject to an impairment review at a reporting unit level, on an annual basis as of the end of fiscal July of each year, or when an event occurs or circumstances change that would indicate potential impairment.
The Partnership has the option to first assess qualitative factors to determine whether the existence of events or circumstances leads to a determination that it is more likely than not that the fair value of a reporting unit is less than its carrying amount. If, after assessing the totality of events or circumstances, an entity determines it is not more likely than not that the fair value of a reporting unit is less than its carrying amount, then performing the two-step impairment test is unnecessary. However, if an entity concludes otherwise, then it is required to perform the first step of the two-step impairment test.
Under the two-step impairment test, the Partnership assesses the carrying value of goodwill at a reporting unit level based on an estimate of the fair value of the respective reporting unit. Fair value of the reporting unit is estimated using discounted cash flow analyses taking into consideration estimated cash flows in a ten-year projection period and a terminal value calculation at the end of the projection period. If the fair value of the reporting unit exceeds its carrying value, the goodwill associated with the reporting unit is not considered to be impaired. If the carrying value of the reporting unit exceeds its fair value, an impairment loss is recognized to the extent that the carrying amount of the associated goodwill, if any, exceeds the implied fair value of the goodwill.
Other Intangible Assets. Other intangible assets consist of customer relationships, tradenames, non-compete agreements and leasehold interests. Customer relationships and tradenames are amortized under the straight-line method over the estimated period for which the assets are expected to contribute to the future cash flows of the reporting entities to which they relate, ending periodically between fiscal years 2021 and 2031. Non-compete agreements are amortized under the straight-line method over the periods of the related agreements. Leasehold interests are amortized under the straight-line method over the shorter of the lease term or the useful life of the related assets, through fiscal 2025.

F-13
Accrued Insurance. Accrued insurance represents the estimated costs of known and anticipated or unasserted claims for incidents related to general and product, workers’ compensation and automobile liability. For each claim, the Partnership records a provision up to the estimated amount of the probable claim utilizing actuarially determined loss development factors applied to actual claims data. The Partnership is self-insured for these liabilities up to predetermined amounts above which third party insurance applies. The Partnership maintains insurance coverage such that its net exposure for insured claims is limited to the insurance deductible, claims above which are paid by the Partnership’s insurance carriers. For the portion of the estimated liability that exceeds insurance deductibles, the Partnership records an asset related to the amount of the liability expected to be covered by insurance.
Pension and Other Postretirement Benefits. The Partnership estimates the rate of return on plan assets, the discount rate used to estimate the present value of future benefit obligations and the expected cost of future health care benefits in determining its annual pension and other postretirement benefit costs. The Partnership uses Society of Actuaries mortality tables (RP-2014), mortality improvement scales (MP-2019) and other actuarial life expectancy information when developing the annual mortality assumptions for the pension and postretirement benefit plans, which are used to measure net periodic benefit costs and the obligation under these plans.
Customer Deposits and Advances. The Partnership offers different payment programs to its customers including the ability to prepay for usage and to make equal monthly payments on account under a budget payment plan. The Partnership establishes a liability within customer deposits and advances for amounts collected in advance of deliveries.
Income Taxes. As discussed in Note 1, the Partnership structure consists of two limited partnerships, the Partnership and the Operating Partnership, and the Corporate Entities. For federal income tax purposes, as well as for state income tax purposes in the majority of the states in which the Partnership operates, the earnings attributable to the Partnership and the Operating Partnership are included in the tax returns of the Common Unitholders. As a result, except for certain states that impose an income tax on partnerships, no income tax expense is reflected in the Partnership’s consolidated financial statements relating to the earnings of the Partnership and the Operating Partnership. The earnings attributable to the Corporate Entities are subject to federal and state income tax. Net earnings for financial statement purposes may differ significantly from taxable income reportable to Common Unitholders as a result of differences between the tax basis and financial reporting basis of assets and liabilities and the taxable income allocation requirements under the Partnership Agreement.
Income taxes for the Corporate Entities are provided based on the asset and liability approach to accounting for income taxes. Under this method, deferred tax assets and liabilities are recognized for the expected future tax consequences of differences between the carrying amounts and the tax basis of assets and liabilities using enacted tax rates in effect for the year in which the differences are expected to reverse. The effect on deferred tax assets and liabilities of a change in tax rates is recognized in income in the period when the change is enacted. A valuation allowance is recorded to reduce the carrying amounts of deferred tax assets when it is more likely than not that the full amount will not be realized.
Loss Contingencies. In the normal course of business, the Partnership is involved in various claims and legal proceedings. The Partnership records a liability for such matters when it is probable that a loss has been incurred and the amounts can be reasonably estimated. The liability includes probable and estimable legal costs to the point in the legal matter where the Partnership believes a conclusion to the matter will be reached. When only a range of possible loss can be established, the most probable amount in the range is accrued. If no amount within this range is a better estimate than any other amount within the range, the minimum amount in the range is accrued.
Asset Retirement Obligations. Asset retirement obligations apply to legal obligations associated with the retirement of long-lived assets that result from the acquisition, construction, development and/or the normal operation of a long-lived asset. The Partnership has recognized asset retirement obligations for certain costs to remove and properly dispose of underground and aboveground fuel oil storage tanks and contractually mandated removal of leasehold improvements.
The Partnership records a liability at fair value for the estimated cost to settle an asset retirement obligation at the time that liability is incurred, which is generally when the asset is purchased, constructed or leased. The Partnership records the liability, which is referred to as the asset retirement obligation, when it has a legal obligation to incur costs to retire the asset and when a reasonable estimate of the fair value of the liability can be made. If a reasonable estimate cannot be made at the time the liability is incurred, the Partnership records the liability when sufficient information is available to estimate the liability’s fair value.
Unit-Based Compensation. The Partnership recognizes compensation cost over the respective service period for employee services received in exchange for an award of equity or equity-based compensation based on the grant date fair value of the award. The Partnership measures liability awards under an equity-based payment arrangement based on remeasurement of the award’s fair value at the conclusion of each interim and annual reporting period until the date of settlement, taking into consideration the probability that the performance conditions will be satisfied.
F-14
Costs and Expenses. The cost of products sold reported in the consolidated statements of operations represents the weighted average unit cost of propane, fuel oil and refined fuels, as well as the cost of natural gas and electricity sold, including transportation costs to deliver product from the Partnership’s supply points to storage or to the Partnership’s customer service centers. Cost of products sold also includes the cost of appliances, equipment and related parts sold or installed by the Partnership’s customer service centers computed on a basis that approximates the average cost of the products. Unrealized non-cash gains or losses from changes in the fair value of commodity derivative instruments that are not designated as cash flow hedges are recorded in each reporting period within cost of products sold. Cost of products sold is reported exclusive of any depreciation and amortization as such amounts are reported separately within the consolidated statements of operations.
All other costs of operating the Partnership’s retail propane, fuel oil and refined fuels distribution and appliance sales and service operations, as well as the natural gas and electricity marketing business, are reported within operating expenses in the consolidated statements of operations. These operating expenses include the compensation and benefits of field and direct operating support personnel, costs of operating and maintaining the vehicle fleet, overhead and other costs of the purchasing, training and safety departments and other direct and indirect costs of operating the Partnership’s customer service centers.
All costs of back office support functions, including compensation and benefits for executives and other support functions, as well as other costs and expenses to maintain finance and accounting, treasury, legal, human resources, corporate development and the information systems functions are reported within general and administrative expenses in the consolidated statements of operations.
Net Income Per Unit. Computations of basic income per Common Unit are performed by dividing net income by the weighted average number of outstanding Common Units, and vested (and unissued) restricted units granted under the Partnership’s Restricted Unit Plans, as defined below, to retirement-eligible grantees. Computations of diluted income per Common Unit are performed by dividing net income by the weighted average number of outstanding Common Units and unissued restricted units granted under the Restricted Unit Plans. In computing diluted net income per Common Unit, weighted average units outstanding used to compute basic net income per Common Unit were increased by 427,504, 373,370 and 290,020 units for fiscal 2020, 2019 and 2018, respectively, to reflect the potential dilutive effect of the unvested restricted units outstanding using the treasury stock method.
Comprehensive Income. The Partnership reports comprehensive income (the total of net income and all other non-owner changes in partners’ capital) within the consolidated statement of comprehensive income. Other comprehensive income includes unrealized gains and losses on derivative instruments accounted for as cash flow hedges and reclassifications of realized losses on cash flow hedges into earnings, amortization of net actuarial losses and prior service credits into earnings and changes in the funded status of pension and other postretirement benefit plans, and net actuarial losses recognized in earnings associated with pension settlements.
Recently Issued Accounting Pronouncements. In January 2017, the FASB issued ASU 2017-04, “Simplifying the Test for Goodwill Impairment” (“Topic 350”). This update eliminates the requirement to perform a hypothetical purchase price allocation to measure goodwill impairment. In testing goodwill for impairment, an entity may elect to utilize a qualitative assessment to evaluate whether it is more likely than not that the fair value of a reporting unit is less than its carrying amount. If the qualitative assessment indicates that goodwill impairment is more likely than not, an entity should perform its annual or interim goodwill impairment test by comparing the fair value of a reporting unit to its carrying amount and recognize an impairment charge for the amount by which the carrying amount exceeds the reporting unit's fair value, not to exceed the total amount of goodwill allocated to the reporting unit. Topic 350 is effective for the first interim period within annual reporting periods beginning after December 15, 2019, which is the Partnership’s first quarter of fiscal 2021. The Partnership does not expect that the adoption of Topic 350 will have a material impact on the Partnership’s consolidated financial statements.
In June 2016, the FASB issued ASU 2016-13, “Financial Instruments - Credit Losses” (“Topic 326”). This amendment introduces an expected credit loss impairment model which requires an initial recognition of anticipated losses over the full lifetime of certain financial assets, rather than upon the incurrence of an actual loss. Topic 326 is effective for the first interim period within annual reporting periods beginning after December 15, 2019, which is the Partnership’s first quarter of fiscal 2021. The Partnership does not expect that the adoption of Topic 326 will have a material impact on the Partnership’s consolidated financial statements.
Recently Adopted Accounting Pronouncements. On September 29, 2019, the first day of fiscal 2020, the Partnership adopted the new leases accounting guidance under ASU 2016-02 “Leases” (“Topic 842”), including the related amendments thereto. Topic 842 amended the existing accounting standards for lease accounting, including requiring lessees to recognize most leases on their balance sheets. The Partnership adopted the guidance under Topic 842 using a modified retrospective transition approach for all leases existing at, or entered into after, the date of initial application. The adoption of Topic 842 resulted in the recognition of operating lease right-of-use assets and corresponding lease liabilities on the Partnership’s condensed consolidated balance sheet as of September 29, 2019 of approximately $103,100, but did not have an impact on the Partnership’s other condensed consolidated financial statements or on its financial metrics used for debt covenant compliance. See Note 8, “Leases” for more information.

F-15
3. Disaggregation of Revenue
The following table disaggregates revenue for each customer type. See Note 17, “Segment Information” for more information on segment reporting wherein it is disclosed that the Partnership’s Propane, Fuel Oil and Refined Fuels and Natural Gas and Electricity reportable segments generated approximately 85%, 7% and 4%, respectively, of the Partnership’s revenue from its reportable segments for all periods presented. The propane segment contributes the majority of the Partnership’s revenue and the concentration of revenue by customer type for the propane segment is not materially different from the consolidated revenue.
Year Ended September 26, September 28, September 29, 2020 2019 2018
Retail Residential $ 654,265 $ 731,468 $ 759,468 Commercial 283,021 333,078 354,493 Industrial 92,969 104,992 109,740 Agricultural 33,718 39,937 44,581 Government 43,441 53,764 56,598
Wholesale 483 4,466 19,533 Total revenues $ 1,107,897 $ 1,267,705 $ 1,344,413
The Partnership recognized $67,117, $66,697 and $61,384 of revenue during fiscal 2020, fiscal 2019 and fiscal 2018, respectively, for annually billed tank rent, maintenance service contracts, fixed price contracts and budgetary programs where customer consideration was received at the start of the contract period and which was included in contract liabilities as of the beginning of each respective period. Contract assets of $4,700 and $7,051 relating to deliveries to customers enrolled in budgetary programs that exceeded billings to those customers were included in accounts receivable as of September 26, 2020 and September 28, 2019, respectively.
4. Investment in and Acquisition and Disposition of Businesses
On September 17, 2020, the Operating Partnership purchased a 39% equity stake in Oberon Fuels, Inc. (“Oberon”) based in San Diego, California and also purchased a secured convertible note issued by Oberon. Oberon, a development-stage producer of low carbon, renewable dimethyl ether (“rDME”) transportation fuel, is focused on the research and development of practical and affordable pathways to zero-emission transportation through its proprietary production process. Oberon's rDME fuel is a cost-effective, low-carbon, zero-soot alternative to petroleum diesel, and when blended with propane can significantly reduce its carbon intensity. Pursuant to the agreements between the parties, the Operating Partnership also committed to provide additional funding to support continued development efforts to begin commercializing a rDME/propane blended product. The equity investment in Oberon is being accounted for under the equity method of accounting.
Pursuant to the Partnership’s strategic growth initiatives, the Operating Partnership acquired the propane assets and operations of various propane retailers in each of the last three fiscal years as summarized below. The purchase price allocations and results of operations of the acquired businesses were not material to the Partnership’s consolidated financial position and statement of operations.
Fiscal Year Total consideration (1)
2020 $ 27,065 (2)
2019 22,850 (3)
2018 16,771 (4)
(1) Total consideration includes non-compete consideration, which will be paid over the respective non-compete periods subject to compliance with the terms of the respective agreements, and excludes working capital adjustments.
(2) Includes the investment in Oberon and two acquisitions of propane retailers located in Georgia and California.
(3) Includes three acquisitions of propane retailers located in Texas, Florida and the West Coast. Total consideration includes the issuance of $1,600 in Common Units.
(4) Includes two acquisitions of propane retailers located in Florida and California.
On December 8, 2017, the Operating Partnership sold certain assets and operations in a non-strategic market of its propane segment for $2,800, plus working capital consideration, resulting in a loss of $4,823 that was recognized during the first quarter of fiscal 2018,
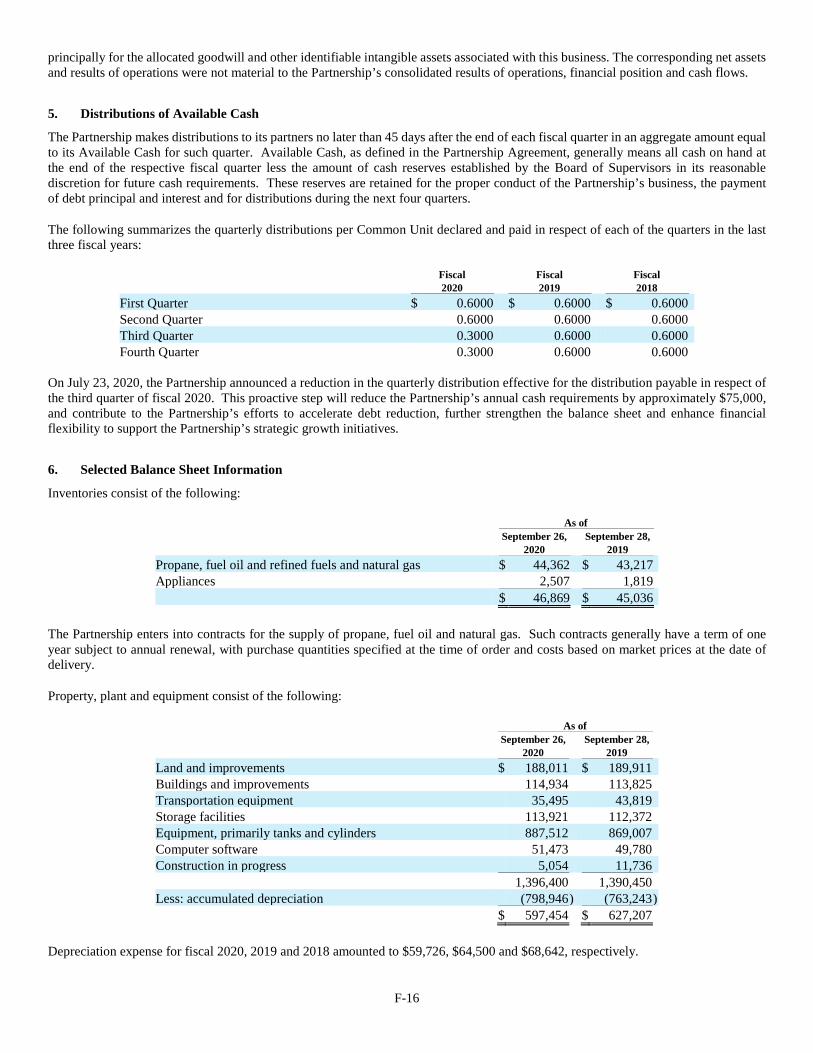
F-16
principally for the allocated goodwill and other identifiable intangible assets associated with this business. The corresponding net assets and results of operations were not material to the Partnership’s consolidated results of operations, financial position and cash flows.
5. Distributions of Available Cash
The Partnership makes distributions to its partners no later than 45 days after the end of each fiscal quarter in an aggregate amount equal to its Available Cash for such quarter. Available Cash, as defined in the Partnership Agreement, generally means all cash on hand at the end of the respective fiscal quarter less the amount of cash reserves established by the Board of Supervisors in its reasonable discretion for future cash requirements. These reserves are retained for the proper conduct of the Partnership’s business, the payment of debt principal and interest and for distributions during the next four quarters.
The following summarizes the quarterly distributions per Common Unit declared and paid in respect of each of the quarters in the last three fiscal years:
Fiscal Fiscal Fiscal 2020 2019 2018
First Quarter $ 0.6000 $ 0.6000 $ 0.6000 Second Quarter 0.6000 0.6000 0.6000 Third Quarter 0.3000 0.6000 0.6000 Fourth Quarter 0.3000 0.6000 0.6000
On July 23, 2020, the Partnership announced a reduction in the quarterly distribution effective for the distribution payable in respect of the third quarter of fiscal 2020. This proactive step will reduce the Partnership’s annual cash requirements by approximately $75,000, and contribute to the Partnership’s efforts to accelerate debt reduction, further strengthen the balance sheet and enhance financial flexibility to support the Partnership’s strategic growth initiatives.
6. Selected Balance Sheet Information
Inventories consist of the following:
As of September 26, September 28, 2020 2019
Propane, fuel oil and refined fuels and natural gas $ 44,362 $ 43,217 Appliances 2,507 1,819 $ 46,869 $ 45,036
The Partnership enters into contracts for the supply of propane, fuel oil and natural gas. Such contracts generally have a term of one year subject to annual renewal, with purchase quantities specified at the time of order and costs based on market prices at the date of delivery.
Property, plant and equipment consist of the following:
As of September 26, September 28, 2020 2019
Land and improvements $ 188,011 $ 189,911 Buildings and improvements 114,934 113,825 Transportation equipment 35,495 43,819 Storage facilities 113,921 112,372 Equipment, primarily tanks and cylinders 887,512 869,007 Computer software 51,473 49,780 Construction in progress 5,054 11,736 1,396,400 1,390,450 Less: accumulated depreciation (798,946 ) (763,243 ) $ 597,454 $ 627,207
Depreciation expense for fiscal 2020, 2019 and 2018 amounted to $59,726, $64,500 and $68,642, respectively.
F-17
7. Goodwill and Other Intangible Assets
The Partnership’s fiscal 2020 and fiscal 2019 annual goodwill impairment review resulted in no adjustments to the carrying amount of goodwill.
The carrying values of goodwill assigned to the Partnership’s operating segments are as follows:
Propane Fuel oil and
refined fuels Natural gas and
electricity
Total Balance as of September 28, 2019
Goodwill $ 1,085,747 $ 10,900 $ 7,900 $ 1,104,547 Accumulated adjustments — (6,462 ) — (6,462 ) $ 1,085,747 $ 4,438 $ 7,900 $ 1,098,085
Fiscal 2020 Activity Goodwill acquired (1) $ 5,696 $ — $ — $ 5,696
Balance as of September 26, 2020 Goodwill $ 1,091,443 $ 10,900 $ 7,900 $ 1,110,243 Accumulated adjustments — (6,462 ) — (6,462 )
$ 1,091,443 $ 4,438 $ 7,900 $ 1,103,781 Other intangible assets consist of the following:
As of September 26, September 28, 2020 2019
Customer relationships (1) $ 517,676 $ 507,159 Non-compete agreements (1) 37,690 35,440 Other 1,967 1,967 557,333 544,566 Less: accumulated amortization
Customer relationships (439,507 ) (384,507 ) Non-compete agreements (32,154 ) (30,181 ) Other (1,532 ) (1,441 )
(473,193 ) (416,129 ) $ 84,140 $ 128,437
(1) Reflects the impact from acquisitions (See Note 4). Aggregate amortization expense related to other intangible assets for fiscal 2020, 2019 and 2018 was $57,065, $56,372 and $56,580, respectively. Aggregate amortization expense for each of the five succeeding fiscal years related to other intangible assets held as of September 26, 2020 is estimated as follows: 2021 - $47,780; 2022 - $7,091; 2023 - $6,490; 2024 - $6,325; and 2025 - $4,240.
8. Leases
The Partnership leases certain property, plant and equipment, including portions of its vehicle fleet, for various periods under noncancelable leases all of which were determined to be operating leases. The Partnership determines if an agreement contains a lease at inception based on the Partnership’s right to the economic benefits of the leased assets and its right to direct the use of the leased asset. Right-of-use assets represent the Partnership’s right to use an underlying asset, and right-of-use liabilities represent the Partnership’s obligation to make lease payments arising from the lease. Right-of-use assets and liabilities are recognized at the lease commencement date based on the present value of the lease payments over the lease term. As most of the Partnership’s leases do not provide an implicit rate, the Partnership uses its estimated incremental borrowing rate based on the information available at the commencement date, adjusted for the lease term, to determine the present value of the lease payments. This rate is calculated based on a collateralized rate for the specific leasing activities of the Partnership.
Some leases include one or more options to renew at the Partnership’s discretion, with renewal terms that can extend the lease from one to fifteen additional years. The renewal options are included in the measurement of the right-of-use assets and lease liabilities if the Partnership is reasonably certain to exercise the renewal options. Short-term leases are leases having an initial term of twelve months

F-18
or less. The Partnership recognizes expenses for short-term leases on a straight-line basis and does not record a lease asset or lease liability for such leases.
When implementing Topic 842, the Partnership elected the following practical expedients: (1) a package of practical expedients that allows the Partnership to not reassess: (a) whether expired or existing contracts contained leases; (b) the lease classification for expired or existing leases; and (c) the initial direct costs for existing leases; (2) for all underlying asset classes, an expedient that allows the Partnership to not apply the recognition requirements to short-term leases and account for lease and associated non-lease components as a single lease component; (3) an expedient that allows the use of hindsight to determine lease term; and (4) an expedient that allows the Partnership to not evaluate under Topic 842 land easements that existed or expired before the Partnership’s adoption of Topic 842, and that were not previously accounted for as leases.
The Partnership has residual value guarantees associated with certain of its operating leases, related primarily to transportation equipment. See Note 15, “Guarantees” for more information.
The Partnership does not have any material lease obligations that were signed, but not yet commenced as of September 26, 2020.
Quantitative information on the Partnership’s lease population for fiscal 2020 is as follows:
Year Ended September 26, 2020 Lease expense $ 31,889 Other information: Cash payments for operating leases 32,306 Right-of-use assets obtained in exchange for new operating lease liabilities
35,817
Other information related to leases as of September 26, 2020 was as follows:
Weighted-average remaining lease term 6.5 years Weighted-average discount rate 5.3 %
The following table summarizes future minimum lease payments under non-cancelable operating leases as of September 26, 2020:
Fiscal Year Operating Leases 2021 $ 31,998 2022 28,865 2023 23,761 2024 18,085 2025 13,618 2026 and thereafter 25,377 Total future minimum lease payments $ 141,704 Less: interest (22,600 ) Total lease obligations $ 119,104
As previously disclosed in the Partnership’s 2019 Annual Report on Form 10-K under the previous lease standard (Topic 840), at September 28, 2019, future minimum lease payments under non-cancelable operating leases were as follows:
Fiscal Year Operating Leases 2020 $ 27,110 2021 23,875 2022 21,068 2023 16,267 2024 10,980 2025 and thereafter 25,128 Total future minimum lease payments $ 124,428

F-19
9. Income Taxes
For federal income tax purposes, as well as for state income tax purposes in the majority of the states in which the Partnership operates, the earnings attributable to the Partnership and the Operating Partnership are not subject to income tax at the partnership level. With the exception of those states that impose an entity-level income tax on partnerships, the taxable income or loss attributable to the Partnership and to the Operating Partnership, which may vary substantially from the income (loss) before income taxes reported by the Partnership in the consolidated statement of operations, are includable in the federal and state income tax returns of the Common Unitholders. The aggregate difference in the basis of the Partnership’s net assets for financial and tax reporting purposes cannot be readily determined as the Partnership does not have access to each Common Unitholder’s basis in the Partnership.
As described in Note 1 “Partnership Organization and Formation”, the earnings of the Corporate Entities are subject to U.S. corporate level income tax. However, based upon past performance, the Corporate Entities are currently reporting an income tax provision composed primarily of minimum state income taxes. A full valuation allowance has been provided against the deferred tax assets (with the exception of certain NOLs, which is defined and explained below, that arose after the enactment of the Tax Cuts and Jobs Act (“2017 Act”)) based upon an analysis of all available evidence, both negative and positive at the balance sheet date, which, taken as a whole, indicates that it is more likely than not that sufficient future taxable income will not be available to utilize the assets. Management’s periodic reviews include, among other things, the nature and amount of the taxable income and expense items, the expected timing of when assets will be used or liabilities will be required to be reported and the reliability of historical profitability of businesses expected to provide future earnings. Furthermore, management considered tax-planning strategies it could use to increase the likelihood that the deferred tax assets will be realized.
On December 22, 2017, the 2017 Act was signed into law, which enacted significant changes to U.S. tax and related laws. Some of the provisions of the 2017 Act that could affect the Partnership, the Operating Partnership and their subsidiaries include, but are not limited to, a reduction of the federal corporate income tax rate from 35% to 21%, limitations on the deductibility of net business interest expense, restrictions on the use of net operating loss carryforwards (“NOLs”) arising in taxable years beginning after December 31, 2017 and full expensing for certain qualified property. Certain of these changes have been suspended or modified by the Coronavirus Aid, Relief, and Economic Security Act (the “CARES Act”).
In the case of a corporation, the 2017 Act made Alternative Minimum Tax (“AMT”) credit carryforwards fully refundable without regard to future taxable income. Accordingly, the Partnership concluded that the existing valuation allowance on the AMT credit carryforwards of the Corporate Entities should be released as part of accounting for tax reform. The reversal of the valuation allowance resulted in a $1,086 discrete deferred tax benefit being recorded during the first quarter of fiscal 2018. As of September 26, 2020, all of the AMT credit carryforwards have been refunded. In addition, also as a result of the 2017 Act, NOLs generated beginning in 2018 may be carried forward indefinitely. As a result, the Partnership reversed the valuation allowance on certain of these NOLs generated after the 2017 Act, which resulted in a $496 discrete deferred tax benefit recorded during the first quarter of fiscal 2020.
The income tax provision of all the legal entities included in the Partnership’s consolidated statement of operations, which is composed primarily of state income taxes in the few states that impose taxes on partnerships and minimum state income taxes on the Corporate Entities, consists of the following:
Year Ended September 26, September 28, September 29, 2020 2019 2018
Current Federal $ 4 $ 67 $ 7 State and local 346 790 473
350 857 480 Deferred (496 ) — (1,086 ) $ (146 ) $ 857 $ (606 )

F-20
The provision for income taxes differs from income taxes computed at the U.S. federal statutory rate as a result of the following:
Year Ended September 26, September 28, September 29, 2020 2019 2018
Income tax provision at federal statutory tax rate $ 12,728 $ 14,593 $ 15,945 Impact of Partnership income not subject to federal income taxes
(13,045 )
(14,925 )
(15,939 )
Permanent differences 127 162 65 Change in valuation allowance (298 ) 115 (21,307 ) State income taxes 403 707 656 Remeasurement of net deferred tax assets (1) — — 19,941 Other (61 ) 205 33 Provision for income taxes - current and deferred $ (146 ) $ 857 $ (606 )
The components of net deferred taxes and the related valuation allowance using currently enacted tax rates are as follows:
Year Ended September 26, September 28, 2020 2019
Deferred tax assets: Net operating loss carryforwards $ 38,217 $ 38,914 Allowance for doubtful accounts 156 170 Inventory 250 231 Deferred revenue 575 615 AMT credit carryforward — 513 Other accruals 2,092 1,416
Total deferred tax assets 41,290 41,859 Deferred tax liabilities:
Intangible assets 1,197 1,205 Property, plant and equipment 1,899 2,145
Total deferred tax liabilities 3,096 3,350 Net deferred tax assets 38,194 38,509
Valuation allowance (37,698 ) (37,996 ) Net deferred tax assets $ 496 $ 513
10. Long-Term Borrowings
Long-term borrowings consist of the following:
As of September 26, September 28, 2020 2019
5.5% senior notes, due June 1, 2024 $ 525,000 $ 525,000 5.75% senior notes, due March 1, 2025 250,000 250,000 5.875% senior notes, due March 1, 2027 350,000 350,000 Revolving Credit Facility, due March 5, 2025 94,600 113,500 Subtotal 1,219,600 1,238,500 Less: unamortized debt issuance costs (9,424 ) (11,443 ) $ 1,210,176 $ 1,227,057

F-21
Senior Notes
2024 Senior Notes
On May 27, 2014, the Partnership and its 100%-owned subsidiary, Suburban Energy Finance Corp., completed a public offering of $525,000 in aggregate principal amount of 5.5% senior notes due June 1, 2024 (the “2024 Senior Notes”). The 2024 Senior Notes were issued at 100% of the principal amount and require semi-annual interest payments in June and December. The net proceeds from the issuance of the 2024 Senior Notes, along with cash on hand, were used to repurchase, satisfy and discharge all of the Partnership’s then-outstanding 7.5% senior notes due in 2018.
The 2024 Senior Notes are redeemable, at the Partnership’s option, in whole or in part, at any time on or after June 1, 2019, in each case at the redemption prices described in the table below, together with any accrued and unpaid interest to the date of the redemption.
Year Percentage 2020 101.833% 2021 100.917% 2022 and thereafter 100.000%
2025 Senior Notes
On February 25, 2015, the Partnership and its 100%-owned subsidiary, Suburban Energy Finance Corp., completed a public offering of $250,000 in aggregate principal amount of 5.75% senior notes due March 1, 2025 (the “2025 Senior Notes”). The 2025 Senior Notes were issued at 100% of the principal amount and require semi-annual interest payments in March and September. The net proceeds from the issuance of the 2025 Senior Notes, along with cash on hand, were used to repurchase, satisfy and discharge all of the Partnership’s then-outstanding 7.375% senior notes due in 2020.
The 2025 Senior Notes are redeemable, at the Partnership’s option, in whole or in part, at any time on or after March 1, 2020, in each case at the redemption prices described in the table below, together with any accrued and unpaid interest to the date of the redemption.
Year Percentage 2020 102.875% 2021 101.917% 2022 100.958% 2023 and thereafter 100.000%
2027 Senior Notes
On February 14, 2017, the Partnership and its 100%-owned subsidiary, Suburban Energy Finance Corp., completed a public offering of $350,000 in aggregate principal amount of 5.875% senior notes due March 1, 2027 (the “2027 Senior Notes”). The 2027 Senior Notes were issued at 100% of the principal amount and require semi-annual interest payments in March and September. The net proceeds from the issuance of the 2027 Senior Notes, along with borrowings under the Revolving Credit Facility, were used to repurchase, satisfy and discharge all of the Partnership’s then-outstanding 7.375% senior notes due in 2021.
The 2027 Senior Notes are redeemable, at the Partnership’s option, in whole or in part, at any time on or after March 1, 2022, in each case at the redemption prices described in the table below, together with any accrued and unpaid interest to the date of the redemption.
Year Percentage 2022 102.938% 2023 101.958% 2024 100.979% 2025 and thereafter 100.000%

F-22
The Partnership’s obligations under the 2024 Senior Notes, 2025 Senior Notes and 2027 Senior Notes (collectively, the “Senior Notes”) are unsecured and rank senior in right of payment to any future subordinated indebtedness and equally in right of payment with any future senior indebtedness. The Senior Notes are structurally subordinated to, which means they rank effectively behind, any debt and other liabilities of the Operating Partnership. The Partnership is permitted to redeem some or all of the Senior Notes at redemption prices and times as specified in the indentures governing the Senior Notes. The Senior Notes each have a change of control provision that would require the Partnership to offer to repurchase the notes at 101% of the principal amount repurchased, if a change of control, as defined in the indenture, occurs and is followed by a rating decline (a decrease in the rating of the notes by either Moody’s Investors Service or Standard and Poor’s Rating Group by one or more gradations) within 90 days of the consummation of the change of control.
Credit Agreement
On March 5, 2020 the Partnership and the Operating Partnership entered into a Third Amended and Restated Credit Agreement (the “Credit Agreement”) that provides for a $500,000 revolving credit facility (the “Revolving Credit Facility”), of which $94,600 was outstanding as of September 26, 2020. The Revolving Credit Facility matures on the earlier of (a) the date that is ninety-one (91) days prior to maturity of the 2024 Senior Notes (unless the notes have been refinanced prior to such date) and (b) March 5, 2025. At the time of the execution of the Credit Agreement, $183,900 was outstanding under the Operating Partnership’s revolving credit facility of the previous credit agreement, which was rolled into the Revolving Credit Facility under the Credit Agreement. The Credit Agreement amends and restates the previous credit agreement to, among other things, extend the maturity, lower borrowing costs, and amend certain affirmative and negative covenants, including an increase to the maximum permitted Total Consolidated Leverage Ratio from 5.50x to 5.75x. Borrowings under the Revolving Credit Facility may be used for general corporate purposes, including working capital, capital expenditures and acquisitions. The Operating Partnership has the right to prepay any borrowings under the Revolving Credit Facility, in whole or in part, without penalty at any time prior to maturity. In connection with the execution of the Credit Agreement, the Partnership recognized a non-cash charge of $109 to write-off a portion of unamortized debt origination costs of the previous credit agreement.
The Credit Agreement contains certain restrictive and affirmative covenants applicable to the Operating Partnership, its subsidiaries and the Partnership, as well as certain financial covenants, including (a) requiring the Partnership’s Consolidated Interest Coverage Ratio, as defined in the Credit Agreement, to be not less than 2.5 to 1.0 as of the end of any fiscal quarter, (b) prohibiting the Total Consolidated Leverage Ratio, as defined in the Credit Agreement, of the Partnership from being greater than 5.75 to 1.0, and (c) prohibiting the Senior Secured Consolidated Leverage Ratio, as defined in the Credit Agreement, of the Operating Partnership from being greater than 3.25 to 1.0 as of the end of any fiscal quarter.
The Partnership and certain subsidiaries of the Operating Partnership act as guarantors with respect to the obligations of the Operating Partnership under the Credit Agreement pursuant to the terms and conditions set forth therein. The obligations under the Credit Agreement are secured by liens on substantially all of the personal property of the Partnership, the Operating Partnership and their subsidiaries, as well as mortgages on certain real property.
Borrowings under the Revolving Credit Facility bear interest at prevailing interest rates based upon, at the Operating Partnership’s option, LIBOR plus the Applicable Rate, or the base rate, defined as the higher of the Federal Funds Rate plus ½ of 1%, the administrative agent bank’s prime rate, or LIBOR plus 1%, plus in each case the Applicable Rate. The Applicable Rate is dependent upon the Partnership’s Total Consolidated Leverage Ratio. As of September 26, 2020, the interest rate for borrowings under the Revolving Credit Facility was approximately 2.8%. The interest rate and the Applicable Rate will be reset following the end of each calendar quarter.
As of September 26, 2020, the Partnership had standby letters of credit issued under the Revolving Credit Facility of $63,088 which expire periodically through April 30, 2021.
The Credit Agreement and the Senior Notes both contain various restrictive and affirmative covenants applicable to the Operating Partnership, its subsidiaries and the Partnership, respectively, including (i) restrictions on the incurrence of additional indebtedness, and (ii) restrictions on certain liens, investments, guarantees, loans, advances, payments, mergers, consolidations, distributions, sales of assets and other transactions. Under the Credit Agreement and the indentures governing the Senior Notes, the Operating Partnership and the Partnership are generally permitted to make cash distributions equal to available cash, as defined, as of the end of the immediately preceding quarter, if no event of default exists or would exist upon making such distributions, and with respect to the indentures governing the Senior Notes, the Partnership’s Consolidated Fixed Charge Coverage Ratio, as defined, is greater than 1.75 to 1. The Partnership and the Operating Partnership were in compliance with all covenants and terms of the Senior Notes and the Credit Agreement as of September 26, 2020.

F-23
Debt origination costs representing the costs incurred in connection with the placement of, and the subsequent amendment to, the Credit Agreement are capitalized within other assets and amortized on a straight-line basis over the term of the Credit Agreement. During fiscal 2020, the Partnership recognized a charge of $109 to write-off unamortized debt origination costs and capitalized $2,717 in costs incurred in connection with the amendment to the Credit Agreement. Debt origination costs associated with the Partnership’s Senior Notes are reflected as a direct deduction from the carrying amount of such debt and amortized on a straight-line basis over the terms of the respective Senior Notes. Other assets at September 26, 2020 and September 28, 2019 include debt origination costs associated with our Credit Agreement with a net carrying amount of $3,164 and $1,550, respectively.
The aggregate amounts of long-term debt maturities subsequent to September 26, 2020 are as follows: fiscal 2021: $-0-; fiscal 2022: $-0-; fiscal 2023: $-0-; fiscal 2024: $619,600; fiscal 2025: $250,000; and thereafter: $350,000.
11. Unit-Based Compensation Arrangements
As described in Note 2, the Partnership recognizes compensation cost over the respective service period for employee services received in exchange for an award of equity, or equity-based compensation, based on the grant date fair value of the award. The Partnership measures liability awards under an equity-based payment arrangement based on remeasurement of the award’s fair value at the conclusion of each interim and annual reporting period until the date of settlement, taking into consideration the probability that the performance conditions will be satisfied.
Restricted Unit Plans. On July 22, 2009, the Partnership adopted the Suburban Propane Partners, L.P. 2009 Restricted Unit Plan, as amended (the “2009 Restricted Unit Plan”), which authorized the issuance of Common Units to executives, managers and other employees and members of the Board of Supervisors of the Partnership. The total number of Common Units authorized for issuance under the 2009 Restricted Unit Plan was 2,400,000 as of July 31, 2019, the date on which this plan expired. At the Partnership’s Tri-Annual Meeting held on May 15, 2018, the Unitholders approved the Partnership’s 2018 Restricted Unit Plan authorizing the issuance of up to 1,800,000 Common Units (the “2018 Restricted Unit Plan” and together with the 2009 Restricted Unit Plan, from which there are still unvested awards outstanding, the “Restricted Unit Plans”). Unless otherwise stipulated by the Compensation Committee of the Partnership’s Board of Supervisors on or before the grant date, 33.33% of all outstanding awards under the Restricted Unit Plans will vest on each of the first three anniversaries of the award grant date. Participants in the Restricted Unit Plans are not eligible to receive quarterly distributions on, or vote, their respective restricted units until vested. Restricted units cannot be sold or transferred prior to vesting. The value of each restricted unit is established by the market price of the Common Unit on the date of grant, net of estimated future distributions during the vesting period. Restricted units are subject to forfeiture in certain circumstances as defined in the Restricted Unit Plans. Compensation expense for the unvested awards is recognized ratably over the vesting periods and is net of estimated forfeitures.
The following is a summary of activity in the Restricted Unit Plans:
Weighted Average Grant Date Fair Units Value Per Unit
Outstanding September 30, 2017 621,045 $ 22.10 Awarded 424,431 19.52 Forfeited (14,092 ) (19.70 ) Vested (1) (335,253 ) (24.39 ) Outstanding September 29, 2018 696,131 19.47 Awarded 618,268 18.13 Forfeited (5,904 ) (18.34 ) Vested (1) (320,156 ) (21.08 ) Outstanding September 28, 2019 988,339 18.12 Awarded 471,111 18.19 Forfeited (9,975 ) (18.01 ) Vested (1) (487,659 ) (19.22 ) Outstanding September 26, 2020 961,816 $ 17.60
(1) During fiscal 2020, 2019 and 2018, the Partnership withheld 76,453, 59,227 and 34,388 Common Units, respectively, from
participants for income tax withholding purposes for those executive officers of the Partnership whose shares of restricted units vested during the period.
F-24
As of September 26, 2020, unrecognized compensation cost related to unvested restricted units awarded under the Restricted Unit Plans amounted to $3,085. Compensation cost associated with the unvested awards is expected to be recognized over a weighted-average period of 1.2 years. Compensation expense for the Restricted Unit Plans for fiscal 2020, 2019 and 2018 was $9,242, $10,521 and $8,198, respectively.
Distribution Equivalent Rights Plan. On January 17, 2017, the Partnership adopted the Distribution Equivalent Rights Plan (the “DER Plan”), which gives the Compensation Committee of the Partnership’s Board of Supervisors discretion to award distribution equivalent rights (“DERs”) to executive officers of the Partnership. Once awarded, DERs entitle the grantee to a cash payment each time the Board of Supervisors declares a cash distribution on the Partnership’s Common Units, which cash payment will be equal to an amount calculated by multiplying the number of unvested restricted units which are held by the grantee on the record date of the distribution, by the amount of the declared distribution per Common Unit. Compensation expense recognized under the DER Plan was $842, $1,048 and $810 for fiscal 2020, 2019 and 2018, respectively.
Long-Term Incentive Plan. On August 6, 2013, the Partnership adopted the 2014 Long-Term Incentive Plan (“LTIP”). The LTIP is a non-qualified, unfunded, long-term incentive plan for executive officers and key employees that provides for payment, in the form of cash, of an award of equity-based compensation at the end of a three-year performance period. The level of compensation earned under the LTIP is based on the Partnership’s average distribution coverage ratio over the three-year measurement period. The Partnership’s average distribution coverage ratio is calculated as the Partnership’s average distributable cash flow, as defined by the LTIP, for each of the three years in the measurement period, subject to certain adjustments as set forth in the LTIP, divided by the amount of annualized cash distributions to be paid by the Partnership. Compensation expense, which includes adjustments to previously recognized compensation expense for current period changes in the fair value of unvested awards, for fiscal 2020, 2019 and 2018 was $480, $5,385 and $3,180, respectively. The cash payout in fiscal 2020, which related to the fiscal 2017 award, was $2,963; there were no cash payouts in fiscal 2019 and 2018, which related to the fiscal 2016 and 2015 awards, respectively.
12. Employee Benefit Plans
Defined Contribution Plan. The Partnership has an employee Retirement Savings and Investment Plan (the “401(k) Plan”) covering most employees. Employer matching contributions relating to the 401(k) Plan represent a match of $0.50 on up to 6% of eligible compensation contributed with the opportunity to earn an additional performance-based matching contribution if certain annual fiscal performance targets are achieved. These contribution costs were $3,934, $3,782 and $3,575 for fiscal 2020, 2019 and 2018, respectively.
Defined Pension and Retiree Health and Life Benefits Arrangements
Pension Benefits. The Partnership has a noncontributory defined benefit pension plan which was originally designed to cover all eligible employees of the Partnership who met certain requirements as to age and length of service. Effective January 1, 1998, the Partnership amended its defined benefit pension plan to provide benefits under a cash balance formula as compared to a final average pay formula which was in effect prior to January 1, 1998. Effective January 1, 2000, participation in the defined benefit pension plan was limited to eligible existing participants on that date with no new participants eligible to participate in the plan. On September 20, 2002, the Board of Supervisors approved an amendment to the defined benefit pension plan whereby, effective January 1, 2003, future service credits ceased and eligible employees receive interest credits only toward their ultimate retirement benefit.
Contributions, as needed, are made to a trust maintained by the Partnership. Contributions to the defined benefit pension plan are made by the Partnership in accordance with the Employee Retirement Income Security Act of 1974 minimum funding standards plus additional amounts made at the discretion of the Partnership, which may be determined from time to time. Contributions of $3,835, $5,350 and $4,764 were made by the Partnership in fiscal 2020, 2019 and 2018, respectively. In fiscal 2010, the Internal Revenue Service completed its review of the Partnership’s defined benefit pension plan and issued a favorable determination letter pertaining to the cash balance formula. However, there can be no assurances that future legislative developments will not have an adverse effect on the Partnership’s results of operations or cash flows.
Retiree Health and Life Benefits. The Partnership provides postretirement health care and life insurance benefits for certain retired employees. Partnership employees hired prior to July 1993 and who retired prior to March 1998 are eligible for postretirement health care benefits if they reached a specified retirement age while working for the Partnership. Partnership employees hired prior to July 1993 and who retired prior to January 1998 are eligible for life insurance benefits if they reached a specified retirement age while working for the Partnership. Effective January 1, 2017, the Partnership terminated postretirement life insurance benefits to all retirees that retired after December 31, 1997. Effective March 31, 1998, the Partnership froze participation in its postretirement health care benefit plan, with no new retirees eligible to participate in the plan. All active employees who were eligible to receive health care benefits under the postretirement plan subsequent to March 1, 1998, were provided an increase to their accumulated benefits under the cash balance pension plan. The Partnership’s postretirement health care and life insurance benefit plans are unfunded. Effective January 1, 2006, the Partnership changed its postretirement health care plan from a self-insured program to one that is fully insured under which the Partnership pays a portion of the insurance premium on behalf of the eligible participants.

F-25
The Partnership recognizes the funded status of pension and other postretirement benefit plans as an asset or liability on the balance sheet and recognizes changes in the funded status in other comprehensive income (loss) in the year the changes occur. The Partnership uses the date of its consolidated financial statements as the measurement date of plan assets and obligations.
Projected Benefit Obligation, Fair Value of Plan Assets and Funded Status. The following tables provide a reconciliation of the changes in the benefit obligations and the fair value of the plan assets for fiscal 2020 and 2019 and a statement of the funded status for both years. Under the Partnership’s cash balance defined benefit pension plan, the accumulated benefit obligation and the projected benefit obligation are the same.
Pension Benefits Retiree Health and Life
Benefits 2020 2019 2020 2019
Reconciliation of benefit obligations: Benefit obligation at beginning of year $ 115,471 $ 111,701 $ 6,929 $ 7,895 Interest cost 2,726 3,943 151 275 Actuarial loss (gain) 7,005 10,429 (246 ) (296 ) Lump sum benefits paid (3,623 ) (3,869 ) — — Ordinary benefits paid (6,347 ) (6,733 ) (835 ) (945 ) Benefit obligation at end of year $ 115,232 $ 115,471 $ 5,999 $ 6,929 Reconciliation of fair value of plan assets: Fair value of plan assets at beginning of year $ 80,913 $ 78,032 $ — $ — Actual gain (loss) return on plan assets 5,223 8,133 — — Employer contributions 3,835 5,350 835 945 Lump sum benefits paid (3,623 ) (3,869 ) — — Ordinary benefits paid (6,347 ) (6,733 ) (835 ) (945 ) Fair value of plan assets at end of year $ 80,001 $ 80,913 $ — $ — Funded status: Funded status at end of year $ (35,231 ) $ (34,558 ) $ (5,999 ) $ (6,929 ) Amounts recognized in consolidated balance sheets consist of:
Net amount recognized at end of year $ (35,231 ) $ (34,558 ) $ (5,999 ) $ (6,929 ) Less: current portion — — 843 970 Noncurrent benefit liability $ (35,231 ) $ (34,558 ) $ (5,156 ) $ (5,959 ) Amounts not yet recognized in net periodic benefit cost and included in accumulated other comprehensive income (loss):
Actuarial net (loss) gain $ (32,286 ) $ (33,733 ) $ 4,757 $ 5,296 Prior service credits — — 1,753 2,251 Net amount recognized in accumulated other comprehensive (loss) income
$ (32,286 )
$ (33,733 )
$ 6,510
$ 7,547
The amounts in accumulated other comprehensive loss as of September 26, 2020 that are expected to be recognized as components of net periodic benefit costs during fiscal 2021 are expenses of $3,592 and credits of ($1,221) for pension and other postretirement benefits, respectively.

F-26
Plan Assets. The Partnership’s investment policies and strategies, as set forth in the Investment Management Policy and Guidelines, are monitored by a Benefits Committee comprised of six members of management. The Partnership employs a liability driven investment strategy, which seeks to increase the correlation of the plan’s assets and liabilities to reduce the volatility of the plan’s funded status. This strategy has resulted in an asset allocation that is largely comprised of investments in funds of fixed income securities. The target asset mix is as follows: (i) fixed income securities portion of the portfolio should range between 80% and 90%; and (ii) equity securities portion of the portfolio should range between 10% and 20%.
The following table presents the actual allocation of assets held in trust as of:
September 26, September 28, 2020 2019 Fixed income securities 86% 86% Equity securities 14% 14% 100% 100%
The Partnership’s valuations include the use of the funds’ reported net asset values for commingled fund investments. Commingled funds are valued at the net asset value of its underlying securities. The assets of the defined benefit pension plan have no significant concentration of risk and there are no restrictions on these investments.
The following table describes the measurement of the Partnership’s pension plan assets by asset category as of:
September 26, September 28, 2020 2019 Short term investments (1) $ 1,485 $ 1,502 Equity securities: (1) (2) Domestic 4,138 4,314 International 7,117 7,393 Fixed income securities (1) (3) 67,261 67,704 $ 80,001 $ 80,913
(1) Includes funds which are not publicly traded and are valued at the net asset value of the units provided by the fund issuer.
(2) Includes funds which invest primarily in a diversified portfolio of publicly traded U.S. and Non-U.S. common stock.
(3) Includes funds which invest primarily in publicly traded and non-publicly traded, investment grade corporate bonds, U.S. government bonds and asset-backed securities.
Projected Contributions and Benefit Payments. The Partnership expects to contribute approximately $6,250 to the defined benefit pension plan during fiscal 2021. Estimated future benefit payments for both pension and retiree health and life benefits are as follows:
Pension Retiree Health and Fiscal Year Benefits Life Benefits
2021 $ 27,217 $ 843 2022 9,193 760 2023 8,785 680 2024 7,809 602 2025 7,619 529 2026 through 2030 30,853 1,727
Estimated future pension benefit payments assumes that age 65 or older active and non-active eligible participants in the pension plan that had not received a benefit payment prior to fiscal 2021 will elect to receive a benefit payment in fiscal 2021. In addition, for all periods presented, estimated future pension benefit payments assumes that participants will elect a lump sum payment in the fiscal year that the participant becomes eligible to receive benefits.

F-27
Effect on Operations. The following table provides the components of net periodic benefit costs included in operating expenses for fiscal 2020, 2019 and 2018:
Pension Benefits Retiree Health and Life Benefits 2020 2019 2018 2020 2019 2018
Interest cost $ 2,726 $ 3,943 $ 3,778 $ 151 $ 275 $ 277 Expected return on plan assets (1,270 ) (1,723 ) (1,894 ) — — — Amortization of prior service credit — — — (498 ) (498 ) (498 ) Settlement charge 1,051 — — — — — Recognized net actuarial loss (gain) 3,448 3,466 3,683 (786 ) (761 ) (654 ) Net periodic benefit costs $ 5,955 $ 5,686 $ 5,567 $ (1,133 ) $ (984 ) $ (875 ) During fiscal 2020, fiscal 2019 and fiscal 2018, lump sum pension settlement payments to either terminated or retired individuals amounted to $3,623, $3,869 and $3,373, respectively. The settlement threshold (combined service and interest costs of net periodic pension cost) for these three years were $2,725, $3,943 and $3,778, respectively. In fiscal 2020, lump sum pension settlement payments exceeded the settlement threshold, which required the Partnership to recognize a non-cash settlement charge of $1,051. The non-cash charges were required to accelerate recognition of a portion of cumulative unamortized losses in the defined benefit pension plan.
Actuarial Assumptions. The assumptions used in the measurement of the Partnership’s benefit obligations as of September 26, 2020 and September 28, 2019 are shown in the following table:
Pension Benefits Retiree Health and Life
Benefits 2020 2019 2020 2019
Weighted-average discount rate 2.125 % 2.875 % 1.375 % 2.375 % Average rate of compensation increase n/a n/a n/a n/a Health care cost trend n/a n/a 5.720 % 6.010 %
The assumptions used in the measurement of net periodic pension benefit and postretirement benefit costs for fiscal 2020, 2019 and 2018 are shown in the following table:
Pension Benefits Retiree Health and Life Benefits 2020 2019 2018 2020 2019 2018 Weighted-average discount rate 2.875 % 4.000 % 3.500 % 2.375 % 3.750 % 3.000 % Average rate of compensation increase n/a n/a n/a n/a n/a n/a Weighted-average expected long-term rate of return on plan assets
1.800 % 2.550 % 2.500 %
n/a n/a n/a
Health care cost trend n/a n/a n/a 6.010 % 6.290 % 6.570 % The discount rate assumption takes into consideration current market expectations related to long-term interest rates and the projected duration of the Partnership’s pension obligations based on a benchmark index with similar characteristics as the expected cash flow requirements of the Partnership’s defined benefit pension plan over the long-term. The expected long-term rate of return on plan assets assumption reflects estimated future performance in the Partnership’s pension asset portfolio considering the investment mix of the pension asset portfolio and historical asset performance. The expected return on plan assets is determined based on the expected long-term rate of return on plan assets and the market-related value of plan assets. The market-related value of pension plan assets is the fair value of the assets. Unrecognized actuarial gains and losses in excess of 10% of the greater of the projected benefit obligation and the market-related value of plan assets are amortized over the expected average remaining service period of active employees expected to receive benefits under the plan.

F-28
The 5.72% increase in health care costs assumed at September 26, 2020 is assumed to decrease gradually to 4.50% in fiscal 2040 and to remain at that level thereafter. An increase or decrease of the assumed health care cost trend rates by 1.0% in each year would have no material impact to the Partnership’s benefit obligation as of September 26, 2020 nor the aggregate of service and interest components of net periodic postretirement benefit expense for fiscal 2020. The Partnership has concluded that the prescription drug benefits within the retiree medical plan do not entitle the Partnership to an available Medicare subsidy.
Multi-Employer Pension Plans. As a result of the acquisition of the retail propane assets of Inergy, the Partnership contributes to multi-employer pension plans (“MEPPs”) in accordance with various collective bargaining agreements covering union employees. As one of the many participating employers in these MEPPs, the Partnership is responsible with the other participating employers for any plan underfunding. During fiscal 2013, the Partnership established an accrual of $7,000 for its estimated obligation to certain MEPPs due to the Partnership’s voluntary partial withdrawal from one such MEPP and full withdrawal from four MEPPs. During fiscal 2015, the Partnership accrued $11,300 for its further voluntary partial withdrawal, and during fiscal 2016 the Partnership accrued an additional $6,600 for its voluntary full withdrawal. As of September 26, 2020 and September 28, 2019, the Partnership’s estimated obligation to these MEPPs was $20,396 and $21,441, respectively. Due to the uncertainty regarding future factors that could impact the withdrawal liability, the Partnership is unable to determine the timing of the payment of the future withdrawal liability, or additional future withdrawal liability, if any.
The Partnership’s contributions to a particular MEPP are established by the applicable collective bargaining agreements (“CBAs”); however, the required contributions may increase based on the funded status of a MEPP and legal requirements of the Pension Protection Act of 2006 (the “PPA”), which requires substantially underfunded MEPPs to implement a funding improvement plan (“FIP”) or a rehabilitation plan (“RP”) to improve their funded status. Factors that could impact funded status of a MEPP include, without limitation, investment performance, changes in the participant demographics, decline in the number of contributing employers, changes in actuarial assumptions and the utilization of extended amortization provisions.
While no multi-employer pension plan that the Partnership contributed to is individually significant to the Partnership, the table below discloses the MEPPs to which the Partnership contributes. The financial health of a MEPP is indicated by the zone status, as defined by the PPA, which represents the funded status of the plan as certified by the plan's actuary. Plans in the red zone are less than 65% funded, the yellow zone are between 65% and 80% funded, and green zone are at least 80% funded. Total contributions made by the Partnership to multi-employer pension plans for the fiscal years ended September 26, 2020, September 28, 2019 and September 29, 2018 are shown below.
PPA Zone Status
Contributions
Contributions greater than
5% of Expiration
Pension Fund EIN/Pension
Plan Number 2020
2019 FIP/RP
Status
2020
2019
2018 Total Plan
Contributions date of CBA
Local 282 Pension Trust (1) 11-6245313 Green Green n/a $ 272 $ 272 $ 235 No August 2024 Teamsters Industrial Employees Pension Fund (2)
22-6099363 Green Green n/a 203 200 187 Yes March 2021
Western Conference of Teamsters Pension Plan (2)
91-6145047 Green Green n/a 24 27 20 No February 2021
$ 499 $ 499 $ 442 (1) Based on most recent available valuation information for plan year ended February 2020.
(2) Based on most recent available valuation information for plan year ended December 2019. Additionally, the Partnership contributes to certain multi-employer plans that provide health and welfare benefits and defined annuity plans. Contributions to those plans were $1,151, $1,220 and $1,099 for fiscal 2020, 2019 and 2018, respectively.
13. Financial Instruments and Risk Management
Cash and Cash Equivalents. The fair value of cash and cash equivalents is not materially different from their carrying amount because of the short-term maturity of these instruments.
Derivative Instruments and Hedging Activities. The Partnership measures the fair value of its exchange-traded commodity-related options and futures contracts using Level 1 inputs, the fair value of its commodity-related swap contracts and interest rate swaps using Level 2 inputs and the fair value of its over-the-counter commodity-related options contracts using Level 3 inputs. The Partnership’s over-the-counter options contracts are valued based on an internal option model. The inputs utilized in the model are based on publicly available information, as well as broker quotes.

F-29
The following summarizes the fair value of the Partnership’s derivative instruments and their location in the consolidated balance sheets as of September 26, 2020 and September 28, 2019, respectively:
As of September 26, 2020 As of September 28, 2019 Asset Derivatives Location Fair Value Location Fair Value Derivatives not designated as hedging instruments:
Commodity-related derivatives Other current assets $ 1,066 Other current assets $ 4,082 Other assets 461 Other assets 167 $ 1,527 $ 4,249 Liability Derivatives Location Fair Value Location Fair Value
Derivatives not designated as hedging instruments:
Commodity-related derivatives Other current liabilities $ 2,684 Other current liabilities $ 3,360 Other liabilities — Other liabilities — $ 2,684 $ 3,360
The following summarizes the reconciliation of the beginning and ending balances of assets and liabilities measured at fair value on a recurring basis using significant unobservable inputs:
Fair Value Measurement Using Significant
Unobservable Inputs (Level 3) Fiscal 2020 Fiscal 2019 Assets Liabilities Assets Liabilities
Beginning balance of over-the-counter options $ 419 $ — $ 1,546 $ 361 Beginning balance realized during the period (419 ) — (1,533 ) (361 ) Contracts purchased during the period — — 83 — Change in the fair value of outstanding contracts — — 323 —
Ending balance of over-the-counter options $ — $ — $ 419 $ — As of September 26, 2020 and September 28, 2019, the Partnership’s outstanding commodity-related derivatives had a weighted average maturity of approximately six and three months, respectively.
The effect of the Partnership’s derivative instruments on the consolidated statements of operations for fiscal 2020, 2019 and 2018 are as follows:
Unrealized (Losses) Gains Recognized in Income Derivatives Not Designated as Hedging Instruments Location Amount Commodity-related derivatives:
Fiscal 2020 Cost of products sold $ (381 )
Fiscal 2019 Cost of products sold $ (8,008 )
Fiscal 2018 Cost of products sold $ 310
F-30
The following table presents the fair value of the Partnership’s recognized derivative assets and liabilities on a gross basis and amounts offset on the consolidated balance sheets subject to enforceable master netting arrangements or similar agreements:
As of September 26, 2020 Net amounts presented in the Gross amounts Effects of netting balance sheet
Asset Derivatives Commodity-related derivatives $ 6,836 $ (5,309 ) $ 1,527 $ 6,836 $ (5,309 ) $ 1,527 Liability Derivatives Commodity-related derivatives $ 7,993 $ (5,309 ) $ 2,684 $ 7,993 $ (5,309 ) $ 2,684
As of September 28, 2019 Net amounts presented in the Gross amounts Effects of netting balance sheet
Asset Derivatives Commodity-related derivatives $ 10,464 $ (6,215 ) $ 4,249 $ 10,464 $ (6,215 ) $ 4,249 Liability Derivatives Commodity-related derivatives $ 9,575 $ (6,215 ) $ 3,360 $ 9,575 $ (6,215 ) $ 3,360
The Partnership had $4,718 and $5,392 posted cash collateral as of September 26, 2020 and September 28, 2019, respectively, with its brokers for outstanding commodity-related derivatives.
Concentrations. The Partnership’s principal customers are residential and commercial end users of propane and fuel oil and refined fuels served by approximately 700 locations in 41 states. No single customer accounted for more than 10% of revenues during fiscal 2020, 2019 or 2018 and no concentration of receivables exists as of September 26, 2020 or September 28, 2019.
During fiscal 2020, Crestwood Equity Partners L.P., Targa Liquids Marketing and Trade LLC and Enterprise Products Partners L.P., provided approximately 24%, 17%, and 10% of the Partnership’s total propane purchases, respectively. No other single supplier accounted for more than 10% of the Partnership’s propane purchases in fiscal 2020. The Partnership believes that, if supplies from any of these suppliers were interrupted, it would be able to secure adequate propane supplies from other sources without a material disruption of its operations.
Credit Risk. Exchange-traded futures and options contracts are traded on and guaranteed by the NYMEX and as a result, have minimal credit risk. Futures contracts traded with brokers of the NYMEX require daily cash settlements in margin accounts. The Partnership is subject to credit risk with over-the-counter swaps and options contracts entered into with various third parties to the extent the counterparties do not perform. The Partnership evaluates the financial condition of each counterparty with which it conducts business and establishes credit limits to reduce exposure to credit risk based on non-performance. The Partnership does not require collateral to support the contracts.
Bank Debt and Senior Notes. The fair value of the Revolving Credit Facility approximates the carrying value since the interest rates are adjusted quarterly to reflect market conditions. Based upon quoted market prices, the fair value of the Partnership’s 2024 Senior Notes, 2025 Senior Notes, and 2027 Senior Notes was $531,563, $255,625 and $360,063, respectively, as of September 26, 2020.
14. Commitments and Contingencies
Commitments. The Partnership leases certain property, plant and equipment, including portions of the Partnership’s vehicle fleet, for various periods under noncancelable leases.
Contingencies
Accrued Insurance. The Partnership is self-insured for general and product, workers’ compensation and automobile liabilities up to predetermined amounts above which third party insurance applies. As of September 26, 2020 and September 28, 2019, the Partnership

F-31
had accrued liabilities of $72,942 and $67,279, respectively, representing the total estimated losses for known and anticipated or unasserted general and product, workers’ compensation and automobile claims. For the portion of the estimated liability that exceeds insurance deductibles, the Partnership records an asset within other assets (or prepaid expenses and other current assets, as applicable) related to the amount of the liability expected to be covered by insurance which amounted to $17,572 and $18,110 as of September 26, 2020 and September 28, 2019, respectively.
Legal Matters. The Partnership’s operations are subject to operating hazards and risks normally incidental to handling, storing and delivering combustible liquids such as propane. The Partnership has been, and will continue to be, a defendant in various legal proceedings and litigation as a result of these operating hazards and risks, and as a result of other aspects of its business. In this regard, the Partnership’s natural gas and electricity business is currently a defendant in a putative class action suit in the Northern District of New York. The complaint alleges a number of claims under various consumer statutes and common law in New York and Pennsylvania regarding pricing offered to electricity customers in those states. The complaint was dismissed in part by the district court, but causes of action based on the New York consumer statute and breach of contract were allowed to proceed. Based on the nature of the allegations in the suit, the Partnership believes that the suit is without merit and is defending against it vigorously. With respect to this pending suit, the Partnership has determined, based on the allegations and discovery to date, that no reserve for a loss contingency is required. The Partnership is unable to reasonably estimate the possible loss or range of loss, if any, arising from the action. Although any litigation is inherently uncertain, based on past experience, the information currently available to the Partnership, and the amount of its accrued insurance liabilities, the Partnership does not believe that currently pending or threatened litigation matters, or known claims or known contingent claims, will have a material adverse effect on its results of operations, financial condition or cash flow.
During the first quarter of fiscal 2020, the Partnership recorded a charge of $5,000 for the settlement of certain product liability and other legal matters. The settled claims were paid in the second quarter of fiscal 2020.
COVID-19 Pandemic. The impact of the COVID-19 pandemic continues to evolve subsequent to the year ended September 26, 2020. Although the Partnership believes the financial information included herein properly reflects all facts known at this time, the Partnership is unable to estimate the full financial impact of this pandemic at this time. The Partnership’s supply chain, including its suppliers and business partners, has not been materially impacted and the Partnership has been able to acquire sufficient supplies of the products it sells. Additionally, the Partnership continues to obtain the necessary liquidity to sustain its operations through collections of accounts receivable as well as access to its Revolving Credit Facility available under the Credit Agreement. The Partnership will continue to actively monitor and manage the economic impact of the COVID-19 pandemic and ensure new information is reflected within future financial information.
15. Guarantees
The Partnership has residual value guarantees associated with certain of its operating leases, related primarily to transportation equipment, with remaining lease periods scheduled to expire periodically through fiscal 2028. Upon completion of the lease period, the Partnership guarantees that the fair value of the equipment will equal or exceed the guaranteed amount, or the Partnership will pay the lessor the difference. Although the fair value of equipment at the end of its lease term has historically exceeded the guaranteed amounts, the maximum potential amount of aggregate future payments the Partnership could be required to make under these leasing arrangements, assuming the equipment is deemed worthless at the end of the lease term, was $25,164 as of September 26, 2020. The fair value of residual value guarantees for outstanding operating leases was de minimis as of September 26, 2020 and September 28, 2019.

F-32
16. Amounts Reclassified Out of Accumulated Other Comprehensive Income
The following table summarizes amounts reclassified out of accumulated other comprehensive (loss) income for the years ended September 26, 2020, September 28, 2019 and September 29, 2018:
Year Ended September 26, September 28, September 29, 2020 2019 2018
Pension Benefits Balance, beginning of period $ (33,733 ) $ (33,180 ) $ (37,311 )
Other comprehensive income before reclassifications: Net change in funded status of benefit plan (3,052 ) (4,019 ) 448
Reclassifications to earnings: Recognition of net actuarial loss for pension settlement (1)
1,051
—
—
Amortization of net loss (1) 3,448 3,466 3,683 Other comprehensive (loss) income 1,447 (553 ) 4,131 Balance, end of period $ (32,286 ) $ (33,733 ) $ (33,180 ) Postretirement Benefits Balance, beginning of period $ 7,547 $ 8,510 $ 8,499
Other comprehensive income before reclassifications: Net change in plan obligation 247 296 1,164
Reclassifications to earnings: Amortization of prior service credits (1) (498 ) (498 ) (498 ) Amortization of net gain (1) (786 ) (761 ) (655 )
Other comprehensive (loss) income (1,037 ) (963 ) 11 Balance, end of period $ 6,510 $ 7,547 $ 8,510 Accumulated Other Comprehensive Income (Loss) Balance, beginning of period $ (26,186 ) $ (24,670 ) $ (28,812 )
Other comprehensive income before reclassifications (2,805 ) (3,723 ) 1,612 Recognition of net actuarial loss for pension settlement 1,051 — — Reclassifications to earnings 2,164 2,207 2,530
Other comprehensive (loss) income 410 (1,516 ) 4,142 Balance, end of period $ (25,776 ) $ (26,186 ) $ (24,670 )
(1) These amounts are included in the computation of net periodic benefit cost. See Note 12, “Employee Benefit Plans”.
17. Segment Information
The Partnership manages and evaluates its operations in four operating segments, three of which are reportable segments: Propane, Fuel Oil and Refined Fuels and Natural Gas and Electricity. The chief operating decision maker evaluates performance of the operating segments using a number of performance measures, including gross margins and income before interest expense and provision for income taxes (operating profit). Costs excluded from these profit measures are captured in Corporate and include corporate overhead expenses not allocated to the operating segments. Unallocated corporate overhead expenses include all costs of back office support functions that are reported as general and administrative expenses within the consolidated statements of operations. In addition, certain costs associated with field operations support that are reported in operating expenses within the consolidated statements of operations, including purchasing, training and safety, are not allocated to the individual operating segments. Thus, operating profit for each operating segment includes only the costs that are directly attributable to the operations of the individual segment. The accounting policies of the operating segments are otherwise the same as those described in the summary of significant accounting policies in Note 2.
The propane segment is primarily engaged in the retail distribution of propane to residential, commercial, industrial and agricultural customers and, to a lesser extent, wholesale distribution to large industrial end users. In the residential and commercial markets, propane is used primarily for space heating, water heating, cooking and clothes drying. Industrial customers use propane generally as a motor fuel burned in internal combustion engines that power over-the-road vehicles, forklifts and stationary engines, to fire furnaces and as a cutting gas. In the agricultural markets, propane is primarily used for tobacco curing, crop drying, poultry brooding and weed control.

F-33
The fuel oil and refined fuels segment is primarily engaged in the retail distribution of fuel oil, diesel, kerosene and gasoline to residential and commercial customers for use primarily as a source of heat in homes and buildings.
The natural gas and electricity segment is engaged in the marketing of natural gas and electricity to residential and commercial customers in the deregulated energy markets of New York and Pennsylvania. Under this operating segment, the Partnership owns the relationship with the end consumer and has agreements with the local distribution companies to deliver the natural gas or electricity from the Partnership’s suppliers to the customer.
Activities in the “all other” category include the Partnership’s service business, which is primarily engaged in the sale, installation and servicing of a wide variety of home comfort equipment, particularly in the areas of heating and ventilation.
The following table presents certain data by reportable segment and provides a reconciliation of total operating segment information to the corresponding consolidated amounts for the periods presented:
Year Ended September 26, September 28, September 29, 2020 2019 2018
Revenues: Propane $ 955,143 $ 1,083,446 $ 1,153,323 Fuel oil and refined fuels 75,039 92,084 91,520 Natural gas and electricity 31,184 45,206 54,308 All other 46,531 46,969 45,262
Total revenues $ 1,107,897 $ 1,267,705 $ 1,344,413 Operating income (loss):
Propane $ 239,771 $ 254,447 $ 248,473 Fuel oil and refined fuels 9,338 8,489 7,605 Natural gas and electricity 7,459 8,758 12,309 All other (20,377 ) (19,516 ) (20,145 ) Corporate (95,921 ) (101,324 ) (90,239 )
Total operating income 140,270 150,854 158,003
Reconciliation to net income: Loss on debt extinguishment 109 — — Interest expense, net 74,727 76,663 77,383 Other, net 4,822 4,702 4,692 (Benefit from) provision for income taxes (146 ) 857 (606 )
Net income $ 60,758 $ 68,632 $ 76,534 Depreciation and amortization:
Propane $ 106,725 $ 108,763 $ 111,460 Fuel oil and refined fuels 1,843 2,083 2,574 Natural gas and electricity 18 — — All other 189 196 215 Corporate 8,016 9,830 10,973
Total depreciation and amortization $ 116,791 $ 120,872 $ 125,222
As of September 26, September 28, 2020 2019
Assets: Propane $ 1,934,960 $ 1,904,344 Fuel oil and refined fuels 47,063 44,279 Natural gas and electricity 10,594 11,907 All other 18,733 2,950 Corporate 35,903 34,868
Total assets $ 2,047,253 $ 1,998,348

F-34
18. Subsequent Event
On November 12, 2020, the Operating Partnership acquired the propane assets and operations of a propane retailer headquartered in North Carolina for $7,685, including $1,250 for non-compete consideration, plus working capital acquired. The acquisition was consummated pursuant to the Partnership’s strategic growth initiatives.

S-1
INDEX TO FINANCIAL STATEMENT SCHEDULE
SUBURBAN PROPANE PARTNERS, L.P. AND SUBSIDIARIES Page Schedule II Valuation and Qualifying Accounts – Years Ended September 26, 2020, September 28, 2019 and
September 29, 2018 ...............................................................................................................................................
S-2

S-2
SCHEDULE II
SUBURBAN PROPANE PARTNERS, L.P. AND SUBSIDIARIES
VALUATION AND QUALIFYING ACCOUNTS (in thousands)
Balance at Beginning of Period
Charged (credited) to Costs and Expenses Other Additions Deductions (a)
Balance at End of Period
Year Ended September 29, 2018 Allowance for doubtful accounts $ 3,044 $ 4,443 $ — $ (3,858 ) $ 3,629 Valuation allowance for deferred tax assets 59,188 (1,366 ) — (19,941 ) 37,881 Year Ended September 28, 2019 Allowance for doubtful accounts $ 3,629 $ 2,580 $ — $ (3,636 ) $ 2,573 Valuation allowance for deferred tax assets 37,881 115 — — 37,996 Year Ended September 26, 2020 Allowance for doubtful accounts $ 2,573 $ 3,855 $ — $ (1,955 ) $ 4,473 Valuation allowance for deferred tax assets 37,996 (298 ) — — 37,698
(a) Represents amounts that did not impact earnings.

S-3
Exhibit 21.1
SUBSIDIARIES OF SUBURBAN PROPANE PARTNERS, L.P. (as of November 25, 2020)
SUBURBAN LP HOLDING, INC. (Delaware) SUBURBAN LP HOLDING, LLC (Delaware) SUBURBAN PROPANE, L. P. (Delaware) SUBURBAN SALES & SERVICE, INC. (Delaware) GAS CONNECTION, LLC (Oregon) SUBURBAN FRANCHISING, LLC (Nevada) SUBURBAN ENERGY FINANCE CORP. (Delaware) SUBURBAN HEATING OIL PARTNERS, LLC (Delaware) (d/b/a Suburban Propane) AGWAY ENERGY SERVICES, LLC (Delaware) SUBURBAN PROPERTY HOLDINGS, LLC (Delaware)

Exhibit 23.1
CONSENT OF INDEPENDENT REGISTERED PUBLIC ACCOUNTING FIRM
We hereby consent to the incorporation by reference in the Registration Statements on Form S-4 (No. 333-228760) and Form S-8 (Nos. 333-224975, 333-204559 and 333-160768) of Suburban Propane Partners, L.P. of our report dated November 25, 2020 relating to the financial statements, financial statement schedule, and the effectiveness of internal control over financial reporting, which appears in this Form 10 K.
Florham Park, New Jersey November 25, 2020

Exhibit 31.1
Certification of the President and Chief Executive Officer Pursuant to Section 302
of the Sarbanes-Oxley Act of 2002 I, Michael A. Stivala, certify that:
1. I have reviewed this Annual Report on Form 10-K of Suburban Propane Partners, L.P.;
2. Based on my knowledge, this report does not contain any untrue statement of a material fact or omit to state a material fact necessary to make the statements made, in light of the circumstances under which such statements were made, not misleading with respect to the period covered by this report;
3. Based on my knowledge, the financial statements, and other financial information included in this report, fairly present in all material respects the financial condition, results of operations and cash flows of the registrant as of, and for, the periods presented in this report;
4. The registrant’s other certifying officer and I are responsible for establishing and maintaining disclosure controls and procedures (as defined in Exchange Act Rules 13a-15(e) and 15d-15(e)) and internal control over financial reporting (as defined in Exchange Act Rules 13a-15(f) and 15d-15(f)) for the registrant and have:
a) Designed such disclosure controls and procedures, or caused such disclosure controls and procedures to be designed under our supervision, to ensure that material information relating to the registrant, including its consolidated subsidiaries, is made known to us by others within those entities, particularly during the period in which this report is being prepared;
b) Designed such internal control over financial reporting, or caused such internal control over financial reporting to be designed under our supervision, to provide reasonable assurance regarding the reliability of financial reporting and the preparation of financial statements for external purposes in accordance with generally accepted accounting principles;
c) Evaluated the effectiveness of the registrant’s disclosure controls and procedures and presented in this report our conclusions about the effectiveness of the disclosure controls and procedures, as of the end of the period covered by this report based on such evaluation; and
d) Disclosed in this report any change in the registrant’s internal control over financial reporting that occurred during the registrant’s most recent fiscal quarter (the registrant’s fourth fiscal quarter in the case of an annual report) that has materially affected, or is reasonably likely to materially affect, the registrant’s internal control over financial reporting; and
5. The registrant’s other certifying officer and I have disclosed, based on our most recent evaluation of internal control over financial reporting, to the registrant’s auditors and the audit committee of the registrant’s Board of Supervisors:
a) All significant deficiencies and material weaknesses in the design or operation of internal control over financial reporting which are reasonably likely to adversely affect the registrant’s ability to record, process, summarize and report financial information; and
b) Any fraud, whether or not material, that involves management or other employees who have a significant role in the registrant’s internal control over financial reporting.
November 25, 2020 By: /s/ MICHAELA. STIVALA Michael A. Stivala President and Chief Executive Officer

Exhibit 31.2
Certification of the Chief Financial Officer and Chief Accounting Officer Pursuant to Section 302
of the Sarbanes-Oxley Act of 2002 I, Michael A. Kuglin, certify that:
1. I have reviewed this Annual Report on Form 10-K of Suburban Propane Partners, L.P.;
2. Based on my knowledge, this report does not contain any untrue statement of a material fact or omit to state a material fact necessary to make the statements made, in light of the circumstances under which such statements were made, not misleading with respect to the period covered by this report;
3. Based on my knowledge, the financial statements, and other financial information included in this report, fairly present in all material respects the financial condition, results of operations and cash flows of the registrant as of, and for, the periods presented in this report;
4. The registrant’s other certifying officer and I are responsible for establishing and maintaining disclosure controls and procedures (as defined in Exchange Act Rules 13a-15(e) and 15d-15(e)) and internal control over financial reporting (as defined in Exchange Act Rules 13a-15(f) and 15d-15(f)) for the registrant and have:
a) Designed such disclosure controls and procedures, or caused such disclosure controls and procedures to be designed under our supervision, to ensure that material information relating to the registrant, including its consolidated subsidiaries, is made known to us by others within those entities, particularly during the period in which this report is being prepared;
b) Designed such internal control over financial reporting, or caused such internal control over financial reporting to be designed under our supervision, to provide reasonable assurance regarding the reliability of financial reporting and the preparation of financial statements for external purposes in accordance with generally accepted accounting principles;
c) Evaluated the effectiveness of the registrant’s disclosure controls and procedures and presented in this report our conclusions about the effectiveness of the disclosure controls and procedures, as of the end of the period covered by this report based on such evaluation; and
d) Disclosed in this report any change in the registrant’s internal control over financial reporting that occurred during the registrant’s most recent fiscal quarter (the registrant’s fourth fiscal quarter in the case of an annual report) that has materially affected, or is reasonably likely to materially affect, the registrant’s internal control over financial reporting; and
5. The registrant’s other certifying officer and I have disclosed, based on our most recent evaluation of internal control over financial reporting, to the registrant’s auditors and the audit committee of the registrant’s Board of Supervisors:
a) All significant deficiencies and material weaknesses in the design or operation of internal control over financial reporting which are reasonably likely to adversely affect the registrant’s ability to record, process, summarize and report financial information; and
b) Any fraud, whether or not material, that involves management or other employees who have a significant role in the registrant’s internal control over financial reporting.
November 25, 2020 By: /s/ MICHAEL A. KUGLIN Michael A. Kuglin Chief Financial Officer and Chief Accounting Officer

Exhibit 32.1
Certification of the President and Chief Executive Officer Pursuant to 18 U.S.C. Section 1350, as Adopted Pursuant to
Section 906 of the Sarbanes-Oxley Act of 2002
In connection with the Annual Report of Suburban Propane Partners, L.P. (the “Partnership”) on Form 10-K for the period ended September 26, 2020 as filed with the Securities and Exchange Commission on the date hereof (the “Report”), I, Michael A. Stivala, President and Chief Executive Officer of the Partnership, certify, pursuant to 18 U.S.C. § 1350, as adopted pursuant to § 906 of the Sarbanes-Oxley Act of 2002, that to my knowledge:
(1) The Report fully complies with the requirements of Section 13(a) or 15(d) of the Securities Exchange Act of 1934; and
(2) The information contained in the Report fairly presents, in all material respects, the financial condition and results of operations of the Partnership.
By: /s/ MICHAEL A. STIVALA Michael A. Stivala President and Chief Executive Officer November 25, 2020
This certification shall not be deemed “filed” for purposes of Section 18 of the Securities Exchange Act of 1934, as amended (the “Exchange Act”), or incorporated by reference in any filing under the Securities Act of 1933, as amended, or the Exchange Act, except as shall be expressly set forth by specific reference in such a filing.

Exhibit 32.2
Certification of the Chief Financial Officer and Chief Accounting Officer Pursuant to 18 U.S.C. Section 1350,
as Adopted Pursuant to Section 906 of the Sarbanes-Oxley Act of 2002
In connection with the Annual Report of Suburban Propane Partners, L.P. (the “Partnership”) on Form 10-K for the period ended September 26, 2020 as filed with the Securities and Exchange Commission on the date hereof (the “Report”), I, Michael A. Kuglin, Chief Financial Officer and Chief Accounting Officer of the Partnership, certify, pursuant to 18 U.S.C. § 1350, as adopted pursuant to § 906 of the Sarbanes-Oxley Act of 2002, that to my knowledge:
(1) The Report fully complies with the requirements of Section 13(a) or 15(d) of the Securities Exchange Act of 1934; and
(2) The information contained in the Report fairly presents, in all material respects, the financial condition and results of operations of the Partnership.
By: /s/ MICHAEL A. KUGLIN Michael A. Kuglin Chief Financial Officer and Chief Accounting Officer November 25, 2020
This certification shall not be deemed “filed” for purposes of Section 18 of the Securities Exchange Act of 1934, as amended (the “Exchange Act”), or incorporated by reference in any filing under the Securities Act of 1933, as amended, or the Exchange Act, except as shall be expressly set forth by specific reference in such a filing.
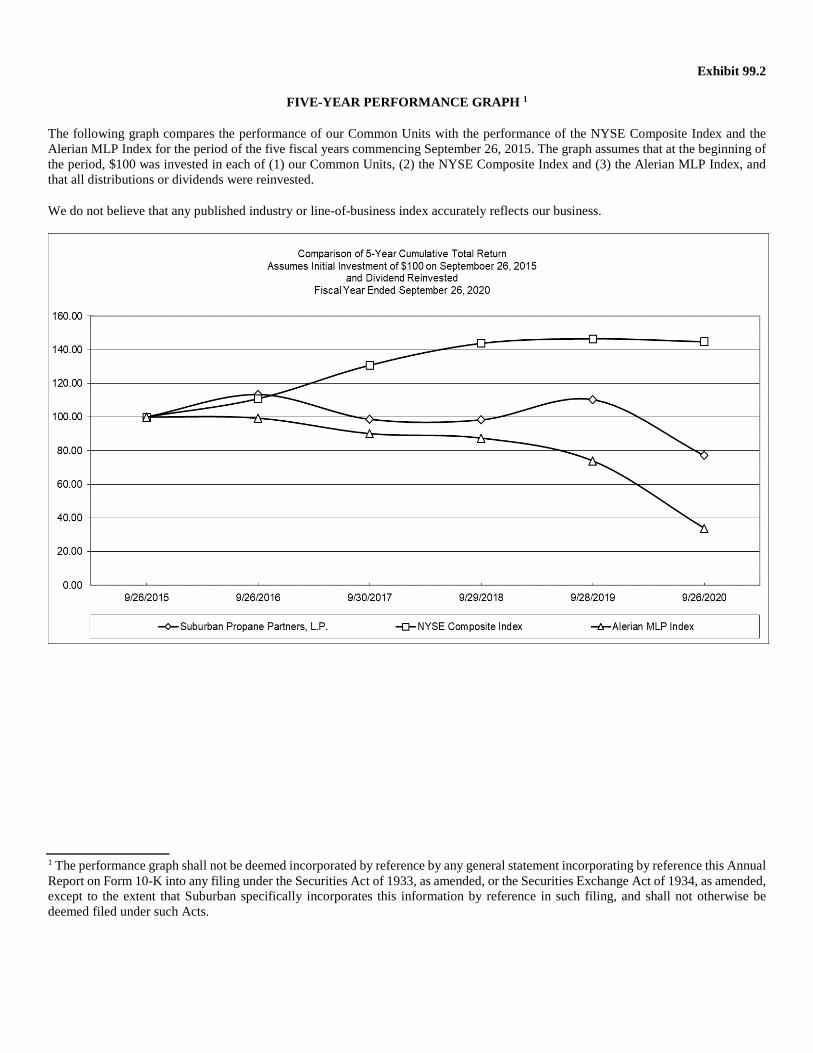
Exhibit 99.2
FIVE-YEAR PERFORMANCE GRAPH 1
The following graph compares the performance of our Common Units with the performance of the NYSE Composite Index and the Alerian MLP Index for the period of the five fiscal years commencing September 26, 2015. The graph assumes that at the beginning of the period, $100 was invested in each of (1) our Common Units, (2) the NYSE Composite Index and (3) the Alerian MLP Index, and that all distributions or dividends were reinvested.
We do not believe that any published industry or line-of-business index accurately reflects our business.
1 The performance graph shall not be deemed incorporated by reference by any general statement incorporating by reference this Annual Report on Form 10-K into any filing under the Securities Act of 1933, as amended, or the Securities Exchange Act of 1934, as amended, except to the extent that Suburban specifically incorporates this information by reference in such filing, and shall not otherwise be deemed filed under such Acts.

Suburban Board andExecutive Management
EXECUTIVE MANAGEMENTMICHAEL A. STIVALAPresident and Chief Executive Officer
MICHAEL A. KUGLINChief Financial Officer and Chief Accounting Officer
STEVEN C. BOYDChief Operating Officer
DOUGLAS T. BRINKWORTHSenior Vice President, Product Supply,Purchasing and Logistics
NEIL E. SCANLONSenior Vice President, Information Services
DANIEL S. BLOOMSTEINVice President and Controller
FRANCESCA CLEFFIVice President, Human Resources
A. DAVIN D’AMBROSIOVice President and Treasurer
BRYON KOEPKEVice President, General Counsel and Secretary
KEITH P. ONDERDONKVice President, Operational Support
MICHAEL SCHUELERVice President, Product Supply
DAN BOYDVice President, Area Operations
GREG BOYDVice President, Area Operations
TOM ROSSVice President, Area Operations
ART TATEVice President, Area Operations
BOARD OF SUPERVISORSHarold Logan, Jr. (Chairman)**
Lawrence C. Caldwell*Matthew J. Chanin**
Terence J. Connors*
William M. Landuyt*
John Hoyt Stookey**
Jane Swift*
Michael A. Stivala
* Member of Nominating/Governance Committeeand Audit Committee
** Member of Nominating/Governance Committeeand Compensation Committee
INVESTOR INFORMATIONCopies of Annual Reports, Interim Reports and otherpublications are available without charge fromSuburban Propane.
Refer to our website for:• Company news, including the
scheduling of analyst calls• Earnings releases• K-1’s
Suburban Propane Partners, L.P.Investor RelationsP.O. Box 206Whippany, New Jersey 07981-0206Telephone: 973-503-9252www.suburbanpropane.com
Telephone number for K-1 inquiries: +1 888-878-0708
It is anticipated that K-1’s will be available on our website and mailed to each Unitholder in late February 2021.
UNITHOLDER INFORMATIONExchange ListingSuburban Propane Partners, L.P. commonunits are listed on the New York StockExchange under the ticker symbol SPH.
TRANSFER AGENT/UNITHOLDER RECORDSComputershare Investor Services
By Mail:Computershare Investor ServicesP.O. Box 505000Louisville, KY 40233-5000United States of America
By Overnight Delivery:Computershare Investor Services462 South 4th Street, Suite 1600Louisville, KY 40202United States of America
Telephone: +1 781-575-2724 www.computershare.com

Suburban Propane Partners, L.P.
One Suburban Plaza240 Route 10 West • P.O. Box 206
Whippany, NJ 07981-0206
suburbanpropane.com


