Green Power Marketing in Canada: The State of the Industry A Report Completed for Environment Canada December 2002 Prepared by: Jonathan J. Dogterom, Pembina Institute Matthew McCulloch, Pembina Institute Andrew Pape-Salmon, Pembina Institute
Transcript
Green Power Marketing in Canada:
The State of the Industry A Report Completed for Environment Canada December 2002 Prepared by: Jonathan J. Dogterom, Pembina Institute Matthew McCulloch, Pembina Institute Andrew Pape-Salmon, Pembina Institute
Acknowledgements The Pembina Institute would like to acknowledge the cooperation and support of the following Canadian electrical utilities and individuals: Maritime Electric Company Ltd. – Angus Orford Toronto Hydro Energy Services Inc. – Joyce McLean Nova Scotia Power – Joan McDougall ENMAX Energy – Theresa Howland Ontario Power Generation – Murray Patterson SaskPower – Monica Curtis EPCOR Energy Services Inc. – Tannis Tupper Cambridge and North Dumfries Hydro – Glen Wood The authors would also like to thank Karin Lloyd for her research and writing assistance during a student co-op term as an Eco-Efficiency Analyst.
About the Pembina Institute The Pembina Institute is an independent, citizen-based organization involved in environmental education, research, public policy development, and client-confidential environmental consulting services. Its mandate is to develop and promote policies and practices that lead to environmental protection, resource conservation, and environmentally sound and sustainable energy and resource management. The mission of the Pembina Institute is to implement holistic and practical solutions for a sustainable world. Incorporated in 1985, the Institute’s head office is in Drayton Valley, Alberta, with offices in Ottawa and Calgary, and satellite offices in Edmonton, Vancouver, Saskatoon, and Toronto. For more information on the Pembina Institute’s work and details of the capabilities and services it offers, please visit our web site at www.pembina.org.
About the Authors Jonathan J. Dogterom is a Sustainable Energy Analyst for the Pembina Institute. His focus is on sustainable energy policy and project assessment for corporations and communities. Areas of expertise include low-impact renewable energy technologies, electricity market policy, Green Power certification standards, and community energy planning. In previous work experience, Jonathan established international certification for Canada’s first large-scale wind turbine for remote applications, and has been involved with power electronic research and development for small wind and solar applications. Matthew McCulloch is part of the Pembina Institute’s Eco-Solutions Group. He leads and provides technical support in applying life cycle value assessments (LCVAs) to resource and utility sector companies. Matthew applies his environmental and technical knowledge to characterize environmental, social, and economic consequences of operations, while also helping to generate potential project design improvements. Matthew also delivers LCVA classes to students in the Industrial Ecology program at Mt. Royal College in Calgary, Alberta. Other areas of focus include corporate and community sustainable development through the evaluation of renewable energy and sustainable business opportunities, and leading pre-feasibility studies to
Green Power Marketing in Canada: The State of the Industry 2
assess potential project viability. Matthew also sits on project review teams of the Greenhouse Gas Emissions Reduction Trading (GERT) Pilot Technical Committee. Andrew Pape-Salmon is the Director of Sustainable Energy at the Pembina Institute. He is a professional engineer and resource manager with a focus on sustainable energy policy, low-impact renewable energy technologies, and community energy planning. He has led several sustainable energy policy advocacy efforts in Canada and has authored several related reports, including “A Smart Electricity Policy for Alberta,” available on the Pembina Institute’s web site. He has worked extensively on the implementation of low-impact renewable energy and energy efficiency at a community level with First Nations, industry, and small municipal government partners in Alberta, British Columbia, and the Yukon. Andrew is the Director of Government Relations with the Canadian Wind Energy Association.
Green Power Marketing in Canada: The State of the Industry
2 DESCRIPTION OF CANADIAN GREEN POWER MARKETING PROGRAMS.................. 10 2.1 EXISTING PROGRAMS IN COMPETITIVE MARKETS ..................................................................... 10
2.1.1 ENMAX Energy................................................................................................................... 11 2.1.2 EPCOR Energy Services Inc............................................................................................... 11
2.2 EXISTING PROGRAMS IN NON-COMPETITIVE MARKETS............................................................. 12 2.2.1 Maritime Electric Company Ltd. ........................................................................................ 12 2.2.2 Cambridge and North Dumfries Hydro .............................................................................. 12 2.2.3 SaskPower........................................................................................................................... 12
2.3 EMERGING PROGRAMS................................................................................................................ 13 2.3.1 Ontario Power Generation ................................................................................................. 13 2.3.2 Toronto Hydro Energy Services Inc. .................................................................................. 14 2.3.3 Nova Scotia Power.............................................................................................................. 14 2.3.4 BC Hydro ............................................................................................................................ 14
2.4 THE ROLE OF INDEPENDENT POWER PRODUCERS ...................................................................... 15 2.5 EMERGING GREEN TAG PROGRAMS ........................................................................................... 15
3 EXISTING PROGRAM COMPARISON ...................................................................................... 16 3.1 SOURCES OF GENERATION AND INSTALLED CAPACITY ............................................................. 17 3.2 CUSTOMER ENROLMENT............................................................................................................. 20 3.3 PRODUCT DESIGN – PREMIUM CHARGED................................................................................... 21
4 ENVIRONMENTAL AND SOCIAL BENEFITS FROM GREEN POWER ............................. 22 4.1 ENVIRONMENTAL BENEFITS ....................................................................................................... 22
4.1.1 Background on Greenhouse Gases (GHGs) ....................................................................... 22 4.1.2 Background on Acid Deposition Precursors (ADPs) ......................................................... 22 4.1.3 Background on Ground-Level Ozone Precursors (GLOPs) ............................................... 23 4.1.4 Background on Particulate Matter (PM) and Secondary Particulate Matter Precursors (SPMPs) ........................................................................................................... 23 4.1.5 Background on Sulphur Dioxide (SO2)............................................................................... 24 4.1.6 Background on Nitrogen Oxides (NOX) .............................................................................. 24 4.1.7 Background on Carbon Monoxide (CO)............................................................................. 24
4.2 EMISSIONS REDUCTIONS............................................................................................................. 25 4.3 OTHER BENEFITS ........................................................................................................................ 30
6 CANADIAN GREEN POWER GUIDELINES.............................................................................. 32 6.1 ISSUES SURROUNDING GREEN POWER GUIDELINES IN GENERAL.............................................. 34
6.1.1 Definition of Green Power.................................................................................................. 34 6.1.2 Development of New Generation ........................................................................................ 34 6.1.3 Ownership of Environmental Attributes ............................................................................. 35
Green Power Marketing in Canada: The State of the Industry 4
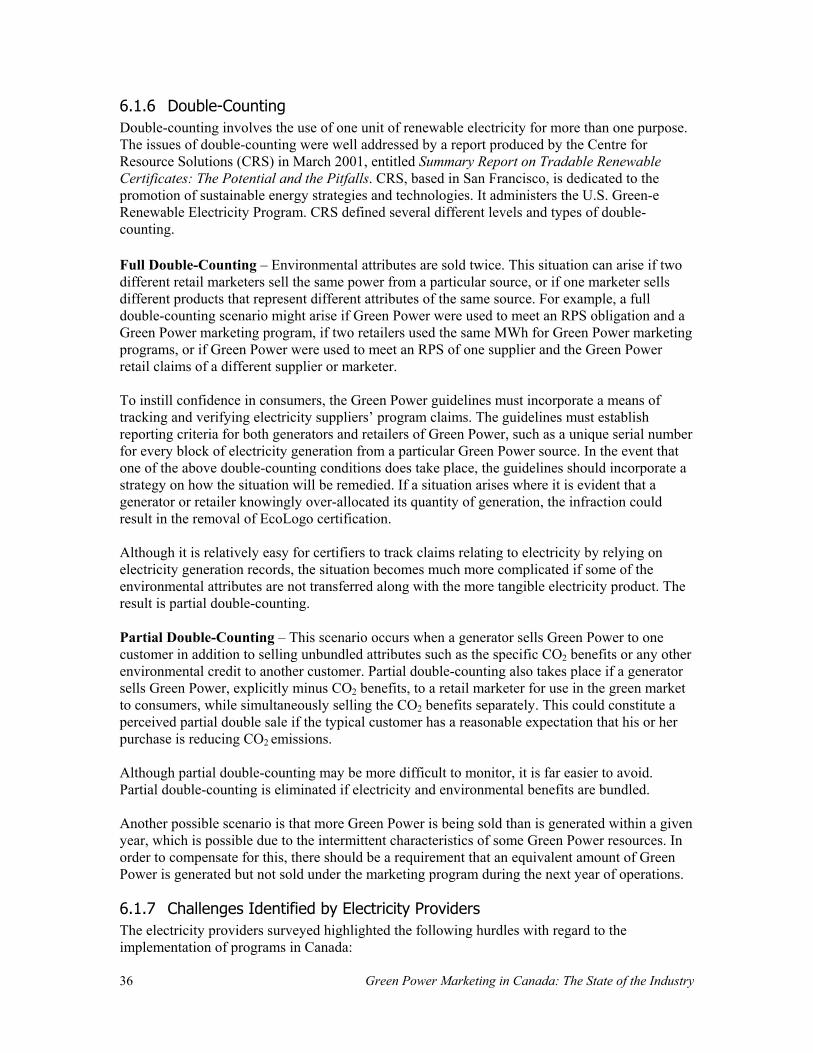
6.1.4 National Continuity............................................................................................................. 35 6.1.5 Consistency ......................................................................................................................... 35 6.1.6 Double-Counting ................................................................................................................ 36 6.1.7 Challenges Identified by Electricity Providers ................................................................... 36
7 UNITED STATES GREEN POWER PROGRAMS ..................................................................... 37
APPENDIX A: GREEN POWER MARKETING SURVEY FOR CANADIAN UTILITIES .......... 41 PART A – RESIDENTIAL PROGRAMS ..................................................................................................... 41 PART B – BUSINESS AND INDUSTRIAL PROGRAMS ............................................................................... 42 PART C – GENERAL INFORMATION....................................................................................................... 43
Figures and Tables FIGURE 1. GENERATION SOURCES AND INSTALLED CAPACITY FOR EXISTING GREEN POWER
MARKETING PROGRAMS..................................................................................................................... 17 FIGURE 2. GENERATING SOURCES CURRENTLY KNOWN FOR EMERGING PROGRAMS .............................. 18 TABLE 1. CUSTOMER ENROLMENT IN EXISTING PROGRAMS (2001).......................................................... 20 TABLE 2. COMPARISON TABLE: OFFERINGS AND PRICE PREMIUMS FOR UTILITY PROGRAMS ................. 21 TABLE 3. GREEN POWER PROGRAM HISTORY........................................................................................... 25 TABLE 4. PROVINCIAL FUEL TYPE BREAKDOWN BY GENERATION .......................................................... 27 TABLE 5. LIFE CYCLE EMISSIONS OF ELECTRICITY SOURCES................................................................... 27 TABLE 6. EMISSION OFFSETS FROM EXISTING PROGRAMS ....................................................................... 29
Green Power Marketing in Canada: The State of the Industry
Executive Summary Green Power marketing is a relatively new, market-based initiative to introduce low-impact renewable energy into Canada’s electricity supply. The recent restructuring of two provincial electricity markets is making it possible for consumers to choose their electricity supplier; as a result, customers are being offered Green Power at a premium price in some jurisdictions. In other jurisdictions, which do not offer consumers a choice, existing vertically integrated power companies are also offering Green Power options as an alternative to conventional power products. In the Alberta electricity market, both ENMAX Energy and EPCOR Energy Services Inc. offer Green Power programs to their residential and commercial sector customers. Relatively new programs are also being offered in Prince Edward Island (by Maritime Electric Company Ltd.) and in Saskatchewan (by SaskPower). All of the current Green Power offerings in Canada are based on specific amounts of electricity purchased – consumers pay a monthly premium to obtain a specific amount or block of power from low-impact renewable sources. The Pembina Institute investigated the success of the various programs based on the installed capacity of Green Power, consumer enrolment, product design, and environmental benefits; this report presents the results of that investigation. This study only considered programs established by the end of 2001. A subsequent study will be completed early in 2003 to consider programs launched in 2002, such as those of Nova Scotia Power and others, including Green Certificate programs, which separate the environmental attributes of Green Power from electricity sales, and voluntary Green Power acquisition programs by electricity companies that are not tied to Green Power marketing. The environmental benefits of Green Power marketing are modest but measurable. The study analyzed the environmental impacts of new generation technologies that have been implemented as a result of Green Power marketing programs. Since various provinces use different types of power generation, Pembina investigated and quantified the benefits in each province based on historical emission data of the primary generation sources. The significant emissions avoided by Green Power generation are greenhouse gases, acid deposition precursors, ground-level ozone precursors, particulate matter, and carbon monoxide. Life cycle emissions from conventional power sources, as well as Green Power sources, have been included in the emissions reduction analysis in each province considered. Because of the location of the existing programs, the only provinces included in this study are Alberta, Saskatchewan, and Prince Edward Island. A quantification of the historical offsets from existing Green Power marketing programs, assuming that all Green Power offered was purchased, showed that the following estimated amounts of air emissions were displaced in 2001:
• 67,115 tonnes of greenhouse gases (CO2 equivalents); • 318 tonnes of SO2 equivalents; • 133 tonnes of ground-level ozone precursors (NOX and volatile organic compounds, or
VOCs); • 13 tonnes of particulate matter; and • 36 tonnes of carbon monoxide.
Numerous environmental benefits, such as the reductions outlined above, can be considered an overall benefit to society. Other social benefits of renewable energy use are the following:
Green Power Marketing in Canada: The State of the Industry 6
• 50% more jobs per million dollars invested created by renewable energy compared to conventional sources;1
• stable long-term costs and lower operating costs than conventional sources; • less depletion of non-renewable resources, and increased use of renewable resources for
sustained electricity production in the long term; • reduced impact on biodiversity, watersheds, and landscapes than conventional sources; • no increase in toxic waste buildup; and • the broad satisfaction of contributing to society’s sustainability.
As with the introduction of any new consumer product, there are several obstacles that must be overcome in order to create a successful Green Power marketing industry. The Pembina Institute considers the development of guidelines to govern the industry to be a critically important element. There are two main certification programs with guidelines under development. The Environmental Choice Program (ECP) has developed guidelines that certify low-impact renewable energy under the EcoLogo brand, and the Canadian Electricity Association (CEA) is currently developing a reporting standard that may eventually become a reward system. In order to be successful, guidelines must include a clear and concise definition of Green Power, a means of allocating ownership of environmental attributes, consideration of national continuity and consistency, and a methodology to avoid double-counting. The electricity providers surveyed identified the following obstacles to the implementation of programs in Canada:
• A lack of consumer awareness and understanding results in a continuous need for education on low-impact renewable energy.
• Standards for Green Power are confusing, due to unfinalized ECP and CEA guidelines. Consumers will shy away from purchasing Green Power if multiple definitions of the product are offered at different prices, representing different standards of environmental performance. The ECP EcoLogo certifies high environmental performance and renewable power sources only. In contrast, the CEA initiative could include fossil fuel and large storage-reservoir hydroelectric projects with significant historical environmental impacts. The CEA initiative could severely jeopardize the Green Power market in Canada by offering fossil fuel products as “environmentally preferable” at a potentially lower cost than EcoLogo products.
• The ownership of environmental benefits remains in question. The vast majority of Green Power programs would like to see the environmental benefits bundled and sold with the electricity so that they can transfer the benefits to consumers.
• Some provincial government electricity regulatory agencies2 (operating under and administering the Utilities Commission Act) enforce strict requirements on product offerings that hinder the success of the programs.
• There are difficulties associated with understanding how to incorporate Green Power into the energy supply portfolio – specifically, how to integrate intermittent resources into the energy mix.
1 Report for Environment Canada – Global Air Issues Branch, “Comparative Analysis of Employment from Air Emissions Reduction Measures.” 1997: Pembina Institute. 2 The responsibilities of utility commission regulators are to protect the rights of ratepayers and ensure that the rates charged for energy are fair, just, and reasonable, and that utility operations provide safe, adequate, and secure service to their customers.
Green Power Marketing in Canada: The State of the Industry
Green Power marketing in Canada will rapidly expand in 2002 with the introduction of several programs in Ontario, Nova Scotia, and British Columbia. However, success in Canada within the market will depend on the introduction of one set of clear, concise guidelines that protect consumers and ensure that environmental attributes are passed on to them. Green Power marketing empowers consumers by allowing them to choose to incorporate low-impact renewable (Green Power) energy into their energy supply, and it could lead to the development of more Green Power projects. Nonetheless, it should be regarded as an independent but complementary mechanism, along with other methods of achieving the same objective. Two other programs that would assist in the development of renewable energy include Renewable Portfolio Standards (RPS) and emissions trading. In fact, Green Power marketing is an excellent means of engaging public support, not only for Green Power but, eventually, for larger-scale, legislated programs, such as the RPS, which will result in substantially higher environmental benefits at a significantly lower cost to consumers.
Green Power Marketing in Canada: The State of the Industry 8
1 Introduction The definition of Green Power has undergone considerable discussion over the past five years among the various electricity stakeholders. Although several different definitions exist, they usually include two primary characteristics:3
• the electricity is generated from renewable resources; and • the sources of electricity promote the protection of human health and the environment.
The generation of Green Power results in the creation of several different products. It creates not only electricity (i.e., the commodity being sold), but also “greenhouse gas offsets” (a product of generation) and other environmental benefits, such as improved air quality resulting from reducing air emissions from fossil fuel sources. Several environmental attributes can be bundled together as “Green Certificates” or “Green Tags” (i.e., a new paper commodity that represents the environmental attributes).4 Electricity providers (utilities and retailers) are now developing or purchasing Green Power to supplement their power supplies. Some providers are marketing and selling it to a select number of consumers who opt for a specific Green Power product as an alternative to conventional power supplies. These products are offered at a higher price than conventional supplies to cover the cost premium associated with Green Power. This type of offering is commonly referred to as “Green Power marketing” or “green pricing.” Currently, four electricity providers in Canada offer this product. Other electricity providers are blending Green Power with other electricity supplies in the electricity product they sell to all consumers, and recover any cost premiums from the entire consumer base. This type of arrangement is commonly referred to as a “Green Power Portfolio Standard,” “Set-Aside,” or “Quota.” Currently, British Columbia and Quebec have this type of arrangement.5 This study summarizes the current state of Green Power marketing in Canada. It compares programs that currently exist, provides insights on the development of national guidelines, and analyzes the impact of Canadian Green Power marketing programs on the environment. It has been developed in the hope that it can serve as a baseline for future tracking of changes in the industry. This study only considered Green Power marketing programs established by the end of 2001. A subsequent study will be completed early in 2003 to consider programs launched in 2002, including Green Certificate programs, which separate the environmental attributes of Green Power from electricity sales, and voluntary Green Power acquisition programs by electricity companies that are not tied to Green Power marketing.
3 Raynolds, Marlo and Pape, Andrew, “The Pembina Institute Green Power Guidelines for Canada.” July 2000: Pembina Institute. Available at www.pembina.org. 4 “Environmental attributes” and “environmental benefits” are used interchangeably throughout this study. Both terms are defined as tangible, environmentally desirable qualities of low-impact renewable energy that reduce emissions of greenhouse gases, local air pollutants, toxic waste buildup, and impacts on watersheds and wildlife. These terms also include any emerging commodities, such as greenhouse gas offsets associated with these reductions. 5 Contact the authors for other Pembina Institute studies that highlight Portfolio Standards.
Green Power Marketing in Canada: The State of the Industry
2 Description of Canadian Green Power Marketing Programs Electricity in Canada has traditionally been supplied from coal, hydro, or nuclear facilities; however, as a result of a substantial increase in awareness of the environmental impacts of these sources, consumers have developed a preference for low-environmental-impact sources of electricity, such as Green Power. Some electricity suppliers, responding to consumer preferences, are beginning to offer renewable energy at a premium price, creating a new market for Green Power. In some areas of Canada, the electricity market has been opened up to competition where one or more suppliers previously had a monopoly in the provision of electricity. There are several rationales for this switch in the market structure: • it opens up the transmission lines to cheaper supplies from neighbouring regions; • it establishes an electricity pricing system that reflects the cost of new supplies and the value
of power exports; • it stimulates the development of emerging small, distributed power technologies; and • it introduces competition between producers and service providers to ensure that prices are
competitively managed. Restructuring is taking place on two different levels. The first is on a wholesale basis, where electricity generators have access to the transmission system and can sell power to distribution companies or independent marketers. The second is in retail competition, where marketers have access to distribution systems and can sell to consumers, consumers have a choice among the various marketers, and different products are offered by each marketer. The provinces of British Columbia, Saskatchewan, Manitoba, Québec, and New Brunswick have all implemented wholesale access to the electricity market. Alberta implemented full retail access as of January 1, 2001, and Ontario implemented full retail access in 2002. Throughout North America, Green Power is included in certain utility product offerings. Green Power is often more costly to generate than power from conventional fossil fuel sources, especially when life cycle environmental and social costs of electricity are not taken into consideration. As a result, providers pass the additional costs on to consumers, applying them to consumers’ utility bills as an additional price per kWh or as a flat monthly fee. The Canadian federal government has set an example for consumers by undertaking a program whereby it will purchase 20% of the power used by federal facilities through a green procurement initiative, as part of its “Action Plan 2000 on Climate Change.” Currently, the federal government is purchasing Green Power in Alberta, Saskatchewan, and P.E.I. To accurately assess the state of Canadian Green Power marketing, the Pembina Institute surveyed Canadian utilities that are known to be currently selling electricity to Canadian consumers, that are planning to implement a Green Power marketing program, or that previously had a program in place. A copy of the survey is included in Appendix A of this report.
2.1 Existing Programs in Competitive Markets Alberta is the only Canadian province that had implemented a competitive retail electricity market, as of the end of 2001. Two major electricity suppliers in the province, ENMAX Energy and EPCOR Energy Services Inc., offer consumers Green Power products, and the experience
Green Power Marketing in Canada: The State of the Industry 10
gained by these programs provides excellent insight into the potential future of this market in Canada.
2.1.1 ENMAX Energy ENMAX is a City of Calgary–owned utility that supplies 340,000 residential and 20,000 commercial customers in Southern Alberta.6 ENMAX was the first to offer Green Power to Canadian consumers, through a program called Greenmax, established in 1998. The Greenmax program provides Alberta customers with the option of paying a premium of $5, $10, or $15 per month on their electrical bill. Participating customers elect to purchase 75 kWh, 160 kWh or 250 kWh per month of Green Power, respectively.7 Greenmax purchases EcoLogo-certified Green Power (see Chapter 6) for the program from wind turbines in Southern Alberta, owned and operated by independent power producers. Greenmax has approximately 3,000 residential customers and 200 commercial customers enrolled.8 Natural Resources Canada, Environment Canada, and the Calgary Transit Authority are all examples of commercial customers that participate in the program. No standard rate for these customers exists; they are provided with customized contracts and offerings.
2.1.2 EPCOR Energy Services Inc. EPCOR Energy Services Inc. is the largest Alberta-based utility. It sells electricity to over 600,000 customers. EPCOR launched its Green Power program in 1999. The program gives residential consumers the option to purchase “Eco-Packs,” which are described as “blocks of energy generated from low impact/renewable sources, such as small hydro, wind, biomass and solar.”9 The electricity that customers receive is generated from the incremental part of the output of a 23 MW wood waste biomass plant expanded in 1997, part of the generation from a 12.75 MW run-of-the-river hydropower plant, all of the generation from a 13.4 kW solar power installation, and part of the generation from a 900 kW wind turbine that was recently installed in Southern Alberta. EPCOR offers the Eco-Packs for a price premium of $5, $10, $20, and $40 per month, for which customers receive 10%, 25%, 50%, and 100%, respectively, of their power from these green sources.10 The percentages that are advertised are equivalent to 55 kWh/month, 137 kWh/month, 275 kWh/month, and 550 kWh/month, respectively (based on average monthly consumption of 550 kWh). The program had 3,100 residential customers at the end of December 2001.11 In 2001, EPCOR began offering commercial consumers “ECO-PACKS.” The quantities of electricity purchased with an ECO-PACK are based on the average monthly power consumption of commercial customers (7,000 kWh). In addition to their regular monthly power bill, customers pay a premium of $50 per month for 10% Green Power (700 kWh), $125 per month for 25% Green Power (1,750 kWh), $250 per month for 50% Green Power (3,500 kWh), and $450 per month for 100% Green Power (7,000 kWh).12 Offers are also sometimes customized to suit the individual needs of the consumer. All of the environmental attributes from Green Power sales to residential consumers are retired and not used by EPCOR for its own environmental management targets. The environmental 6 Theresa Howland, ENMAX Energy, Green Power Marketing Survey Response (02/02/12). 7 The premium options have expanded since launch and ¢/kWh (i.e., the amount of energy the premium purchases) of Green Power has decreased and increased, based on market costs for Green Power. 8 Theresa Howland, ENMAX Energy, Green Power Marketing Survey Response (02/02/12). 9 www.EPCOR.ca. 10 Conversation and e-mail correspondence with Tannis Tupper, EPCOR Sustainable Development (01/07/11). 11 Tannis Tupper, EPCOR Energy Services Inc., Green Power Marketing Survey Response (02/02/27). 12 Ibid.
Green Power Marketing in Canada: The State of the Industry
attributes from Green Power sales to commercial customers are transferred to the customer in the form of a Green Certificate at the end of each calendar year for the volume and types of environmental attributes purchased (e.g., CO2, SO2, N2O, and particulate emission reductions from the Green Power).
2.2 Existing Programs in Non-Competitive Markets
2.2.1 Maritime Electric Company Ltd. Maritime Electric services 55,000 residential and 11,000 industrial customers. It has been offering the Maritime Electric Green Power Program to customers since December 2001.13 A 5.2 MW wind farm, installed in November 2001 and owned and operated by the PEI Energy Corporation, supplies the electricity for the program. Green Power is also sold to the governments of Canada and P.E.I. through their renewable energy commitments.14 The retail sale of power takes place in 50 kWh blocks at a price of $1.75 per block.
2.2.2 Cambridge and North Dumfries Hydro Cambridge and North Dumfries Hydro was the first public utility in Ontario to offer a rate for Green Power, through its EarthWise program. Cambridge and North Dumfries Hydro is a municipal electric utility owned by the City of Cambridge and the Township of North Dumfries. Under the new regulatory environment, it is defined as a local distribution company, with its core business being the delivery of power. While it continues to supply electricity to customers who choose not to switch to a new retailer, it is no longer an active retailer for electricity. As a result, it was obligated by the regulator to end the Green Power program when the Ontario market opened. Due to billing and other changes in customer information systems that also needed to take place with the market opening, the program was discontinued at the end of 2001.15 The utility was serving power to 38,500 residential customers. At the close of the EarthWise program, approximately 120 residential customers and 6 commercial customers were enrolled.16 EarthWise Power had been offered to consumers at a price of 7.71¢/kWh, a 0.84 cent premium over the standard Ontario Power Generation supply at 6.87¢/kWh.17 Unlike the Western province utilities offering similar programs, Cambridge and North Dumfries Hydro did not offer a flat monthly rate to consumers. However, its prices were low enough that an average customer using 775 kWh per month could purchase 100% Green Power for only $6.51 extra each month. Cambridge and North Dumfries Hydro also offered commercial customers a 10% renewable energy option in GWh blocks at the same price. Of the total power, 10% came from a wind turbine in Southern Ontario, and 90% from small-scale hydro. Since it is no longer an active retailer and its Green Power program has been discontinued, Cambridge and North Dumfries Hydro is not included in the program comparison section of this report.
2.2.3 SaskPower SaskPower currently offers SaskPower Green Power to residential, farm, business and industrial customers. The Green Power is supplied by an 11 MW wind farm located in Saskatchewan. Much 13Angus Orford, Maritime Electric Company Ltd., Green Power Marketing Survey Response (02/02/12). 14 Ibid. 15 E-mail correspondence with Glen Wood, Director of Customer Services, Cambridge and North Dumfries Hydro (02/02/18). 16 E-mail correspondence with Glen Wood, Director of Customer Services, Cambridge and North Dumfries Hydro (02/02/18). 17 Conversation with Glen Wood, Director of Customer Services, Cambridge and North Dumfries Hydro (01/07/11).
Green Power Marketing in Canada: The State of the Industry 12
of the power generated by the wind farm is being used to supply the Government of Canada’s power needs in the province through its Green Power commitment.18 A 5.9 MW wind farm was also installed in late 2002. By early 2002, the SaskPower Green Power program had 230 business and industrial participants, out of the 86,000 served by the utility.19 Premium payments are based on 100 kWh blocks, each block costing $3.50, or 3.5 cents per kWh. Any purchases over $100,000 are negotiated on a case-by-case basis with a power purchase agreement. The residential program launched in April, 2002 targeted SaskPower’s 312,000. The structure of the residential program was to be the same as the current commercial program.20 One important distinction with this program is that SaskPower retains ownership of greenhouse gas offsets for sales under its program to consumers other than the federal government. Thus, consumers are only purchasing part of the Green Power product, with the greenhouse gas emission reduction component retained by the utility. This allows SaskPower to offer the product at a lower price. However, it also breaks the standard set by all other Green Power marketing programs in Canada, which pass all attributes of the product on to consumers. The Pembina Institute believes that consumers should be made aware of this policy so they are not misinformed about the product they are purchasing.
2.3 Emerging Programs
2.3.1 Ontario Power Generation Ontario Power Generation (OPG) currently supplies about 85% of all the electricity consumed in Ontario; however, as part of the Ontario market restructuring, OPG is required to reduce “Tier II” market share to 35% over the next 10 years. OPG customers have historically included more than 250 municipal electric distribution utilities (MEUs) throughout the province, which in turn supply retail power to more than three million homes and businesses. The number of MEUs is dropping quickly as they rationalize their operations in anticipation of market opening.21 In early 2002, there were 93 MEUs.22 Larger retail operations, such as Hydro One, are consolidating much of the distribution market, and fewer than one-third of MEUs will likely remain when the market opens. In addition to the MEUs, OPG also supplies power to more than 100 retail industrial customers in the automotive, pulp and paper, mining, manufacturing, petrochemical, steel, and other energy-intensive industries. OPG has established an operating unit called Evergreen Energy to manage its Green Power program, which will provide Green Power to customers in the Ontario electricity industry after restructuring. Evergreen’s pool consists of a broad spectrum of generation sources:
• 29 small, run-of-the-river hydroelectric projects; • commercial-scale wind turbines – at the end of 2001, a 1.8 MW Vestas unit in Pickering
and a 600 kW Tacke unit that has been operating in Bruce County since 1995; • power purchases from two Toronto-area biogas plants that use the methane gas produced
from solid waste; and • a 5 kW Photovoltaic installation at OPG headquarters in Toronto.23
18 Monica Curtis, SaskPower, Green Power Marketing Survey Response (02/02/22). 19 Ibid. 20 Ibid. 21 E-mail correspondence with Murray Paterson, Manager of Business Development, OPG – Evergreen Energy (02/02/14). 22 E-mail correspondence with Glen Estil, Sky Generation Inc. 23 Ibid.
Green Power Marketing in Canada: The State of the Industry
In 2002, OPG, in partnership with British Energy Canada, developed a new wind project: a 10 MW wind farm to be located near Kincardine on the shores of Lake Huron. OPG is also exploring opportunities to use other biofuels, such as wood waste and farm wastes, to produce Green Power. Specific details regarding the Evergreen Energy program design are scheduled to be released to the public shortly.
2.3.2 Toronto Hydro Energy Services Inc. Toronto Hydro Energy Services Inc. is a new retail electricity company based in Ontario. It launched a Green Power program to customers in 2002.24 At the end of 2001, the program plan was to offer the product to both residential and commercial customers.25 Plans included the development of a wind turbine on the City of Toronto Harbourfront in collaboration with the Toronto Renewable Energy Co-operative (TREC). Toronto Hydro is also looking at a former landfill site where methane could be used as an alternative supply source.26
2.3.3 Nova Scotia Power Nova Scotia Power is planning to implement a Green Power program for its 400,650 residential customers in 2002. Nova Scotia Power is not currently planning to offer this program to commercial customers; however, it is in discussions with the federal government regarding the sale of Green Power for use by the federal facilities located in the province. 27 Plans are under way for the program to incorporate wind power and possibly other sources of generation.28 The utility is evaluating more than 20 independent power producer applications competing for the installation of 30 MW of wind capacity (2% of the provincial generating capacity).29 Nova Scotia Power has also purchased and installed two wind turbines to launch its program.30
2.3.4 BC Hydro31 BC Hydro announced on February 20, 2002, that it would begin to market Green Power to commercial and industrial customers in late 2002. This initiative will generate demand for Green Power in addition to that required under BC Hydro’s voluntary commitment to meet 10% of new domestic electricity requirements through green energy technologies. To meet this 10% voluntary green “Portfolio Standard,” BC Hydro will be purchasing approximately 1,100 GWh of its annual new supply from independent power producers (IPPs) with projects that meet BC Hydro’s green criteria. This 10% will become part of the mix of electricity supplied by BC Hydro to all of its customers. Green Power that BC Hydro secures 24 Joyce McLean, Toronto Hydro Energy Services Inc., Green Power Marketing Survey Response (02/02/12). 25 www.torontohydro.com/energyservices/green_energy/project_details/index.cfm. 26 Ibid. 27Joan McDougall, Green Power Development Manager, Nova Scotia Power, Green Power Marketing Survey Response (02/02/12). 28 Ibid. 29 Canadian Wind Energy Association, “Nova Scotia Power Looking for 50 MW.” September 2001: WindSight, Vol. 14, No. 3. 30 E-mail correspondence with Joan McDougall, Green Power Development Manager, Nova Scotia Power (02/02/13). Nova Scotia Power web site news releases. 31 This description was completed without the assistance of a survey, due to the recent announcement of the program.
Green Power Marketing in Canada: The State of the Industry 14
above and beyond its voluntary commitment will be available for purchase by institutions, businesses, governments, and industry customers committed to demonstrating environmental leadership. This program is similar to those offered by ENMAX, EPCOR, Maritime Electric, and SaskPower; however, BC Hydro is calling its product a Green Certificate (see Section 2.5 below). BC Hydro’s method acknowledges that the actual path of electrical energy from the Green Power facilities cannot be tracked and separates the environmental and social attributes of green energy from the electrons. In addition, BC Hydro plans to export its Certificates outside the province to consumers in neighbouring jurisdictions. To date, BC Hydro has signed initial Electricity Purchase Agreements to purchase Green Power from some small low-impact hydroelectricity installations, as well as biomass and biogas facilities. In 2003, it will complete a wind farm and a sustainable landfill gas to energy plant. An ocean wave power plant is expected to be completed in 2004. The outputs from these Green Power supplies will be verified by independent bodies to ensure that consumers are getting the full product they are paying for, and that it is not being used for other purposes.
2.4 The Role of Independent Power Producers The ENMAX program relies exclusively on independent power producers (IPPs) to supply the Green Power that is passed on to consumers. EPCOR has taken a different approach and generates some of its own electricity for its Green Power program. Programs planned in the soon-to-be-competitive Ontario market are also using a mixture of strategies. Generally speaking, electricity providers that have not normally been in the business of generating their own electricity are relying on independent power producers for Green Power so that they can continue to concentrate on their core business: the management of transmission, distribution, and retail services. However, there are several reasons some electricity generators are choosing not to generate their own Green Power:
1. Green Power comes from new technologies with which most generators have very little experience. As a result, they lack the necessary skill sets (i.e., siting of wind turbines).
2. New generation technology also exposes generators to a higher level of risk than they normally accept or are accustomed to.
3. IPPs have taken the lead in many jurisdictions in developing Green Power supplies and, as such, have already secured the most favourable project locations. Some IPPs have the ability to move faster because of their much smaller size and can act on project opportunities significantly more quickly than other suppliers.
Some IPPs are also acting as retail companies and selling or planning to sell Green Power directly to customers without involving a distribution or transmission organization.
2.5 Emerging Green Tag Programs In several countries, a new type of Green Power marketing product is emerging: a Green Tag or Green Electricity Certificate. This consumer product represents the environmental attributes of a Green Power facility, but does not include the electricity. Thus, while electricity is sold into an open market such as the Alberta Power Pool, the ownership of emissions reductions and other environmental benefits can be transferred to a buyer other than the electricity buyer. Although this approach has not yet been proven in the marketplace, several companies have begun to define what these products would entail; they include the Bonneville Power Administration in the
Green Power Marketing in Canada: The State of the Industry
United States, BC Hydro, and some smaller Green Power companies, such as VisionQuest Wind Electric in Calgary, Alberta, and Sky Generation Inc. in Guelph, Ontario. The benefit of this product is that Green Power producers could receive financial value for their environmental attributes, yet achieve simplicity in power purchase arrangements by selling directly into the open market without any special contracts. This product is virtually identical to the Green Power marketing initiatives already offered by ENMAX, EPCOR, Maritime Electric, and SaskPower. In fact, EPCOR’s residential Green Power purchase contracts acknowledge that the electricity and the environmental benefits from green energy sources have been unbundled, and that the product sold to the customer under the program is the environmental benefits. The same is true for the commercial program Green Power purchase contracts. The challenges of this approach include ensuring the following:
• that consumers receive exclusive ownership of the environmental attributes; • that the electricity purchaser does not claim ownership of the benefits and market its
business as if it were a Green Power purchaser when it is simply buying regular electricity;
• that Green Power definitions are consistent across jurisdictions where the Green Tag product is sold;
• that the Green Tag clearly indicates ownership of environmental attributes that are or will be regulated (e.g., offsets of greenhouse gases and smog/acid precursor emissions); and
• that the Green Tags are not generated from Green Power supplies that are part of legislated or voluntary system-wide Portfolio Standards, which are intended to generate a set amount of Green Power for all consumers.
The effect of many of these challenges is a risk that the Green Power will be sold to several consumers, paid for by multiple parties, claimed by multiple parties for compliance with environmental regulations, and/or claimed by multiple parties for public relations, marketing, or other purposes. These challenges can be addressed through product auditing programs that track the source and destination of every Green Power certificate in the system. The BC Hydro program will provide significant experience for Canada to assess the value of the Green Tag approach.
3 Existing Program Comparison There are a number of issues and characteristics to consider when determining the success of a program. The National Renewable Energy Laboratory (NREL) in the United States recently completed a study entitled Utility Green Pricing Programs: What Defines Success?, with funding provided by the Office of Power Technologies of the U.S. Department of Energy (DOE). The intention of the study was to research green pricing programs within the United States, determine key program elements, define criteria for success, rank the existing programs, and provide recommendations for best practices when implementing such programs.32 Success of a Green Power program depends on maximizing consumer involvement and thereby generating a market for renewable energy resource development. The Pembina Institute has used the following criteria to compare Canadian Green Power programs:
32 Swezey, Blair and Bird, Lori, Utility Green Pricing Programs: What Defines Success? September 2001: National Renewable Energy Laboratory, NREL/TP.620.29831.
Green Power Marketing in Canada: The State of the Industry 16
1. Quantity of Installed Green Power Resources: Installed capacity is generally driven by customer demand for the program offering. Generally speaking, a more successful program would require a larger amount of Green Power installed capacity.
2. Customer Enrolment: Elevated program subscription statistics indicate program success,
since consumer demand is the principal driver behind Green Power marketing. However, the number of enrolled consumers is often a function of the size of the electricity provider’s jurisdiction. Therefore, the percentage of the total customer base participating in the Green Power program is a more accurate indicator of success.
3. Product Design – Premium Charged: The lower the premium, the greater the effort by the
utility to internalize the costs and make the program more appealing to customers. A lower price could also reflect the quality of the Green Power resource, which might not be desirable for environmental quality.
4. Emission Offsets: Green Power technologies provide varying benefits to the environment.
The Pembina Institute has taken steps to link the Green Power marketing program to the emissions reductions that have been generated as a direct result of the program. However, it is important to note that these calculations depend on the avoidance of conventional forms of energy used in the province where the electricity provider operates and, as a result, the reductions can appear significantly better for a utility that operates in a province where emission levels of the energy generation sector are high.
Several of the Canadian programs are still under development. Once programs have been operating for a longer period of time, the consumer retention rate will be an additional criterion to consider when determining a program’s success. Low retention rates point to customer displeasure with the service offered. High retention rates show customer satisfaction and indicate a successful program. Higher retention rates also show that the program will be more likely to support long-term growth in Green Power supply. However, at this early stage of Canadian programs, and due to the limited number of active programs, retention rates do not provide an accurate measure of success.
3.1 Sources of Generation and Installed Capacity Figure 1. Generation Sources and Installed Capacity for Existing Green Power Marketing
Programs
Green Power Marketing in Canada: The State of the Industry
Generation Sources and Installed Capacity for Existing Green Power Marketing Programs
0.0005.000
10.00015.00020.00025.00030.00035.00040.000
ENMAXEnergy
EPCOR MaritimeElectric
SaskPower
Utility
Inst
alle
d C
apac
ity (M
W)
WaterBiomassSolarWind
ENMAX and EPCOR have extremely similar total installed Green Power capacity associated with their programs, although EPCOR’s facilities are only partly used for the Green Power marketing program. The Whitecourt wood-waste biomass generating station, owned by the Whitecourt Power Limited Partnership, has an installed capacity of 23 MW, but only a small proportion of that is used for EPCOR’s ECO-PACKS program. In 2001, this proportion was 25%. A large proportion of that plant’s output is purchased by other entities, including a contract signed under the provincial government’s Small Power Research and Development Act.
Figure 2. Generating Sources Currently Known for Emerging Programs33
Generating Sources Currently Known for Emerging Programs
TorontoHydro
EnergyServices
OntarioPower
Generation
Nova ScotiaPower
SaskPower
Utility
Qua
ntiti
es S
till t
o Be
De
term
ined
Other (TBD)BiogasWaterBiomassSolarWind
Information regarding expected generation sources for emerging programs within Canada presents two interesting developments:
33 Quantities and mix of generation remain to be determined as programs emerge.
Green Power Marketing in Canada: The State of the Industry 18
1. The introduction of biogas and other generation sources into the Green Power marketing mix.
2. Wind power remaining the major generation source maintained by all programs in their generation mix.
Green Power Marketing in Canada: The State of the Industry
3.2 Customer Enrolment Table 1. Customer Enrolment in Existing Programs (2001) Customer Class ENMAX
Energy EPCOR Energy
Services Inc.
Maritime Electric
Company Ltd.
SaskPower
Residential Total Number of Local Customers 340,000 Over
600,00055,000 N/A
Participating Customers 3,000 3,100 280 N/A Enrolment Percentage 0.88% 0.51% 0.51% N/ABusiness and Industrial Total Number of Local Customers 20,000 N/A 11,000 86,000 Participating Customers 200 N/A 56 230 Enrolment Percentage 1.00% N/A 0.51% 0.27% Note 1: Maritime Electric has one program that services both residential and industrial customers. It was assumed that the percentage enrolment rate for both types of Maritime Electric customers is the same. Note 2: EPCOR would not release the results of its commercial program due to confidentiality restrictions. Note 3: SaskPower did not begin selling green power to consumers other than the Federal Government until early 2002. EPCOR has the highest number of residential customers enrolled in any Green Power marketing program in Canada, while ENMAX has signed up the highest proportion of its customer base. Commercial and industrial customers provide the backbone of Green Power marketing due to their much higher levels of energy use. Information on the actual amounts of Green Power that commercial customers are purchasing from suppliers is difficult to assess since there is no single standard quantity of power sold to these larger consumers. Electricity providers negotiate these contracts on a case-by-case basis. Nonetheless, ENMAX has a successful commercial sector program in terms of the number of customers signed up. ENMAX has secured customers for 95% of the Green Power it produces, showing a high level of success with its marketing program.34 In addition, as of January 1, 2001, both ENMAX and EPCOR began to compete to sell electricity (and Green Power) to all consumers in the province, such that their number of customers has expanded significantly. This will need to be taken into account in future editions of this survey. For example, ENMAX has signed a contract with the provincial government to meet all of its electricity needs, including supplying offices outside Calgary, and to include a 3% share of this electricity from Green Power sources. In addition, ENMAX has signed a contract with the Alberta Urban Municipalities Association to supply all of its participating members with electricity, including a 2% Green Power component. Thus, the number of commercial consumers served is higher than that listed in Table 1 above, which highlights only local customers.
34 Theresa Howland, ENMAX Energy, Green Power Marketing Survey Response (02/02/12).
Green Power Marketing in Canada: The State of the Industry 20
3.3 Product Design – Premium Charged Table 2. Comparison Table: Offerings and Price Premiums for Utility Programs
Customer Class ENMAX Energy EPCOR Energy
Services Inc.
Maritime Electric
Company Ltd.
SaskPower
Residential N/A1. Offering (kWh) $5 per month for
75 kWh$5 per month
for 55 kWh$1.75 for 50 kWh blocks
Premium Price (cents per kWh) 6.7 9.1 3.52. Offering (kWh) $10 per month
for 160 kWh$10 per month
for 137 kWh
Premium Price (cents per kWh) 6.25 7.3 3. Offering (kWh) $15 per month
for 250 kWh$20 per month
for 275 kWh
Premium Price (cents per kWh) 6 7.34. Offering (kWh) $40 per month
for 550 kWh
Premium Price (cents per kWh) 7.3 Business and Industrial N/A Offering (kWh) Customized $1.75 for 50
kWh blocks$3.50 for 100 kWh blocks*
Premium Price (cents per kWh) 3.5 3.5 * Purchases over $100,000 are customized. All of the programs existing in Canada are “energy-based.” In these programs, customers choose the amount of energy to be supplied from Green Power. For the programs offered in Alberta, the monthly premium charge decreases as quantities increase. Both the ENMAX and EPCOR programs use this method of pricing. ENMAX charges a considerably lower price per kWh than EPCOR, and the price difference for the smallest contribution is 2.4 cents per kWh. Neither of the Alberta-based programs offers consumers a break on their Green Power purchases when the Power Pool price is higher than the price of Green Power, and neither charges them a higher premium when the Power Pool price is really low. As such, Green Power offers a price stability benefit to consumers, allowing them to plan their power expenditures for the period of the contract, as opposed to experiencing price volatility in the Power Pool. Programs in other jurisdictions take a slightly different approach. Maritime Electric offers consumers 50 kWh blocks of Green Power for $1.75. Similarly, SaskPower offers 100 kWh blocks for $3.50. The prices do not fluctuate as consumers increase the volume of their purchases, and both premium prices work out to be only 3.5 cents per kWh. It should be noted that the consumer price premium for other types of Green Power programs, such as a Portfolio Standard, outlined in Section 5.1, could be substantially lower than those in the Green Power marketing programs highlighted in this paper. This is because the cost of supplying a proportion of the entire electricity needs of the province, when it is shared among all consumers, is substantially lower for each customer, and because Portfolio Standards may result in larger amounts of Green Power with corresponding economies of scale.
Green Power Marketing in Canada: The State of the Industry
4 Environmental and Social Benefits from Green Power
4.1 Environmental Benefits Increased installation of Green Power will modestly reduce the requirement for more conventional fuel sources, such as coal, oil, and natural gas. These fuel sources have a range of local, regional, and global environmental impacts associated with their life cycle activities, which include exploration, extraction, processing, transportation, and combustion. By displacing the need for these fuel types for electricity generation, a modest amount of environmental impact on land, air, and water may be avoided. The impacts that are most readily quantifiable are air-related emissions. This study quantifies the air emissions displaced, or avoided, based on generated Green Power. The significant emissions avoided are greenhouse gases, acid deposition precursors, ground-level ozone precursors, particulate matter, and carbon monoxide. A brief background on each of these emissions follows.
4.1.1 Background on Greenhouse Gases (GHGs) Emissions resulting from human activities, particularly the burning of fossil fuels, are substantially increasing the atmospheric concentrations of several important greenhouse gases, especially carbon dioxide (CO2), methane (CH4), and nitrous oxide (N2O). These increases are enhancing the greenhouse effect, resulting in an overall average warming of the Earth’s surface. If emissions continue in line with current trends, the temperature increase projected during the current century is expected to have a dramatic impact on the Earth's climate system, resulting in more extreme precipitation events over many areas and consequential flooding, increased risk of drought over most continental interiors, increasing rates of biodiversity loss, and especially rapid change in the Arctic.35,36 The global warming potential of the various greenhouse gases is commonly presented in terms of their equivalence to carbon dioxide in effecting global warming (using the units “kg CO2 eq”). The Intergovernmental Panel on Climate Change uses factors of 21 and 310 for the 100-year global warming potential of methane and nitrous oxide, respectively.
4.1.2 Background on Acid Deposition Precursors (ADPs) Acid deposition, which commonly occurs in the form of acid rain, is responsible for widely documented damage to lakes, forests, crops, and buildings. As lakes become more acidic, plankton and invertebrates are the first to die, while over 75% of fish species cannot survive when the pH drops below 5. This affects not only life within the lakes, but also all life that relies on the lakes for survival. Trees are unable to receive the nutrients they require, and are left susceptible to stunted growth, loss of leaves, climatic changes, diseases, and pests. Acid deposition is more prevalent in Eastern Canada, where forests receive approximately twice the amount of acid they are able to sustain without long-term damage. Even with decreasing emissions of ADPs, it is estimated that once 2010 targets are met, up to one-quarter of the lakes in Eastern Canada will
35 Intergovernmental Panel on Climate Change (IPCC), “Summary for Policymakers, A Report of Working Group I of the Intergovernmental Panel on Climate Change.” 2001a. Available at www.ipcc.ch. 36 Intergovernmental Panel on Climate Change (IPCC), “Summary for Policymakers, Climate Change 2001: Impacts, Adaptation and Vulnerability, A Report of Working Group II of the Intergovernmental Panel on Climate Change.” 2001b. Available at www.ipcc.ch.
Green Power Marketing in Canada: The State of the Industry 22
remain chemically damaged.37 The two key emissions associated with acid deposition are sulphur dioxide (SO2) and nitrogen oxides (NOX), while ammonia (NH3) also contributes to its formation. The acidification potential of NOX is 0.696 times that of SO2, while ammonia is 1.9 times more potent on a mass basis – commonly presented as “kg SO2 eq.”
4.1.3 Background on Ground-Level Ozone Precursors (GLOPs) Elevated levels of ground-level ozone have been shown to cause adverse effects on humans, including irritation of the eyes, nose, throat, and lungs; lowered lung function; and the development of chronic respiratory diseases, possibly leading to increased respiratory hospital admissions and exacerbation of asthma.38 Ground-level ozone has also been found to have a significant impact on reducing the productivity of agricultural crops and forests.39 It is also a major constituent of smog found in several Canadian urban centres. Nitrogen oxides (NOX) and volatile organic compounds (VOCs) are key precursors to the production of ground-level ozone. While both NOX and VOCs, in addition to sunlight, must be present to create ground-level ozone, the relationship between ground-level ozone and its precursors involves a very complex process. The scale of environmental impacts from these precursors is regional. Depending on weather conditions, ozone precursors can travel hundreds of kilometres, or the constituents can concentrate in the local air shed if quiet conditions persist. Representing the quantities and concentrations of these precursors provides only a rough proxy for the actual environmental impacts of ground-level ozone.
4.1.4 Background on Particulate Matter (PM) and Secondary Particulate Matter Precursors (SPMPs)
Particulate matter consists of tiny pieces of solid and liquid matter small enough to be suspended in the air (also referred to as suspended particulate matter – SPM). Of special concern are PM10 and PM2.5 – particulates smaller than 10 and 2.5 microns in size that can penetrate deeply into the lungs. PM2.5 are considered fine particulates formed primarily during fossil fuel combustion, from industrial processes, and through secondary particulate formation in the atmosphere, while particles between 2.5 µm and 10 µm are formed primarily during construction and mining activities (i.e., dust), and from disturbances on unpaved roads and soil erosion. The total suspended particulate (TSP) matter refers to all airborne solid and liquid particles ranging from 0.005 µm to 100 µm in diameter. Secondary sources of PM result from SO2, NOX, VOCs, and ammonia emissions, which act as precursors to PM formation in the atmosphere. Secondary particulate matter precursors are aggregated into the SPMP stressor category. Human health effects of particulate matter include:
…acute effects such as increased daily mortality, increased rates of hospital admissions for exacerbation of respiratory disease, fluctuations in the prevalence of bronchiodilator use and cough and peak flow reductions. Long-term effects of SPM refer also to mortality and respiratory morbidity, but only a few studies on the long-term effects of SPM exist. Air pollution by particulate matter has been considered to be primarily an urban phenomenon, but it is now clear that in many
37 Environment Canada, “Clean Air.” 2002. Available at www.ec.gc.ca/air/introduction_e.cfm, Accessed 01/02. 38 Environment Canada, “National Ambient Air Quality Objectives (NAAQOs).” 1976. Available at www.ec.gc.ca/Ind/english/Urb_Air/Tech_Sup/uasup5_e.cfm#Table_9. 39 Environment Canada, “Clean Air.” 2002. Available at www.ec.gc.ca/air/introduction_e.cfm. Accessed 01/02.
Green Power Marketing in Canada: The State of the Industry
areas of developed countries, urban-rural differences in PM10 are small or even absent, indicating that PM exposure is widespread. This is not to imply that exposure to primary, combustion-related PM may not be higher in urban areas.40
These particulates have also been linked to cancer, especially those particulates from diesel exhaust, which contain carcinogenic fuel combustion products. In general, the finer the particles, the more hazardous they are to human health, as they are able to penetrate deeper into the lungs and can contain higher levels of acids, heavy metals, and other organic compounds. Evidence has shown that there is no defined threshold level at which particulate matter will have no adverse effects on humans.41 In addition, PM is being considered under the CEPA Priority Substances List II process for inclusion in the list of air toxins.42 Particulates also have an impact on the vegetation, structures, and aesthetics of a region. Interfering with photosynthesis and, depending on particle composition, delivering toxins to plants can have a negative impact on plant growth and productivity. Particulate deposition on materials can have an impact on their aesthetics and increase their physical and chemical breakdown. Fine particles can also have an impact on the aesthetics of an entire region by limiting visibility and giving the impression of poor air quality.
4.1.5 Background on Sulphur Dioxide (SO2) In addition to being an acid deposition and a particulate matter precursor, sulphur dioxide inhibits respiratory function by causing breathing discomfort, respiratory illness, and cardiovascular disease. SO2 particularly affects those with asthma, bronchitis, or emphysema, as well as children and the elderly. SO2 is produced by the combustion of fossil fuels containing sulphur. The main sources of sulphur oxides in Canada are smelters (34%) and power plants (20%), although upstream oil and gas, oilsands, and refinery operations combined account for approximately 26% of the national total, based on the 1995 Environment Canada Emission Inventory.43 Transportation sources account for 5% of total SOX emissions.
4.1.6 Background on Nitrogen Oxides (NOX) In addition to being an acid deposition precursor, ozone precursor, and particulate matter precursor, nitrogen dioxide (a major component of NOX) decreases pulmonary function, irritates the lungs, causes bronchitis and pneumonia, and lowers resistance to respiratory infections and disease. Once again, there is an increased sensitivity for those with asthma and bronchitis. NOX are by-products formed from the combustion of fossil fuels. In Canada, electricity generation contributes 10% of all NOX emissions.
4.1.7 Background on Carbon Monoxide (CO) Carbon monoxide is a colourless, odourless, and poisonous gas produced through incomplete combustion of carbon in fuels. When CO enters the bloodstream, it reduces the delivery of oxygen to the body’s organs and tissues, beginning with organs and tissues of high oxygen
40 World Health Organization, “Guidelines for Air Quality.” 2000: Geneva. 41 Health Canada and Environment Canada, “National Ambient Air Quality Objectives for Particulate Matter.” 1998: CEPA/FPAC Working Group on Air Quality Objectives and Guidelines. ISBN 0-662-63486-1. 42 Environment Canada, “Clean Air.” 2002. Available at www.ec.gc.ca/air/introduction_e.cfm. Accessed 01/02. 43 Environment Canada, “Clean Air.” 2002. Available at www.ec.gc.ca/air/introduction_e.cfm. Accessed 01/02.
Green Power Marketing in Canada: The State of the Industry 24
consumption, such as the brain, heart, exercising skeletal muscle, and the developing fetus. Exposure to elevated CO levels can cause impairment of visual perception, manual dexterity, learning ability, and performance of complex tasks. “Severe hypoxia due to acute CO poisoning may cause both reversible, short-lasting neurological deficits and severe, often delayed neurological damage.”44 Health threats are most serious for those who suffer from cardiovascular disease, particularly those with angina or peripheral vascular disease.
4.2 Emissions Reductions The quantity of emissions avoided or displaced through the development and implementation of Green Power programs has been estimated based on generation to date and the type of renewable resource used. The underlying assumption is that the fuel sources displaced are equal to the average fuel mix (based on generation) at the time of the Green Power installation. Table 3 provides a breakdown of the amounts of Green Power each program has contributed, and when. For programs that generated (or purchased) Green Power partway through the year, the annual generation accounts for only that part of the year in which these programs were operating.45
Table 3. Green Power Program History Program ENMAX EPCOR SaskPower Maritime
Percent Wind 100% 100% 100% 100% 0% 0% 8% 100% 100%Percent PV 0% 0% 0% 0% 0% <1% <1% 0% 0%Percent Small Hydro 0% 0% 0% 0% 0% 57% 67% 0% 0%Percent Biomass 0% 0% 0% 0% 100% 42% 25% 0% 0% Note 1: SaskPower and Maritime Electric 2001 annual production included only three months of generation following the installation of the new facilities. Note 2: The annual generation (MWh) quantities presented for ENMAX are based on the information provided by ENMAX, along with several additional assumptions made by the authors when this study was completed. Life cycle emissions from conventional sources per province, as well as Green Power sources, have been included in this emissions reduction analysis. Based on the location of the existing programs, the only provinces included in this study are Alberta, Saskatchewan, and Prince Edward Island. Table 4 lists the breakdown of the fuel mix per province, by generation, based on the noted years.
44 World Health Organization, (WHO), “Guidelines for Air Quality.” 2000: Geneva. 45 ENMAX generation for 1998 and 1999 are estimated based on installation dates of Vision Quest Electric turbines (conversation with Jason Edworthy, February 22, 2002). Numbers for 2000 and 2001 represent actual generation. No biomass generation was included as no information was available at the time of this report. The EPCOR Green Power program was established in 1999, thus no quantification is provided for prior generation. Small hydro is seasonal, so we assumed generation for six months only. Solar contribution is considered negligible (10 kW). Wind power is not included based on only one month of generation in 2001 (900 kW). For biomass and hydro, a 95% capacity factor was applied for maintenance/shutdown-related operations.
Green Power Marketing in Canada: The State of the Industry
Green Power Marketing in Canada: The State of the Industry 26
Table 4. Provincial Fuel Type Breakdown by Generation Alberta46 Year 2000 Coal – 77.6% Oil – 0% Gas – 18.4% Hydro – 3% Other – 1%
Saskatchewan47 Year 1998 Coal – 68.6% Oil – 0.3% Gas – 8.8% Hydro – 21.6% Other – 0.7%
Prince Edward Island48 Year 1998 Coal – 29% Oil – 36% Nuclear – 18% Hydro – 13% Other – 4%
It is assumed that this fuel mix has not significantly changed throughout the life of the existing Green Power marketing programs. Table 5 provides a breakdown of the associated emissions by unit amount of electricity generated within each province, as well as by Green Power type.
Table 5. Life Cycle Emissions of Electricity Sources49 GHG ADP GLOP PM CO By Province (kg/MWh) Alberta 950 4.44 1.85 0.19 0.49P.E.I. 559 5.23 5.73 0.07 1.53Saskatchewan 788 3.81 1.53 0.17 0.43By Green Power Type (kg/MWh)
Wind 13 0.03 0.03 – –Small Hydro 0 0 0 0 0Biomass 38 0.96 1.48 0.24 – For each year of Green Power generation, per program, the emissions associated with the provincial fuel mix for electricity production are considered displaced. The provincial fuel mix is assumed to be constant for each year of Green Power production. The calculation methodology is provided here, for a given year:
46 D. Ruiu of Alberta Power Pool provided the ratio for provincial fuel type breakdown, based on generation. 47 “Electric Power in Canada,” Canadian Electricity Association Report. 1999. 48 “Electric Power in Canada,” Canadian Electricity Association Report. 1999. Note that 90% is imported from New Brunswick. P.E.I. generation is all oil (Maritime Electric web site). 49 No emissions considered associated with hydro or nuclear. A dash indicates that no data were available. For wind, all emissions are associated with “upstream” activities, and are amortized over a 20-year project life. For all oil-generated electricity, emissions for diesel-based generation were used as a proxy. Biomass technology did not have emission control systems, and considers a modern travelling grate system; i.e., emissions from the EPCOR biomass plant are not applied and may differ from Table 5. Data source for wind: McCulloch et al, 1999. Data Source for biomass: aggregate of Klein, Manfred, Environment Canada, Oil, Gas, and Energy Division, “13th Symposium on Industrial Application of Gas Turbines: Full Fuel Cycle Emissions Estimations.” 1999: Hull, Quebec. and Mann, M.K. and Spath, P.L., National Renewable Energy Laboratory, “Life-cycle Assessment of a Biomass Gasification Combined-Cycle Power System.” December 1997.
Green Power Marketing in Canada: The State of the Industry
Example Calculation Annual Emissions Avoided (t) = ∑i
n [ (Emissions from Average Provincial Electricity Supply (t per MWh) – Emissions from Green Power Supply (t per MWh)) x Annual Green Power Generated (MWh)] where i = renewable energy type, and n = total types of renewable energy The types of emissions quantified are consistent with those described in Section 4.1. It is assumed that all Green Power is purchased through Green Power marketing programs. Table 6 provides a breakdown of the emissions and emissions reductions for each year of the Green Power programs. 1997 ENMAX sales are not included because they did not take place under the Greenmax marketing program.
Green Power Marketing in Canada: The State of the Industry 28
Tabl
e 6.
Em
issi
on O
ffset
s fr
om E
xist
ing
Prog
ram
s
Prog
ram
Year
Emis
sion
s O
ffset
from
G
rid
Emis
sion
s G
ener
ated
fro
m G
P
Tota
l Em
issi
ons
Offs
et
Emis
sion
s O
ffset
from
G
rid
Emis
sion
s G
ener
ated
fro
m G
P
Tota
l Em
issi
ons
Offs
et
Emis
sion
s O
ffset
from
G
rid
Emis
sion
s G
ener
ated
fro
m G
P
Tota
l Em
issi
ons
Offs
et
Emis
sion
s O
ffset
from
G
rid
Emis
sion
s G
ener
ated
fro
m G
P
Tota
l Em
issi
ons
Offs
et
Emis
sion
s O
ffset
from
G
rid
Emis
sion
s G
ener
ated
fro
m G
P
Tota
l Em
issi
ons
Offs
et
ENM
AX19
983,
395
463,
349
160
167
07
10
12
02
1999
6,79
193
6,69
832
032
130
131
01
40
420
0013
,635
187
13,4
4964
063
270
263
03
70
720
0158
,650
803
57,8
4827
42
272
114
211
212
012
300
30To
tal t
o D
ate
82,4
721,
129
81,3
4338
53
383
161
315
816
016
430
43EP
CO
R19
9934
514
331
20
11
10
00
00
00
2000
1,90
073
1,82
79
27
43
10
00
10
120
012,
302
882,
214
112
94
31
01
01
01
Tota
l to
Dat
e4,
547
175
4,37
221
417
97
21
10
20
2M
ariti
me
Elec
tric
2001
722
1770
57
07
70
70
00
20
2Sa
skPo
wer
2001
6,45
610
66,
349
310
3113
012
10
14
13
Tota
l C
ombi
ned
Offs
ets
92,7
6943
718
018
49
Tota
l 200
1 O
ffset
s67
,115
318
133
1336
Tota
l CO
(ton
nes)
GH
G (t
onne
s C
O2
eq)
ADP
(tonn
es S
O2
eq)
GLO
P (to
nnes
NO
x&VO
C)
Tota
l PM
(ton
nes)
N
ote:
Sas
kPow
er G
HG
em
issi
on re
duct
ions
are
list
ed a
s 6,3
49 to
nnes
, but
em
issi
on re
duct
ions
ass
ocia
ted
with
the
Gre
en P
ower
mar
ketin
g pr
ogra
m a
re le
ss th
an th
at g
iven
that
th
e co
mpa
ny is
reta
inin
g ow
ners
hip
of th
e gr
eenh
ouse
gas
em
issi
on re
duct
ion
offs
ets f
or sa
les t
o co
nsum
ers o
ther
than
the
fede
ral g
over
nmen
t. G
reen
Pow
er M
arke
ting
in C
anad
a: T
he S
tate
of t
he In
dust
ry
2
9
Four significant conclusions can be drawn from the analysis of historical offsets from existing Green Power programs:
1. In 2001, existing Canadian Green Power programs offset or avoided 67,115 tonnes CO2 eq, 318 tonnes SO2 eq, 133 tonnes GLOP (NOX + VOC), 13 tonnes of particulate matter, and 36 tonnes of carbon monoxide – assuming that all Green Power generated was purchased under Green Power marketing programs. However, this includes 6,349 tonnes of emission reductions from the SaskPower program, in which the company retains ownership of GHG offsets associated with non–federal government sales. Thus, the total GHG emission reductions were lower than 67,115 tonnes in 2001.
2. ENMAX’s program has contributed the majority of total reductions. SaskPower and
Maritime Electric’s programs, in their infancy with a much smaller installed capacity, contributed less to overall emissions reductions.
3. Biomass generates more particulate matter than the mix of conventional sources in the
provinces considered. Thus, the installation of biomass can contribute more PM than might otherwise have occurred on an average basis.
4. The majority of offset emissions are from conventional sources, such as coal and oil,
which are the dominant electricity sources in the jurisdictions considered.
4.3 Other Benefits Numerous environmental benefits, such as the reductions outlined above, can be considered an overall benefit to society. Other benefits of renewable energy use to society are the following:
• 50% more jobs per million dollars invested created by renewable energy compared to conventional sources;50
• stable long-term costs and lower operating costs than conventional sources; • less depletion of non-renewable resources, and increased use of renewable resources for
sustained electricity production in the long term; • reduced impact on biodiversity, watersheds, and landscapes than conventional sources, • no increase in toxic waste buildup; and • the broad satisfaction of contributing to society’s sustainability.
5 Complementary Mechanisms Green Power marketing empowers consumers by allowing them to choose to incorporate low-impact renewable energy into their energy supply, and it could lead to the development of more Green Power projects. Nonetheless, it should be regarded as an independent but complementary mechanism, along with other methods of achieving the same objective. Two other mechanisms that would assist in the development of renewable energy include Renewable Portfolio Standards and emissions trading. However, it is currently not clear that emissions trading will actually support the installation of renewable energy, since that depends on the design of the allocation and trading system. Green Power marketing is an excellent means of engaging public support for
50 Report for Environment Canada – Global Air Issues Branch, “Comparative Analysis of Employment from Air Emissions Reduction Measures.” 1997: Pembina Institute.
Green Power Marketing in Canada: The State of the Industry 30
Green Power, which, in the long run, could result in establishing public support for larger-scale, legislated programs.
5.1 Renewable Portfolio Standards A Renewable Portfolio Standard (RPS) involves the development of a mandatory (government-legislated) or voluntary (on the part of a retail distributor) program that ensures that a certain percentage of electricity sold is generated from low-impact renewable energy sources. Generators of low-impact renewable energy would receive certificates for the production of electricity. Retailers would purchase the most cost-effective certificates, thus effectively creating a competitive market for the supply of renewable energy.51 When Texas restructured its electricity market, the government required electricity retailers to produce a minimum amount of their supply from renewable energy sources, such as wind, biomass, solar, and hydro power. The law states that a minimum of 2,000 MW of new renewable energy capacity must be on-line by 2009. Similarly, in the United States, the states of Arizona, California, Connecticut, Iowa, Maine, Massachusetts, Minnesota, Nevada, New Jersey, New Mexico, Pennsylvania, and Wisconsin require that a proportion of supplies be met by low-impact (green) renewable energy over the next decade.52 In Canada, several companies and provinces have established supply-side targets for clean energy and Green Power. BC Hydro has implemented a voluntary commitment that 10% of all new power supplies will be derived through Green Power (i.e., new supplies of 1,100 GWh each year). In November 2002, the new British Columbia Energy Policy established a “clean electricity” target of 50% of new electricity supplies, albeit with a broader definition, including fossil fuel–fired combined heat and power plants. Nova Scotia’s Energy Strategy in 2001 announced a voluntary RPS for about 2.5% of the electricity-generating capacity of Nova Scotia Power Inc. Hydro Québec has committed to investing in 1,000 MW of new wind energy capacity in the next 10 years. Ontario Power Generation has committed to generate three terawatt-hours of Green Power by 2005. Alberta, New Brunswick, and Ontario have committed to develop renewable energy targets or Portfolio Standards. The Climate Change Plan for Canada has set a national target of 10% of new electrical capacity to be derived from Green Power. It is important for any utility that plans to incorporate both an RPS and Green Power marketing that the two programs remain distinctly separate. The renewable energy that is implemented under an RPS program is offered to all consumers regardless of their involvement in a Green Power marketing program, and any premium price is shared among all consumers. In contrast, Green Power marketing is only subscribed to by a small group of customers, who pay a price premium. These consumers must not be subsidizing any Green Power sources included as part of an RPS commitment. If the programs are not distinctly different, the result could be a double-counting scenario that defeats the purpose of implementing both mechanisms. The programs could, however, be complementary in that the marketing component could allow consumers to purchase a higher proportion of their electricity supplies from Green Power sources than the RPS provides.
51 Pape-Salmon, Andrew, A Smart Electricity Policy for Alberta. March 2001: Pembina Institute. 52 For more information, see the report by the Union of Concerned Scientists, Clean Power Surge: Ranking the States. April 2000. Available at www.ucsusa.org.
Green Power Marketing in Canada: The State of the Industry 31
5.2 Emissions Trading The development of emissions trading programs in Canada is recognized as another valuable tool in reducing emissions and can also increase the installed capacity of renewable energy. The Ontario government has implemented emission caps and an emissions allowance and reduction credit trading system for nitric oxides (NOX) and sulphur dioxide (SO2). As of January 1, 2002, the regulation applies to the coal and oil-fired electric generating facilities of Lakeview, Nanticoke, Lambton, Atikokan, Thunder Bay, and Lennox. Ontario Power Generation currently owns these facilities.53 The plan is to expand the regulation in 2004 to also cover:
• any generator that is over 25 MW capacity; • all who sell/convey annually more than 20,000 MWh of electricity to the transmission
grid controlled by the Ontario Independent Market Operator; and • all who emit more than trace amounts of NOX and SO2, or generators who apply for and
obtain emission allowances. The regulation also defines a code for the system of emissions trading. These rules outline how emissions trading will provide incentives for reductions. Four basic processes define the caps and trading system:
• establishment of emissions limits and allocation of allowances; • credit creation; • credit and allowance use; and • trading administration.54
The Ontario emissions trading system includes a small set-aside for energy efficiency and renewable energy projects. The Canadian government is considering a national emissions trading system for greenhouse gases in order to comply with the Kyoto Protocol that would limit national emissions to 6% below 1990 levels by 2012.
Green Power marketing and emissions trading can work together; however, caution must be taken to ensure that the same environmental attributes from a Green Power installation are not used for the purpose of an emissions trading program and simultaneously sold to consumers. Thus, Green Power marketing consumers will need to be informed that the emissions reductions are being used for the emissions trading system and should be offered a price discount.
6 Canadian Green Power Guidelines The push for Green Power from Canadian electricity consumers and the subsequent emergence of Green Power programs offered by utilities, primarily in deregulated electricity markets, has created a need for certification standards to validate what consumers are buying. Organizations have begun to implement or develop guidelines and certification standards.
53 Ontario Ministry of Environment, Emissions Trading and NOX and SO2 Emissions Limits for Ontario’s Electricity Sector. 2001. Available at www.ene.gov.on.ca/envision/env_reg/er/documents/2001/RA01E0020-C.pdf. 54 Ontario Ministry of Environment, Ontario Emissions Trading Registry Introduction. 2001. Available at www.ene.gov.on.ca/envision/air/etr.
Green Power Marketing in Canada: The State of the Industry 32
In 1996, Environment Canada’s Environmental Choice Program (ECP) developed interim criteria for alternative-source or environmentally preferable electricity generation, and began certification of these sources. Certification of a renewable low-environmental-impact power source under Environment Canada’s ECP results in the award of an “EcoLogo,” the Program’s certification trademark.55 The purpose of the ECP is to empower consumers with a simple, readily identifiable logo to enable them to choose power with a low environmental impact and net environmental benefits. Environment Canada developed the ECP to support more environmentally friendly products and services in a wide range of markets. The “Alternative Source Electricity Generation” category of ECP awarded the EcoLogo certification to electricity generated from naturally occurring energy sources (such as the wind and the sun), and from power sources that, with the proper controls, add little in the way of environmental burdens (such as less intrusive hydro and certain biomass combustion).56 The ECP guidelines are intended to “encourage the supply of and demand for products and services which have less stress on the environment. By empowering consumers with the tools to make informed choices, it is expected that individuals and companies will choose more environmentally preferable options.” On December 8, 2001, the ECP released a new draft of the EcoLogo guidelines for electricity generation for a three-month public review period. The Canadian Electricity Association (CEA) has been involved in the development of different standards. CEA had concerns with the approach of the EcoLogo program when it was being developed, and effectively walked away from the process.57 More specifically, the CEA does not feel that the EcoLogo program serves the needs of the Canadian electricity market and has begun the first stages of an initiative to develop its own guidelines. The CEA organization represents the majority of utility companies, accounting for approximately 95% of Canada’s installed generating capacity, although this initiative may not have the direct support of all of its member companies. It also represents major electrical manufacturers, and several hundred other companies and individuals. The CEA is currently adapting what it calls the “Environmentally Preferable Electricity Portfolio” certification system. Development is being assisted by the Oakland, California–based Scientific Certification Systems (SCS). CEA and SCS together completed a feasibility study showing the value of the Environmentally Preferable Electricity Portfolio certification standard to the Canadian market. They are now proceeding with plans for a pilot project in Manitoba. The CEA has agreements from utilities across Canada to proceed with the initiative The CEA initiative will be different from the ECP EcoLogo in that it will target lower-cost resources, including natural gas, whereas the ECP represents only renewable resources with low environmental impacts. It risks the possibility of leading consumers to believe that they are paying for a product that improves environmental quality, while in reality the product may be comparable to the majority of electricity supplies in the jurisdiction.
55 To be authorized to carry the EcoLogo, a power source must meet or exceed all applicable governmental and industrial safety and performance standards. As well, the facility generating the electricity must meet the requirements of all applicable governmental acts, by-laws and regulations, including, for facilities located in Canada, the Fisheries Act and the Canadian Environmental Protection Act. 56 Environmental Choice Program web site at www.environmentalchoice.com. 57 Conversations with Tim Egan, Canadian Electricity Association.
Green Power Marketing in Canada: The State of the Industry 33
6.1 Issues Surrounding Green Power Guidelines in General
6.1.1 Definition of Green Power Green Power guidelines must ensure that the products receiving the certification truly reflect low-impact renewable (green) energy sources. There are many instances where renewable energy technologies present undesirable environmental consequences and, although they may not directly contribute to emissions, these technologies do not fall under the definition of “low-impact.” The low-impact characteristics of Green Power go beyond the conventional definition of renewable resources and imply a minimal effect on the following:58
• local and regional air quality; • climate change – GHGs; • water quality; • watersheds, river systems and fisheries; • flora and fauna; • geophysical features; • noise; • visual aesthetics; and • any additional buildup of hazardous or toxic waste.
As a result of the different characteristics of various renewable resources, it is impossible to implement general guidelines that apply to all of the technologies. Each technology must meet its own specific requirements to ensure that it is truly a low-impact application of renewable energy. Not all renewable energy sources are free of the aforementioned characteristics so they should not automatically be considered Green Power. For example, while large-scale hydroelectric and biomass energy may constitute relatively clean and “renewable” energy by definition, its full environmental costs can be high (where such large-scale infrastructures have regrettable ecological impacts on the land and environment, negating some of their renewable benefits). This will inevitably reduce the applicability of some technologies, such as biomass and storage hydropower; however, for the guidelines to maintain their credibility with consumers, the full life cycle impacts of the development of the individual technologies must be taken into account. Although this may limit the eligibility of several technologies, it will ensure that only state-of-the-art applications and those that show the lowest levels of environmental impact meet the guideline requirements.
6.1.2 Development of New Generation One objective of Green Power certification is to increase the quantity of installed capacity of new Green Power sources. As a result, one challenge to the guidelines is to set a date for determining whether or not the installation meets the definition of a “new” generation. The EcoLogo guidelines defined the eligibility of programs based on percentages of generation that had to be installed post-1991. The 1999 version of the guidelines specified that a Green Power retail offering had to have 80% of its Green Power installed after 1991. However, the new release of the guidelines (December 2001) allows 50%. This limits the actual impact that the certification standards and Green Power marketing programs will have on the environment as up to half of the Green Power products sold could be from power plants built before 1991.
58 Ibid.
Green Power Marketing in Canada: The State of the Industry 34
6.1.3 Ownership of Environmental Attributes A report produced by Friends of the Earth Canada for the Office of Consumer Affairs Industry Canada in March 2000 surveyed the market for green electricity. This report and others have concluded that customers in Canada purchase renewable electricity (i.e., Green Power) for both the electric energy that is consumed and the environmental benefits associated with it. More specifically, the Friends of the Earth survey found that the number one reason cited for participating in Green Power programs is to reduce air pollution (43%). These “benefits” are defined as the tangible, environmentally desirable qualities of renewable energy, such as reductions in emissions of greenhouse gases (GHGs), local air quality–impacting pollutants, toxic waste buildup, impacts on watersheds and wildlife, and any emerging commodities, such as greenhouse gas offsets associated with those benefits. As previously mentioned, the generation of new Green Power results in more then just electricity; it also produces environmental benefits. In order for guidelines to have credibility with consumers they must ensure that consumers receive what they want to purchase. As the Friends of the Earth survey results showed, consumers are purchasing Green Power for the environmental benefits. Therefore, it is paramount to the success of guideline development that both the electricity and the environmental attributes are transferred to the consumer. Green Power marketing will be jeopardized if the environmental attributes are unbundled from the electricity and not sold as part of the program (i.e., as emissions reduction offset credits or other commodities). If environmental impacts and attributes are not guaranteed to be associated with an energy purchase, then a Green Power product may not be subject to differentiation from other forms of electricity. The result will be that consumers who pay a premium for Green Power may not be receiving an environmentally superior product. If generators or retailers remove the environmental attributes from the electricity product, the EcoLogo brand will eventually be discredited among consumers, thereby decreasing participation, and ultimately diminishing the program’s ability to meet its objectives.
6.1.4 National Continuity Cooperation on guideline development is critical. Consumers will ultimately shy away from purchases of Green Power products if there are multiple programs attempting to sell them what would appear to be the same product at different prices and representing different certification standards. The success of Green Power marketing in Canada will increase with one set of national guidelines.
6.1.5 Consistency Guidelines cannot be left open to dispute over what does and does not qualify. Debates on the eligibility of various generation sources, which continue to take place in Canada, are distracting stakeholders, and send a message to consumers that there are still questions remaining. This ultimately creates further concern regarding the program’s credibility. Furthermore, leaving the debate open with regard to one particular technology also creates an unjust arena for other low-impact energy options. When multiple programs are put in place for the same certification or designation, consumers may become confused and the programs may begin to compete for organizations to use their standard, creating the possibility of standards being developed more for the producer than for the consumer.
Green Power Marketing in Canada: The State of the Industry 35
6.1.6 Double-Counting Double-counting involves the use of one unit of renewable electricity for more than one purpose. The issues of double-counting were well addressed by a report produced by the Centre for Resource Solutions (CRS) in March 2001, entitled Summary Report on Tradable Renewable Certificates: The Potential and the Pitfalls. CRS, based in San Francisco, is dedicated to the promotion of sustainable energy strategies and technologies. It administers the U.S. Green-e Renewable Electricity Program. CRS defined several different levels and types of double-counting. Full Double-Counting – Environmental attributes are sold twice. This situation can arise if two different retail marketers sell the same power from a particular source, or if one marketer sells different products that represent different attributes of the same source. For example, a full double-counting scenario might arise if Green Power were used to meet an RPS obligation and a Green Power marketing program, if two retailers used the same MWh for Green Power marketing programs, or if Green Power were used to meet an RPS of one supplier and the Green Power retail claims of a different supplier or marketer. To instill confidence in consumers, the Green Power guidelines must incorporate a means of tracking and verifying electricity suppliers’ program claims. The guidelines must establish reporting criteria for both generators and retailers of Green Power, such as a unique serial number for every block of electricity generation from a particular Green Power source. In the event that one of the above double-counting conditions does take place, the guidelines should incorporate a strategy on how the situation will be remedied. If a situation arises where it is evident that a generator or retailer knowingly over-allocated its quantity of generation, the infraction could result in the removal of EcoLogo certification. Although it is relatively easy for certifiers to track claims relating to electricity by relying on electricity generation records, the situation becomes much more complicated if some of the environmental attributes are not transferred along with the more tangible electricity product. The result is partial double-counting.
Partial Double-Counting – This scenario occurs when a generator sells Green Power to one customer in addition to selling unbundled attributes such as the specific CO2 benefits or any other environmental credit to another customer. Partial double-counting also takes place if a generator sells Green Power, explicitly minus CO2 benefits, to a retail marketer for use in the green market to consumers, while simultaneously selling the CO2 benefits separately. This could constitute a perceived partial double sale if the typical customer has a reasonable expectation that his or her purchase is reducing CO2 emissions. Although partial double-counting may be more difficult to monitor, it is far easier to avoid. Partial double-counting is eliminated if electricity and environmental benefits are bundled. Another possible scenario is that more Green Power is being sold than is generated within a given year, which is possible due to the intermittent characteristics of some Green Power resources. In order to compensate for this, there should be a requirement that an equivalent amount of Green Power is generated but not sold under the marketing program during the next year of operations.
6.1.7 Challenges Identified by Electricity Providers The electricity providers surveyed highlighted the following hurdles with regard to the implementation of programs in Canada:
Green Power Marketing in Canada: The State of the Industry 36
• A lack of consumer awareness and understanding results in a continuous need for education on low-impact renewable energy.
• Standards for Green Power are confusing, due to unfinalized ECP and CEA guidelines. Consumers will shy away from purchasing Green Power if multiple definitions for the product are offered at different prices, representing different standards of environmental performance. The ECP EcoLogo certifies high environmental performance and renewable power sources only. In contrast, the CEA initiative could include fossil fuel and large storage-reservoir hydroelectric projects with significant historical environmental impacts. The CEA initiative could severely jeopardize the Green Power market in Canada by offering fossil fuel products as “environmentally preferable” at a potentially lower cost than EcoLogo products.
• The ownership of environmental benefits remains in question. The vast majority of Green Power programs would like to see the environmental benefits bundled and sold with the electricity so that they can transfer the benefits to consumers.
• Some provincial government electricity regulatory agencies59 (operating under and administering the Utilities Commission Act) enforce strict requirements on product offerings that hinder the success of the programs.
• There are difficulties associated with understanding how to incorporate Green Power into the energy supply portfolio – specifically, how to integrate intermittent resources into the energy mix.
7 United States Green Power Programs More than one-third of retail customers in the United States now have the option of purchasing Green Power directly from their electricity supplier. Green Power programs have been implemented in 29 states across the United States.60 Within these programs, at the end of 2001, there were 110 MW of new installed renewable resources and firm plans for 172 MW of renewable power to be established. Wind represents the largest percentage of power supply for both the developed and planned programs. Smaller fractions of biomass (landfill methane and wood), small-scale hydro and solar also contribute to the Green Power supply. As of 1999, 24 programs were in place and another 20 were announced in the year 2000.61 Contribution, capacity-based, and energy-based are the three main types of Green Power programs running in the United States. Contribution programs account for about 20% of the projects, operated by eight utilities. This type of program allows customers to contribute to a renewable energy project development fund managed by a utility without specifying the actual quantity of Green Power they will receive for it. The customers often determine the amount of contribution they are willing to make per month. Contribution programs consist mainly of solar power developments; there is also one landfill methane project and one wind turbine project. Capacity-based programs account for only about 4% of the Green Power projects in the United States. There are currently four utilities supplying fixed blocks of electric power created from renewable sources. All of these programs are photovoltaic (PV)–based, and most are larger than
59 The responsibilities of utility commission regulators are to protect the rights of ratepayers and ensure that the rates charged for energy are fair, just, and reasonable, and that utility operations provide safe, adequate, and secure service to their customers. 60 Swezey, Blair and Bird, Lori, Utility Green Pricing Programs: What Defines Success? September 2001: National Renewable Energy Laboratory, NREL/TP.620.29831. 61 Ibid.
Green Power Marketing in Canada: The State of the Industry 37
the solar contribution programs. The premiums range from $6.00 to $6.59 per 100 W of capacity. In general, the capacity blocks bought are well below the power required to serve the customer. Energy-based programs account for 76% of the projects in the United States. The electricity is usually sold in 100 kWh blocks or as a fixed percentage of the monthly electric requirement. Most premiums range from 1¢/kWh to 17.6¢/kWh. Higher premiums represent solar, although most solar power projects use the contribution or capacity-based programs. More than half of the utilities using the energy-based structure are powered by wind energy. A small number of these utilities use mixed renewable energy programs. There are also a few utilities that combine contribution and energy-based designs. In these cases, customers support the development of a new renewable resource while paying a premium tied to an existing resource. The following have been identified as the leading-edge Green Power programs in the United States.62 Los Angeles Department of Water and Power (LADWP) is by far the leader in number of participating consumers. The program has approximately 80,000 customers enrolled – a 6.2% participation rate. However, it should be noted that approximately half of these participants receive renewable energy at no extra cost due to a California state subsidy for Green Power purchases of 1.5¢/kWh. Nevertheless, they still made an active decision to use Green Power. LADWP also has the largest capacity of Green Power resources (wind and various others) at 25 MW. Austin Energy is a close second for renewable resource capacity at 23.2 MW. Austin Energy also intended to install another 53 MW of wind and landfill methane by the end of 2001. Its Greenchoice program has 8,680 participants and has undoubtedly the lowest premium for consumers in the second phase of a program (0.17¢/kWh). The next lowest premiums are approximately 1¢/kWh. The resources used for this program are wind, landfill methane, and solar. Public Service Company of Colorado (PSCo) is second to LADWP in number of participants, with 141,100 subscribers for its Windsource program. Moorhead Public Service’s Capture the Wind program has the leading participation rate for all of the utilities, with 7.4% of subscribers involved.
8 Conclusion The introduction of Green Power to Canadian consumers has been taking place only for the past few years. The two major electricity providers in Alberta (ENMAX and EPCOR) have the most experience and the highest rates of success with their programs. Maritime Electric and SaskPower have recently developed similar programs for their consumers. BC Hydro and Nova Scotia Power recently announced new programs, along with several Ontario retailers. Just over 6,000 residential electricity consumers in Alberta are purchasing Green Power; this translates into a consumer enrolment rate of almost 1%.
62 Ibid.
Green Power Marketing in Canada: The State of the Industry 38
The most common form of Green Power being used for program offerings is wind energy. Wind is included in all of the existing programs and is being pursued for all emerging programs. The total installed capacity of wind power resulting from Green Power marketing initiatives in Canada is 50.3 MW. This represents 58% of the total 86 MW of installed Green Power in marketing programs. A quantification of the historical offsets from existing Green Power marketing programs, assuming that all Green Power offered is purchased, shows that the following estimated amounts of air emissions have been displaced each year:
• 67,115 tonnes of greenhouse gases (CO2 equivalents); • 318 tonnes SO2 equivalents; • 133 tonnes of ground-level ozone precursors (NOX and VOCs); • 13 tonnes of particulate matter; and • 36 tonnes of carbon monoxide.
It should be noted that biomass generates more particulate matter than the mix of conventional sources in Alberta, and thus the installation of biomass can contribute more PM than might have otherwise occurred on an average basis. The majority of offset emissions are from conventional sources, such as coal and oil, which make up the majority of electricity sources in the jurisdictions considered (i.e., Alberta, Saskatchewan, and P.E.I.). The ENMAX program has shown remarkable success for the following reasons:
• It has the highest subscription rate of all the programs in terms of residential and commercial consumers participating, namely 3,000 residential and 200 commercial consumers, representing about 1% of the local consumer base.
• 100% of the Green Power used in the program represents new generation. • ENMAX is currently selling 95% of the power being produced. • The Greenmax program was the first of its kind in Canada. • ENMAX uses 100% wind power. • ENMAX has signed contracts to supply all of the electricity needs of the Alberta
government and members of the Alberta Urban Municipalities Association, with a 3-2% Green Power component in both.
• The ENMAX program requires a lower premium price than the EPCOR program, which represents its competition in the Alberta market – although it charges a higher premium than the SaskPower and Maritime Electric programs.
Numerous environmental benefits, such as the reductions outlined above, can be considered an overall benefit to society. Other social benefits of renewable energy use are the following:
• 50% more jobs per million dollars invested created by renewable energy compared to conventional sources;63
• stable long-term costs and lower operating costs than conventional sources; • less depletion of non-renewable resources, and increased use of renewable resources for
sustained electricity production in the long term; • reduced impact on biodiversity, watersheds, and landscapes than conventional sources, • no increase in toxic waste buildup; and
63 Report for Environment Canada – Global Air Issues Branch, “Comparative Analysis of Employment from Air Emissions Reduction Measures.” 1997: Pembina Institute.
Green Power Marketing in Canada: The State of the Industry 39
• the broad satisfaction of contributing to society’s sustainability. The electricity providers surveyed identified the following obstacles to the implementation of programs in Canada:
• A lack of consumer awareness and understanding results in a continuous need for education on low-impact renewable energy.
• Standards for Green Power are confusing, due to unfinalized ECP and CEA guidelines. Consumers will shy away from purchasing Green Power if multiple definitions for the product are offered at different prices, representing different standards of environmental performance. The ECP EcoLogo certifies high environmental performance and renewable power sources only. In contrast, the CEA initiative could include fossil fuel and large storage-reservoir hydroelectric projects with significant historical environmental impacts. The CEA initiative could severely jeopardize the Green Power market in Canada by offering fossil fuel products as “environmentally preferable” at a potentially lower cost than EcoLogo products.
• The ownership of environmental benefits remains in question. The vast majority of Green Power programs would like to see the environmental benefits bundled and sold with the electricity so that they can transfer the benefits to consumers.
• Some provincial government electricity regulatory agencies64 (operating under and administering the Utilities Commission Act) enforce strict requirements on product offerings that hinder the success of the programs.
• There are difficulties associated with understanding how to incorporate Green Power into the energy supply portfolio – specifically, how to integrate intermittent resources into the energy mix.
Green Power marketing in Canada will rapidly expand in 2002 with the introduction of several programs in Ontario, Nova Scotia, and British Columbia. However, success in the Canadian market will depend on the introduction of one set of clear, concise guidelines that protect consumers and ensure that environmental attributes are passed on to them. Green Power marketing empowers consumers by allowing them to choose to incorporate low-impact renewable (Green Power) energy into their energy supply, and it could lead to the development of more Green Power projects. Nonetheless, it should be regarded as an independent but complementary mechanism, along with other methods of achieving the same objective. Two other programs that would assist in the development of renewable energy include Renewable Portfolio Standards (RPS) and emissions trading. In fact, Green Power marketing is an excellent means of engaging the public in supporting not only Green Power but, eventually, larger-scale, legislated programs, such as the RPS, which will result in substantially higher environmental benefits at a significantly lower cost to consumers.
64 The responsibilities of utility commission regulators are to protect the rights of ratepayers and ensure that the rates charged for energy are fair, just, and reasonable, and that utility operations provide safe, adequate, and secure service to their customers.
Green Power Marketing in Canada: The State of the Industry 40
Appendix A: Green Power Marketing Survey for Canadian Utilities
The Pembina Institute for Appropriate Development, on behalf of Environment Canada, is conducting a survey concerning the state of Green Power Marketing programs in Canada. The intention of the survey is to review both the existing and emerging Green Power marketing programs. The answers to the following questions will assist Pembina in gaining an understanding of your utility’s program. Any amount of information that can be provided is greatly appreciated. Please type your responses in the shaded fields below. Use as much space as required. Thank you for your prompt reply. Name of Organization: Contact Person: Contact Information:
PART A – Residential Programs 1. Is there a residential Green Power marketing program?
Yes Planned but not yet implemented No (If no, proceed to Part B)
2. Please give the name and describe the structure of the residential Green Power
marketing program(s).
3. How many residential customers participate in the program(s)?
4. What is the total number of residential consumers served by the utility?
5. What are the various premium payment options?
6. How have retention rates changed over the past year?
7. Have the premiums changed (reduced or increased) since the program’s inception?
8. Other comments about the residential program(s):
Green Power Marketing in Canada: The State of the Industry 41
PART B – Business and Industrial Programs 9. Is there a business or industrial Green Power marketing program?
Yes Planned but not yet implemented No (If no, proceed to Part C)
10. Please give the name and describe the structure of the business or industrial Green
Power marketing program(s).
11. How many businesses or industrial consumers participate in the program(s)?
12. What is the total number of businesses or industrial consumers served by the utility?
13. What are the various premium payment options?
14. How have retention rates changed over the past year?
15. Have the premiums changed (reduced or increased) since the program’s inception?
16. Other comments about the business or industrial program(s):
Green Power Marketing in Canada: The State of the Industry 42
PART C – General Information 17. What resources are used for the Green Power marketing program?
Wind power Solar power Small-scale hydro Landfill methane Biomass Other
18. Please fill out the applicable spots in the following table:
Green Power resource Installation date Installed capacity of resource
Estimated annual production from
resource Wind power
Solar power
Small-scale hydro
Landfill methane
Biomass
Other 19. What percentage of the installed Green Power marketing capacity is currently being
purchased?
20. Does the current level of consumer participation cover the entire program costs (i.e., does it cover administration and marketing costs)?
21. What efforts have been used to raise awareness of the program (i.e., marketing programs; project implementation information)?
22. What is the utility’s policy on environmental attributes and/or emission credits gained from these programs (i.e., does the utility retain the attributes and credits or are they transferred to the customer)?
23. What has been the largest hurdle encountered when implementing the Green Power marketing program?
Green Power Marketing in Canada: The State of the Industry 43
24. What could the Government of Canada, NGOs and other industry stakeholders do to enhance the success of the Green Power marketing program?
25. Other comments or information:
Green Power Marketing in Canada: The State of the Industry 44