TZW Water Technology Center – Environmental Biotechnology Green Remediation & Atténuation naturelle des solvants chlorés : Identification de la biodégradation anaérobie et aérobie Kathrin Rachel Schmidt (1) , Andreas Tiehm (1) , Michael Heidinger (2) , Siegmund Ertl (2) (1) Water Technology Center (TZW), Department of Environmental Biotechnology, Karlsruhe, Allemagne; www.tzw.de (2) Hydroisotop GmbH, Schweitenkirchen, Allemagne; www.hydroisotop.de
Transcript
TZWWater Technology Center – Environmental Biotechnology
Green Remediation & Atténuation
naturelle des solvants chlorés :
Identification de la biodégradation
anaérobie et aérobie
Kathrin Rachel Schmidt (1), Andreas Tiehm (1),
Michael Heidinger (2), Siegmund Ertl (2)
(1) Water Technology Center (TZW), Department of Environmental
� 2) Oxydation aérobie / minéralisation de cDCE (CV)
Aérobie
CO2
Cl-
H2O
H H
C = CH Cl
Cl H
C = CCl Cl
Cl Cl
C = CCl Cl
Anaérobie
PCE
TCE
cDCE
CV
H H
C = CCl Cl
dégradation
métabolique
Schéma réactionnel
Intersol 2010
TZWKathrin R. Schmidt Water Technology Center – Environmental Biotechnology
L‘identification des processus de
biodégradation
par des méthodes differentes
- qui ont donné des résultats
correspondantes -
a permis la définition du schéma
réactionnel spécifique pour ce site.
Conclusions
Aérobie
CO2
Cl-
H2O
H H
C = CH Cl
H H
C = CH Cl
Cl H
C = CCl Cl
Cl H
C = CCl Cl
Cl Cl
C = CCl Cl
Cl Cl
C = CCl Cl
Anaérobie
PCE
TCE
cDCE
CV
H H
C = CCl Cl
H H
C = CCl Cl
dégradation
métabolique
Oxydation aérobie
CO2
Cl-
H2OH H
C = CH Cl
H H
C = CH Cl
Cl H
C = CCl Cl
Cl H
C = CCl Cl
Cl Cl
C = CCl Cl
Cl Cl
C = CCl Cl
Déchloration anaérobie-réductrice
ComposéorganiqueDonneur
d‘électrons
PCE
TCE
cDCE
CV
éthène
H H
C = CCl Cl
H H
C = CCl Cl
H H
C = CH H
H H
C = CH H
H2
O2
Accepteurd‘électron
Dégradation cométabolique
Dégradation métabolique
Dégradation cométabolique
Dégradation métabolique
sensib
ilitédécro
issante
àla
déchlo
ratio
n ré
ductric
e
sensib
ilitécro
issante
àla
dégra
datio
noxydatif
Répartition des polluants
Conditions redox de l’aquifère
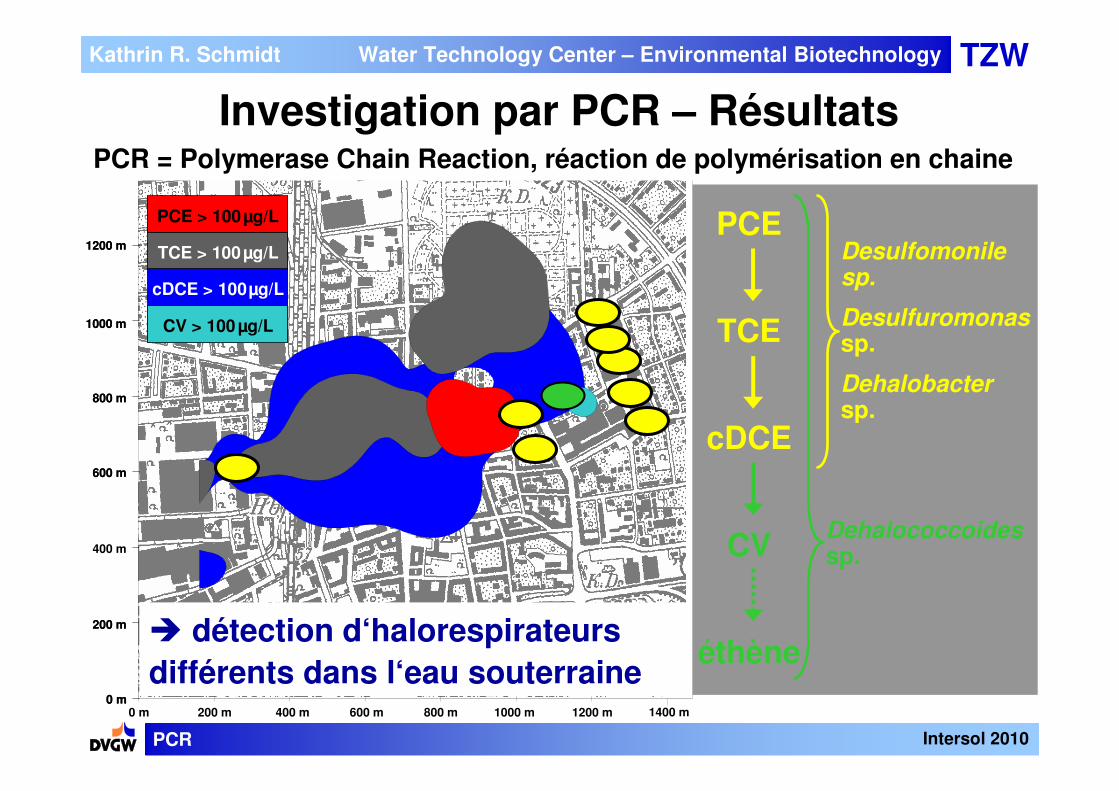
Bactéries spécialisées par PCR et MPN
Dégradation en microcosmes
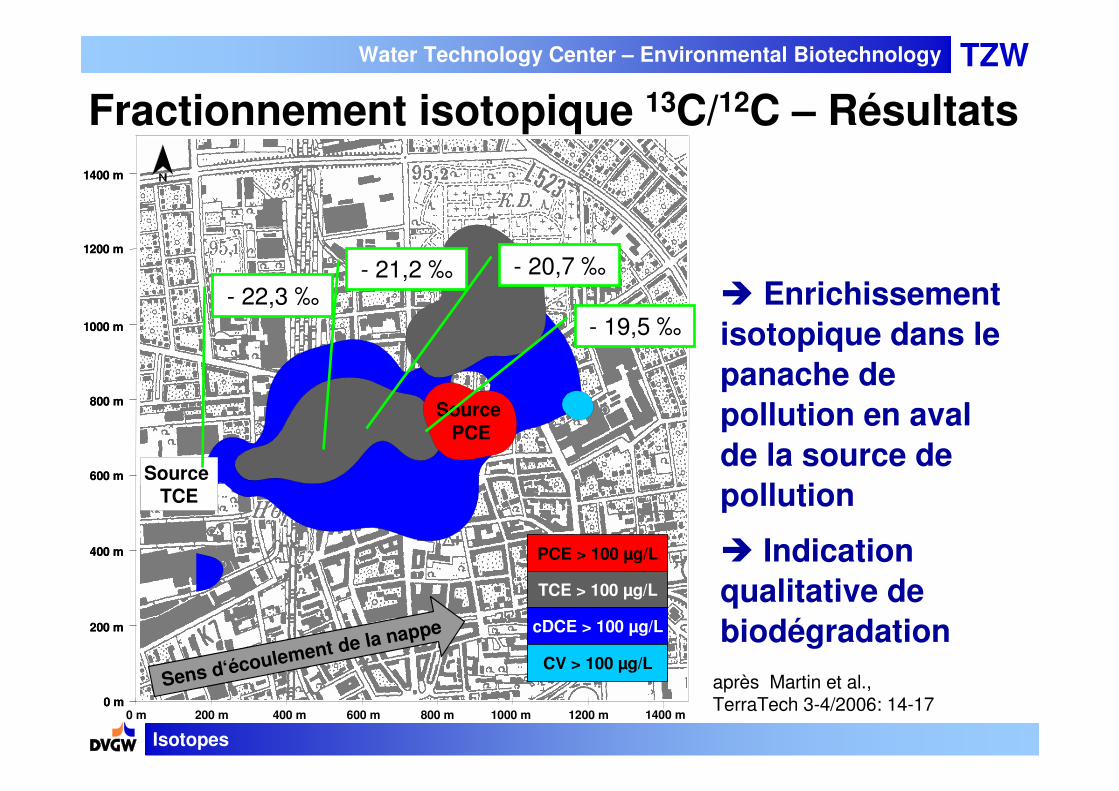
Analyse isotopique
Conclusions
Intersol 2010
TZWKathrin R. Schmidt Water Technology Center – Environmental Biotechnology
Ministère Fédéral de l’Education et de la Recherche (BMBF)
et Land de Rhénanie-Palatinat pour le soutien financier
nos partenaires de project – les Universités de Göttingen,
Karlsruhe et Kiel, et la municipalité de Frankenthal
nos collègues du TZW –
Tobias Augenstein, Carmen Kraffert,
Silke Kraßnitzer, Axel Müller, Sarah
Mungenast, Heico Schell, Claudia
Stoll et Claudia Zawadsky
et vous pour votre attention!!
Remerciements
Remerciements
Intersol 2010
TZWKathrin R. Schmidt Water Technology Center – Environmental Biotechnology
Schmidt K. R., Augenstein T., Heidinger M., Ertl S., Tiehm A. (2010) Aerobic biodegradation of cis-1,2-dichloroethene as sole carbon source: Stable carbon isotope fractionation and growth characteristics. Chemosphere 78(5): 527-532.
Zhao H.-P., Schmidt K. R., Tiehm A. (2010) Inhibition of aerobic metabolic cis-1,2-di-chloroethene biodegradation by other chloroethenes. Water Res.: 44(7): 2276-2282.
Lohner S. T., Tiehm A. (2009) Application of electrolysis to stimulate microbial reductive PCE dechlorination and oxidative VC biodegradation. Environ. Sci. Technol. 43(18): 7098-7104.
Tiehm A., Schmidt K. R., Pfeifer B., Heidinger M., Ertl S. (2008) Growth kinetics and carbon isotope fractionation during aerobic degradation of cis-1,2-dichloroethene and vinyl chloride. Water Res. 42: 2431-2438.
Schmidt K. R., Tiehm A. (2008) Natural attenuation of chloroethenes: Identification of sequential reductive/oxidative biodegradation by microcosm studies. Water Sci. Technol. 58(5): 1137-1145.
Tiehm A., Schmidt K. R. (2007) Methods to evaluate biodegradation at contaminated sites. In: Knödel K., Lange G., Voigt H.-J. (Eds.): Environmental geology – Handbook of field methods and case studies. Springer, Berlin, Heidelberg: 876-911.
Schmidt K. R., Stoll C., Tiehm A. (2006) Evaluation of 16S-PCR detection of Dehalococcoides at two chloroethene-contaminated sites. Water Sci. Technol.: Water Supply 6(3): 129-136.