GREENFIELD FOREIGN DIRECT INVESTMENT AND MERGERS AND ACQUISITIONS: FEEDBACK AND MACROECONOMIC EFFECTS* César Calderón Central Bank of Chile Norman Loayza The World Bank Luis Servén The World Bank Abstract FDI flows to developing countries surged in the 1990s, to become their leading source of external financing. This rise in FDI volume was accompanied by a marked change in its composition: investment taking the form of acquisition of existing assets (M&A) grew much more rapidly than investment in new assets (“greenfield” FDI), particularly in countries undertaking extensive privatization of public enterprises. This raises two issues. First, is the M&A boom a one-time effect of privatization, or is it likely to be followed by a rise in greenfield investment? Second, do these two types of FDI have different macroeconomic causes and consequences – in relation to aggregate investment and growth? This paper focuses on establishing the stylized facts in terms of time precedence between both types of FDI, investment and growth, using annual data for the period 1987-2001 and a large sample of industrial and developing countries. We find that in all samples higher M&A is typically followed by higher greenfield investment, while the reverse is true only for developing countries. In industrial and developing countries alike, both types of FDI lead domestic investment, but not the reverse. Finally, neither type of FDI appears to precede economic growth in either developing or industrial countries, but FDI does respond positively to increases in the growth rate. JEL classification codes: F43, F37, O16 World Bank Policy Research Working Paper 3192, January 2004 The Policy Research Working Paper Series disseminates the findings of work in progress to encourage the exchange of ideas about development issues. An objective of the series is to get the findings out quickly, even if the presentations are less than fully polished. The papers carry the names of the authors and should be cited accordingly. The findings, interpretations, and conclusions expressed in this paper are entirely those of the authors. They do not necessarily represent the view of the World Bank, its Executive Directors, or the countries they represent. Policy Research Working Papers are available online at http://econ.worldbank.org. * This research was supported by the World Bank’s Latin American Regional Studies program. We thank Linda Kaltani for able research assistance.
Transcript
GREENFIELD FOREIGN DIRECT INVESTMENT AND MERGERS AND ACQUISITIONS: FEEDBACK AND MACROECONOMIC EFFECTS*
César Calderón Central Bank of Chile
Norman Loayza The World Bank
Luis Servén
The World Bank
Abstract FDI flows to developing countries surged in the 1990s, to become their leading source of external financing. This rise in FDI volume was accompanied by a marked change in its composition: investment taking the form of acquisition of existing assets (M&A) grew much more rapidly than investment in new assets (“greenfield” FDI), particularly in countries undertaking extensive privatization of public enterprises. This raises two issues. First, is the M&A boom a one-time effect of privatization, or is it likely to be followed by a rise in greenfield investment? Second, do these two types of FDI have different macroeconomic causes and consequences – in relation to aggregate investment and growth? This paper focuses on establishing the stylized facts in terms of time precedence between both types of FDI, investment and growth, using annual data for the period 1987-2001 and a large sample of industrial and developing countries. We find that in all samples higher M&A is typically followed by higher greenfield investment, while the reverse is true only for developing countries. In industrial and developing countries alike, both types of FDI lead domestic investment, but not the reverse. Finally, neither type of FDI appears to precede economic growth in either developing or industrial countries, but FDI does respond positively to increases in the growth rate. JEL classification codes: F43, F37, O16 World Bank Policy Research Working Paper 3192, January 2004 The Policy Research Working Paper Series disseminates the findings of work in progress to encourage the exchange of ideas about development issues. An objective of the series is to get the findings out quickly, even if the presentations are less than fully polished. The papers carry the names of the authors and should be cited accordingly. The findings, interpretations, and conclusions expressed in this paper are entirely those of the authors. They do not necessarily represent the view of the World Bank, its Executive Directors, or the countries they represent. Policy Research Working Papers are available online at http://econ.worldbank.org. * This research was supported by the World Bank’s Latin American Regional Studies program. We thank Linda Kaltani for able research assistance.
1
1. Introduction
The 1990s witnessed a dramatic surge in foreign direct investment (henceforth FDI) to
developing countries. Net FDI flows to LDCs rose from 0.5 percent of their overall GDP in the
late 1980s to over 2.5 percent in 2000-2001. The FDI increase was particularly marked in Latin
America. In the context of a steep decline in other private external flows, FDI became the leading
source of external financing to the developing world after 1994.
The causes of the boom have attracted considerable attention, and several authors have
attempted to disentangle the role played by “push” and “pull” factors in the process – i.e.,
declining real interest rates in industrial economies, and the improved investment environment in
developing countries following liberalization and reform of their economies, including the
decision to privatize state enterprises.1
Along with their rising volume, FDI inflows also showed a major change in composition.
Specifically, foreign investment in LDCs related to the acquisition of existing assets – i.e.,
mergers and acquisitions, henceforth denoted M&A – saw its share in total FDI inflows rise from
virtually nothing in the late 1980s to half of the total in the late 1990s. The rise was again
especially significant in Latin America, where in 2001-02 M&A accounted for over 50 percent of
total FDI inflows. The other component of FDI, foreign investment primarily related to the
acquisition of new assets – commonly referred to as “greenfield” FDI -- rose as well, but its share
in total FDI inflows to LDCs experienced a decline. In a number of developing economies,
especially Latin American ones, the rise in M&A foreign investment was largely driven by
privatization of state-owned enterprises, particularly in the utilities and financial services
industries.
2
However, the FDI boom has also raised two major concerns. The first one involves the
uncertain future prospects of FDI to developing countries, following the near completion of the
privatization drive in major economies (most notably in Latin America). As just noted, a
considerable portion of the FDI inflows received by these economies over the last decade
reflected M&A transactions related to the acquisition of public enterprise assets, and hence the
end of privatization might be followed by a sharp decline in FDI inflows, which, given the
predominant role acquired by investment flows in overall external financing during the late
1990s, could generate major external difficulties in these countries.
Whether this concern is warranted, however, depends to a large extent on the relationship
between M&A and greenfield FDI. Specifically, if the former tends to set the stage for the latter,
then stagnating M&A need not cause undue worries, because the surge in mergers in the 1990s is
likely to be followed by rising greenfield investment, thus ensuring the continuation of external
financing in the coming years.
The second concern relates to the growth impact of FDI flows, which has attracted
renewed interest in the wake of the FDI boom. While the theoretical literature has pointed out that
FDI may boost growth, both by raising aggregate investment and through technological spillovers
– i.e., technology transfers that go beyond those firms directly receiving foreign capital -- the
empirical literature shows considerable disagreement about the relevance of these impacts. On the
one hand, firm-level studies often find no significant productivity effects of FDI.2 On the other
hand, macroeconomic studies tend to conclude that FDI boosts growth via higher productivity
1 See for example Calvo and Reinhart (1996), Fernández-Arias and Montiel (1996), Fernández-Arias (2000), and Albuquerque, Loayza, and Servén (2003). 2 Aitken and Harrison (1999), Kokko, Tansini and Zejan (1996), and Haddad and Harrison (1993) find no evidence of productivity spillovers; Blömstrom and Sjoholm (1999) find no evidence of technology spillovers but do find some evidence of productivity improvements stemming from greater competitive pressure in local markets.
3
and/or physical investment,3 although some papers argue that this requires the destination
economy to satisfy certain conditions,4 and yet others find no significant impact of FDI on
investment or growth.5
There are two major difficulties with the interpretation of many of these results, however.
First, both micro and macro studies face problems of bi-directional causality: high-productivity
and high-growth firms and countries are more likely to attract FDI than the rest, so that the
empirical association between growth and FDI could well reflect reverse causation from the
former to the latter. To the extent that high investment itself also reflects high anticipated returns,
the same argument would apply to its close association with FDI often found in empirical studies
(e.g., Bosworth and Collins 1999). 6
The other difficulty concerns the lack of distinction between greenfield FDI and M&A.
Since the former involves mainly (although not only) new capital assets, while the latter is just a
transfer of existing ones, greenfield FDI would seem more likely to affect growth -- if at all -- via
increased physical investment, while M&A FDI would be more likely to do so via enhanced
productivity growth. In fact, the increased importance of M&A in total FDI flows in recent years
has been singled out as the likely cause of an observed weakening in the empirical FDI-
investment link in the 1990s (World Bank 2001). Thus, failure to distinguish between the two
3 See World Bank (2001) and the references listed therein. 4 For example, Borensztein, de Gregorio, and Lee (1998) find that the investment and growth impact of FDI is significant only when the recipient economy possesses high levels of human capital. A similar argument in relation to the importance of financial development is made by Alfaro et al. (2002). In turn, Blomstrom, Lipsey and Zejan (1996) conclude that FDI has a stronger positive impact on growth in high-income destination economies, while Nair-Reichert and Weinhold (2001) find that this positive effect takes place only in open economies. 5 See for example Carkovic and Levine (2002). 6 Some micro and macro studies do control for simultaneity; see, e.g., Aitken and Harrison (1999) and Carkovic and Levine (2002). Both studies find no significant growth effects of FDI, so that the association between the two variables would mainly reflect causation from growth to FDI. Indeed, as shown by Rangvid (2001) using a sample of industrial and developing countries, growth and investment returns are very closely associated. Thus anticipations of higher growth should attract increased domestic and foreign investment. This line of argument is empirically pursued by Calderón, Loayza and Servén (2001) to explain international capital flows.
4
types of FDI flows in the face of large changes in their relative magnitude – such as those
witnessed over the last decade – could bias the inferences on the relationship of total FDI with
investment and growth.
The purpose of this paper is to address these concerns7 by examining the link between the
two components of FDI flows – greenfield and M&A -- and their respective relationship with
aggregate investment and growth in a large cross-country time-series data set. The main
objective of the analysis is to identify the facts present in the data, rather than exploring the
ability of a particular model to explain the empirical regularities. Specifically, the paper focuses
on establishing the patterns of time precedence between FDI, investment and growth. Thus, it
follows an approach similar to those adopted by recent influential studies that have attempted to
determine the patterns of causation between saving, investment and growth (Carroll and Weil
1995; Blomstrom, Lipsey, and Zejan 1996; Attanasio, Picci and Scorcu 2000).
The paper extends the existing literature along two dimensions. First, it provides what to
the best of our knowledge is the first exploration of the dynamic relation between greenfield and
M&A foreign investment.8 Second, it uncovers systematic differences between these two
components of FDI flows regarding their respective relationship with investment and growth in
the destination economies.9 The paper performs extensive robustness checks by employing a
variety of econometric specifications and working with various country samples in order to allow
7 Although we will not pursue it here, we should also mention a third concern recently raised by Fernández-Arias and Hausmann (2000), according to which the boom in FDI to developing countries would reflect the sorry state of their markets and institutions which forces domestic investors to sell off their local assets, rather than providing proof of sound economic management, as had been argued in the past. 8 There are strands of the FDI literature that focus on other aspects of the separation between greenfield and M&A FDI. Some of them investigate the determinants of the mode of entry by foreign firms --that is, greenfield vs. M&As-- (e.g. Blömstrom, Kokko, and Zejan 2000 and Görg 2000), while others analyze the welfare implications of various modes of entry on the host economy from a theoretical perspective (e.g. Mattoo, Olarreaga, and Saggi 2001 and Ferrett 2003).
5
for possible heterogeneity across country groups – industrial economies, where FDI is
characterized by large inflows and outflows and a large share of M&A in total investment flows;
developing countries, where the M&A share of total FDI is much lower, and outflows are
dwarfed by inflows; and Latin America, where the FDI boom of the 1990s has been most closely
associated with privatization of public enterprises.
The paper is organized as follows. Section 2 introduces the main concepts and data
regarding the composition of FDI, and offers a brief overview of recent trends in the volume and
structure of FDI across a large number of industrial and developing countries. Section 3 reports
the results of causality tests between the M&A and greenfield components of FDI, and between
each of them, domestic investment and GDP growth. Section 4 concludes.
2. FDI: Concepts, data and trends
Direct investment undertaken by foreign firms in a host country (i.e., the country of the
target firm whose assets are being acquired) can take the form of either greenfield investment or
mergers and acquisitions (M&As), depending on whether the transaction involves mainly newly-
created assets coming under control of the foreign firms, or just a transfer of existing assets from
local firms, respectively.
The fact that FDI represents just a financing flow, and not necessarily investment, is often
overlooked. The same applies to greenfield investment, which does not necessarily reflect the
acquisition of new fixed assets. Like FDI, greenfield investment includes all financial transfers
from a multinational’s headquarters to its subsidiary (and back, in the case of outflows). These
could take the form of equity or loan financing. While most financial transfers presumably
9 The received literature that investigates the relationship between FDI, domestic investment, and growth has focused on total FDI. Studies of this type include Choe (2003), Basu, Chakraborty, and Reagle (2003), de Mello (1999), Ericsson and Irandoust (2001), Agosin and Mayer (2000), and Razin (2002).
6
reflect the purchase (or liquidation) of assets, at the macroeconomic level there is no simple way
to ascertain the extent to which they actually finance capital, rather than current, expenditures.
In the case of M&A, one can draw a further distinction between cross-border mergers,
which occur when the assets and operation of firms from different countries are combined to
establish a new legal identity, and cross-border acquisitions, which occur when the control of
assets and operations is transferred from a local to a foreign company (with the former becoming
an affiliate of the latter).
In practice, world M&As have been predominantly driven by acquisitions. Cross-border
mergers represented only 3 percent of cross-border M&As in 1999.10 Also, over 50 percent of
cross-border M&As in 1999 took the form of full (or outright) acquisitions. Minority acquisitions
by foreign firms (that is, purchases of 10-49 percent participation in total capital) represented
one-third of acquisitions in developing countries and less than 20 percent in developed countries
(see UNCTAD 2000).
Data on FDI inflows and outflows, as well as worldwide cross-border M&As, are
collected by UNCTAD’s World Investment Report (various years). We construct greenfield FDI
by subtracting cross-border M&As from FDI inflows. Our sample is dictated by the availability
of data on cross-border M&A transactions, which is quite limited prior to 1987. Thus, the
analysis focuses on the period 1987-2001. It includes 72 countries, with a combined total of 848
country-year observations.
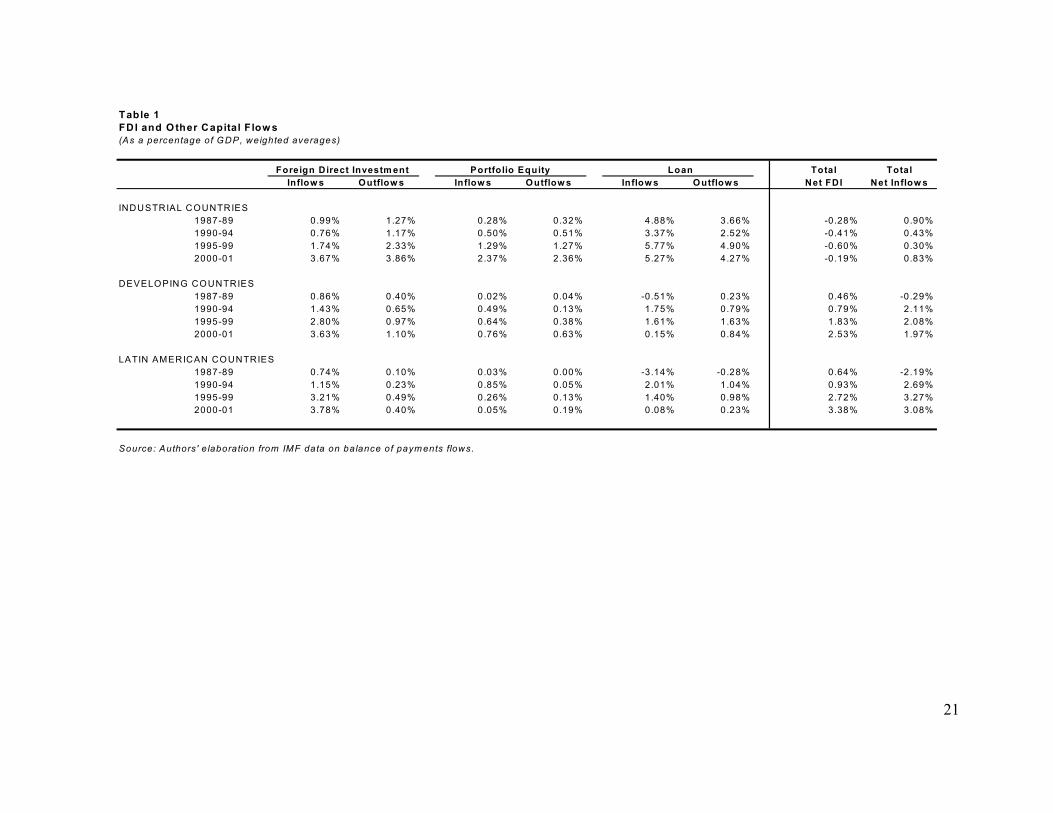
Tables 1 and 2 provide an overview of the major trends in the volume and composition of
FDI. Table 1 documents the changing patterns of external financing to industrial and developing
10 In reality, even when mergers are supposedly between relatively equal partners, most are in fact acquisitions with one company controlling the other.
7
countries since the mid-1980s.11 Between 1987-89 and 2000-01, net financing to developing
countries rose from a negative 0.3% to 2% of the recipient economies’ GDP. This increase
reflected a parallel rise in net FDI flows by a similar magnitude. Over the same period, net FDI
flows went up from 0.5% to 2.5% of GDP. Net portfolio equity flows also rose, although by a
very modest amount, from virtually zero in the late 1980s to some 0.1 percent of GDP in 2000-
2001. In turn, net debt flows to developing countries rose in the early 1990s but then collapsed
following the East Asia and Russia crises, becoming sharply negative by 2000-01. As a result of
these trends, in the latter years net FDI exceeded total net financing flows to LDCs (see World
Bank 2001).
Table 1 also shows the figures for Latin American countries, which were the primary
destination of the FDI boom of the 1990s. For these countries, total net flows rose from -2.2% to
3.1% of GDP between the late 1980s and the early 2000s. Over half of this increase took the form
of higher net FDI. In fact, increasing FDI between the first half of the 1990s and the early 2000s
more than made up for the collapse in all other flows over the same period.
Unlike with developing countries, net FDI flows to industrial economies showed little
change over the period under consideration. Closer inspection reveals that both inflows and
outflows rose markedly, leaving the net difference virtually unchanged.
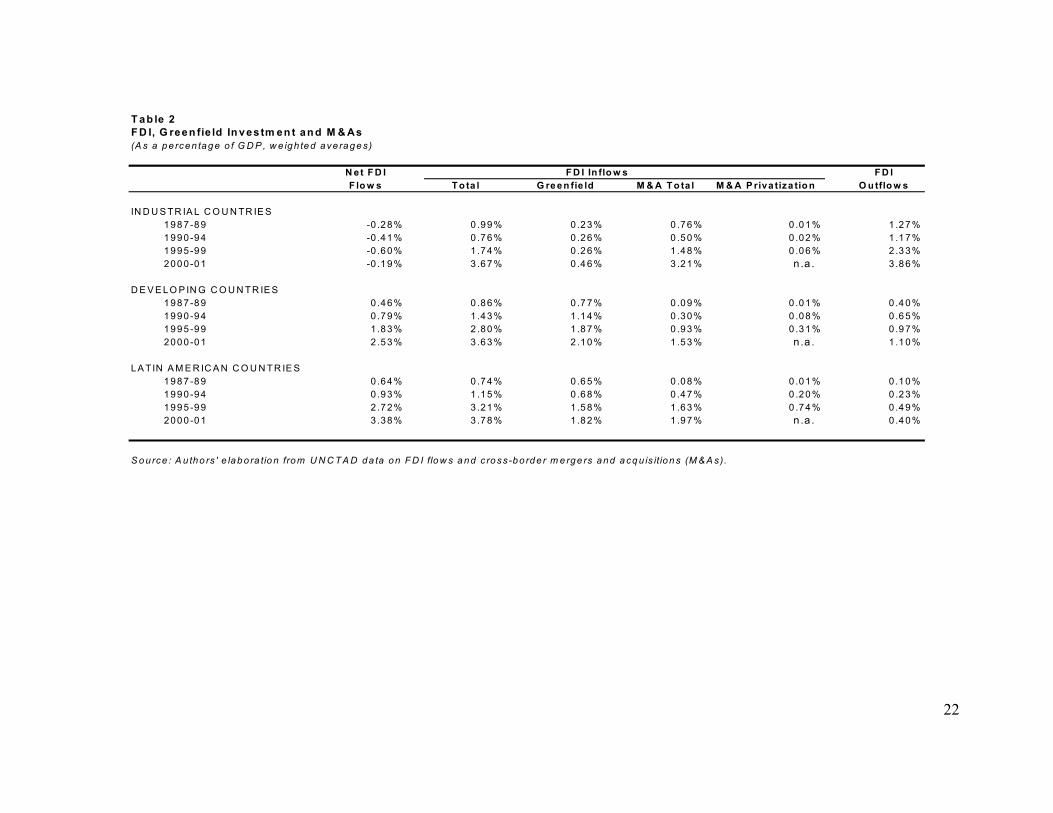
Table 2 offers a detailed breakdown of FDI flows over the same time period. In industrial
economies, almost all of the increase in inflows took the form of higher cross-border M&A, of
which a very small portion was due to privatization of public enterprises. As a result, in industrial
countries M&A transactions were about 7 times larger than greenfield FDI in 2000-01.
11 Table 1 reveals that in our sample net flows to both industrial and developing countries do not add up to zero. This is primarily due to the fact that our sample of countries is incomplete (especially concerning a few developing economies that are international financial centers where large FDI outflows originate).
8
As for developing countries, three stylized facts emerge. First, compared with the sharp
rise in inflows, FDI outflows remain relatively modest. Although they have risen over the last
decade, in 2000-01 outflows amounted to less than a third of inflows in developing countries as a
whole, and even less (about 10 percent) in Latin America. Thus, for developing countries FDI
inflows and net flows have moved in close tandem, in contrast with industrial economies, where
large increases in inflows have translated into little change in net flows.
Second, a considerable portion of the rise in FDI inflows to developing countries over the
last decade took the form of increased cross-border M&A. By the early 2000s, these had grown to
account for nearly half (and even more in the case of Latin America) of FDI inflows, up from
about 10 percent in the late 1980s. Unlike in industrial countries, however, in developing
economies greenfield FDI still accounts for a large portion of FDI inflows.
Third, much of this M&A increase was due to privatization of public assets. The latter
accounted for roughly one-third of the increase in M&A inflows to developing countries in
general, and half for Latin America in particular, over the period during which comprehensive
privatization data are available.
3. Econometric analysis
Objective. Our empirical objective is to analyze the dynamic relationship between
greenfield FDI, cross-border M&A, domestic investment, and GDP growth. Specifically, we
want to examine how the behavior of a given variable is related to the future behavior of the rest.
There are two aspects to this analysis: effect and predictability. The first deals with whether
changes in a variable have a lasting impact on another. The second examines whether the
behavior of a given variable helps predict the behavior of the rest.
9
Methodology. Our methodology consists of estimating and testing bivariate vector
autoregressions (VAR) in a panel setting (that is, combining cross-country and time-series
observations). The VAR equations have the following form,
tiittititi xLByLAy ,,,, )()( εµη ++++=
tiittititi xLDyLCx ,,,, )()( υψφ ++++=
where y and x represent the two variables of interest; L is the lag operator; A, B, C, and D are
vectors of coefficients; ηt and φt are unobserved time effects; µi and ψi are unobserved country
effects, and εi,t and νi,t are regression residuals. The subscripts i and t denote country and time,
respectively. As is standard in non-structural VAR analysis, we do not impose any cross-
equation parameter restrictions, we allow for a free cross-equation error covariance, and we
interpret each equation as a reduced-form regression.
We choose the optimal lag structure for the panel VARs through likelihood ratio tests.
This turns out to be 4 or 5 lags, depending on the specific bivariate system. To assess the
robustness of our results, we present the estimation without country- and time-specific effects,
with only country effects, and with both country and time effects.
As stated above, we have two empirical objectives. First, we are interested in the impact
of changes in a variable, say x, on the other, say y. The direct impact of x on y, given the past
history of y, is given by the sum of the coefficients on all lagged x. Using the properties of the
lag operator, this impact would be equal to B(1). From estimation of the VAR, we can obtain the
point estimate of B(1) and, for the purpose of statistical inference, its associated standard
deviation. From the estimated coefficients we can also obtain the long-run effect of x on y. The
long-run effect takes into account both the direct impact of x on y (given the past history of y) and
10
the autoregressive properties of y (to account for own and cross feedback effects). Provided that
y follows a stable process, the long-run effect of x on y is given by B(1)/[1-A(1)].
Second, we want to examine whether a variable, say x, helps forecast the other variable in
the system, say y, beyond what the past history of y predicts. This is a test of Granger-causality,
and, in the example above, it amounts to testing if the coefficients of the lag polynomial B are
statistically significantly different from zero.
The two issues of interest --namely, impact and Granger-causality-- are related but not
identical. There may be cases when a variable has predictive power for another, yet its impact is
zero because coefficients on different lags cancel each other. However, in the relationships we
consider, it is usually the case that when the impact is statistically zero, there is also no indication
of Granger causality.
Sample. Our full sample consists of annual information for 72 countries during the period
1987-2001. The sample is divided into 22 industrial and 50 developing countries. See Appendix
Table A for the complete list of countries included in the sample. We do not attempt to pool all
72 countries for estimation of a single set of coefficients because, as we discuss below, industrial
and developing countries exhibit different relationships among the variables of interest. Given
the increasing importance of Latin America as a recipient of FDI flows, we consider separate
estimation for the countries in this region.
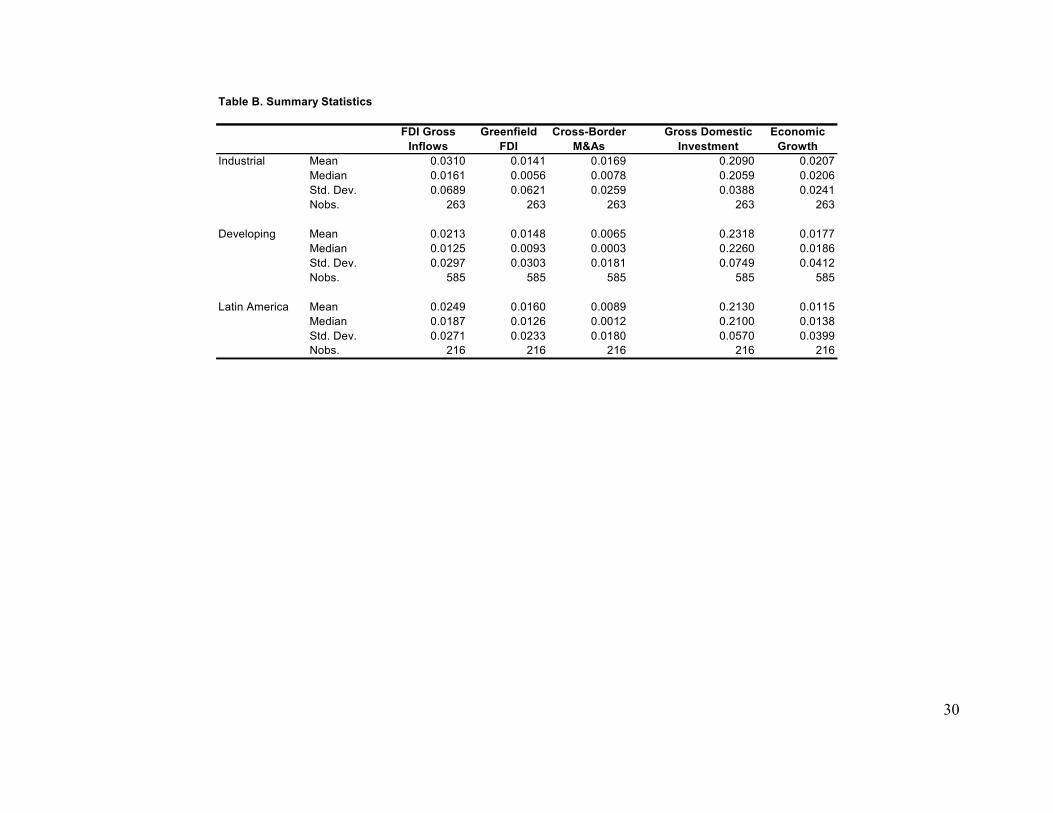
Definitions. In the empirical analysis, we use the following definitions for the variables of
interest. Economic growth is the log difference of real GDP in consecutive years. Domestic
investment is equal to gross fixed capital formation, expressed as a ratio to current GDP. Cross-
border mergers & acquisitions and greenfield FDI are expressed as ratios to GDP. Given that our
objective is to capture the effect of foreign participation in the domestic economy, we consider
11
inflows, rather than net flows, for both types of FDI. 12 See Appendix Table B for summary
statistics on all variables of interest.
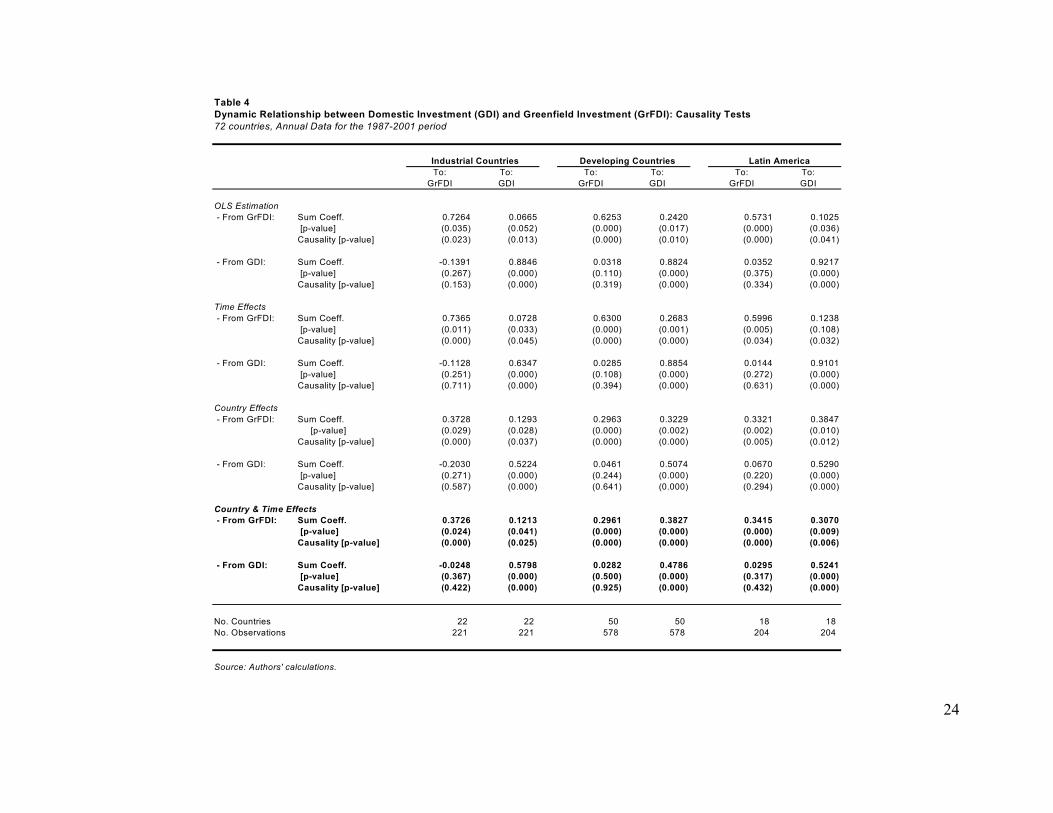
Results. The estimation and inference results are summarized in Tables 3-7. For each
vector auto-regression, we report the sum of the coefficients on the lagged terms of each variable,
the p-value for the hypothesis that this direct effect is not statistically significant, and the p-value
for the corresponding test that there is no Granger causality.
Table 3 examines the relationship between the two types of FDI, that is, greenfield
investment and M&A. Tables 4 and 5 examine the link between domestic investment and,
respectively, greenfield FDI and M&A FDI. Tables 6 and 7 study the relationship between GDP
growth and the two types of FDI, respectively. Finally, Table 8 summarizes the results.
Before discussing the bivariate VAR results table by table, we would like to examine the
inertial properties of our variables of interest –that is, their dependence on their own past
realizations, given the past of the other variable in the system. Comparing results across tables,
the following points arise. First, the autoregression coefficients drop considerably in all cases
once we account for country-specific effects. When the correct specification of the dynamic
system includes country-specific effects, ignoring them in estimation leads to an upward bias in
the autoregression coefficients, in accordance with theoretical predictions (Robertson and
Symons 1992). This result reflects the correlation between the unobserved country effects with
all (current and lagged) values of the variable of interest. Second, for all variables in all systems,
the sum of autoregression coefficients is statistically greater than zero and lower than one. That
is, all variables feature smooth positive persistence, not cyclical or explosive. Third, GDP growth
12As mentioned before, for developing countries the distinction between inflows and net flows is largely inconsequential. The same does not apply to industrial countries, however.
12
is the least persistent of all variables considered here. The persistence (or inertia) of GDP growth
is lower in the samples of developing countries and Latin America (autoregression coefficients of
around 0.15) than in industrial countries (about 0.3).13 Fourth, in all samples the most persistent
variable is gross domestic investment (0.5 - 0.6), followed by greenfield and M&A FDI.
Greenfield FDI appears to be as persistent in industrial as in developing countries (0.30 – 0.55,
depending on the bivariate system). However, M&A FDI is somewhat more persistent in
industrial countries (0.5) than in developing economies (0.25). Note than greenfield and M&A
FDI in developing countries are not memory-less processes, as is usually implied in claims that
the booming cross-border investment to emerging countries is only the result of a one-shot
privatization process. Apart from the nuances just noted, greenfield and M&A FDI have similar
autocorrelation characteristics. As explained below, this is the first of many similarities between
the two types of FDI regarding their dynamic properties.
Table 3 indicates that in the samples of industrial, developing, and Latin American
countries, higher M&A leads to more greenfield FDI. For developing countries, in addition, an
increase in greenfield FDI leads to a rise in M&A FDI.14 These results are robust to the inclusion
of country- and time-specific effects. In order to assess the economic importance of our results,
we can examine the size of long-run effects, as explained above. Using the point estimates of the
regression that controls for country- and time-specific effects, the long-run effect of a unit change
in M&A FDI on greenfield FDI is 0.97 for industrial countries, 1.56 for developing countries, and
0.77 for Latin America. Thus, this effect is similar in industrial and Latin American countries,
but significantly larger in the full sample of developing countries. In addition, in the latter group
13 In a different context, growth’s low persistence was also noted by Easterly, Kremer, Pritchett, and Summers (1993). 14 As implied from the discussion below, this is the only instance of bi-directional VAR effects in the paper.
13
there is feedback from greenfield FDI to M&A FDI, with a long-run multiplier of 0.20.15 The
implication of these results, both qualitative and quantitatively, is a strong connection between
both types of FDI. In particular, we can conclude that FDI initially driven by the purchase of
existing companies results in fresh investment in the following years. In industrial countries this
subsequent rise is similar in magnitude to the initial investment. In developing countries, the
result is even more optimistic because the gain in greenfield FDI largely surpasses the original
capital purchase. This implies that the end of the privatization process in Latin America and
other parts of the world need not dry up FDI but may instead give way to rising greenfield
investment.
In Table 4, we study the relationship between domestic investment and greenfield FDI.
The main qualitative result is the same for industrial, developing, and Latin American countries.
That is, in all samples, greenfield FDI appears to precede domestic investment, but not the
reverse. The inclusion of time- or country-specific effects does not change the substance of this
result. Quantitatively, the long-run effect of greenfield FDI on domestic investment is more than
twice larger in developing and Latin American countries (with multipliers of 0.73 and 0.65,
respectively) than in industrial countries (0.29).16
Table 5 presents the results of the link between domestic investment and M&A FDI. The
basic result is common to all samples and similar to the case of greenfield FDI. That is, M&A
FDI leads to a rise in domestic investment, but the reverse effect is not statistically significant
(although there is some evidence of predictability from domestic investment to M&A in industrial
countries). Quantitatively, however, there are some differences of degree between the two types
15 In what follows in the text, we label “long-run multiplier” the magnitude of the long-run effect of a unit change in a given variable on another.
14
of FDI. First, in general the multipliers of domestic investment with respect to M&A FDI are
larger than with respect to greenfield FDI. Second, the multipliers of domestic investment to
M&A FDI are higher in industrial (1.05) than in developing and Latin American countries (0.85
and 0.80, respectively); this is just the opposite to what happened with greenfield FDI.
The positive effect of either type of FDI on domestic investment is encouraging. On the
other hand, it may appear surprising that domestic investment does not lead to a rise in either type
of FDI. On second inspection, however, we can find arguments in opposite directions that, in
practice, would cancel each other. For instance, an increase in domestic investment may lead to
more FDI if it serves as an indication that there are profitable opportunities to be exploited in the
country. On the other hand, if domestic investment decreases -- for instance, because of rising
liquidity or solvency problems in local firms -- FDI inflows may increase in the following years
to take advantage of idle opportunities and, thus, partially fill the gap left by resident investors.
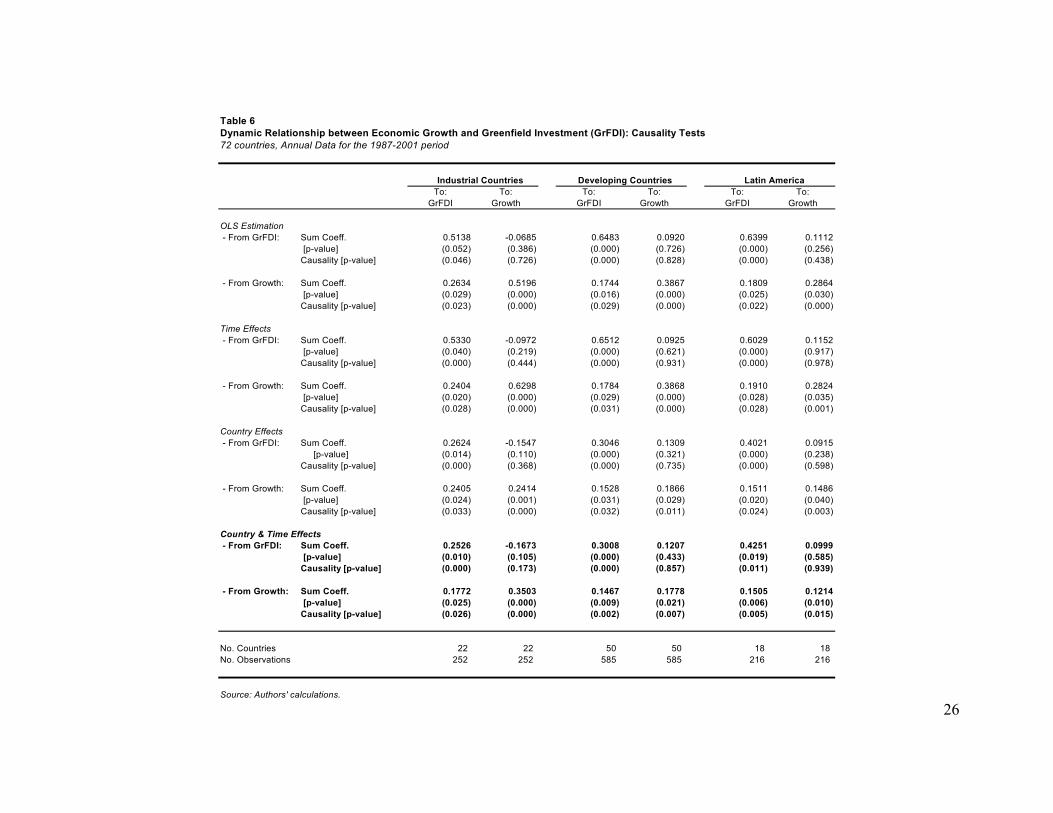
In Table 6 we examine the relationship between economic growth and greenfield FDI.
The main result is qualitatively the same in all samples. Economic growth appears to precede and
produce a positive impact on greenfield FDI. However, there appears to be no statistically
significant reverse effect from greenfield FDI to economic growth. The impact of growth on
greenfield investment is larger for industrial than developing or Latin American countries, with
long-run multipliers of 0.40, 0.21, and 0.26, respectively.
Finally, Table 7 presents the results on the links between economic growth and M&A
FDI. Again, the basic result is the same for all samples. An increase in economic growth leads to
a rise in M&A, but the reverse is not statistically significant. As in the case of greenfield FDI, the
16 In these and other calculations of long-run effects, we use the point estimates obtained in the regressions that control for country and time specific effects.
15
response of M&A FDI to changes in economic growth is larger in industrial countries (multiplier
of 0.65) than in developing (0.27) or Latin American countries (0.21).
The asymmetric relationship between FDI and economic growth deserves further
discussion. The fact that either type of FDI does not lead to larger growth may indicate that FDI
simply cannot account for the majority or the most important of the many determinants of
economic growth.17 Furthermore, it is likely that the relationship between FDI and growth
depends largely on third factors driving both variables. For instance, in countries where FDI rises
as result of higher import tariffs, we should expect a negative relationship between FDI and
economic growth. The opposite would occur when FDI rises because of an improvement in
public infrastructure and government institutions.18 On the other hand, GDP growth can capture
FDI’s most relevant determinants. Given that economic growth is arguably the most important
sign of profitable investment opportunities in a country, it can serve as a strong pull factor for
FDI.19
4. Concluding remarks
In the last 15 years, FDI has become the predominant form of external financing in
developing countries, far surpassing traditional sovereign borrowing. To be sure, the growth of
FDI is part of a more general trend in developing countries consisting of a rapid expansion of
private capital flows and contraction of official ones. In industrial countries, FDI has grown more
than any other type of capital flow, although it still ranks second to foreign borrowing.
Not only has total FDI grown in importance, but also its composition has experienced a
remarkable change over the last 15 years. In developing countries, the share of cross-border
mergers and acquisitions in FDI was about 10% in the mid 1980s and increased to more than a
17 See Carkovic and Levine (2002) for similar results.
16
third at the beginning of the 2000s. The lion’s share of the increase in cross-border M&A is
explained by the privatization of state enterprises that took place during the 1990s in many
developing countries. The share of cross-border M&A in FDI also increased markedly in
industrial countries.
In that context, this paper set out to answer two questions. The first one is about the
continuation of the FDI boom to developing countries; specifically, would it continue after the
privatization process and the ensuing expansion of cross-border M&A had dried up? Our
approach to this question consisted in evaluating to what extent greenfield FDI (that is,
investment in new assets) would follow an increase in cross-border M&A (the purchase of
existing assets). For this purpose, we estimated bivariate vector autoregressions in a pooled
cross-country, time-series setting. We worked with annual data for the period 1987-2001 for
samples of 22 industrial and 50 developing countries. Table 8 provides a summary of results.
We found that an expansion of M&A is indeed followed by an increase in greenfield FDI.
According to our estimates, an increase in M&A by 1 percent of GDP leads to a rise in greenfield
FDI by about 1 and 1.5 percentage points of GDP in industrial and developing countries,
respectively. That is, the subsequent expansion of greenfield FDI is at least as large as the initial
increase in M&A, and substantially more in developing economies. Therefore, if the experience
of the 1990s and late 1980s is a good predictor for the future, an expansion of greenfield FDI will
ensure that the FDI boom will continue in the future even after the privatization process has
stopped.
The second question we wanted to address concerns the causality (in the sense of time
precedence) between the two forms of FDI and domestic investment and economic growth.
18 See Stein and Daude (2001) and Alfaro et al. (2002) for related discussions.
17
Using the afore-mentioned bivariate VAR methodology on the same panel of countries and time-
series observations, we find that both greenfield and M&A FDI lead domestic investment but are
led by GDP growth. Therefore, economic growth, as the most important indicator of domestic
rates of return, serves as an effective “pull” factor for foreign investment; and in turn, FDI helps
increase domestic investment in the future.
In order to close the virtuous circle between FDI, domestic investment, and growth, it
would be necessary for investment to lead to economic growth. This important link is not the
subject of this paper; however, using a methodology similar to this paper’s VAR systems, we
have examined the dynamic relationship between domestic investment and economic growth in
our sample.20 We confirm the results obtained by Blomstrom, Lipsey, and Zejan (1996) and
Attanasio, Scorcu, and Picci (2000) in the sense that while growth causes investment, investment
does not lead to growth. Whether this is a reflection of poor-quality investment (see Pritchett
2000) or the fact that economic growth depends on a multitude of factors that cannot be fully
captured by developments in FDI or domestic investment (see Barro and Sala-i-Martin 1995, p.
433) is a subject for further research.
19 See Calderón, Loayza, and Servén (2001) and Albuquerque, Loayza and Servén (2003). 20 These results are not presented in the paper but are available on request.
18
References Agosin, Manuel and Ricardo Mayer. 2000. “Foreign Investment in Developing Countries: Does It
Crowd in Domestic Investment?” UNCTAD Discussion Paper # 146. Aitken, Brian J. and Harrison, Ann E. June 1999. “Do Domestic Firms Benefit from Direct
Foreign Investment?” American Economic Review 89(3). Albuquerque, Rui, Norman Loayza, and Luis Servén. 2003. “World Market Integration through
the Lens of Foreign Direct Investment.” Mimeo. The World Bank. Alfaro, Laura, Areendam Chanda, Sebnem Kalemli-Ozcan, and Selin Sayek. April 2002. “FDI
and Economic Growth: The Role of Local Financial Markets”. Manuscript, Harvard Business School.
Attanasio, Orazio, Lucio Picci, and Antonello Scorcu. May 2000. “Saving, Growth and
Investment: A Macroeconomic Analysis Using a Panel of Countries”. Review of Economics and Statistics 82(2).
Barro, Robert and Xavier Sala-I-Martin. 1995. Economic Growth. New York: McGraw-Hill. Basu, Parantap, Chandana Chakraborty, and Derrick Reagle. July 2003. “Liberalization, FDI, and
Growth in Developing Countries: A Panel Cointegration Approach.” Economic Inquiry 41(3): 510-516.
Blomström, Magnus, Ari Kokko, and Mario Zejan. 2000. “MNC Entry Strategies: New Ventures
or Acquisitions?” in Foreign Direct Investment: Firm and Host Country Strategies, edited by Magnus Blömstrom, Ari Kokko, and Mario Zejan. New York: St. Martin’s Press, Inc..
Blomström, Magnus, Robert E. Lipsey, and Mario Zejan. February 1996. “Is Fixed Investment
the Key to Economic Growth?” Quarterly Journal of Economics 111(1): 269-276. Blomström, Magnus and Fredrik Sjoholm. April 1999. “Technology Transfer and Spillovers:
Does Local Participation with Multinationals Matter?” European Economic Review 43(4-6): 915-923.
Borenztein, Eduardo, José De Gregorio, and Jong-Wha Lee. 1998. “How does Foreign Direct
Investment Affect Growth?” Journal of International Economics 45(1). Bosworth, Barry P. and Susan M. Collins. 1999. “Capital Flows to Developing Economies:
Implications for Saving and Investment.” Brookings Papers on Economic Activity (1), Brookings Institution, Washington, D.C.
Calderón, César, Norman Loayza, and Luis Servén. September 2001. “Do Capital Flows Respond
to Risk and Return?” Manuscript, World Bank.
19
Calvo, Sara and Carmen Reinhart. 1996. “Capital Flows to Latin America: Is There Evidence of Contagion Effects?” In Private Capital Flows Markets After the Mexican Crisis, edited by Guillermo Calvo, Morris Goldstein, and Eduard Hochreiter. Institute for International Economics – Washington- and Austrian National Bank – Vienna-.
Carkovic, Maria and Ross Levine. 2002. “Does Foreign Direct Investment Accelerate Economic
Growth?” Mimeo. University of Minnesota. Carroll, Christopher D. and David N. Weil. 1995. “Saving and Growth: A Reinterpretation”.
Carnegie-Rochester Conference Series on Public Policy 40. Choe, Jong Il. 2003. “Do Foreign Direct Investment and Gross Domestic Investment Promote
Economic Growth?” Review of Development Economics 7(1): 44-57. de Mello, Luiz. 1999. “Foreign Direct Investment-led Growth: Evidence from Time Series and
Panel Data.” Oxford Economic Papers 51: 133-151. Easterly, William, Michael Kremer, Lant Pritchett, and Lawrence Summers. 1993. “Good Policy
or Good Luck? Country Growth Performance and Temporary Shocks.” Journal of Monetary Economics 32(3): 459-83.
Ericsson, Johan, and Manuchehr Irandoust. 2001 “On the Causality between FDI and Output: a
Comparative Study.” International Trade Journal 15(1): 1-26. Fernández-Arias, Eduardo and Ricardo Hausmann. March 2000. “FDI: Good Cholesterol?” Paper
prepared for the seminar “The New Wave of Capital Inflows: Sea Change or Just Another Tide?” Annual Meeting of the Board of Governors, Inter-American Development Bank and Inter-American Investment Corporation.
Fernández-Arias, Eduardo and Peter J. Montiel. 1996. “The Surge in Capital Inflows to
Developing Countries: An Analytical Overview.” World Bank Economic Review. 10. Fernández-Arias, Eduardo. March 2000. “The New Wave of Capital Inflows: Sea Change or
Tide?” Inter-American Development Bank, Working Paper # 415. Ferrett, Ben. 2003. “Greenfield Investment versus Acquisition: Positive Analysis.” Mimeo.
Leverhulme Centre for Research on Globalisation and Economic Policy (GEP), School of Economics, University of Nottingham.
Haddad, Mona and Ann Harrison. October 1993. “Are There Positive Spillovers from Direct
Foreign Investment? Evidence from Panel Data for Morocco.” Journal of Development Economics 42(1): 51-74.
Görg, Holger. 2000. “Analyzing Foreign Market Entry: The Choice between Greenfield
Investment and Acquisitions.” Journal of Economic Studies 27(3): 165-181.
20
Kokko, Ari, Ruben Tansini, and Mario Zejan. April 1996. “Local Technological Capability Spillovers from FDI in the Uruguayan Manufacturing Sector”. Journal of Development Studies 32(4).
Mattoo, Aaditya, Marcelo Olarreaga, and Kamal Saggi. June 2001. “Mode of Foreign Entry,
Technology Transfer, and FDI Policy.” CEPR Discussion Paper # 2870. Nair-Reichert, Usha and Diana Weinhold. May 2001. “Causality Tests for Cross-country Panels:
a New Look at FDI and Economic Growth in Developing Countries.” Oxford Bulletin of Economics and Statistics 63(2): 153-171.
Pritchett, Lant. December 2000. “The Tyranny of Concepts: CUDIE (Cumulated, Depreciated,
Investment Effort) Is not Capital.” Journal of Economic Growth 5(4): 361-84. Rangvid, Jesper. March 2001. “Predicting Returns and Changes in Real Activity In Emerging and
Developed Economies”. Manuscript, Copenhagen Business School. Razin, Assaf. September 2002. “FDI Contribution to Capital Flows and Investment in Capacity.”
NBER Working Paper # 9204. Robertson, D. and J. Symons. 1992. “Some strange properties of panel data estimators”, Journal
of Applied Econometrics 7(2). Stein, Ernesto and Christian Duade. 2001. “Institutions, Integration, and the Location of Foreign
Direct Investment”. Annual Meeting of the Board of Governors, Inter-American Development Bank and Inter-American Investment Corporation, Santiago de Chile.
United Nations Conference on Trade and Development (UNCTAD). 1999. “World Investment
Report: Foreign Direct Investment and the Challenge of Development”. United Nations Conference on Trade and Development (UNCTAD). 2000. “World Investment
Report: Cross-border Mergers and Acquisitions”. United Nations Conference on Trade and Development (UNCTAD). 2002. “World Investment
Report”. World Bank. 2001. “Global Development Finance 2001”. Washington, D. C.
21
Table 1FDI and O ther Capital Flow s(As a percentage of GDP, weighted averages)
Foreign Direct Investm ent Portfolio Equity Loan Total TotalInflow s Outflow s Inflow s Outflow s Inflow s Outflow s Net FDI Net Inflow s
Source: Authors' e laboration from IMF data on balance of payments flows.
22
T ab le 2F D I, G reen fie ld In v es tm en t an d M & As(A s a p e rcen tag e o f G D P , w e igh ted ave ra ge s)
N et F D I F D I In flo w s F D IF lo w s T o ta l G re en fie ld M & A T o ta l M & A P riva tiza tio n O u tflo w s
IN D U S TR IA L C O U N TR IE S198 7-8 9 -0 .2 8% 0 .99 % 0.2 3% 0 .76 % 0 .01 % 1.2 7%199 0-9 4 -0 .4 1% 0 .76 % 0.2 6% 0 .50 % 0 .02 % 1.1 7%199 5-9 9 -0 .6 0% 1 .74 % 0.2 6% 1 .48 % 0 .06 % 2.3 3%200 0-0 1 -0 .1 9% 3 .67 % 0.4 6% 3 .21 % n.a . 3 .8 6%
D E V E LO P IN G C O U N TR IE S198 7-8 9 0 .46% 0 .86 % 0.7 7% 0 .09 % 0 .01 % 0.4 0%199 0-9 4 0 .79% 1 .43 % 1.1 4% 0 .30 % 0 .08 % 0.6 5%199 5-9 9 1 .83% 2 .80 % 1.8 7% 0 .93 % 0 .31 % 0.9 7%200 0-0 1 2 .53% 3 .63 % 2.1 0% 1 .53 % n.a . 1 .1 0%
L A TIN A M E R IC A N C O U N TR IE S198 7-8 9 0 .64% 0 .74 % 0.6 5% 0 .08 % 0 .01 % 0.1 0%199 0-9 4 0 .93% 1 .15 % 0.6 8% 0 .47 % 0 .20 % 0.2 3%199 5-9 9 2 .72% 3 .21 % 1.5 8% 1 .63 % 0 .74 % 0.4 9%200 0-0 1 3 .38% 3 .78 % 1.8 2% 1 .97 % n.a . 0 .4 0%
S o urce : A u tho rs ' e lab o ra tio n from U N C T A D da ta on F D I flo w s a nd c ross-b o rd e r m e rge rs and a cq u is ition s (M & A s).
23
T ab le 3D ynam ic R elationship betw een G reenfie ld FD I In flow s (G rFD I) and C ross-B order M ergers and Acquisitions (M & As): C ausality T ests72 countries, Annual D ata for the 1987-2001 period
Industria l C ountries D eveloping C ountries Latin Am ericaTo: To: To: To: To: To:
G rFD I M &As G rFDI M &As G rFDI M &As
O LS Estim ation - F rom G rFD I: Sum C oeff. 0 .5379 0.0745 0.7430 0.1230 0.6631 0.0824
- F rom M & As: Sum C oeff. 0 .5611 0.4870 0.6894 0.2509 0.4795 0.2537 [p -value] (0 .005) (0 .007) (0 .003) (0 .006) (0 .000) (0 .018) C ausality [p -value] (0 .000) (0 .049) (0 .000) (0 .010) (0 .000) (0 .008)
N o. C ountries 22 22 50 50 18 18 N o. O bservations 263 263 585 585 216 216
Source: Authors ' ca lcu la tions.
24
Table 4Dynamic Relationship between Domestic Investment (GDI) and Greenfield Investment (GrFDI): Causality Tests72 countries, Annual Data for the 1987-2001 period
Industrial Countries Developing Countries Latin AmericaTo: To: To: To: To: To:
GrFDI GDI GrFDI GDI GrFDI GDI
OLS Estimation - From GrFDI: Sum Coeff. 0.7264 0.0665 0.6253 0.2420 0.5731 0.1025
Table 5Dynamic Relationship between Domestic Investment (GDI) and Cross-Border Mergers and Acquisitions (M&As): Causality Tests72 countries, Annual Data for the 1987-2001 period
Industrial Countries Developing Countries Latin AmericaTo: To: To: To: To: To:
M&As GDI M&As GDI M&As GDI
OLS Estimation - From M&As: Sum Coeff. 0.8208 0.1092 0.2996 0.2381 0.4752 0.1490
Table 6Dynamic Relationship between Economic Growth and Greenfield Investment (GrFDI): Causality Tests72 countries, Annual Data for the 1987-2001 period
Industrial Countries Developing Countries Latin AmericaTo: To: To: To: To: To:
GrFDI Growth GrFDI Growth GrFDI Growth
OLS Estimation - From GrFDI: Sum Coeff. 0.5138 -0.0685 0.6483 0.0920 0.6399 0.1112
Table 7Dynamic Relationship between Economic Growth and Cross-Border Mergers and Acquisitions (M&As): Causality Tests72 countries, Annual Data for the 1987-2001 period
Industrial Countries Developing Countries Latin AmericaTo: To: To: To: To: To:
M&As Growth M&As Growth M&As Growth
OLS Estimation - From M&As: Sum Coeff. 0.8952 0.0144 0.3025 -0.1621 0.4686 -0.1114
Industrial Countries Developing Countries Latin America
From Greenfield FDI to M&As . + .
From M&As to Greenfield FDI + + +
From Greenfield FDI to Domestic Investment + + +
From Domestic Investment to Greenfield FDI . . .
From M&As to Domestic Investment + + +
From Domestic Investment to M&As . . .
From Greenfield FDI to Economic Growth . . .
From Economic Growth to Greenfield FDI + + +
From M&As to Economic Growth . . .
From Economic Growth to M&As + + +
Note: "." represents no significant effect and "+", a statistically positive effect.
29
APPENDIXTable A. Sample of Countries
No. Country Name Region No. Country Name Region1 Argentina AMER 37 Jamaica AMER2 Australia IND 38 Jordan MENA3 Austria IND 39 Japan IND4 Belgium IND 40 Kenya SSA5 Bolivia AMER 41 Korea, Rep. Of EAP6 Brazil AMER 42 Sri Lanka SA7 Botswana SSA 43 Morocco MENA8 Canada IND 44 Madagascar SSA9 Switzerland IND 45 Mexico AMER10 Chile AMER 46 Mali SSA11 China EAP 47 Mauritius SSA12 Cote d'Ivoire SSA 48 Malaysia EAP13 Colombia AMER 49 Nigeria SSA14 Cape Verde SSA 50 Netherlands IND15 Costa Rica AMER 51 Norway IND16 Germany IND 52 New Zealand IND17 Denmark IND 53 Pakistan SA18 Dominican Republic AMER 54 Panama AMER19 Ecuador AMER 55 Peru AMER20 Egypt MENA 56 Philippines EAP21 Spain IND 57 Portugal IND22 Finland IND 58 Paraguay AMER23 France IND 59 Saudi Arabia MENA24 United Kingdom IND 60 Senegal SSA25 Ghana SSA 61 Singapore EAP26 Guinea SSA 62 El Salvador AMER27 Greece IND 63 Sweden IND28 Guatemala AMER 64 Swaziland SSA29 Hong Kong EAP 65 Thailand EAP30 Honduras AMER 66 Tunisia MENA31 Indonesia EAP 67 Turkey MENA32 India SA 68 Taiwan EAP33 Ireland IND 69 Uruguay AMER34 Iceland IND 70 United States IND35 Israel MENA 71 Venezuela AMER36 Italy IND 72 South Africa SSA