164
EEA Report No 6/2012 ISSN 1725-9177 Greenhouse gas emission trends and projections in Europe 2012 Tracking progress towards Kyoto and 2020 targets
| Date post: | 24-Mar-2016 |
| Category: |
Documents |
| Upload: | nick-watts |
| View: | 216 times |
| Download: | 0 times |

EEA Report No 6/2012
ISSN 1725-9177
Greenhouse gas emission trends and projections in Europe 2012
Tracking progress towards Kyoto and 2020 targets

EEA Report No 6/2012
Greenhouse gas emission trends and projections in Europe 2012
Tracking progress towards Kyoto and 2020 targets

Cover design: EEACover illustration © stock.xchngLeft photo © EEARight photo © EEALayout: EEA/Pia Schmidt
European Environment AgencyKongens Nytorv 61050 Copenhagen KDenmarkTel.: +45 33 36 71 00Fax: +45 33 36 71 99Web: eea.europa.euEnquiries: eea.europa.eu/enquiries
REG.NO. DK-000244
Legal notice The contents of this publication do not necessarily reflect the official opinions of the European Commission or other institutions of the European Union. Neither the European Environment Agency nor any person or company acting on behalf of the Agency is responsible for the use that may be made of the information contained in this report.
Copyright notice© EEA, Copenhagen, 2012Reproduction is authorised, provided the source is acknowledged, save where otherwise stated.
Information about the European Union is available on the Internet. It can be accessed through the Europa server (www.europa.eu).
Luxembourg: Publications Office of the European Union, 2012
ISBN 978-92-9213-331-3ISSN 1725-9177doi:10.2800/56770
Environmental productionThis publication is printed according to high environmental standards.
Printed by Schultz Grafisk— Environmental Management Certificate: DS/EN ISO 14001:2004— Quality Certificate: ISO 9001: 2008— EMAS Registration. Licence no. DK – 000235— Ecolabelling with the Nordic Swan, licence no. 541 176
PaperRePrint DeLuxe — 90 gsm. CyclusOffset — 250 gsm.
Printed in Denmark
3
Contents
Greenhouse gas emission trends and projections in Europe 2012
Contents
List of figures and tables ................................................................................................... 4
Acknowledgements ........................................................................................................... 6
Executive summary ........................................................................................................... 7
1 Introduction ............................................................................................................... 151.1 Objective and scope .............................................................................................. 151.2 Data sources ........................................................................................................ 151.3 Quality management of reported information ............................................................ 17
2 2008–2012 emission targets and compliance under the Kyoto Protocol ..................... 192.1 Emission targets under the Kyoto Protocol's first commitment period and the Burden-Sharing Agreement ......................................................................... 192.2 Achieving 2008–2012 objectives: the 'Kyoto compliance equation' ............................... 202.3 Role of the EU Emission Trading System in the achievement of Kyoto targets ................ 222.4 Increasing assigned amounts through flexible mechanisms and carbon sinks ................. 222.5 Implications of target over-delivery by some EU-15 Member States ............................ 24
3 Current progress towards 2008–2012 Kyoto targets .................................................. 253.1 Total emission levels .............................................................................................. 263.2 Emission levels in the non-ETS sectors ..................................................................... 263.3 Use of flexible mechanisms and LULUCF ................................................................... 293.4 Current progress of European countries .................................................................... 353.5 Current progress of the EU-15 ................................................................................ 38
4 The European Union Emissions Trading System .......................................................... 414.1 Introduction to the EU ETS ..................................................................................... 414.2 EU ETS emissions in the second trading period .......................................................... 434.3 Price development ................................................................................................. 484.4 Use of JI and CDM by operators .............................................................................. 494.5 Aviation in the EU ETS .......................................................................................... 514.6 Outlook for the third trading period (2013–2020) ...................................................... 51
5 2020 GHG emission targets in the EU and European countries ................................... 545.1 The EU Climate and Energy Package ........................................................................ 545.2 National 2020 GHG emission targets under the Effort Sharing Decision ......................... 555.3 Use of flexibility options in the ESD annual compliance cycle ....................................... 565.4 Post-2012 emission reduction commitments in Europe under the Kyoto Protocol ............ 57
6 Projected progress towards 2020 targets................................................................... 596.1 EU projected progress towards its 2020 target and beyond ......................................... 596.2 Sectoral projections until 2020 ............................................................................... 616.3 Projected progress towards national 2020 targets in non-ETS sectors ........................... 626.4 Projected emissions of other EEA member countries .................................................. 64
7 Glossary of terms and abbreviations .......................................................................... 66
8 References ................................................................................................................. 69
9 Calculation of progress towards Kyoto and 2020 targets............................................ 72
10 Country profiles .......................................................................................................... 89
Greenhouse gas emission trends and projections in Europe 20124
List of figures and tables
List of figures and tables
Figures
Figure ES.1 Actual progress of the EU-15 towards its burden-sharing target in absolute and relative terms ........................................................................................................ 8
Figure ES.2 Intended (2008–2012) and actual (2008–2011) average annual use of the Kyoto mechanisms .................................................................................................. 9
Figure ES.3 Absolute and relative gaps between average 2008–2011 non-ETS emissions and Kyoto target for non-ETS sectors ............................................................................ 11
Figure ES.4 Projected gaps between 2020 GHG emissions and national targets in sectors not covered by the EU ETS .......................................................................................... 12
Figure ES.5 Comparison of available emission units and verified emissions in all 30 EU ETS countries, 2005–2011 ........................................................................................... 14
Figure 2.1 GHG emission targets in Europe under the KP (2008–2012) relative to base-year emissions (absolute and relative) ............................................................................ 20
Figure 2.2 Possible changes in an assigned amount under the KP ............................................... 21Figure 2.3 Target over-delivery and surplus assigned amount .................................................... 24Figure 3.1 Gaps between average total 2008–2011 emissions and Kyoto targets without
the use of carbon sinks and flexible mechanisms ...................................................... 27Figure 3.2 Gap between average non-ETS 2008–2011 emissions and Kyoto targets without
the use of carbon sinks and flexible mechanisms ...................................................... 28Figure 3.3 Intended (2008–2012) and actual (2008–2011) average annual use of the Kyoto
mechanisms ........................................................................................................ 33Figure 3.4 Breakdown of current progress achieved by European countries towards their
Kyoto targets by the end of 2011 ............................................................................ 35Figure 3.5 Absolute and relative gaps between average 2008–2011 non-ETS emissions
and Kyoto target for non-ETS sectors (AAU initial - ETS issued) (with and without the use of carbon sinks and flexible mechanisms) ..................................................... 37
Figure 3.6 Actual progress of the EU-15 towards its burden-sharing target in absolute and relative terms ...................................................................................................... 38
Figure 3.7 Total, ETS and non-ETS emission trends in the EU-15 compared to their respective targets, 2008–2011 .............................................................................................. 40
Figure 4.1 Comparison of average verified emissions and free allocation for all 30 countries participating in the EU ETS, 2008–2011 ................................................................... 43
Figure 4.2 Comparison of available emission units and verified emissions in all 30 EU ETS countries, 2005–2011 ........................................................................................... 44
Figure 4.3 Development of sectoral emissions 2008–2011 compared to 2008 levels ...................... 47Figure 4.4 EUA future prices 2008–2012 ................................................................................. 48Figure 4.5 Credits from CDM and JI surrendered in 2008–2011 .................................................. 49Figure 4.6 Perspective of the EU ETS cap up to 2050 ................................................................ 52Figure 5.1 GHG targets under the Climate and Energy Package .................................................. 55Figure 5.2 National 2020 GHG emission limits under the ESD relative to 2005 emissions levels ...... 56Figure 6.1 Trends and projections of EU total GHG emissions, 1990–2030 ................................... 61Figure 6.2 Sectoral trends and projections of EU GHG emissions ................................................ 62Figure 6.3 Projected gaps between 2020 GHG emissions and national targets in sectors
not covered by the EU ETS ..................................................................................... 63Figure 6.4 Historic GHG trends and emission projections in EEA member countries that are
not EU Member States, and Croatia, 1990–2020 ....................................................... 65
List of figures and tables
5Greenhouse gas emission trends and projections in Europe 2012
Tables
Table 1.1 Information on countries covered in the report ......................................................... 16Table 1.2 Data sources used for assessments in this report, and related reporting requirements ... 17Table 1.3 Accounting of key factors in the projections reported by Member States ....................... 18Table 3.1 Current progress towards Kyoto or burden-sharing targets based on historic
domestic GHG emissions (no use of flexible mechanisms or LULUCF) ........................... 29Table 3.2 Actual (2008–2010) and expected (2008–2012) average annual emissions and
removals from LULUCF activities ............................................................................. 30Table 3.3 Actual (2008–2011) and planned (2008–2012) average annual Kyoto units from
flexible mechanisms .............................................................................................. 34Table 3.4 Overview of input data for EU-15 for the calculation of the overachievement/gap
between 2008–2011 GHG emissions and targets for the sectors not covered by the EU ETS ................................................................................................................ 39
Table 4.1 Sectors covered by the EU ETS ............................................................................... 42Table 4.2 Comparison of available emission units and verified emissions in all 30 EU ETS
countries, 2005–2011 ........................................................................................... 45Table 4.3 Verified emissions, free allocation and sold/auctioned allowances per EU ETS
country, 2008–2011 .............................................................................................. 46Table 4.4 Verified emissions per trading sector in all 30 EU ETS countries, 2005–2011 ................. 47Table 4.5 Limit on the use of JI and CDM credits by EU ETS operators ....................................... 50Table 5.1 Overview table of QELRCs submitted by European countries ....................................... 58Table 9.1 Calculation of progress towards 2008–2012 Kyoto targets .......................................... 72Table 9.2 Calculation of projected progress towards 2020 targets ............................................. 88

Greenhouse gas emission trends and projections in Europe 20126
Acknowledgements
Acknowledgements
This report was prepared by the European Environment Agency (EEA) and its European Topic Centre for Air Pollution and Climate Change Mitigation (ETC/ACM). The ETC/ACM is a consortium of European institutes assisting the EEA in its support to EU policy in the field of air pollution and climate change mitigation. The ETC/ACM partners involved in the preparation of this report were the Öko-Institut from Germany, the Environment Agency Austria (UBA Vienna), AEA Technology from the United Kingdom and Emisia from Greece.
The report was coordinated by François Dejean and Melanie Sporer (EEA); the ETC/ACM task manager was Sabine Gores (Öko-Institut).
The authors were Sabine Gores, Margarethe Scheffler, Verena Graichen, Ulrike Döring, Hauke Hermann and Anke Herold (Öko-Institut), Agnieszka Griffin, Anne Misra and Shoko Okamura (AEA Technology), Giorgos Melios (Emisia), Nicole Mandl (UBA Vienna), and François Dejean and Melanie Sporer (EEA).
The EEA acknowledges the comments received on the draft report from the national focal points and experts of EEA member countries and the European Commission. These comments are included in the report as far as practically feasible.

7
Executive summary
Greenhouse gas emission trends and projections in Europe 2012
Executive summary
At the end of 2011, almost all European countries were on track towards their Kyoto targets for 2008–2012. The EU-15 also remained on track to achieve its Kyoto target. Italy, however, was not on track. Spain plans to acquire a large quantity of Kyoto units through the KP's flexible mechanisms to achieve its target.
With emission caps already set for the economic sectors under the EU Emissions Trading Scheme (EU ETS), emissions reductions during 2012 in the sectors outside the EU ETS together with reductions by carbon sinks will set the frame for how many Kyoto units Member States need to acquire to reach their individual targets. Hence, both the development and delivery of adequate plans to acquire enough Kyoto credits is becoming increasingly important.
ETS emissions from 2008 to 2011 were on average 5 % below these caps, which results in an oversupply of allowances. The EU ETS is undergoing important changes in view of the third trading phase from 2013 to 2020.
Most EU Member States project that in 2020, their emissions outside the EU ETS will be lower than their national targets set under the Climate and Energy Package. However, further efforts will be necessary to achieve longer term reductions.
This report presents an assessment of the progress projected or achieved by the European Union (EU), its Member States and other EEA member countries towards achieving their greenhouse gas (GHG) emission targets for the first commitment period under the Kyoto Protocol (KP) and for 2020 under EU unilateral commitments. The report supports and complements the annual report of the European Commission to the European Parliament and the Council on the progress of the EU and its Member States towards set targets, as required by Article 5 of the EU Monitoring Mechanism Decision (MMD) (EU, 2004).
Almost all European countries are on track towards their Kyoto targets for 2008–2012.
By the end of 2011, after four years of the five-year first commitment period, almost all EU Member States and other EEA member countries with a Kyoto target were individually on track towards their respective Kyoto targets. This compares favourably to assessments in previous years.
Twenty-five EU Member States (all except Cyprus and Malta), Croatia, Iceland, Liechtenstein, Norway
and Switzerland have individual GHG reduction and limitation targets under the KP. Each of these Kyoto targets corresponds to an emission budget (corresponding to a quantity of 'Kyoto units') for the first commitment period (2008–2012) of the KP. To achieve their Kyoto targets, countries must therefore balance their emissions with the amount of Kyoto units they are holding. Such a balance can be achieved by limiting or reducing their domestic emissions and by increasing their emission budget through the contribution of Land Use, Land-Use Change and Forestry (LULUCF) activities, such as forest management, as well as the use of the KP's flexible mechanisms whereby they can acquire Kyoto units from other countries.
With the introduction of the EU Emissions Trading Scheme (ETS) in the EU, each national Kyoto target was split into a target for the ETS sectors (through the allocation of allowances linked to Kyoto units for the second trading period 2008–2012) and a target for emissions in the sectors not covered by the ETS. While ETS operators are legally bound to match their emissions with an equivalent number of allowances, governments must ensure that their 'non-ETS target' is met in order to achieve their Kyoto target.
Executive summary
8 Greenhouse gas emission trends and projections in Europe 2012
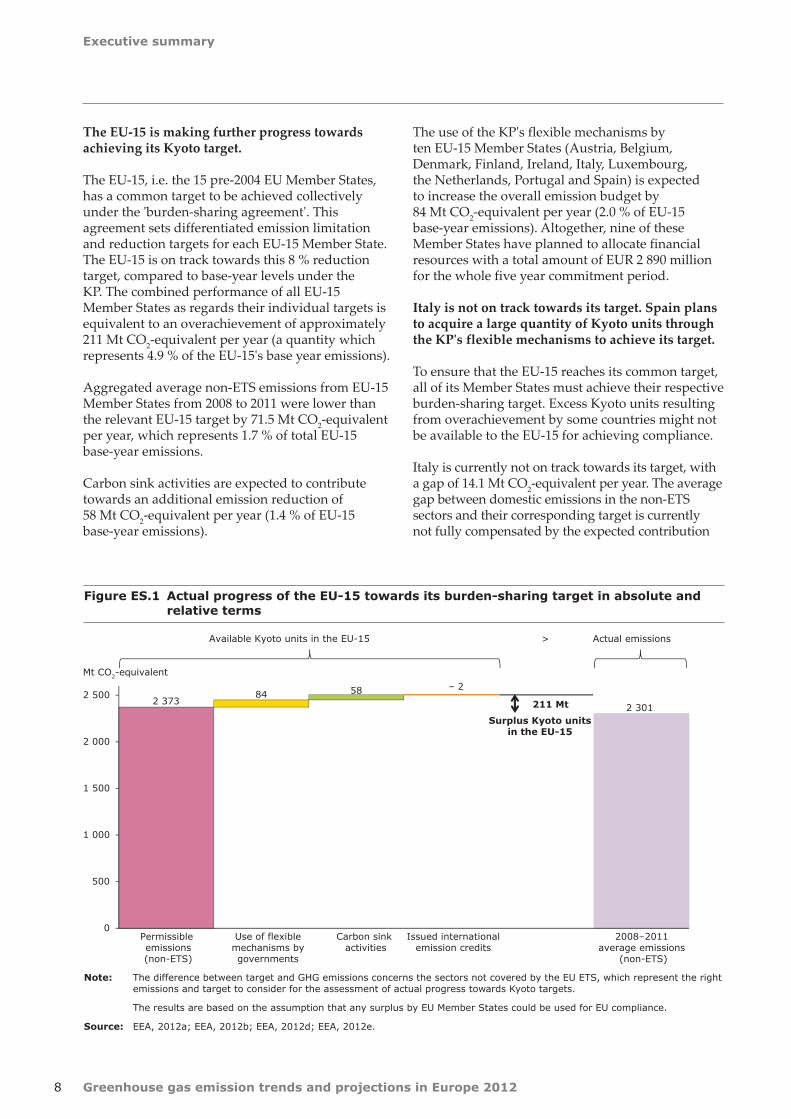
Note: The difference between target and GHG emissions concerns the sectors not covered by the EU ETS, which represent the right emissions and target to consider for the assessment of actual progress towards Kyoto targets.
The results are based on the assumption that any surplus by EU Member States could be used for EU compliance.
Source: EEA, 2012a; EEA, 2012b; EEA, 2012d; EEA, 2012e.
Figure ES.1 Actual progress of the EU‑15 towards its burden‑sharing target in absolute and relative terms
2 37384 58 – 2
2 301211 Mt
0
500
1 000
1 500
2 000
2 500
Permissible emissions(non-ETS)
Use of flexiblemechanisms bygovernments
Carbon sink activities
Issued internationalemission credits
2008–2011 average emissions
(non-ETS)
Mt CO2-equivalent
Available Kyoto units in the EU-15 Actual emissions>
Surplus Kyoto units in the EU-15
The EU‑15 is making further progress towards achieving its Kyoto target.
The EU-15, i.e. the 15 pre-2004 EU Member States, has a common target to be achieved collectively under the 'burden-sharing agreement'. This agreement sets differentiated emission limitation and reduction targets for each EU-15 Member State. The EU-15 is on track towards this 8 % reduction target, compared to base-year levels under the KP. The combined performance of all EU-15 Member States as regards their individual targets is equivalent to an overachievement of approximately 211 Mt CO2-equivalent per year (a quantity which represents 4.9 % of the EU-15's base year emissions).
Aggregated average non-ETS emissions from EU-15 Member States from 2008 to 2011 were lower than the relevant EU-15 target by 71.5 Mt CO2-equivalent per year, which represents 1.7 % of total EU-15 base-year emissions.
Carbon sink activities are expected to contribute towards an additional emission reduction of 58 Mt CO2-equivalent per year (1.4 % of EU-15 base-year emissions).
The use of the KP's flexible mechanisms by ten EU-15 Member States (Austria, Belgium, Denmark, Finland, Ireland, Italy, Luxembourg, the Netherlands, Portugal and Spain) is expected to increase the overall emission budget by 84 Mt CO2-equivalent per year (2.0 % of EU-15 base-year emissions). Altogether, nine of these Member States have planned to allocate financial resources with a total amount of EUR 2 890 million for the whole five year commitment period.
Italy is not on track towards its target. Spain plans to acquire a large quantity of Kyoto units through the KP's flexible mechanisms to achieve its target.
To ensure that the EU-15 reaches its common target, all of its Member States must achieve their respective burden-sharing target. Excess Kyoto units resulting from overachievement by some countries might not be available to the EU-15 for achieving compliance.
Italy is currently not on track towards its target, with a gap of 14.1 Mt CO2-equivalent per year. The average gap between domestic emissions in the non-ETS sectors and their corresponding target is currently not fully compensated by the expected contribution

Executive summary
9Greenhouse gas emission trends and projections in Europe 2012
Figure ES.2 Intended (2008–2012) and actual (2008–2011) average annual use of the Kyoto mechanisms
Note: Positive values indicate net acquisition of Kyoto units, while negative values indicate net sales. The actual use of Kyoto mechanisms is based on the delivery of units according to the SEF table. Countries might have acquired more units than are recorded in the SEF tables, e.g. due to delivery dates later in the commitment period. AAU: assigned amount units; ERU: emission reduction units; CER: certified emission reductions. For the United Kingdom, SEF tables include the overseas territories and the crown dependencies of the United Kingdom. For the purposes of the implementation of Article 4 of the KP and as they are not part of the EC, the overseas territories and the crown dependencies of the United Kingdom were excluded from the initial assigned amount of the United Kingdom under the EC. In consequence, the trade of AAUs is slightly overestimated for the United Kingdom, as SEF tables for the geographical coverage of the United Kingdom under the EC only are not available. For Denmark, Greenland is included in the SEF tables. For the purposes of the implementation of Article 4 of the KP and as Greenland is not part of the EC, Greenland was excluded from the initial assigned amount of Denmark under the EC. In consequence, the trade of AAUs is slightly overestimated for Denmark, as SEF tables for the geographical coverage of Denmark under the EC only are not available. For Germany and France, corrections for allocated allowances have been included. Germany distributed an additional 8.1 Mt in 2008 to finance its auctioning mechanism, and in 2009 and 2010, Germany received 4 Mt from operators due to back requirements that are not included in the CITL. Allocations by France to new entrants in 2008 and 2009 were not recorded as allocation in the CITL; these 9.4 Mt are included in the calculations of the report with exception of the Chapter 4 on the EU ETS.
Source: EEA, 2012e; 2008–2011 data on flexible mechanisms (SEF tables) reported under the KP, 2012.
16
64
1 0 0 02 2 3
10
2
39
0 0
– 1
– 25
– 1
– 4
– 8
– 14
0 0
– 5
1 0 0 0
53
– 30
– 20
– 10
0
10
20
30
40
Austria
Belgium
Denmar
k
Finland
Fran
ce
German
y
Greec
e
Ireland
Italy
Luxe
mbo
urg
Nethe
rland
s
Portu
gal
Spain
Swed
en
Unite
d King
dom
Bulgar
ia
Czec
h Re
public
Esto
nia
Hunga
ry
Latvia
Lithu
ania
Poland
Roman
ia
Slov
akia
Slov
enia
Croa
tia
Icelan
d
Liech
tens
tein
Norway
Switz
erland
Million Kyoto units
Actual use of ERU per year (2008–2011) Actual use of CER per year (2008–2011)
Actual use of AAU per year (2008–2011) Intended average annual use of Kyoto mechanisms
from carbon sink activities and the quantity of Kyoto units that the Italian Government expects to acquire under the flexible mechanisms to achieve its KP target. Although it did not put a threshold on the use of flexible mechanisms in its national climate change strategy, Italy has not reported any concrete plan to purchase more Kyoto units than those already envisaged. Furthermore, Italy is the only EU-15
Member State using flexible mechanisms that has not provided information as to the allocation of financial resources for using the Kyoto mechanisms.
Spain has a very small current shortfall of 0.1 Mt CO2-equivalent per year (0.03 % of base-year emissions). Such a gap could, for example, be bridged if non-ETS emissions were not to increase in 2012
Executive summary
10 Greenhouse gas emission trends and projections in Europe 2012
compared to 2011 levels. Nevertheless, Spain faces the considerable challenge of fulfilling by 2015 its plan to acquire an average of 38.8 million units per year of the commitment period. Although the total projected quantities of credits from flexible mechanisms for the first commitment period increased from 159 to 194 million units compared to 2011, a concurrent rise in the budget was not reported. The reported budget of over EUR 400 million would currently be equivalent to a price of about EUR 2 per tonne of CO2.
The gaps currently observed in Italy and Spain may result in a potential shortfall of 14.2 Mt CO2-equivalent (0.3 % of the EU-15's base-year emissions). These gaps, if not addressed by early 2015, could hinder the EU-15 from achieving its target.
It is increasingly important that a number of European countries deliver on their plans to buy Kyoto credits in order to achieve their individual targets.
With emission caps already set for the economic sectors under the EU ETS, emissions reductions during 2012 in the sectors outside the EU ETS together with reductions by carbon sinks will set the frame for how many Kyoto units Member States need to acquire to reach their individual targets. In Austria, Belgium, Portugal and Spain, the actual annual use of flexible mechanisms observed during the period 2008–2011 was less than half the intended annual use (for the full commitment period). Delivering on these plans corresponds to the need to purchase on average more than 4 million per year of the commitment period by each of these countries. Austria adopted in 2012 a plan to purchase on average 16 million Kyoto units per year of the commitment period, which represents a substantial increase compared to 2011. However, on average only 1.2 million units per year were actually delivered to Austria's Kyoto registry between 2008 and 2011. Seven EU-12 Member States (Bulgaria, the Czech Republic, Estonia, Hungary, Latvia, Lithuania and Slovakia) have reported on their intention to sell a certain amount of Kyoto units to other parties. Four other European countries (Liechtenstein, Norway, Slovenia and Switzerland) also intend to use the flexible mechanisms provided under the Kyoto Protocol to achieve their respective targets.
Most EU Member States project that in 2020, their emissions outside the EU ETS will be lower than their national targets set under the Climate and Energy Package. However, further efforts will be necessary to achieve longer term reductions.
In 2007, the EU committed to a unilateral 20 % GHG reduction target, which corresponds to a 14 % decrease in GHG emissions between 2005 and 2020 (1). The EU Climate and Energy Package adopted in 2009 sets a legislative framework to achieve this objective in a two-fold way: a 21 % reduction of emissions covered under the EU ETS compared to 2005 levels, to be achieved across the whole EU and an effort to reduce emissions not covered by the EU ETS by about 10 % compared to 2005 levels, shared between the 27 Member States through differentiated national GHG targets under Decision 406/2009/EC (known as the 'Effort Sharing Decision' (ESD)). While relative targets were already set under the ESD, absolute GHG targets were determined by the Commission in 2012, following an internal EU technical review of GHG emission estimates of all Member States for the years 2005, 2008, 2009 and 2010.
Based on recent estimates from 14 Member States and the EEA, total GHG emissions of the EU decreased by 2.5 % in 2011, standing approximately 17.6 % below their 1990 levels (about 16.5 %, if emissions from international aviation are taken into account). This important drop follows a 2 % increase in emissions observed in 2010 and substantial emission reductions in 2009 in all Member States. Projections from Member States indicate that total EU emissions will continue to fall slightly until 2020. With the current set of national domestic measures in place, Member States are expected to reach a level in 2020 which is 19 % below 1990 levels and close to the 20 % reduction target.
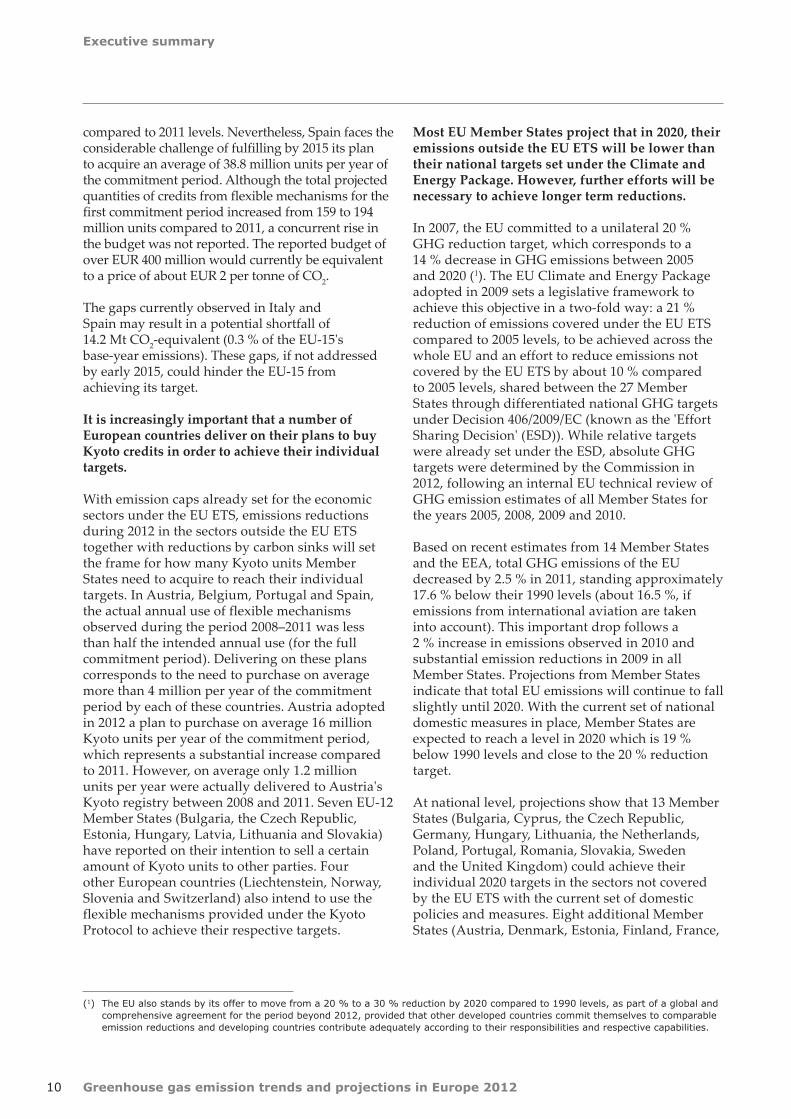
At national level, projections show that 13 Member States (Bulgaria, Cyprus, the Czech Republic, Germany, Hungary, Lithuania, the Netherlands, Poland, Portugal, Romania, Slovakia, Sweden and the United Kingdom) could achieve their individual 2020 targets in the sectors not covered by the EU ETS with the current set of domestic policies and measures. Eight additional Member States (Austria, Denmark, Estonia, Finland, France,
(1) The EU also stands by its offer to move from a 20 % to a 30 % reduction by 2020 compared to 1990 levels, as part of a global and comprehensive agreement for the period beyond 2012, provided that other developed countries commit themselves to comparable emission reductions and developing countries contribute adequately according to their responsibilities and respective capabilities.

Executive summary
11Greenhouse gas emission trends and projections in Europe 2012
Figure ES.3 Absolute and relative gaps between average 2008–2011 non‑ETS emissions and Kyoto target for non‑ETS sectors
Note: * 'EU-15 (no overachievement)' corresponds to the situation of the EU-15 where all surplus Kyoto units from target overachievement in the EU‑15 are not taken into account, to reflect the possibility that Member States with a surplus could use any remaining allowances for their own purposes and not necessarily make them available to compensate for Member States with a shortfall. Subsequent to the effect of allocation of allowances to the EU ETS, the target and annual emissions are those of the sectors not covered by the EU ETS. The target for non-ETS sectors corresponds to the difference between the initial permissible emissions and the amount of allowances allocated under the EU ETS. A positive value indicates a country for which average 2008–2011 non-ETS emissions were lower than the annual target. The assessment is based on average 2008–2011 emissions and the planned use of flexible mechanisms, as well as the expected effect of LULUCF activities. EU-15 values are the sum of the gaps/surplus for the 15 EU Member States party to Burden-Sharing Agreement. For Croatia, Iceland and Switzerland, total emissions are used as they have currently no installations under the EU ETS.
Source: EEA, 2012a; EEA, 2012b; EEA, 2012d; EEA, 2012e.
6.7
1.3
0.9
0.0
0.5
137.7
108.8
54.8
35.9
19.8
8.7
5.1
4.7
3.5
1.1
93.9
61.3
25.7
11.9
7.7
5.4
4.6
4.6
2.4
2.3
1.9
0.2
0.0
– 0.1
– 14.1
210.7
– 14.2
Norway
Croatia
Iceland
Liechtenstein
Switzerland
Poland
Romania
Bulgaria
Hungary
Estonia
Lithuania
Slovakia
Czech Republic
Latvia
Slovenia
United Kingdom
Germany
France
Sweden
Greece
Belgium
Netherlands
Portugal
Ireland
Finland
Denmark
Austria
Luxembourg
Spain
Italy
EU-15
EU-15 (no overachievement) *
13.5
4.2
25.6
2.2
1.0
24.4
39.1
41.3
31.1
46.6
17.7
7.0
2.4
13.6
5.4
12.1
5.0
4.6
16.4
7.2
3.7
2.2
7.7
4.3
3.3
2.7
0.3
0.0
0.0
– 2.7
4.9
– 0.3
100 0 100 200 300
Mt CO2-equivalent
Gap to target (non-ETS domestic emissions including plans on Kyoto mechanisms and carbon sinks) average 2008–2011
– 20 0 20 40 60 % of respective country's base-year emissions
Executive summary
12 Greenhouse gas emission trends and projections in Europe 2012
Figure ES.4 Projected gaps between 2020 GHG emissions and national targets in sectors not covered by the EU ETS
Note: Progress calculated based on domestic emissions only, without accounting for possible use of flexibility options. The 2020 targets and 2005 non-ETS emissions are all consistent with 2013–2020 ETS scope, i.e. they take into account the extension of the ETS scope in 2013 and the unilateral inclusion of installation in 2008–2012. Relative gaps are calculated as a ratio between the difference (projected non-ETS 2020 emissions – estimates of 2020 targets under the ESD) and EEA estimates of 2005 non-ETS emissions consistent with 2013–2020 ETS scope.
Source: EEA, 2012; EC, 2012.
– 27
– 17
– 28
– 16
– 7
0
0
– 10
– 11
– 2
– 1
– 1
– 10
3
7
2
8
– 3
10
– 13
3
14
17
16
15
14
36
1
– 20
– 10
– 6
– 6
– 3
0
0
2
3
4
5
7
9
10
10
14
40
40
8
– 40 – 30 – 20 – 10 0 10 20 30 40 50
Luxembourg
Ireland
Malta
Belgium
Greece
Spain
Sweden
Denmark
Austria
Finland
Estonia
Latvia
Italy
Lithuania
United Kingdom
Netherlands
Bulgaria
France
Romania
Slovenia
Germany
Poland
Portugal
Czech Republic
Slovakia
Cyprus
Hungary
EU-27
% of 2005 non-ETS emissions
Projected shortfall (–) or overachievement (+) of 2020 non-ETS target with existing measures
Projected shortfall (–) or overachievement (+) of 2020 non-ETS target with additional measures
1
2

Executive summary
13Greenhouse gas emission trends and projections in Europe 2012
Italy, Latvia and Slovenia) would achieve their target through the implementation of additional measures. The remaining six Member States (Belgium, Ireland, Greece, Spain, Luxembourg and Malta) would not achieve their targets through domestic emission reductions alone, even if the currently planned measures were to be implemented (although the gap would be extremely small in the case of Spain). These Member States could still meet their national 2020 targets through the use of flexibility options provided by the ESD, whereby transfers of annual emissions allocations between years and between Member States are allowed, as well as the limited use of project-based credits from two of the KP flexible mechanisms, the Clean Development Mechanism (CDM) and the Joint Implementation (JI).
In April 2012 the EU submitted information on its Quantified Emission Limitation or Reduction Commitments (QELRCs) to translate its 2020 target pledge into an emission budget for a second commitment period (CP2) under the KP, based on the legislation adopted under the Climate and Energy Package. This results in an overall QELRC value of 80 % of base-year emissions. According to calculations from the UNFCCC Secretariat, such QELRC would fall into the IPCC range of a 25 % to 40 % reduction by 2020 compared to 1990 levels, assuming a linear decrease in emissions from average CP1 target levels.
Looking beyond 2020, partial information from Member States indicates that existing and currently planned measures are not likely to be sufficient to keep the EU on the path to achieving its long-term emission reduction goals. In particular, achieving a reduction of emissions by 80 % to 95 % by 2050 compared to 1990, as agreed by European heads of state and government, will require enhanced efforts from Member States. For example, aggregated projections for 2030 indicate an approximate emission reduction of 30 % compared to 1990, while cost-effective emission reductions consistent with the long-term target should be in the magnitude of 40 %.
The ETS contributes towards the achievement of Kyoto targets through legally binding caps. ETS emissions from 2008 to 2011 were on average 5 % below these caps, which results in an oversupply of allowances. The EU ETS is undergoing important changes in view of the third trading phase from 2013 to 2020.
The ETS, which covers approximately 40 % of total GHG emissions in the EU, was introduced to help Member States achieving their Kyoto targets. The structure of the ETS is such that addressing compliance under the KP in the EU requires a consideration of the gap between emissions and targets in the sectors not covered by the ETS. Emission levels in the EU ETS do therefore not affect Kyoto compliance.
In the period from 2008 to 2011, the emissions of all installations covered by the EU ETS were 5 % below the amount of allocated allowances (freely and through auctioning) during that period. This was one consequence of the economic crisis. Although verified emissions were lower than freely allocated allowances, operators made a substantial use of CDM and JI credits to comply with their obligations, amounting to 7 % of total verified emissions. In 2012 the aviation sector was included in the EU ETS.
In 2012, the aviation sector was included in the EU ETS. From 2013 onwards, its scope will be further extended. The cap will decrease continuously from 2013 onwards using a linear reduction factor while an increasing number of allowances will be auctioned. The use of Kyoto units issued under the KP's flexible mechanisms will be subject to tighter quality restrictions. Because the carbon market is currently marked by an oversupply of allowances, the Commission recently proposed that a certain quantity of auctioned allowances, yet to be determined, be back-loaded (auctioned later in the third trading phase). This is in order to reduce the amount of allowances to be auctioned in the years 2013 to 2015. It is also expected that long-term structural measures will be proposed by the Commission to address the challenges in the EU ETS. Australia and the European Commission have agreed on a full linking of their emissions trading systems, foreseen to be effective as of July 2018.

Executive summary
14 Greenhouse gas emission trends and projections in Europe 2012
Figure ES.5 Comparison of available emission units and verified emissions in all 30 EU ETS countries, 2005–2011
Note: The 'change in scope/coverage' concerns the correction from 2005 through 2007, to 2008 through 2012. The large corrections for 2005 and 2006 are related to Bulgaria and Romania, which only entered the scheme in 2007 (see Table 4.2).
Source: CITL extracts (allocation and verified emissions data: September 2012; surrendered CERs and ERUs: 2 May 2012); EUAs sold and auctioned: Öko‑Institut, 2011; gap filling for Bulgaria (allocation for the year 2007) and update of auctioning information: own calculations by ETC/ACM.
0
500
1 000
1 500
2 000
2 500
2005 2006 2007 2008 2009 2010 2011
1st trading period 2nd trading period
Million emission units/Mt CO2
Surrendered ERUs
Surrendered CERs
EUAs sold and auctioned by governments
EUAs allocated for free
Scope correction
Verified emissions and scope correction

15
Introduction
Greenhouse gas emission trends and projections in Europe 2012
1 Introduction
1.1 Objective and scope
This report presents an assessment of the progress projected or achieved by the European Union (EU), its Member States and other EEA member countries towards achieving their greenhouse gas (GHG) emission targets for the first commitment period under the Kyoto Protocol (KP) and for 2020 under EU unilateral commitments. The report supports and complements the annual report of the European Commission to the European Parliament and the Council on the progress of the EU and its Member States towards set targets, as required by Article 5 of the EU Monitoring Mechanism Decision (MMD) (EC, 2004).
The report covers the geographical area represented by the 32 EEA member countries (2) and Croatia.
The assessment of progress towards Kyoto targets looks in detail at the situations of:
• the EU-15 comprising the 15 pre-2004 Member States, which has an overall 8 % reduction commitment under the KP;
• the 25 EU Member States with a Kyoto target (all 27 Member States except Cyprus and Malta);
• two EU candidate countries (Croatia and Iceland) (3);
• the three other EEA member countries with a Kyoto target (Liechtenstein, Norway and Switzerland).
Cyprus, Malta and Turkey do not have a target under the KP and are therefore not covered by the assessment of progress towards Kyoto targets.
The 2020 target assessment in this report covers the 27 Member States of the EU (EU-27).
Progress towards GHG emission targets is assessed in two different ways, depending on the time frame considered.
• The current progress of Member States towards their Kyoto (or burden-sharing) targets is assessed primarily on the basis of their historic emissions during the first four years (2008–2011) of the KP's first commitment period. The assessment also uses information on the expected use of flexible mechanisms and carbon sinks as provided by Member States in questionnaires submitted to the European Commission in 2011 and 2012.
• The projected progress of Member States towards their 2020 targets is based on projections of emissions until 2020 submitted by Member States under the MMD in 2011 (for all Member States except for Ireland, Luxembourg and Switzerland, which provided updated projections in 2012). These Member States' emission projections are reported for two scenarios, which differ in terms of context: considering implementation of existing measures only ('with existing measures' (WEM)), or considering implementation of additional planned measures ('with additional measures' (WAM)). For Bulgaria, Portugal and Romania, estimates are based on PRIMES/GAINS projections.
1.2 Data sources
The assessment of current progress for Kyoto targets provides an indication of where all countries stood at the end of 2011 with respect to their 2008–2012 average targets. It does not aim to predict whether a country will finally achieve its targets or not. This approach, which is based mainly on robust historic data, avoids relying on more uncertain projection
(2) EEA member countries are Austria, Belgium, Bulgaria, Cyprus, Czech Republic, Denmark, Estonia, Finland, France, Germany, Greece, Hungary, Iceland, Ireland, Italy, Latvia, Liechtenstein, Lithuania, Luxembourg, Malta, Netherlands, Norway, Poland, Portugal, Romania, Slovakia, Slovenia, Spain, Sweden, Switzerland, Turkey and the United Kingdom.
(3) Iceland applied to join the European Union on 16.7.2009. Negotiations on Iceland's accession to the EU were opened on 27.6.2011. In June 2011, the EU closed the formal membership negotiations with Croatia. The accession treaty was signed on 9.12.2011. Following the ratification procedure in all Member States and Croatia, accession is foreseen on 1.7.2013. Croatia is expected to join the EU as the 28th Member State at that time. Accession negotiations have not been opened yet for the candidate countries Serbia, Montenegro and the former Yugoslav Republic of Macedonia.
Introduction
16 Greenhouse gas emission trends and projections in Europe 2012
Annex I Party to the
UNFCCC
Kyoto protocol Effort Sharing Decision target (2020)
Participating in EU ETS
Included in
Annex B
Base‑year level of total national
emissions as determined by the initial
review (tonnes CO2‑equivalent)
Target under
Burden‑ Sharing
Agreement
Individual target
(% of base year)
(% non‑ETS emissions
2005)
EU x x
EU‑15 4 265.5 – 8.0 %
Austria x x 79.0 – 13.0 % – 16 % x
Belgium x x 145.7 – 7.5 % – 15 % x
Denmark x x 69.3 – 21.0 % – 20 % x
Finland x x 71.0 0.0 % – 16 % x
France x x 563.9 0.0 % – 14 % x
Germany x x 1 232.4 – 21.0 % – 14 % x
Greece x x 107.0 25.0 % – 4 % x
Ireland x x 55.6 13.0 % – 20 % x
Italy x x 516.9 – 6.5 % – 13 % x
Luxembourg x x 13.2 – 28.0 % – 20 % x
Netherlands x x 213.0 – 6.0 % – 16 % x
Portugal x x 60.1 27.0 % 1 % x
Spain x x 289.8 15.0 % – 10 % x
Sweden x x 72.2 4.0 % – 17 % x
United Kingdom x x 776.3 – 12.5 % – 16 % x
EU‑12
Bulgaria x x 132.6 – 8.0 % 20 % Since 2007
Cyprus (a) – – – – – 5 % x
Czech Republic x x 194.2 – 8.0 % 9 % x
Estonia x x 42.6 – 8.0 % 11 % x
Hungary x x 115.4 – 6.0 % 10 % x
Latvia x x 25.9 – 8.0 % 17 % x
Lithuania x x 49.4 – 8.0 % 15 % x
Malta (b) x – – – 5 % x
Poland x x 563.4 – 6.0 % 14 % x
Romania x x 278.2 – 8.0 % 19 % Since 2007
Slovakia x x 72.1 – 8.0 % 13 % x
Slovenia x x 20.4 – 8.0 % 4 % x
EEA member countries
Iceland x x 3.4 10.0 % –
Liechtenstein x x 0.2 – 8.0 % – Since 2008
Norway x x 52.8 1.0 % – Since 2008
Switzerland x x 49.6 – 8.0 % – –
Turkey (c) x – – – – –
EEA cooperating countries
Croatia (d) x x 31.3 – 5.0 % – From 2013 onwards
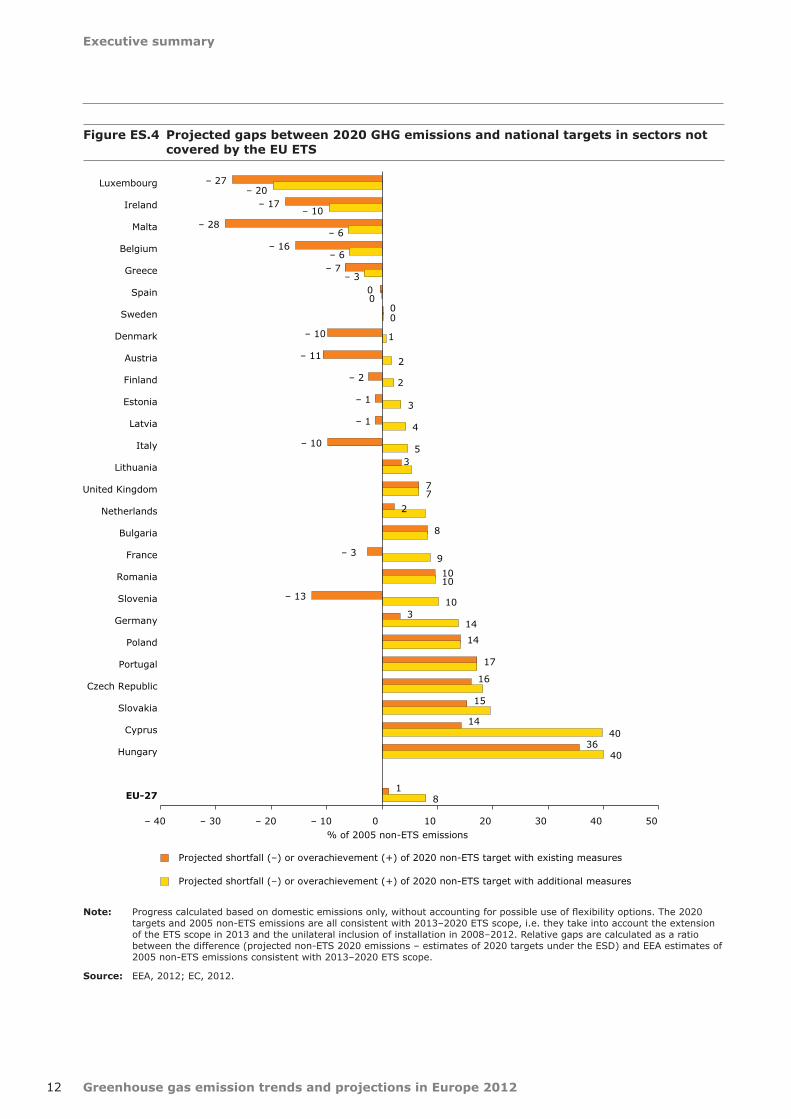
Note: (a) Cyprus ratified the UNFCCC in 1997 and the KP in 1999.
(b) Malta ratified the UNFCCC in 1994 and became an Annex I Party to the Convention at the end of 2010. It ratified the KP in 2001.
(c) Turkey was not Party to the UNFCCC when the KP was adopted. It ratified the KP in 2009.
(d) Croatia will join the EU in 2013.
Table 1.1 Information on countries covered in the report
Introduction
17Greenhouse gas emission trends and projections in Europe 2012
data. It provides policymakers with a clear picture of where countries stand at the end of 2011, and is thus an indication of the further efforts required to achieve Kyoto objectives by the end of 2012.
The average use of flexible mechanisms and the carbon removals due to Land Use, Land-Use Change and Forestry (LULUCF) activities as planned by Member States for the whole commitment period have been considered (instead of actual data for the period from 2008 to 2011 only), in calculating the emission budgets (Kyoto units) against which actual emissions are compared to assess progress. The planned use of credits for the whole first commitment period is assumed to contribute towards better estimates of final national emission budgets than consideration of annual historic data does.
The report uses official UNFCCC submissions up to 2010 and proxy data 2011, which may potentially result in some inconsistencies where proxy data have been estimated on the basis of revised inventory data, especially following the 2012 technical review under Decision No 406/2009/EC, the Effort Sharing Decision (ESD) (EC, 2009a).
The assessment of the projected progress of Member States towards their national 2020 targets set under the ESD as part of the 2009 EU climate and energy package is based on projection data concerning emissions not covered by the European Union Emissions Trading System (EU ETS) submitted by Member States on a voluntary basis. These targets
Table 1.2 Data sources used for assessments in this report, and related reporting requirements
Data Source
National GHG inventory 1990–2010 (Y-2)LULUCF tablesEEA Member States' proxy inventory for 2011 Standard Electronic Format (SEF)
Annual submission from Annex 1 Parties under UNFCCC and KPSome Member States' proxy inventories (a) and the EEA 2011 proxy inventory
GHG emissions projections 2010–2020 (it was recommended that Member States also provide 2025 and 2030 projections)
Biennial submission from Member States to the European Commission under the EU Monitoring Mechanism Decision (b)
GHG emission projections from PRIMES/GAINS models European Commission's EU energy trends to 2030 — Update 2009
Verified emissions under the EU ETS, national allocation plans (NAPs) and the subsequent European Commission decision
Community Independent Transaction Log (CITL)
Information on expected CO2 removals from carbon sequestration activities (LULUCF)
Questionnaire under KP provided by Member States in 2011 and updates of some Member States (c) in 2012
Information on the intended use of the Kyoto flexible mechanisms at government level
Questionnaire provided by Member States in 2011 and updates of some Member States (d) in 2012
concern GHG emissions such as emissions from transport, agriculture, waste or residential fuel combustion. The assessment of projected progress of the EU towards achieving its 2020 targets was made predominately on the basis of updated national projections reported by Member States in 2011 and 2012. Projections from the European Commission's baseline and reference scenarios, based on the PRIMES and GAINS models (EC, 2010a) were used for those Member States that did not submit updated projections in 2011, or where inconsistencies in the reported data were unresolved during the QA/QC procedure.
Overall, the data and analyses presented in this report are based on the sources shown in Table 1.2.
1.3 Quality management of reported information
By June 2012, all the countries covered in this report had reported their GHG inventory for the period 1990–2010. The EU GHG inventory is based on the annual inventories of the Member States. The Member States and the EU implement Quality Assessment and Quality Control (QA/QC) procedures in their inventory compilation process in order to comply with Intergovernmental Panel on Climate Change (IPCC) good practice guidance.
All Member States submitted GHG projections under the MMD in 2011; no projections reporting was
Note: (a) Emission inventory information for the year 2011 available from Austria, Denmark, France, Germany, Greece, Ireland, Italy, Luxembourg, the Netherlands, Poland, Slovenia, Spain, and the United Kingdom.
(b) Decision No 280/2004/EC (EC, 2004).
(c) Questionnaire on the use of activities under Article 3.3 and Article 3.4 of the Kyoto Protocol: France, Germany, United Kingdom, Ireland, Slovakia, Spain.
(d) Questionnaire on the use of the Kyoto Protocol mechanisms in meeting the 2008–2012 targets: Austria, Germany, Ireland, Lithuania, Slovakia, Spain, and the United Kingdom. Luxembourg provided updated information but not an updated questionnaire.

Introduction
18 Greenhouse gas emission trends and projections in Europe 2012
required in 2012 under this mechanism. Nevertheless, Ireland, Luxembourg, and Switzerland submitted updated GHG projections on a voluntary basis in 2012. The reported projections received in 2011 and 2012 were reviewed and compiled by the ETC/ACM of the EEA.
A detailed assessment by the ETC/ACM of the quality of Member State projections submitted in 2011 was published in the 2012 Assessment of the Member States' projections submitted under the EU Monitoring Mechanism in 2011.
Based on the outcome of quality checks on transparency, completeness, comparability, consistency and accuracy, projections reported by Member States were gap-filled if necessary or adjusted (i.e. recalibrated on the basis of more recent
GHG inventory data) by the EEA, in agreement with the countries concerned.
Not all Member States specified whether their projections took into account the impact of the economic recession and of the measures included in the 2009 climate and energy package, in particular the change in scope in the third period of the EU ETS and the binding national targets on renewable energy sources (see Table 1.3). The effect of the economic recession has been taken into account by all 21 Member States which provided information on this issue.
Updated information on the use of flexible mechanisms and carbon sinks for the Kyoto period was also provided by nine Member States as well as Switzerland.
Table 1.3 Accounting of key factors in the projections reported by Member States
Member State Accounting of the economic
recession
Accounting of climate
and energy package
Accounting of change in EU ETS scope
2013
Gap filling of projections by
EEA
Gap filling of non‑ETS
projections by EEA
Adjustment of sectoral
projections by EEA
Austria Yes Yes N.R. No No Yes
Belgium Yes Yes N.A. No No No
Bulgaria Yes N.R. No Yes Yes N.A.
Cyprus Yes Yes No No No Yes
Czech Republic Yes Yes Yes No Yes No
Denmark Yes Yes Yes No No No
Estonia Yes Yes No No Yes Yes
Finland Yes Yes Yes No Yes No
France Yes Yes Yes No No No
Germany Yes Yes Yes No No Yes
Greece Yes Yes Yes No No No
Hungary N.R. N.R. N.R. No No Yes
Ireland Yes Yes No No No No
Italy Yes Yes Yes No No No
Latvia N.R. N.R. N.R. No No Yes
Lithuania Yes No No No Yes Yes
Luxembourg Yes No Yes No No No
Malta N.R. No N.R. No No Yes
Netherlands Yes Yes N.R. No Yes Yes
Poland Yes No No No Yes No
Portugal No No No Yes Yes N.A.
Romania No No No Yes Yes N.A.
Slovakia Yes Yes No No No Yes
Slovenia Yes No No No No No
Spain Yes Yes Yes No No No
Sweden Yes Yes Yes No No No
United Kingdom Yes Yes Yes No No Yes
Note: N.R.: information not reported by the country or not available; N.A.: not applicable, since projections were already gap filled. Gap filling of projections based on PRIMES/GAINS models. Adjustment of projections based on the ratio between historic emissions reported with projections and latest historic emissions data at sectoral level (energy supply, energy use, transport, industrial processes, agriculture and waste).
Source: EEA, 2012a.
19
2008–2012 emission targets and compliance under the Kyoto Protocol
Greenhouse gas emission trends and projections in Europe 2012
2 2008–2012 emission targets and compliance under the Kyoto Protocol
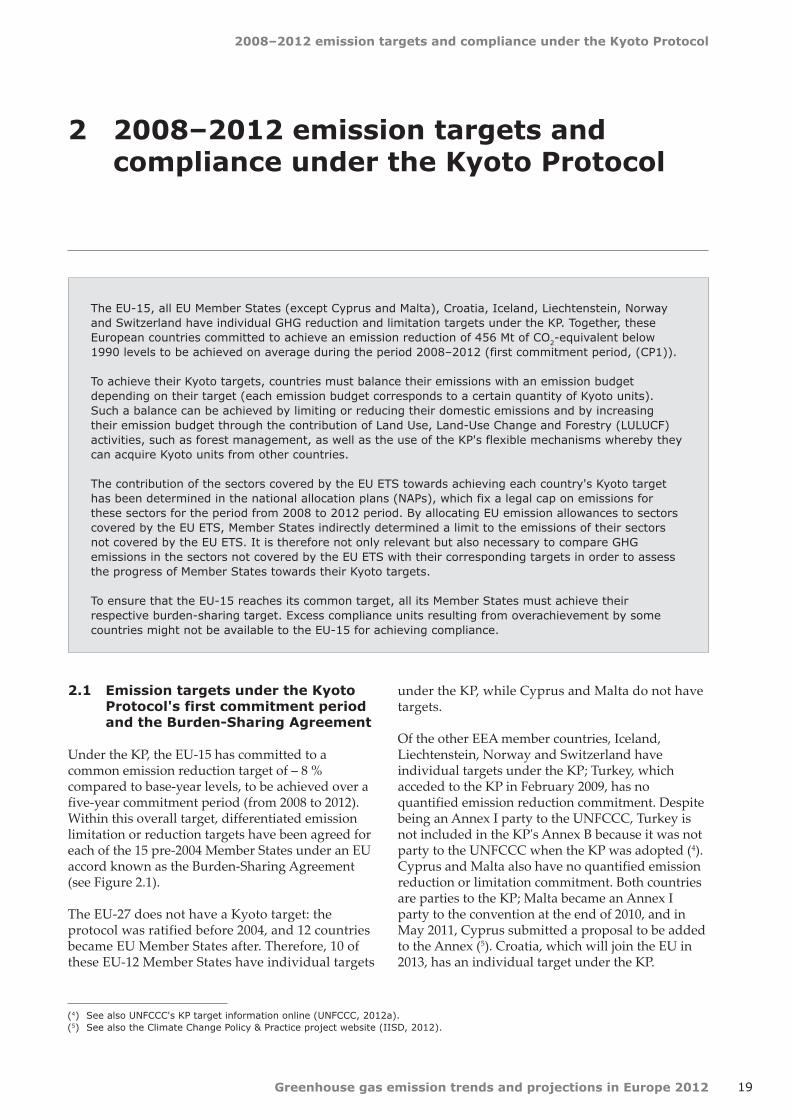
The EU-15, all EU Member States (except Cyprus and Malta), Croatia, Iceland, Liechtenstein, Norway and Switzerland have individual GHG reduction and limitation targets under the KP. Together, these European countries committed to achieve an emission reduction of 456 Mt of CO2-equivalent below 1990 levels to be achieved on average during the period 2008–2012 (first commitment period, (CP1)).
To achieve their Kyoto targets, countries must balance their emissions with an emission budget depending on their target (each emission budget corresponds to a certain quantity of Kyoto units). Such a balance can be achieved by limiting or reducing their domestic emissions and by increasing their emission budget through the contribution of Land Use, Land-Use Change and Forestry (LULUCF) activities, such as forest management, as well as the use of the KP's flexible mechanisms whereby they can acquire Kyoto units from other countries.
The contribution of the sectors covered by the EU ETS towards achieving each country's Kyoto target has been determined in the national allocation plans (NAPs), which fix a legal cap on emissions for these sectors for the period from 2008 to 2012 period. By allocating EU emission allowances to sectors covered by the EU ETS, Member States indirectly determined a limit to the emissions of their sectors not covered by the EU ETS. It is therefore not only relevant but also necessary to compare GHG emissions in the sectors not covered by the EU ETS with their corresponding targets in order to assess the progress of Member States towards their Kyoto targets.
To ensure that the EU-15 reaches its common target, all its Member States must achieve their respective burden-sharing target. Excess compliance units resulting from overachievement by some countries might not be available to the EU-15 for achieving compliance.
2.1 Emission targets under the Kyoto Protocol's first commitment period and the Burden‑Sharing Agreement
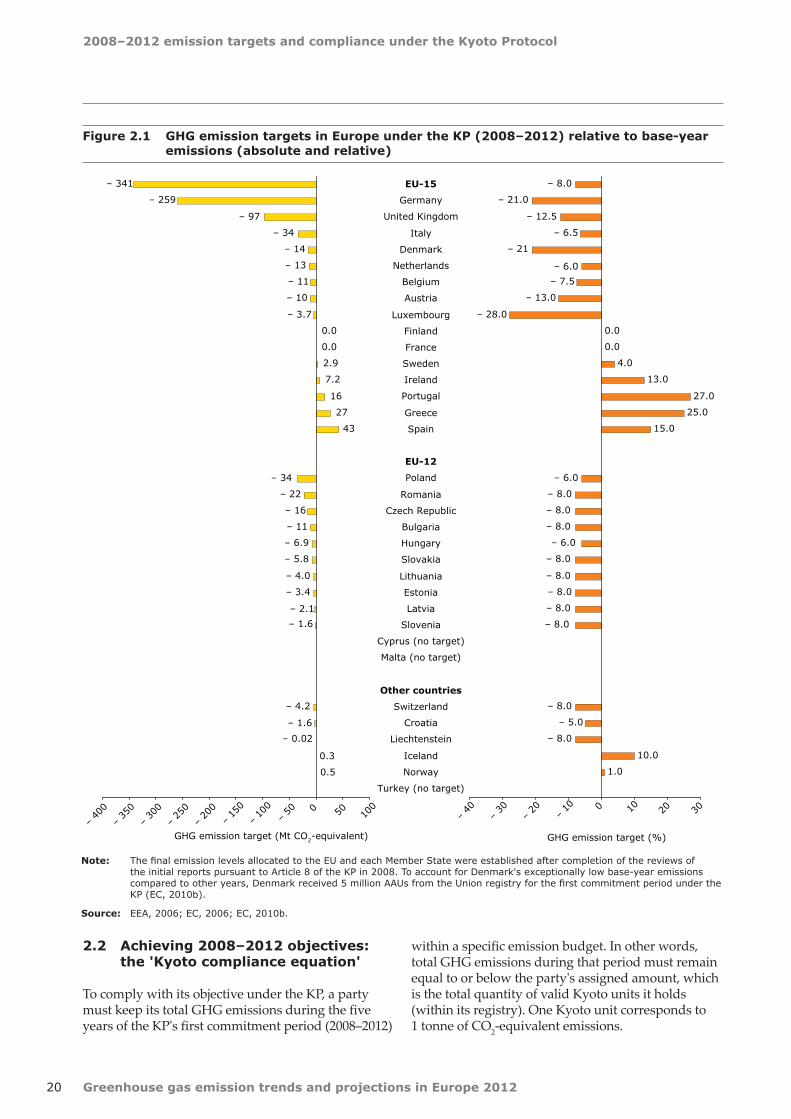
Under the KP, the EU-15 has committed to a common emission reduction target of – 8 % compared to base-year levels, to be achieved over a five-year commitment period (from 2008 to 2012). Within this overall target, differentiated emission limitation or reduction targets have been agreed for each of the 15 pre-2004 Member States under an EU accord known as the Burden-Sharing Agreement (see Figure 2.1).
The EU-27 does not have a Kyoto target: the protocol was ratified before 2004, and 12 countries became EU Member States after. Therefore, 10 of these EU-12 Member States have individual targets
under the KP, while Cyprus and Malta do not have targets.
Of the other EEA member countries, Iceland, Liechtenstein, Norway and Switzerland have individual targets under the KP; Turkey, which acceded to the KP in February 2009, has no quantified emission reduction commitment. Despite being an Annex I party to the UNFCCC, Turkey is not included in the KP's Annex B because it was not party to the UNFCCC when the KP was adopted (4). Cyprus and Malta also have no quantified emission reduction or limitation commitment. Both countries are parties to the KP; Malta became an Annex I party to the convention at the end of 2010, and in May 2011, Cyprus submitted a proposal to be added to the Annex (5). Croatia, which will join the EU in 2013, has an individual target under the KP.
(4) See also UNFCCC's KP target information online (UNFCCC, 2012a).(5) See also the Climate Change Policy & Practice project website (IISD, 2012).
2008–2012 emission targets and compliance under the Kyoto Protocol
20 Greenhouse gas emission trends and projections in Europe 2012
Figure 2.1 GHG emission targets in Europe under the KP (2008–2012) relative to base‑year emissions (absolute and relative)
Note: The final emission levels allocated to the EU and each Member State were established after completion of the reviews of the initial reports pursuant to Article 8 of the KP in 2008. To account for Denmark's exceptionally low base-year emissions compared to other years, Denmark received 5 million AAUs from the Union registry for the first commitment period under the KP (EC, 2010b).
Source: EEA, 2006; EC, 2006; EC, 2010b.
– 341
– 259
– 97
– 34
– 14
– 13
– 11
– 10
43
– 34
– 22
– 16
– 11
– 3.7
0.0
– 6.9
– 5.8
0.5
0.3
– 0.02
– 1.6
– 2.1
– 3.4
– 4.0
27
16
7.2
2.9
0.0
– 4.2
– 1.6
– 40
0
– 35
0
– 30
0
– 25
0
– 20
0– 15
0
– 10
0– 50 0 50 10
0
GHG emission target (Mt CO2-equivalent)
EU-15
Germany
United Kingdom
Italy
Denmark
Netherlands
Belgium
Austria
Luxembourg
Finland
France
Sweden
Ireland
Portugal
Greece
Spain
EU-12
Poland
Romania
Czech Republic
Bulgaria
Hungary
Slovakia
Lithuania
Estonia
Latvia
Slovenia
Cyprus (no target)
Malta (no target)
Other countries
Switzerland
Croatia
Liechtenstein
Iceland
Norway
Turkey (no target)
– 8.0
– 21.0
– 12.5
– 6.5
– 21
– 6.0
– 7.5
– 13.0
– 28.0
0.0
0.0
4.0
13.0
27.0
25.0
15.0
– 6.0
– 8.0
– 8.0
– 8.0
– 6.0
– 8.0
– 8.0
– 8.0
– 8.0
– 8.0
– 8.0
– 5.0
– 8.0
10.0
1.0
– 40
– 30
– 20
– 10 0 10 20 30
GHG emission target (%)
2.2 Achieving 2008–2012 objectives: the 'Kyoto compliance equation'
To comply with its objective under the KP, a party must keep its total GHG emissions during the five years of the KP's first commitment period (2008–2012)
within a specific emission budget. In other words, total GHG emissions during that period must remain equal to or below the party's assigned amount, which is the total quantity of valid Kyoto units it holds (within its registry). One Kyoto unit corresponds to 1 tonne of CO2-equivalent emissions.

2008–2012 emission targets and compliance under the Kyoto Protocol
21Greenhouse gas emission trends and projections in Europe 2012
Figure 2.2 Possible changes in an assigned amount under the KP
Note: AAU: assigned amount unit; CER: certified emission reduction; CDM: Clean Development Mechanism; ERU: emission reduction unit; JI: Joint Implementation; RMU: removal unit; LULUCF: Land Use, Land-Use Change and Forestry.
Source: EEA.
Each party's assigned amount is equal to:
• an initial assigned amount, determined according to the party's base-year emissions and its Kyoto target, and measured in AAUs;
• plus/minus any additional Kyoto units that the party has acquired from or transferred to other parties through the Kyoto mechanisms (certified emission reductions (CERs) from Clean Development Mechanism (CDM) projects, emission reduction units (ERUs) from Joint Implementation (JI) projects or AAUs from international emissions trading (IET) between governments);
• plus/minus any additional Kyoto units that the party has issued/cancelled for net removals/emissions from a LULUCF activity (removal units (RMUs)).
To comply with its Kyoto obligations, a party needs to satisfy a 'Kyoto compliance formula', which can be summarised as follows.
Therefore, to achieve its target, a party can act on two sides of the 'compliance equation':
• emissions: emissions can be limited or reduced by acting at national level;
• assigned amount: the assigned amount can be increased by acquiring additional Kyoto units at international level and by further enhancing CO2 removals from carbon sink activities.
Compliance of EU-15 Member States under the internal EU Burden-Sharing Agreement relies on the same principles, with each Member State's initial assigned amount being determined according to its individual burden-sharing target, instead of the – 8 % reduction target of the whole EU-15 under the KP.
After final emissions have been reported and reviewed for the entire commitment period, parties to the KP will have 100 days to undertake final transactions necessary to achieve compliance with their commitment (the 'true-up period'). A final Kyoto compliance assessment will therefore not be possible before the end of 2014 or beginning of 2015. The assessment presented in this report is based on preliminary and incomplete data for the commitment period. It gives an indication of countries' progress in relation to their emission reduction targets at the end of 2010, but cannot predict whether a country will finally be compliant.
'2008–2012 total GHG emissions' ≤ 'total Kyoto units'
With: 'total Kyoto units' = 'initial assigned amount (AAUs)' + 'use of flexible mechanisms
(AAUs + CERs + ERUs)' + 'carbon sink removals (RMUs)'
Assigned amount (permissible emissions
for the period 2008–2012)
Initially constituted of a quantityof Asigned Amount Units (initial AAUs)
determined by the Kyoto Protocol target(% of base-year emissions)
Transfer/sale of AAUs
Issuance of ERUs for jointimplementation (JI) projects
Acquisition of AAUs
ERUs from jointimplementation (JI) projects
CERs from Clean DevelopmentMechanism (CDM) projects
RMUs from LULUCFactivities
(if net sink)
Cancellation of AAUs
RMUs from LULUCFactivities
(if net source)
2008–2012 emission targets and compliance under the Kyoto Protocol
22 Greenhouse gas emission trends and projections in Europe 2012
2.3 Role of the EU Emission Trading System in the achievement of Kyoto targets
By setting cap levels under the EU ETS, Member States — as well as Liechtenstein and Norway — have shared the national effort required to reach their Kyoto target among the sectors covered by the EU ETS and the other sectors.
The EU ETS is a domestic EU policy which aims at achieving cost-efficient emission reductions by setting emission targets to operators (primarily of industrial installations and power plants) in the EU. Operators have a choice between reducing their own emissions, and purchasing carbon allowances (or CDM/JI credits) on the European carbon market whenever this is more cost-effective.
The EU ETS is linked to the flexible mechanisms under the KP. Any trading or transfer of EU allowance (EUA), which serve the purpose of proving compliance of an operator under the EU ETS, implies the transfer of an equal quantity of AAUs under the KP between Member States or within a Member State.
Following the introduction of the EU ETS and the finalisation of the second NAPs, Member States as well as Liechtenstein and Norway (who joined the ETS in 2008) have determined national caps for the emissions from sectors covered by the EU ETS for the first commitment period of the KP. These caps correspond to a certain number of Kyoto units being transformed into EU emission allowances and allocated/sold to EU ETS operators. In so doing, these countries have fixed the overall contribution of the EU ETS to reach their burden-sharing or Kyoto target, and they have indirectly determined the number of Kyoto units to remain for the other sectors not covered by the EU ETS (such as buildings, transport or agriculture). Hence, they have assigned themselves a 'non-ETS target' for 2008 to 2012, equivalent to their initial assigned amount reduced by the ETS cap that they have determined.
In other words, EU governments have split their Kyoto emission budgets into two: one budget is allocated to the sectors covered by the EU ETS, where total emissions are capped under EU law and the distribution of abatement measures among sources is determined by market forces within the trading
mechanism; the remaining budget is allocated to non-ETS sectors. Since national caps have been fixed for the 2008–2012 trading period of the EU ETS, the situation is as follows.
• Governments must reach their Kyoto or burden-sharing targets through emission reductions from policies and measures addressing the sectors not covered by the EU ETS and/or through flexible mechanisms. A country's progress towards its Kyoto target is therefore determined by comparing its emissions in non-ETS sectors with its emission budget for the non-ETS sectors.
• Emission levels in the sectors covered by the EU ETS result in the trading of allowances at EU ETS level, but do not influence the achievement by a Member State of its Kyoto or burden-sharing target (6), since EU ETS operators are legally bound to surrender to their government an amount of allowances equivalent to their emissions.
To comply with their Kyoto obligations, the EU-15, Member States, Liechtenstein and Norway must satisfy the following equation.
(6) There is one exception to this rule: allowances remaining in the NER at the end of the trading period that are not sold to the market might be used to achieve the national Kyoto target. Most Member States have not yet decided whether they intend to use any remaining allowances in the reserve, or auction them. Ireland reported the quantity of unused allowances they expect to remain in the NER, which is intended to be used towards achieving its burden-sharing target. Except for this country, it has been assumed in this report that all EUAs in all Member States will be used by the trading sector, and not be transferred back to national governments.
'2008–2012 non-ETS GHG emissions' ≤
'initial assigned amount' – 'allowances issued under the EU ETS' + 'use of flexible mechanisms at government level' + 'carbon
sink removals'
With: 'allowances issued under the EU ETS' = 'free allocation 2008–2012 EU ETS' + 'auctions/sales 2008–2012 EU ETS'.
This method is used in Chapter 1 to assess progress towards Kyoto and burden-sharing targets in Europe.
2.4 Increasing assigned amounts through flexible mechanisms and carbon sinks
The total quantity of valid emission allowances (Kyoto units) held by Member States within their national registry (their assigned amounts), and subsequently the target for the sectors that are not

2008–2012 emission targets and compliance under the Kyoto Protocol
23Greenhouse gas emission trends and projections in Europe 2012
covered by the EU ETS, can be modified using the following.
• The expected CO2 removals from carbon stock changes, under Article 3.3 and Article 3.4 of the KP. Information on the expected removals/emissions is reported by EU Member States in a specific questionnaire; actual use can be approximated from the annual LULUCF inventories under the KP.
• The Kyoto mechanisms at government level (JI, CDM and IET): information on the projected use of such mechanisms is reported by EU Member States in a specific questionnaire under the EU MMD.
2.4.1 Carbon sinks
In addition to policies and measures targeting sources of GHG emissions, Member States can use policies and measures to protect their existing terrestrial carbon stocks (e.g. by reducing deforestation and forest degradation, devegetation, and land degradation) and to further enhance terrestrial carbon stocks (e.g. by increasing the area or carbon density of forests by afforestation and reforestation, rehabilitating degraded forests, and altering the management of forest and agricultural lands to sequester more carbon in biomass and soil). These LULUCF activities include the following:
• afforestation, reforestation and deforestation since 1990 (mandatory activities covered by Article 3.3 of the KP), which encompass lands that have been subject to direct, human-induced conversion from a forest to a non-forest state, or vice versa;
• forest management (FM) (7), cropland management, grazing land management and revegetation (voluntary activities under Article 3.4 of the KP), which encompass lands that have not undergone conversion since 1990, but are otherwise subject to a specific land use.
Parties account for net emissions or removals for each activity during the commitment period by issuing RMUs in the case of net GHG removals from LULUCF activities, or cancelling Kyoto units in the case of net source of GHG emissions. LULUCF activities can therefore be used to compensate emissions from other sources if removals are higher than emissions from the sector are. The number
(7) The amount accountable for forest management is restricted by country-specific caps which are, in most cases, only a fraction of the anticipated uptake.
of RMUs that can be issued by each party under Article 3.4 'Activity forest management' is capped. Thus, issued RMUs corresponding to this activity might be lower than the carbon removals from forest management that are actually reported.
RMUs can be accounted for at the end of the first commitment period or annually. According to Decision 13/CMP.1, parties must indicate the frequency of accounting with their initial reports. For each activity under Article 3.3 and Article 3.4, parties may choose whether they want to account annually during the commitment period or only once at the end of this period. The decision on the frequency determines when parties may issue RMUs or cancel other units in the case of emissions from Article 3.3 and Article 3.4 activities. Of the countries assessed in this report, only Denmark, France, Hungary, Liechtenstein and Switzerland have opted for annual accounting.
With the use of actual accounted emissions from KP LULUCF activities and the intended LULUCF information of the questionnaires, substantial underestimation from net removals from Article 3.3 and Article 3.4 activities can be avoided. This means that actual accounted emissions from KP LULUCF activities were calculated according to the IPCC guidelines and the respective accounting rules for the Member States. One important rule relates to debit compensation under Article 3.3: if Member States have net emissions from Article 3.3 activities (Article 1 and Article 2) they can increase their FM cap by this amount of net emissions. The KP LULUCF accounting tables provide cumulative data for all years of the CP. Thus, these values were divided by the number of reported years except for forest management where the cap applies to five years, and therefore the total cap should be divided by five. However, no changes occur for intended LULUCF activities (see results in Table 3.2).
2.4.2 Kyoto mechanisms
As an additional means of meeting commitments under the KP, parties may use three market-based mechanisms to lower the overall costs of achieving emission targets for the commitment period from 2008 to 2012:
• project-based mechanisms in industrialised countries (JI);

2008–2012 emission targets and compliance under the Kyoto Protocol
24 Greenhouse gas emission trends and projections in Europe 2012
Figure 2.3 Target over‑delivery and surplus assigned amount
Source: EEA, 2010.
GHG emissions 2008–2012
Assigned amount by the end of 2008–2012
Unused units(surplus)
Units to be usedfor compliance
under Kyoto
Total emissions at the end of the
commitment period
'Over-delivery'
• CDM in developing countries; • IET, which allows countries that have achieved
emission reductions beyond those required by the KP to sell their surplus Kyoto units to countries finding it more difficult or expensive to meet their commitments.
Use of these mechanisms must be 'supplemental to domestic action' to achieve KP targets.
2.5 Implications of target over‑delivery by some EU‑15 Member States
A Member State that limits or reduces its domestic emissions below its assigned amount would hold an amount of unused AAUs (or other unit types) by the end of the commitment period (Figure 2.3).
By the end of the commitment period, a Kyoto unit held by a party within its national registry can be:
• transferred to another party's registry (e.g. under international emissions trading);
• 'retired', i.e. used towards meeting a Kyoto or burden-sharing commitment; or
• cancelled, i.e. this unit would not be further transferred or used towards meeting a Kyoto or burden-sharing commitment.
In addition, the KP allows parties holding surplus units by the end of the commitment period to request that these units (with the exception of RMUs (8)) be
(8) See Decision 13/CMP.1 16.of the Report of the Conference of the Parties (FCCC, 2006).(9) In the United Kingdom, the Carbon Accounting Regulations 2009 ensure that any carbon units, in the carbon credit account, in
excess of the United Kingdom's first carbon budget (which requires greater emissions reductions than the country's Kyoto target) are cancelled, and therefore are not used to offset GHG emissions in the United Kingdom or in any other country during the first commitment period.
carried over to the subsequent commitment period, subject to applicable rules. Without restriction, such banking may have considerable negative effects on the environmental integrity of a future climate agreement and on the comparability of efforts among Annex I parties.
If surplus AAUs held by an EU-15 Member State by the end of the commitment period are retired or transferred through the flexible mechanisms, to be subsequently retired either to another EU-15 Member State or to the European Union, the EU-15 would benefit from these AAUs; it would be able to fill any shortfall of units left by Member States not able to meet their burden-sharing target.
If surplus AAUs held by an EU-15 Member State by the end of the commitment period are transferred to another Party outside the EU-15, cancelled or banked for use in a subsequent commitment period, the EU-15 would not be able to benefit from these units for its compliance; the extent of the over-delivery currently projected would subsequently be reduced.
There is certainty that such a situation will occur in at least one EU-15 Member State for part of the potentially surplus AAUs (9), but other Member States could adopt similar strategies. As it cannot be taken for granted that any other EU-15 Member State will make surplus Kyoto units available to the EU-15 for its compliance, the EU-15 relies on each single EU-15 Member State to achieve its own burden-sharing target. Any Member State not complying with its target could lead to non-compliance for the EU-15 as well.
Any shortfall in emission reductions, in particular in the sectors not covered by the EU ETS, will have to be compensated for by the acquisition of additional Kyoto units through Kyoto mechanisms. The Kyoto mechanisms will, in practice, act as a safety valve: parties, under the KP, can undertake final transactions necessary to comply with their commitment during a 100-day period after 2008–2012 emissions have been reported in 2014 and reviewed by the UNFCCC (the 'true-up period').
Further details on the continuation of the Kyoto Protocol after 2012 and on the EU's commitment for a second commitment period are provided in Section 5.5.

25
Current progress towards 2008–2012 Kyoto targets
Greenhouse gas emission trends and projections in Europe 2012
3 Current progress towards 2008–2012 Kyoto targets
Twenty-five EU Member States (all except Cyprus and Malta), Croatia, Iceland, Liechtenstein, Norway and Switzerland have individual GHG reduction and limitation targets under the KP. By the end of 2011, after four years of the five-year first commitment period, almost all of these countries were individually on track towards their respective Kyoto targets. This compares favourably to assessments in previous years.
With the introduction of the EU Emissions Trading Scheme (ETS) in the EU, each national Kyoto target was split into a target for the ETS sectors (through the allocation of allowances linked to Kyoto units for the second trading period 2008–2012) and a target for emissions in the sectors not covered by the ETS.
The EU-15 is on track towards this 8 % reduction target, compared to base-year levels under the KP. The combined performance of all EU-15 Member States as regards their individual targets is equivalent to an overachievement of approximately 211 Mt CO2-equivalent per year (a quantity which represents 4.9 % of the EU-15's base year emissions).
Aggregated average non-ETS emissions from EU-15 Member States from 2008 to 2011 were lower than the relevant EU-15 target by 71.5 Mt CO2-equivalent per year, which represents 1.7 % of total EU-15 base-year emissions.
Carbon sink activities are expected to contribute towards an additional emission reduction of 58 Mt CO2-equivalent per year (1.4 % of EU-15 base-year emissions).
The use of the KP's flexible mechanisms by ten EU-15 Member States (Austria, Belgium, Denmark, Finland, Ireland, Italy, Luxembourg, the Netherlands, Portugal and Spain) is expected to increase the overall emission budget by 84 Mt CO2-equivalent per year (2.0 % of EU-15 base-year emissions). Altogether, nine of these Member States have planned to allocate financial resources with a total amount of EUR 2 890 million for the whole five year commitment period.
To ensure that the EU-15 reaches its common target, all of its Member States must achieve their respective burden-sharing target. Excess Kyoto units resulting from overachievement by some countries might not be available to the EU-15 for achieving compliance.
Italy is currently not on track towards its target, with a gap of 14.1 Mt CO2-equivalent per year. The average gap between domestic emissions in the non-ETS sectors and their corresponding target is currently not fully compensated by the expected contribution from carbon sink activities and the quantity of Kyoto units that the Italian Government expects to acquire under the flexible mechanisms to achieve its KP target. Although it did not put a threshold on the use of flexible mechanisms in its national climate change strategy, Italy has not reported any concrete plan to purchase more Kyoto units than those already envisaged. Furthermore, Italy is the only EU-15 Member State using flexible mechanisms that has not provided information as to the allocation of financial resources for using the Kyoto mechanisms.
Spain has a very small current shortfall of 0.1 Mt CO2-equivalent per year (0.03 % of base-year emissions). Such a gap could, for example, be bridged if non-ETS emissions were not to increase in 2012 compared to 2011 levels. Nevertheless, Spain faces the considerable challenge of fulfilling by 2015 its plan to acquire an average of 38.8 million units per year of the commitment period. Although the total projected quantities of credits from flexible mechanisms for the first commitment period increased from 159 to 194 million units compared to 2011, a concurrent rise in the budget was not reported. The reported budget of over EUR 400 million would currently be equivalent to a price of about EUR 2 per tonne of CO2.
The gaps currently observed in Italy and Spain may result in a potential shortfall of 14.2 Mt CO2-equivalent (0.3 % of the EU-15's base-year emissions). These gaps, if not addressed by early 2015, could hinder the EU-15 from achieving its target.

Current progress towards 2008–2012 Kyoto targets
26 Greenhouse gas emission trends and projections in Europe 2012
3.1 Total emission levels
National GHG inventories are available for the years 2008, 2009 and 2010, i.e. the three years of the first commitment period under the KP. With the approximated EU GHG inventory calculated by Member States and the EEA, emission data for 2011 are also available for all Member States, Switzerland and Norway.
In 19 of the 30 European countries which have a Kyoto target and are assessed in this report, average 2008–2011 GHG emissions were below the respective Kyoto target. Figure 3.1 compares Kyoto or burden-sharing targets (expressed in relative terms) and average 2008–2011 emissions in relation to base-year emissions. Within the EU-15, Austria, Luxembourg and Spain show the largest differences between their average total emissions and their respective targets.
This simple comparison between total emissions and targets is purely indicative, showing only how domestic emission levels compare with initial assigned amounts. However, it does not provide a full and accurate picture of the actual progress of countries towards their respective targets, because it does not reflect any change in Kyoto accounting units, i.e. the accounting side of the Kyoto compliance equation. In particular, it does not take into account the effect of the allocation of allowances under emissions trading schemes such as the EU ETS (10) on the assigned amounts that are available to achieve the Kyoto targets (see Section 2.3). Furthermore, the removal of atmospheric CO2 through LULUCF activities and
the use of Kyoto mechanisms may further modify the countries' assigned amounts and help countries achieve their targets.
3.2 Emission levels in the non‑ETS sectors
In this section, the analysis focuses only on domestic emission limitation and reductions achieved by European countries against their respective targets. This analysis is complemented in Section 3.4 by information on the planned use of flexible mechanisms and carbon sinks by governments.
As discussed in Section 2.3, an accurate assessment of current progress towards Kyoto targets in the EU must be based on a comparison of non-ETS emissions (calculated as the difference between total GHG emissions and verified emissions under the EU ETS during the 2008–2011 period) with the relevant 'non-ETS target' for Member States (calculated as the difference between AAUs and the quantity of allowances actually allocated — for free or sold — to operators under the EU ETS between 2008 and 2011).
By the end of 2011, six EU-15 Member States, nine EU-12 Member States and three EEA member countries had reached an average non-ETS emissions level below their respective average Kyoto targets (i.e. domestic emissions in the sectors not covered by the EU ETS) (see Figure 3.2).
For the EU-12 Member States, the current situation is mainly due to the substantial emission reductions
In Austria, Belgium, Portugal and Spain, the actual annual use of flexible mechanisms observed during the period 2008–2011 was less than half the intended annual use (for the full commitment period). Delivering on these plans corresponds to the need to purchase on average more than 4 million per year of the commitment period by each of these countries. Austria adopted in 2012 a plan to purchase on average 16 million Kyoto units per year of the commitment period, which represents a substantial increase compared to 2011. However, on average only 1.2 million units per year were actually delivered to Austria's Kyoto registry between 2008 and 2011.
Seven EU-12 Member States (Bulgaria, the Czech Republic, Estonia, Hungary, Latvia, Lithuania and Slovakia) have reported on their intention to sell a certain amount of Kyoto units to other parties.
Four other European countries (Liechtenstein, Norway, Slovenia and Switzerland) also intend to use the flexible mechanisms provided under the Kyoto Protocol to achieve their respective targets.
(10) All 27 EU Member States, Norway and Liechtenstein participate in the EU ETS. Switzerland has its own emissions trading scheme.
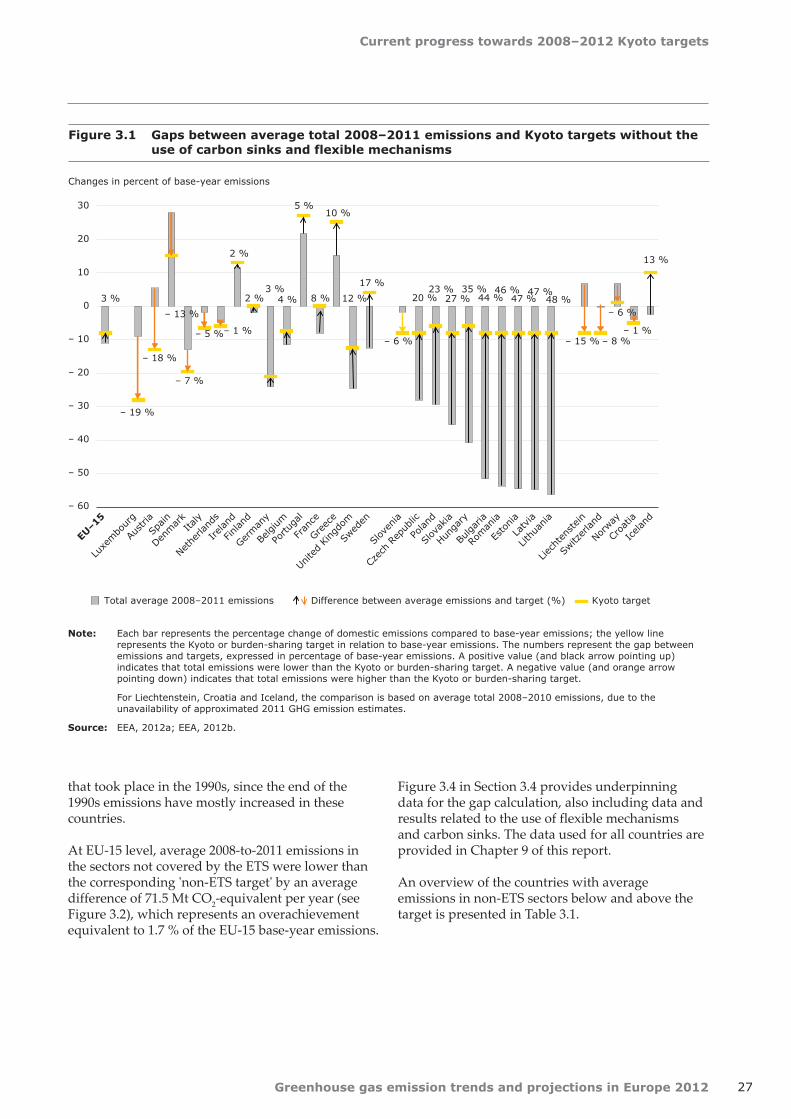
Current progress towards 2008–2012 Kyoto targets
27Greenhouse gas emission trends and projections in Europe 2012
Figure 3.1 Gaps between average total 2008–2011 emissions and Kyoto targets without the use of carbon sinks and flexible mechanisms
Note: Each bar represents the percentage change of domestic emissions compared to base-year emissions; the yellow line represents the Kyoto or burden-sharing target in relation to base-year emissions. The numbers represent the gap between emissions and targets, expressed in percentage of base-year emissions. A positive value (and black arrow pointing up) indicates that total emissions were lower than the Kyoto or burden-sharing target. A negative value (and orange arrow pointing down) indicates that total emissions were higher than the Kyoto or burden-sharing target.
For Liechtenstein, Croatia and Iceland, the comparison is based on average total 2008–2010 emissions, due to the unavailability of approximated 2011 GHG emission estimates.
Source: EEA, 2012a; EEA, 2012b.
that took place in the 1990s, since the end of the 1990s emissions have mostly increased in these countries.
At EU-15 level, average 2008-to-2011 emissions in the sectors not covered by the ETS were lower than the corresponding 'non-ETS target' by an average difference of 71.5 Mt CO2-equivalent per year (see Figure 3.2), which represents an overachievement equivalent to 1.7 % of the EU-15 base-year emissions.
Figure 3.4 in Section 3.4 provides underpinning data for the gap calculation, also including data and results related to the use of flexible mechanisms and carbon sinks. The data used for all countries are provided in Chapter 9 of this report.
An overview of the countries with average emissions in non-ETS sectors below and above the target is presented in Table 3.1.
Icelan
d
Croa
tia
Norway
Switz
erland
Liech
tens
tein
Lithu
ania
Latvia
Esto
nia
Roman
ia
Bulgar
ia
Hunga
ry
Slov
akia
Poland
Czec
h Re
public
Slov
enia
Swed
en
Unite
d King
dom
Greec
e
Fran
ce
Portu
gal
Belgium
German
y
Finland
Ireland
Nethe
rland
sIta
ly
Denmar
k
Spain
Austria
Luxe
mbo
urg
EU–1
5
Changes in percent of base-year emissions
Total average 2008–2011 emissions Difference between average emissions and target (%) Kyoto target
30
20
10
0
– 10
– 20
– 30
– 40
– 50
– 60
13 %
– 1 %
– 6 %
– 8 %– 15 %
48 %47 %
47 %46 %
44 %35 %
27 %23 %
20 %
– 6 %
17 %
12 %
10 %
8 %
5 %
4 %3 %
2 %
2 %
– 1 %– 5 %
– 7 %
– 13 %
– 18 %
– 19 %
3 %

Current progress towards 2008–2012 Kyoto targets
28 Greenhouse gas emission trends and projections in Europe 2012
Figure 3.2 Gap between average non‑ETS 2008–2011 emissions and Kyoto targets without the use of carbon sinks and flexible mechanisms
2.2
0.4
0.4
0.0
– 4.1
127.3
106.1
56.6
38.8
29.1
21.8
21.3
10.6
10.2
– 1.2
90.5
52.5
23.5
9.7
7.1
0.8
– 0.7
– 1.6
– 2.1
– 2.8
– 3.8
– 5.4
– 16.5
– 32.4
– 50.2
71.5
Norway
Croatia
Iceland
Liechtenstein
Switzerland
Poland
Romania
Bulgaria
Hungary
Czech Republic
Lithuania
Estonia
Latvia
Slovakia
Slovenia
United Kingdom
Germany
France
Sweden
Greece
Finland
Belgium
Portugal
Ireland
Luxembourg
Denmark
Netherlands
Austria
Italy
Spain
EU-15
EU-15 (no overachievement)
4.5
1.4
12.5
– 19.1
– 7.7
22.6
38.1
42.7
33.6
15.0
44.0
50.1
40.9
14.2
– 6.0
11.7
4.3
4.2
13.5
6.6
1.1
– 0.4
– 2.6
– 3.8
– 21.6
– 5.5
– 2.5
– 20.9
– 6.3
– 17.3
1.7
– 2.7
100 50 0 50 100 150 200
Mt CO2-equivalent
– 40 – 20 0 20 40 60
% of respective country's base-year emissions
– 115.5
Note: The data used in the calculations are presented in Table 9.1.
A positive value indicates that average 2008-to-2011 emissions in the non-ETS sectors were lower than the average annual target, taking into account the effect of allowances attributed to the EU ETS and without use of carbon sinks and Kyoto mechanisms.
Source: EEA, 2012a; EEA, 2012b, EEA, 2012d.

Current progress towards 2008–2012 Kyoto targets
29Greenhouse gas emission trends and projections in Europe 2012
3.3 Use of flexible mechanisms and LULUCF
Ten EU-15 Member States (Austria, Belgium, Denmark, Finland, Ireland, Italy, Luxembourg, the Netherlands, Portugal and Spain) intend to make use of flexible mechanisms under the Kyoto Protocol to achieve their burden-sharing target. Overall, the intended net acquisition of Kyoto units in the EU-15 amounts to 84 million units per year of the commitment period, or 2.0 % of base-year emissions. Theses countries have allocated financial resources for using the Kyoto mechanisms with a total amount of EUR 2 890 million for the whole 5-year commitment period. Seven EU-12 Member States (Bulgaria, the Czech Republic, Estonia, Hungary,
Table 3.1 Current progress towards Kyoto or burden‑sharing targets based on historic domestic GHG emissions (no use of flexible mechanisms or LULUCF)
Country grouping Average 2008–2011 emissions in sectors not covered by the EU ETS
< Target for sectors not covered by the
EU ETS
Average 2008–2011 emissions in sectors not covered by the EU ETS
> Target for sectors not covered by the
EU ETS
EU-15 EU-15 Finland France Germany Greece Sweden United Kingdom
EU-15 (no overachievement) Austria Belgium Denmark Ireland Italy Luxembourg Netherlands Portugal Spain
EU-12 Member States Bulgaria Czech Republic Estonia Hungary Latvia Lithuania Poland Romania Slovakia
Slovenia
Other EEA member countries, EU candidate country
Iceland (*) (**) Croatia (*) (**) Liechtenstein (**) Norway
Switzerland (*)
Note: (*) assessment based on total emissions (no allocation under the EU ETS) (**) assessment based on average 2008–2010 emissions (no approximated 2011 GHG estimates available). Target = [average annual Kyoto or burden-sharing target – average annual allocation in the EU ETS between 2008 and 2011], excluding planned use of Kyoto mechanisms by governments and carbon sinks. The Kyoto or burden-sharing target corresponds to the initial assigned amount of each country. Allocation: allowances freely allocated or auctioned to the EU ETS in the years from 2008 to 2011. 'EU-15 (no overachievement)' corresponds to the situation of the EU-15 where all surplus AAUs from target overachievement in the EU‑15 are not taken into account, to reflect the possibility that Member States with a surplus could use any remaining allowances for their own purposes, and not necessarily make them available to compensate for Member States with a shortfall.
Source: EEA, 2012a; EEA, 2012b, EEA, 2012d.
Latvia, Lithuania and Slovakia) have reported on their intention to sell a certain amount of Kyoto units to other parties.
The expected effect of LULUCF in the EU-15 corresponds to the average removal of an actual 58 Mt CO2 per year of the commitment period (around 1.4 % of EU-15 base-year emissions (see Table 9.1)).
3.3.1 Carbon sinks
The intended annual GHG removals/emissions from LULUCF activities as reported by EU and EEA Member States (for the CP) and the actual
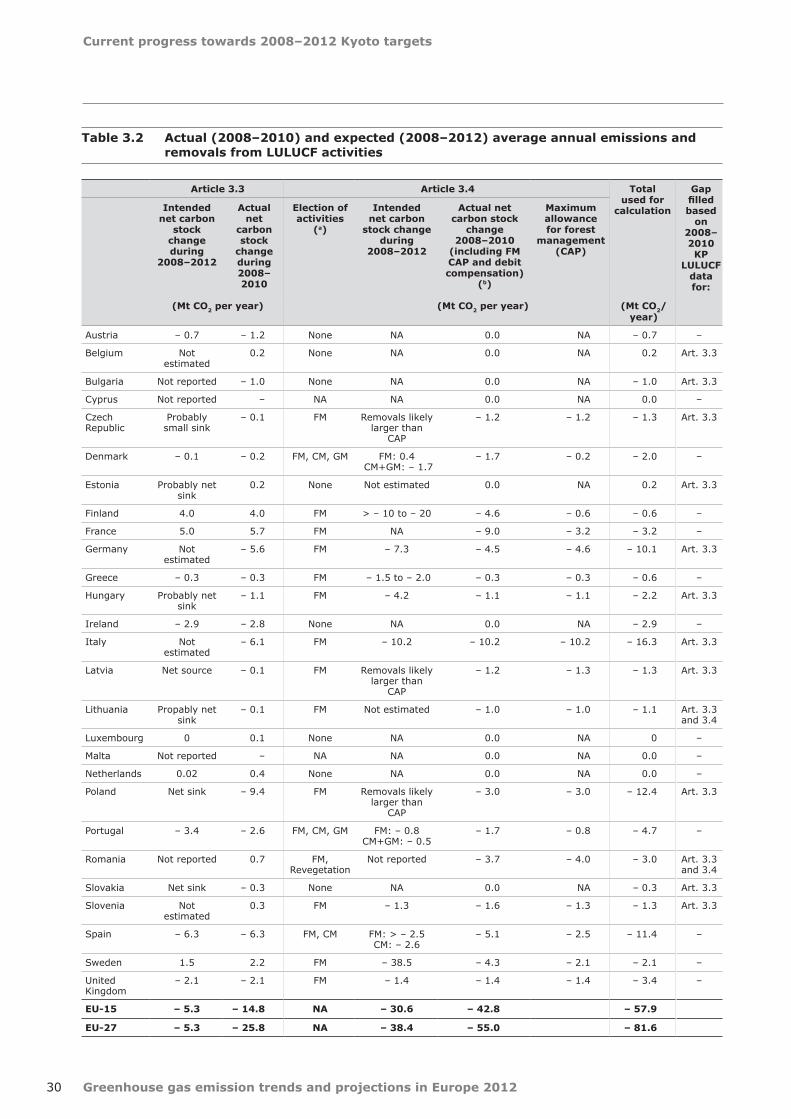
Current progress towards 2008–2012 Kyoto targets
30 Greenhouse gas emission trends and projections in Europe 2012
Article 3.3 Article 3.4 Total used for
calculation
Gap filled based
on 2008–2010 KP
LULUCF data for:
Intended net carbon
stock change during
2008–2012
Actual net
carbon stock
change during 2008–2010
Election of activities
(a)
Intended net carbon
stock change during
2008–2012
Actual net carbon stock
change 2008–2010
(including FM CAP and debit compensation)
(b)
Maximum allowance for forest
management (CAP)
(Mt CO2 per year) (Mt CO2 per year) (Mt CO2/ year)
Austria – 0.7 – 1.2 None NA 0.0 NA – 0.7 –
Belgium Not estimated
0.2 None NA 0.0 NA 0.2 Art. 3.3
Bulgaria Not reported – 1.0 None NA 0.0 NA – 1.0 Art. 3.3
Cyprus Not reported – NA NA 0.0 NA 0.0 –
Czech Republic
Probably small sink
– 0.1 FM Removals likely larger than
CAP
– 1.2 – 1.2 – 1.3 Art. 3.3
Denmark – 0.1 – 0.2 FM, CM, GM FM: 0.4 CM+GM: – 1.7
– 1.7 – 0.2 – 2.0 –
Estonia Probably net sink
0.2 None Not estimated 0.0 NA 0.2 Art. 3.3
Finland 4.0 4.0 FM > – 10 to – 20 – 4.6 – 0.6 – 0.6 –
France 5.0 5.7 FM NA – 9.0 – 3.2 – 3.2 –
Germany Not estimated
– 5.6 FM – 7.3 – 4.5 – 4.6 – 10.1 Art. 3.3
Greece – 0.3 – 0.3 FM – 1.5 to – 2.0 – 0.3 – 0.3 – 0.6 –
Hungary Probably net sink
– 1.1 FM – 4.2 – 1.1 – 1.1 – 2.2 Art. 3.3
Ireland – 2.9 – 2.8 None NA 0.0 NA – 2.9 –
Italy Not estimated
– 6.1 FM – 10.2 – 10.2 – 10.2 – 16.3 Art. 3.3
Latvia Net source – 0.1 FM Removals likely larger than
CAP
– 1.2 – 1.3 – 1.3 Art. 3.3
Lithuania Propably net sink
– 0.1 FM Not estimated – 1.0 – 1.0 – 1.1 Art. 3.3 and 3.4
Luxembourg 0 0.1 None NA 0.0 NA 0 –
Malta Not reported – NA NA 0.0 NA 0.0 –
Netherlands 0.02 0.4 None NA 0.0 NA 0.0 –
Poland Net sink – 9.4 FM Removals likely larger than
CAP
– 3.0 – 3.0 – 12.4 Art. 3.3
Portugal – 3.4 – 2.6 FM, CM, GM FM: – 0.8 CM+GM: – 0.5
– 1.7 – 0.8 – 4.7 –
Romania Not reported 0.7 FM, Revegetation
Not reported – 3.7 – 4.0 – 3.0 Art. 3.3 and 3.4
Slovakia Net sink – 0.3 None NA 0.0 NA – 0.3 Art. 3.3
Slovenia Not estimated
0.3 FM – 1.3 – 1.6 – 1.3 – 1.3 Art. 3.3
Spain – 6.3 – 6.3 FM, CM FM: > – 2.5 CM: – 2.6
– 5.1 – 2.5 – 11.4 –
Sweden 1.5 2.2 FM – 38.5 – 4.3 – 2.1 – 2.1 –
United Kingdom
– 2.1 – 2.1 FM – 1.4 – 1.4 – 1.4 – 3.4 –
EU‑15 – 5.3 – 14.8 NA – 30.6 – 42.8 – 57.9
EU‑27 – 5.3 – 25.8 NA – 38.4 – 55.0 – 81.6
Table 3.2 Actual (2008–2010) and expected (2008–2012) average annual emissions and removals from LULUCF activities

Current progress towards 2008–2012 Kyoto targets
31Greenhouse gas emission trends and projections in Europe 2012
values as reported in the LULUCF inventories under the KP for the period from 2008 until 2010 are presented in Table 3.2 (11). Only 14 countries reported estimates for Article 3.3 and — if elected — Article 3.4 activities. To avoid substantial underestimation from net removals from Article 3.3 and Article 3.4 activities, gap filling has been applied for those countries that do not provide estimates in their questionnaires under the respective article. Gap filling is most important for Article 3.3; for Article 3.4, the forest management cap is used for
most countries because both the intended and the actual carbon sequestration from forest management are very often higher than the cap. For this reason, the assessment of actual progress towards Kyoto targets is based on the gap filled data as provided in Table 3.2. This represents a new methodological improvement compared to previous years where no gap filling was made. Differences between the sum of Article 3.3 and Article 3.4 activities and the totals used for calculation occur for Member States such as Austria, Luxembourg and the Netherlands, due
(11) Estimated 'actual' annual accounting during the first commitment period is based on latest KP LULUCF submissions (updated May 2012). All LULUCF accounting rules have been applied in the calculation of the actual use of LULUCF (see application of the cap for Forest Management as contained in the appendix to decision 16/CMP.1).
Note: Consistent with the reporting of emission inventories, a negative sign '-' is used for removals and a positive sign '+' for emissions. NA: not applicable; NE: not estimated.
FM: Forest Management; CM: Cropland Management; GM: Grazing Land Management.
If Parties have net emissions from activities under Article 3.3 (afforestation and deforestation), they can increase their FM cap by this amount of net emissions. This is the case for Sweden, Finland, France (to a smaller extent in Romania, Netherlands, Belgium, Slovenia).
The sum for EU-15 and EU-27 includes emissions and removals from Article 3.4 actvities as indicated by Member States with application of the cap for Forest Management. Note that adding the net carbon stock changes resulting from Article 3.3 and Article 3.4 activities during the period from 2008 to 2012 does not result in their totals for EU-15 and EU-27, as net emissions from Article 3.3 in Finland and Sweden could be completely compensated with net removals from Article 3.4 in these Member States.
In addition to accounting for forest management up to the maximum allowance, Parties may account for removals from forest management to compensate net emissions under Art. 3.3. In Finland and Sweden, removals from forest management are projected to exceed the sum of emissions under Art. 3.3 and the maximum allowance for forest management.
According to Art. 3.3 and 3.4, Denmark, France and Hungary have decided to choose the annual accounting.
For Switzerland, the intended net carbon stock change during 2008–2012 is in range from – 0.6 up to – 1.8 Mt CO2-equivalent.
Source: EEA, 2012b; 2008–2010 data on LULUCF reported under the KP, 2012.
Table 3.2 Actual (2008–2010) and expected (2008–2012) average annual emissions and removals from LULUCF activities (cont.)
Article 3.3 Article 3.4 Total used for
calculation
Gap filled based
on 2008–2010 KP
LULUCF data for:
Intended net carbon
stock change during
2008–2012
Actual net
carbon stock
change during 2008–2010
Election of activities
(a)
Intended net carbon
stock change during
2008–2012
Actual net carbon stock
change 2008–2010
(including FM CAP and debit compensation)
(b)
Maximum allowance for forest
management (CAP)
(Mt CO2 per year) (Mt CO2 per year) (Mt CO2/ year)
Further EEA member countries
Croatia Not estimated separately
0.1 FM – 1.0 – 1.0 – 1.0 – 1.0 Art. 3.3
Iceland Not reported separately
– 0.2 Revegetation – 0.3 – 0.2 NA – 0.4 Art. 3.3
Liechtenstein Not reported 0.0 None 0 0.0 – 0.0 0.0 Art. 3.3
Norway 0 0.7 FM 0 – 1.5 – 1.5 0.0 Art. 3.3
Switzerland 0.2 0.2 FM Range – 0.6 to – 1.8
– 0.9 – 1.8 – 1.6 –

Current progress towards 2008–2012 Kyoto targets
32 Greenhouse gas emission trends and projections in Europe 2012
to differences in the reporting of the intended and actual net carbon stock change under Article 3.3.
Data quality on the actual account of CO2 emissions/removals from LULUCF has been rather poor in the last years, as land use inventories were typically only conducted every few years; the estimates of the actual emissions/removals might therefore undergo substantial changes in future inventory submissions. Nevertheless with the 2012 inventory submission, the data quality of the LULUCF inventories under the KP has improved considerably. Data reported under Article 3.3 and Article 3.4 in common reporting format (CRF) tables are more consolidated, and since the CRF tables represent three years of the first commitment period, this makes up three-fifths of the final result.
The total net removals from 3.3 and 3.4 activities expected in the EU seem to be substantially underestimated because few Member States provided estimates in the questionnaire.
• The total EU-27 intended net removals from Article 3.3 activities from questionnaires (2011 and updated 2012 questionnaires) amount to – 5 Mt CO2 per year. If the 2012 KP LULUCF submissions (the accounting quantities for the period) are used, the net sink amounts to – 26 Mt CO2 per year (average amount for 2008-to-2012 period).
• The total EU-27 intended net removals from Article 3.4 activities from questionnaires amount to – 38 Mt CO2-equivalent per year, whereas the net sink amounts to – 55 Mt CO2-equivalent per year if the 2012 KP-LULUCF submissions are considered. For these activities, the accounting quantities of forest management, cropland management, grazing land management and revegetation are considered, as described in Section 2.4.1. To account removals under forest management activities, the allocation period of five years, together with the offset maximum of CO2 sinks from forest management up to a country-specific upper limit (cap) have been taken into account.
Taking into account the gap filling described, the total accounting quantity of removals amounts to 58 Mt CO2-equivalent per year for the EU-15 and 82 Mt CO2-equivalent for the EU-27. The largest removals from actual LULUCF activities have been reported by Italy (16 Mt CO2), Poland (12 Mt CO2), Spain (11 Mt CO2) and Germany (10 Mt CO2) whereas net sources from this sector have been reported by Belgium, Estonia, Luxembourg and the Netherlands.
3.3.2 Kyoto mechanisms
In 2012, twelve countries (Austria, Belgium, France, Finland, Germany, Ireland, Italy, Lithuania, Slovakia, Spain, Switzerland and the United Kingdom) updated information on their planned use of Kyoto mechanisms with the submission of their questionnaires in 2012. France, Germany, Lithuania, Slovakia and the United Kingdom have not reported on any intention to use Kyoto mechanisms at governmental level and have not reported on any sale of units under the EU Monitoring Mechanism to date.
Ten EU-15 Member States have planned to buy a total of 419 million Kyoto units for the whole commitment period (83.8 million units per year of the commitment period, which represents 2.0 % of EU-15 base-year emissions). Nine of these Member States have reported information on allocated financial resources for using the Kyoto mechanisms, with a total of EUR 2 970 for the whole first commitment period. Spain, Austria and the Netherlands are the countries (in decreasing order) that intend to acquire the largest quantities of units (194, 80 and 50 million units for the whole period, respectively). These three countries have also allocated the largest financial resources for using the Kyoto mechanisms (EUR 611 million for Austria, EUR 500 million for the Netherlands and EUR 382 million for Spain). Italy has not reported any information on financial allocation for the use of flexible mechanisms.
Compared to 2011, Austria and Spain have significantly increased the amount of Kyoto units they intend to use to achieve their Kyoto objectives. However, Spain did not report on any change in the overall budget amount for AAUs acquisition between 2008 and 2012 (over EUR 400 million). Such budget might not be sufficient to cover the intended acquisition of all 194 million Kyoto units.
In the EU-12, most Member States are in a situation of net sellers of Kyoto units, due to the significant emission reductions which occurred in the 1990s with the transition to market economies, compared to their Kyoto reduction targets. Compared to last year, Lithuania increased considerably the amount of Kyoto units it is planning to sell, while Slovakia decreased theirs.
A comparison of the intended use of Kyoto mechanisms (annual average during the commitment period based on reported questionnaires) with the actual use of these mechanisms (annual average for the period 2008–2011, based on the quantities of allowances delivered to the Member States' holding account in their Kyoto registries) shows for some
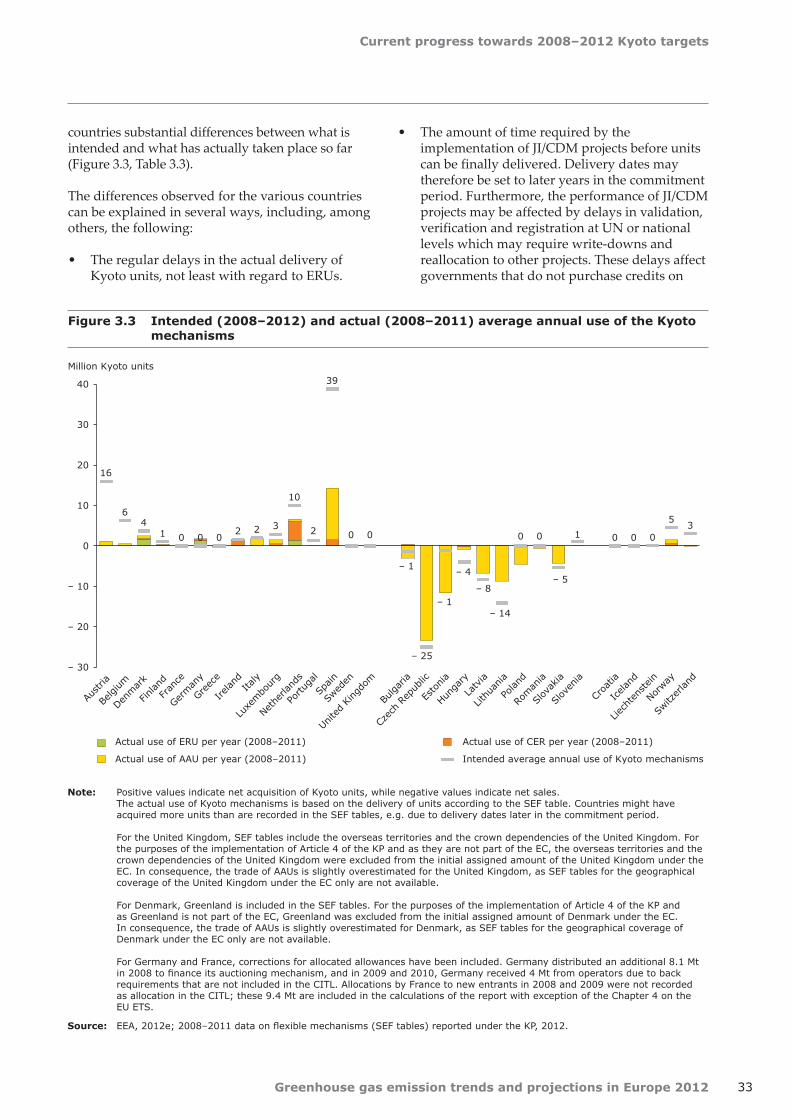
Current progress towards 2008–2012 Kyoto targets
33Greenhouse gas emission trends and projections in Europe 2012
Figure 3.3 Intended (2008–2012) and actual (2008–2011) average annual use of the Kyoto mechanisms
Note: Positive values indicate net acquisition of Kyoto units, while negative values indicate net sales. The actual use of Kyoto mechanisms is based on the delivery of units according to the SEF table. Countries might have acquired more units than are recorded in the SEF tables, e.g. due to delivery dates later in the commitment period. For the United Kingdom, SEF tables include the overseas territories and the crown dependencies of the United Kingdom. For the purposes of the implementation of Article 4 of the KP and as they are not part of the EC, the overseas territories and the crown dependencies of the United Kingdom were excluded from the initial assigned amount of the United Kingdom under the EC. In consequence, the trade of AAUs is slightly overestimated for the United Kingdom, as SEF tables for the geographical coverage of the United Kingdom under the EC only are not available. For Denmark, Greenland is included in the SEF tables. For the purposes of the implementation of Article 4 of the KP and as Greenland is not part of the EC, Greenland was excluded from the initial assigned amount of Denmark under the EC. In consequence, the trade of AAUs is slightly overestimated for Denmark, as SEF tables for the geographical coverage of Denmark under the EC only are not available. For Germany and France, corrections for allocated allowances have been included. Germany distributed an additional 8.1 Mt in 2008 to finance its auctioning mechanism, and in 2009 and 2010, Germany received 4 Mt from operators due to back requirements that are not included in the CITL. Allocations by France to new entrants in 2008 and 2009 were not recorded as allocation in the CITL; these 9.4 Mt are included in the calculations of the report with exception of the Chapter 4 on the EU ETS.
Source: EEA, 2012e; 2008–2011 data on flexible mechanisms (SEF tables) reported under the KP, 2012.
countries substantial differences between what is intended and what has actually taken place so far (Figure 3.3, Table 3.3).
The differences observed for the various countries can be explained in several ways, including, among others, the following:
• The regular delays in the actual delivery of Kyoto units, not least with regard to ERUs.
• The amount of time required by the implementation of JI/CDM projects before units can be finally delivered. Delivery dates may therefore be set to later years in the commitment period. Furthermore, the performance of JI/CDM projects may be affected by delays in validation, verification and registration at UN or national levels which may require write-downs and reallocation to other projects. These delays affect governments that do not purchase credits on
16
64
1 0 0 02 2 3
10
2
39
0 0
– 1
– 25
– 1
– 4
– 8
– 14
0 0
– 5
1 0 0 0
53
– 30
– 20
– 10
0
10
20
30
40
Austria
Belgium
Denmar
k
Finland
Fran
ce
German
y
Greec
e
Ireland
Italy
Luxe
mbo
urg
Nethe
rland
s
Portu
gal
Spain
Swed
en
Unite
d King
dom
Bulgar
ia
Czec
h Re
public
Esto
nia
Hunga
ry
Latvia
Lithu
ania
Poland
Roman
ia
Slov
akia
Slov
enia
Croa
tia
Icelan
d
Liech
tens
tein
Norway
Switz
erland
Million Kyoto units
Actual use of ERU per year (2008–2011) Actual use of CER per year (2008–2011)
Actual use of AAU per year (2008–2011) Intended average annual use of Kyoto mechanisms

Current progress towards 2008–2012 Kyoto targets
34 Greenhouse gas emission trends and projections in Europe 2012
the secondary market but rather participate in project development from an early stage.
• The possibility that purchased and delivered units are not always held on national holding accounts. For example, in Austria, the institution authorised to purchase units for the government keeps the delivered units on its account until the final retirement.
• Some countries' possible preference for waiting until the end of the commitment period to use the flexible mechanisms and acquire Kyoto units, depending on their current progress towards their targets. It should also be noted that Member States may purchase secondary credits until after the end of the commitment period, all the way up to the end of the true-up period (12)
Note: (a) IET: International Emissions Trading; JI: Joint Implementation; CDM: Clean Development Mechanism
The total budget calculated for the EU‑15 and the EU‑27 do not include the expected benefits of AAU sales.
Italy reported that it can buy up to 14.9 Mt of CERs/ERUs in order to comply with the supplementarity principle and that no limitation is foreseen for AAUs.
Spain reported that it does not expect the top of 194 Mt CO2-equivalent to be taken as a limiting value but as a value that may evolve together with the future needs (up or down).
N.A. not applicable.
Table 3.3 Actual (2008–2011) and planned (2008–2012) average annual Kyoto units from flexible mechanisms
Member State Planned use of Kyoto
mechanisms
Type of Kyoto
mechanisms (IET, CDM,
JI) (a)
Achievement of Kyoto target
planned through domestic
action only
Actual use of flexible
mechanisms (AAUs, CERs + ERUs) at
government level
Intended use of flexible
mechanisms (AAUs, CERs + ERUs) at
government level
Actual vs. intended
use
Allocated budget (if intended
acquisition)
(Mt CO2‑equivalent per
year, 2008–2011)
(Mt CO2‑equivalent per
year, 2008–2012)
(%) (EUR million, 2008–2012)
Austria Yes IET, JI, CDM No 1.2 16.0 7 % 611
Belgium Yes IET, JI, CDM No 0.6 6.3 9 % 276
Bulgaria No – Yes – 2.7 – 1.4 – –
Cyprus N.A. N.A. N.A. N.A. N.A. N.A. N.A.
Czech Republic No – Yes – 23.5 – 25.0 – –
Denmark Yes IET, JI, CDM No 2.5 3.7 67 % 217
Estonia No – Yes – 11.6 – 1.2 – –
Finland Yes JI, CDM No 0.3 1.0 32 % 80
France No – Yes – 0.2 – – –
Germany No – Yes 1.6 – – –
Greece No – Yes – 0.3 – – –
Hungary No – Yes – 0.8 – 4.0 – –
Ireland Yes IET, JI, CDM No 1.6 1.6 101 % 290
Italy Yes IET, JI, CDM No 1.8 2.0 – Not reported
Latvia No – Yes – 6.8 – 8.4 – –
Lithuania Yes JI Yes – 8.7 – 14.1 – –
Luxembourg Yes IET, JI, CDM No 1.5 2.9 51 % 250
Malta N.A. N.A. N.A. N.A. N.A. N.A. N.A.
Netherlands Yes IET, JI, CDM No 6.6 10.0 66 % 500
Poland No – Yes – 4.4 – – –
Portugal Yes IET, JI, CDM No 0.0 1.5 0 % 106
Romania No – Yes – 0.4 – – –
Slovakia No – Yes – 4.3 – 5.4 – –
Slovenia Yes IET, JI, CDM No 0.0 1.0 0 % 80
Spain Yes IET, JI, CDM No 14.3 38.8 37 % 382
Sweden No – Yes 0.1 – – 178
United Kingdom No – Yes 0.2 – – –
EU‑15 Yes IET, JI, CDM No 31.8 83.8 38 % 2 890
EU‑27 Yes IET, JI, CDM No – 31.5 25.3 – 2 970
(12) The true-up period is a 100-day period after final emissions have been reported for the commitment period, during which parties have the opportunity to undertake final transactions necessary to achieve compliance with their commitments.
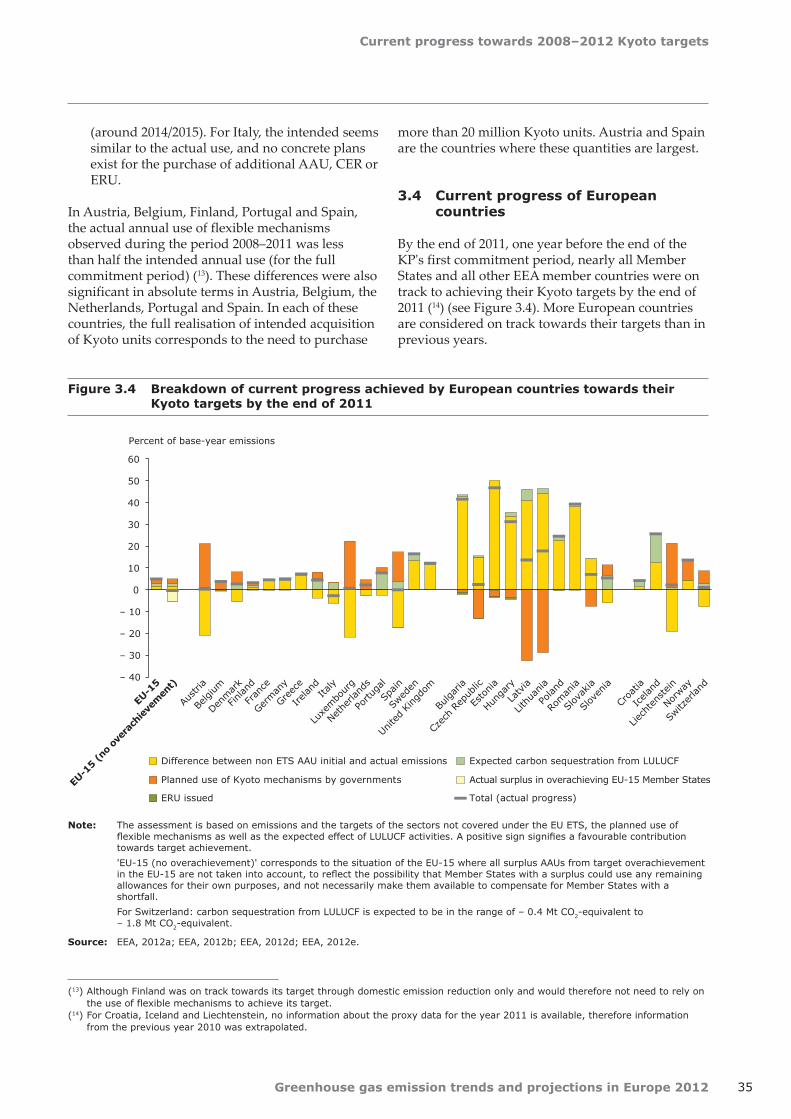
Current progress towards 2008–2012 Kyoto targets
35Greenhouse gas emission trends and projections in Europe 2012
(13) Although Finland was on track towards its target through domestic emission reduction only and would therefore not need to rely on the use of flexible mechanisms to achieve its target.
(14) For Croatia, Iceland and Liechtenstein, no information about the proxy data for the year 2011 is available, therefore information from the previous year 2010 was extrapolated.
(around 2014/2015). For Italy, the intended seems similar to the actual use, and no concrete plans exist for the purchase of additional AAU, CER or ERU.
In Austria, Belgium, Finland, Portugal and Spain, the actual annual use of flexible mechanisms observed during the period 2008–2011 was less than half the intended annual use (for the full commitment period) (13). These differences were also significant in absolute terms in Austria, Belgium, the Netherlands, Portugal and Spain. In each of these countries, the full realisation of intended acquisition of Kyoto units corresponds to the need to purchase
more than 20 million Kyoto units. Austria and Spain are the countries where these quantities are largest.
3.4 Current progress of European countries
By the end of 2011, one year before the end of the KP's first commitment period, nearly all Member States and all other EEA member countries were on track to achieving their Kyoto targets by the end of 2011 (14) (see Figure 3.4). More European countries are considered on track towards their targets than in previous years.
Figure 3.4 Breakdown of current progress achieved by European countries towards their Kyoto targets by the end of 2011
Note: The assessment is based on emissions and the targets of the sectors not covered under the EU ETS, the planned use of flexible mechanisms as well as the expected effect of LULUCF activities. A positive sign signifies a favourable contribution towards target achievement.
'EU-15 (no overachievement)' corresponds to the situation of the EU-15 where all surplus AAUs from target overachievement in the EU‑15 are not taken into account, to reflect the possibility that Member States with a surplus could use any remaining allowances for their own purposes, and not necessarily make them available to compensate for Member States with a shortfall.
For Switzerland: carbon sequestration from LULUCF is expected to be in the range of – 0.4 Mt CO2-equivalent to – 1.8 Mt CO2-equivalent.
Source: EEA, 2012a; EEA, 2012b; EEA, 2012d; EEA, 2012e.
– 40
– 30
– 20
– 10
0
10
20
30
40
50
60
Percent of base-year emissions
EU-1
5
EU-1
5 (n
o ov
erac
hiev
emen
t)
Austria
Belgium
Denmar
k
Finland
Fran
ce
German
y
Greec
e
Ireland
Italy
Luxe
mbo
urg
Nethe
rland
s
Portu
gal
Spain
Swed
en
Unite
d King
dom
Bulgar
ia
Czec
h Re
public
Esto
nia
Hunga
ry
Latvia
Lithu
ania
Poland
Roman
ia
Slov
akia
Slov
enia
Croa
tia
Icelan
d
Liech
tens
tein
Norway
Switz
erland
Difference between non ETS AAU initial and actual emissions Expected carbon sequestration from LULUCF
Planned use of Kyoto mechanisms by governments Actual surplus in overachieving EU-15 Member States
ERU issued Total (actual progress)
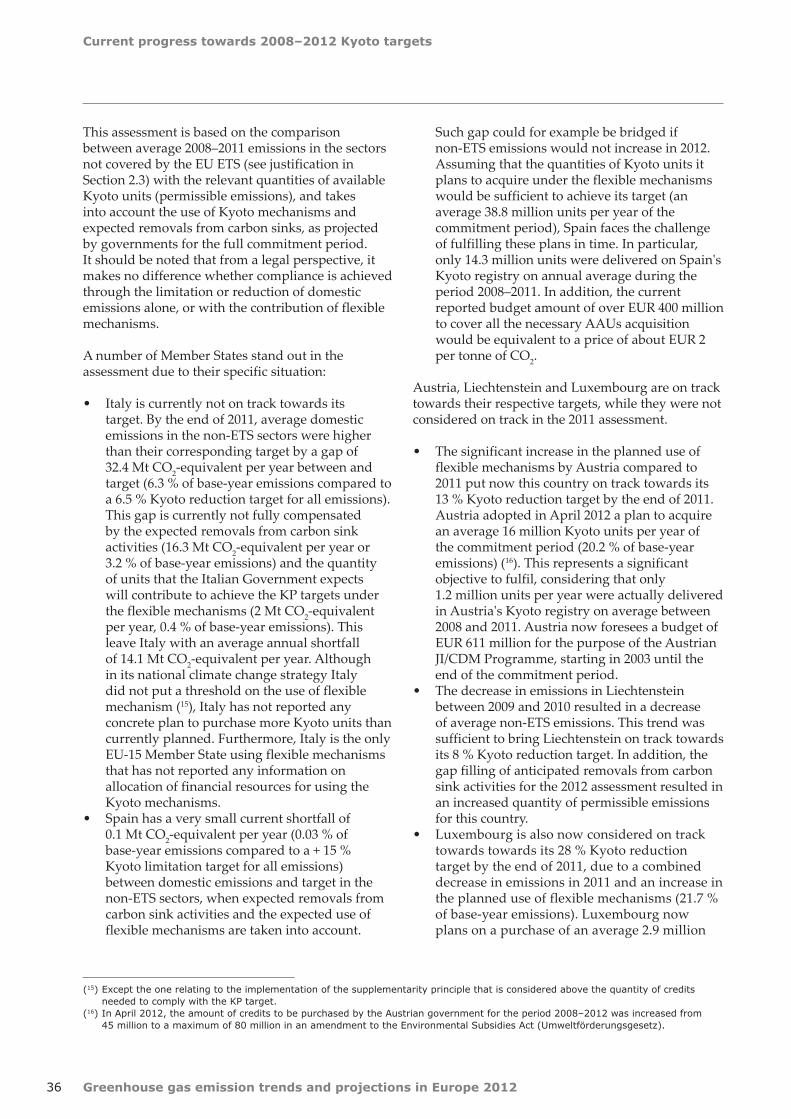
Current progress towards 2008–2012 Kyoto targets
36 Greenhouse gas emission trends and projections in Europe 2012
This assessment is based on the comparison between average 2008–2011 emissions in the sectors not covered by the EU ETS (see justification in Section 2.3) with the relevant quantities of available Kyoto units (permissible emissions), and takes into account the use of Kyoto mechanisms and expected removals from carbon sinks, as projected by governments for the full commitment period. It should be noted that from a legal perspective, it makes no difference whether compliance is achieved through the limitation or reduction of domestic emissions alone, or with the contribution of flexible mechanisms.
A number of Member States stand out in the assessment due to their specific situation:
• Italy is currently not on track towards its target. By the end of 2011, average domestic emissions in the non-ETS sectors were higher than their corresponding target by a gap of 32.4 Mt CO2-equivalent per year between and target (6.3 % of base-year emissions compared to a 6.5 % Kyoto reduction target for all emissions). This gap is currently not fully compensated by the expected removals from carbon sink activities (16.3 Mt CO2-equivalent per year or 3.2 % of base-year emissions) and the quantity of units that the Italian Government expects will contribute to achieve the KP targets under the flexible mechanisms (2 Mt CO2-equivalent per year, 0.4 % of base-year emissions). This leave Italy with an average annual shortfall of 14.1 Mt CO2-equivalent per year. Although in its national climate change strategy Italy did not put a threshold on the use of flexible mechanism (15), Italy has not reported any concrete plan to purchase more Kyoto units than currently planned. Furthermore, Italy is the only EU-15 Member State using flexible mechanisms that has not reported any information on allocation of financial resources for using the Kyoto mechanisms.
• Spain has a very small current shortfall of 0.1 Mt CO2-equivalent per year (0.03 % of base-year emissions compared to a + 15 % Kyoto limitation target for all emissions) between domestic emissions and target in the non-ETS sectors, when expected removals from carbon sink activities and the expected use of flexible mechanisms are taken into account.
Such gap could for example be bridged if non-ETS emissions would not increase in 2012. Assuming that the quantities of Kyoto units it plans to acquire under the flexible mechanisms would be sufficient to achieve its target (an average 38.8 million units per year of the commitment period), Spain faces the challenge of fulfilling these plans in time. In particular, only 14.3 million units were delivered on Spain's Kyoto registry on annual average during the period 2008–2011. In addition, the current reported budget amount of over EUR 400 million to cover all the necessary AAUs acquisition would be equivalent to a price of about EUR 2 per tonne of CO2.
Austria, Liechtenstein and Luxembourg are on track towards their respective targets, while they were not considered on track in the 2011 assessment.
• The significant increase in the planned use of flexible mechanisms by Austria compared to 2011 put now this country on track towards its 13 % Kyoto reduction target by the end of 2011. Austria adopted in April 2012 a plan to acquire an average 16 million Kyoto units per year of the commitment period (20.2 % of base-year emissions) (16). This represents a significant objective to fulfil, considering that only 1.2 million units per year were actually delivered in Austria's Kyoto registry on average between 2008 and 2011. Austria now foresees a budget of EUR 611 million for the purpose of the Austrian JI/CDM Programme, starting in 2003 until the end of the commitment period.
• The decrease in emissions in Liechtenstein between 2009 and 2010 resulted in a decrease of average non-ETS emissions. This trend was sufficient to bring Liechtenstein on track towards its 8 % Kyoto reduction target. In addition, the gap filling of anticipated removals from carbon sink activities for the 2012 assessment resulted in an increased quantity of permissible emissions for this country.
• Luxembourg is also now considered on track towards towards its 28 % Kyoto reduction target by the end of 2011, due to a combined decrease in emissions in 2011 and an increase in the planned use of flexible mechanisms (21.7 % of base-year emissions). Luxembourg now plans on a purchase of an average 2.9 million
(15) Except the one relating to the implementation of the supplementarity principle that is considered above the quantity of credits needed to comply with the KP target.
(16) In April 2012, the amount of credits to be purchased by the Austrian government for the period 2008–2012 was increased from 45 million to a maximum of 80 million in an amendment to the Environmental Subsidies Act (Umweltförderungsgesetz).

Current progress towards 2008–2012 Kyoto targets
37Greenhouse gas emission trends and projections in Europe 2012
Figure 3.5 Absolute and relative gaps between average 2008–2011 non‑ETS emissions and Kyoto target for non‑ETS sectors (AAU initial — ETS issued) (with and without the use of carbon sinks and flexible mechanisms)
Note: * 'EU-15 (no overachievement)' corresponds to the situation of the EU-15 where all surplus AAUs from target overachievement in the EU‑15 are not taken into account, to reflect the possibility that Member States with a surplus could use any remaining allowances for their own purposes and not necessarily make them available to compensate for Member States with a shortfall. Subsequent to the effect of allocation of allowances to the EU ETS, the target and annual emissions are those of the sectors not covered by the EU ETS. For each country, the top bar represents the gap between domestic emissions and the Kyoto target, while the bar below includes the planned effect of Kyoto mechanisms and carbon sinks. A positive value indicates a country for which average 2008–2011 non-ETS emissions were lower than the annual target. The assessment is based on average 2008–2011 emissions and the planned use of flexible mechanisms, as well as the expected effect of LULUCF activities. EU-15 values are the sum of the gaps/surplus for the 15 EU Member States party to Burden-Sharing Agreement. For Croatia, Iceland and Switzerland, total emissions are used as they have currently no installations under the EU ETS.
Source: EEA, 2012a; EEA, 2012b; EEA, 2012d; EEA, 2012e.
6.7
1.3
0.9
0.0
0.5
137.7
108.8
54.8
35.9
19.8
8.7
5.1
4.7
3.5
1.1
93.9
61.3
25.7
11.9
7.7
5.4
4.6
4.6
2.4
2.3
1.9
0.2
0.0
– 0.1
– 14.1
210.7
– 14.2
2.2
0.4
0.4
– 4.1
– 0.0
127.3
106.1
56.6
38.8
21.3
21.8
10.2
29.1
10.6
– 1.2
90.5
52.5
23.5
9.7
7.1
– 0.7
– 5.4
– 1.6
– 2.1
0.8
– 3.8
– 16.5
– 2.8
– 50.2
– 32.4
71.5
– 115.5
Norway
Croatia
Iceland
Liechtenstein
Switzerland
Poland
Romania
Bulgaria
Hungary
Estonia
Lithuania
Slovakia
Czech Republic
Latvia
Slovenia
United Kingdom
Germany
France
Sweden
Greece
Belgium
Netherlands
Portugal
Ireland
Finland
Denmark
Austria
Luxembourg
Spain
Italy
EU-15
EU-15 (no overachievement) *
13.5
4.2
25.6
2.2
1.0
24.4
39.1
41.3
31.1
46.6
17.7
7.0
2.4
13.6
5.4
12.1
5.0
4.6
16.4
7.2
3.7
2.2
7.7
4.3
3.3
2.7
0.3
0.0
0.0
– 2.7
4.9
– 0.3
4.5
1.4
12.5
– 7.7
– 19.1
22.6
38.8
42.7
33.6
50.1
44.0
14.2
15.0
40.9
– 6.0
11.7
4.3
4.2
13.5
6.6
– 0.4
– 2.5
– 2.6
– 3.8
1.1
– 5.5
– 20.9
– 21.6
– 17.3
– 6.3
1.7
– 2.7
200 100 0 100 200 300
Mt CO2-equivalent
Gap to target (non-ETS domestic emissions) average 2008–2011
Gap to target (nonETS domestic emissions including plans on Kyoto mechanisms and carbon sinks) average 2008–2011
– 40 – 20 0 20 40 60 % of respective country's base-year emissions

Current progress towards 2008–2012 Kyoto targets
38 Greenhouse gas emission trends and projections in Europe 2012
Note: The difference between target and GHG emissions concerns the sectors not covered by the EU ETS, which represent the right emissions and target to consider for the assessment of actual progress towards Kyoto targets.
The results are based on the assumption that any surplus by EU Member States could be used for EU compliance.
Source: EEA, 2012a; EEA, 2012b; EEA, 2012d; EEA, 2012e.
Figure 3.6 Actual progress of the EU‑15 towards its burden‑sharing target in absolute and relative terms
2 37384 58 – 2
2 301211 Mt
0
500
1 000
1 500
2 000
2 500
Permissible emissions(non-ETS)
Use of flexiblemechanisms bygovernments
Carbon sink activities
Issued internationalemission credits
2008–2011 average emissions
(non-ETS)
Mt CO2-equivalent
Available Kyoto units in the EU-15 Actual emissions>
Surplus Kyoto units in the EU-15
units per year for the full commitment period and has already acquired an average 1.5 million units between 2008 and 2011. The maximum budget allocated by Luxembourg to acquire Kyoto units amounts EUR 250 million.
Fourteen European countries intend to use the flexible mechanisms provided under the Kyoto Protocol to achieve their respective targets. In addition to Austria, Italy, Luxembourg and Spain mentioned above, the other countries concerned are: Belgium, Denmark, Finland, Ireland, Luxembourg, the Netherlands, Norway, Portugal, Slovenia and Switzerland. Slovenia is the only EU-12 Member State which is planning to use flexible mechanisms to reach its Kyoto target. In Austria, Luxembourg and Spain, the flexible mechanisms are expected to play an important role in bridging the gaps between emissions and targets.
Carbon sinks will also play an important role in Kyoto compliance of European countries. In Croatia, Ireland and Portugal, carbon sequestration from sinks as currently projected for the full commitment period could fully cover the gap existing between current domestic emission levels in the sectors not covered by the EU ETS and their corresponding targets.
3.5 Current progress of the EU‑15
3.5.1 Overall assessment
On average, after four of the five years of the KP's first commitment period, the EU-15 is on track towards its 8 % reduction target. The combined average over-delivery is equivalent to approximately 211 Mt CO2-equivalent per year (a quantity which
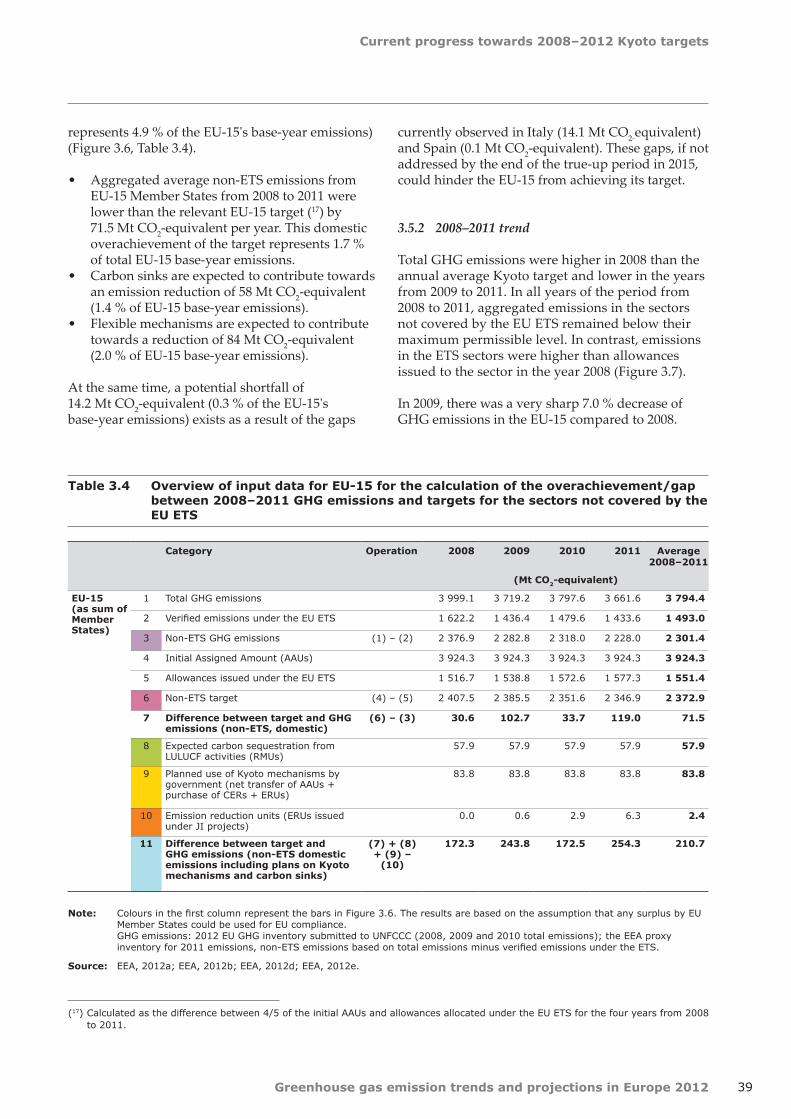
Current progress towards 2008–2012 Kyoto targets
39Greenhouse gas emission trends and projections in Europe 2012
(17) Calculated as the difference between 4/5 of the initial AAUs and allowances allocated under the EU ETS for the four years from 2008 to 2011.
represents 4.9 % of the EU-15's base-year emissions) (Figure 3.6, Table 3.4).
• Aggregated average non-ETS emissions from EU-15 Member States from 2008 to 2011 were lower than the relevant EU-15 target (17) by 71.5 Mt CO2-equivalent per year. This domestic overachievement of the target represents 1.7 % of total EU-15 base-year emissions.
• Carbon sinks are expected to contribute towards an emission reduction of 58 Mt CO2-equivalent (1.4 % of EU-15 base-year emissions).
• Flexible mechanisms are expected to contribute towards a reduction of 84 Mt CO2-equivalent (2.0 % of EU-15 base-year emissions).
At the same time, a potential shortfall of 14.2 Mt CO2-equivalent (0.3 % of the EU-15's base-year emissions) exists as a result of the gaps
Table 3.4 Overview of input data for EU‑15 for the calculation of the overachievement/gap between 2008–2011 GHG emissions and targets for the sectors not covered by the EU ETS
Category Operation 2008 2009 2010 2011 Average 2008–2011
(Mt CO2‑equivalent)
EU‑15 (as sum of Member States)
1 Total GHG emissions 3 999.1 3 719.2 3 797.6 3 661.6 3 794.4
2 Verified emissions under the EU ETS 1 622.2 1 436.4 1 479.6 1 433.6 1 493.0
3 Non-ETS GHG emissions (1) – (2) 2 376.9 2 282.8 2 318.0 2 228.0 2 301.4
4 Initial Assigned Amount (AAUs) 3 924.3 3 924.3 3 924.3 3 924.3 3 924.3
5 Allowances issued under the EU ETS 1 516.7 1 538.8 1 572.6 1 577.3 1 551.4
6 Non-ETS target (4) – (5) 2 407.5 2 385.5 2 351.6 2 346.9 2 372.9
7 Difference between target and GHG emissions (non‑ETS, domestic)
(6) – (3) 30.6 102.7 33.7 119.0 71.5
8 Expected carbon sequestration from LULUCF activities (RMUs)
57.9 57.9 57.9 57.9 57.9
9 Planned use of Kyoto mechanisms by government (net transfer of AAUs + purchase of CERs + ERUs)
83.8 83.8 83.8 83.8 83.8
10 Emission reduction units (ERUs issued under JI projects)
0.0 0.6 2.9 6.3 2.4
11 Difference between target and GHG emissions (non‑ETS domestic emissions including plans on Kyoto mechanisms and carbon sinks)
(7) + (8) + (9) –
(10)
172.3 243.8 172.5 254.3 210.7
Note: Colours in the first column represent the bars in Figure 3.6. The results are based on the assumption that any surplus by EU Member States could be used for EU compliance. GHG emissions: 2012 EU GHG inventory submitted to UNFCCC (2008, 2009 and 2010 total emissions); the EEA proxy inventory for 2011 emissions, non‑ETS emissions based on total emissions minus verified emissions under the ETS.
Source: EEA, 2012a; EEA, 2012b; EEA, 2012d; EEA, 2012e.
currently observed in Italy (14.1 Mt CO2-equivalent) and Spain (0.1 Mt CO2-equivalent). These gaps, if not addressed by the end of the true-up period in 2015, could hinder the EU-15 from achieving its target.
3.5.2 2008–2011 trend
Total GHG emissions were higher in 2008 than the annual average Kyoto target and lower in the years from 2009 to 2011. In all years of the period from 2008 to 2011, aggregated emissions in the sectors not covered by the EU ETS remained below their maximum permissible level. In contrast, emissions in the ETS sectors were higher than allowances issued to the sector in the year 2008 (Figure 3.7).
In 2009, there was a very sharp 7.0 % decrease of GHG emissions in the EU-15 compared to 2008.
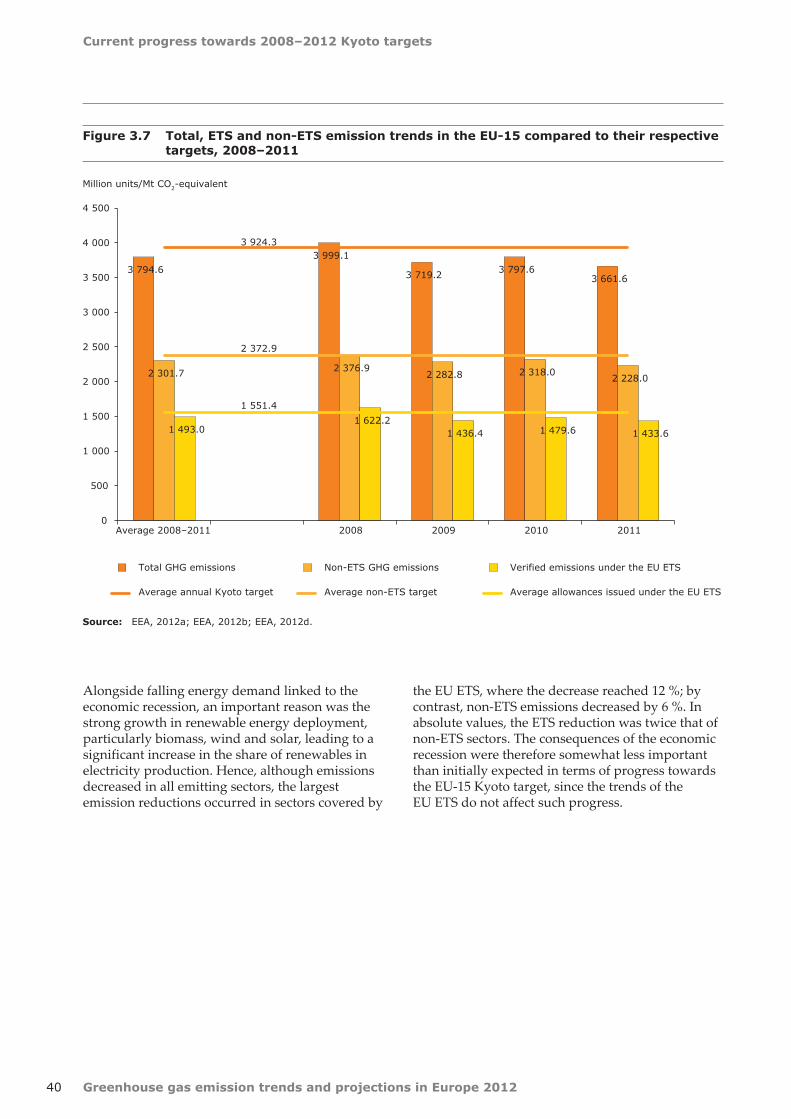
Current progress towards 2008–2012 Kyoto targets
40 Greenhouse gas emission trends and projections in Europe 2012
Source: EEA, 2012a; EEA, 2012b; EEA, 2012d.
Figure 3.7 Total, ETS and non‑ETS emission trends in the EU‑15 compared to their respective targets, 2008–2011
3 794.6
3 999.1
3 719.2 3 797.63 661.6
2 301.7 2 376.92 282.8 2 318.0
2 228.0
1 493.01 622.2
1 436.4 1 479.6 1 433.6
3 924.3
2 372.9
1 551.4
0
500
1 000
1 500
2 000
2 500
3 000
3 500
4 000
4 500
Average 2008–2011 2008 2009 2010 2011
Million units/Mt CO2-equivalent
Total GHG emissions Non-ETS GHG emissions Verified emissions under the EU ETS
Average annual Kyoto target Average non-ETS target Average allowances issued under the EU ETS
Alongside falling energy demand linked to the economic recession, an important reason was the strong growth in renewable energy deployment, particularly biomass, wind and solar, leading to a significant increase in the share of renewables in electricity production. Hence, although emissions decreased in all emitting sectors, the largest emission reductions occurred in sectors covered by
the EU ETS, where the decrease reached 12 %; by contrast, non-ETS emissions decreased by 6 %. In absolute values, the ETS reduction was twice that of non-ETS sectors. The consequences of the economic recession were therefore somewhat less important than initially expected in terms of progress towards the EU-15 Kyoto target, since the trends of the EU ETS do not affect such progress.

41
The European Union Emissions Trading System
Greenhouse gas emission trends and projections in Europe 2012
4 The European Union Emissions Trading System
The EU ETS covers approximately 40 % of total GHG emissions in the EU. Through their NAPs for the second trading period 2008–2012, ETS-participating countries have fixed the overall contribution of the EU ETS towards the achievement of their respective burden-sharing or Kyoto targets.
Emissions of installations covered by the EU ETS increased slightly between 2005 and 2007, declined in 2008, and have since stabilised below 2008 levels. In the period from 2008 to 2011, the emissions of all installations covered by the EU ETS were 5 % below the amount of allocated allowances (freely and through auctioning) during that period. Although verified emissions were lower than freely allocated allowances, operators made a substantial use of CDM and JI credits to comply with their obligations, amounting to 7 % of total verified emissions.
In 2012 the aviation sector was included in the EU ETS. From 2013 onwards, its scope will be further extended. The cap will decrease continuously from 2013 onwards using a linear reduction factor while an increasing number of allowances will be auctioned. The use of Kyoto units issued under the KP's flexible mechanisms will be subject to tighter quality restrictions.
Because the carbon market is currently marked by an oversupply of allowances, the Commission recently proposed that a certain quantity of auctioned allowances, yet to be determined, be back-loaded (auctioned later in the third trading phase). This is in order to reduce the amount of allowances to be auctioned in the years 2013 to 2015. It is also expected that long-term structural measures will be proposed by the Commission to address the challenges in the EU ETS.
Australia and the European Commission have agreed on a full linking of their emissions trading systems, foreseen to be effective as of July 2018.
4.1 Introduction to the EU ETS
The EU ETS is a key policy instrument to achieve climate policy objectives in the European Union. It was established by Directive 2003/87/EC (the Emission Trading Directive) and entered into force on 1 January 2005. The role of the EU ETS and the particular importance of cap setting in the context of the achievement of their Kyoto targets by Member States is described in Section 2.3.
All EU Member States participate in the scheme. Bulgaria and Romania joined the ETS in 2007 when they became Member States of the EU. Iceland, Liechtenstein and Norway, which do not belong
to the EU, joined the EU ETS in 2008 (18) and must comply with the same rules and regulations as the EU Member States. At present, no installation in Iceland falls under the scope of the Directive and consequently no figures for Iceland are reported in Chapter 4 (19).This changed in 2012, with the inclusion of aviation in the EU ETS, and will change again in 2013, when aluminium and ferrosilicon production will also join the scheme. Switzerland has a separate emissions trading scheme, but intends to link its system to the EU ETS. It would operate on the basis of mutual recognition of emission allowances in line with a bilateral agreement which should come into effect in the second commitment period of the
(18) The linkage of the EU emissions trading system with Iceland, Liechtenstein and Norway took place through the incorporation of the EU ETS Directive (Directive 2003/87/EC) into the European Economic Area agreement in 2007. For more information, see the EFTA Surveillance Authority website (EFTA Surveillance Authority, 2012).
(19) Pursuant to EEA Joint Committee Decision No 146/2007.
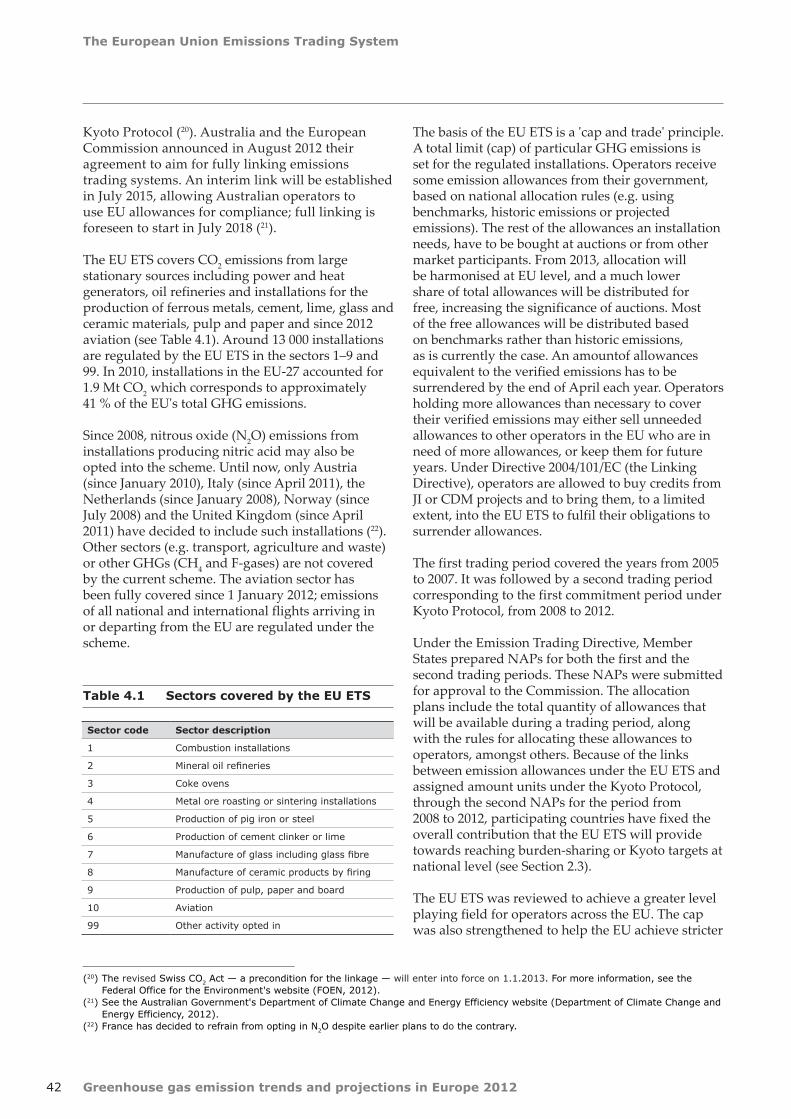
The European Union Emissions Trading System
42 Greenhouse gas emission trends and projections in Europe 2012
Kyoto Protocol (20). Australia and the European Commission announced in August 2012 their agreement to aim for fully linking emissions trading systems. An interim link will be established in July 2015, allowing Australian operators to use EU allowances for compliance; full linking is foreseen to start in July 2018 (21).
The EU ETS covers CO2 emissions from large stationary sources including power and heat generators, oil refineries and installations for the production of ferrous metals, cement, lime, glass and ceramic materials, pulp and paper and since 2012 aviation (see Table 4.1). Around 13 000 installations are regulated by the EU ETS in the sectors 1–9 and 99. In 2010, installations in the EU-27 accounted for 1.9 Mt CO2 which corresponds to approximately 41 % of the EU's total GHG emissions.
Since 2008, nitrous oxide (N2O) emissions from installations producing nitric acid may also be opted into the scheme. Until now, only Austria (since January 2010), Italy (since April 2011), the Netherlands (since January 2008), Norway (since July 2008) and the United Kingdom (since April 2011) have decided to include such installations (22). Other sectors (e.g. transport, agriculture and waste) or other GHGs (CH4 and F-gases) are not covered by the current scheme. The aviation sector has been fully covered since 1 January 2012; emissions of all national and international flights arriving in or departing from the EU are regulated under the scheme.
The basis of the EU ETS is a 'cap and trade' principle. A total limit (cap) of particular GHG emissions is set for the regulated installations. Operators receive some emission allowances from their government, based on national allocation rules (e.g. using benchmarks, historic emissions or projected emissions). The rest of the allowances an installation needs, have to be bought at auctions or from other market participants. From 2013, allocation will be harmonised at EU level, and a much lower share of total allowances will be distributed for free, increasing the significance of auctions. Most of the free allowances will be distributed based on benchmarks rather than historic emissions, as is currently the case. An amountof allowances equivalent to the verified emissions has to be surrendered by the end of April each year. Operators holding more allowances than necessary to cover their verified emissions may either sell unneeded allowances to other operators in the EU who are in need of more allowances, or keep them for future years. Under Directive 2004/101/EC (the Linking Directive), operators are allowed to buy credits from JI or CDM projects and to bring them, to a limited extent, into the EU ETS to fulfil their obligations to surrender allowances.
The first trading period covered the years from 2005 to 2007. It was followed by a second trading period corresponding to the first commitment period under Kyoto Protocol, from 2008 to 2012.
Under the Emission Trading Directive, Member States prepared NAPs for both the first and the second trading periods. These NAPs were submitted for approval to the Commission. The allocation plans include the total quantity of allowances that will be available during a trading period, along with the rules for allocating these allowances to operators, amongst others. Because of the links between emission allowances under the EU ETS and assigned amount units under the Kyoto Protocol, through the second NAPs for the period from 2008 to 2012, participating countries have fixed the overall contribution that the EU ETS will provide towards reaching burden-sharing or Kyoto targets at national level (see Section 2.3).
The EU ETS was reviewed to achieve a greater level playing field for operators across the EU. The cap was also strengthened to help the EU achieve stricter
(20) The revised Swiss CO2 Act — a precondition for the linkage — will enter into force on 1.1.2013. For more information, see the Federal Office for the Environment's website (FOEN, 2012).
(21) See the Australian Government's Department of Climate Change and Energy Efficiency website (Department of Climate Change and Energy Efficiency, 2012).
(22) France has decided to refrain from opting in N2O despite earlier plans to do the contrary.
Table 4.1 Sectors covered by the EU ETS
Sector code Sector description
1 Combustion installations
2 Mineral oil refineries
3 Coke ovens
4 Metal ore roasting or sintering installations
5 Production of pig iron or steel
6 Production of cement clinker or lime
7 Manufacture of glass including glass fibre
8 Manufacture of ceramic products by firing
9 Production of pulp, paper and board
10 Aviation
99 Other activity opted in
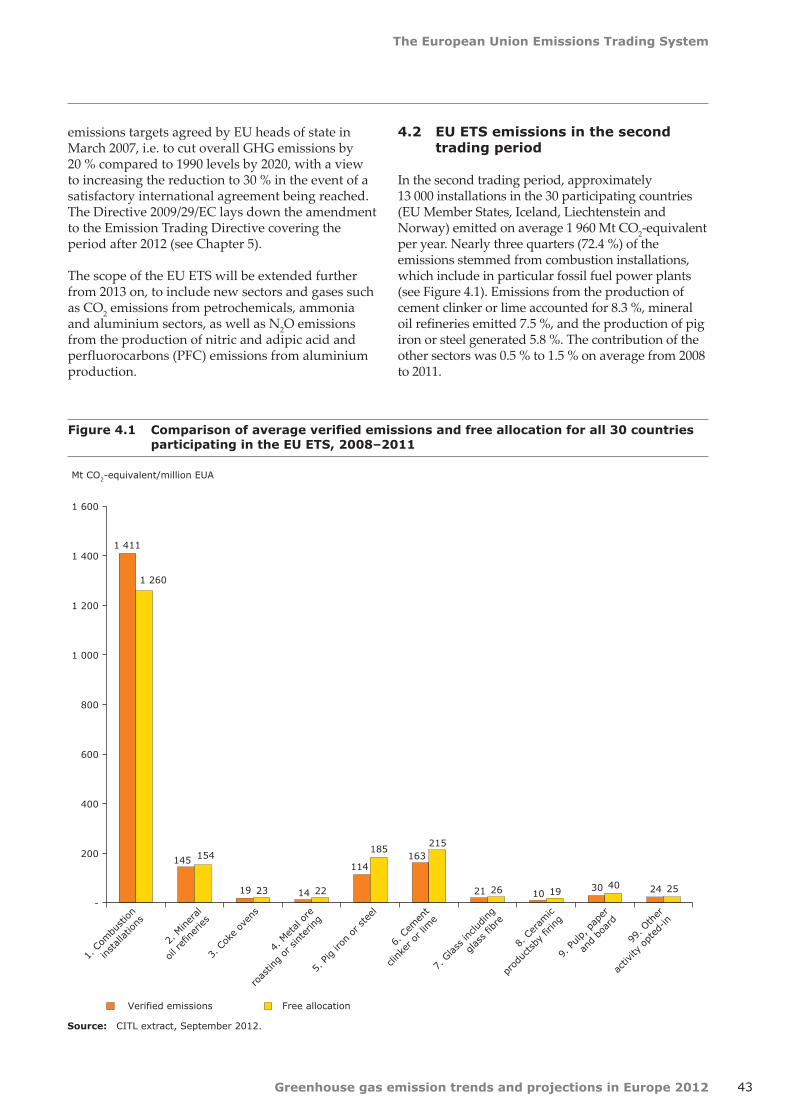
The European Union Emissions Trading System
43Greenhouse gas emission trends and projections in Europe 2012
Figure 4.1 Comparison of average verified emissions and free allocation for all 30 countries participating in the EU ETS, 2008–2011
Source: CITL extract, September 2012.
emissions targets agreed by EU heads of state in March 2007, i.e. to cut overall GHG emissions by 20 % compared to 1990 levels by 2020, with a view to increasing the reduction to 30 % in the event of a satisfactory international agreement being reached. The Directive 2009/29/EC lays down the amendment to the Emission Trading Directive covering the period after 2012 (see Chapter 5).
The scope of the EU ETS will be extended further from 2013 on, to include new sectors and gases such as CO2 emissions from petrochemicals, ammonia and aluminium sectors, as well as N2O emissions from the production of nitric and adipic acid and perfluorocarbons (PFC) emissions from aluminium production.
1 411
145
19 14
114 163
21 10 30 24
1 260
154
23 22
185 215
26 19 40 25
-
200
400
600
800
1 000
1 200
1 400
1 600
1. C
ombu
stion
installatio
ns
3. C
oke ov
ens
5. Pig ir
on or s
teel
7. G
lass
inclu
ding
glas
s fib
re
9. Pulp, pap
er
and bo
ard
Mt CO2-equivalent/million EUA
Verified emissions Free allocation
2. M
iner
al
oil r
efiner
ies
4. M
etal ore
roas
ting or
sinterin
g
6. C
emen
t
clink
er or l
ime
8. C
eram
ic
prod
uctsby
firin
g
99. O
ther
activ
ity opt
ed-in
4.2 EU ETS emissions in the second trading period
In the second trading period, approximately 13 000 installations in the 30 participating countries (EU Member States, Iceland, Liechtenstein and Norway) emitted on average 1 960 Mt CO2-equivalent per year. Nearly three quarters (72.4 %) of the emissions stemmed from combustion installations, which include in particular fossil fuel power plants (see Figure 4.1). Emissions from the production of cement clinker or lime accounted for 8.3 %, mineral oil refineries emitted 7.5 %, and the production of pig iron or steel generated 5.8 %. The contribution of the other sectors was 0.5 % to 1.5 % on average from 2008 to 2011.

The European Union Emissions Trading System
44 Greenhouse gas emission trends and projections in Europe 2012
Figure 4.2 Comparison of available emission units and verified emissions in all 30 EU ETS countries, 2005–2011
Note: The 'change in scope/coverage' concerns the correction from 2005 through 2007, to 2008 through 2012. The large corrections for 2005 and 2006 are related to Bulgaria and Romania, which only entered the scheme in 2007 (see Table 4.2).
Source: CITL extracts (allocation and verified emissions data: September 2012; surrendered CERs and ERUs: 2 May 2012); EUAs sold and auctioned: Öko‑Institut, 2011; gap filling for Bulgaria (allocation for the year 2007) and update of auctioning information: own calculations by ETC/ACM.
On average, free allocation of allowances in the 2008–2011 period slightly surpassed total emissions in the ETS sector , mainly due to the economic crisis, which reduced emissions much more than had been anticipated.
When assessing development over the years, verified emissions have been significantly lower
(23) Allocation information was missing for Bulgaria in 2007. For the calculation of averages, it was assumed that free allocation in the missing years was identical to the average of the reported years. No installation in Iceland falls under the current scope of the EU ETS Directive. No additional corrections, e.g. for allocated allowances in France and Germany (see note to Figure 3.3) were included in figures in Chapter 4.
0
500
1 000
1 500
2 000
2 500
2005 2006 2007 2008 2009 2010 2011
1st trading period 2nd trading period
Million emission units/Mt CO2
Surrendered ERUs
Surrendered CERs
EUAs sold and auctioned by governments
EUAs allocated for free
Scope correction
Verified emissions and scope correction
in the second trading period compared to the first. Figure 4.2 compares the verified emissions in all countries participating in the EU ETS with the amount of available emission units (EUAs, CERs and ERUs) (23).
From 2005 to 2007, verified emissions of all EU ETS installations increased slightly by 20 Mt CO2 (taking
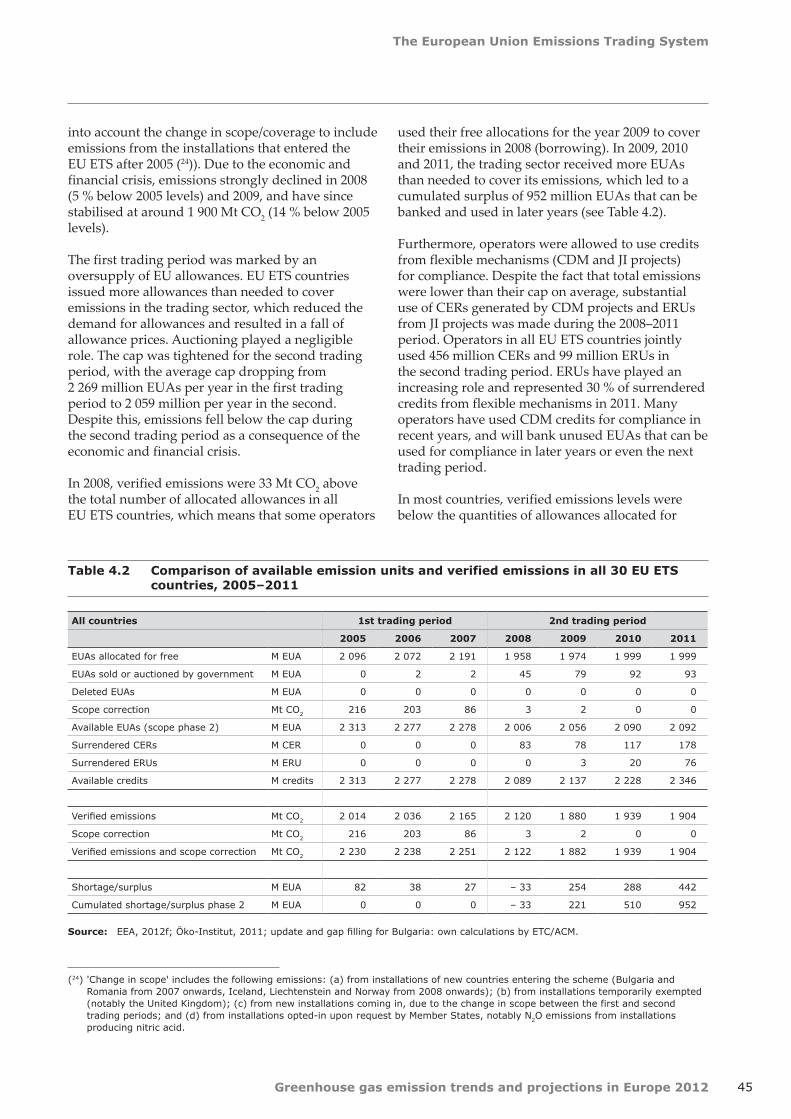
The European Union Emissions Trading System
45Greenhouse gas emission trends and projections in Europe 2012
(24) 'Change in scope' includes the following emissions: (a) from installations of new countries entering the scheme (Bulgaria and Romania from 2007 onwards, Iceland, Liechtenstein and Norway from 2008 onwards); (b) from installations temporarily exempted (notably the United Kingdom); (c) from new installations coming in, due to the change in scope between the first and second trading periods; and (d) from installations opted-in upon request by Member States, notably N2O emissions from installations producing nitric acid.
into account the change in scope/coverage to include emissions from the installations that entered the EU ETS after 2005 (24)). Due to the economic and financial crisis, emissions strongly declined in 2008 (5 % below 2005 levels) and 2009, and have since stabilised at around 1 900 Mt CO2 (14 % below 2005 levels).
The first trading period was marked by an oversupply of EU allowances. EU ETS countries issued more allowances than needed to cover emissions in the trading sector, which reduced the demand for allowances and resulted in a fall of allowance prices. Auctioning played a negligible role. The cap was tightened for the second trading period, with the average cap dropping from 2 269 million EUAs per year in the first trading period to 2 059 million per year in the second. Despite this, emissions fell below the cap during the second trading period as a consequence of the economic and financial crisis.
In 2008, verified emissions were 33 Mt CO2 above the total number of allocated allowances in all EU ETS countries, which means that some operators
used their free allocations for the year 2009 to cover their emissions in 2008 (borrowing). In 2009, 2010 and 2011, the trading sector received more EUAs than needed to cover its emissions, which led to a cumulated surplus of 952 million EUAs that can be banked and used in later years (see Table 4.2).
Furthermore, operators were allowed to use credits from flexible mechanisms (CDM and JI projects) for compliance. Despite the fact that total emissions were lower than their cap on average, substantial use of CERs generated by CDM projects and ERUs from JI projects was made during the 2008–2011 period. Operators in all EU ETS countries jointly used 456 million CERs and 99 million ERUs in the second trading period. ERUs have played an increasing role and represented 30 % of surrendered credits from flexible mechanisms in 2011. Many operators have used CDM credits for compliance in recent years, and will bank unused EUAs that can be used for compliance in later years or even the next trading period.
In most countries, verified emissions levels were below the quantities of allowances allocated for
Table 4.2 Comparison of available emission units and verified emissions in all 30 EU ETS countries, 2005–2011
Source: EEA, 2012f; Öko‑Institut, 2011; update and gap filling for Bulgaria: own calculations by ETC/ACM.
All countries 1st trading period 2nd trading period
2005 2006 2007 2008 2009 2010 2011
EUAs allocated for free M EUA 2 096 2 072 2 191 1 958 1 974 1 999 1 999
EUAs sold or auctioned by government M EUA 0 2 2 45 79 92 93
Deleted EUAs M EUA 0 0 0 0 0 0 0
Scope correction Mt CO2 216 203 86 3 2 0 0
Available EUAs (scope phase 2) M EUA 2 313 2 277 2 278 2 006 2 056 2 090 2 092
Surrendered CERs M CER 0 0 0 83 78 117 178
Surrendered ERUs M ERU 0 0 0 0 3 20 76
Available credits M credits 2 313 2 277 2 278 2 089 2 137 2 228 2 346
Verified emissions Mt CO2 2 014 2 036 2 165 2 120 1 880 1 939 1 904
Scope correction Mt CO2 216 203 86 3 2 0 0
Verified emissions and scope correction Mt CO2 2 230 2 238 2 251 2 122 1 882 1 939 1 904
Shortage/surplus M EUA 82 38 27 – 33 254 288 442
Cumulated shortage/surplus phase 2 M EUA 0 0 0 – 33 221 510 952
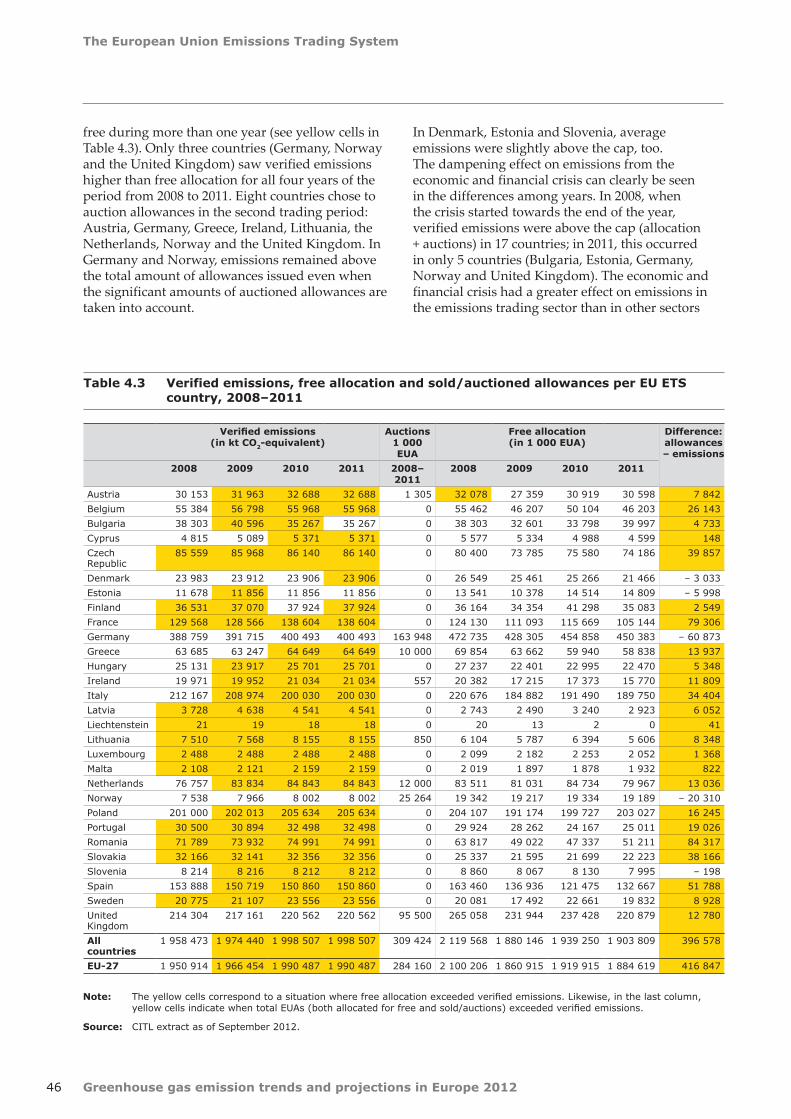
The European Union Emissions Trading System
46 Greenhouse gas emission trends and projections in Europe 2012
free during more than one year (see yellow cells in Table 4.3). Only three countries (Germany, Norway and the United Kingdom) saw verified emissions higher than free allocation for all four years of the period from 2008 to 2011. Eight countries chose to auction allowances in the second trading period: Austria, Germany, Greece, Ireland, Lithuania, the Netherlands, Norway and the United Kingdom. In Germany and Norway, emissions remained above the total amount of allowances issued even when the significant amounts of auctioned allowances are taken into account.
Table 4.3 Verified emissions, free allocation and sold/auctioned allowances per EU ETS country, 2008–2011
Verified emissions (in kt CO2‑equivalent)
Auctions 1 000 EUA
Free allocation (in 1 000 EUA)
Difference: allowances – emissions
2008 2009 2010 2011 2008–2011
2008 2009 2010 2011
Austria 30 153 31 963 32 688 32 688 1 305 32 078 27 359 30 919 30 598 7 842
Belgium 55 384 56 798 55 968 55 968 0 55 462 46 207 50 104 46 203 26 143
Bulgaria 38 303 40 596 35 267 35 267 0 38 303 32 601 33 798 39 997 4 733
Cyprus 4 815 5 089 5 371 5 371 0 5 577 5 334 4 988 4 599 148
Czech Republic
85 559 85 968 86 140 86 140 0 80 400 73 785 75 580 74 186 39 857
Denmark 23 983 23 912 23 906 23 906 0 26 549 25 461 25 266 21 466 – 3 033
Estonia 11 678 11 856 11 856 11 856 0 13 541 10 378 14 514 14 809 – 5 998
Finland 36 531 37 070 37 924 37 924 0 36 164 34 354 41 298 35 083 2 549
France 129 568 128 566 138 604 138 604 0 124 130 111 093 115 669 105 144 79 306
Germany 388 759 391 715 400 493 400 493 163 948 472 735 428 305 454 858 450 383 – 60 873
Greece 63 685 63 247 64 649 64 649 10 000 69 854 63 662 59 940 58 838 13 937
Hungary 25 131 23 917 25 701 25 701 0 27 237 22 401 22 995 22 470 5 348
Ireland 19 971 19 952 21 034 21 034 557 20 382 17 215 17 373 15 770 11 809
Italy 212 167 208 974 200 030 200 030 0 220 676 184 882 191 490 189 750 34 404
Latvia 3 728 4 638 4 541 4 541 0 2 743 2 490 3 240 2 923 6 052
Liechtenstein 21 19 18 18 0 20 13 2 0 41
Lithuania 7 510 7 568 8 155 8 155 850 6 104 5 787 6 394 5 606 8 348
Luxembourg 2 488 2 488 2 488 2 488 0 2 099 2 182 2 253 2 052 1 368
Malta 2 108 2 121 2 159 2 159 0 2 019 1 897 1 878 1 932 822
Netherlands 76 757 83 834 84 843 84 843 12 000 83 511 81 031 84 734 79 967 13 036
Norway 7 538 7 966 8 002 8 002 25 264 19 342 19 217 19 334 19 189 – 20 310
Poland 201 000 202 013 205 634 205 634 0 204 107 191 174 199 727 203 027 16 245
Portugal 30 500 30 894 32 498 32 498 0 29 924 28 262 24 167 25 011 19 026
Romania 71 789 73 932 74 991 74 991 0 63 817 49 022 47 337 51 211 84 317
Slovakia 32 166 32 141 32 356 32 356 0 25 337 21 595 21 699 22 223 38 166
Slovenia 8 214 8 216 8 212 8 212 0 8 860 8 067 8 130 7 995 – 198
Spain 153 888 150 719 150 860 150 860 0 163 460 136 936 121 475 132 667 51 788
Sweden 20 775 21 107 23 556 23 556 0 20 081 17 492 22 661 19 832 8 928
United Kingdom
214 304 217 161 220 562 220 562 95 500 265 058 231 944 237 428 220 879 12 780
All countries
1 958 473 1 974 440 1 998 507 1 998 507 309 424 2 119 568 1 880 146 1 939 250 1 903 809 396 578
EU‑27 1 950 914 1 966 454 1 990 487 1 990 487 284 160 2 100 206 1 860 915 1 919 915 1 884 619 416 847
In Denmark, Estonia and Slovenia, average emissions were slightly above the cap, too. The dampening effect on emissions from the economic and financial crisis can clearly be seen in the differences among years. In 2008, when the crisis started towards the end of the year, verified emissions were above the cap (allocation + auctions) in 17 countries; in 2011, this occurred in only 5 countries (Bulgaria, Estonia, Germany, Norway and United Kingdom). The economic and financial crisis had a greater effect on emissions in the emissions trading sector than in other sectors
Note: The yellow cells correspond to a situation where free allocation exceeded verified emissions. Likewise, in the last column, yellow cells indicate when total EUAs (both allocated for free and sold/auctions) exceeded verified emissions.
Source: CITL extract as of September 2012.

The European Union Emissions Trading System
47Greenhouse gas emission trends and projections in Europe 2012
Figure 4.3 Development of sectoral emissions 2008–2011 compared to 2008 levels
Note: The ETS sector category '99. Other activities opted-in' is not included, as it is heterogeneous and includes installations with unclear sector definition. Figures for the sector are reported in Table 4.4.
Source: CITL extract as of September 2012.
like transport, residential, agriculture and forestry. Therefore, the crisis de facto reduced the level of ambition initially defined through the cap levels in the EU ETS.
Emissions have declined in all trading sectors in the last years compared to 2008 (see Figure 4.3). The decline has been steepest for metal roasting or sintering, where 2009 emissions were 38 %
Table 4.4 Verified emissions per trading sector in all 30 EU ETS countries, 2005–2011
2005 2006 2007 2008 2009 2010 2011
Verified emissions in Mt CO2
1. Combustion installations 1 457 1 468 1 541 1 508 1 379 1 412 1 377
2. Mineral oil refineries 151 150 154 156 147 144 142
3. Coke ovens 19 21 22 21 16 20 20
4. Metal ore roasting or sintering 13 14 25 18 11 13 13
5. Pig iron or steel 129 133 132 133 95 114 113
6. Cement clinker or lime 177 182 201 191 153 154 152
7. Glass including glass fibre 20 20 21 23 19 20 21
8. Ceramic products by firing 15 15 15 14 9 9 9
9. Pulp, paper and board 30 30 30 32 28 30 29
99. Other activity opted-in 2 2 23 25 22 22 27
Total all sectors 2 014 2 036 2 165 2 120 1 880 1 939 1 904
Note: No adjustments for change in scope/coverage were made; therefore, the first trading period (2005–2007) is not fully comparable to the second trading period (since 2008), due to new countries and activities being included.
Source: CITL extract as of September 2012.
50
60
70
80
90
100
2008 2009 2010 2011
Verified emissions compared to 2008 levels (%)
3. Coke ovens
7. Glass including glass fibre2. Mineral oil refineries
1. Combustion installations
9. Pulp, paper and board
5. Pig iron or steel
6. Cement clinker or lime
4. Metal ore roasting or sintering
8. Ceramic products by firing
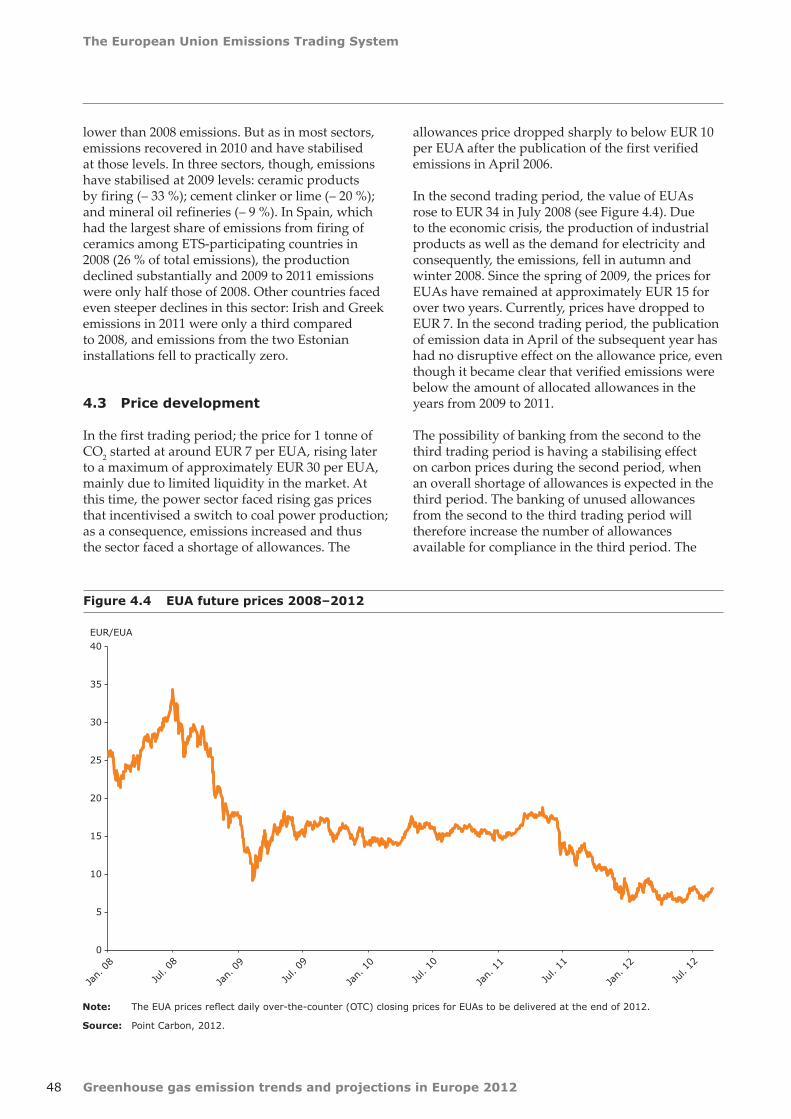
The European Union Emissions Trading System
48 Greenhouse gas emission trends and projections in Europe 2012
Figure 4.4 EUA future prices 2008–2012
Note: The EUA prices reflect daily over‑the‑counter (OTC) closing prices for EUAs to be delivered at the end of 2012.
Source: Point Carbon, 2012.
lower than 2008 emissions. But as in most sectors, emissions recovered in 2010 and have stabilised at those levels. In three sectors, though, emissions have stabilised at 2009 levels: ceramic products by firing (– 33 %); cement clinker or lime (– 20 %); and mineral oil refineries (– 9 %). In Spain, which had the largest share of emissions from firing of ceramics among ETS-participating countries in 2008 (26 % of total emissions), the production declined substantially and 2009 to 2011 emissions were only half those of 2008. Other countries faced even steeper declines in this sector: Irish and Greek emissions in 2011 were only a third compared to 2008, and emissions from the two Estonian installations fell to practically zero.
4.3 Price development
In the first trading period; the price for 1 tonne of CO2 started at around EUR 7 per EUA, rising later to a maximum of approximately EUR 30 per EUA, mainly due to limited liquidity in the market. At this time, the power sector faced rising gas prices that incentivised a switch to coal power production; as a consequence, emissions increased and thus the sector faced a shortage of allowances. The
0
5
10
15
20
25
30
35
40
Jan.
08
Jul. 08
Jan.
09
Jul. 09
Jan.
10
Jul. 10
Jan.
11
Jul. 11
Jan.
12
Jul. 12
EUR/EUA
allowances price dropped sharply to below EUR 10 per EUA after the publication of the first verified emissions in April 2006.
In the second trading period, the value of EUAs rose to EUR 34 in July 2008 (see Figure 4.4). Due to the economic crisis, the production of industrial products as well as the demand for electricity and consequently, the emissions, fell in autumn and winter 2008. Since the spring of 2009, the prices for EUAs have remained at approximately EUR 15 for over two years. Currently, prices have dropped to EUR 7. In the second trading period, the publication of emission data in April of the subsequent year has had no disruptive effect on the allowance price, even though it became clear that verified emissions were below the amount of allocated allowances in the years from 2009 to 2011.
The possibility of banking from the second to the third trading period is having a stabilising effect on carbon prices during the second period, when an overall shortage of allowances is expected in the third period. The banking of unused allowances from the second to the third trading period will therefore increase the number of allowances available for compliance in the third period. The
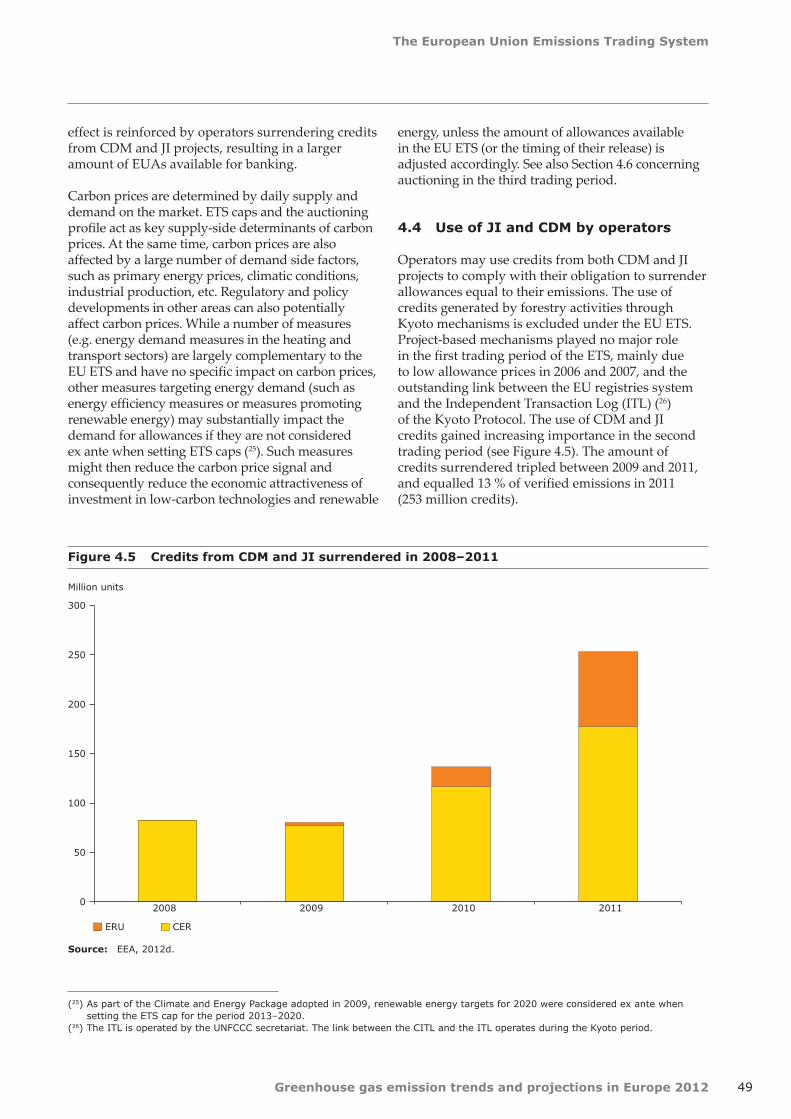
The European Union Emissions Trading System
49Greenhouse gas emission trends and projections in Europe 2012
Figure 4.5 Credits from CDM and JI surrendered in 2008–2011
Source: EEA, 2012d.
effect is reinforced by operators surrendering credits from CDM and JI projects, resulting in a larger amount of EUAs available for banking.
Carbon prices are determined by daily supply and demand on the market. ETS caps and the auctioning profile act as key supply-side determinants of carbon prices. At the same time, carbon prices are also affected by a large number of demand side factors, such as primary energy prices, climatic conditions, industrial production, etc. Regulatory and policy developments in other areas can also potentially affect carbon prices. While a number of measures (e.g. energy demand measures in the heating and transport sectors) are largely complementary to the EU ETS and have no specific impact on carbon prices, other measures targeting energy demand (such as energy efficiency measures or measures promoting renewable energy) may substantially impact the demand for allowances if they are not considered ex ante when setting ETS caps (25). Such measures might then reduce the carbon price signal and consequently reduce the economic attractiveness of investment in low-carbon technologies and renewable
(25) As part of the Climate and Energy Package adopted in 2009, renewable energy targets for 2020 were considered ex ante when setting the ETS cap for the period 2013–2020.
(26) The ITL is operated by the UNFCCC secretariat. The link between the CITL and the ITL operates during the Kyoto period.
energy, unless the amount of allowances available in the EU ETS (or the timing of their release) is adjusted accordingly. See also Section 4.6 concerning auctioning in the third trading period.
4.4 Use of JI and CDM by operators
Operators may use credits from both CDM and JI projects to comply with their obligation to surrender allowances equal to their emissions. The use of credits generated by forestry activities through Kyoto mechanisms is excluded under the EU ETS. Project-based mechanisms played no major role in the first trading period of the ETS, mainly due to low allowance prices in 2006 and 2007, and the outstanding link between the EU registries system and the Independent Transaction Log (ITL) (26) of the Kyoto Protocol. The use of CDM and JI credits gained increasing importance in the second trading period (see Figure 4.5). The amount of credits surrendered tripled between 2009 and 2011, and equalled 13 % of verified emissions in 2011 (253 million credits).
0
50
100
150
200
250
300
2008 2009 2010 2011
Million units
ERU CER

The European Union Emissions Trading System
50 Greenhouse gas emission trends and projections in Europe 2012
On average, 7 % of verified emissions (in total, 555 Mt CO2-equivalent) were covered by surrendering CERs and ERUs in the years from 2008 to 2011. Most units (456 million) originated from projects in non-Annex 1 countries, i.e. the developing world (CERs). Units from JI projects were used to a much lesser extent (18 % of total credits from flexible mechanisms; 99 million ERUs), but their share experienced a steep increase from 0.1 % of units from flexible mechanisms in 2008 to 30 % in 2011.
Operators in all participating countries except Liechtenstein and Malta have used project-based credits so far (see Table 4.5). In Lithuania 18 % of surrendered allowances stemmed from project-based mechanisms; in Spain this rose to 12 % and in Slovakia 10 %. In absolute figures, most credits from flexible mechanisms were used by operators in Germany (162 million), Spain (69 million), Poland (56 million), Italy (49 million) and France (43 million), with those five countries
Country Verified emissions (average
2008–2011)
Free allocation (average
2008–2011)
Allowed CER/ERU use
(% of free allocation)
Total allowed CER/ERU use in phase II
(2008–2012)
Total CER/ERU surrendered by
operators 2008–2011
Used CER/ERU (2008–
2011) vs budget (2008–2012)
(kt CO2‑equivalent/
year)(1 000 EUA/
year) (%) (1 000 CER/ERU) (%)
Austria 30 239 31 873 10 % 15 936 4 649 29 %
Belgium 49 494 56 030 8 % 23 532 9 057 38 %
Bulgaria 36 175 37 358 13 % 23 362 13 709 59 %
Cyprus 5 125 5 162 10 % 2 581 956 37 %
Czech Republic 75 988 85 952 10 % 42 976 16 439 38 %
Denmark 24 685 23 927 17 % 20 350 4 538 22 %
Estonia 13 311 11 811 4 % * 2 362 158 7 %
Finland 36 725 37 362 10 % * 18 681 8 246 44 %
France 114 009 133 835 14 % 90 339 42 518 47 %
Germany 451 571 395 365 22 % 434 902 162 316 37 %
Greece 63 073 64 057 9 % 28 826 14 190 49 %
Hungary 23 776 25 113 10 % 12 556 6 765 54 %
Ireland 17 685 20 498 10 % 10 249 4 020 39 %
Italy 196 699 205 300 15 % 153 862 48 933 32 %
Latvia 2 849 4 362 10 % 2 181 897 41 %
Liechtenstein 9 19 11 % 10 0 -
Lithuania 5 973 7 847 20 % 7 847 4 373 56 %
Luxembourg 2 146 2 488 10 % 1 244 540 43 %
Malta 1 931 2 137 10 % 1 069 0 -
Netherlands 82 310 82 569 10 % 41 285 8 283 20 %
Norway 19 271 7 877 13 % * 12 526 6 371 51 %
Poland 199 509 203 570 10 % 101 785 55 701 55 %
Portugal 26 841 31 597 10 % 15 799 8 102 51 %
Romania 52 847 73 926 10 % 36 963 17 041 46 %
Slovakia 22 713 32 255 7 % 11 289 8 841 78 %
Slovenia 8 263 8 213 16 % 6 472 2 632 41 %
Spain 138 634 151 581 20 % 151 581 69 114 46 %
Sweden 20 016 22 248 10 % 11 124 3 428 31 %
United Kingdom 238 827 218 147 8 % 87 259 33 505 38 %
EU‑15 1 492 956 1 476 880 15 % 1 105 512 421 438 38 %
EU‑27 1 941 414 1 974 586 14 % 1 354 568 548 950 41 %
All EU ETS countries 1 960 693 1 982 482 14 % 1 358 912 555 321 41 %
Table 4.5 Limit on the use of JI and CDM credits by EU ETS operators
Note: Estonia: Up to the year 2010, no offsets were permitted in Estonia. For 2011 and 2012, 10 % are allowed (based on the NAP notified by Estonia on 5 September 2011), which would be equivalent to 4 % over the five‑year period from 2008 to 2012.
Norway: The allowed use of CER/ERU is defined as a share of verified emissions (instead of free allocation). The share of free allocation compared to emissions is considerably lower in Norway than in all the other participating countries (Norwegian operators of combustion installations received only 19 % of their actual 2008-to-2011 emissions as free allocation). Whereas the EU Member States are bound by the Emission Trading Directive which foresees at least 90 % of free allocation in the second trading period, Norway could choose to apply stricter standards.
Source: CITL extract as of September 2012; EEA, 2009; EC, 2012.

The European Union Emissions Trading System
51Greenhouse gas emission trends and projections in Europe 2012
together having accounted for 68 % of the CERs and ERUs used.
As a part of the second NAPs, Member States had to set a limit on the maximum use of project-based credits by operators. In total, up to 1 359 million CERs or ERUs may be used by ETS installations from all participating countries in the second trading period (see Figure 4.5). This corresponds to 14 % of the total free allocation (all 30 countries) in the second trading period. However, the limits on the use of JI and CDM credits represent an upper boundary; they may not be completely used in the period from 2008 to 2012. Furthermore, the revised ETS Directive allows operators to use the total number of CDM and JI credits initially permitted in the period from 2008 to 2012 in the total period from 2008 to 2020. From 2013 onwards, certain CDM project types are no longer permitted; this might incentivise their use now, even if the operator receives enough free allocation to cover their emissions.
In the first four years of the trading period, 41 % of the allowable offsets were used. This figure differs significantly from country to country, though most countries stayed way below the average allowed usage. Slovakian operators have already made use of 78 % of their allowed amount, which is almost proportional to the annual allowed use. Other countries with substantial use (more than 50 % of the allowed amounts of CERs/ERUs) are Bulgaria (59 %), Hungary (54 %), Lithuania (56 %), Norway (51 %), Poland (55 %) and Portugal (51 %).
4.5 Aviation in the EU ETS
Since 1 January 2012, the last year of the second trading period, aviation entered the system (EC, 2008). All flights arriving at and departing from EEA airports (27 EU Member States, Norway, Iceland and Liechtenstein) are covered until their first stop. Small aircrafts (under 5.7 tonnes maximum take-off mass), state, military, rescue, emergency, visual flight rules and training flights, and commercial air transport operators with less than 2 flights per day or emitting less than 10 000 tonnes of CO2 per year are exempted.
The cap on aviation is based on average historic emissions from 2004 to 2006 (221.4 Mt CO2 for all participating countries (EC, 2011a; EEA Joint Committee, 2011). The cap for 2012 equals 97 % of the baseline and will be reduced to 95 % of baseline emissions in the years from 2013 to 2020. It thus expands the total ETS cap by approximately 10 %. The predominant method of distribution will be free allocation to aircraft operators (85 % in 2012,
then 82 % from 2013 to 2020); 15 % will be sold by auction, and the remaining 3 % from 2013 onwards is allocated to the special reserve for new entrants and fast growing airlines. Free allocation is based on benchmarks calculated by dividing the total number of allowances to be allocated for free by the sum of the tonne-kilometre data included in aircraft operators' applications for free allocation (EC, 2011b).
Whereas aircraft operators may use aviation allowances as well as the allowances from the stationary sectors, stationary installations are not allowed to use aviation allowances for compliance. This is especially important in 2012, as the aviation allowances are not backed by AAUs: if they were acceptable for compliance in the stationary sector, those units would be missing when ensuring Kyoto compliance. Credits from flexible mechanisms may be used additionally by aircraft operators: in 2012 up to 15 % of their verified emissions, whereas from 2013 onwards, the final quantity is to be determined, but it will not be below 1.5 % of verified emissions.
The EU ETS covers all airlines that fly to and from Europe. This led to legal challenges (e.g. by some US airlines and their trade associations) claiming that the inclusion of aviation in the EU ETS infringes international law. In its ruling of 21 December 2011, the European Court of Justice concluded that the legislation is fully consistent with international law and that the EU ETS is not a tax, a fee, nor a charge on fuel.
4.6 Outlook for the third trading period (2013–2020)
The scope of the EU ETS has been growing ever since its introduction, and will continue to do so. From 2013 onwards, more CO2 emissions from installations producing bulk organic chemicals, hydrogen, ammonia and aluminium will be included. Additionally, N2O emissions from the production of nitric, adipic glyoxal and glyoxylic acid, and PFC emissions from the aluminium sector will be included.
The third trading period will last eight years, and both cap setting and rules for free allocation are set at European level rather than by EU Member States. The cap will decrease continuously from 2013 onwards using a linear reduction factor of 1.74 % (see Figure 4.6). The cap for aviation remains stable over time. Auctioning will play a much greater role than in the past, while the share of free allocation will decline

The European Union Emissions Trading System
52 Greenhouse gas emission trends and projections in Europe 2012
Figure 4.6 Perspective of the EU ETS cap up to 2050
Source: Öko-Institut, 2012, updated by ETC/ACM.
over time. The latter will be based on EU-wide harmonised allocation rules founded on benchmarks.
Furthermore, for the use of offsets, tighter quality restrictions will apply. Currently, EU legislation excludes JI/CDM credits from nuclear projects and
Mt CO2-equivalent
0
500
1 000
1 500
2 000
2 500
3 000
2005 2010 2015 2020 2025 2030 2035 2040 2045 2050
EU ETS cap for aviation in 2012EU ETS cap phase 2 EU ETS cap phase 1
EU ETS cap phase 3
Phase1 Phase 2 Phase 3 Phase 4 and subsequent phases
EU ETS cap phase 3 including aviation
temporary forest credits; for large hydroelectricity projects, certain conditions apply. From 2013 onwards, the use of credits from CDM and JI projects destructing trifluoromethane (HFC-23) and N2O from adipic acid production will no longer be permitted under the EU ETS.
The European Union Emissions Trading System
53Greenhouse gas emission trends and projections in Europe 2012
Box 4.1 Auctioning profile during the third trading period
In 2010 the distribution of auctioning volumes in the years 2013–2020 was laid down in Commission Regulation (EU) No 1031/2010 (the Auctioning Regulation) (EC 2010c). To ensure an orderly transition from the second to the third phase, this regulation was amended in 2011 to advance some auction volumes from 2013/2014 to 2012.
The carbon market is currently marked by an oversupply of allowances built up over the last few years, both due to a low demand e.g. due to the economic crisis and by a high supply e.g. caused by the inflow of credits from flexible mechanisms and the 2011 change of the auctioning profile.
On 25 July 2012, the European Commission published a Decision proposal to technically amend the EU ETS Directive in order to clarify that the time profile for auctions can be adjusted in exceptional circumstances to ensure an orderly functioning of the market (EC, 2012a).The Commission also proposed that a certain quantity of allowances be auctioned later in the phase ('back-loading'). In the related Commission Staff Working Document (EC, 2012b) three options to revise the auction time profile are assessed. The amount of allowances to be auctioned would be reduced in the years 2013 to 2015 (by 1.2, 0.9 or 0.4 billion EUA depending on the degree of back-loading) as the supply-demand imbalance is expected to peak in these years. In the following years 2016 to 2020 the same amount of allowances would be reintroduced into the market and the amount auctioned would increase accordingly. The total of allowances sold in the period 2013 to 2020 would be unchanged and thus the expected surplus of allowances in 2020 is identical in all three scenarios.
The Commission organised a public consultation from 25 July 2012 to 16 October 2012 to collect views from stakeholders and experts in the field of European carbon market on the draft for a future amendment of the Auctioning Regulation and on the amount of auctioned allowances which should be back-loaded. By the end of 2012 the Commission was also expected to present a first report on the functioning of the European carbon market and to finalise the options for long-term structural measures which might be needed to address the challenges in the EU ETS.

Greenhouse gas emission trends and projections in Europe 201254
2020 GHG emission targets in the EU and European countries
5 2020 GHG emission targets in the EU and European countries
In 2007, the EU committed to a unilateral 20 % GHG reduction target, which corresponds to a 14 % decrease in GHG emissions between 2005 and 2020. The EU Climate and Energy Package adopted in 2009 sets a legislative framework to achieve this objective in a two-fold way: a 21 % reduction of emissions covered under the EU ETS compared to 2005 levels, to be achieved across the whole EU, and an effort to reduce emissions not covered by the EU ETS by about 10 % compared to 2005 levels, shared between the 27 Member States through differentiated national GHG targets under the ESD.
While relative targets were already set under the ESD, absolute GHG targets were determined by the Commission in 2012, following an internal EU technical review of GHG emission estimates of all Member States for the years 2005, 2008, 2009 and 2010.
In addition to the necessity for each Member State to adopt and implement policies and measures limiting or reducing domestic emissions in the non-ETS sectors, the ESD provides flexibility in means for Member States to reach their targets, by allowing transfers of annual emissions allocations between years and between Member States, and through the limited use of project-based credits from the CDM and JI.
At the international level, discussions are taking place regarding Quantified Emission Limitation or Reduction Commitments (QELRCs) for the second commitment period under the KP. In April 2012, the EU submitted information on its QELRC to translate its 2020 target pledge into an emission budget for a second commitment period (CP2) under the KP based on the legislation adopted under the Climate and Energy Package. This results in an overall QELRC value of 80 % of base-year emissions. According to calculations from the UNFCCC Secretariat, such QELRC would fall into the IPCC range of a 25 % to 40 % reduction by 2020 compared to 1990 levels, assuming a linear decrease in emissions from average CP1 target levels.
The EU also stands by its offer to move from a 20 % to a 30 % reduction by 2020 compared to 1990 levels, as part of a global and comprehensive agreement for the period beyond 2012, provided that other developed countries commit themselves to comparable emission reductions and developing countries contribute adequately according to their responsibilities and respective capabilities.
5.1 The EU Climate and Energy Package
In March 2007, the European Council committed the EU to become a highly energy-efficient, low carbon economy by reducing its GHG emissions by at least 20 % by 2020 compared to 1990 levels, and to increase this commitment to a 30 % reduction if major emitting countries outside Europe make similarly challenging commitments under a global climate agreement.
The EU's Climate and Energy Package was adopted in April 2009, aiming at enabling the EU to achieve the 20 % reduction target in GHG emissions and the 20 % target for renewable energy use. Under the package, the 20 % reduction target for total GHG
emissions, which is equivalent to a 14 % reduction in GHG emissions between 2005 and 2020, was divided into two sub-targets:
• a 21 % reduction target compared to 2005 for the emissions covered by the EU ETS (including domestic and international aviation);
• a 10 % reduction target compared to 2005 for the remaining non-ETS emissions.
In order to achieve a 21 % reduction of ETS emissions in 2020, the EU-wide cap will decrease annually by 1.74 % starting from the average level of allowances issued by Member States for the second trading period (2008–2012) (see also Section 4.6).

2020 GHG emission targets in the EU and European countries
55Greenhouse gas emission trends and projections in Europe 2012
Figure 5.1 GHG targets under the Climate and Energy Package
Note: Emissions from international aviation and maritime transport, not covered by the Kyoto Protocol, are not included in the total emissions presented in this figure.
Source: EEA, 2011a.
The ESD establishes binding annual targets for greenhouse gas emissions not covered by the EU ETS for all Member States for the period 2013–2020. At the EU level, this will deliver an approximate 10 % reduction of emissions from the covered sectors in 2020 compared with 2005 levels.
5.2 National 2020 GHG emission targets under the Effort Sharing Decision
Non-trading emissions addressed under the ESD cover emissions from all sources outside the EU ETS, except for emissions from international maritime and emissions and removals from LULUCF. It thus includes a diverse range of small-scale emitters in a wide range of sectors such as transport (cars, trucks), buildings (in particular heating), services, small industrial installations, agriculture and waste. Such sources currently account for about 60 % of total GHG emissions in the EU.
While the EU ETS target is to be achieved by the EU as a whole, irrespective of the country in which the reduction takes place, the non-ETS target was divided into national targets to be achieved individually by each Member State.
GHG target: – 20 % compared to 1990
– 14 % compared to 2005
EU ETS– 21 % compared to 2005
Non-ETS sectors – 10 % compared to 2005
27 Member State targets, streching from – 20 % to + 20 %
Each Member State will contribute to this effort according to its relative wealth in terms of GDP per capita. The national emission targets range from a 20 % reduction for the richest Member States to a 20 % increase for poorer ones in 2020 compared with 2005 levels. Less wealthy countries are allowed emission increases in these sectors because their relatively higher economic growth is likely to be accompanied by higher emissions. Nevertheless their targets still represent a limit on emissions and a reduction effort will be required in all Member States.
Pursuant to Article 3.2 of the ESD, the European Commission determined in 2012 the annual emission allocations of Member States for the period from 2013 to 2020, using reviewed and verified emission data for the years 2005, 2008, 2009 and 2010. To support this process, a technical review of the relevant emission inventories of all Member States and Croatia was conducted in 2012, in accordance with specific review guidelines (EC, 2012b) prepared for the Commission by the EEA in close consultation with Member State experts in the EU Climate Change Committee.

2020 GHG emission targets in the EU and European countries
56 Greenhouse gas emission trends and projections in Europe 2012
5.3 Use of flexibility options in the ESD annual compliance cycle
With respect to the annual compliance cycle, Member State will need to introduce policies and measures to limit and lower their emissions in the various non-ETS sectors. The ESD also provides flexibility for means for Member States to reach their targets by allowing transfers of annual emissions allocations between years, between Member States, and through the use of external credits from CDM and JI projects.
Member States are allowed to make use of flexibility provisions for meeting their targets:
• Within the Member State itself, any overachievement in a year of the period 2013–2019 can be carried over to subsequent years, up to 2020. An emission allocation of up to 5 % during 2013–2019 may be carried forward from the following year.
• Between Member States, Member States may transfer up to 5 % of their annual emission allocation to other Member States, which may use this emission allocation until 2020 (ex-ante). Any overachievement in a year of the period 2013–2019 may also be transferred to other Member States, which may use this emission allocation until 2020 (ex-post).
Figure 5.2 National 2020 GHG emission limits under the ESD relative to 2005 emissions levels
Source: EC, 2009a (Annex II).
– 25
– 20
– 15
– 10
– 5
0
5
10
15
20
25
EU
2020 emissions compared to 2005 in %
Lithu
ania
Latvia
Esto
nia
Roman
ia
Bulgar
ia
Hunga
ry
Slov
akia
Poland
Czec
h Re
public
Slov
enia
Malta
Swed
en
Unite
d King
dom
Greec
e
Fran
ce
Portu
gal
Belgium
German
y
Nethe
rland
sIta
ly
Denmar
k
Ireland
Spain
Cypr
us
Austria
Finland
Luxe
mbo
urg
Member States may use JI/CDM credits according to the following provisions:
• The use of project-based emission credits is capped on a yearly basis up to 3 % of 2005 non-ETS emissions in Member State.
• Member States that do not use their 3 % limit for the use of project based credits in any specific year can transfer their unused part for that year to other Member States or bank it for own use until 2020.
• Member States, which fulfil further criteria (Austria, Belgium, Denmark, Finland, Ireland, Spain, Italy, Cyprus, Luxembourg, Portugal, Slovenia and Sweden) may use project-based credits up to an additional 1 % of their verified emissions in 2005; not bankable and transferable.
Overall, up to 750 Mt JI/CDM credits could be used during the period from 2013 to 2020.
Any Member State with emissions exceeding its annual emission allocations, even after taking into account the flexibility provisions and the use of JI/CDM credits, will face a normal infringement procedure from the Commission, as well as the following consequences:
• Deduction from the annual emission allocation for the next year of the excess emissions multiplied by 1.08 (8 % interest rate).
2020 GHG emission targets in the EU and European countries
57Greenhouse gas emission trends and projections in Europe 2012
• Development of a corrective action plan; the Commission may issue an opinion based on comments from Climate Change Committee.
• Transfer of emission allocations and project-based credits from the Member State's will be temporarily suspended.
5.4 Post‑2012 emission reduction commitments in Europe under the Kyoto Protocol
At the 2011 Conference of the Parties (COP17) in Durban, South Africa, parties were invited to submit information on their QELRCs for the second commitment period under the KP by 1 May 2012 to the UNFCCC Secretariat. The QELRCs submitted have been subject to further discussion and analysis in the negotiations on a second commitment period. The intention is that the Doha climate conference at the end of 2012 will adopt, in the context of progress on all elements of the Durban package, a set of amendments to the Kyoto Protocol, including a new Annex B that will contain QELRCs for Annex I parties that intend to take part in such second commitment period.
In April 2012, the EU submitted information on its QELRC to translate its 2020 target pledge into an emission budget for a second commitment period (CP2) under the KP based on the legislation adopted under the Climate and Energy Package.
The scope of existing EU legislation implementing its 20 % commitment is different from the scope of the CP2, which is why the total allowed emissions or 'emissions budget' under the Climate and Energy Package cannot be used directly in the calculation of the corresponding QELRO. The main differences between the Climate and Energy Package and CP2 which have been taken into account in determining the provisional information on QELROs are the following:
• International aviation: is included in the Climate and Energy Package and its overall
QELRQELRC
A QELRC describes the level of assigned amounts (see Section 2.1) as a percentage of a party's base-year emissions. It is calculated using the following formula:
QELRC = Total allowed emissions during commitment periodBase-year emissions x length commitment period
=Average annual allowed emissions
Base-year emissions
20 % reduction target, while its emissions are not accounted for under the Kyoto Protocol.
• LULUCF: the LULUCF sector in the EU is not included in the 20 % target under the CE package, but is accounted for under the Kyoto Protocol according to the relevant decisions made in Durban.
• Inclusion of NF3: nitrogen trifluoride (NF3) is not included in the Climate and Energy Package, whereas the scope of CP2 has been extended to include the additional gas. The impact of NF3 on aggregate EU emissions is insignificant.
• Global Warming Potentials (GWP): the Climate and Energy Package uses the GWP of the 2nd Assessment report of the IPCC to aggregate GHG emissions, whereas the GWP of CP2 have been updated to those included in the 4th Assessment Report. The expected impact of using the updated GWP values under CP2 is an additional reduction in EU emissions of up to 0.5 % compared to using IPCC AR2 GWP.
• Base years: the EU 2020 target uses 1990 as the base year, while it was agreed in Durban to continue with the same flexibilities to set a different base year which applied to CP1.
The process of translating the 2013–2020 emission budget under EU legislation to the Kyoto rules for an 8-year period (from 2013 to 2020), taking into account these differences results in an overall QELRC value of 80 % of base-year emissions (EC 2012, UNFCCC 2012a).
The EU also stands by its offer to move from a 20 % to a 30 % reduction by 2020 compared to 1990 levels, as part of a global and comprehensive agreement for the period beyond 2012, provided that other developed countries commit themselves to comparable emission reductions and developing countries contribute adequately according to their responsibilities and respective capabilities. Translating a 30 % target into a QELRC would raise similar issues with regard to the translation from EU legislation to the Kyoto accounting rules. In addition, a range of further issues will need to be taken into account, including starting points and reduction trajectories for the main parts

2020 GHG emission targets in the EU and European countries
58 Greenhouse gas emission trends and projections in Europe 2012
of the EU Climate and Energy Package, as well as decisions on the approach to LULUCF.
Croatia and Iceland have already announced that they will jointly fulfil their emission reductions commitments with the EU and their QELRCs. The calculation of a QELRC for Iceland in a revised Annex B in the KP for the CP2 would therefore be the same as for the European Union, its 27 Member States, and for Croatia. Information on QELRCs has also been submitted by Liechtenstein, Norway and Switzerland (see Table 5.1).
The UNFCCC Secretariat performed an analysis of QELRCs expressed as percentage of base year and absolute emission levels using the information submitted by Parties before and during the first part
Table 5.1 Overview table of QELRCs submitted by European countries
Party Base‑year emissions QELRC submitted by parties (2013–2020)
Average annual emissions in the commitment period consistent
with the QELRC
(Mt CO2‑equivalent) (%) (Mt CO2‑equivalent)
EU-27 5 736.16 80.0 4 588.9
Croatia 27.97 80.0 22.4
Iceland 3.50 80.0 2.8
Liechtenstein 0.23 84.0–78.0 0.2–0.2
Norway 49.80 84.0–81.0 41.8–40.3
Switzerland 53.06 84.2–77.7 44.7–41.2
Source: UNFCCC, 2012b.
of the seventeenth session of the Ad-Hoc Working Group on Further Commitments for Annex I Parties under the Kyoto Protocol (AWG-KP) (UNFCCC, 2012b). According to these calculations, assuming a linear decrease starting from 2010 at a level corresponding to CP1's average annual emission objectives for KP's Annex B parties (excluding Canada, Japan and the Russian Federation), the achievement of the IPCC's objective of a 25 % to 40 % reduction by 2020 compared to 1990 levels would require an overall QELRC for these parties comprised between 72.1 and 82.9. The pledges from the EU, Croatia and Iceland of respective QELRCs of 80 % below base-year emissions would therefore fall into this range. So would also the ambitious end of the range of QELRCs proposed by Liechtenstein, Norway and Switzerland.
59
Projected progress towards 2020 targets
Greenhouse gas emission trends and projections in Europe 2012
6 Projected progress towards 2020 targets
Based on recent estimates from 14 Member States and the EEA, total GHG emissions of the EU decreased by 2.5 % in 2011, standing approximately 17.6 % below their 1990 levels (about 16.5 %, if emissions from international aviation are taken into account). This important drop follows a 2 % increase in emissions observed in 2010 and substantial emission reductions in 2009 in all Member States. Projections from Member States indicate that total EU emissions will continue to fall slightly until 2020. With the current set of national domestic measures in place, Member States are expected to reach a level in 2020 which is 19 % below 1990 levels and close to the 20 % reduction target.
At national level, projections show that 13 Member States (Bulgaria, Cyprus, the Czech Republic, Germany, Hungary, Lithuania, the Netherlands, Poland, Portugal, Romania, Slovakia, Sweden and the United Kingdom) could achieve their individual 2020 targets in the sectors not covered by the EU ETS with the current set of domestic policies and measures. Eight additional Member States (Austria, Denmark, Estonia, Finland, France, Italy, Latvia and Slovenia) would achieve their target through the implementation of additional measures. The remaining six Member States (Belgium, Ireland, Greece, Spain, Luxembourg and Malta) would not achieve their targets through domestic emission reductions alone, even if the currently planned measures were to be implemented (although the gap would be extremely small in the case of Spain). These Member States could still meet their national 2020 targets through the use of flexibility options, provided by the ESD.
Looking beyond 2020, partial information from Member States indicates that existing and currently planned measures are not likely to be sufficient to keep the EU on the path to achieving its long-term emission reduction goals. In particular, achieving a reduction of emissions by 80 % to 95 % by 2050 compared to 1990, as agreed by European heads of state and government, will require enhanced efforts from Member States. For example, aggregated projections for 2030 indicate an approximate emission reduction of 30 % compared to 1990, while cost-effective emission reductions consistent with the long-term target should be in the magnitude of 40 %.
6.1 EU projected progress towards its 2020 target and beyond
According to approximated estimates of 2011 GHG emissions available from 14 Member States (27) and the EEA as of September 2012, GHG emissions from the EU (28) fell by 2.5 % from 2010 to 2011, despite higher coal consumption and a growing GDP. Based on these estimates, EU 2011 emissions stand approximately 17.6 % below the 1990 level (29). This
represents the lowest emission level observed in the EU since the beginning of the time series covered by the EU GHG inventory, 1990.
The main reasons for the decrease in emissions were a milder winter in most parts of the EU, which resulted in lower heating demand from households, and reduced natural gas consumption. Renewable energy consumption also continued to increase in 2011, which contributed to the observed drop in emissions.
(27) Austria, Denmark, Finland, France, Germany, Greece, Ireland, Italy, Luxembourg, the Netherlands, Poland, Slovenia, Spain, and the United Kingdom.
(28) Excluding LULUCF and international aviation and shipping as well as emission reductions achieved through the Kyoto Protocol's flexible mechanisms.
(29) According to the EEA estimates for the whole EU (i.e. without taking into account the estimates provided by Member States), EU 2011 emissions stood 17.5 % below 1990 levels. These estimates are based on publicly available verified EU ETS emissions, and other national and European sources, available as of mid-July 2012. The uncertainty in the current emissions estimates is 2.5 % (+/– 0.3 percentage points).
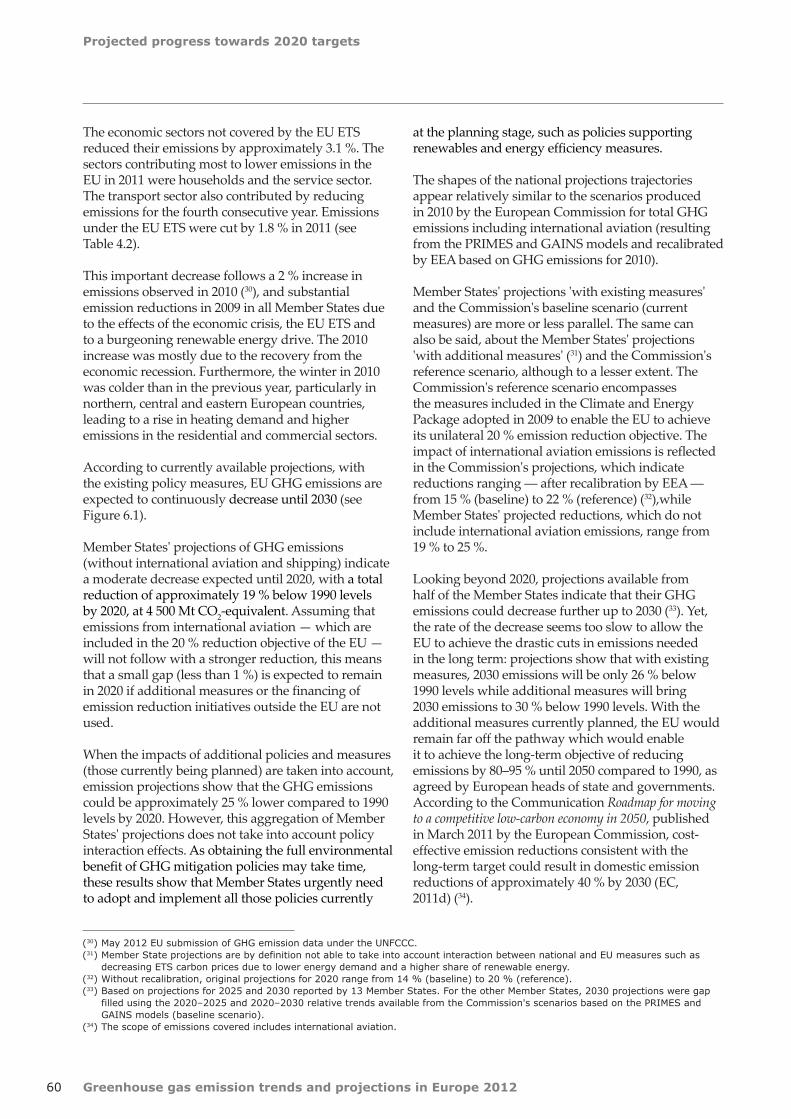
Projected progress towards 2020 targets
60 Greenhouse gas emission trends and projections in Europe 2012
The economic sectors not covered by the EU ETS reduced their emissions by approximately 3.1 %. The sectors contributing most to lower emissions in the EU in 2011 were households and the service sector. The transport sector also contributed by reducing emissions for the fourth consecutive year. Emissions under the EU ETS were cut by 1.8 % in 2011 (see Table 4.2).
This important decrease follows a 2 % increase in emissions observed in 2010 (30), and substantial emission reductions in 2009 in all Member States due to the effects of the economic crisis, the EU ETS and to a burgeoning renewable energy drive. The 2010 increase was mostly due to the recovery from the economic recession. Furthermore, the winter in 2010 was colder than in the previous year, particularly in northern, central and eastern European countries, leading to a rise in heating demand and higher emissions in the residential and commercial sectors.
According to currently available projections, with the existing policy measures, EU GHG emissions are expected to continuously decrease until 2030 (see Figure 6.1).
Member States' projections of GHG emissions (without international aviation and shipping) indicate a moderate decrease expected until 2020, with a total reduction of approximately 19 % below 1990 levels by 2020, at 4 500 Mt CO2-equivalent. Assuming that emissions from international aviation — which are included in the 20 % reduction objective of the EU — will not follow with a stronger reduction, this means that a small gap (less than 1 %) is expected to remain in 2020 if additional measures or the financing of emission reduction initiatives outside the EU are not used.
When the impacts of additional policies and measures (those currently being planned) are taken into account, emission projections show that the GHG emissions could be approximately 25 % lower compared to 1990 levels by 2020. However, this aggregation of Member States' projections does not take into account policy interaction effects. As obtaining the full environmental benefit of GHG mitigation policies may take time, these results show that Member States urgently need to adopt and implement all those policies currently
(30) May 2012 EU submission of GHG emission data under the UNFCCC.(31) Member State projections are by definition not able to take into account interaction between national and EU measures such as
decreasing ETS carbon prices due to lower energy demand and a higher share of renewable energy.(32) Without recalibration, original projections for 2020 range from 14 % (baseline) to 20 % (reference).(33) Based on projections for 2025 and 2030 reported by 13 Member States. For the other Member States, 2030 projections were gap
filled using the 2020–2025 and 2020–2030 relative trends available from the Commission's scenarios based on the PRIMES and GAINS models (baseline scenario).
(34) The scope of emissions covered includes international aviation.
at the planning stage, such as policies supporting renewables and energy efficiency measures.
The shapes of the national projections trajectories appear relatively similar to the scenarios produced in 2010 by the European Commission for total GHG emissions including international aviation (resulting from the PRIMES and GAINS models and recalibrated by EEA based on GHG emissions for 2010).
Member States' projections 'with existing measures' and the Commission's baseline scenario (current measures) are more or less parallel. The same can also be said, about the Member States' projections 'with additional measures' (31) and the Commission's reference scenario, although to a lesser extent. The Commission's reference scenario encompasses the measures included in the Climate and Energy Package adopted in 2009 to enable the EU to achieve its unilateral 20 % emission reduction objective. The impact of international aviation emissions is reflected in the Commission's projections, which indicate reductions ranging ― after recalibration by EEA ― from 15 % (baseline) to 22 % (reference) (32),while Member States' projected reductions, which do not include international aviation emissions, range from 19 % to 25 %.
Looking beyond 2020, projections available from half of the Member States indicate that their GHG emissions could decrease further up to 2030 (33). Yet, the rate of the decrease seems too slow to allow the EU to achieve the drastic cuts in emissions needed in the long term: projections show that with existing measures, 2030 emissions will be only 26 % below 1990 levels while additional measures will bring 2030 emissions to 30 % below 1990 levels. With the additional measures currently planned, the EU would remain far off the pathway which would enable it to achieve the long-term objective of reducing emissions by 80–95 % until 2050 compared to 1990, as agreed by European heads of state and governments. According to the Communication Roadmap for moving to a competitive low-carbon economy in 2050, published in March 2011 by the European Commission, cost-effective emission reductions consistent with the long-term target could result in domestic emission reductions of approximately 40 % by 2030 (EC, 2011d) (34).

Projected progress towards 2020 targets
61Greenhouse gas emission trends and projections in Europe 2012
Figure 6.1 Trends and projections of EU total GHG emissions, 1990–2030
Note: PRIMES/GAINS projections recalibrated by EEA, based on 2010 GHG emissions. Member State projections do not include international aviation, while the PRIMES/GAINS scenarios do. 2025 and 2030 projections are based on information provided by 12 Member States. For other Member States, 2030 projections were gap filled using the 2020–2025 and 2020–2030 relative trends available from the Commission's scenarios based on the PRIMES and GAINS models.
The gaps observed between the end of historic trends and the start of projected trends are due to the fact that the absolute projection data was not calibrated on the latest 2011 GHG proxy inventory data.
Source: EEA, 2012a; EEA, 2012b; EC, 2010a.
0
1 000
2 000
3 000
4 000
5 000
6 000
1990 1995 2000 2005 2010 2015 2020 2025 2030
Mt CO2-equivalent
GHG emissions excluding international aviation GHG emissions including international aviation
Member States projections with existing measures Primes/gains baseline
Member States projections with additional measures Primes/gains full package implementation (– 20%)
20 % target by 2020 30 % target by 2020
– 30 %
– 20 %
6.2 Sectoral projections until 2020
Projections by sector indicate that with the existing measures currently in place, emissions will decrease between 2011 and 2020 in the main emitting sectors, except for the transport sector and emissions from industrial processes.
The largest reductions are expected to occur in the energy supply sector (energy industries), consisting mostly of public electricity and heat production (reductions of a magnitude of 135 Mt CO2-equivalent). These absolute reductions are expected to be considerably larger than the reductions expected in the energy use sector (as defined under the IPCC nomenclature, i.e. direct fuel combustion only, not accounting for electricity
consumption which is included in the energy supply), the agriculture sector and the waste sector (36, 30 and 34 Mt CO2-equivalent respectively).
Additional measures will mostly target the energy supply and energy use sectors (magnitude of 110 Mt CO2-equivalent and 85 Mt equivalent for each sector respectively), as well as the transport sector (around 45 Mt CO2-equivalent). In the latter sector (excluding emissions from international aviation and maritime transport), the implementation of additional measures could result in a stabilisation of its emissions by 2015 and net reductions by 2020 but emission levels would still remain between 9 % and 15 % higher than in 1990 by 2020, depending on the scenario considered. Additional measures in the agriculture, industrial

Projected progress towards 2020 targets
62 Greenhouse gas emission trends and projections in Europe 2012
Figure 6.2 Sectoral trends and projections of EU GHG emissions
Note: Solid lines represent historic emissions up to 2011 and WEM projections from 2011 onwards. Dashed lines represent WAM projections.
The gaps observed between the end of historic trends and the start of projected trends are due to the fact that absolute projection data were not calibrated on the latest 2011 GHG proxy inventory data.
Source: EEA, 2012a; EEA, 2012b.
processes and the waste sectors are currently not expected to contribute towards meaningful absolute reductions despite the potential that these sectors offer in terms of emission reductions especially in the waste sector (EEA, 2011).
6.3 Projected progress towards national 2020 targets in non‑ETS sectors
An assessment of Member States' progress towards their 2020 targets was carried out (see Table 9.2), based on the calculation of a relative gap between:
• absolute national 2020 targets under the ESD, consistent with the 2013–2020 ETS scope, based on:
− the calculation of the 2020 targets consistent with the 2008–2012 ETS scope based on 2012 GHG inventory data, the outcome of the 2012 technical review of GHG inventories and ETS verified emission data (35);
− expected adjustments related to the ETS cap under Article 10 of the ESD (extension of the ETS scope in 2013 and unilateral inclusion of installations in 2008–2012);
• projections of non-ETS emissions for 2020, consistent with the 2013–2020 ETS scope, taking into consideration the existing measures as well as the possible implementation of additional measures.
In 2012, only two Member States (Ireland and Luxembourg) reported updated projections on
0
200
400
600
800
1 000
1 200
1 400
1 600
1 800
2 000
1990 1995 2000 2005 2010 2015 2020
Mt CO2-equivalent
Energy industries
Energy use (direct combustion)
Transport
Agriculture
Industrial processes
Waste
Solvents
(35) A Commission decision concerning the absolute 2020 targets consistent with the 2008–2012 scope was planned to be adopted shortly after the publication of this report.
Projected progress towards 2020 targets
63Greenhouse gas emission trends and projections in Europe 2012
Figure 6.3 Projected gaps between 2020 GHG emissions and national targets in sectors not covered by the EU ETS
Note: Progress calculated based on domestic emissions only, without accounting for possible use of flexibility options. The 2020 targets and 2005 non-ETS emissions are all consistent with 2013–2020 ETS scope, i.e. they take into account the extension of the ETS scope in 2013 and the unilateral inclusion of installation in 2008–2012. Relative gaps are calculated as a ratio between the difference (projected non-ETS 2020 emissions – estimates of 2020 targets under the ESD) and EEA estimates of 2005 non-ETS emissions consistent with 2013–2020 ETS scope.
Source: EEA, 2012b; EC, 2012.
– 27
– 17
– 28
– 16
– 7
0
0
– 10
– 11
– 2
– 1
– 1
– 10
3
7
2
8
– 3
10
– 13
3
14
17
16
15
14
36
1
– 20
– 10
– 6
– 6
– 3
0
0
2
3
4
5
7
9
10
10
14
40
40
8
– 40 – 30 – 20 – 10 0 10 20 30 40 50
Luxembourg
Ireland
Malta
Belgium
Greece
Spain
Sweden
Denmark
Austria
Finland
Estonia
Latvia
Italy
Lithuania
United Kingdom
Netherlands
Bulgaria
France
Romania
Slovenia
Germany
Poland
Portugal
Czech Republic
Slovakia
Cyprus
Hungary
EU-27
% of 2005 non-ETS emissions
Projected shortfall (–) or overachievement (+) of 2020 non-ETS target with existing measures
Projected shortfall (–) or overachievement (+) of 2020 non-ETS target with additional measures
1
2
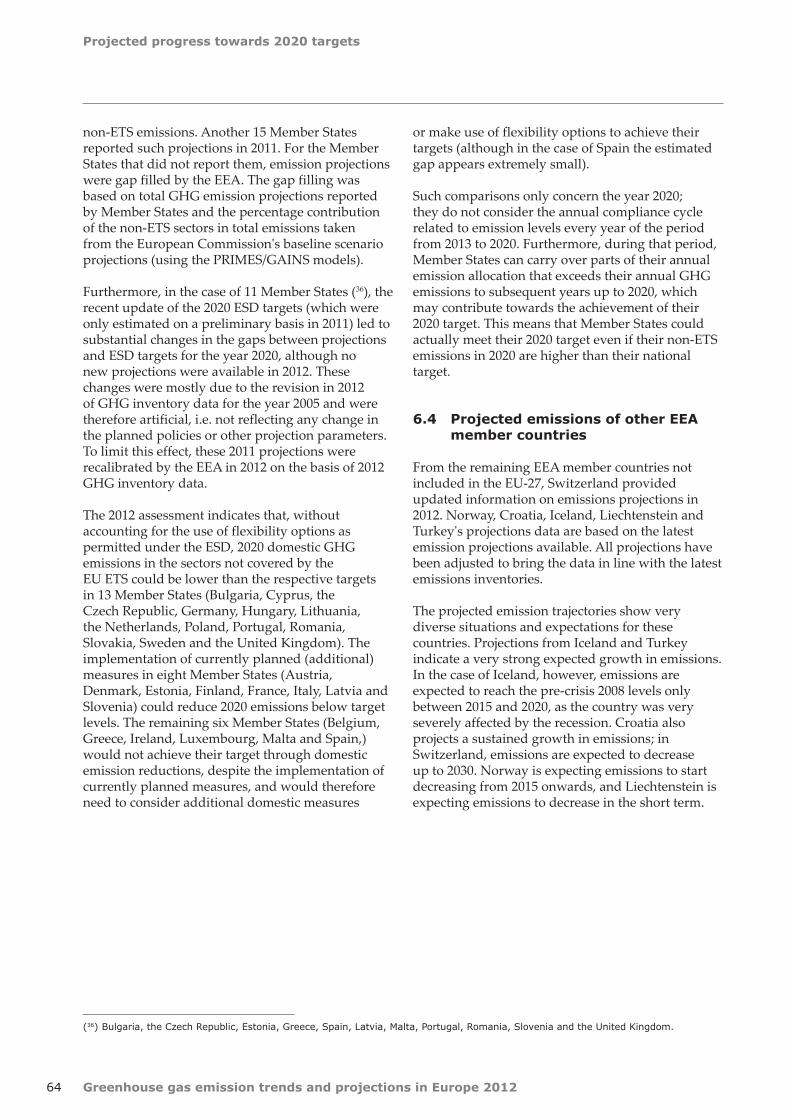
Projected progress towards 2020 targets
64 Greenhouse gas emission trends and projections in Europe 2012
non-ETS emissions. Another 15 Member States reported such projections in 2011. For the Member States that did not report them, emission projections were gap filled by the EEA. The gap filling was based on total GHG emission projections reported by Member States and the percentage contribution of the non-ETS sectors in total emissions taken from the European Commission's baseline scenario projections (using the PRIMES/GAINS models).
Furthermore, in the case of 11 Member States (36), the recent update of the 2020 ESD targets (which were only estimated on a preliminary basis in 2011) led to substantial changes in the gaps between projections and ESD targets for the year 2020, although no new projections were available in 2012. These changes were mostly due to the revision in 2012 of GHG inventory data for the year 2005 and were therefore artificial, i.e. not reflecting any change in the planned policies or other projection parameters. To limit this effect, these 2011 projections were recalibrated by the EEA in 2012 on the basis of 2012 GHG inventory data.
The 2012 assessment indicates that, without accounting for the use of flexibility options as permitted under the ESD, 2020 domestic GHG emissions in the sectors not covered by the EU ETS could be lower than the respective targets in 13 Member States (Bulgaria, Cyprus, the Czech Republic, Germany, Hungary, Lithuania, the Netherlands, Poland, Portugal, Romania, Slovakia, Sweden and the United Kingdom). The implementation of currently planned (additional) measures in eight Member States (Austria, Denmark, Estonia, Finland, France, Italy, Latvia and Slovenia) could reduce 2020 emissions below target levels. The remaining six Member States (Belgium, Greece, Ireland, Luxembourg, Malta and Spain,) would not achieve their target through domestic emission reductions, despite the implementation of currently planned measures, and would therefore need to consider additional domestic measures
(36) Bulgaria, the Czech Republic, Estonia, Greece, Spain, Latvia, Malta, Portugal, Romania, Slovenia and the United Kingdom.
or make use of flexibility options to achieve their targets (although in the case of Spain the estimated gap appears extremely small).
Such comparisons only concern the year 2020; they do not consider the annual compliance cycle related to emission levels every year of the period from 2013 to 2020. Furthermore, during that period, Member States can carry over parts of their annual emission allocation that exceeds their annual GHG emissions to subsequent years up to 2020, which may contribute towards the achievement of their 2020 target. This means that Member States could actually meet their 2020 target even if their non-ETS emissions in 2020 are higher than their national target.
6.4 Projected emissions of other EEA member countries
From the remaining EEA member countries not included in the EU-27, Switzerland provided updated information on emissions projections in 2012. Norway, Croatia, Iceland, Liechtenstein and Turkey's projections data are based on the latest emission projections available. All projections have been adjusted to bring the data in line with the latest emissions inventories.
The projected emission trajectories show very diverse situations and expectations for these countries. Projections from Iceland and Turkey indicate a very strong expected growth in emissions. In the case of Iceland, however, emissions are expected to reach the pre-crisis 2008 levels only between 2015 and 2020, as the country was very severely affected by the recession. Croatia also projects a sustained growth in emissions; in Switzerland, emissions are expected to decrease up to 2030. Norway is expecting emissions to start decreasing from 2015 onwards, and Liechtenstein is expecting emissions to decrease in the short term.
Projected progress towards 2020 targets
65Greenhouse gas emission trends and projections in Europe 2012
Figure 6.4 Historic GHG trends and emission projections in EEA member countries that are not EU Member States, and Croatia, 1990–2020
Note: 2012 information on GHG projections available from Switzerland, 2011 information on GHG projections available from Norway, 2010 information available from Croatia and Liechtenstein, 2007 information available from Turkey and 2006 information available for Iceland.
Source: EEA, 2012b; EEA, 2012c; Government of the Republic of Croatia, 2010; Government of Liechtenstein, 2010.
0
50
100
150
200
250
300
350
400
1990 1995 2000 2005 2010 2015 2020
Index: 100 = 1990 emissions
Turkey Iceland Croatia Norway Liechtenstein Switzerland
Greenhouse gas emission trends and projections in Europe 201266
Glossary of terms and abbreviations
7 Glossary of terms and abbreviations
AAU(s) Assigned amount unit(s). A Kyoto unit representing an allowance to emit one metric tonne of carbon dioxide equivalent (CO2-equivalnet) AAUs are created (issued) up to a level of a party's initial assigned amount
AEA(s) Annual emission allocation(s)
Annex I The annex to the UNFCCC specifying which developed country parties and other parties to the UNFCCC have committed themselves to limiting anthropogenic emissions and enhancing their GHG sinks and reservoirs
Assigned amount The total quantity of valid emission allowances (Kyoto units) held by a party within its national registry. The initial assigned amount for a party is determined by its base-year emissions, and its emission limitation and reduction objective contained in Annex B to the KP. Any Kyoto units that the party acquires through the Kyoto mechanisms, or issues for removals from LULUCF activities under Article 3, paragraphs 3 and 4, are added to the party's assigned amount; any units that the party transfers, or cancels for emissions from LULUCF activities under Article 3, paragraphs 3 and 4, are subtracted from the party's assigned amount. At the end of the commitment period, each party must ensure that its total emissions over the commitment period are less than or equal to its total assigned amount
Cancellation The transfer of a unit to a cancellation account. Such units may not be further transferred, and may not be used towards meeting a party's Kyoto target
Carry-over The authorisation for a unit that was issued in one commitment period to be used in a subsequent commitment period. Individual unit types are subject to different rules for carry-over
CDM Clean Development Mechanism. A KP mechanism that allows Annex I parties to purchase emission allowances from projects in non-Annex I parties that reduce or remove emissions. The emission allowances from CDM projects are called Certified Emission Reductions (CERs)
CER(s) Certified emission reduction(s). A Kyoto unit representing an allowance to emit 1 metric tonne of CO2-equivalent. CERs are issued for emission reductions from CDM project activities.
CITL Community Independent Transaction Log
CO2 Carbon dioxide
CO2-equivalent Carbon dioxide equivalent
COP Conference of the Parties to the United Nations Framework Convention on Climate Change (UNFCCC)
CP Commitment period, the timeframe in which the KP's emission limitation and reduction commitments apply. The first commitment period is 2008–2012. The second will start in 2013
Glossary of terms and abbreviations
67Greenhouse gas emission trends and projections in Europe 2012
Domestic Pertaining to a country's or group of countries' own emissions or internal action to reduce emissions
EC European Community
EEA European Environment Agency
EFTA countries European Free Trade Association countries: Liechtenstein, Switzerland, Norway, Iceland
ERU(s) Emission reduction unit(s). A Kyoto unit representing an allowance to emit 1 metric tonne of CO2-equivalent CERs are issued for emission reductions or emission removals from JI project activities by converting an equivalent quantity of the party's existing AAUs or RMUs
ESD Effort Sharing Decision (Decision No 406/2009/EC of the European Parliament and of the Council of 23 April 2009 on the effort of Member States to reduce their greenhouse gas emissions to meet the Community's greenhouse gas emission reduction commitments up to 2020)
ETC/ACC European Topic Centre on Air and Climate Change. The ETC/ACC is a consortium of European institutes contracted by the EEA to carry out specific tasks in the field of air pollution and climate change
EU ETS European Union Emissions Trading System
EU European Union
EU-12 Belgium, Denmark, Germany, Ireland, Greece, Spain, France, Italy, Luxembourg, Netherlands, Portugal, United Kingdom
EU-15 Austria, Belgium, Denmark, Finland, France, Germany, Greece, Ireland, Italy, Luxembourg, Netherlands, Portugal, Spain, Sweden, United Kingdom
EU-25 Austria, Belgium, Cyprus, Czech Republic, Denmark, Estonia, Finland, France, Germany, Greece, Hungary, Ireland, Italy, Latvia, Lithuania, Luxembourg, Malta, Netherlands, Poland, Portugal, Slovakia, Slovenia, Spain, Sweden, United Kingdom
EU-27 Austria, Belgium, Bulgaria, Cyprus, Czech Republic, Denmark, Estonia, Finland, France, Germany, Greece, Hungary, Ireland, Italy, Latvia, Lithuania, Luxembourg, Malta, Netherlands, Poland, Portugal, Romania, Slovakia, Slovenia, Spain, Sweden, United Kingdom
EUA European Union allowance
FM Forest Management
GAINS Greenhouse Gas and Air Pollution Interactions and Synergies
GDP Gross domestic product
GHG(s) Greenhouse gas(es)
IET International emissions trading. One of the three KP emissions trading mechanisms by which an Annex I party may transfer Kyoto units to or acquire units from another Annex I party. A party must meet specific eligibility requirements to participate in emissions trading.
IPCC Intergovernmental Panel on Climate Change

Glossary of terms and abbreviations
68 Greenhouse gas emission trends and projections in Europe 2012
ITL International Transaction Log. An electronic data system, administered by the UNFCCC Secretariat, which monitors and tracks parties' transactions of Kyoto units.
JI Joint implementation. A KP mechanism that allows Annex I parties to purchase emission allowances from projects of other Annex I parties that reduce or remove emissions. The emission allowances from JI projects are called Emission Reduction Units (ERUs)
JRC Joint Research Centre
KP Kyoto Protocol
LULUCF Land Use, Land-Use Change, and Forestry. A GHG inventory sector subject to specific accounting rules.
MMD EU Monitoring Mechanism Decision
MS Member State
Mt Mega (million) tonnes
NAP National allocation plan
National registry An electronic database maintained by a party, or group of parties, for the transfer and tracking of units in accordance with the KP rules
NER new entrants reserve
Non-Annex I parties Parties not included in Annex I to the UNFCCC
Pledge Emission reduction expressed as a percentage reduction, relative to the base year, which has to be achieved by a given year in the future
PRIMES Price-driven and agent-based simulation of markets energy system models
QA/QC Quality assurance/Quality control
QELRC(s) Quantified Emission Limitation or Reduction Commitment(s), average level of anthropogenic carbon dioxide equivalent emissions of GHG expressed as a percentage in relation to the base year
Retirement The transfer of a unit to a retirement account to be used towards meeting a party's Kyoto commitment
RMU(s) Removal unit(s). A Kyoto unit representing an allowance to emit 1 metric tonne of CO2-equivalent. RMUs are issued for emission removals from LULUCF activities under Article 3, paragraphs 3 and 4
SEF Standard electronic format for reporting KP units
True-up period A 100-day period after final emissions have been reported for the commitment period during which parties have the opportunity to undertake final transactions necessary to achieve compliance with their Kyoto commitment
UNFCCC United Nations Framework Convention on Climate Change
WAM with additional measures
WEM with existing measures

69
References
Greenhouse gas emission trends and projections in Europe 2012
8 References
EEA, 2006, The European Community's initial report under the Kyoto Protocol, EEA Technical report No 10/2006, European Environment Agency (http://unfccc.int/national_reports/initial_reports_under_the_kyoto_protocol/items/3765.php) accessed 19 September 2012.
EEA, 2009, Greenhouse gas emission trends and projections in Europe 2009, EEA Report No 9/2009, European Environment Agency (http://www.eea.europa.eu/publications/eea_report_2009_9) accessed 19 September 2012.
EEA, 2010, Tracking progress towards Kyoto targets, EEA Report No 7/2010, European Environment Agency (http://www.eea.europa.eu/publications/progress-towards-kyoto) accessed 19 September 2012.
EEA, 2012a, Annual European Community greenhouse gas inventory 1990–2010 and inventory report 2012, EEA Technical report No 3/2012, European Environment Agency (http://www.eea.europa.eu/publications/european-union-greenhouse-gas-inventory-2012) accessed 19 September 2012.
EEA, 2012b, Deliveries for projections and national programmes, Eionet Reporting Obligations Database, European Environment Agency (http://rod.eionet.europa.eu/obligations/385/deliveries?d-4014547-p=1&d-4014547-o=1&d-4014547-s=2) accessed 19 September 2012.
EEA, 2012c, Greenhouse gas data viewer, European Environment Agency (http://dataservice.eea.europa.eu/PivotApp/pivot.aspx?pivotid=475) accessed 19 September 2012.
EEA, 2012d, EU ETS data viewer, European Environment Agency (http://dataservice.eea.europa.eu/PivotApp/pivot.aspx?pivotid=473) accessed 19 September 2012.
EEA, 2012e, Questionnaires on the use of flexible mechanisms reported under the EU Monitoring Mechanism, European Environment Agency.
EEA, 2012f, Aggregated EU ETS database, European Environment Agency (http://papers.ssrn.com/sol3/Delivery.cfm/SSRN_ID1756736_code1194431.pdf?abstractid=1756736&mirid=1) accessed 19 September 2012.
EEA Joint Committee, 2011, Decision of the EEA Joint Committee No 87/2011 of 1 July 2011 amending Annex XX (Environment) to the EEA Agreement, European Environment Agency (http://ec.europa.eu/clima/policies/transport/aviation/allowances/docs/eea_01072011_en.pdf) accessed 19 September 2012.
European Commission, 2005, Commission Decision 2005/166/EC of 10 February 2005 laying down rules implementing Decision No 280/2004/EC of the European Parliament and of the Council concerning a mechanism for monitoring Community greenhouse gas emissions and for implementing the Kyoto Protocol (OJ L 55, 1.3.2005, p. 57–91) (http://eur-lex.europa.eu/LexUriServ/LexUriServ.do?uri=OJ:L:2005:055:0057:0057:EN:PDF) accessed 19 September 2012.
European Commission, 2006, Commission Decision 2006/944/EC of 14 December 2006 determining the respective emission levels allocated to the Community and each of its Member States under the Kyoto Protocol pursuant to Council Decision 2002/358/EC (OJ L 358, 16.12.2006, p. 87–89) (http://eur-lex.europa.eu/LexUriServ/LexUriServ.do?uri=OJ:L:2006:358:0087:0089:EN:PDF) accessed 19 September 2012.
European Commission, 2010a, EU energy trends to 2030 — Update 2009, European Commission Directorate-General for Energy in collaboration with Climate Action DG and Mobility and Transport DG (http://ec.europa.eu/energy/observatory/trends_2030/index_en.htm) accessed 19 September 2012.
European Commission, 2010b, Commission Decision of 15 December 2010 amending Decision 2006/944/EC determining the respective emission levels allocated to the Community and each of its Member States under the Kyoto Protocol pursuant to Council

References
70 Greenhouse gas emission trends and projections in Europe 2012
Decision 2002/358/EC (OJ L332, 16.12.2010, p.41) (http://eur-lex.europa.eu/LexUriServ/LexUriServ.do?uri=OJ:L:2010:332:0041:0042:EN:PDF) accessed 19 September 2012.
European Commission, 2010c, Commission Regulation (EU) No 1031/2010 of 12 November 2010 on the timing, administration and other aspects of auctioning of greenhouse gas emission allowances pursuant to Directive 2003/87/EC of the European Parliament and of the Council establishing a scheme for greenhouse gas emission allowances trading within the Community (OJ L 302, 18.11.2010, p. 1) (http://eur-lex.europa.eu/LexUriServ/LexUriServ.do?uri=OJ:L:2010:302:0001:0041:EN:PDF) accessed 19 September 2012.
European Commission, 2011a, Commission Decision 2011/149/EU of 7 March 2011 on historical aviation emissions pursuant to Article 3c(4) of Directive 2003/87/EC of the European Parliament and of the Council establishing a scheme for greenhouse gas emission allowance trading within the Community (OJ L 61, 8.3.2011, p. 42–43)
European Commission, 2011b, Commission Decision 2011/638/EU of 26 September 2011 on benchmarks to allocate greenhouse gas emission allowances free of charge to aircraft operators pursuant to Article 3e of Directive 2003/87/EC of the European Parliament and of the Council.
European Commission, 2011c, Progress report 2011 (http://ec.europa.eu/clima/documentation/g-gas/index_en.htm#progress_reports) accessed 19 September 2012.
European Commisson, 2011d, Communication from the Commision to the European Parliament, theCouncil, the European economic and social committee and the committee of the regions: Roadmap for moving to a competitive low-carbon economy in 2050. COM(2011) 112 final. http://eur-lex.europa.eu/LexUriServ/LexUriServ.do?uri=COM:2011:0112:FIN:en:PDF accessed 9 October 2012.
European Commission, 2012a, Q&A Emissions Trading: Commission prepares to change the time profile for auctions of emission allowances; MEMO/12/600 Date: 25/07/2012.
European Commission, 2012b, Commission Staff Working Document, Information provided on the functioning of the EU Emissions Trading System, the volumes of greenhouse gas emission allowances auctioned and freely allocated and the impact on
the surplus of allowances in the period up to 2020 (http://ec.europa.eu/clima/policies/ets/auctioning/third/docs/swd_20120724_en.pdf) accessed 19 September 2012.
European Commission, 2012c, Commission Staff Working Document of 13 February 2012: Preparing the EU's Quantified Emission Limitation or Reduction Objective (QELRO) based on the EU Climate and Energy Package. SWD (2012) 18 final (http://ec.europa.eu/clima/policies/international/negotiations/docs/swd_13022012_en.pdf) accessed 19 September 2012.
European Commission, 2012d, Commission Staff Working Document of 26 April 2012: Guidelines for the 2012 technical review of greenhouse gas emission inventories to support the determination of Member States' annual emission allocations under Decision 406/2009/EC. SWD(2012) 107 final.
EU, 2002, Council Decision 2002/358/CE of 25 April 2002 concerning the approval, on behalf of the European Community, of the Kyoto Protocol to the United Nations Framework Convention on Climate Change and the joint fulfilment of commitments thereunder (http://eur-lex.europa.eu/LexUriServ/LexUriServ.do?uri=OJ:L:2002:130:0001:0001:EN:PDF) accessed 19 September 2012.
EU, 2003, Directive 2003/87/EC of the European Parliament and of the Council of 13 October 2003 establishing a scheme for greenhouse gas emission allowance trading within the Community and amending Council Directive 96/61/EC (OJ L 275 , 25.10.2003, p. 32–46) (http://eur-lex.europa.eu/LexUriServ/LexUriServ.do?uri=CELEX:32003L0087:EN:NOT) accessed 19 September 2012.
EU, 2004, Decision No 280/2004/EC of the European Parliament and of the Council of 11 February 2004 concerning a mechanism for monitoring Community greenhouse gas emissions and for implementing the Kyoto Protocol (OJ L 049, 19.2.2004, p. 1–8) (http://eur-lex.europa.eu/LexUriServ/LexUriServ.do?uri=OJ:L:2004:049:0001:0008:EN:PDF) accessed 19 September 2012.
EU, 2008, Directive 2008/101/EC of the European Parliament and of the Council of 19 November 2008 amending Directive 2003/87/EC so as to include aviation activities in the scheme for greenhouse gas emission allowance trading within the Community. (OJ L 008, 13.1.2009, p. 3–21).
References
71Greenhouse gas emission trends and projections in Europe 2012
EU, 2009a, Decision No 406/2009/EC of the European Parliament and of the Council of 23 April 2009 on the effort of Member States to reduce their greenhouse gas emissions to meet the Community's greenhouse gas emission reduction commitments up to 2020. (OJ L 140, 5.6.2009, p. 136–148 ) (http://eur-lex.europa.eu/LexUriServ/LexUriServ.do?uri=OJ:L:2009:140:0136:0148:EN:PDF) accessed 19 September 2012.
EU, 2009b, Directive 2009/29/EC of the European Parliament and of the Council of 23 April 2009 amending Directive 2003/87/EC so as to improve and extend the greenhouse gas emission allowance trading scheme of the Community. (OJ L 140, 5.6.2009, p. 16–62) (http://eur-lex.europa.eu/LexUriServ/LexUriServ.do?uri=OJ:L:2009:140:0063:0087:en:PDF) accessed 19 September 2012.
Government of Liechtenstein, 2010, Liechtenstein's Fifth National Communication under the UNFCCC and the Kyoto Protocol, Office of Environmental Protection, submission to the UNFCCC Secretariat (http://unfccc.int/resource/docs/natc/lie_nc5.pdf) accessed 19 September 2012.
Government of the Republic of Croatia, 2010, Fifth National Communication of the Republic of Croatia under the United Nation Framework Convention on the Climate Change, Ministry of Environmental Protection, Physical Planning and Construction, submission to the UNFCCC Secretariat (http://unfccc.int/resource/docs/natc/hrv_nc5.pdf) accessed 19 September 2012.
Öko-Institut, 2011, Functioning of the ETS and the Flexible Mechanisms, report for the European Parliament's Directorate-General for Internal Policies (http://www.europarl.europa.eu/meetdocs/2009_2014/documents/envi/dv/201/201104/20110419_envi_functioning_of_ets_en.pdf) accessed 19 September 2012.
Öko-Institut, 2012, Saving the EU Emissions trading scheme and raising climate ambition. Facts Measures and Implications. Berlin, June 2012. (http://www.wwf.de/fileadmin/user_upload/Bilder/GP_WWF_2012_-_Strengthening_the_EU_ETS_and_Raising_Climate_Ambition.pdf).
Point Carbon, 2012, Daily closing prices for EUAs, 15 June 2012 (http://www.pointcarbon.com) accessed 19 September 2012.
UNFCCC, 2006a, Modalities for the accounting of assigned amounts under Article 7, paragraph 4, of the Kyoto Protocol, Report of the Conference of the Parties serving as the meeting of the Parties to the Kyoto Protocol on its first session, United Nations Framework Convention on Climate Change, Bonn (http://unfccc.int/resource/docs/2005/cmp1/eng/08a02.pdf#page=23) accessed 19 September 2012.
UNFCCC, 2006b, Decision 16/CMP.1 Land use, land-use change and forestry, Report of the Conference of the Parties serving as the meeting of the Parties to the Kyoto Protocol on its first session, United Nations Framework Convention on Climate Change, Bonn (http://unfccc.int/resource/docs/2005/cmp1/eng/08a03.pdf#page=3) accessed 19 September 2012.
UNFCCC, 2012a, Information by Parties included in Annex I listed in annex 1 to decision 1/CMP.7 on their quantified emission limitation or reduction objectives for the second commitment period under the Kyoto Protocol, FCCC/KP/AWG/2012/MISC.1/Add.1, United Nations Framework Convention on Climate Change, Bonn (http://unfccc.int/resource/docs/2012/awg17/eng/misc01.pdf) accessed 19 September 2012.
UNFCCC, 2012b, Analysis of quantified emission limitation and reduction commitments expressed as percentage of base year and absolute emission levels, United Nations Framework Convention on Climate Change, Bonn (http://unfccc.int/files/meetings/ad_hoc_working_groups/kp/application/pdf/tableqelrcs_fromparties_for_website_posting_17aug2012_cln.pdf) accessed 25 September 2012.

Greenhouse gas emission trends and projections in Europe 201272
Calculation of progress towards Kyoto and 2020 targets
9 Calculation of progress towards Kyoto and 2020 targets
Table 9.1 Calculation of progress towards 2008–2012 Kyoto targets
Category Operation 2008 2009 2010 2011 Average 2008–2011
(Mt CO2‑equivalent)
EU‑15 (as sum of Member States)
1 Total GHG emissions 3 999.1 3 719.2 3 797.6 3 661.6 3 794.4
2 Verified emissions under the EU ETS 1 622.2 1 436.4 1 479.6 1 433.6 1 493.0
3 Non-ETS GHG emissions (1) – (2) 2 376.9 2 282.8 2 318.0 2 228.0 2 301.4
4 Initial Assigned Amount (AAUs) 3 924.3 3 924.3 3 924.3 3 924.3 3 924.3
5 Allowances issued under the EU ETS 1 516.7 1 538.8 1 572.6 1 577.3 1 551.4
6 Non-ETS target (4) – (5) 2 407.5 2 385.5 2 351.6 2 346.9 2 372.9
7 Difference between target and GHG emissions (non‑ETS, domestic)
(6) – (3) 30.6 102.7 33.7 119.0 71.5
8 Expected carbon sequestration from LULUCF activities (RMUs)
57.9 57.9 57.9 57.9 57.9
9 Planned use of Kyoto mechanisms by government (net transfer of AAUs + purchase of CERs + ERUs)
83.8 83.8 83.8 83.8 83.8
10 Emission reduction units (ERUs issued under JI projects)
0.0 0.6 2.9 6.3 2.4
11 Difference between target and GHG emissions (non‑ETS domestic emissions including plans on Kyoto mechanisms and carbon sinks)
(7) + (8) + (9) –
(10)
172.3 243.8 172.5 254.3 210.7
AT Austria
1 Total GHG emissions 87.0 79.7 84.6 81.9 83.3
2 Verified emissions under the EU ETS 32.1 27.4 30.9 30.6 30.2
3 Non-ETS GHG emissions (1) – (2) 54.9 52.4 53.7 51.3 53.1
4 Initial Assigned Amount (AAUs) 68.8 68.8 68.8 68.8 68.8
5 Allowances issued under the EU ETS 30.2 32.4 33.1 33.2 32.2
6 Non-ETS target (4) – (5) 38.6 36.4 35.7 35.6 36.6
7 Difference between target and GHG emissions (non‑ETS, domestic)
(6) – (3) – 16.3 – 16.0 – 18.0 – 15.8 – 16.5
8 Expected carbon sequestration from LULUCF activities (RMUs)
0.7 0.7 0.7 0.7 0.7
9 Planned use of Kyoto mechanisms by government (net transfer of AAUs + purchase of CERs + ERUs)
16.0 16.0 16.0 16.0 16.0
10 Emission reduction units (ERUs issued under JI projects)
0.0 0.0 0.0 0.0 0.0
11 Difference between target and GHG emissions (non‑ETS domestic emissions including plans on Kyoto mechanisms and carbon sinks)
(7) + (8) + (9) –
(10)
0.4 0.7 – 1.3 0.9 0.2
Corrections None

Calculation of progress towards Kyoto and 2020 targets
73Greenhouse gas emission trends and projections in Europe 2012
Category Operation 2008 2009 2010 2011 Average 2008–2011
(Mt CO2‑equivalent)
BE Belgium
1 Total GHG emissions 136.7 125.2 132.5 121.3 128.9
2 Verified emissions under the EU ETS 55.5 46.2 50.1 46.2 49.5
3 Non-ETS GHG emissions (1) – (2) 81.2 79.0 82.4 75.1 79.4
4 Initial Assigned Amount (AAUs) 134.8 134.8 134.8 134.8 134.8
5 Allowances issued under the EU ETS 55.4 56.8 56.0 56.0 56.0
6 Non-ETS target (4) – (5) 79.4 78.0 78.8 78.8 78.8
7 Difference between target and GHG emissions (non‑ETS, domestic)
(6) – (3) – 1.8 – 1.0 – 3.5 3.7 – 0.7
8 Expected carbon sequestration from LULUCF activities (RMUs)
– 0.2 – 0.2 – 0.2 – 0.2 – 0.2
9 Planned use of Kyoto mechanisms by government (net transfer of AAUs + purchase of CERs + ERUs)
6.3 6.3 6.3 6.3 6.3
10 Emission reduction units (ERUs issued under JI projects)
0.0 0.0 0.0 0.0 0.0
11 Difference between target and GHG emissions (non‑ETS domestic emissions including plans on Kyoto mechanisms and carbon sinks)
(7) + (8) + (9) –
(10)
4.2 5.1 2.5 9.7 5.4
Corrections None
DE Germany
1 Total GHG emissions 976.0 911.8 936.5 917.0 935.3
2 Verified emissions under the EU ETS 472.7 428.3 454.9 450.4 451.6
3 Non-ETS GHG emissions (1) – (2) 503.2 483.5 481.7 466.6 483.8
4 Initial Assigned Amount (AAUs) 973.6 973.6 973.6 973.6 973.6
5 Allowances issued under the EU ETS 437.9 431.8 438.6 441.2 437.4
6 Non-ETS target (4) – (5) 535.7 541.8 535.0 532.5 536.2
7 Difference between target and GHG emissions (non‑ETS, domestic)
(6) – (3) 32.5 58.3 53.3 65.9 52.5
8 Expected carbon sequestration from LULUCF activities (RMUs)
10.1 10.1 10.1 10.1 10.1
9 Planned use of Kyoto mechanisms by government (net transfer of AAUs + purchase of CERs + ERUs)
0.0 0.0 0.0 0.0 0.0
10 Emission reduction units (ERUs issued under JI projects)
0.0 0.1 1.3 3.7 1.3
11 Difference between target and GHG emissions (non‑ETS domestic emissions including plans on Kyoto mechanisms and carbon sinks)
(7) + (8) + (9) –
(10)
42.6 68.3 62.1 72.3 61.3
Corrections Correction of allowances issued under the EU ETS in 2008 with 8.1 M EUAs for refinancing the KfW
Mechanismus and correction of – 4 M EUAs in 2009 and 2010 due to 'Rückforderungen' from operators
that are not recorded in the CITL

Calculation of progress towards Kyoto and 2020 targets
74 Greenhouse gas emission trends and projections in Europe 2012
Category Operation 2008 2009 2010 2011 Average 2008–2011
(Mt CO2‑equivalent)
DK Denmark
1 Total GHG emissions 63.6 60.7 61.1 56.1 60.4
2 Verified emissions under the EU ETS 26.5 25.5 25.3 21.5 24.7
3 Non-ETS GHG emissions (1) – (2) 37.0 35.2 35.8 34.6 35.7
4 Initial Assigned Amount (AAUs) 55.8 55.8 55.8 55.8 55.8
5 Allowances issued under the EU ETS 24.0 23.9 23.9 23.9 23.9
6 Non-ETS target (4) – (5) 31.8 31.9 31.9 31.9 31.8
7 Difference between target and GHG emissions (non‑ETS, domestic)
(6) – (3) – 5.2 – 3.4 – 3.9 – 2.8 – 3.8
8 Expected carbon sequestration from LULUCF activities (RMUs)
2.0 2.0 2.0 2.0 2.0
9 Planned use of Kyoto mechanisms by government (net transfer of AAUs + purchase of CERs + ERUs)
3.7 3.7 3.7 3.7 3.7
10 Emission reduction units (ERUs issued under JI projects)
0.0 0.0 0.0 0.0 0.0
11 Difference between target and GHG emissions (non‑ETS domestic emissions including plans on Kyoto mechanisms and carbon sinks)
(7) + (8) + (9) –
(10)
0.5 2.3 1.8 2.9 1.9
Corrections Correction of AAU initial to EU territory and inclusion of base-year compensation
EL Greece
1 Total GHG emissions 131.3 124.7 118.3 118.5 123.2
2 Verified emissions under the EU ETS 69.9 63.7 59.9 58.8 63.1
3 Non-ETS GHG emissions (1) – (2) 61.4 61.0 58.3 59.7 60.1
4 Initial Assigned Amount (AAUs) 133.7 133.7 133.7 133.7 133.7
5 Allowances issued under the EU ETS 63.7 63.2 64.6 74.6 66.6
6 Non-ETS target (4) – (5) 70.0 70.5 69.1 59.1 67.2
7 Difference between target and GHG emissions (non‑ETS, domestic)
(6) – (3) 8.6 9.5 10.7 – 0.6 7.1
8 Expected carbon sequestration from LULUCF activities (RMUs)
0.6 0.6 0.6 0.6 0.6
9 Planned use of Kyoto mechanisms by government (net transfer of AAUs + purchase of CERs + ERUs)
0.0 0.0 0.0 0.0 0.0
10 Emission reduction units (ERUs issued under JI projects)
0.0 0.0 0.0 0.0 0.0
11 Difference between target and GHG emissions (non‑ETS domestic emissions including plans on Kyoto mechanisms and carbon sinks)
(7) + (8) + (9) –
(10)
9.3 10.1 11.4 0.0 7.7
Corrections None
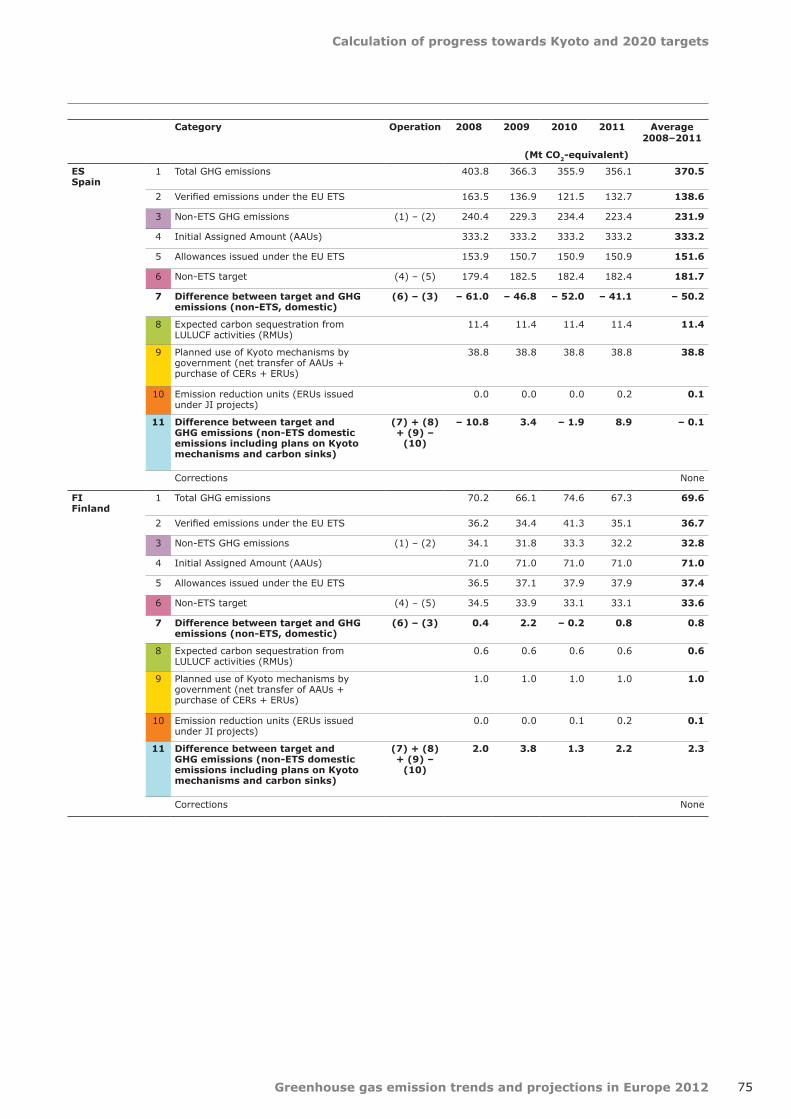
Calculation of progress towards Kyoto and 2020 targets
75Greenhouse gas emission trends and projections in Europe 2012
Category Operation 2008 2009 2010 2011 Average 2008–2011
(Mt CO2‑equivalent)
ES Spain
1 Total GHG emissions 403.8 366.3 355.9 356.1 370.5
2 Verified emissions under the EU ETS 163.5 136.9 121.5 132.7 138.6
3 Non-ETS GHG emissions (1) – (2) 240.4 229.3 234.4 223.4 231.9
4 Initial Assigned Amount (AAUs) 333.2 333.2 333.2 333.2 333.2
5 Allowances issued under the EU ETS 153.9 150.7 150.9 150.9 151.6
6 Non-ETS target (4) – (5) 179.4 182.5 182.4 182.4 181.7
7 Difference between target and GHG emissions (non‑ETS, domestic)
(6) – (3) – 61.0 – 46.8 – 52.0 – 41.1 – 50.2
8 Expected carbon sequestration from LULUCF activities (RMUs)
11.4 11.4 11.4 11.4 11.4
9 Planned use of Kyoto mechanisms by government (net transfer of AAUs + purchase of CERs + ERUs)
38.8 38.8 38.8 38.8 38.8
10 Emission reduction units (ERUs issued under JI projects)
0.0 0.0 0.0 0.2 0.1
11 Difference between target and GHG emissions (non‑ETS domestic emissions including plans on Kyoto mechanisms and carbon sinks)
(7) + (8) + (9) –
(10)
– 10.8 3.4 – 1.9 8.9 – 0.1
Corrections None
FI Finland
1 Total GHG emissions 70.2 66.1 74.6 67.3 69.6
2 Verified emissions under the EU ETS 36.2 34.4 41.3 35.1 36.7
3 Non-ETS GHG emissions (1) – (2) 34.1 31.8 33.3 32.2 32.8
4 Initial Assigned Amount (AAUs) 71.0 71.0 71.0 71.0 71.0
5 Allowances issued under the EU ETS 36.5 37.1 37.9 37.9 37.4
6 Non-ETS target (4) – (5) 34.5 33.9 33.1 33.1 33.6
7 Difference between target and GHG emissions (non‑ETS, domestic)
(6) – (3) 0.4 2.2 – 0.2 0.8 0.8
8 Expected carbon sequestration from LULUCF activities (RMUs)
0.6 0.6 0.6 0.6 0.6
9 Planned use of Kyoto mechanisms by government (net transfer of AAUs + purchase of CERs + ERUs)
1.0 1.0 1.0 1.0 1.0
10 Emission reduction units (ERUs issued under JI projects)
0.0 0.0 0.1 0.2 0.1
11 Difference between target and GHG emissions (non‑ETS domestic emissions including plans on Kyoto mechanisms and carbon sinks)
(7) + (8) + (9) –
(10)
2.0 3.8 1.3 2.2 2.3
Corrections None
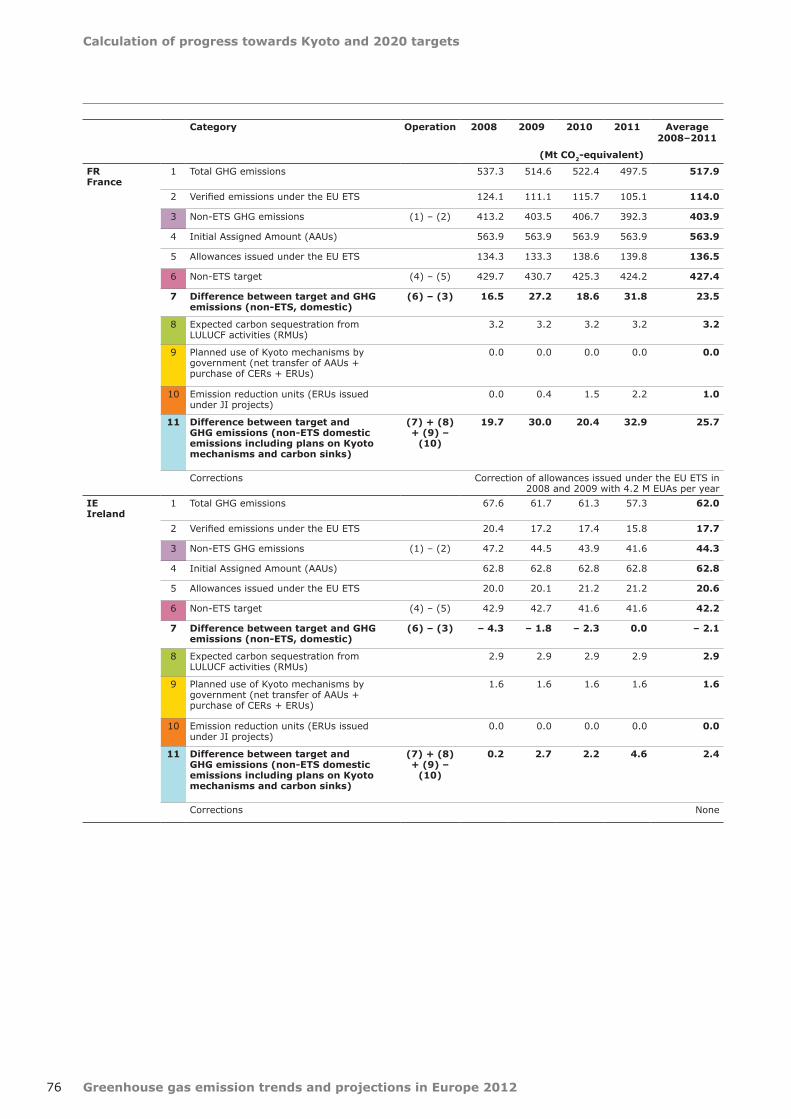
Calculation of progress towards Kyoto and 2020 targets
76 Greenhouse gas emission trends and projections in Europe 2012
Category Operation 2008 2009 2010 2011 Average 2008–2011
(Mt CO2‑equivalent)
FR France
1 Total GHG emissions 537.3 514.6 522.4 497.5 517.9
2 Verified emissions under the EU ETS 124.1 111.1 115.7 105.1 114.0
3 Non-ETS GHG emissions (1) – (2) 413.2 403.5 406.7 392.3 403.9
4 Initial Assigned Amount (AAUs) 563.9 563.9 563.9 563.9 563.9
5 Allowances issued under the EU ETS 134.3 133.3 138.6 139.8 136.5
6 Non-ETS target (4) – (5) 429.7 430.7 425.3 424.2 427.4
7 Difference between target and GHG emissions (non‑ETS, domestic)
(6) – (3) 16.5 27.2 18.6 31.8 23.5
8 Expected carbon sequestration from LULUCF activities (RMUs)
3.2 3.2 3.2 3.2 3.2
9 Planned use of Kyoto mechanisms by government (net transfer of AAUs + purchase of CERs + ERUs)
0.0 0.0 0.0 0.0 0.0
10 Emission reduction units (ERUs issued under JI projects)
0.0 0.4 1.5 2.2 1.0
11 Difference between target and GHG emissions (non‑ETS domestic emissions including plans on Kyoto mechanisms and carbon sinks)
(7) + (8) + (9) –
(10)
19.7 30.0 20.4 32.9 25.7
Corrections Correction of allowances issued under the EU ETS in 2008 and 2009 with 4.2 M EUAs per year
IE Ireland
1 Total GHG emissions 67.6 61.7 61.3 57.3 62.0
2 Verified emissions under the EU ETS 20.4 17.2 17.4 15.8 17.7
3 Non-ETS GHG emissions (1) – (2) 47.2 44.5 43.9 41.6 44.3
4 Initial Assigned Amount (AAUs) 62.8 62.8 62.8 62.8 62.8
5 Allowances issued under the EU ETS 20.0 20.1 21.2 21.2 20.6
6 Non-ETS target (4) – (5) 42.9 42.7 41.6 41.6 42.2
7 Difference between target and GHG emissions (non‑ETS, domestic)
(6) – (3) – 4.3 – 1.8 – 2.3 0.0 – 2.1
8 Expected carbon sequestration from LULUCF activities (RMUs)
2.9 2.9 2.9 2.9 2.9
9 Planned use of Kyoto mechanisms by government (net transfer of AAUs + purchase of CERs + ERUs)
1.6 1.6 1.6 1.6 1.6
10 Emission reduction units (ERUs issued under JI projects)
0.0 0.0 0.0 0.0 0.0
11 Difference between target and GHG emissions (non‑ETS domestic emissions including plans on Kyoto mechanisms and carbon sinks)
(7) + (8) + (9) –
(10)
0.2 2.7 2.2 4.6 2.4
Corrections None

Calculation of progress towards Kyoto and 2020 targets
77Greenhouse gas emission trends and projections in Europe 2012
Category Operation 2008 2009 2010 2011 Average 2008–2011
(Mt CO2‑equivalent)
IT Italy
1 Total GHG emissions 541.6 491.5 501.3 493.7 507.0
2 Verified emissions under the EU ETS 220.7 184.9 191.5 189.7 196.7
3 Non-ETS GHG emissions (1) – (2) 320.9 306.6 309.8 303.9 310.3
4 Initial Assigned Amount (AAUs) 483.3 483.3 483.3 483.3 483.3
5 Allowances issued under the EU ETS 212.2 209.0 200.0 200.0 205.3
6 Non-ETS target (4) – (5) 271.1 274.3 283.2 283.2 278.0
7 Difference between target and GHG emissions (non‑ETS, domestic)
(6) – (3) – 49.8 – 32.4 – 26.6 – 20.7 – 32.4
8 Expected carbon sequestration from LULUCF activities (RMUs)
16.3 16.3 16.3 16.3 16.3
9 Planned use of Kyoto mechanisms by government (net transfer of AAUs + purchase of CERs + ERUs)
2.0 2.0 2.0 2.0 2.0
10 Emission reduction units (ERUs issued under JI projects)
0.0 0.0 0.0 0.0 0.0
11 Difference between target and GHG emissions (non‑ETS domestic emissions including plans on Kyoto mechanisms and carbon sinks)
(7) + (8) + (9) –
(10)
– 31.5 – 14.1 – 8.3 – 2.4 – 14.1
Corrections None
LU Luxembourg
1 Total GHG emissions 12.0 11.5 12.1 12.3 12.0
2 Verified emissions under the EU ETS 2.1 2.2 2.3 2.1 2.1
3 Non-ETS GHG emissions (1) – (2) 9.9 9.3 9.8 10.2 9.8
4 Initial Assigned Amount (AAUs) 9.5 9.5 9.5 9.5 9.5
5 Allowances issued under the EU ETS 2.5 2.5 2.5 2.5 2.5
6 Non-ETS target (4) – (5) 7.0 7.0 7.0 7.0 7.0
7 Difference between target and GHG emissions (non‑ETS, domestic)
(6) – (3) – 3.0 – 2.3 – 2.8 – 3.2 – 2.8
8 Expected carbon sequestration from LULUCF activities (RMUs)
0.0 0.0 0.0 0.0 0.0
9 Planned use of Kyoto mechanisms by government (net transfer of AAUs + purchase of CERs + ERUs)
2.9 2.9 2.9 2.9 2.9
10 Emission reduction units (ERUs issued under JI projects)
0.0 0.0 0.0 0.0 0.0
11 Difference between target and GHG emissions (non‑ETS domestic emissions including plans on Kyoto mechanisms and carbon sinks)
(7) + (8) + (9) –
(10)
0.0 0.6 0.1 – 0.3 0.1
Corrections None
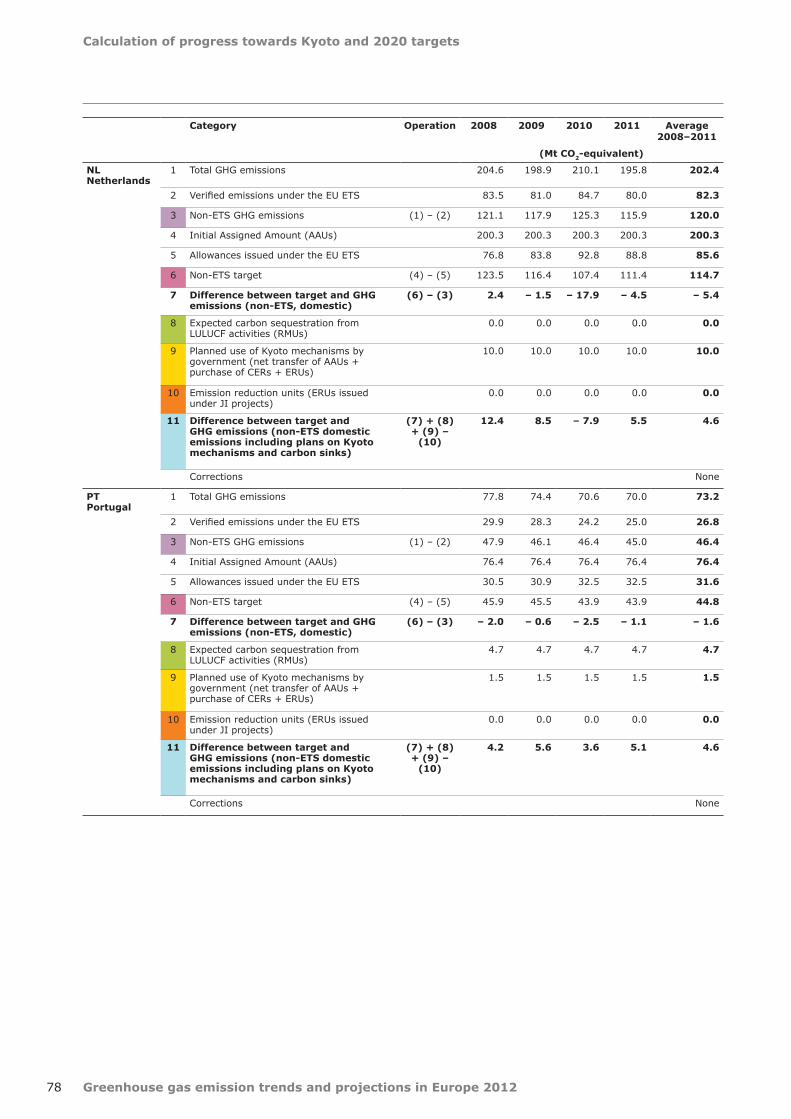
Calculation of progress towards Kyoto and 2020 targets
78 Greenhouse gas emission trends and projections in Europe 2012
Category Operation 2008 2009 2010 2011 Average 2008–2011
(Mt CO2‑equivalent)
NL Netherlands
1 Total GHG emissions 204.6 198.9 210.1 195.8 202.4
2 Verified emissions under the EU ETS 83.5 81.0 84.7 80.0 82.3
3 Non-ETS GHG emissions (1) – (2) 121.1 117.9 125.3 115.9 120.0
4 Initial Assigned Amount (AAUs) 200.3 200.3 200.3 200.3 200.3
5 Allowances issued under the EU ETS 76.8 83.8 92.8 88.8 85.6
6 Non-ETS target (4) – (5) 123.5 116.4 107.4 111.4 114.7
7 Difference between target and GHG emissions (non‑ETS, domestic)
(6) – (3) 2.4 – 1.5 – 17.9 – 4.5 – 5.4
8 Expected carbon sequestration from LULUCF activities (RMUs)
0.0 0.0 0.0 0.0 0.0
9 Planned use of Kyoto mechanisms by government (net transfer of AAUs + purchase of CERs + ERUs)
10.0 10.0 10.0 10.0 10.0
10 Emission reduction units (ERUs issued under JI projects)
0.0 0.0 0.0 0.0 0.0
11 Difference between target and GHG emissions (non‑ETS domestic emissions including plans on Kyoto mechanisms and carbon sinks)
(7) + (8) + (9) –
(10)
12.4 8.5 – 7.9 5.5 4.6
Corrections None
PT Portugal
1 Total GHG emissions 77.8 74.4 70.6 70.0 73.2
2 Verified emissions under the EU ETS 29.9 28.3 24.2 25.0 26.8
3 Non-ETS GHG emissions (1) – (2) 47.9 46.1 46.4 45.0 46.4
4 Initial Assigned Amount (AAUs) 76.4 76.4 76.4 76.4 76.4
5 Allowances issued under the EU ETS 30.5 30.9 32.5 32.5 31.6
6 Non-ETS target (4) – (5) 45.9 45.5 43.9 43.9 44.8
7 Difference between target and GHG emissions (non‑ETS, domestic)
(6) – (3) – 2.0 – 0.6 – 2.5 – 1.1 – 1.6
8 Expected carbon sequestration from LULUCF activities (RMUs)
4.7 4.7 4.7 4.7 4.7
9 Planned use of Kyoto mechanisms by government (net transfer of AAUs + purchase of CERs + ERUs)
1.5 1.5 1.5 1.5 1.5
10 Emission reduction units (ERUs issued under JI projects)
0.0 0.0 0.0 0.0 0.0
11 Difference between target and GHG emissions (non‑ETS domestic emissions including plans on Kyoto mechanisms and carbon sinks)
(7) + (8) + (9) –
(10)
4.2 5.6 3.6 5.1 4.6
Corrections None
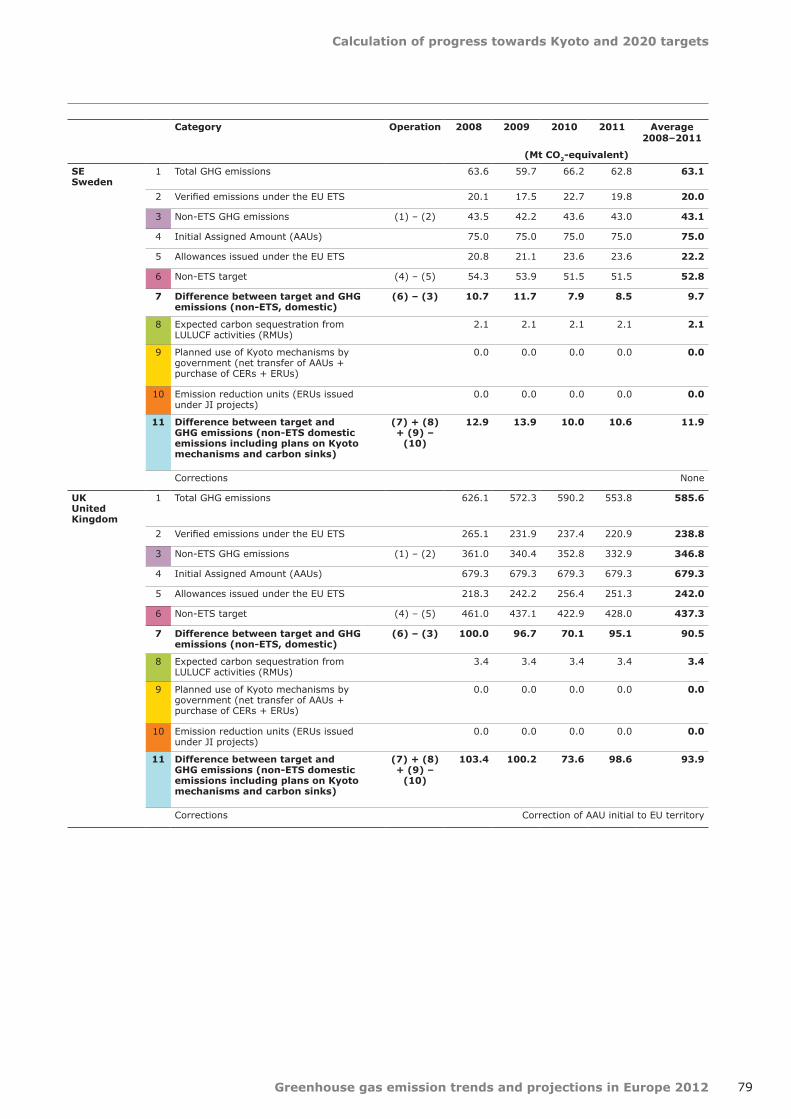
Calculation of progress towards Kyoto and 2020 targets
79Greenhouse gas emission trends and projections in Europe 2012
Category Operation 2008 2009 2010 2011 Average 2008–2011
(Mt CO2‑equivalent)
SE Sweden
1 Total GHG emissions 63.6 59.7 66.2 62.8 63.1
2 Verified emissions under the EU ETS 20.1 17.5 22.7 19.8 20.0
3 Non-ETS GHG emissions (1) – (2) 43.5 42.2 43.6 43.0 43.1
4 Initial Assigned Amount (AAUs) 75.0 75.0 75.0 75.0 75.0
5 Allowances issued under the EU ETS 20.8 21.1 23.6 23.6 22.2
6 Non-ETS target (4) – (5) 54.3 53.9 51.5 51.5 52.8
7 Difference between target and GHG emissions (non‑ETS, domestic)
(6) – (3) 10.7 11.7 7.9 8.5 9.7
8 Expected carbon sequestration from LULUCF activities (RMUs)
2.1 2.1 2.1 2.1 2.1
9 Planned use of Kyoto mechanisms by government (net transfer of AAUs + purchase of CERs + ERUs)
0.0 0.0 0.0 0.0 0.0
10 Emission reduction units (ERUs issued under JI projects)
0.0 0.0 0.0 0.0 0.0
11 Difference between target and GHG emissions (non‑ETS domestic emissions including plans on Kyoto mechanisms and carbon sinks)
(7) + (8) + (9) –
(10)
12.9 13.9 10.0 10.6 11.9
Corrections None
UK United Kingdom
1 Total GHG emissions 626.1 572.3 590.2 553.8 585.6
2 Verified emissions under the EU ETS 265.1 231.9 237.4 220.9 238.8
3 Non-ETS GHG emissions (1) – (2) 361.0 340.4 352.8 332.9 346.8
4 Initial Assigned Amount (AAUs) 679.3 679.3 679.3 679.3 679.3
5 Allowances issued under the EU ETS 218.3 242.2 256.4 251.3 242.0
6 Non-ETS target (4) – (5) 461.0 437.1 422.9 428.0 437.3
7 Difference between target and GHG emissions (non‑ETS, domestic)
(6) – (3) 100.0 96.7 70.1 95.1 90.5
8 Expected carbon sequestration from LULUCF activities (RMUs)
3.4 3.4 3.4 3.4 3.4
9 Planned use of Kyoto mechanisms by government (net transfer of AAUs + purchase of CERs + ERUs)
0.0 0.0 0.0 0.0 0.0
10 Emission reduction units (ERUs issued under JI projects)
0.0 0.0 0.0 0.0 0.0
11 Difference between target and GHG emissions (non‑ETS domestic emissions including plans on Kyoto mechanisms and carbon sinks)
(7) + (8) + (9) –
(10)
103.4 100.2 73.6 98.6 93.9
Corrections Correction of AAU initial to EU territory

Calculation of progress towards Kyoto and 2020 targets
80 Greenhouse gas emission trends and projections in Europe 2012
Category Operation 2008 2009 2010 2011 Average 2008–2011
(Mt CO2‑equivalent)
BG Bulgaria
1 Total GHG emissions 68.6 58.9 61.4 67.9 64.2
2 Verified emissions under the EU ETS 38.3 32.6 33.8 40.0 36.2
3 Non-ETS GHG emissions (1) – (2) 30.3 26.3 27.6 27.9 28.0
4 Initial Assigned Amount (AAUs) 122.0 122.0 122.0 122.0 122.0
5 Allowances issued under the EU ETS 38.3 40.6 35.3 35.3 37.4
6 Non-ETS target (4) – (5) 83.7 81.4 86.7 86.7 84.7
7 Difference between target and GHG emissions (non‑ETS, domestic)
(6) – (3) 53.4 55.1 59.1 58.8 56.6
8 Expected carbon sequestration from LULUCF activities (RMUs)
1.0 1.0 1.0 1.0 1.0
9 Planned use of Kyoto mechanisms by government (net transfer of AAUs + purchase of CERs + ERUs)
– 1.4 – 1.4 – 1.4 – 1.4 – 1.4
10 Emission reduction units (ERUs issued under JI projects)
0.0 0.0 3.3 2.3 1.4
11 Difference between target and GHG emissions (non‑ETS domestic emissions including plans on Kyoto mechanisms and carbon sinks)
(7) + (8) + (9) –
(10)
53.0 54.7 55.4 56.1 54.8
Corrections None
CZ Czech Republic
1 Total GHG emissions 143.7 134.7 139.2 141.1 139.7
2 Verified emissions under the EU ETS 80.4 73.8 75.6 74.2 76.0
3 Non-ETS GHG emissions (1) – (2) 63.3 60.9 63.6 66.9 63.7
4 Initial Assigned Amount (AAUs) 178.7 178.7 178.7 178.7 178.7
5 Allowances issued under the EU ETS 85.6 86.0 86.1 86.1 86.0
6 Non-ETS target (4) – (5) 93.1 92.7 92.6 92.6 92.8
7 Difference between target and GHG emissions (non‑ETS, domestic)
(6) – (3) 29.9 31.8 29.0 25.7 29.1
8 Expected carbon sequestration from LULUCF activities (RMUs)
1.3 1.3 1.3 1.3 1.3
9 Planned use of Kyoto mechanisms by government (net transfer of AAUs + purchase of CERs + ERUs)
– 25.0 – 25.0 – 25.0 – 25.0 – 25.0
10 Emission reduction units (ERUs issued under JI projects)
0.0 0.3 1.4 1.0 0.7
11 Difference between target and GHG emissions (non‑ETS domestic emissions including plans on Kyoto mechanisms and carbon sinks)
(7) + (8) + (9) –
(10)
6.2 7.8 3.9 1.0 4.7
Corrections None

Calculation of progress towards Kyoto and 2020 targets
81Greenhouse gas emission trends and projections in Europe 2012
Category Operation 2008 2009 2010 2011 Average 2008–2011
(Mt CO2‑equivalent)
EE Estonia
1 Total GHG emissions 19.7 16.4 20.5 20.9 19.4
2 Verified emissions under the EU ETS 13.5 10.4 14.5 14.8 13.3
3 Non-ETS GHG emissions (1) – (2) 6.2 6.0 6.0 6.1 6.1
4 Initial Assigned Amount (AAUs) 39.2 39.2 39.2 39.2 39.2
5 Allowances issued under the EU ETS 11.7 11.9 11.9 11.9 11.8
6 Non-ETS target (4) – (5) 27.5 27.4 27.4 27.4 27.4
7 Difference between target and GHG emissions (non‑ETS, domestic)
(6) – (3) 21.4 21.3 21.4 21.3 21.3
8 Expected carbon sequestration from LULUCF activities (RMUs)
– 0.2 – 0.2 – 0.2 – 0.2 – 0.2
9 Planned use of Kyoto mechanisms by government (net transfer of AAUs + purchase of CERs + ERUs)
– 1.2 – 1.2 – 1.2 – 1.2 – 1.2
10 Emission reduction units (ERUs issued under JI projects)
0.0 0.0 0.2 0.3 0.1
11 Difference between target and GHG emissions (non‑ETS domestic emissions including plans on Kyoto mechanisms and carbon sinks)
(7) + (8) + (9) –
(10)
20.0 20.0 19.8 19.6 19.8
Corrections None
HU Hungary
1 Total GHG emissions 73.3 66.9 67.7 65.6 68.4
2 Verified emissions under the EU ETS 27.2 22.4 23.0 22.5 23.8
3 Non-ETS GHG emissions (1) – (2) 46.1 44.5 44.7 43.2 44.6
4 Initial Assigned Amount (AAUs) 108.5 108.5 108.5 108.5 108.5
5 Allowances issued under the EU ETS 25.1 23.9 25.7 25.7 25.1
6 Non-ETS target (4) – (5) 83.3 84.6 82.8 82.8 83.4
7 Difference between target and GHG emissions (non‑ETS, domestic)
(6) – (3) 37.3 40.1 38.1 39.6 38.8
8 Expected carbon sequestration from LULUCF activities (RMUs)
2.2 2.2 2.2 2.2 2.2
9 Planned use of Kyoto mechanisms by government (net transfer of AAUs + purchase of CERs + ERUs)
– 4.0 – 4.0 – 4.0 – 4.0 – 4.0
10 Emission reduction units (ERUs issued under JI projects)
0.0 1.2 1.4 1.6 1.0
11 Difference between target and GHG emissions (non‑ETS domestic emissions including plans on Kyoto mechanisms and carbon sinks)
(7) + (8) + (9) –
(10)
35.5 37.1 34.9 36.1 35.9
Corrections None

Calculation of progress towards Kyoto and 2020 targets
82 Greenhouse gas emission trends and projections in Europe 2012
Category Operation 2008 2009 2010 2011 Average 2008–2011
(Mt CO2‑equivalent)
LT Lithuania
1 Total GHG emissions 24.3 20.0 20.8 21.4 21.6
2 Verified emissions under the EU ETS 6.1 5.8 6.4 5.6 6.0
3 Non-ETS GHG emissions (1) – (2) 18.2 14.2 14.4 15.8 15.7
4 Initial Assigned Amount (AAUs) 45.5 45.5 45.5 45.5 45.5
5 Allowances issued under the EU ETS 7.5 7.6 8.2 9.0 8.1
6 Non-ETS target (4) – (5) 38.0 37.9 37.3 36.5 37.4
7 Difference between target and GHG emissions (non‑ETS, domestic)
(6) – (3) 19.7 23.7 22.9 20.7 21.8
8 Expected carbon sequestration from LULUCF activities (RMUs)
1.1 1.1 1.1 1.1 1.1
9 Planned use of Kyoto mechanisms by government (net transfer of AAUs + purchase of CERs + ERUs)
– 14.1 – 14.1 – 14.1 – 14.1 – 14.1
10 Emission reduction units (ERUs issued under JI projects)
0.0 0.0 0.0 0.0 0.0
11 Difference between target and GHG emissions (non‑ETS domestic emissions including plans on Kyoto mechanisms and carbon sinks)
(7) + (8) + (9) –
(10)
6.7 10.7 9.9 7.7 8.7
Corrections None
LV Latvia
1 Total GHG emissions 11.7 11.0 12.1 12.1 11.7
2 Verified emissions under the EU ETS 2.7 2.5 3.2 2.9 2.8
3 Non-ETS GHG emissions (1) – (2) 9.0 8.5 8.8 9.2 8.9
4 Initial Assigned Amount (AAUs) 23.8 23.8 23.8 23.8 23.8
5 Allowances issued under the EU ETS 3.7 4.6 4.5 4.5 4.4
6 Non-ETS target (4) – (5) 20.1 19.2 19.3 19.3 19.5
7 Difference between target and GHG emissions (non‑ETS, domestic)
(6) – (3) 11.1 10.7 10.5 10.1 10.6
8 Expected carbon sequestration from LULUCF activities (RMUs)
1.3 1.3 1.3 1.3 1.3
9 Planned use of Kyoto mechanisms by government (net transfer of AAUs + purchase of CERs + ERUs)
– 8.4 – 8.4 – 8.4 – 8.4 – 8.4
10 Emission reduction units (ERUs issued under JI projects)
0.0 0.0 0.0 0.0 0.0
11 Difference between target and GHG emissions (non‑ETS domestic emissions including plans on Kyoto mechanisms and carbon sinks)
(7) + (8) + (9) –
(10)
4.1 3.7 3.4 3.0 3.5
Corrections None
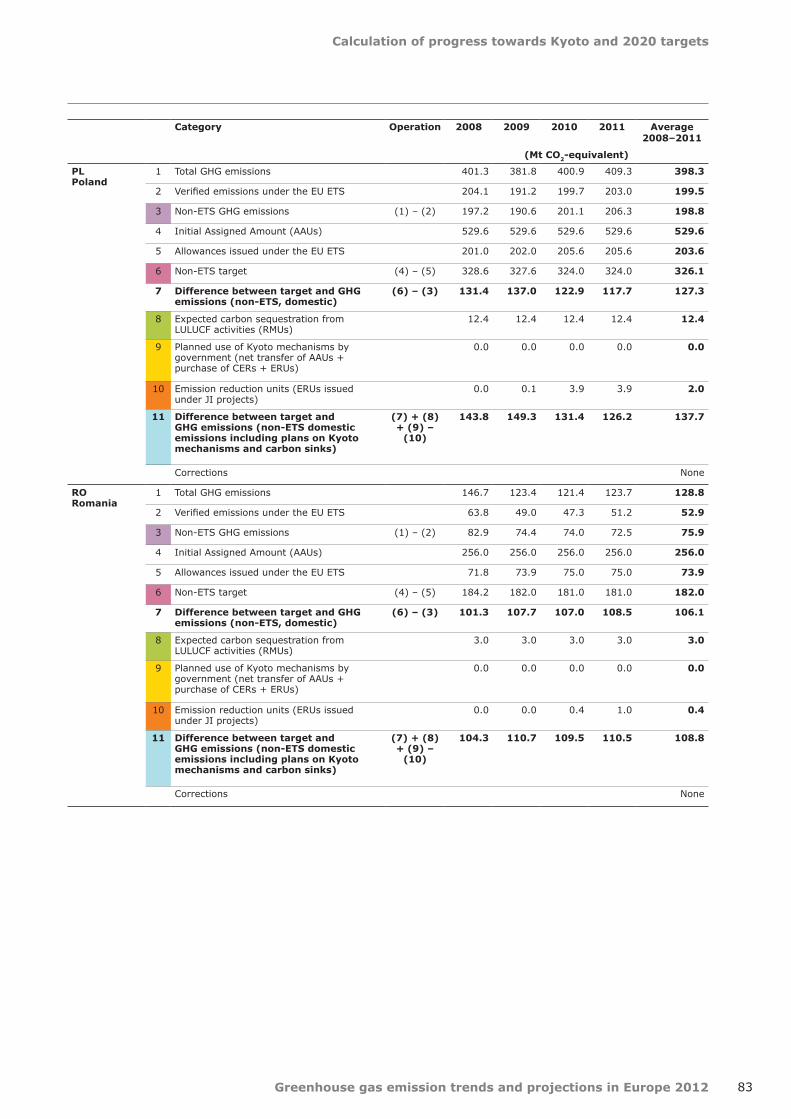
Calculation of progress towards Kyoto and 2020 targets
83Greenhouse gas emission trends and projections in Europe 2012
Category Operation 2008 2009 2010 2011 Average 2008–2011
(Mt CO2‑equivalent)
PL Poland
1 Total GHG emissions 401.3 381.8 400.9 409.3 398.3
2 Verified emissions under the EU ETS 204.1 191.2 199.7 203.0 199.5
3 Non-ETS GHG emissions (1) – (2) 197.2 190.6 201.1 206.3 198.8
4 Initial Assigned Amount (AAUs) 529.6 529.6 529.6 529.6 529.6
5 Allowances issued under the EU ETS 201.0 202.0 205.6 205.6 203.6
6 Non-ETS target (4) – (5) 328.6 327.6 324.0 324.0 326.1
7 Difference between target and GHG emissions (non‑ETS, domestic)
(6) – (3) 131.4 137.0 122.9 117.7 127.3
8 Expected carbon sequestration from LULUCF activities (RMUs)
12.4 12.4 12.4 12.4 12.4
9 Planned use of Kyoto mechanisms by government (net transfer of AAUs + purchase of CERs + ERUs)
0.0 0.0 0.0 0.0 0.0
10 Emission reduction units (ERUs issued under JI projects)
0.0 0.1 3.9 3.9 2.0
11 Difference between target and GHG emissions (non‑ETS domestic emissions including plans on Kyoto mechanisms and carbon sinks)
(7) + (8) + (9) –
(10)
143.8 149.3 131.4 126.2 137.7
Corrections None
RO Romania
1 Total GHG emissions 146.7 123.4 121.4 123.7 128.8
2 Verified emissions under the EU ETS 63.8 49.0 47.3 51.2 52.9
3 Non-ETS GHG emissions (1) – (2) 82.9 74.4 74.0 72.5 75.9
4 Initial Assigned Amount (AAUs) 256.0 256.0 256.0 256.0 256.0
5 Allowances issued under the EU ETS 71.8 73.9 75.0 75.0 73.9
6 Non-ETS target (4) – (5) 184.2 182.0 181.0 181.0 182.0
7 Difference between target and GHG emissions (non‑ETS, domestic)
(6) – (3) 101.3 107.7 107.0 108.5 106.1
8 Expected carbon sequestration from LULUCF activities (RMUs)
3.0 3.0 3.0 3.0 3.0
9 Planned use of Kyoto mechanisms by government (net transfer of AAUs + purchase of CERs + ERUs)
0.0 0.0 0.0 0.0 0.0
10 Emission reduction units (ERUs issued under JI projects)
0.0 0.0 0.4 1.0 0.4
11 Difference between target and GHG emissions (non‑ETS domestic emissions including plans on Kyoto mechanisms and carbon sinks)
(7) + (8) + (9) –
(10)
104.3 110.7 109.5 110.5 108.8
Corrections None
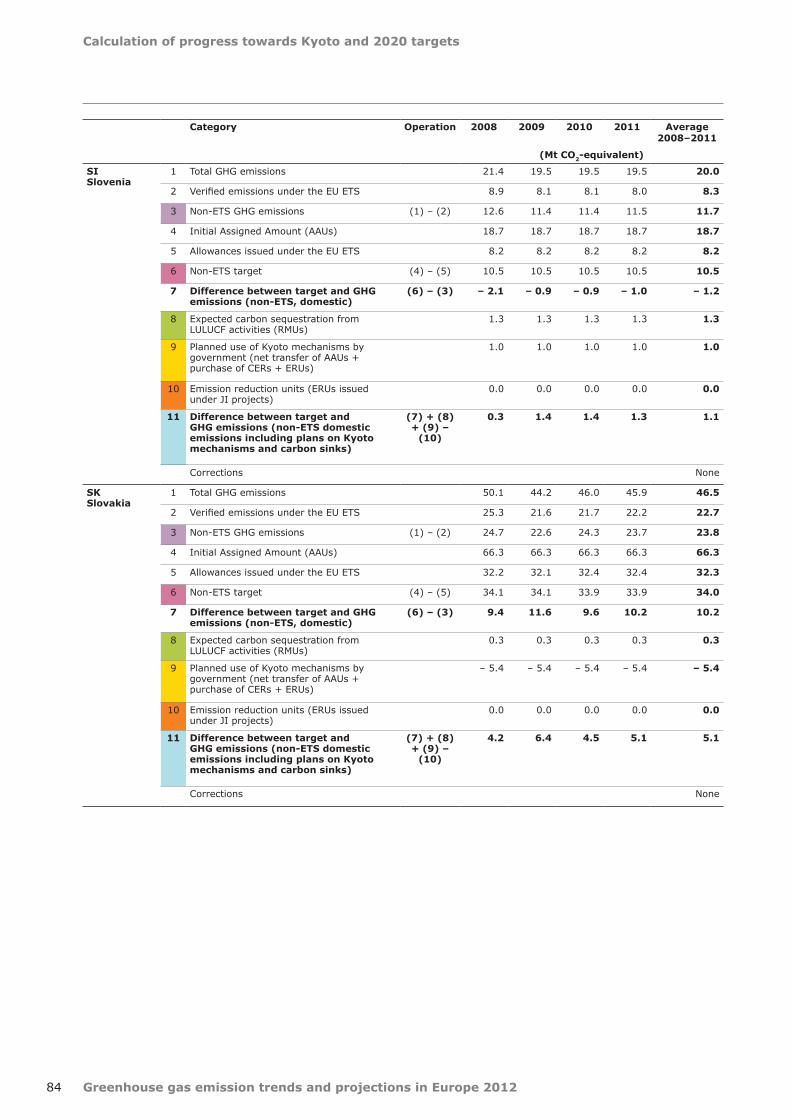
Calculation of progress towards Kyoto and 2020 targets
84 Greenhouse gas emission trends and projections in Europe 2012
Category Operation 2008 2009 2010 2011 Average 2008–2011
(Mt CO2‑equivalent)
SI Slovenia
1 Total GHG emissions 21.4 19.5 19.5 19.5 20.0
2 Verified emissions under the EU ETS 8.9 8.1 8.1 8.0 8.3
3 Non-ETS GHG emissions (1) – (2) 12.6 11.4 11.4 11.5 11.7
4 Initial Assigned Amount (AAUs) 18.7 18.7 18.7 18.7 18.7
5 Allowances issued under the EU ETS 8.2 8.2 8.2 8.2 8.2
6 Non-ETS target (4) – (5) 10.5 10.5 10.5 10.5 10.5
7 Difference between target and GHG emissions (non‑ETS, domestic)
(6) – (3) – 2.1 – 0.9 – 0.9 – 1.0 – 1.2
8 Expected carbon sequestration from LULUCF activities (RMUs)
1.3 1.3 1.3 1.3 1.3
9 Planned use of Kyoto mechanisms by government (net transfer of AAUs + purchase of CERs + ERUs)
1.0 1.0 1.0 1.0 1.0
10 Emission reduction units (ERUs issued under JI projects)
0.0 0.0 0.0 0.0 0.0
11 Difference between target and GHG emissions (non‑ETS domestic emissions including plans on Kyoto mechanisms and carbon sinks)
(7) + (8) + (9) –
(10)
0.3 1.4 1.4 1.3 1.1
Corrections None
SK Slovakia
1 Total GHG emissions 50.1 44.2 46.0 45.9 46.5
2 Verified emissions under the EU ETS 25.3 21.6 21.7 22.2 22.7
3 Non-ETS GHG emissions (1) – (2) 24.7 22.6 24.3 23.7 23.8
4 Initial Assigned Amount (AAUs) 66.3 66.3 66.3 66.3 66.3
5 Allowances issued under the EU ETS 32.2 32.1 32.4 32.4 32.3
6 Non-ETS target (4) – (5) 34.1 34.1 33.9 33.9 34.0
7 Difference between target and GHG emissions (non‑ETS, domestic)
(6) – (3) 9.4 11.6 9.6 10.2 10.2
8 Expected carbon sequestration from LULUCF activities (RMUs)
0.3 0.3 0.3 0.3 0.3
9 Planned use of Kyoto mechanisms by government (net transfer of AAUs + purchase of CERs + ERUs)
– 5.4 – 5.4 – 5.4 – 5.4 – 5.4
10 Emission reduction units (ERUs issued under JI projects)
0.0 0.0 0.0 0.0 0.0
11 Difference between target and GHG emissions (non‑ETS domestic emissions including plans on Kyoto mechanisms and carbon sinks)
(7) + (8) + (9) –
(10)
4.2 6.4 4.5 5.1 5.1
Corrections None
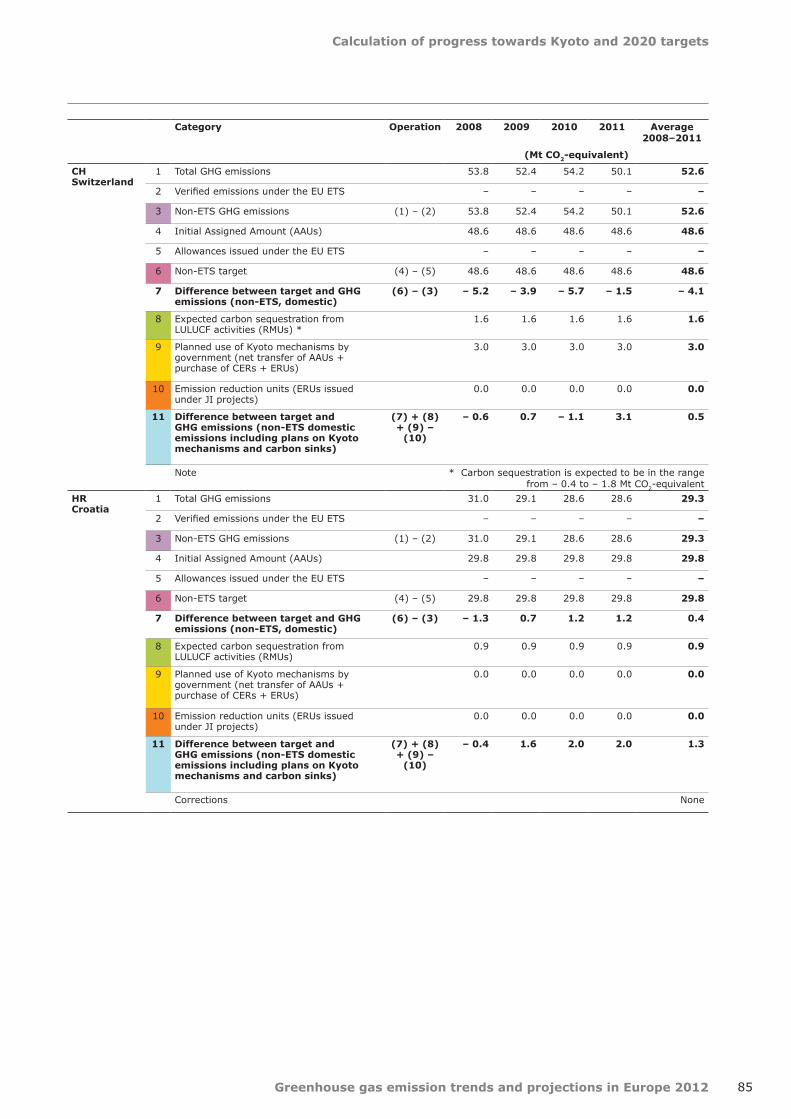
Calculation of progress towards Kyoto and 2020 targets
85Greenhouse gas emission trends and projections in Europe 2012
Category Operation 2008 2009 2010 2011 Average 2008–2011
(Mt CO2‑equivalent)
CH Switzerland
1 Total GHG emissions 53.8 52.4 54.2 50.1 52.6
2 Verified emissions under the EU ETS – – – – –
3 Non-ETS GHG emissions (1) – (2) 53.8 52.4 54.2 50.1 52.6
4 Initial Assigned Amount (AAUs) 48.6 48.6 48.6 48.6 48.6
5 Allowances issued under the EU ETS – – – – –
6 Non-ETS target (4) – (5) 48.6 48.6 48.6 48.6 48.6
7 Difference between target and GHG emissions (non‑ETS, domestic)
(6) – (3) – 5.2 – 3.9 – 5.7 – 1.5 – 4.1
8 Expected carbon sequestration from LULUCF activities (RMUs) *
1.6 1.6 1.6 1.6 1.6
9 Planned use of Kyoto mechanisms by government (net transfer of AAUs + purchase of CERs + ERUs)
3.0 3.0 3.0 3.0 3.0
10 Emission reduction units (ERUs issued under JI projects)
0.0 0.0 0.0 0.0 0.0
11 Difference between target and GHG emissions (non‑ETS domestic emissions including plans on Kyoto mechanisms and carbon sinks)
(7) + (8) + (9) –
(10)
– 0.6 0.7 – 1.1 3.1 0.5
Note * Carbon sequestration is expected to be in the range from – 0.4 to – 1.8 Mt CO2-equivalent
HR Croatia
1 Total GHG emissions 31.0 29.1 28.6 28.6 29.3
2 Verified emissions under the EU ETS – – – – –
3 Non-ETS GHG emissions (1) – (2) 31.0 29.1 28.6 28.6 29.3
4 Initial Assigned Amount (AAUs) 29.8 29.8 29.8 29.8 29.8
5 Allowances issued under the EU ETS – – – – –
6 Non-ETS target (4) – (5) 29.8 29.8 29.8 29.8 29.8
7 Difference between target and GHG emissions (non‑ETS, domestic)
(6) – (3) – 1.3 0.7 1.2 1.2 0.4
8 Expected carbon sequestration from LULUCF activities (RMUs)
0.9 0.9 0.9 0.9 0.9
9 Planned use of Kyoto mechanisms by government (net transfer of AAUs + purchase of CERs + ERUs)
0.0 0.0 0.0 0.0 0.0
10 Emission reduction units (ERUs issued under JI projects)
0.0 0.0 0.0 0.0 0.0
11 Difference between target and GHG emissions (non‑ETS domestic emissions including plans on Kyoto mechanisms and carbon sinks)
(7) + (8) + (9) –
(10)
– 0.4 1.6 2.0 2.0 1.3
Corrections None

Calculation of progress towards Kyoto and 2020 targets
86 Greenhouse gas emission trends and projections in Europe 2012
Category Operation 2008 2009 2010 2011 Average 2008–2011
(Mt CO2‑equivalent)
IS Iceland
1 Total GHG emissions 3.4 3.3 3.2 3.2 3.3
2 Verified emissions under the EU ETS – – – – –
3 Non-ETS GHG emissions (1) – (2) 3.4 3.3 3.2 3.2 3.3
4 Initial Assigned Amount (AAUs) 3.7 3.7 3.7 3.7 3.7
5 Allowances issued under the EU ETS – – – – –
6 Non-ETS target (4) – (5) 3.7 3.7 3.7 3.7 3.7
7 Difference between target and GHG emissions (non‑ETS, domestic)
(6) – (3) 0.3 0.4 0.5 0.5 0.4
8 Expected carbon sequestration from LULUCF activities (RMUs)
0.4 0.4 0.4 0.4 0.4
9 Planned use of Kyoto mechanisms by government (net transfer of AAUs + purchase of CERs + ERUs)
0.0 0.0 0.0 0.0 0.0
10 Emission reduction units (ERUs issued under JI projects)
0.0 0.0 0.0 0.0 0.0
11 Difference between target and GHG emissions (non‑ETS domestic emissions including plans on Kyoto mechanisms and carbon sinks)
(7) + (8) + (9) –
(10)
0.7 0.8 1.0 1.0 0.9
Corrections Correction of Total GHG emissions: Emissions from aluminium prodution
are excluded according to COP Decision 14/CP.7
LI Liechtenstein
1 Total GHG emissions 0.26 0.25 0.23 0.23 0.24
2 Verified emissions under the EU ETS 0.02 0.01 0.00 0.00 0.01
3 Non-ETS GHG emissions (1) – (2) 0.24 0.24 0.23 0.23 0.24
4 Initial Assigned Amount (AAUs) 0.21 0.21 0.21 0.21 0.21
5 Allowances issued under the EU ETS 0.02 0.02 0.02 0.02 0.02
6 Non-ETS target (4) – (5) 0.19 0.19 0.19 0.19 0.19
7 Difference between target and GHG emissions (non‑ETS, domestic)
(6) – (3) – 0.05 – 0.04 – 0.04 – 0.04 – 0.04
8 Expected carbon sequestration from LULUCF activities (RMUs)
0.00 0.00 0.00 0.00 0.00
9 Planned use of Kyoto mechanisms by government (net transfer of AAUs + purchase of CERs + ERUs)
0.05 0.05 0.05 0.05 0.05
10 Emission reduction units (ERUs issued under JI projects)
0.00 0.00 0.00 0.00 0.00
11 Difference between target and GHG emissions (non‑ETS domestic emissions including plans on Kyoto mechanisms and carbon sinks)
(7) + (8) + (9) –
(10)
– 0.01 0.01 0.01 0.01 0.00
Corrections None
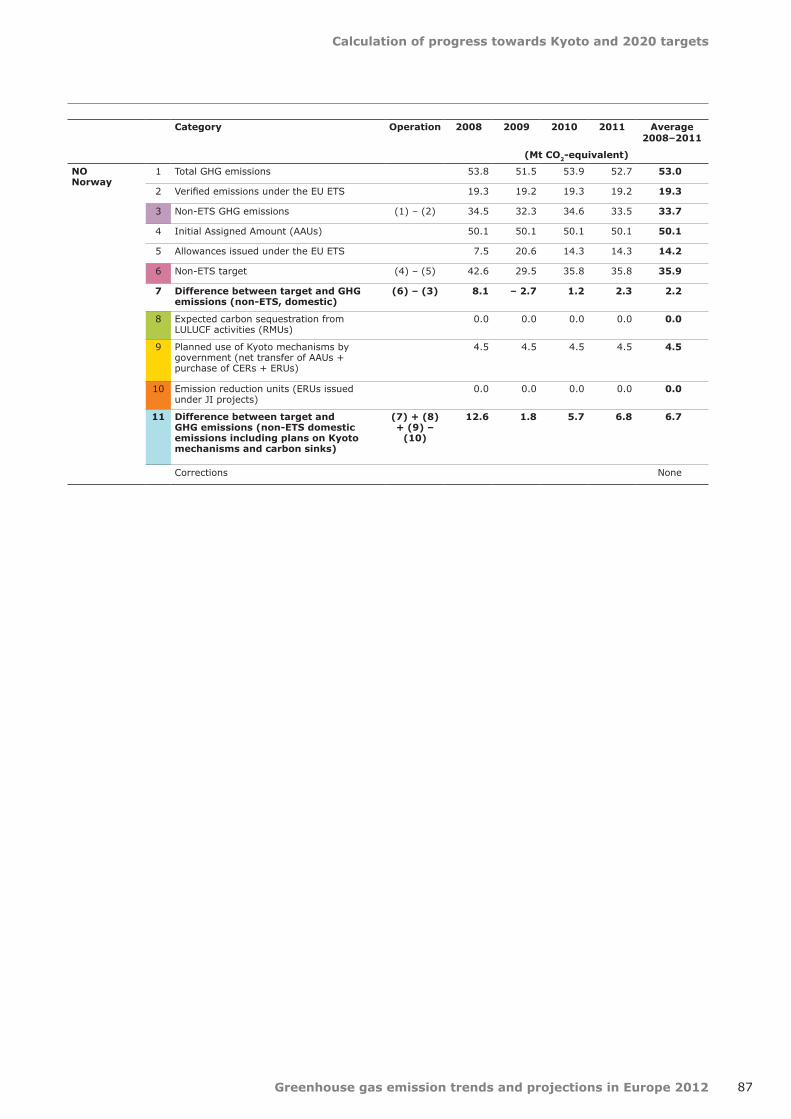
Calculation of progress towards Kyoto and 2020 targets
87Greenhouse gas emission trends and projections in Europe 2012
Category Operation 2008 2009 2010 2011 Average 2008–2011
(Mt CO2‑equivalent)
NO Norway
1 Total GHG emissions 53.8 51.5 53.9 52.7 53.0
2 Verified emissions under the EU ETS 19.3 19.2 19.3 19.2 19.3
3 Non-ETS GHG emissions (1) – (2) 34.5 32.3 34.6 33.5 33.7
4 Initial Assigned Amount (AAUs) 50.1 50.1 50.1 50.1 50.1
5 Allowances issued under the EU ETS 7.5 20.6 14.3 14.3 14.2
6 Non-ETS target (4) – (5) 42.6 29.5 35.8 35.8 35.9
7 Difference between target and GHG emissions (non‑ETS, domestic)
(6) – (3) 8.1 – 2.7 1.2 2.3 2.2
8 Expected carbon sequestration from LULUCF activities (RMUs)
0.0 0.0 0.0 0.0 0.0
9 Planned use of Kyoto mechanisms by government (net transfer of AAUs + purchase of CERs + ERUs)
4.5 4.5 4.5 4.5 4.5
10 Emission reduction units (ERUs issued under JI projects)
0.0 0.0 0.0 0.0 0.0
11 Difference between target and GHG emissions (non‑ETS domestic emissions including plans on Kyoto mechanisms and carbon sinks)
(7) + (8) + (9) –
(10)
12.6 1.8 5.7 6.8 6.7
Corrections None

Calculation of progress towards Kyoto and 2020 targets
88 Greenhouse gas emission trends and projections in Europe 2012
Table 9.2 Calculation of projected progress towards 2020 targets
Country 2005 non‑ETS estimate
consistent with the adjusted 2020 ESD
target
2020 ESD
target
2020 'ETS‑adjusted'
ESD target estimate
2020 non‑ETS
projections WEM
2020 non‑ETS
projections WAM
Gap WEM Gap WAM
(Mt CO2‑eq.)
(%) (Mt CO2‑eq.)
(Mt CO2‑eq.)
(Mt CO2‑eq.)
(Mt CO2‑eq.)
(%) (Mt CO2‑eq.)
(%)
Austria 56.99 – 16.0 47.87 53.94 46.92 – 6.07 – 10.7 0.95 1.7
Belgium 78.44 – 15.0 66.68 78.92 71.34 – 12.24 – 15.6 – 4.66 – 5.9
Bulgaria 22.69 20.0 27.23 25.37 25.37 1.86 8.2 1.86 8.2
Cyprus 5.80 – 5.0 5.51 4.68 3.21 0.83 14.3 2.31 39.7
Czech Republic 60.29 9.0 65.71 56.02 54.76 9.70 16.1 10.95 18.2
Denmark 37.17 – 20.0 29.73 33.39 29.47 – 3.66 – 9.8 0.26 0.7
Estonia 5.65 11.0 6.27 6.34 6.08 – 0.07 – 1.2 0.19 3.4
Finland 32.97 – 16.0 27.69 28.50 27.00 – 0.81 – 2.5 0.69 2.1
France 407.05 – 14.0 350.06 360.80 314.81 – 10.73 – 2.6 35.26 8.7
Germany 485.10 – 14.0 417.19 401.36 350.36 15.82 3.3 66.83 13.8
Greece 61.31 – 4.0 58.86 62.95 60.85 – 4.09 – 6.7 – 1.99 – 3.3
Hungary 51.46 10.0 56.61 38.28 36.05 18.33 35.6 20.55 39.9
Ireland 46.49 – 20.0 37.19 45.30 41.64 – 8.11 – 17.5 – 4.45 – 9.6
Italy 329.52 – 13.0 286.68 319.00 271.58 – 32.32 – 9.8 15.10 4.6
Latvia 8.21 17.0 9.60 9.70 9.25 – 0.10 – 1.2 0.35 4.2
Lithuania 12.93 15.0 14.88 14.43 14.19 0.45 3.5 0.69 5.3
Luxembourg 10.11 – 20.0 8.08 10.81 10.07 – 2.73 – 27.0 – 1.99 – 19.7
Malta 1.06 5.0 1.11 1.41 1.17 – 0.30 – 28.3 – 0.06 – 6.1
Netherlands 124.37 – 16.0 104.47 101.71 94.79 2.76 2.2 9.68 7.8
Poland 171.04 14.0 194.98 170.80 170.80 24.18 14.1 24.18 14.1
Portugal 48.55 1.0 49.03 40.72 40.72 8.32 17.1 8.32 17.1
Romania 70.24 19.0 83.58 76.88 76.88 6.71 9.6 6.71 9.6
Slovakia 22.49 13.0 25.42 21.97 21.04 3.45 15.3 4.38 19.5
Slovenia 11.52 4.0 11.98 13.44 10.81 – 1.46 – 12.7 1.17 10.2
Spain 230.63 – 10.0 207.57 208.43 207.62 – 0.87 – 0.4 – 0.05 0.0
Sweden 43.85 – 17.0 36.40 36.32 36.32 0.08 0.2 0.08 0.2
United Kingdom 377.92 – 16.0 317.45 292.42 292.42 25.04 6.6 25.04 6.6
Note: Progress calculated based on domestic emissions only, without accounting for possible use of flexibility options.
The ESD target represents the 2020 target for emissions not covered by the EU ETS, as defined in percentage in the ESD (EC, 2009a). The quantitative 2020 targets are preliminary estimates made by the EEA, taking into account future cap adjustments for the trading period from 2013 to 2020. These data are based on preliminary estimates and calculations by EEA and do not constitute final data.
2005 non-ETS emissions estimated based on 2020 target estimates and percentage reduction targets. These estimates do not include CO2 from domestic aviation.
Absolute gaps calculated as the difference between emissions and targets. Relative gaps estimated by dividing absolute gaps by 2005 non-ETS emission estimates.
Source: EEA, 2012b, EEA, 2012d; EU, 2009a; information on possible cap adjustments provided by the European Commission.
89
Country profiles
Greenhouse gas emission trends and projections in Europe 2012
10 Country profiles
Country profiles have been prepared for each EEA member country. The country profiles present key data on trends in greenhouse gas emissions over the period 1990–2011 and projections of greenhouse gas emissions until 2020, with additional data on
the EU ETS for 2008–2011. All data made available by member countries up to May 2012 is included. The country profiles also include brief assessments of past trends (2009–2010) and progress towards Kyoto targets (where applicable).
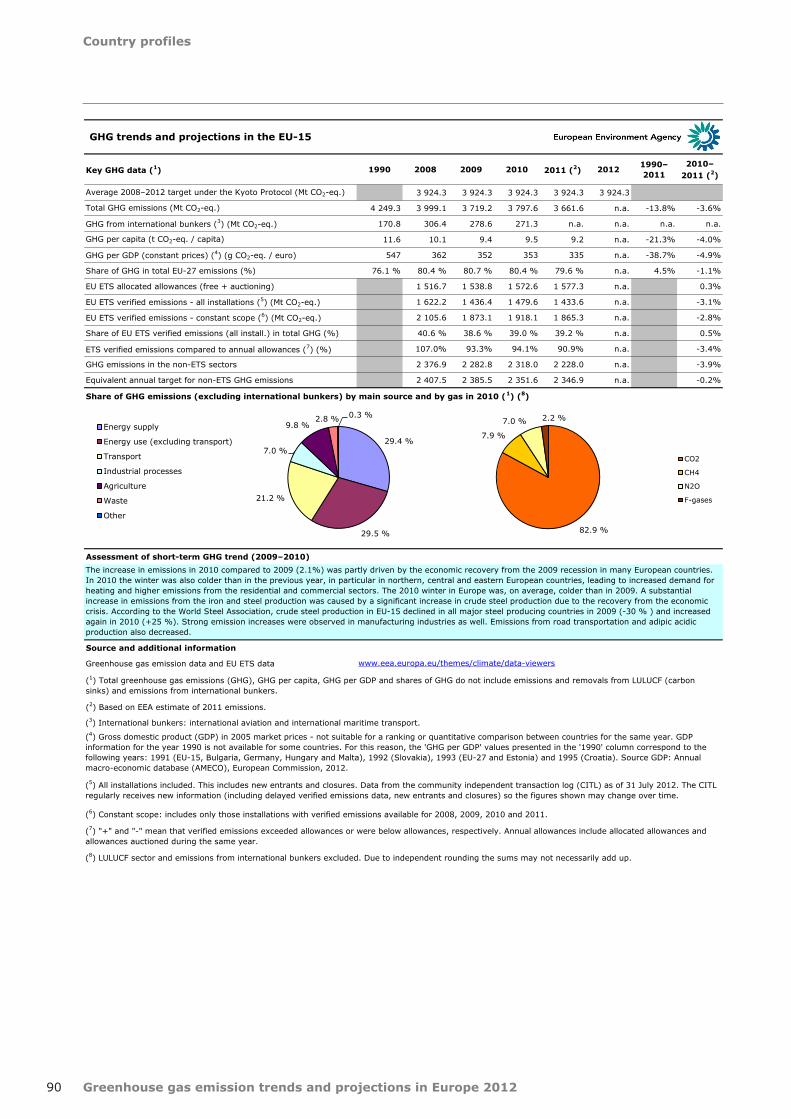
Country profiles
90 Greenhouse gas emission trends and projections in Europe 2012
Key GHG data (1) 1990 2008 2009 2010 2011 (2) 2012 1990–2011
2010–2011 (2)
Average 2008–2012 target under the Kyoto Protocol (Mt CO2-eq.) 3 924.3 3 924.3 3 924.3 3 924.3 3 924.3
Total GHG emissions (Mt CO2-eq.) 4 249.3 3 999.1 3 719.2 3 797.6 3 661.6 n.a. -13.8% -3.6%
GHG from international bunkers (3) (Mt CO2-eq.) 170.8 306.4 278.6 271.3 n.a. n.a. n.a. n.a.
GHG per capita (t CO2-eq. / capita) 11.6 10.1 9.4 9.5 9.2 n.a. -21.3% -4.0%
GHG per GDP (constant prices) (4) (g CO2-eq. / euro) 547 362 352 353 335 n.a. -38.7% -4.9%
Share of GHG in total EU-27 emissions (%) 76.1 % 80.4 % 80.7 % 80.4 % 79.6 % n.a. 4.5% -1.1%
EU ETS allocated allowances (free + auctioning) 1 516.7 1 538.8 1 572.6 1 577.3 n.a. 0.3%
EU ETS verified emissions - all installations (5) (Mt CO2-eq.) 1 622.2 1 436.4 1 479.6 1 433.6 n.a. -3.1%
EU ETS verified emissions - constant scope (6) (Mt CO2-eq.) 2 105.6 1 873.1 1 918.1 1 865.3 n.a. -2.8%
Share of EU ETS verified emissions (all install.) in total GHG (%) 40.6 % 38.6 % 39.0 % 39.2 % n.a. 0.5%
ETS verified emissions compared to annual allowances (7) (%) 107.0% 93.3% 94.1% 90.9% n.a. -3.4%
GHG emissions in the non-ETS sectors 2 376.9 2 282.8 2 318.0 2 228.0 n.a. -3.9%
Equivalent annual target for non-ETS GHG emissions 2 407.5 2 385.5 2 351.6 2 346.9 n.a. -0.2%
Share of GHG emissions (excluding international bunkers) by main source and by gas in 2010 (1) (8)
Assessment of short-term GHG trend (2009–2010)
Source and additional information
Greenhouse gas emission data and EU ETS data
The increase in emissions in 2010 compared to 2009 (2.1%) was partly driven by the economic recovery from the 2009 recession in many European countries. In 2010 the winter was also colder than in the previous year, in particular in northern, central and eastern European countries, leading to increased demand forheating and higher emissions from the residential and commercial sectors. The 2010 winter in Europe was, on average, colder than in 2009. A substantial increase in emissions from the iron and steel production was caused by a significant increase in crude steel production due to the recovery from the economic crisis. According to the World Steel Association, crude steel production in EU-15 declined in all major steel producing countries in 2009 (-30 % ) and increased again in 2010 (+25 %). Strong emission increases were observed in manufacturing industries as well. Emissions from road transportation and adipic acidic production also decreased.
www.eea.europa.eu/themes/climate/data-viewers
(5) All installations included. This includes new entrants and closures. Data from the community independent transaction log (CITL) as of 31 July 2012. The CITL regularly receives new information (including delayed verified emissions data, new entrants and closures) so the figures shown may change over time.
(7) "+" and "-" mean that verified emissions exceeded allowances or were below allowances, respectively. Annual allowances include allocated allowances and allowances auctioned during the same year.
(8) LULUCF sector and emissions from international bunkers excluded. Due to independent rounding the sums may not necessarily add up.
(6) Constant scope: includes only those installations with verified emissions available for 2008, 2009, 2010 and 2011.
(1) Total greenhouse gas emissions (GHG), GHG per capita, GHG per GDP and shares of GHG do not include emissions and removals from LULUCF (carbon sinks) and emissions from international bunkers.
(3) International bunkers: international aviation and international maritime transport.
(4) Gross domestic product (GDP) in 2005 market prices - not suitable for a ranking or quantitative comparison between countries for the same year. GDP information for the year 1990 is not available for some countries. For this reason, the 'GHG per GDP' values presented in the '1990' column correspond to the following years: 1991 (EU-15, Bulgaria, Germany, Hungary and Malta), 1992 (Slovakia), 1993 (EU-27 and Estonia) and 1995 (Croatia). Source GDP: Annual macro-economic database (AMECO), European Commission, 2012.
(2) Based on EEA estimate of 2011 emissions.
GHG trends and projections in the EU-15
29.4 %
29.5 %
21.2 %
7.0 %
9.8 % 2.8 % 0.3 %
Energy supply
Energy use (excluding transport)
Transport
Industrial processes
Agriculture
Waste
Other
82.9 %
7.9 %
7.0 % 2.2 %
CO2
CH4
N2O
F-gases
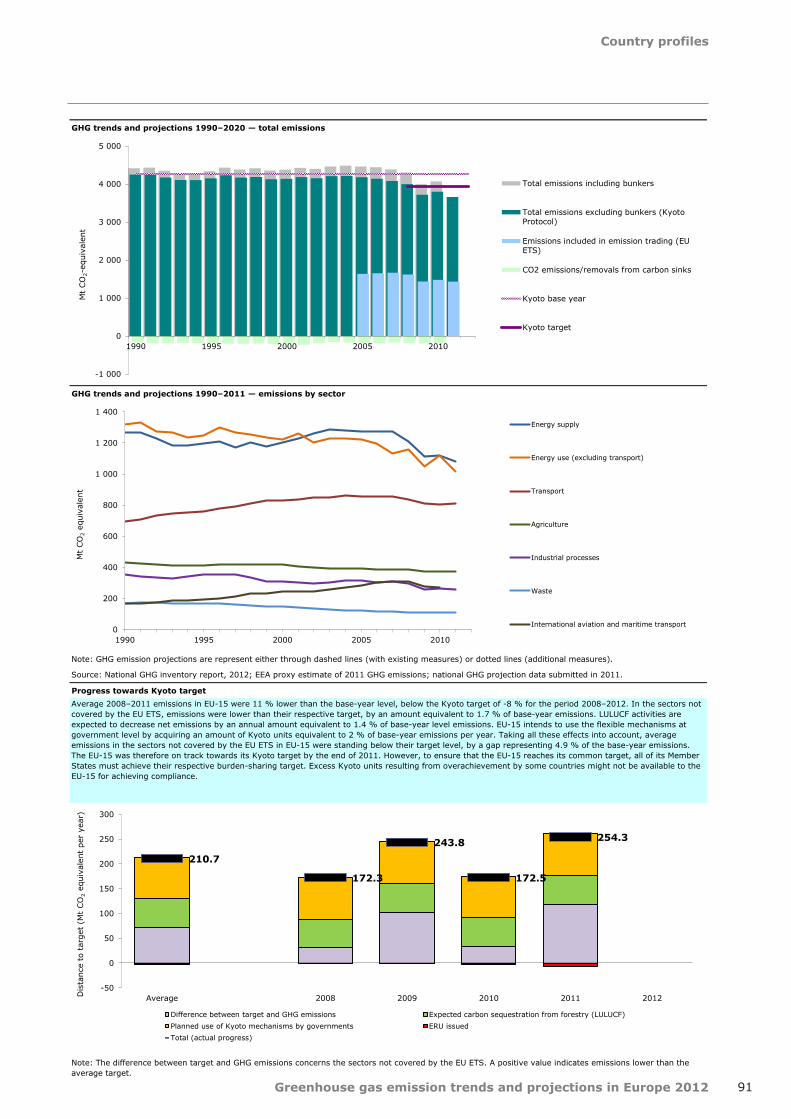
Country profiles
91Greenhouse gas emission trends and projections in Europe 2012
GHG trends and projections 1990–2020 — total emissions
GHG trends and projections 1990–2011 — emissions by sector
Progress towards Kyoto target
Note: The difference between target and GHG emissions concerns the sectors not covered by the EU ETS. A positive value indicates emissions lower than the average target.
Average 2008–2011 emissions in EU-15 were 11 % lower than the base-year level, below the Kyoto target of -8 % for the period 2008–2012. In the sectors not covered by the EU ETS, emissions were lower than their respective target, by an amount equivalent to 1.7 % of base-year emissions. LULUCF activities are expected to decrease net emissions by an annual amount equivalent to 1.4 % of base-year level emissions. EU-15 intends to use the flexible mechanisms at government level by acquiring an amount of Kyoto units equivalent to 2 % of base-year emissions per year. Taking all these effects into account, average emissions in the sectors not covered by the EU ETS in EU-15 were standing below their target level, by a gap representing 4.9 % of the base-year emissions. The EU-15 was therefore on track towards its Kyoto target by the end of 2011. However, to ensure that the EU-15 reaches its common target, all of its Member States must achieve their respective burden-sharing target. Excess Kyoto units resulting from overachievement by some countries might not be available to the EU-15 for achieving compliance.
Note: GHG emission projections are represent either through dashed lines (with existing measures) or dotted lines (additional measures).
Source: National GHG inventory report, 2012; EEA proxy estimate of 2011 GHG emissions; national GHG projection data submitted in 2011.
-1 000
0
1 000
2 000
3 000
4 000
5 000
1990 1995 2000 2005 2010
Mt
CO
2-eq
uiva
lent
Total emissions including bunkers
Total emissions excluding bunkers (KyotoProtocol)
Emissions included in emission trading (EUETS)
CO2 emissions/removals from carbon sinks
Kyoto base year
Kyoto target
210.7
172.3
243.8
172.5
254.3
-50
0
50
100
150
200
250
300
Average 2008 2009 2010 2011 2012Dis
tanc
e to
tar
get
(Mt
CO
2 eq
uiva
lent
per
yea
r)
Difference between target and GHG emissions Expected carbon sequestration from forestry (LULUCF)Planned use of Kyoto mechanisms by governments ERU issuedTotal (actual progress)
0
200
400
600
800
1 000
1 200
1 400
1990 1995 2000 2005 2010
Mt
CO
2 eq
uiva
lent
Energy supply
Energy use (excluding transport)
Transport
Agriculture
Industrial processes
Waste
International aviation and maritime transport
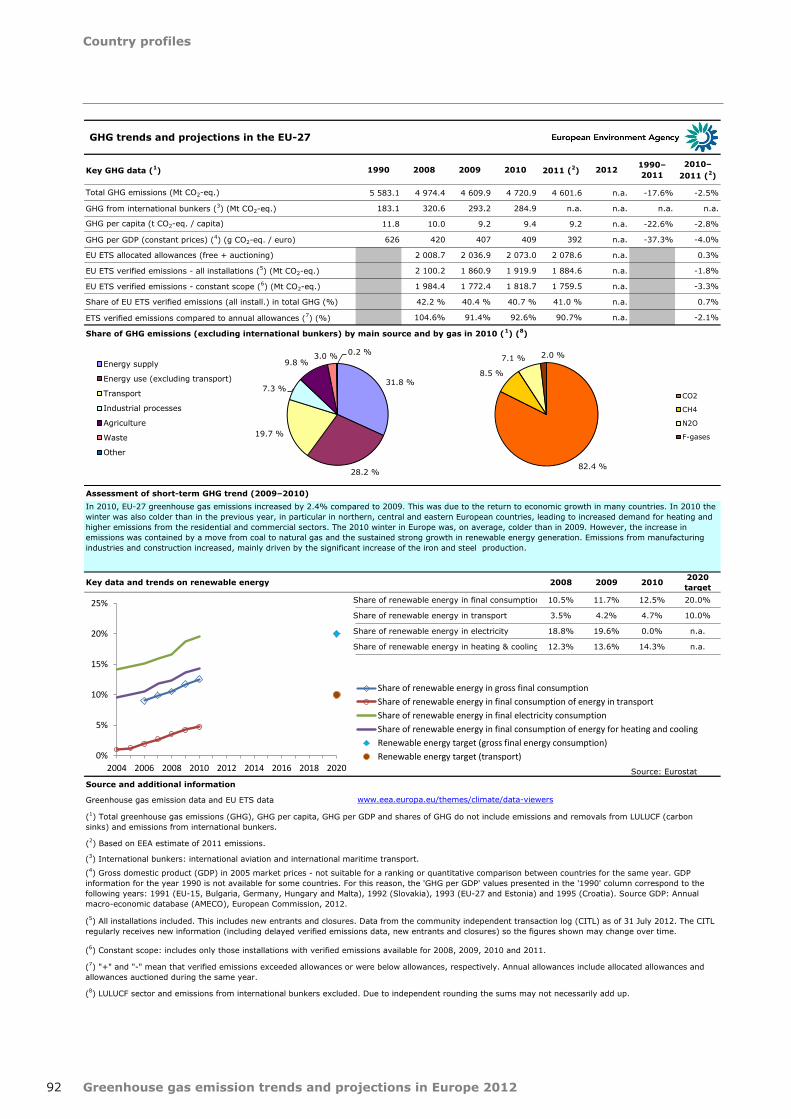
Country profiles
92 Greenhouse gas emission trends and projections in Europe 2012
Key GHG data (1) 1990 2008 2009 2010 2011 (2) 2012 1990–2011
2010–2011 (2)
Total GHG emissions (Mt CO2-eq.) 5 583.1 4 974.4 4 609.9 4 720.9 4 601.6 n.a. -17.6% -2.5%
GHG from international bunkers (3) (Mt CO2-eq.) 183.1 320.6 293.2 284.9 n.a. n.a. n.a. n.a.
GHG per capita (t CO2-eq. / capita) 11.8 10.0 9.2 9.4 9.2 n.a. -22.6% -2.8%
GHG per GDP (constant prices) (4) (g CO2-eq. / euro) 626 420 407 409 392 n.a. -37.3% -4.0%
EU ETS allocated allowances (free + auctioning) 2 008.7 2 036.9 2 073.0 2 078.6 n.a. 0.3%
EU ETS verified emissions - all installations (5) (Mt CO2-eq.) 2 100.2 1 860.9 1 919.9 1 884.6 n.a. -1.8%
EU ETS verified emissions - constant scope (6) (Mt CO2-eq.) 1 984.4 1 772.4 1 818.7 1 759.5 n.a. -3.3%
Share of EU ETS verified emissions (all install.) in total GHG (%) 42.2 % 40.4 % 40.7 % 41.0 % n.a. 0.7%
ETS verified emissions compared to annual allowances (7) (%) 104.6% 91.4% 92.6% 90.7% n.a. -2.1%
Share of GHG emissions (excluding international bunkers) by main source and by gas in 2010 (1) (8)
Assessment of short-term GHG trend (2009–2010)
Key data and trends on renewable energy 2008 2009 2010 2020 target
Share of renewable energy in final consumption 10.5% 11.7% 12.5% 20.0%
Share of renewable energy in transport 3.5% 4.2% 4.7% 10.0%
Share of renewable energy in electricity 18.8% 19.6% 0.0% n.a.
Share of renewable energy in heating & cooling 12.3% 13.6% 14.3% n.a.
Source: EurostatSource and additional information
Greenhouse gas emission data and EU ETS data
In 2010, EU-27 greenhouse gas emissions increased by 2.4% compared to 2009. This was due to the return to economic growth in many countries. In 2010 the winter was also colder than in the previous year, in particular in northern, central and eastern European countries, leading to increased demand for heating and higher emissions from the residential and commercial sectors. The 2010 winter in Europe was, on average, colder than in 2009. However, the increase in emissions was contained by a move from coal to natural gas and the sustained strong growth in renewable energy generation. Emissions from manufacturing industries and construction increased, mainly driven by the significant increase of the iron and steel production.
www.eea.europa.eu/themes/climate/data-viewers
(5) All installations included. This includes new entrants and closures. Data from the community independent transaction log (CITL) as of 31 July 2012. The CITL regularly receives new information (including delayed verified emissions data, new entrants and closures) so the figures shown may change over time.
(7) "+" and "-" mean that verified emissions exceeded allowances or were below allowances, respectively. Annual allowances include allocated allowances and allowances auctioned during the same year.
(8) LULUCF sector and emissions from international bunkers excluded. Due to independent rounding the sums may not necessarily add up.
(6) Constant scope: includes only those installations with verified emissions available for 2008, 2009, 2010 and 2011.
(1) Total greenhouse gas emissions (GHG), GHG per capita, GHG per GDP and shares of GHG do not include emissions and removals from LULUCF (carbon sinks) and emissions from international bunkers.
(3) International bunkers: international aviation and international maritime transport.
(4) Gross domestic product (GDP) in 2005 market prices - not suitable for a ranking or quantitative comparison between countries for the same year. GDP information for the year 1990 is not available for some countries. For this reason, the 'GHG per GDP' values presented in the '1990' column correspond to the following years: 1991 (EU-15, Bulgaria, Germany, Hungary and Malta), 1992 (Slovakia), 1993 (EU-27 and Estonia) and 1995 (Croatia). Source GDP: Annual macro-economic database (AMECO), European Commission, 2012.
(2) Based on EEA estimate of 2011 emissions.
GHG trends and projections in the EU-27
31.8 %
28.2 %
19.7 %
7.3 %
9.8 % 3.0 % 0.2 %
Energy supply
Energy use (excluding transport)
Transport
Industrial processes
Agriculture
Waste
Other
82.4 %
8.5 %
7.1 % 2.0 %
CO2
CH4
N2O
F-gases
0%
5%
10%
15%
20%
25%
2004 2006 2008 2010 2012 2014 2016 2018 2020
Share of renewable energy in gross final consumptionShare of renewable energy in final consumption of energy in transportShare of renewable energy in final electricity consumptionShare of renewable energy in final consumption of energy for heating and coolingRenewable energy target (gross final energy consumption)Renewable energy target (transport)

Country profiles
93Greenhouse gas emission trends and projections in Europe 2012
GHG trends and projections 1990–2020 — total emissions
GHG trends and projections 1990–2020 — emissions by sector
Progress towards Kyoto targetThe EU-27 does not have a target under the Kyoto Protocol. Recent EEA estimates indicate a 2.5 % emission decrease in 2011 compared to 2010. Projections from Member States indicate that the long-term reduction trend observed since 1990 is expected to continue until 2020 and after. With the current set of measures in place, Member States do not project sufficient emission reductions to allow the EU to meet its unilateral 20 % reduction commitment by 2020. Additional measures, currently planned by Member States, will help in achieving this target but further policies will be needed to achieve even more important emission cuts in the long term.
Note: GHG emission projections are represent either through dashed lines (with existing measures) or dotted lines (additional measures).
Source: National GHG inventory report, 2012; EEA proxy estimate of 2011 GHG emissions; national GHG projection data submitted in 2011.
-1 000
0
1 000
2 000
3 000
4 000
5 000
6 000
7 000
1990 1995 2000 2005 2010 2015 2020
Mt
CO
2-eq
uiva
lent
Projections (with existing measures)
Projections (with additional measures)
Total emissions including bunkers
Total emissions excluding bunkers
Emissions included in emission trading (EU ETS)
CO2 emissions/removals from carbon sinks
0
200
400
600
800
1 000
1 200
1 400
1 600
1 800
2 000
1990 1995 2000 2005 2010 2015 2020
Mt
CO
2 eq
uiva
lent
Energy supply
Energy use (excluding transport)
Transport
Agriculture
Industrial processes
Waste
International aviation and maritime transport
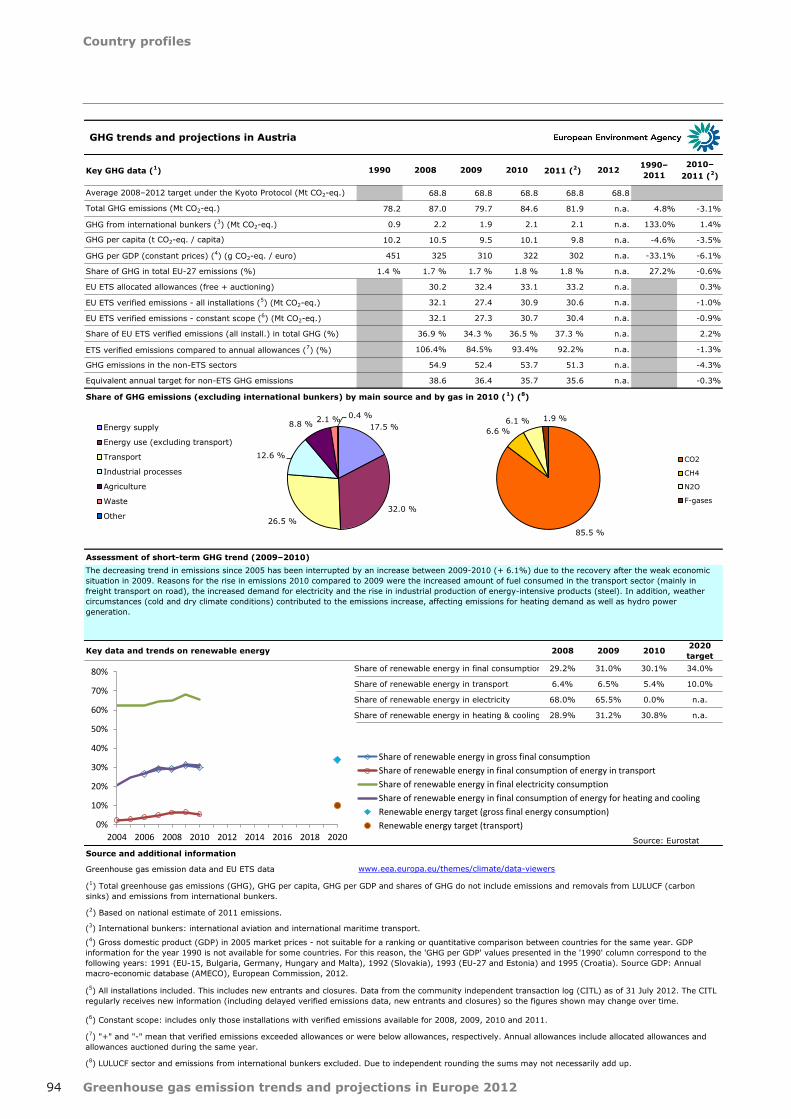
Country profiles
94 Greenhouse gas emission trends and projections in Europe 2012
Key GHG data (1) 1990 2008 2009 2010 2011 (2) 2012 1990–2011
2010–2011 (2)
Average 2008–2012 target under the Kyoto Protocol (Mt CO2-eq.) 68.8 68.8 68.8 68.8 68.8
Total GHG emissions (Mt CO2-eq.) 78.2 87.0 79.7 84.6 81.9 n.a. 4.8% -3.1%
GHG from international bunkers (3) (Mt CO2-eq.) 0.9 2.2 1.9 2.1 2.1 n.a. 133.0% 1.4%
GHG per capita (t CO2-eq. / capita) 10.2 10.5 9.5 10.1 9.8 n.a. -4.6% -3.5%
GHG per GDP (constant prices) (4) (g CO2-eq. / euro) 451 325 310 322 302 n.a. -33.1% -6.1%
Share of GHG in total EU-27 emissions (%) 1.4 % 1.7 % 1.7 % 1.8 % 1.8 % n.a. 27.2% -0.6%
EU ETS allocated allowances (free + auctioning) 30.2 32.4 33.1 33.2 n.a. 0.3%
EU ETS verified emissions - all installations (5) (Mt CO2-eq.) 32.1 27.4 30.9 30.6 n.a. -1.0%
EU ETS verified emissions - constant scope (6) (Mt CO2-eq.) 32.1 27.3 30.7 30.4 n.a. -0.9%
Share of EU ETS verified emissions (all install.) in total GHG (%) 36.9 % 34.3 % 36.5 % 37.3 % n.a. 2.2%
ETS verified emissions compared to annual allowances (7) (%) 106.4% 84.5% 93.4% 92.2% n.a. -1.3%
GHG emissions in the non-ETS sectors 54.9 52.4 53.7 51.3 n.a. -4.3%
Equivalent annual target for non-ETS GHG emissions 38.6 36.4 35.7 35.6 n.a. -0.3%
Share of GHG emissions (excluding international bunkers) by main source and by gas in 2010 (1) (8)
Assessment of short-term GHG trend (2009–2010)
Key data and trends on renewable energy 2008 2009 2010 2020 target
Share of renewable energy in final consumption 29.2% 31.0% 30.1% 34.0%
Share of renewable energy in transport 6.4% 6.5% 5.4% 10.0%
Share of renewable energy in electricity 68.0% 65.5% 0.0% n.a.
Share of renewable energy in heating & cooling 28.9% 31.2% 30.8% n.a.
Source: EurostatSource and additional information
Greenhouse gas emission data and EU ETS data
The decreasing trend in emissions since 2005 has been interrupted by an increase between 2009-2010 (+ 6.1%) due to the recovery after the weak economic situation in 2009. Reasons for the rise in emissions 2010 compared to 2009 were the increased amount of fuel consumed in the transport sector (mainly in freight transport on road), the increased demand for electricity and the rise in industrial production of energy-intensive products (steel). In addition, weather circumstances (cold and dry climate conditions) contributed to the emissions increase, affecting emissions for heating demand as well as hydro power generation.
www.eea.europa.eu/themes/climate/data-viewers
(5) All installations included. This includes new entrants and closures. Data from the community independent transaction log (CITL) as of 31 July 2012. The CITL regularly receives new information (including delayed verified emissions data, new entrants and closures) so the figures shown may change over time.
(7) "+" and "-" mean that verified emissions exceeded allowances or were below allowances, respectively. Annual allowances include allocated allowances and allowances auctioned during the same year.
(8) LULUCF sector and emissions from international bunkers excluded. Due to independent rounding the sums may not necessarily add up.
(6) Constant scope: includes only those installations with verified emissions available for 2008, 2009, 2010 and 2011.
(1) Total greenhouse gas emissions (GHG), GHG per capita, GHG per GDP and shares of GHG do not include emissions and removals from LULUCF (carbon sinks) and emissions from international bunkers.
(3) International bunkers: international aviation and international maritime transport.
(4) Gross domestic product (GDP) in 2005 market prices - not suitable for a ranking or quantitative comparison between countries for the same year. GDP information for the year 1990 is not available for some countries. For this reason, the 'GHG per GDP' values presented in the '1990' column correspond to the following years: 1991 (EU-15, Bulgaria, Germany, Hungary and Malta), 1992 (Slovakia), 1993 (EU-27 and Estonia) and 1995 (Croatia). Source GDP: Annual macro-economic database (AMECO), European Commission, 2012.
(2) Based on national estimate of 2011 emissions.
GHG trends and projections in Austria
17.5 %
32.0 % 26.5 %
12.6 %
8.8 % 2.1 % 0.4 % Energy supply
Energy use (excluding transport)
Transport
Industrial processes
Agriculture
Waste
Other
85.5 %
6.6 % 6.1 % 1.9 %
CO2
CH4
N2O
F-gases
0%
10%
20%
30%
40%
50%
60%
70%
80%
2004 2006 2008 2010 2012 2014 2016 2018 2020
Share of renewable energy in gross final consumptionShare of renewable energy in final consumption of energy in transportShare of renewable energy in final electricity consumptionShare of renewable energy in final consumption of energy for heating and coolingRenewable energy target (gross final energy consumption)Renewable energy target (transport)
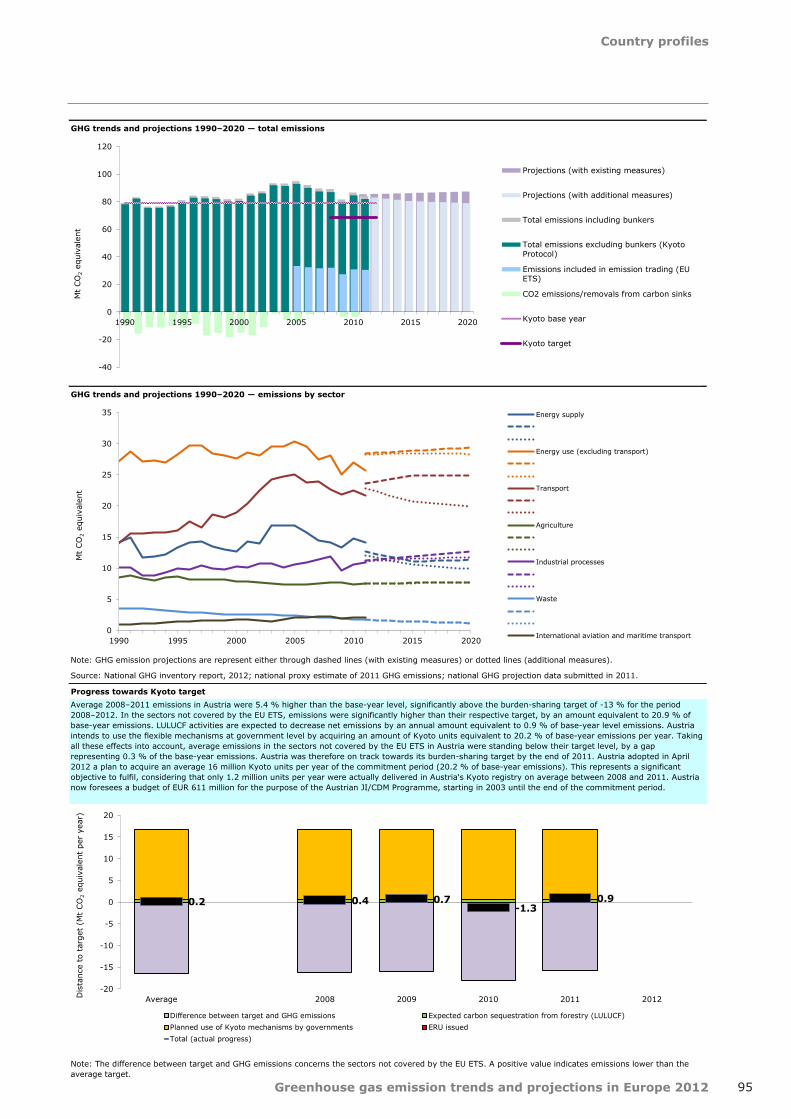
Country profiles
95Greenhouse gas emission trends and projections in Europe 2012
GHG trends and projections 1990–2020 — total emissions
GHG trends and projections 1990–2020 — emissions by sector
Progress towards Kyoto target
Note: The difference between target and GHG emissions concerns the sectors not covered by the EU ETS. A positive value indicates emissions lower than the average target.
Average 2008–2011 emissions in Austria were 5.4 % higher than the base-year level, significantly above the burden-sharing target of -13 % for the period 2008–2012. In the sectors not covered by the EU ETS, emissions were significantly higher than their respective target, by an amount equivalent to 20.9 % of base-year emissions. LULUCF activities are expected to decrease net emissions by an annual amount equivalent to 0.9 % of base-year level emissions. Austria intends to use the flexible mechanisms at government level by acquiring an amount of Kyoto units equivalent to 20.2 % of base-year emissions per year. Taking all these effects into account, average emissions in the sectors not covered by the EU ETS in Austria were standing below their target level, by a gap representing 0.3 % of the base-year emissions. Austria was therefore on track towards its burden-sharing target by the end of 2011. Austria adopted in April 2012 a plan to acquire an average 16 million Kyoto units per year of the commitment period (20.2 % of base-year emissions). This represents a significant objective to fulfil, considering that only 1.2 million units per year were actually delivered in Austria's Kyoto registry on average between 2008 and 2011. Austria now foresees a budget of EUR 611 million for the purpose of the Austrian JI/CDM Programme, starting in 2003 until the end of the commitment period.
Note: GHG emission projections are represent either through dashed lines (with existing measures) or dotted lines (additional measures).
Source: National GHG inventory report, 2012; national proxy estimate of 2011 GHG emissions; national GHG projection data submitted in 2011.
-40
-20
0
20
40
60
80
100
120
1990 1995 2000 2005 2010 2015 2020
Mt
CO
2 eq
uiva
lent
Projections (with existing measures)
Projections (with additional measures)
Total emissions including bunkers
Total emissions excluding bunkers (KyotoProtocol)
Emissions included in emission trading (EUETS)
CO2 emissions/removals from carbon sinks
Kyoto base year
Kyoto target
0
5
10
15
20
25
30
35
1990 1995 2000 2005 2010 2015 2020
Mt
CO
2 eq
uiva
lent
Energy supply
Energy use (excluding transport)
Transport
Agriculture
Industrial processes
Waste
International aviation and maritime transport
0.2 0.4 0.7 -1.3
0.9
-20
-15
-10
-5
0
5
10
15
20
Average 2008 2009 2010 2011 2012Dis
tanc
e to
tar
get
(Mt
CO
2 eq
uiva
lent
per
yea
r)
Difference between target and GHG emissions Expected carbon sequestration from forestry (LULUCF)Planned use of Kyoto mechanisms by governments ERU issuedTotal (actual progress)
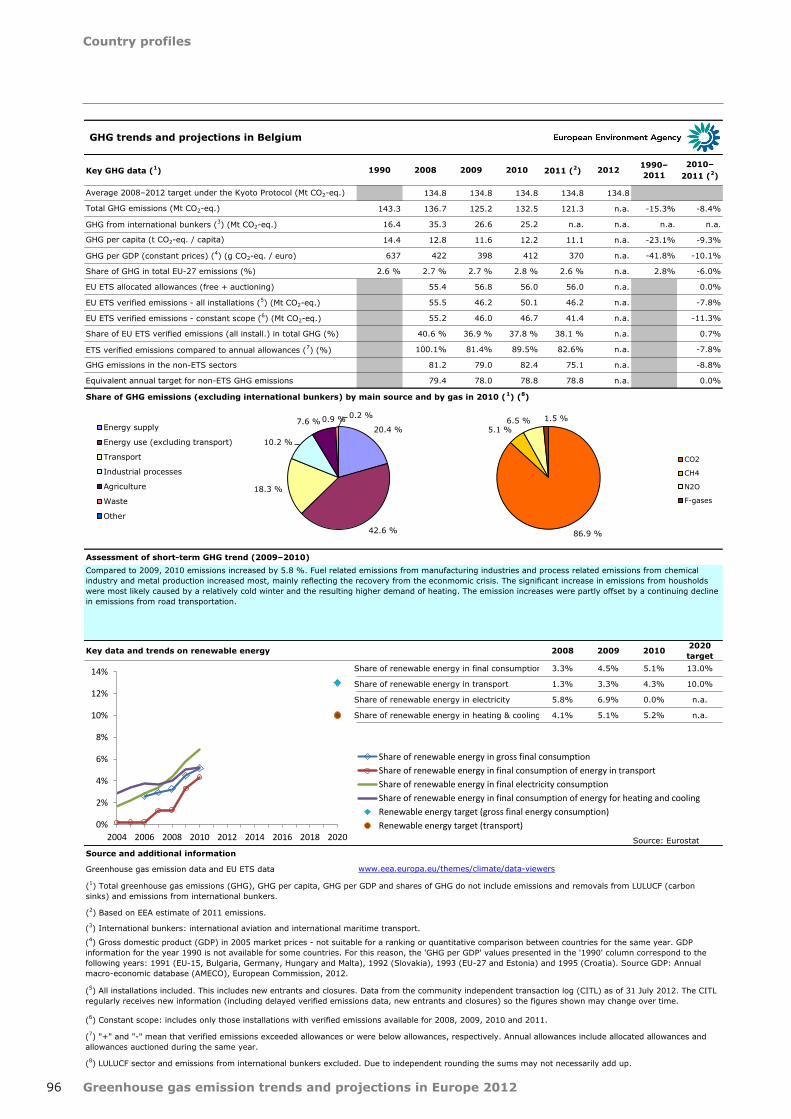
Country profiles
96 Greenhouse gas emission trends and projections in Europe 2012
Key GHG data (1) 1990 2008 2009 2010 2011 (2) 2012 1990–2011
2010–2011 (2)
Average 2008–2012 target under the Kyoto Protocol (Mt CO2-eq.) 134.8 134.8 134.8 134.8 134.8
Total GHG emissions (Mt CO2-eq.) 143.3 136.7 125.2 132.5 121.3 n.a. -15.3% -8.4%
GHG from international bunkers (3) (Mt CO2-eq.) 16.4 35.3 26.6 25.2 n.a. n.a. n.a. n.a.
GHG per capita (t CO2-eq. / capita) 14.4 12.8 11.6 12.2 11.1 n.a. -23.1% -9.3%
GHG per GDP (constant prices) (4) (g CO2-eq. / euro) 637 422 398 412 370 n.a. -41.8% -10.1%
Share of GHG in total EU-27 emissions (%) 2.6 % 2.7 % 2.7 % 2.8 % 2.6 % n.a. 2.8% -6.0%
EU ETS allocated allowances (free + auctioning) 55.4 56.8 56.0 56.0 n.a. 0.0%
EU ETS verified emissions - all installations (5) (Mt CO2-eq.) 55.5 46.2 50.1 46.2 n.a. -7.8%
EU ETS verified emissions - constant scope (6) (Mt CO2-eq.) 55.2 46.0 46.7 41.4 n.a. -11.3%
Share of EU ETS verified emissions (all install.) in total GHG (%) 40.6 % 36.9 % 37.8 % 38.1 % n.a. 0.7%
ETS verified emissions compared to annual allowances (7) (%) 100.1% 81.4% 89.5% 82.6% n.a. -7.8%
GHG emissions in the non-ETS sectors 81.2 79.0 82.4 75.1 n.a. -8.8%
Equivalent annual target for non-ETS GHG emissions 79.4 78.0 78.8 78.8 n.a. 0.0%
Share of GHG emissions (excluding international bunkers) by main source and by gas in 2010 (1) (8)
Assessment of short-term GHG trend (2009–2010)
Key data and trends on renewable energy 2008 2009 2010 2020 target
Share of renewable energy in final consumption 3.3% 4.5% 5.1% 13.0%
Share of renewable energy in transport 1.3% 3.3% 4.3% 10.0%
Share of renewable energy in electricity 5.8% 6.9% 0.0% n.a.
Share of renewable energy in heating & cooling 4.1% 5.1% 5.2% n.a.
Source: EurostatSource and additional information
Greenhouse gas emission data and EU ETS data
Compared to 2009, 2010 emissions increased by 5.8 %. Fuel related emissions from manufacturing industries and process related emissions from chemical industry and metal production increased most, mainly reflecting the recovery from the econmomic crisis. The significant increase in emissions from housholds were most likely caused by a relatively cold winter and the resulting higher demand of heating. The emission increases were partly offset by a continuing decline in emissions from road transportation.
www.eea.europa.eu/themes/climate/data-viewers
(5) All installations included. This includes new entrants and closures. Data from the community independent transaction log (CITL) as of 31 July 2012. The CITL regularly receives new information (including delayed verified emissions data, new entrants and closures) so the figures shown may change over time.
(7) "+" and "-" mean that verified emissions exceeded allowances or were below allowances, respectively. Annual allowances include allocated allowances and allowances auctioned during the same year.
(8) LULUCF sector and emissions from international bunkers excluded. Due to independent rounding the sums may not necessarily add up.
(6) Constant scope: includes only those installations with verified emissions available for 2008, 2009, 2010 and 2011.
(1) Total greenhouse gas emissions (GHG), GHG per capita, GHG per GDP and shares of GHG do not include emissions and removals from LULUCF (carbon sinks) and emissions from international bunkers.
(3) International bunkers: international aviation and international maritime transport.
(4) Gross domestic product (GDP) in 2005 market prices - not suitable for a ranking or quantitative comparison between countries for the same year. GDP information for the year 1990 is not available for some countries. For this reason, the 'GHG per GDP' values presented in the '1990' column correspond to the following years: 1991 (EU-15, Bulgaria, Germany, Hungary and Malta), 1992 (Slovakia), 1993 (EU-27 and Estonia) and 1995 (Croatia). Source GDP: Annual macro-economic database (AMECO), European Commission, 2012.
(2) Based on EEA estimate of 2011 emissions.
GHG trends and projections in Belgium
20.4 %
42.6 %
18.3 %
10.2 %
7.6 % 0.9 % 0.2 % Energy supply
Energy use (excluding transport)
Transport
Industrial processes
Agriculture
Waste
Other
86.9 %
5.1 % 6.5 % 1.5 %
CO2
CH4
N2O
F-gases
0%
2%
4%
6%
8%
10%
12%
14%
2004 2006 2008 2010 2012 2014 2016 2018 2020
Share of renewable energy in gross final consumptionShare of renewable energy in final consumption of energy in transportShare of renewable energy in final electricity consumptionShare of renewable energy in final consumption of energy for heating and coolingRenewable energy target (gross final energy consumption)Renewable energy target (transport)
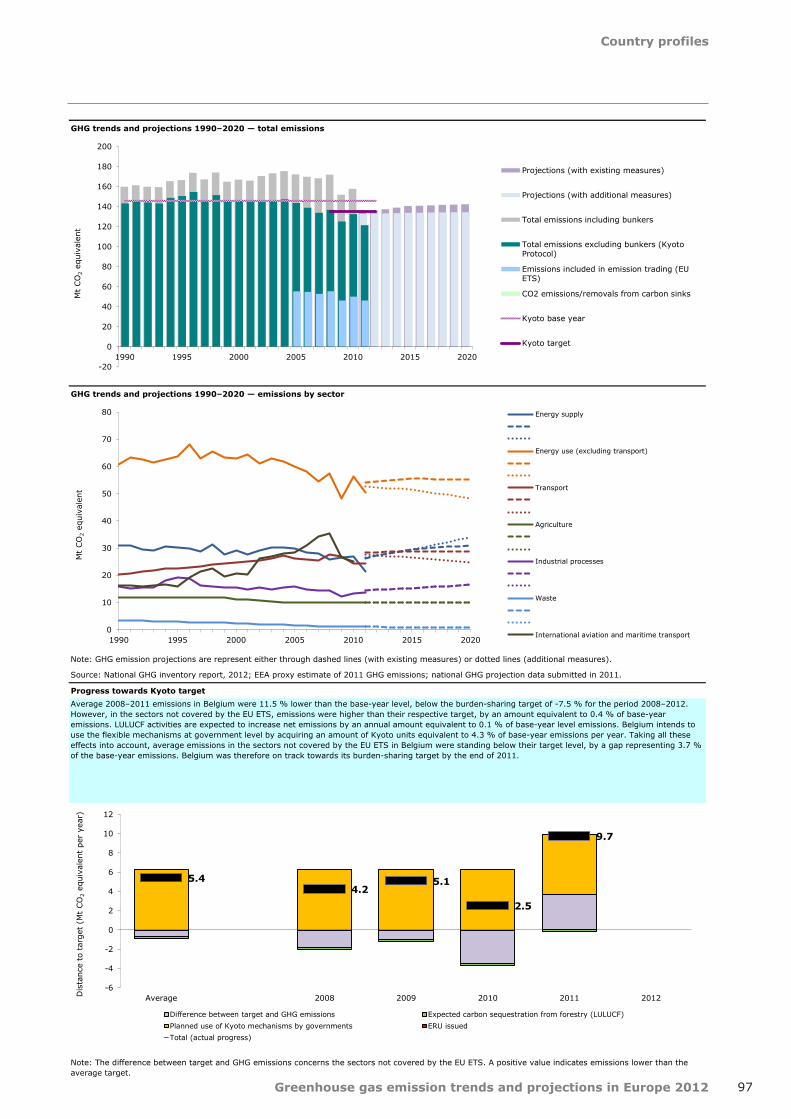
Country profiles
97Greenhouse gas emission trends and projections in Europe 2012
GHG trends and projections 1990–2020 — total emissions
GHG trends and projections 1990–2020 — emissions by sector
Progress towards Kyoto target
Note: The difference between target and GHG emissions concerns the sectors not covered by the EU ETS. A positive value indicates emissions lower than the average target.
Average 2008–2011 emissions in Belgium were 11.5 % lower than the base-year level, below the burden-sharing target of -7.5 % for the period 2008–2012. However, in the sectors not covered by the EU ETS, emissions were higher than their respective target, by an amount equivalent to 0.4 % of base-year emissions. LULUCF activities are expected to increase net emissions by an annual amount equivalent to 0.1 % of base-year level emissions. Belgium intends to use the flexible mechanisms at government level by acquiring an amount of Kyoto units equivalent to 4.3 % of base-year emissions per year. Taking all these effects into account, average emissions in the sectors not covered by the EU ETS in Belgium were standing below their target level, by a gap representing 3.7 % of the base-year emissions. Belgium was therefore on track towards its burden-sharing target by the end of 2011.
Note: GHG emission projections are represent either through dashed lines (with existing measures) or dotted lines (additional measures).
Source: National GHG inventory report, 2012; EEA proxy estimate of 2011 GHG emissions; national GHG projection data submitted in 2011.
-20
0
20
40
60
80
100
120
140
160
180
200
1990 1995 2000 2005 2010 2015 2020
Mt
CO
2 eq
uiva
lent
Projections (with existing measures)
Projections (with additional measures)
Total emissions including bunkers
Total emissions excluding bunkers (KyotoProtocol)
Emissions included in emission trading (EUETS)
CO2 emissions/removals from carbon sinks
Kyoto base year
Kyoto target
0
10
20
30
40
50
60
70
80
1990 1995 2000 2005 2010 2015 2020
Mt
CO
2 eq
uiva
lent
Energy supply
Energy use (excluding transport)
Transport
Agriculture
Industrial processes
Waste
International aviation and maritime transport
5.4 4.2
5.1
2.5
9.7
-6
-4
-2
0
2
4
6
8
10
12
Average 2008 2009 2010 2011 2012Dis
tanc
e to
tar
get
(Mt
CO
2 eq
uiva
lent
per
yea
r)
Difference between target and GHG emissions Expected carbon sequestration from forestry (LULUCF)Planned use of Kyoto mechanisms by governments ERU issuedTotal (actual progress)
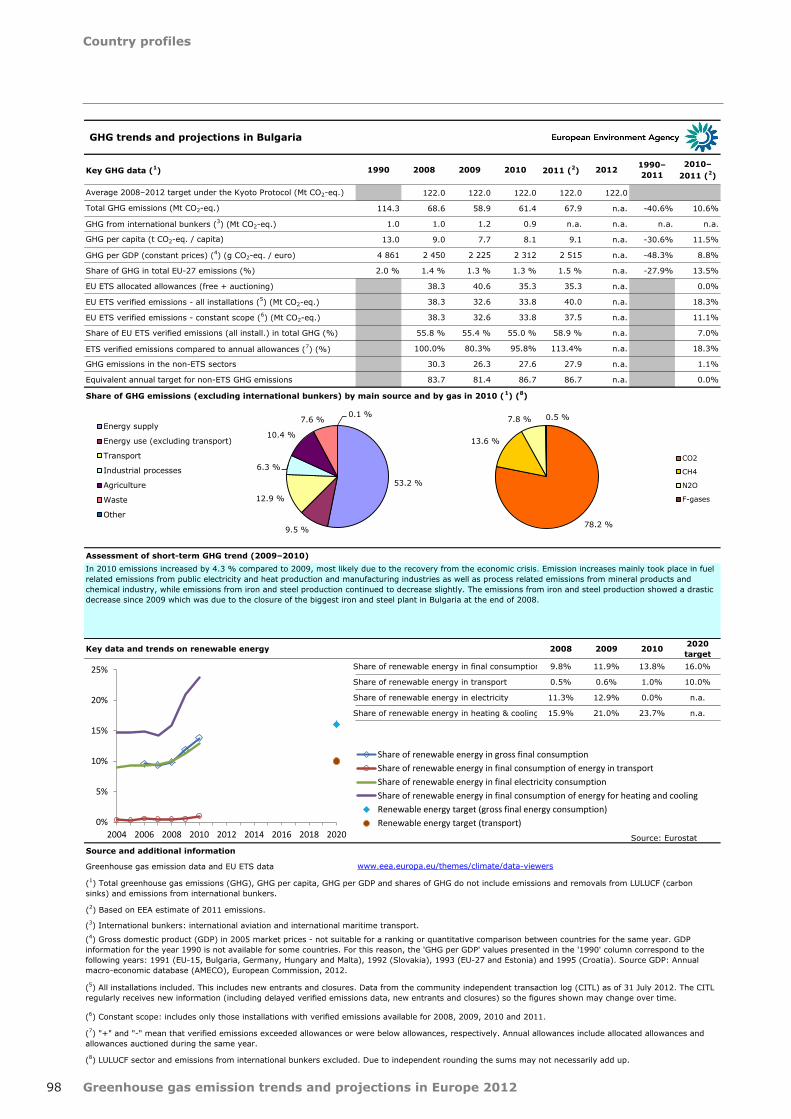
Country profiles
98 Greenhouse gas emission trends and projections in Europe 2012
Key GHG data (1) 1990 2008 2009 2010 2011 (2) 2012 1990–2011
2010–2011 (2)
Average 2008–2012 target under the Kyoto Protocol (Mt CO2-eq.) 122.0 122.0 122.0 122.0 122.0
Total GHG emissions (Mt CO2-eq.) 114.3 68.6 58.9 61.4 67.9 n.a. -40.6% 10.6%
GHG from international bunkers (3) (Mt CO2-eq.) 1.0 1.0 1.2 0.9 n.a. n.a. n.a. n.a.
GHG per capita (t CO2-eq. / capita) 13.0 9.0 7.7 8.1 9.1 n.a. -30.6% 11.5%
GHG per GDP (constant prices) (4) (g CO2-eq. / euro) 4 861 2 450 2 225 2 312 2 515 n.a. -48.3% 8.8%
Share of GHG in total EU-27 emissions (%) 2.0 % 1.4 % 1.3 % 1.3 % 1.5 % n.a. -27.9% 13.5%
EU ETS allocated allowances (free + auctioning) 38.3 40.6 35.3 35.3 n.a. 0.0%
EU ETS verified emissions - all installations (5) (Mt CO2-eq.) 38.3 32.6 33.8 40.0 n.a. 18.3%
EU ETS verified emissions - constant scope (6) (Mt CO2-eq.) 38.3 32.6 33.8 37.5 n.a. 11.1%
Share of EU ETS verified emissions (all install.) in total GHG (%) 55.8 % 55.4 % 55.0 % 58.9 % n.a. 7.0%
ETS verified emissions compared to annual allowances (7) (%) 100.0% 80.3% 95.8% 113.4% n.a. 18.3%
GHG emissions in the non-ETS sectors 30.3 26.3 27.6 27.9 n.a. 1.1%
Equivalent annual target for non-ETS GHG emissions 83.7 81.4 86.7 86.7 n.a. 0.0%
Share of GHG emissions (excluding international bunkers) by main source and by gas in 2010 (1) (8)
Assessment of short-term GHG trend (2009–2010)
Key data and trends on renewable energy 2008 2009 2010 2020 target
Share of renewable energy in final consumption 9.8% 11.9% 13.8% 16.0%
Share of renewable energy in transport 0.5% 0.6% 1.0% 10.0%
Share of renewable energy in electricity 11.3% 12.9% 0.0% n.a.
Share of renewable energy in heating & cooling 15.9% 21.0% 23.7% n.a.
Source: EurostatSource and additional information
Greenhouse gas emission data and EU ETS data
In 2010 emissions increased by 4.3 % compared to 2009, most likely due to the recovery from the economic crisis. Emission increases mainly took place in fuel related emissions from public electricity and heat production and manufacturing industries as well as process related emissions from mineral products and chemical industry, while emissions from iron and steel production continued to decrease slightly. The emissions from iron and steel production showed a drastic decrease since 2009 which was due to the closure of the biggest iron and steel plant in Bulgaria at the end of 2008.
www.eea.europa.eu/themes/climate/data-viewers
(5) All installations included. This includes new entrants and closures. Data from the community independent transaction log (CITL) as of 31 July 2012. The CITL regularly receives new information (including delayed verified emissions data, new entrants and closures) so the figures shown may change over time.
(7) "+" and "-" mean that verified emissions exceeded allowances or were below allowances, respectively. Annual allowances include allocated allowances and allowances auctioned during the same year.
(8) LULUCF sector and emissions from international bunkers excluded. Due to independent rounding the sums may not necessarily add up.
(6) Constant scope: includes only those installations with verified emissions available for 2008, 2009, 2010 and 2011.
(1) Total greenhouse gas emissions (GHG), GHG per capita, GHG per GDP and shares of GHG do not include emissions and removals from LULUCF (carbon sinks) and emissions from international bunkers.
(3) International bunkers: international aviation and international maritime transport.
(4) Gross domestic product (GDP) in 2005 market prices - not suitable for a ranking or quantitative comparison between countries for the same year. GDP information for the year 1990 is not available for some countries. For this reason, the 'GHG per GDP' values presented in the '1990' column correspond to the following years: 1991 (EU-15, Bulgaria, Germany, Hungary and Malta), 1992 (Slovakia), 1993 (EU-27 and Estonia) and 1995 (Croatia). Source GDP: Annual macro-economic database (AMECO), European Commission, 2012.
(2) Based on EEA estimate of 2011 emissions.
GHG trends and projections in Bulgaria
53.2 %
9.5 %
12.9 %
6.3 %
10.4 %
7.6 % 0.1 %
Energy supply
Energy use (excluding transport)
Transport
Industrial processes
Agriculture
Waste
Other78.2 %
13.6 %
7.8 % 0.5 %
CO2
CH4
N2O
F-gases
0%
5%
10%
15%
20%
25%
2004 2006 2008 2010 2012 2014 2016 2018 2020
Share of renewable energy in gross final consumptionShare of renewable energy in final consumption of energy in transportShare of renewable energy in final electricity consumptionShare of renewable energy in final consumption of energy for heating and coolingRenewable energy target (gross final energy consumption)Renewable energy target (transport)
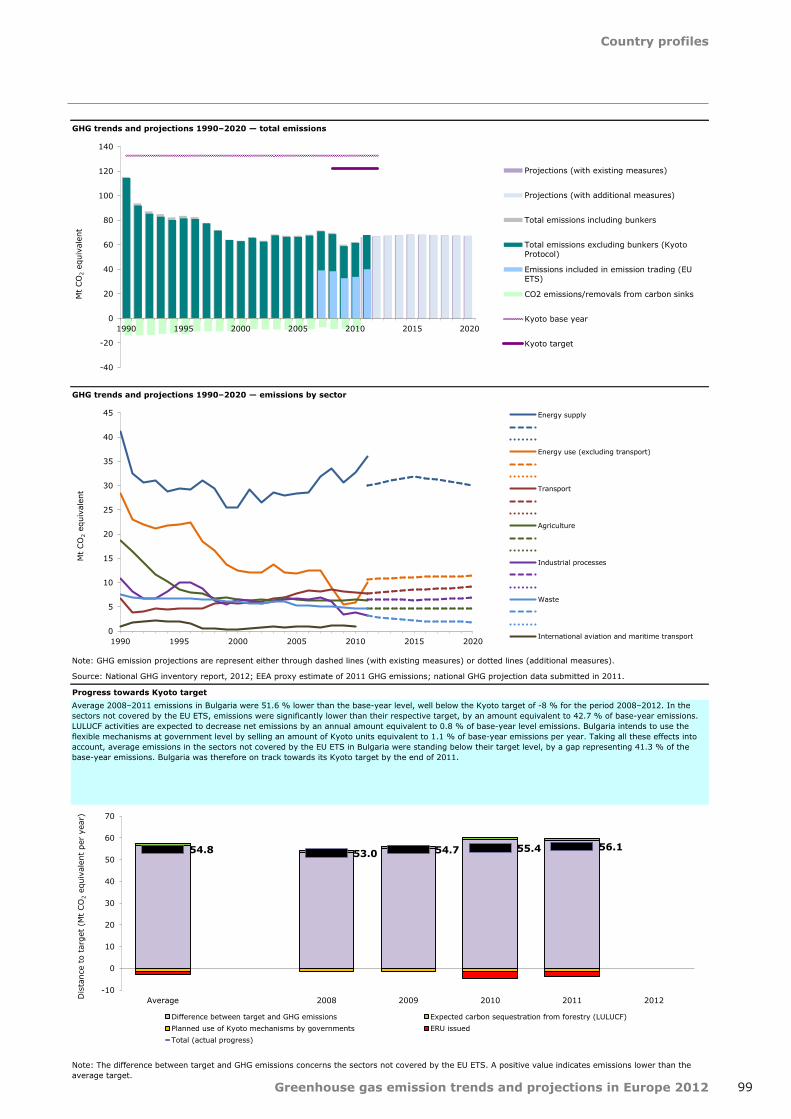
Country profiles
99Greenhouse gas emission trends and projections in Europe 2012
GHG trends and projections 1990–2020 — total emissions
GHG trends and projections 1990–2020 — emissions by sector
Progress towards Kyoto target
Note: The difference between target and GHG emissions concerns the sectors not covered by the EU ETS. A positive value indicates emissions lower than the average target.
Average 2008–2011 emissions in Bulgaria were 51.6 % lower than the base-year level, well below the Kyoto target of -8 % for the period 2008–2012. In the sectors not covered by the EU ETS, emissions were significantly lower than their respective target, by an amount equivalent to 42.7 % of base-year emissions. LULUCF activities are expected to decrease net emissions by an annual amount equivalent to 0.8 % of base-year level emissions. Bulgaria intends to use the flexible mechanisms at government level by selling an amount of Kyoto units equivalent to 1.1 % of base-year emissions per year. Taking all these effects into account, average emissions in the sectors not covered by the EU ETS in Bulgaria were standing below their target level, by a gap representing 41.3 % of the base-year emissions. Bulgaria was therefore on track towards its Kyoto target by the end of 2011.
Note: GHG emission projections are represent either through dashed lines (with existing measures) or dotted lines (additional measures).
Source: National GHG inventory report, 2012; EEA proxy estimate of 2011 GHG emissions; national GHG projection data submitted in 2011.
-40
-20
0
20
40
60
80
100
120
140
1990 1995 2000 2005 2010 2015 2020
Mt
CO
2 eq
uiva
lent
Projections (with existing measures)
Projections (with additional measures)
Total emissions including bunkers
Total emissions excluding bunkers (KyotoProtocol)
Emissions included in emission trading (EUETS)
CO2 emissions/removals from carbon sinks
Kyoto base year
Kyoto target
0
5
10
15
20
25
30
35
40
45
1990 1995 2000 2005 2010 2015 2020
Mt
CO
2 eq
uiva
lent
Energy supply
Energy use (excluding transport)
Transport
Agriculture
Industrial processes
Waste
International aviation and maritime transport
54.8 53.0 54.7 55.4 56.1
-10
0
10
20
30
40
50
60
70
Average 2008 2009 2010 2011 2012Dis
tanc
e to
tar
get
(Mt
CO
2 eq
uiva
lent
per
yea
r)
Difference between target and GHG emissions Expected carbon sequestration from forestry (LULUCF)Planned use of Kyoto mechanisms by governments ERU issuedTotal (actual progress)

Country profiles
100 Greenhouse gas emission trends and projections in Europe 2012
Key GHG data (1) 1990 2008 2009 2010 2011 (2) 2012 1990–2011
2010–2011 (2)
Average 2008–2012 target under the Kyoto Protocol (Mt CO2-eq.) 29.8 29.8 29.8 29.8 29.8
Total GHG emissions (Mt CO2-eq.) 31.5 31.0 29.1 28.6 n.a. n.a. n.a. n.a.
GHG from international bunkers (3) (Mt CO2-eq.) 0.5 0.3 0.3 0.3 n.a. n.a. n.a. n.a.
GHG per capita (t CO2-eq. / capita) 6.6 7.0 6.6 6.5 n.a. n.a. n.a. n.a.
GHG per GDP (constant prices) (4) (g CO2-eq. / euro) 940 765 762 759 n.a. n.a. n.a. n.a.
Share of GHG emissions (excluding international bunkers) by main source and by gas in 2010 (1) (8)
Assessment of short-term GHG trend (2009–2010)
Key data and trends on renewable energy 2008 2009 2010 2020 target
Share of renewable energy in final consumption 12.2% 13.2% 14.6% 20.0%
Share of renewable energy in transport 0.4% 0.4% 0.4% 10.0%
Share of renewable energy in electricity 33.5% 35.7% 0.0% n.a.
Share of renewable energy in heating & cooling 10.4% 11.6% 13.0% n.a.
Source: EurostatSource and additional information
Greenhouse gas emission data and EU ETS data
Croatia was among the countries with decreasing emissons between 2009 and 2010 (-1.6%). The total energy consumption in 2010 was 2.6 percent lower than in the previous year. This reduction is the results of decreased consumption of liquid fuels (14.9 percent) and imported electricity (11.8 percent). It is also due to increase in hydro power utilization (by 17.5 percent from the previous year) and larger consumption of fuel wood and other renewables. Due to decreasing of economic activity within 2009 and 2010, cement production was decreased by 23 and 26 percent, respectively. Whereas the ammonia production in 2010 was 17 percent higher in comparison to 2009 and nitric acid production was 29 percent higher as well in 2010 in comparison to 2009. The level of emissions from the latter sub‐sectors strongly depend on consumer’s demand for particular type of mineral fertilizer at the market.
www.eea.europa.eu/themes/climate/data-viewers
(8) LULUCF sector and emissions from international bunkers excluded. Due to independent rounding the sums may not necessarily add up.
(1) Total greenhouse gas emissions (GHG), GHG per capita, GHG per GDP and shares of GHG do not include emissions and removals from LULUCF (carbon sinks) and emissions from international bunkers.
(3) International bunkers: international aviation and international maritime transport.
(4) Gross domestic product (GDP) in 2005 market prices - not suitable for a ranking or quantitative comparison between countries for the same year. GDP information for the year 1990 is not available for some countries. For this reason, the 'GHG per GDP' values presented in the '1990' column correspond to the following years: 1991 (EU-15, Bulgaria, Germany, Hungary and Malta), 1992 (Slovakia), 1993 (EU-27 and Estonia) and 1995 (Croatia). Source GDP: Annual macro-economic database (AMECO), European Commission, 2012.
(2) Based on EEA estimate of 2011 emissions.
GHG trends and projections in Croatia
20.6 %
24.2 %
21.1 %
11.3 %
11.4 % 3.7 % 0.5 %
Energy supply
Energy use (excluding transport)
Transport
Industrial processes
Agriculture
Waste
Other 74.1 %
12.6 %
11.7 % 1.7 %
CO2
CH4
N2O
F-gases
0%
5%
10%
15%
20%
25%
30%
35%
40%
45%
2004 2006 2008 2010 2012 2014 2016 2018 2020
Share of renewable energy in gross final consumptionShare of renewable energy in final consumption of energy in transportShare of renewable energy in final electricity consumptionShare of renewable energy in final consumption of energy for heating and coolingRenewable energy target (gross final energy consumption)Renewable energy target (transport)

Country profiles
101Greenhouse gas emission trends and projections in Europe 2012
GHG trends and projections 1990–2020 — total emissions
GHG trends 1990–2010 - emissions by sector
Source: National GHG inventory report, 2012.
Progress towards Kyoto target
Note: A positive value indicates emissions lower than the average target.
Average 2008–2010 emissions in Croatia were 5.6 % lower than the base-year level, below the Kyoto target of -5 % for the period 2008–2012. LULUCF activities are expected to decrease net emissions by an annual amount equivalent to 2.8 % of base-year level emissions. Taking all these effects into account, average emissions Croatia were standing below their target level, by a gap representing 4.2 % of the base-year emissions. Croatia was therefore on track towards its Kyoto target by the end of 2010.
1.3
-0.4
1.6
2.0
-1.5
-1.0
-0.5
0.0
0.5
1.0
1.5
2.0
2.5
Average 2008 2009 2010 2011 2012
Dis
tanc
e to
tar
get
(Mt
CO
2 eq
uiva
lent
per
yea
r)
Difference between target and GHG emissions Expected carbon sequestration from forestry (LULUCF)Planned use of Kyoto mechanisms by governments ERU issuedTotal (actual progress)
-20
-10
0
10
20
30
40
50
1990 1995 2000 2005 2010 2015 2020
Mt
CO
2-eq
uiva
lent
Projections (with existing measures)
Projections (with additional measures)
Total emissions including bunkers
Total emissions excluding bunkers (KyotoProtocol)
CO2 emissions/removals from carbon sinks
Kyoto base year
Kyoto target
0
2
4
6
8
10
12
1990 1995 2000 2005 2010
Mt
CO
2 eq
uiva
lent
Energy supply
Energy use (excluding transport)
Transport
Agriculture
Industrial processes
Waste
International aviation and maritime transport

Country profiles
102 Greenhouse gas emission trends and projections in Europe 2012
Key GHG data (1) 1990 2008 2009 2010 2011 (2) 2012 1990–2011
2010–2011 (2)
Total GHG emissions (Mt CO2-eq.) 6.5 11.4 11.1 10.8 9.4 n.a. 46.1% -12.8%
GHG from international bunkers (3) (Mt CO2-eq.) 0.9 1.7 1.5 1.4 n.a. n.a. n.a. n.a.
GHG per capita (t CO2-eq. / capita) 11.3 14.5 13.9 13.5 11.7 n.a. 4.0% -13.0%
GHG per GDP (constant prices) (4) (g CO2-eq. / euro) 869 740 734 708 615 n.a. -29.3% -13.2%
Share of GHG in total EU-27 emissions (%) 0.1 % 0.2 % 0.2 % 0.2 % 0.2 % n.a. 77.3% -10.6%
EU ETS allocated allowances (free + auctioning) 4.8 5.1 5.4 5.4 n.a. 0.0%
EU ETS verified emissions - all installations (5) (Mt CO2-eq.) 5.6 5.3 5.0 4.6 n.a. -7.8%
Share of EU ETS verified emissions (all install.) in total GHG (%) 48.9 % 48.0 % 46.0 % 48.7 % n.a. 5.7%
ETS verified emissions compared to annual allowances (7) (%) 115.8% 104.8% 92.9% 85.6% n.a. -7.8%
Share of GHG emissions (excluding international bunkers) by main source and by gas in 2010 (1) (8)
Assessment of short-term GHG trend (2009–2010)
Key data and trends on renewable energy 2008 2009 2010 2020 target
Share of renewable energy in final consumption 4.1% 4.6% 4.8% 13.0%
Share of renewable energy in transport 1.9% 2.0% 2.0% 10.0%
Share of renewable energy in electricity 0.6% 1.4% 0.0% n.a.
Share of renewable energy in heating & cooling 12.7% 14.6% 16.3% n.a.
Source: EurostatSource and additional information
Greenhouse gas emission data and EU ETS data
Cyprus was among the few European countries with decreasing emissions in 2010 compared to 2009 (-2.4%). Emission decreases occurred in all major sectors with the exception of Agriculture. In the residential sector the emission reduction was propably due to the positive effect of the more favourable weather conditions in 2010.
www.eea.europa.eu/themes/climate/data-viewers
(5) All installations included. This includes new entrants and closures. Data from the community independent transaction log (CITL) as of 31 July 2012. The CITL regularly receives new information (including delayed verified emissions data, new entrants and closures) so the figures shown may change over time.
(7) "+" and "-" mean that verified emissions exceeded allowances or were below allowances, respectively. Annual allowances include allocated allowances and allowances auctioned during the same year.
(8) LULUCF sector and emissions from international bunkers excluded. Due to independent rounding the sums may not necessarily add up.
(1) Total greenhouse gas emissions (GHG), GHG per capita, GHG per GDP and shares of GHG do not include emissions and removals from LULUCF (carbon sinks) and emissions from international bunkers.
(3) International bunkers: international aviation and international maritime transport.
(4) Gross domestic product (GDP) in 2005 market prices - not suitable for a ranking or quantitative comparison between countries for the same year. GDP information for the year 1990 is not available for some countries. For this reason, the 'GHG per GDP' values presented in the '1990' column correspond to the following years: 1991 (EU-15, Bulgaria, Germany, Hungary and Malta), 1992 (Slovakia), 1993 (EU-27 and Estonia) and 1995 (Croatia). Source GDP: Annual macro-economic database (AMECO), European Commission, 2012.
(2) Based on EEA estimate of 2011 emissions.
GHG trends and projections in Cyprus
35.8 %
12.1 % 21.3 %
7.4 %
6.2 %
17.1 % 0.0 %
Energy supply
Energy use (excluding transport)
Transport
Industrial processes
Agriculture
Waste
Other 74.3 %
19.9 %
3.7 % 2.1 %
CO2
CH4
N2O
F-gases
0%
2%
4%
6%
8%
10%
12%
14%
16%
18%
2004 2006 2008 2010 2012 2014 2016 2018 2020
Share of renewable energy in gross final consumptionShare of renewable energy in final consumption of energy in transportShare of renewable energy in final electricity consumptionShare of renewable energy in final consumption of energy for heating and coolingRenewable energy target (gross final energy consumption)Renewable energy target (transport)
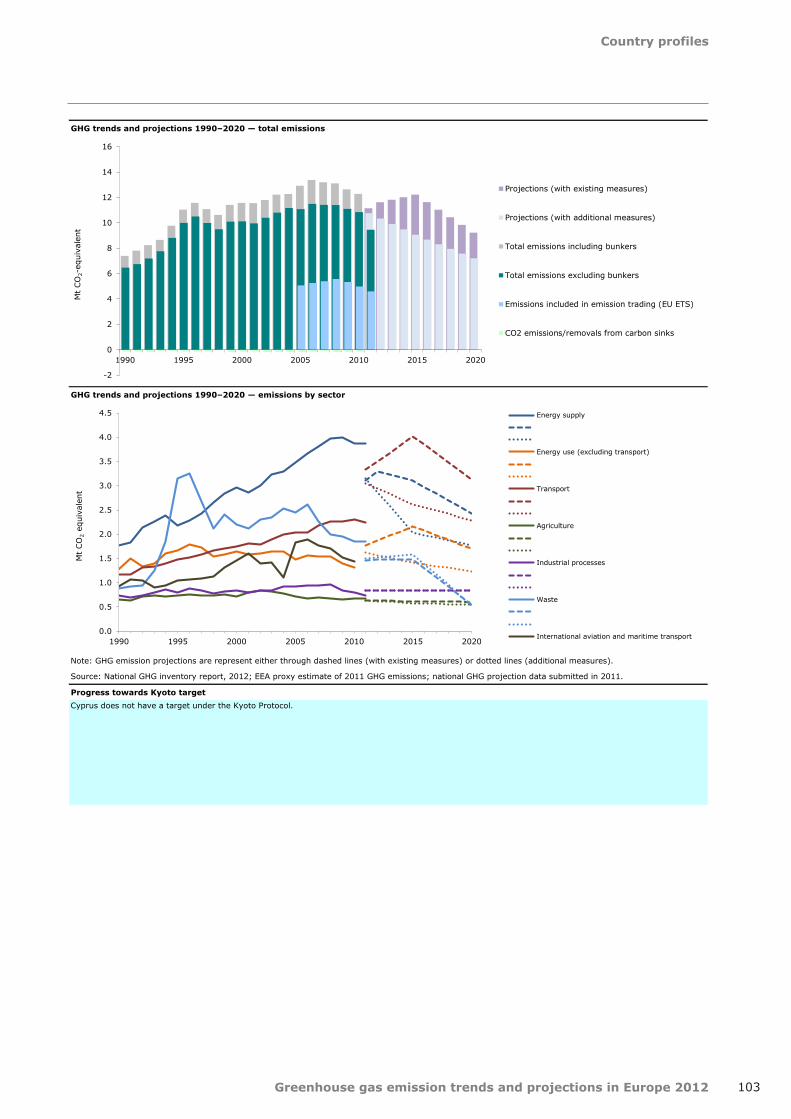
Country profiles
103Greenhouse gas emission trends and projections in Europe 2012
GHG trends and projections 1990–2020 — total emissions
GHG trends and projections 1990–2020 — emissions by sector
Progress towards Kyoto targetCyprus does not have a target under the Kyoto Protocol.
Note: GHG emission projections are represent either through dashed lines (with existing measures) or dotted lines (additional measures).
Source: National GHG inventory report, 2012; EEA proxy estimate of 2011 GHG emissions; national GHG projection data submitted in 2011.
-2
0
2
4
6
8
10
12
14
16
1990 1995 2000 2005 2010 2015 2020
Mt
CO
2-eq
uiva
lent
Projections (with existing measures)
Projections (with additional measures)
Total emissions including bunkers
Total emissions excluding bunkers
Emissions included in emission trading (EU ETS)
CO2 emissions/removals from carbon sinks
0.0
0.5
1.0
1.5
2.0
2.5
3.0
3.5
4.0
4.5
1990 1995 2000 2005 2010 2015 2020
Mt
CO
2 eq
uiva
lent
Energy supply
Energy use (excluding transport)
Transport
Agriculture
Industrial processes
Waste
International aviation and maritime transport

Country profiles
104 Greenhouse gas emission trends and projections in Europe 2012
Key GHG data (1) 1990 2008 2009 2010 2011 (2) 2012 1990–2011
2010–2011 (2)
Average 2008–2012 target under the Kyoto Protocol (Mt CO2-eq.) 178.7 178.7 178.7 178.7 178.7
Total GHG emissions (Mt CO2-eq.) 195.8 143.7 134.7 139.2 141.1 n.a. -27.9% 1.4%
GHG from international bunkers (3) (Mt CO2-eq.) 0.6 1.2 1.1 1.0 n.a. n.a. n.a. n.a.
GHG per capita (t CO2-eq. / capita) 18.9 13.8 12.9 13.2 13.4 n.a. -29.1% 1.1%
GHG per GDP (constant prices) (4) (g CO2-eq. / euro) 2 387 1 177 1 158 1 164 1 161 n.a. -51.3% -0.3%
Share of GHG in total EU-27 emissions (%) 3.5 % 2.9 % 2.9 % 2.9 % 3.1 % n.a. -12.6% 4.0%
EU ETS allocated allowances (free + auctioning) 85.6 86.0 86.1 86.1 n.a. 0.0%
EU ETS verified emissions - all installations (5) (Mt CO2-eq.) 80.4 73.8 75.6 74.2 n.a. -1.8%
EU ETS verified emissions - constant scope (6) (Mt CO2-eq.) 80.3 73.7 73.7 71.8 n.a. -2.6%
Share of EU ETS verified emissions (all install.) in total GHG (%) 56.0 % 54.8 % 54.3 % 52.6 % n.a. -3.2%
ETS verified emissions compared to annual allowances (7) (%) 94.0% 85.8% 87.7% 86.1% n.a. -1.8%
GHG emissions in the non-ETS sectors 63.3 60.9 63.6 66.9 n.a. 5.2%
Equivalent annual target for non-ETS GHG emissions 93.1 92.7 92.6 92.6 n.a. 0.0%
Share of GHG emissions (excluding international bunkers) by main source and by gas in 2010 (1) (8)
Assessment of short-term GHG trend (2009–2010)
Key data and trends on renewable energy 2008 2009 2010 2020 target
Share of renewable energy in final consumption 7.6% 8.5% 9.2% 13.0%
Share of renewable energy in transport 2.2% 3.8% 4.6% 10.0%
Share of renewable energy in electricity 6.4% 7.5% 0.0% n.a.
Share of renewable energy in heating & cooling 11.2% 11.9% 12.0% n.a.
Source: EurostatSource and additional information
Greenhouse gas emission data and EU ETS data
In the Czech Republic emissions increased by 3.3% in 2010. Hereby fuel related emissions from public electricity and heat production, manufacturing industries and the residential sector and process related emission from manufacturing industries increased most. This trend was mainly caused by the recovery from the economic crisis in 2009 as well as a higher need for heat due to a colder winter.
www.eea.europa.eu/themes/climate/data-viewers
(5) All installations included. This includes new entrants and closures. Data from the community independent transaction log (CITL) as of 31 July 2012. The CITL regularly receives new information (including delayed verified emissions data, new entrants and closures) so the figures shown may change over time.
(7) "+" and "-" mean that verified emissions exceeded allowances or were below allowances, respectively. Annual allowances include allocated allowances and allowances auctioned during the same year.
(8) LULUCF sector and emissions from international bunkers excluded. Due to independent rounding the sums may not necessarily add up.
(6) Constant scope: includes only those installations with verified emissions available for 2008, 2009, 2010 and 2011.
(1) Total greenhouse gas emissions (GHG), GHG per capita, GHG per GDP and shares of GHG do not include emissions and removals from LULUCF (carbon sinks) and emissions from international bunkers.
(3) International bunkers: international aviation and international maritime transport.
(4) Gross domestic product (GDP) in 2005 market prices - not suitable for a ranking or quantitative comparison between countries for the same year. GDP information for the year 1990 is not available for some countries. For this reason, the 'GHG per GDP' values presented in the '1990' column correspond to the following years: 1991 (EU-15, Bulgaria, Germany, Hungary and Malta), 1992 (Slovakia), 1993 (EU-27 and Estonia) and 1995 (Croatia). Source GDP: Annual macro-economic database (AMECO), European Commission, 2012.
(2) Based on EEA estimate of 2011 emissions.
GHG trends and projections in the Czech Republic
43.5 %
26.8 %
12.5 %
8.7 %
5.6 % 2.6 % 0.4 % Energy supply
Energy use (excluding transport)
Transport
Industrial processes
Agriculture
Waste
Other
86.1 %
7.4 % 5.4 % 1.1 %
CO2
CH4
N2O
F-gases
0%
2%
4%
6%
8%
10%
12%
14%
2004 2006 2008 2010 2012 2014 2016 2018 2020
Share of renewable energy in gross final consumptionShare of renewable energy in final consumption of energy in transportShare of renewable energy in final electricity consumptionShare of renewable energy in final consumption of energy for heating and coolingRenewable energy target (gross final energy consumption)Renewable energy target (transport)

Country profiles
105Greenhouse gas emission trends and projections in Europe 2012
GHG trends and projections 1990–2020 — total emissions
GHG trends and projections 1990–2020 — emissions by sector
Progress towards Kyoto target
Note: The difference between target and GHG emissions concerns the sectors not covered by the EU ETS. A positive value indicates emissions lower than the average target.
Average 2008–2011 emissions in Czech Republic were 28.1 % lower than the base-year level, well below the Kyoto target of -8 % for the period 2008–2012. In the sectors not covered by the EU ETS, emissions were significantly lower than their respective target, by an amount equivalent to 15 % of base-year emissions. LULUCF activities are expected to decrease net emissions by an annual amount equivalent to 0.7 % of base-year level emissions. Czech Republic intends to use the flexible mechanisms at government level by selling an amount of Kyoto units equivalent to 12.9 % of base-year emissions per year. Taking all these effects into account, average emissions in the sectors not covered by the EU ETS in Czech Republic were standing below their target level, by a gap representing 2.4 % of the base-year emissions. The Czech Republic was therefore on track towards its Kyoto target by the end of 2011.
Note: GHG emission projections are represent either through dashed lines (with existing measures) or dotted lines (additional measures).
Source: National GHG inventory report, 2012; EEA proxy estimate of 2011 GHG emissions; national GHG projection data submitted in 2011.
-50
0
50
100
150
200
250
1990 1995 2000 2005 2010 2015 2020
Mt
CO
2 eq
uiva
lent
Projections (with existing measures)
Projections (with additional measures)
Total emissions including bunkers
Total emissions excluding bunkers (KyotoProtocol)
Emissions included in emission trading (EUETS)
CO2 emissions/removals from carbon sinks
Kyoto base year
Kyoto target
0
10
20
30
40
50
60
70
80
90
1990 1995 2000 2005 2010 2015 2020
Mt
CO
2 eq
uiva
lent
Energy supply
Energy use (excluding transport)
Transport
Agriculture
Industrial processes
Waste
International aviation and maritime transport
4.7 6.2 7.8 3.9
1.0
-30
-20
-10
0
10
20
30
40
Average 2008 2009 2010 2011 2012Dis
tanc
e to
tar
get
(Mt
CO
2 eq
uiva
lent
per
yea
r)
Difference between target and GHG emissions Expected carbon sequestration from forestry (LULUCF)Planned use of Kyoto mechanisms by governments ERU issuedTotal (actual progress)

Country profiles
106 Greenhouse gas emission trends and projections in Europe 2012
Key GHG data (1) 1990 2008 2009 2010 2011 (2) 2012 1990–2011
2010–2011 (2)
Average 2008–2012 target under the Kyoto Protocol (Mt CO2-eq.) 55.8 55.8 55.8 55.8 55.8
Total GHG emissions (Mt CO2-eq.) 68.6 63.6 60.7 61.1 56.1 n.a. -18.2% -8.1%
GHG from international bunkers (3) (Mt CO2-eq.) 4.8 5.5 3.9 4.6 n.a. n.a. n.a. n.a.
GHG per capita (t CO2-eq. / capita) 13.4 11.6 11.0 11.0 10.1 n.a. -24.5% -8.5%
GHG per GDP (constant prices) (4) (g CO2-eq. / euro) 455 294 298 296 270 n.a. -40.8% -9.0%
Share of GHG in total EU-27 emissions (%) 1.2 % 1.3 % 1.3 % 1.3 % 1.2 % n.a. -0.8% -5.7%
EU ETS allocated allowances (free + auctioning) 24.0 23.9 23.9 23.9 n.a. 0.0%
EU ETS verified emissions - all installations (5) (Mt CO2-eq.) 26.5 25.5 25.3 21.5 n.a. -15.0%
EU ETS verified emissions - constant scope (6) (Mt CO2-eq.) 26.5 25.4 25.3 21.5 n.a. -15.0%
Share of EU ETS verified emissions (all install.) in total GHG (%) 41.8 % 42.0 % 41.4 % 38.3 % n.a. -7.5%
ETS verified emissions compared to annual allowances (7) (%) 110.7% 106.5% 105.7% 89.8% n.a. -15.0%
GHG emissions in the non-ETS sectors 37.0 35.2 35.8 34.6 n.a. -3.2%
Equivalent annual target for non-ETS GHG emissions 31.8 31.9 31.9 31.9 n.a. 0.0%
Share of GHG emissions (excluding international bunkers) by main source and by gas in 2010 (1) (8)
Assessment of short-term GHG trend (2009–2010)
Key data and trends on renewable energy 2008 2009 2010 2020 target
Share of renewable energy in final consumption 18.8% 20.2% 22.2% 30.0%
Share of renewable energy in transport 0.2% 0.2% 0.3% 10.0%
Share of renewable energy in electricity 28.3% 32.9% 0.0% n.a.
Share of renewable energy in heating & cooling 29.0% 30.8% 31.9% n.a.
Source: EurostatSource and additional information
Greenhouse gas emission data and EU ETS data
In 2010 emission increased slightly compared to 2009. This increase was caused by increasing fuel related emissions from public electricity and heat. The main reason for this increase was the cold winter, which caused an increase in emissions from non-industrial combustion. Emissions from manufacturing industries however increased due to a slight increase in the activity level.
www.eea.europa.eu/themes/climate/data-viewers
(5) All installations included. This includes new entrants and closures. Data from the community independent transaction log (CITL) as of 31 July 2012. The CITL regularly receives new information (including delayed verified emissions data, new entrants and closures) so the figures shown may change over time.
(7) "+" and "-" mean that verified emissions exceeded allowances or were below allowances, respectively. Annual allowances include allocated allowances and allowances auctioned during the same year.
(8) LULUCF sector and emissions from international bunkers excluded. Due to independent rounding the sums may not necessarily add up.
(6) Constant scope: includes only those installations with verified emissions available for 2008, 2009, 2010 and 2011.
(1) Total greenhouse gas emissions (GHG), GHG per capita, GHG per GDP and shares of GHG do not include emissions and removals from LULUCF (carbon sinks) and emissions from international bunkers.
(3) International bunkers: international aviation and international maritime transport.
(4) Gross domestic product (GDP) in 2005 market prices - not suitable for a ranking or quantitative comparison between countries for the same year. GDP information for the year 1990 is not available for some countries. For this reason, the 'GHG per GDP' values presented in the '1990' column correspond to the following years: 1991 (EU-15, Bulgaria, Germany, Hungary and Malta), 1992 (Slovakia), 1993 (EU-27 and Estonia) and 1995 (Croatia). Source GDP: Annual macro-economic database (AMECO), European Commission, 2012.
(2) Based on national estimate of 2011 emissions.
GHG trends and projections in Denmark
39.9 %
18.3 %
21.7 %
2.8 %
15.6 % 1.6 % 0.1 %
Energy supply
Energy use (excluding transport)
Transport
Industrial processes
Agriculture
Waste
Other79.9 %
9.1 %
9.7 % 1.4 %
CO2
CH4
N2O
F-gases
0%
5%
10%
15%
20%
25%
30%
35%
2004 2006 2008 2010 2012 2014 2016 2018 2020
Share of renewable energy in gross final consumptionShare of renewable energy in final consumption of energy in transportShare of renewable energy in final electricity consumptionShare of renewable energy in final consumption of energy for heating and coolingRenewable energy target (gross final energy consumption)Renewable energy target (transport)
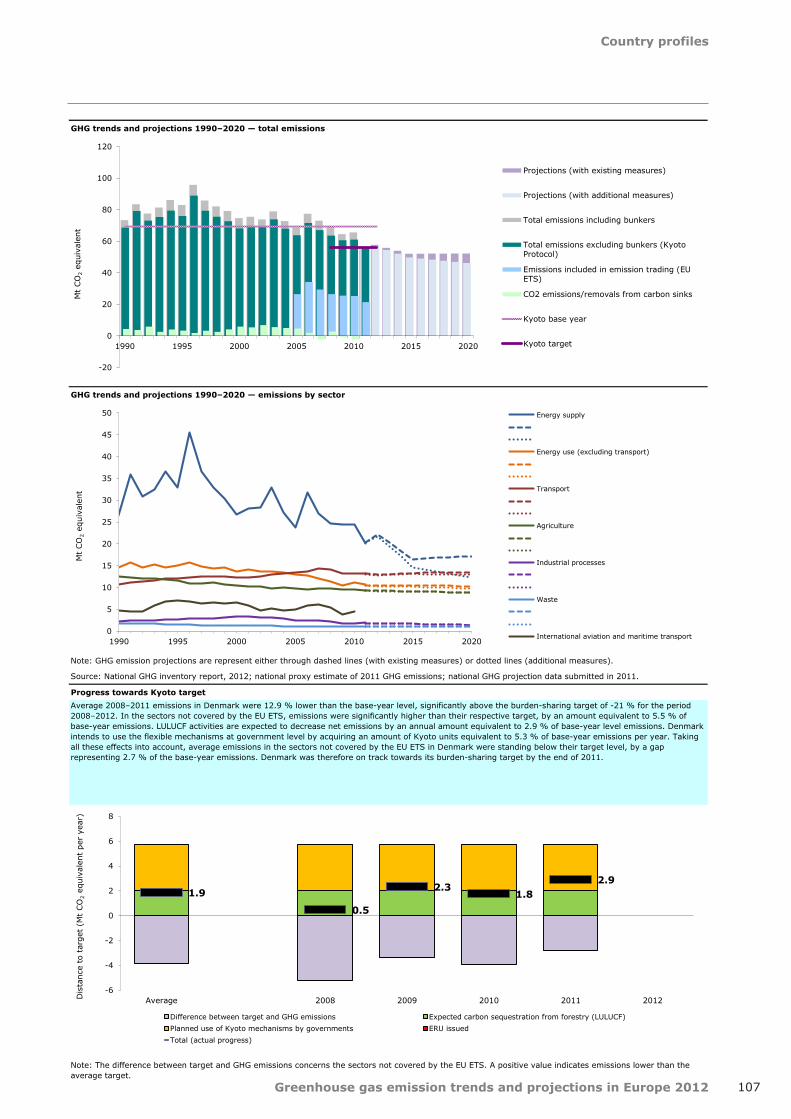
Country profiles
107Greenhouse gas emission trends and projections in Europe 2012
GHG trends and projections 1990–2020 — total emissions
GHG trends and projections 1990–2020 — emissions by sector
Progress towards Kyoto target
Note: The difference between target and GHG emissions concerns the sectors not covered by the EU ETS. A positive value indicates emissions lower than the average target.
Average 2008–2011 emissions in Denmark were 12.9 % lower than the base-year level, significantly above the burden-sharing target of -21 % for the period 2008–2012. In the sectors not covered by the EU ETS, emissions were significantly higher than their respective target, by an amount equivalent to 5.5 % of base-year emissions. LULUCF activities are expected to decrease net emissions by an annual amount equivalent to 2.9 % of base-year level emissions. Denmark intends to use the flexible mechanisms at government level by acquiring an amount of Kyoto units equivalent to 5.3 % of base-year emissions per year. Taking all these effects into account, average emissions in the sectors not covered by the EU ETS in Denmark were standing below their target level, by a gap representing 2.7 % of the base-year emissions. Denmark was therefore on track towards its burden-sharing target by the end of 2011.
Note: GHG emission projections are represent either through dashed lines (with existing measures) or dotted lines (additional measures).
Source: National GHG inventory report, 2012; national proxy estimate of 2011 GHG emissions; national GHG projection data submitted in 2011.
-20
0
20
40
60
80
100
120
1990 1995 2000 2005 2010 2015 2020
Mt
CO
2 eq
uiva
lent
Projections (with existing measures)
Projections (with additional measures)
Total emissions including bunkers
Total emissions excluding bunkers (KyotoProtocol)
Emissions included in emission trading (EUETS)
CO2 emissions/removals from carbon sinks
Kyoto base year
Kyoto target
0
5
10
15
20
25
30
35
40
45
50
1990 1995 2000 2005 2010 2015 2020
Mt
CO
2 eq
uiva
lent
Energy supply
Energy use (excluding transport)
Transport
Agriculture
Industrial processes
Waste
International aviation and maritime transport
1.9
0.5
2.3 1.8
2.9
-6
-4
-2
0
2
4
6
8
Average 2008 2009 2010 2011 2012Dis
tanc
e to
tar
get
(Mt
CO
2 eq
uiva
lent
per
yea
r)
Difference between target and GHG emissions Expected carbon sequestration from forestry (LULUCF)Planned use of Kyoto mechanisms by governments ERU issuedTotal (actual progress)

Country profiles
108 Greenhouse gas emission trends and projections in Europe 2012
Key GHG data (1) 1990 2008 2009 2010 2011 (2) 2012 1990–2011
2010–2011 (2)
Average 2008–2012 target under the Kyoto Protocol (Mt CO2-eq.) 39.2 39.2 39.2 39.2 39.2
Total GHG emissions (Mt CO2-eq.) 40.9 19.7 16.4 20.5 20.9 n.a. -48.9% 1.8%
GHG from international bunkers (3) (Mt CO2-eq.) 0.7 0.9 0.8 0.8 n.a. n.a. n.a. n.a.
GHG per capita (t CO2-eq. / capita) 26.0 14.7 12.2 15.3 15.6 n.a. -40.1% 1.8%
GHG per GDP (constant prices) (4) (g CO2-eq. / euro) 3 850 1 546 1 500 1 836 1 736 n.a. -54.9% -5.4%
Share of GHG in total EU-27 emissions (%) 0.7 % 0.4 % 0.4 % 0.4 % 0.5 % n.a. -38.0% 4.4%
EU ETS allocated allowances (free + auctioning) 11.7 11.9 11.9 11.9 n.a. 0.0%
EU ETS verified emissions - all installations (5) (Mt CO2-eq.) 13.5 10.4 14.5 14.8 n.a. 2.0%
EU ETS verified emissions - constant scope (6) (Mt CO2-eq.) 13.4 10.2 14.3 14.4 n.a. 1.2%
Share of EU ETS verified emissions (all install.) in total GHG (%) 68.7 % 63.3 % 70.7 % 70.9 % n.a. 0.2%
ETS verified emissions compared to annual allowances (7) (%) 115.9% 87.5% 122.4% 124.9% n.a. 2.0%
GHG emissions in the non-ETS sectors 6.2 6.0 6.0 6.1 n.a. 1.2%
Equivalent annual target for non-ETS GHG emissions 27.5 27.4 27.4 27.4 n.a. 0.0%
Share of GHG emissions (excluding international bunkers) by main source and by gas in 2010 (1) (8)
Assessment of short-term GHG trend (2009–2010)
Key data and trends on renewable energy 2008 2009 2010 2020 target
Share of renewable energy in final consumption 18.9% 23.0% 24.3% 25.0%
Share of renewable energy in transport 0.2% 0.2% 0.2% 10.0%
Share of renewable energy in electricity 6.1% 10.4% 0.0% n.a.
Share of renewable energy in heating & cooling 35.5% 41.8% 42.8% n.a.
Source: EurostatSource and additional information
Greenhouse gas emission data and EU ETS data
Between 2009 and 2010 Estonia showed the largest relative increase of emissions within the EU (+25.2%). Emissions mainly increased in public electricity and heat production. Domestic electricity production increased considerably (by almost 50 % compared to 2009) mainly due to lower electricity imports and higher electricity exports; most of the additional domestic electricity production was based on oil shale. To a much smaller extent, emissions also increased in oil shale production, cement production, road and rail transport, and households and services.
www.eea.europa.eu/themes/climate/data-viewers
(5) All installations included. This includes new entrants and closures. Data from the community independent transaction log (CITL) as of 31 July 2012. The CITL regularly receives new information (including delayed verified emissions data, new entrants and closures) so the figures shown may change over time.
(7) "+" and "-" mean that verified emissions exceeded allowances or were below allowances, respectively. Annual allowances include allocated allowances and allowances auctioned during the same year.
(8) LULUCF sector and emissions from international bunkers excluded. Due to independent rounding the sums may not necessarily add up.
(6) Constant scope: includes only those installations with verified emissions available for 2008, 2009, 2010 and 2011.
(1) Total greenhouse gas emissions (GHG), GHG per capita, GHG per GDP and shares of GHG do not include emissions and removals from LULUCF (carbon sinks) and emissions from international bunkers.
(3) International bunkers: international aviation and international maritime transport.
(4) Gross domestic product (GDP) in 2005 market prices - not suitable for a ranking or quantitative comparison between countries for the same year. GDP information for the year 1990 is not available for some countries. For this reason, the 'GHG per GDP' values presented in the '1990' column correspond to the following years: 1991 (EU-15, Bulgaria, Germany, Hungary and Malta), 1992 (Slovakia), 1993 (EU-27 and Estonia) and 1995 (Croatia). Source GDP: Annual macro-economic database (AMECO), European Commission, 2012.
(2) Based on EEA estimate of 2011 emissions.
GHG trends and projections in Estonia
71.8 %
5.8 %
11.0 %
2.4 % 6.6 % 2.3 % 0.1 %
Energy supply
Energy use (excluding transport)
Transport
Industrial processes
Agriculture
Waste
Other
88.8 %
5.1 % 5.3 % 0.8 %
CO2
CH4
N2O
F-gases
0%
5%
10%
15%
20%
25%
30%
35%
40%
45%
2004 2006 2008 2010 2012 2014 2016 2018 2020
Share of renewable energy in gross final consumptionShare of renewable energy in final consumption of energy in transportShare of renewable energy in final electricity consumptionShare of renewable energy in final consumption of energy for heating and coolingRenewable energy target (gross final energy consumption)Renewable energy target (transport)
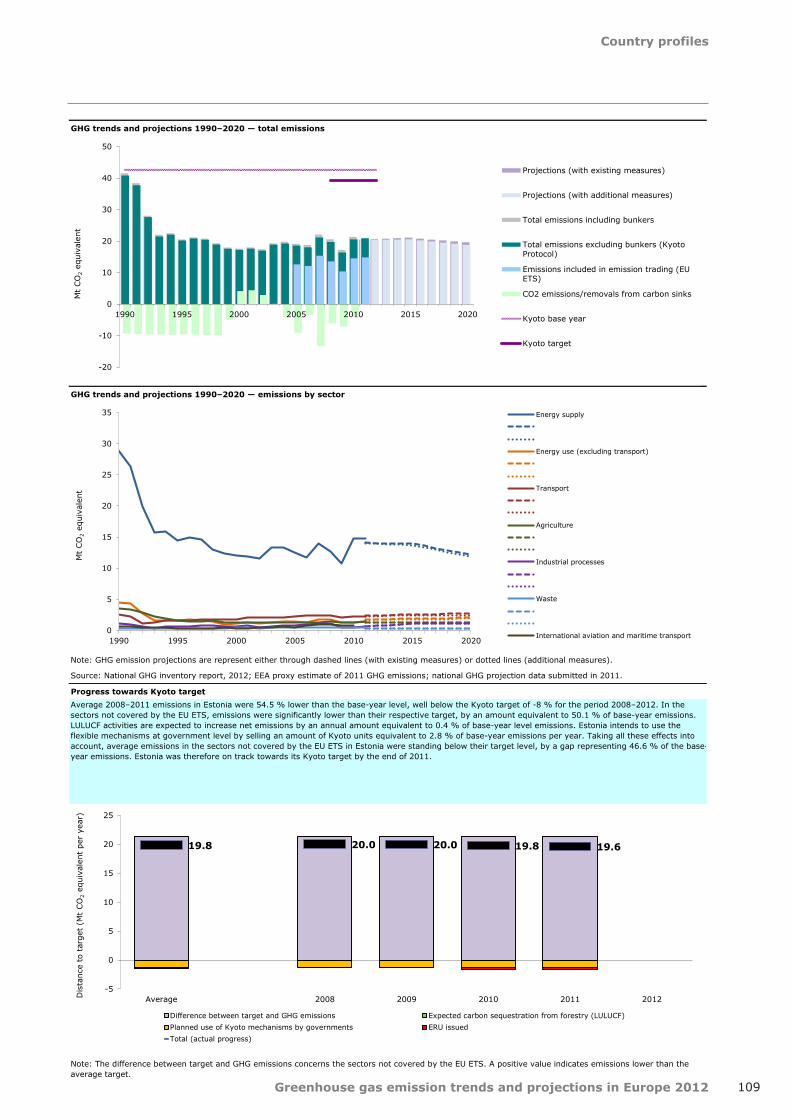
Country profiles
109Greenhouse gas emission trends and projections in Europe 2012
GHG trends and projections 1990–2020 — total emissions
GHG trends and projections 1990–2020 — emissions by sector
Progress towards Kyoto target
Note: The difference between target and GHG emissions concerns the sectors not covered by the EU ETS. A positive value indicates emissions lower than the average target.
Average 2008–2011 emissions in Estonia were 54.5 % lower than the base-year level, well below the Kyoto target of -8 % for the period 2008–2012. In the sectors not covered by the EU ETS, emissions were significantly lower than their respective target, by an amount equivalent to 50.1 % of base-year emissions. LULUCF activities are expected to increase net emissions by an annual amount equivalent to 0.4 % of base-year level emissions. Estonia intends to use the flexible mechanisms at government level by selling an amount of Kyoto units equivalent to 2.8 % of base-year emissions per year. Taking all these effects into account, average emissions in the sectors not covered by the EU ETS in Estonia were standing below their target level, by a gap representing 46.6 % of the base-year emissions. Estonia was therefore on track towards its Kyoto target by the end of 2011.
Note: GHG emission projections are represent either through dashed lines (with existing measures) or dotted lines (additional measures).
Source: National GHG inventory report, 2012; EEA proxy estimate of 2011 GHG emissions; national GHG projection data submitted in 2011.
-20
-10
0
10
20
30
40
50
1990 1995 2000 2005 2010 2015 2020
Mt
CO
2 eq
uiva
lent
Projections (with existing measures)
Projections (with additional measures)
Total emissions including bunkers
Total emissions excluding bunkers (KyotoProtocol)
Emissions included in emission trading (EUETS)
CO2 emissions/removals from carbon sinks
Kyoto base year
Kyoto target
0
5
10
15
20
25
30
35
1990 1995 2000 2005 2010 2015 2020
Mt
CO
2 eq
uiva
lent
Energy supply
Energy use (excluding transport)
Transport
Agriculture
Industrial processes
Waste
International aviation and maritime transport
19.8 20.0 20.0 19.8 19.6
-5
0
5
10
15
20
25
Average 2008 2009 2010 2011 2012Dis
tanc
e to
tar
get
(Mt
CO
2 eq
uiva
lent
per
yea
r)
Difference between target and GHG emissions Expected carbon sequestration from forestry (LULUCF)Planned use of Kyoto mechanisms by governments ERU issuedTotal (actual progress)

Country profiles
110 Greenhouse gas emission trends and projections in Europe 2012
Key GHG data (1) 1990 2008 2009 2010 2011 (2) 2012 1990–2011
2010–2011 (2)
Average 2008–2012 target under the Kyoto Protocol (Mt CO2-eq.) 71.0 71.0 71.0 71.0 71.0
Total GHG emissions (Mt CO2-eq.) 70.4 70.2 66.1 74.6 67.3 n.a. -4.3% -9.7%
GHG from international bunkers (3) (Mt CO2-eq.) 2.9 3.1 2.4 2.3 n.a. n.a. n.a. n.a.
GHG per capita (t CO2-eq. / capita) 14.1 13.3 12.4 13.9 12.5 n.a. -11.5% -10.1%
GHG per GDP (constant prices) (4) (g CO2-eq. / euro) 624 405 415 452 397 n.a. -36.5% -12.2%
Share of GHG in total EU-27 emissions (%) 1.3 % 1.4 % 1.4 % 1.6 % 1.5 % n.a. 16.1% -7.4%
EU ETS allocated allowances (free + auctioning) 36.5 37.1 37.9 37.9 n.a. 0.0%
EU ETS verified emissions - all installations (5) (Mt CO2-eq.) 36.2 34.4 41.3 35.1 n.a. -15.0%
EU ETS verified emissions - constant scope (6) (Mt CO2-eq.) 36.0 34.2 40.5 34.2 n.a. -15.5%
Share of EU ETS verified emissions (all install.) in total GHG (%) 51.5 % 52.0 % 55.4 % 52.1 % n.a. -5.9%
ETS verified emissions compared to annual allowances (7) (%) 99.0% 92.7% 108.9% 92.5% n.a. -15.0%
GHG emissions in the non-ETS sectors 34.1 31.8 33.3 32.2 n.a. -3.0%
Equivalent annual target for non-ETS GHG emissions 34.5 33.9 33.1 33.1 n.a. 0.0%
Share of GHG emissions (excluding international bunkers) by main source and by gas in 2010 (1) (8)
Assessment of short-term GHG trend (2009–2010)
Key data and trends on renewable energy 2008 2009 2010 2020 target
Share of renewable energy in final consumption 31.1% 31.1% 32.2% 38.0%
Share of renewable energy in transport 2.4% 4.1% 3.9% 10.0%
Share of renewable energy in electricity 27.2% 27.6% 0.0% n.a.
Share of renewable energy in heating & cooling 43.2% 43.3% 44.4% n.a.
Source: EurostatSource and additional information
Greenhouse gas emission data and EU ETS data
Finland recorded an increase in emissions of 12.8% in 2010 compared to 2009, which is the second highest increase of all EU-27 MS. Main increases occured in fuel related emission from public electricity and heat and manufacturing industries as well as process related emissions from mineral products and iron and steel production. This was mostly due to the recovery from the economic recession and due to the cold winter in Northern Europe, resulting in a higher need for heating .
www.eea.europa.eu/themes/climate/data-viewers
(5) All installations included. This includes new entrants and closures. Data from the community independent transaction log (CITL) as of 31 July 2012. The CITL regularly receives new information (including delayed verified emissions data, new entrants and closures) so the figures shown may change over time.
(7) "+" and "-" mean that verified emissions exceeded allowances or were below allowances, respectively. Annual allowances include allocated allowances and allowances auctioned during the same year.
(8) LULUCF sector and emissions from international bunkers excluded. Due to independent rounding the sums may not necessarily add up.
(6) Constant scope: includes only those installations with verified emissions available for 2008, 2009, 2010 and 2011.
(1) Total greenhouse gas emissions (GHG), GHG per capita, GHG per GDP and shares of GHG do not include emissions and removals from LULUCF (carbon sinks) and emissions from international bunkers.
(3) International bunkers: international aviation and international maritime transport.
(4) Gross domestic product (GDP) in 2005 market prices - not suitable for a ranking or quantitative comparison between countries for the same year. GDP information for the year 1990 is not available for some countries. For this reason, the 'GHG per GDP' values presented in the '1990' column correspond to the following years: 1991 (EU-15, Bulgaria, Germany, Hungary and Malta), 1992 (Slovakia), 1993 (EU-27 and Estonia) and 1995 (Croatia). Source GDP: Annual macro-economic database (AMECO), European Commission, 2012.
(2) Based on national estimate of 2011 emissions.
GHG trends and projections in Finland
41.2 %
21.9 %
18.2 %
7.7 %
7.9 % 2.9 % 0.1 % Energy supply
Energy use (excluding transport)
Transport
Industrial processes
Agriculture
Waste
Other
85.4 %
5.8 % 7.2 % 1.6 %
CO2
CH4
N2O
F-gases
0%5%
10%15%20%25%30%35%40%45%50%
2004 2006 2008 2010 2012 2014 2016 2018 2020
Share of renewable energy in gross final consumptionShare of renewable energy in final consumption of energy in transportShare of renewable energy in final electricity consumptionShare of renewable energy in final consumption of energy for heating and coolingRenewable energy target (gross final energy consumption)Renewable energy target (transport)
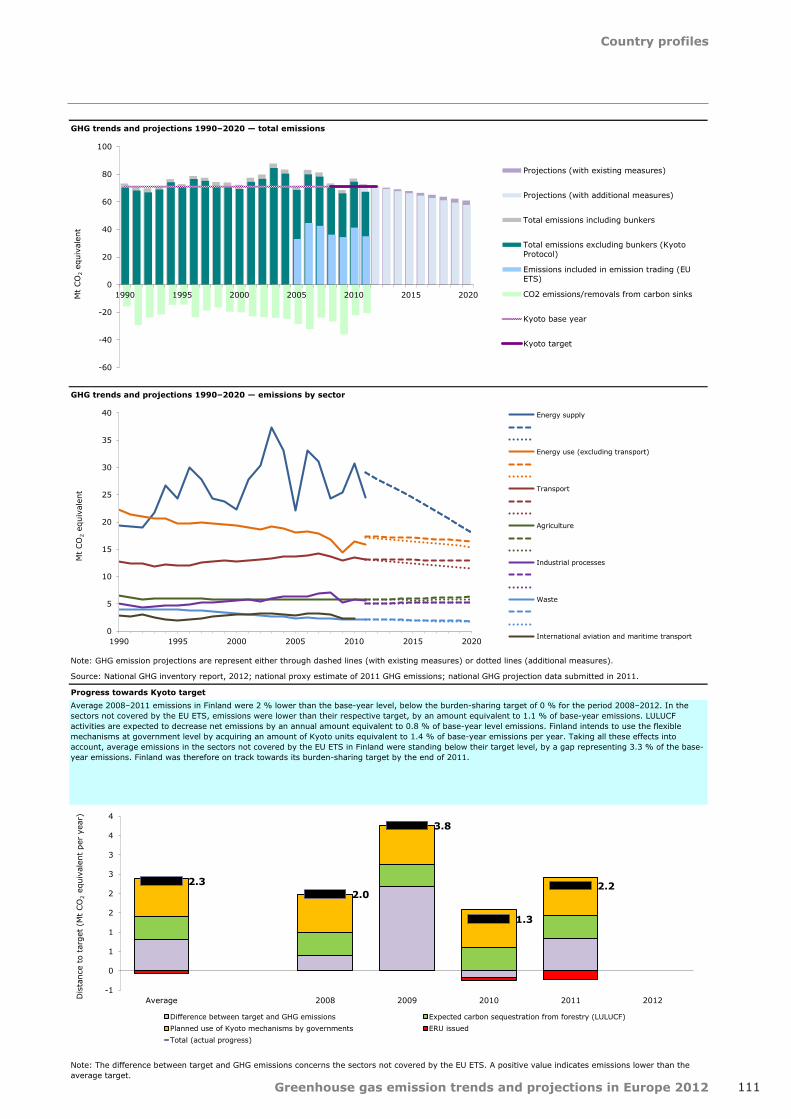
Country profiles
111Greenhouse gas emission trends and projections in Europe 2012
GHG trends and projections 1990–2020 — total emissions
GHG trends and projections 1990–2020 — emissions by sector
Progress towards Kyoto target
Note: The difference between target and GHG emissions concerns the sectors not covered by the EU ETS. A positive value indicates emissions lower than the average target.
Average 2008–2011 emissions in Finland were 2 % lower than the base-year level, below the burden-sharing target of 0 % for the period 2008–2012. In the sectors not covered by the EU ETS, emissions were lower than their respective target, by an amount equivalent to 1.1 % of base-year emissions. LULUCF activities are expected to decrease net emissions by an annual amount equivalent to 0.8 % of base-year level emissions. Finland intends to use the flexible mechanisms at government level by acquiring an amount of Kyoto units equivalent to 1.4 % of base-year emissions per year. Taking all these effects into account, average emissions in the sectors not covered by the EU ETS in Finland were standing below their target level, by a gap representing 3.3 % of the base-year emissions. Finland was therefore on track towards its burden-sharing target by the end of 2011.
Note: GHG emission projections are represent either through dashed lines (with existing measures) or dotted lines (additional measures).
Source: National GHG inventory report, 2012; national proxy estimate of 2011 GHG emissions; national GHG projection data submitted in 2011.
-60
-40
-20
0
20
40
60
80
100
1990 1995 2000 2005 2010 2015 2020Mt
CO
2 eq
uiva
lent
Projections (with existing measures)
Projections (with additional measures)
Total emissions including bunkers
Total emissions excluding bunkers (KyotoProtocol)
Emissions included in emission trading (EUETS)
CO2 emissions/removals from carbon sinks
Kyoto base year
Kyoto target
0
5
10
15
20
25
30
35
40
1990 1995 2000 2005 2010 2015 2020
Mt
CO
2 eq
uiva
lent
Energy supply
Energy use (excluding transport)
Transport
Agriculture
Industrial processes
Waste
International aviation and maritime transport
2.3 2.0
3.8
1.3
2.2
-1
0
1
1
2
2
3
3
4
4
Average 2008 2009 2010 2011 2012Dis
tanc
e to
tar
get
(Mt
CO
2 eq
uiva
lent
per
yea
r)
Difference between target and GHG emissions Expected carbon sequestration from forestry (LULUCF)Planned use of Kyoto mechanisms by governments ERU issuedTotal (actual progress)
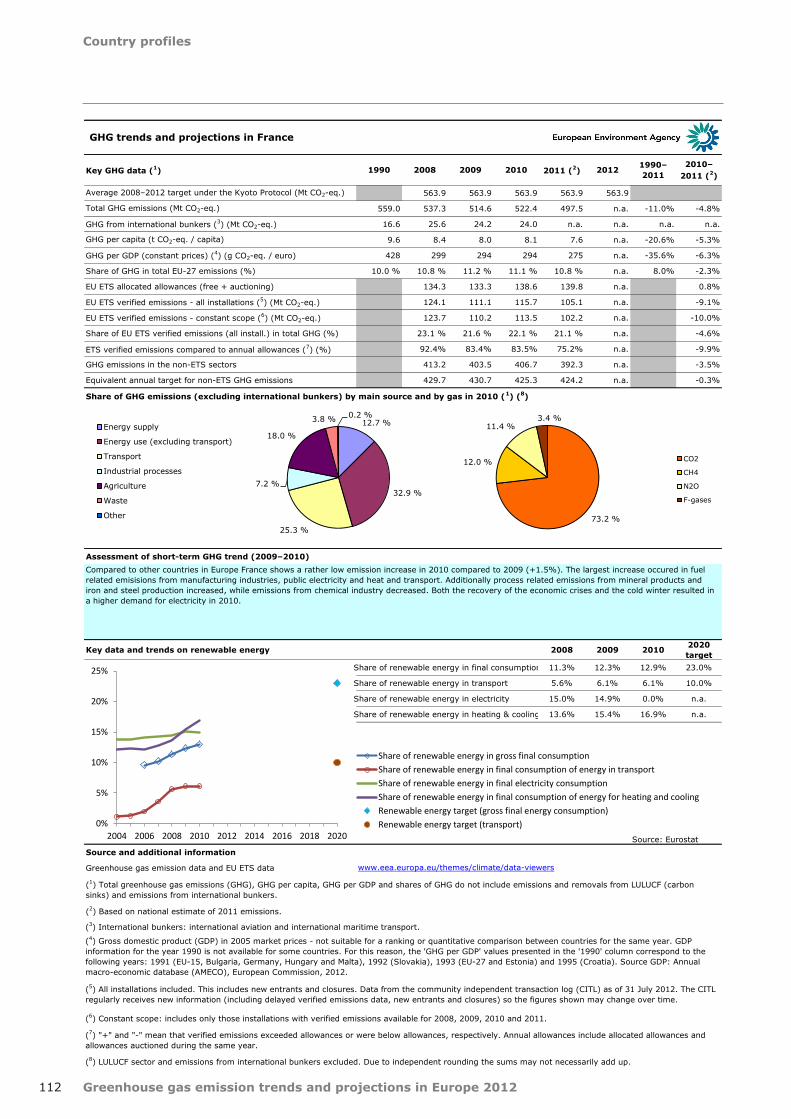
Country profiles
112 Greenhouse gas emission trends and projections in Europe 2012
Key GHG data (1) 1990 2008 2009 2010 2011 (2) 2012 1990–2011
2010–2011 (2)
Average 2008–2012 target under the Kyoto Protocol (Mt CO2-eq.) 563.9 563.9 563.9 563.9 563.9
Total GHG emissions (Mt CO2-eq.) 559.0 537.3 514.6 522.4 497.5 n.a. -11.0% -4.8%
GHG from international bunkers (3) (Mt CO2-eq.) 16.6 25.6 24.2 24.0 n.a. n.a. n.a. n.a.
GHG per capita (t CO2-eq. / capita) 9.6 8.4 8.0 8.1 7.6 n.a. -20.6% -5.3%
GHG per GDP (constant prices) (4) (g CO2-eq. / euro) 428 299 294 294 275 n.a. -35.6% -6.3%
Share of GHG in total EU-27 emissions (%) 10.0 % 10.8 % 11.2 % 11.1 % 10.8 % n.a. 8.0% -2.3%
EU ETS allocated allowances (free + auctioning) 134.3 133.3 138.6 139.8 n.a. 0.8%
EU ETS verified emissions - all installations (5) (Mt CO2-eq.) 124.1 111.1 115.7 105.1 n.a. -9.1%
EU ETS verified emissions - constant scope (6) (Mt CO2-eq.) 123.7 110.2 113.5 102.2 n.a. -10.0%
Share of EU ETS verified emissions (all install.) in total GHG (%) 23.1 % 21.6 % 22.1 % 21.1 % n.a. -4.6%
ETS verified emissions compared to annual allowances (7) (%) 92.4% 83.4% 83.5% 75.2% n.a. -9.9%
GHG emissions in the non-ETS sectors 413.2 403.5 406.7 392.3 n.a. -3.5%
Equivalent annual target for non-ETS GHG emissions 429.7 430.7 425.3 424.2 n.a. -0.3%
Share of GHG emissions (excluding international bunkers) by main source and by gas in 2010 (1) (8)
Assessment of short-term GHG trend (2009–2010)
Key data and trends on renewable energy 2008 2009 2010 2020 target
Share of renewable energy in final consumption 11.3% 12.3% 12.9% 23.0%
Share of renewable energy in transport 5.6% 6.1% 6.1% 10.0%
Share of renewable energy in electricity 15.0% 14.9% 0.0% n.a.
Share of renewable energy in heating & cooling 13.6% 15.4% 16.9% n.a.
Source: EurostatSource and additional information
Greenhouse gas emission data and EU ETS data
Compared to other countries in Europe France shows a rather low emission increase in 2010 compared to 2009 (+1.5%). The largest increase occured in fuel related emisisions from manufacturing industries, public electricity and heat and transport. Additionally process related emissions from mineral products and iron and steel production increased, while emissions from chemical industry decreased. Both the recovery of the economic crises and the cold winter resulted in a higher demand for electricity in 2010.
www.eea.europa.eu/themes/climate/data-viewers
(5) All installations included. This includes new entrants and closures. Data from the community independent transaction log (CITL) as of 31 July 2012. The CITL regularly receives new information (including delayed verified emissions data, new entrants and closures) so the figures shown may change over time.
(7) "+" and "-" mean that verified emissions exceeded allowances or were below allowances, respectively. Annual allowances include allocated allowances and allowances auctioned during the same year.
(8) LULUCF sector and emissions from international bunkers excluded. Due to independent rounding the sums may not necessarily add up.
(6) Constant scope: includes only those installations with verified emissions available for 2008, 2009, 2010 and 2011.
(1) Total greenhouse gas emissions (GHG), GHG per capita, GHG per GDP and shares of GHG do not include emissions and removals from LULUCF (carbon sinks) and emissions from international bunkers.
(3) International bunkers: international aviation and international maritime transport.
(4) Gross domestic product (GDP) in 2005 market prices - not suitable for a ranking or quantitative comparison between countries for the same year. GDP information for the year 1990 is not available for some countries. For this reason, the 'GHG per GDP' values presented in the '1990' column correspond to the following years: 1991 (EU-15, Bulgaria, Germany, Hungary and Malta), 1992 (Slovakia), 1993 (EU-27 and Estonia) and 1995 (Croatia). Source GDP: Annual macro-economic database (AMECO), European Commission, 2012.
(2) Based on national estimate of 2011 emissions.
GHG trends and projections in France
12.7 %
32.9 %
25.3 %
7.2 %
18.0 %
3.8 % 0.2 % Energy supply
Energy use (excluding transport)
Transport
Industrial processes
Agriculture
Waste
Other 73.2 %
12.0 %
11.4 % 3.4 %
CO2
CH4
N2O
F-gases
0%
5%
10%
15%
20%
25%
2004 2006 2008 2010 2012 2014 2016 2018 2020
Share of renewable energy in gross final consumptionShare of renewable energy in final consumption of energy in transportShare of renewable energy in final electricity consumptionShare of renewable energy in final consumption of energy for heating and coolingRenewable energy target (gross final energy consumption)Renewable energy target (transport)
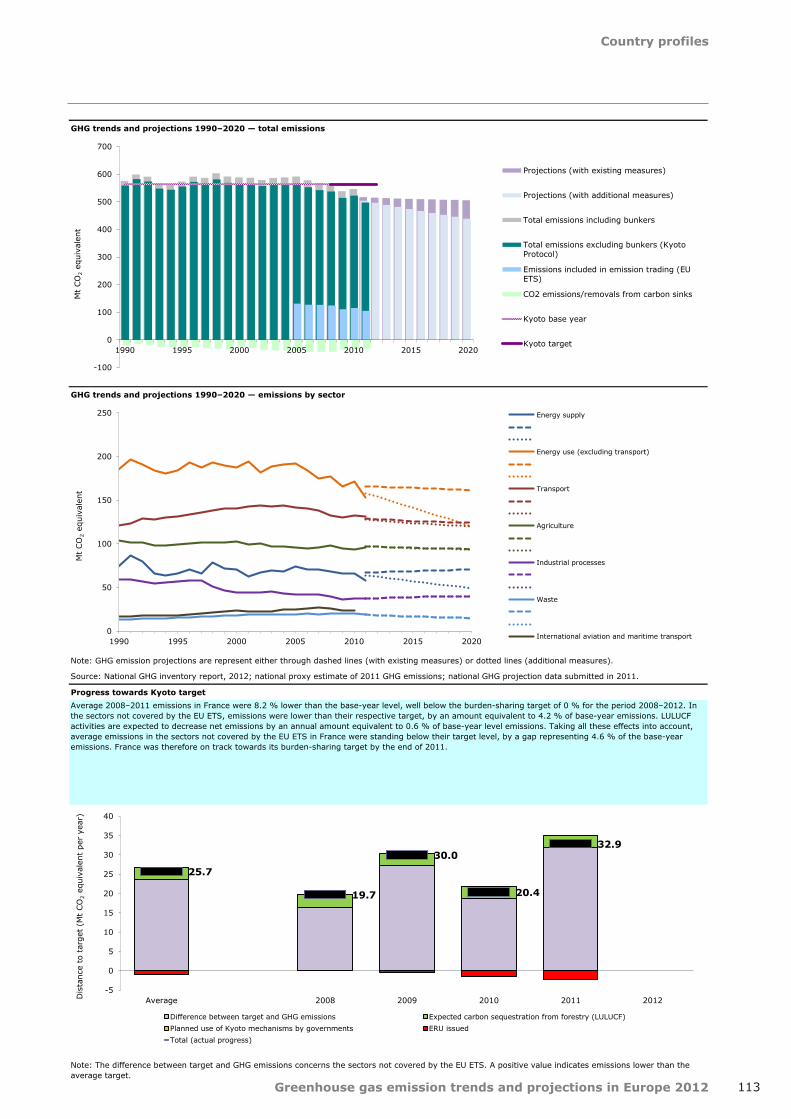
Country profiles
113Greenhouse gas emission trends and projections in Europe 2012
GHG trends and projections 1990–2020 — total emissions
GHG trends and projections 1990–2020 — emissions by sector
Progress towards Kyoto target
Note: The difference between target and GHG emissions concerns the sectors not covered by the EU ETS. A positive value indicates emissions lower than the average target.
Average 2008–2011 emissions in France were 8.2 % lower than the base-year level, well below the burden-sharing target of 0 % for the period 2008–2012. In the sectors not covered by the EU ETS, emissions were lower than their respective target, by an amount equivalent to 4.2 % of base-year emissions. LULUCF activities are expected to decrease net emissions by an annual amount equivalent to 0.6 % of base-year level emissions. Taking all these effects into account, average emissions in the sectors not covered by the EU ETS in France were standing below their target level, by a gap representing 4.6 % of the base-year emissions. France was therefore on track towards its burden-sharing target by the end of 2011.
Note: GHG emission projections are represent either through dashed lines (with existing measures) or dotted lines (additional measures).
Source: National GHG inventory report, 2012; national proxy estimate of 2011 GHG emissions; national GHG projection data submitted in 2011.
-100
0
100
200
300
400
500
600
700
1990 1995 2000 2005 2010 2015 2020
Mt
CO
2 eq
uiva
lent
Projections (with existing measures)
Projections (with additional measures)
Total emissions including bunkers
Total emissions excluding bunkers (KyotoProtocol)
Emissions included in emission trading (EUETS)
CO2 emissions/removals from carbon sinks
Kyoto base year
Kyoto target
0
50
100
150
200
250
1990 1995 2000 2005 2010 2015 2020
Mt
CO
2 eq
uiva
lent
Energy supply
Energy use (excluding transport)
Transport
Agriculture
Industrial processes
Waste
International aviation and maritime transport
25.7
19.7
30.0
20.4
32.9
-5
0
5
10
15
20
25
30
35
40
Average 2008 2009 2010 2011 2012Dis
tanc
e to
tar
get
(Mt
CO
2 eq
uiva
lent
per
yea
r)
Difference between target and GHG emissions Expected carbon sequestration from forestry (LULUCF)Planned use of Kyoto mechanisms by governments ERU issuedTotal (actual progress)

Country profiles
114 Greenhouse gas emission trends and projections in Europe 2012
Key GHG data (1) 1990 2008 2009 2010 2011 (2) 2012 1990–2011
2010–2011 (2)
Average 2008–2012 target under the Kyoto Protocol (Mt CO2-eq.) 973.6 973.6 973.6 973.6 973.6
Total GHG emissions (Mt CO2-eq.) 1 246.1 976.0 911.8 936.5 917.0 n.a. -26.4% -2.1%
GHG from international bunkers (3) (Mt CO2-eq.) 20.1 35.4 33.9 33.8 34.4 n.a. 70.9% 1.9%
GHG per capita (t CO2-eq. / capita) 15.8 11.9 11.1 11.4 11.2 n.a. -28.8% -2.0%
GHG per GDP (constant prices) (4) (g CO2-eq. / euro) 641 405 399 395 376 n.a. -41.3% -4.9%
Share of GHG in total EU-27 emissions (%) 22.3 % 19.6 % 19.8 % 19.8 % 19.9 % n.a. -10.7% 0.4%
EU ETS allocated allowances (free + auctioning) 437.9 431.8 438.6 441.2 n.a. 0.6%
EU ETS verified emissions - all installations (5) (Mt CO2-eq.) 472.7 428.3 454.9 450.4 n.a. -1.0%
EU ETS verified emissions - constant scope (6) (Mt CO2-eq.) 466.7 427.7 453.2 447.4 n.a. -1.3%
Share of EU ETS verified emissions (all install.) in total GHG (%) 48.4 % 47.0 % 48.6 % 49.1 % n.a. 1.1%
ETS verified emissions compared to annual allowances (7) (%) 108.0% 99.2% 103.7% 102.1% n.a. -1.6%
GHG emissions in the non-ETS sectors 503.2 483.5 481.7 466.6 n.a. -3.1%
Equivalent annual target for non-ETS GHG emissions 535.7 541.8 535.0 532.5 n.a. -0.5%
Share of GHG emissions (excluding international bunkers) by main source and by gas in 2010 (1) (8)
Assessment of short-term GHG trend (2009–2010)
Key data and trends on renewable energy 2008 2009 2010 2020 target
Share of renewable energy in final consumption 9.1% 9.5% 11.0% 18.0%
Share of renewable energy in transport 6.1% 5.3% 5.7% 10.0%
Share of renewable energy in electricity 17.2% 18.1% 0.0% n.a.
Share of renewable energy in heating & cooling 8.5% 8.5% 10.5% n.a.
Source: EurostatSource and additional information
Greenhouse gas emission data and EU ETS data
Compared to 2009 emissions increased by 2.7% in 2010. Reasons for this trend were the fuel related emission increases in public electricity and heat production, manufacturing industries (especially iron and steel) and households. Additionally, process related emissions from iron and steel and ammonia production increased. This rise in emission was mainly caused by the recovery from the economic crisis and a colder winter compared to 2009. Significant emission cuts in the adipic acid production due to the implementation of emission reducing measures (two out of the existing three plants in Germany have installed a second additional off-gas treatment system) partly offset this trend.
www.eea.europa.eu/themes/climate/data-viewers
(5) All installations included. This includes new entrants and closures. Data from the community independent transaction log (CITL) as of 31 July 2012. The CITL regularly receives new information (including delayed verified emissions data, new entrants and closures) so the figures shown may change over time.
(7) "+" and "-" mean that verified emissions exceeded allowances or were below allowances, respectively. Annual allowances include allocated allowances and allowances auctioned during the same year.
(8) LULUCF sector and emissions from international bunkers excluded. Due to independent rounding the sums may not necessarily add up.
(6) Constant scope: includes only those installations with verified emissions available for 2008, 2009, 2010 and 2011.
(1) Total greenhouse gas emissions (GHG), GHG per capita, GHG per GDP and shares of GHG do not include emissions and removals from LULUCF (carbon sinks) and emissions from international bunkers.
(3) International bunkers: international aviation and international maritime transport.
(4) Gross domestic product (GDP) in 2005 market prices - not suitable for a ranking or quantitative comparison between countries for the same year. GDP information for the year 1990 is not available for some countries. For this reason, the 'GHG per GDP' values presented in the '1990' column correspond to the following years: 1991 (EU-15, Bulgaria, Germany, Hungary and Malta), 1992 (Slovakia), 1993 (EU-27 and Estonia) and 1995 (Croatia). Source GDP: Annual macro-economic database (AMECO), European Commission, 2012.
(2) Based on national estimate of 2011 emissions.
GHG trends and projections in Germany
39.0 %
28.0 %
16.5 %
7.7 %
7.2 % 1.3 % 0.2 % Energy supply
Energy use (excluding transport)
Transport
Industrial processes
Agriculture
Waste
Other
87.4 %
5.1 % 5.8 % 1.6 %
CO2
CH4
N2O
F-gases
0%2%4%6%8%
10%12%14%16%18%20%
2004 2006 2008 2010 2012 2014 2016 2018 2020
Share of renewable energy in gross final consumptionShare of renewable energy in final consumption of energy in transportShare of renewable energy in final electricity consumptionShare of renewable energy in final consumption of energy for heating and coolingRenewable energy target (gross final energy consumption)Renewable energy target (transport)

Country profiles
115Greenhouse gas emission trends and projections in Europe 2012
GHG trends and projections 1990–2020 — total emissions
GHG trends and projections 1990–2020 — emissions by sector
Progress towards Kyoto target
Note: The difference between target and GHG emissions concerns the sectors not covered by the EU ETS. A positive value indicates emissions lower than the average target.
Average 2008–2011 emissions in Germany were 24.1 % lower than the base-year level, below the burden-sharing target of -21 % for the period 2008–2012. In the sectors not covered by the EU ETS, emissions were lower than their respective target, by an amount equivalent to 4.3 % of base-year emissions. LULUCF activities are expected to decrease net emissions by an annual amount equivalent to 0.8 % of base-year level emissions. Taking all these effects into account, average emissions in the sectors not covered by the EU ETS in Germany were standing below their target level, by a gap representing 5 % of the base-year emissions. Germany was therefore on track towards its burden-sharing target by the end of 2011.
Note: GHG emission projections are represent either through dashed lines (with existing measures) or dotted lines (additional measures).
Source: National GHG inventory report, 2012; national proxy estimate of 2011 GHG emissions; national GHG projection data submitted in 2011.
-200
0
200
400
600
800
1 000
1 200
1 400
1990 1995 2000 2005 2010 2015 2020
Mt
CO
2 eq
uiva
lent
Projections (with existing measures)
Projections (with additional measures)
Total emissions including bunkers
Total emissions excluding bunkers (KyotoProtocol)
Emissions included in emission trading (EUETS)
CO2 emissions/removals from carbon sinks
Kyoto base year
Kyoto target
0
50
100
150
200
250
300
350
400
450
500
1990 1995 2000 2005 2010 2015 2020
Mt
CO
2 eq
uiva
lent
Energy supply
Energy use (excluding transport)
Transport
Agriculture
Industrial processes
Waste
International aviation and maritime transport
61.3
42.6
68.3 62.1
72.3
-10
0
10
20
30
40
50
60
70
80
Average 2008 2009 2010 2011 2012Dis
tanc
e to
tar
get
(Mt
CO
2 eq
uiva
lent
per
yea
r)
Difference between target and GHG emissions Expected carbon sequestration from forestry (LULUCF)Planned use of Kyoto mechanisms by governments ERU issuedTotal (actual progress)

Country profiles
116 Greenhouse gas emission trends and projections in Europe 2012
Key GHG data (1) 1990 2008 2009 2010 2011 (2) 2012 1990–2011
2010–2011 (2)
Average 2008–2012 target under the Kyoto Protocol (Mt CO2-eq.) 133.7 133.7 133.7 133.7 133.7
Total GHG emissions (Mt CO2-eq.) 105.0 131.3 124.7 118.3 118.5 n.a. 12.9% 0.2%
GHG from international bunkers (3) (Mt CO2-eq.) 11.2 13.3 11.4 11.0 n.a. n.a. n.a. n.a.
GHG per capita (t CO2-eq. / capita) 10.4 11.7 11.1 10.5 10.5 n.a. 1.0% 0.2%
GHG per GDP (constant prices) (4) (g CO2-eq. / euro) 836 626 615 605 651 n.a. -22.1% 7.6%
Share of GHG in total EU-27 emissions (%) 1.9 % 2.6 % 2.7 % 2.5 % 2.6 % n.a. 37.0% 2.8%
EU ETS allocated allowances (free + auctioning) 63.7 63.2 64.6 74.6 n.a. 15.5%
EU ETS verified emissions - all installations (5) (Mt CO2-eq.) 69.9 63.7 59.9 58.8 n.a. -1.8%
EU ETS verified emissions - constant scope (6) (Mt CO2-eq.) 69.8 63.6 59.8 57.0 n.a. -4.8%
Share of EU ETS verified emissions (all install.) in total GHG (%) 53.2 % 51.1 % 50.7 % 49.6 % n.a. -2.0%
ETS verified emissions compared to annual allowances (7) (%) 109.7% 100.7% 92.7% 78.8% n.a. -15.0%
GHG emissions in the non-ETS sectors 61.4 61.0 58.3 59.7 n.a. 2.3%
Equivalent annual target for non-ETS GHG emissions 70.0 70.5 69.1 59.1 n.a. -14.5%
Share of GHG emissions (excluding international bunkers) by main source and by gas in 2010 (1) (8)
Assessment of short-term GHG trend (2009–2010)
Key data and trends on renewable energy 2008 2009 2010 2020 target
Share of renewable energy in final consumption 8.0% 8.1% 9.2% 18.0%
Share of renewable energy in transport 1.1% 1.1% 1.9% 10.0%
Share of renewable energy in electricity 10.5% 11.9% 0.0% n.a.
Share of renewable energy in heating & cooling 14.4% 15.9% 16.2% n.a.
Source: EurostatSource and additional information
Greenhouse gas emission data and EU ETS data
Greece showed the largest emission reductions within the EU (-5.1%) in 2010 compared to 2009. The significant decline in emissions was mainly due to fuel related emissions decreases in public electricity and heat, road transportation, manufacturing industries and households as well as process related emissions from cement production. This trend mainly reflects the continuing effects of the economic crisis.
www.eea.europa.eu/themes/climate/data-viewers
(5) All installations included. This includes new entrants and closures. Data from the community independent transaction log (CITL) as of 31 July 2012. The CITL regularly receives new information (including delayed verified emissions data, new entrants and closures) so the figures shown may change over time.
(7) "+" and "-" mean that verified emissions exceeded allowances or were below allowances, respectively. Annual allowances include allocated allowances and allowances auctioned during the same year.
(8) LULUCF sector and emissions from international bunkers excluded. Due to independent rounding the sums may not necessarily add up.
(6) Constant scope: includes only those installations with verified emissions available for 2008, 2009, 2010 and 2011.
(1) Total greenhouse gas emissions (GHG), GHG per capita, GHG per GDP and shares of GHG do not include emissions and removals from LULUCF (carbon sinks) and emissions from international bunkers.
(3) International bunkers: international aviation and international maritime transport.
(4) Gross domestic product (GDP) in 2005 market prices - not suitable for a ranking or quantitative comparison between countries for the same year. GDP information for the year 1990 is not available for some countries. For this reason, the 'GHG per GDP' values presented in the '1990' column correspond to the following years: 1991 (EU-15, Bulgaria, Germany, Hungary and Malta), 1992 (Slovakia), 1993 (EU-27 and Estonia) and 1995 (Croatia). Source GDP: Annual macro-economic database (AMECO), European Commission, 2012.
(2) Based on national estimate of 2011 emissions.
GHG trends and projections in Greece
45.3 %
14.0 %
19.4 %
8.9 %
7.8 % 4.2 % 0.3 %
Energy supply
Energy use (excluding transport)
Transport
Industrial processes
Agriculture
Waste
Other
82.4 %
8.3 %
6.2 % 3.1 %
CO2
CH4
N2O
F-gases
0%2%4%6%8%
10%12%14%16%18%20%
2004 2006 2008 2010 2012 2014 2016 2018 2020
Share of renewable energy in gross final consumptionShare of renewable energy in final consumption of energy in transportShare of renewable energy in final electricity consumptionShare of renewable energy in final consumption of energy for heating and coolingRenewable energy target (gross final energy consumption)Renewable energy target (transport)

Country profiles
117Greenhouse gas emission trends and projections in Europe 2012
GHG trends and projections 1990–2020 — total emissions
GHG trends and projections 1990–2020 — emissions by sector
Progress towards Kyoto target
Note: The difference between target and GHG emissions concerns the sectors not covered by the EU ETS. A positive value indicates emissions lower than the average target.
Average 2008–2011 emissions in Greece were 15.2 % higher than the base-year level, well below the burden-sharing target of 25 % for the period 2008–2012. In the sectors not covered by the EU ETS, emissions were significantly lower than their respective target, by an amount equivalent to 6.6 % of base-year emissions. LULUCF activities are expected to decrease net emissions by an annual amount equivalent to 0.6 % of base-year level emissions. Taking all these effects into account, average emissions in the sectors not covered by the EU ETS in Greece were standing below their target level, by a gap representing 7.2 % of the base-year emissions. Greece was therefore on track towards its burden-sharing target by the end of 2011.
Note: GHG emission projections are represent either through dashed lines (with existing measures) or dotted lines (additional measures).
Source: National GHG inventory report, 2012; national proxy estimate of 2011 GHG emissions; national GHG projection data submitted in 2011.
-20
0
20
40
60
80
100
120
140
160
1990 1995 2000 2005 2010 2015 2020
Mt
CO
2 eq
uiva
lent
Projections (with existing measures)
Projections (with additional measures)
Total emissions including bunkers
Total emissions excluding bunkers (KyotoProtocol)
Emissions included in emission trading (EUETS)
CO2 emissions/removals from carbon sinks
Kyoto base year
Kyoto target
0
10
20
30
40
50
60
70
1990 1995 2000 2005 2010 2015 2020
Mt
CO
2 eq
uiva
lent
Energy supply
Energy use (excluding transport)
Transport
Agriculture
Industrial processes
Waste
International aviation and maritime transport
7.7
9.3 10.1
11.4
0.0
-2
0
2
4
6
8
10
12
Average 2008 2009 2010 2011 2012Dis
tanc
e to
tar
get
(Mt
CO
2 eq
uiva
lent
per
yea
r)
Difference between target and GHG emissions Expected carbon sequestration from forestry (LULUCF)Planned use of Kyoto mechanisms by governments ERU issuedTotal (actual progress)
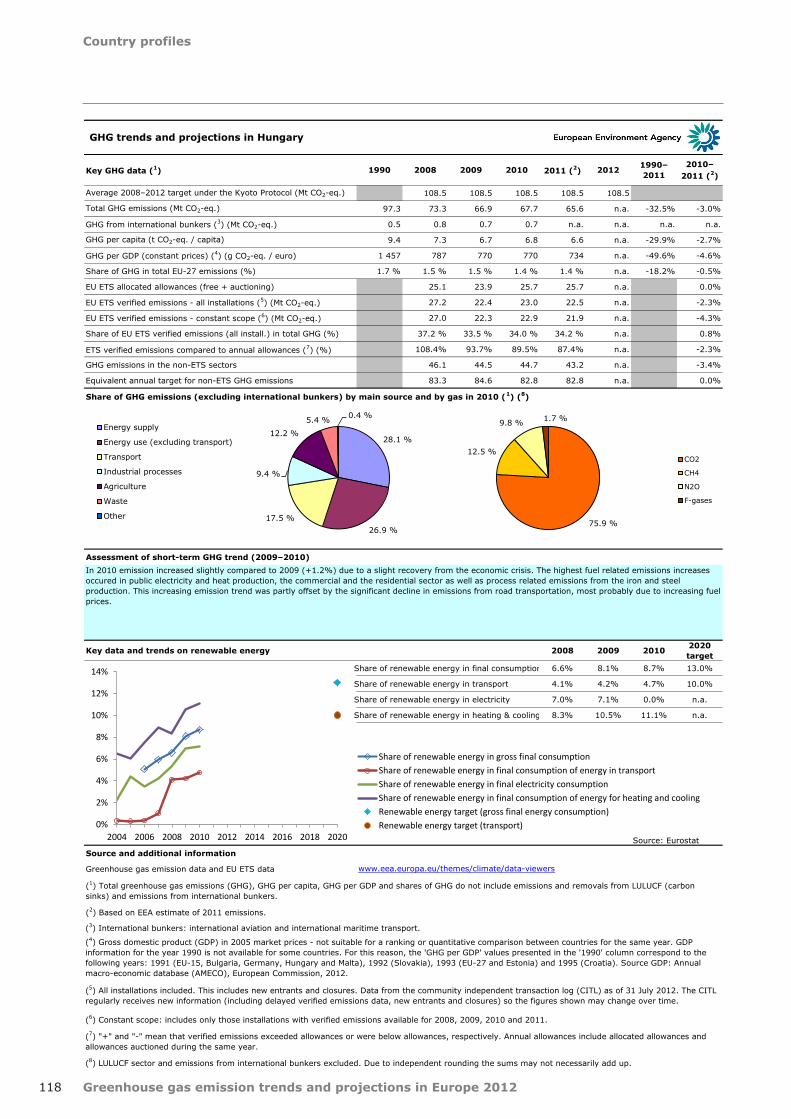
Country profiles
118 Greenhouse gas emission trends and projections in Europe 2012
Key GHG data (1) 1990 2008 2009 2010 2011 (2) 2012 1990–2011
2010–2011 (2)
Average 2008–2012 target under the Kyoto Protocol (Mt CO2-eq.) 108.5 108.5 108.5 108.5 108.5
Total GHG emissions (Mt CO2-eq.) 97.3 73.3 66.9 67.7 65.6 n.a. -32.5% -3.0%
GHG from international bunkers (3) (Mt CO2-eq.) 0.5 0.8 0.7 0.7 n.a. n.a. n.a. n.a.
GHG per capita (t CO2-eq. / capita) 9.4 7.3 6.7 6.8 6.6 n.a. -29.9% -2.7%
GHG per GDP (constant prices) (4) (g CO2-eq. / euro) 1 457 787 770 770 734 n.a. -49.6% -4.6%
Share of GHG in total EU-27 emissions (%) 1.7 % 1.5 % 1.5 % 1.4 % 1.4 % n.a. -18.2% -0.5%
EU ETS allocated allowances (free + auctioning) 25.1 23.9 25.7 25.7 n.a. 0.0%
EU ETS verified emissions - all installations (5) (Mt CO2-eq.) 27.2 22.4 23.0 22.5 n.a. -2.3%
EU ETS verified emissions - constant scope (6) (Mt CO2-eq.) 27.0 22.3 22.9 21.9 n.a. -4.3%
Share of EU ETS verified emissions (all install.) in total GHG (%) 37.2 % 33.5 % 34.0 % 34.2 % n.a. 0.8%
ETS verified emissions compared to annual allowances (7) (%) 108.4% 93.7% 89.5% 87.4% n.a. -2.3%
GHG emissions in the non-ETS sectors 46.1 44.5 44.7 43.2 n.a. -3.4%
Equivalent annual target for non-ETS GHG emissions 83.3 84.6 82.8 82.8 n.a. 0.0%
Share of GHG emissions (excluding international bunkers) by main source and by gas in 2010 (1) (8)
Assessment of short-term GHG trend (2009–2010)
Key data and trends on renewable energy 2008 2009 2010 2020 target
Share of renewable energy in final consumption 6.6% 8.1% 8.7% 13.0%
Share of renewable energy in transport 4.1% 4.2% 4.7% 10.0%
Share of renewable energy in electricity 7.0% 7.1% 0.0% n.a.
Share of renewable energy in heating & cooling 8.3% 10.5% 11.1% n.a.
Source: EurostatSource and additional information
Greenhouse gas emission data and EU ETS data
In 2010 emission increased slightly compared to 2009 (+1.2%) due to a slight recovery from the economic crisis. The highest fuel related emissions increases occured in public electricity and heat production, the commercial and the residential sector as well as process related emissions from the iron and steel production. This increasing emission trend was partly offset by the significant decline in emissions from road transportation, most probably due to increasing fuel prices.
www.eea.europa.eu/themes/climate/data-viewers
(5) All installations included. This includes new entrants and closures. Data from the community independent transaction log (CITL) as of 31 July 2012. The CITL regularly receives new information (including delayed verified emissions data, new entrants and closures) so the figures shown may change over time.
(7) "+" and "-" mean that verified emissions exceeded allowances or were below allowances, respectively. Annual allowances include allocated allowances and allowances auctioned during the same year.
(8) LULUCF sector and emissions from international bunkers excluded. Due to independent rounding the sums may not necessarily add up.
(6) Constant scope: includes only those installations with verified emissions available for 2008, 2009, 2010 and 2011.
(1) Total greenhouse gas emissions (GHG), GHG per capita, GHG per GDP and shares of GHG do not include emissions and removals from LULUCF (carbon sinks) and emissions from international bunkers.
(3) International bunkers: international aviation and international maritime transport.
(4) Gross domestic product (GDP) in 2005 market prices - not suitable for a ranking or quantitative comparison between countries for the same year. GDP information for the year 1990 is not available for some countries. For this reason, the 'GHG per GDP' values presented in the '1990' column correspond to the following years: 1991 (EU-15, Bulgaria, Germany, Hungary and Malta), 1992 (Slovakia), 1993 (EU-27 and Estonia) and 1995 (Croatia). Source GDP: Annual macro-economic database (AMECO), European Commission, 2012.
(2) Based on EEA estimate of 2011 emissions.
GHG trends and projections in Hungary
28.1 %
26.9 % 17.5 %
9.4 %
12.2 %
5.4 % 0.4 % Energy supply
Energy use (excluding transport)
Transport
Industrial processes
Agriculture
Waste
Other75.9 %
12.5 %
9.8 % 1.7 %
CO2
CH4
N2O
F-gases
0%
2%
4%
6%
8%
10%
12%
14%
2004 2006 2008 2010 2012 2014 2016 2018 2020
Share of renewable energy in gross final consumptionShare of renewable energy in final consumption of energy in transportShare of renewable energy in final electricity consumptionShare of renewable energy in final consumption of energy for heating and coolingRenewable energy target (gross final energy consumption)Renewable energy target (transport)
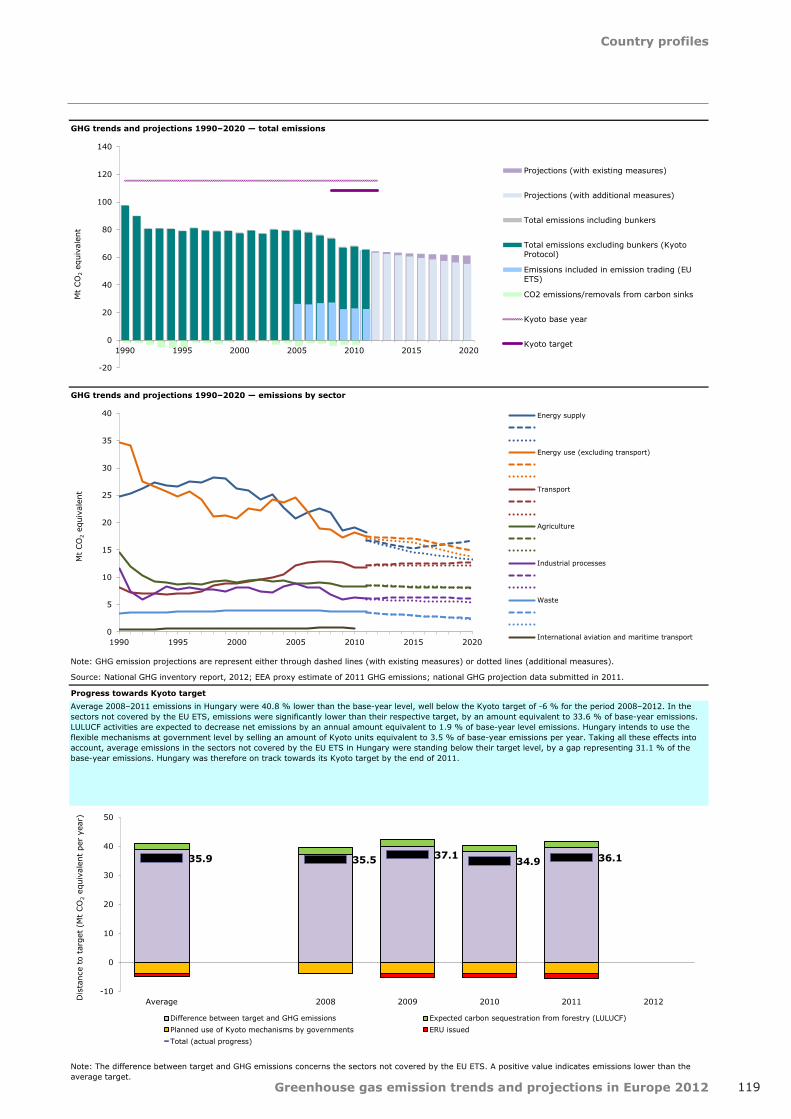
Country profiles
119Greenhouse gas emission trends and projections in Europe 2012
GHG trends and projections 1990–2020 — total emissions
GHG trends and projections 1990–2020 — emissions by sector
Progress towards Kyoto target
Note: The difference between target and GHG emissions concerns the sectors not covered by the EU ETS. A positive value indicates emissions lower than the average target.
Average 2008–2011 emissions in Hungary were 40.8 % lower than the base-year level, well below the Kyoto target of -6 % for the period 2008–2012. In the sectors not covered by the EU ETS, emissions were significantly lower than their respective target, by an amount equivalent to 33.6 % of base-year emissions. LULUCF activities are expected to decrease net emissions by an annual amount equivalent to 1.9 % of base-year level emissions. Hungary intends to use the flexible mechanisms at government level by selling an amount of Kyoto units equivalent to 3.5 % of base-year emissions per year. Taking all these effects into account, average emissions in the sectors not covered by the EU ETS in Hungary were standing below their target level, by a gap representing 31.1 % of the base-year emissions. Hungary was therefore on track towards its Kyoto target by the end of 2011.
Note: GHG emission projections are represent either through dashed lines (with existing measures) or dotted lines (additional measures).
Source: National GHG inventory report, 2012; EEA proxy estimate of 2011 GHG emissions; national GHG projection data submitted in 2011.
-20
0
20
40
60
80
100
120
140
1990 1995 2000 2005 2010 2015 2020
Mt
CO
2 eq
uiva
lent
Projections (with existing measures)
Projections (with additional measures)
Total emissions including bunkers
Total emissions excluding bunkers (KyotoProtocol)
Emissions included in emission trading (EUETS)
CO2 emissions/removals from carbon sinks
Kyoto base year
Kyoto target
0
5
10
15
20
25
30
35
40
1990 1995 2000 2005 2010 2015 2020
Mt
CO
2 eq
uiva
lent
Energy supply
Energy use (excluding transport)
Transport
Agriculture
Industrial processes
Waste
International aviation and maritime transport
35.9 35.5 37.1 34.9 36.1
-10
0
10
20
30
40
50
Average 2008 2009 2010 2011 2012Dis
tanc
e to
tar
get
(Mt
CO
2 eq
uiva
lent
per
yea
r)
Difference between target and GHG emissions Expected carbon sequestration from forestry (LULUCF)Planned use of Kyoto mechanisms by governments ERU issuedTotal (actual progress)

Country profiles
120 Greenhouse gas emission trends and projections in Europe 2012
Key GHG data (1) 1990 2008 2009 2010 2011 (2) 2012 1990–2011
2010–2011 (2)
Average 2008–2012 target under the Kyoto Protocol (Mt CO2-eq.) 3.7 3.7 3.7 3.7 3.7
Total GHG emissions (Mt CO2-eq.) 3.5 5.0 4.7 4.5 n.a. n.a. n.a. n.a.
GHG from international bunkers (3) (Mt CO2-eq.) 0.3 0.7 0.5 0.6 n.a. n.a. n.a. n.a.
GHG per capita (t CO2-eq. / capita) 13.8 15.7 14.7 14.3 n.a. n.a. n.a. n.a.
GHG per GDP (constant prices) (4) (g CO2-eq. / euro) 423 336 342 345 n.a. n.a. n.a. n.a.
Share of GHG emissions (excluding international bunkers) by main source and by gas in 2010 (1) (8)
Assessment of short-term GHG trend (2009–2010)
Source and additional information
Greenhouse gas emission data and EU ETS data
Iceland was among the countries with decreasing emissons between 2009 and 2010 (-3.4%). Late year 2008, Iceland was severely hit by an economic crisis when its three largest banks collapsed. The crisis has resulted in serious contraction of the economy. Emissions of greenhouse gases decreased from most sectors between 2008 and 2010. In 2010, 818,859 tonnes of aluminium were produced in three aluminium plants. Parallel investments in increased power capacity were needed to accommodate for an nine fold increase in aluminium production. The size of these investments is large relative to the Icelandic economy. Emissions from fuel combustion in the transport and construction sector decreased in 2010 by 7% compared to 2009, because of the economic crises. Emissions from cement production have continued to decrease by 84% since 2007 (process emissions and emissions from fuel consumption) also as a result of the economic crises and the collapse of the construction sector.
www.eea.europa.eu/themes/climate/data-viewers
(8) LULUCF sector and emissions from international bunkers excluded. Due to independent rounding the sums may not necessarily add up.
(1) Total greenhouse gas emissions (GHG), GHG per capita, GHG per GDP and shares of GHG do not include emissions and removals from LULUCF (carbon sinks) and emissions from international bunkers.
(3) International bunkers: international aviation and international maritime transport.
(4) Gross domestic product (GDP) in 2005 market prices - not suitable for a ranking or quantitative comparison between countries for the same year. GDP information for the year 1990 is not available for some countries. For this reason, the 'GHG per GDP' values presented in the '1990' column correspond to the following years: 1991 (EU-15, Bulgaria, Germany, Hungary and Malta), 1992 (Slovakia), 1993 (EU-27 and Estonia) and 1995 (Croatia). Source GDP: Annual macro-economic database (AMECO), European Commission, 2012.
(2) Based on EEA estimate of 2011 emissions.
GHG trends and projections in Iceland
4.3 %
16.9 %
19.8 %
39.8 %
14.2 %
4.7 % 0.1 % Energy supply
Energy use (excluding transport)
Transport
Industrial processes
Agriculture
Waste
Other75.0 %
10.1 %
10.1 % 4.8 %
CO2
CH4
N2O
F-gases

Country profiles
121Greenhouse gas emission trends and projections in Europe 2012
GHG trends and projections 1990–2020 — total emissions
GHG trends 1990–2010 - emissions by sector
Source: National GHG inventory report, 2012.
Progress towards Kyoto target
Note: A positive value indicates emissions lower than the average target.
Average 2008–2010 emissions in Iceland were 1.5 % lower than the base-year level, well below the Kyoto target of 10 % for the period 2008–2012. LULUCF activities are expected to decrease net emissions by an annual amount equivalent to 13 % of base-year level emissions. Taking all these effects into account, average emissions Iceland were standing below their target level, by a gap representing 25.6 % of the base-year emissions. Iceland was therefore on track towards its Kyoto target by the end of 2010. These calculations take into account the provisions of COP Decision 14/CP.7, according to which any Annex I Party accounting for less than 0.05 % of all Annex I Parties 1990 emissions (as is the case for Iceland), can exclude from its national total emissions during the commitment period, the emissions from single projects provided that renewable energy is used, resulting in a reduction in GHG emissions per unit of production, and best environmental practice is used to minimize process emissions.
0.9
0.7 0.8
1.0
0.0
0.2
0.4
0.6
0.8
1.0
1.2
Average 2008 2009 2010 2011 2012
Dis
tanc
e to
tar
get
(Mt
CO
2 eq
uiva
lent
per
yea
r)
Difference between target and GHG emissions Expected carbon sequestration from forestry (LULUCF)Planned use of Kyoto mechanisms by governments ERU issuedTotal (actual progress)
0
1
2
3
4
5
6
1990 1995 2000 2005 2010 2015 2020
Mt
CO
2-eq
uiva
lent
Projections (with existing measures)
Projections (with additional measures)
Total emissions including bunkers
Total emissions excluding bunkers (KyotoProtocol)
CO2 emissions/removals from carbon sinks
Kyoto base year
Kyoto target
0.0
0.5
1.0
1.5
2.0
2.5
1990 1995 2000 2005 2010
Mt
CO
2 eq
uiva
lent
Energy supply
Energy use (excluding transport)
Transport
Agriculture
Industrial processes
Waste
International aviation and maritime transport
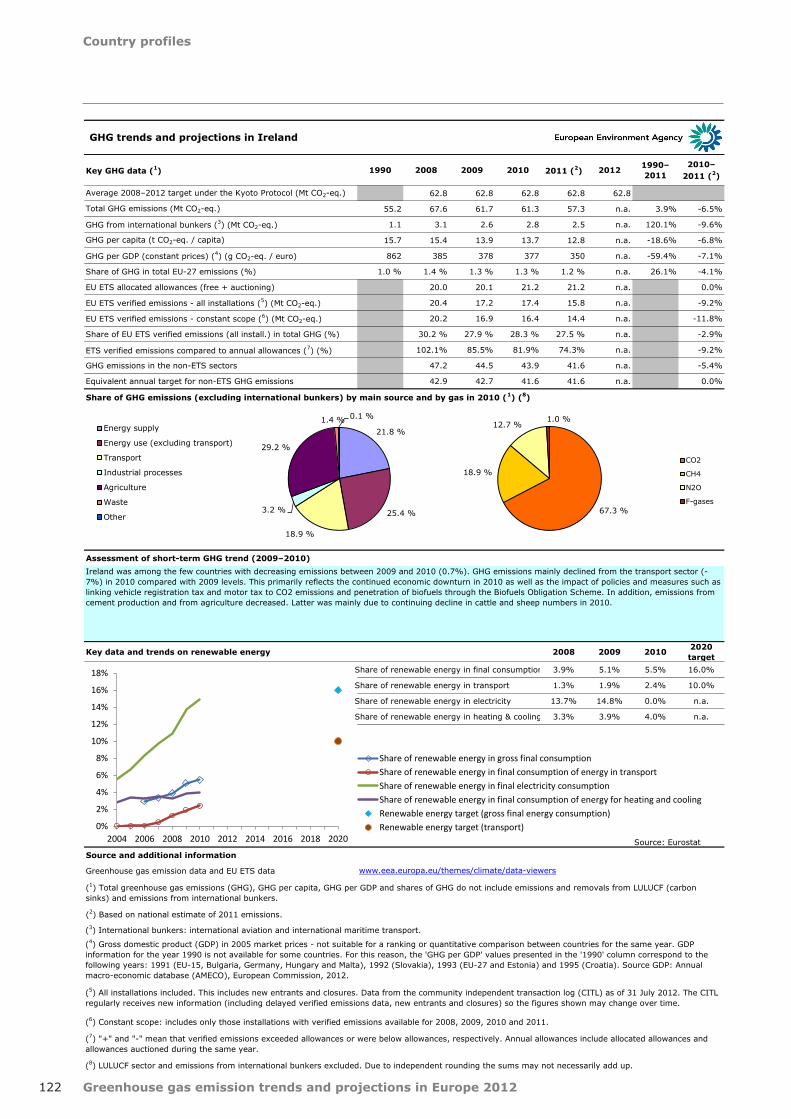
Country profiles
122 Greenhouse gas emission trends and projections in Europe 2012
Key GHG data (1) 1990 2008 2009 2010 2011 (2) 2012 1990–2011
2010–2011 (2)
Average 2008–2012 target under the Kyoto Protocol (Mt CO2-eq.) 62.8 62.8 62.8 62.8 62.8
Total GHG emissions (Mt CO2-eq.) 55.2 67.6 61.7 61.3 57.3 n.a. 3.9% -6.5%
GHG from international bunkers (3) (Mt CO2-eq.) 1.1 3.1 2.6 2.8 2.5 n.a. 120.1% -9.6%
GHG per capita (t CO2-eq. / capita) 15.7 15.4 13.9 13.7 12.8 n.a. -18.6% -6.8%
GHG per GDP (constant prices) (4) (g CO2-eq. / euro) 862 385 378 377 350 n.a. -59.4% -7.1%
Share of GHG in total EU-27 emissions (%) 1.0 % 1.4 % 1.3 % 1.3 % 1.2 % n.a. 26.1% -4.1%
EU ETS allocated allowances (free + auctioning) 20.0 20.1 21.2 21.2 n.a. 0.0%
EU ETS verified emissions - all installations (5) (Mt CO2-eq.) 20.4 17.2 17.4 15.8 n.a. -9.2%
EU ETS verified emissions - constant scope (6) (Mt CO2-eq.) 20.2 16.9 16.4 14.4 n.a. -11.8%
Share of EU ETS verified emissions (all install.) in total GHG (%) 30.2 % 27.9 % 28.3 % 27.5 % n.a. -2.9%
ETS verified emissions compared to annual allowances (7) (%) 102.1% 85.5% 81.9% 74.3% n.a. -9.2%
GHG emissions in the non-ETS sectors 47.2 44.5 43.9 41.6 n.a. -5.4%
Equivalent annual target for non-ETS GHG emissions 42.9 42.7 41.6 41.6 n.a. 0.0%
Share of GHG emissions (excluding international bunkers) by main source and by gas in 2010 (1) (8)
Assessment of short-term GHG trend (2009–2010)
Key data and trends on renewable energy 2008 2009 2010 2020 target
Share of renewable energy in final consumption 3.9% 5.1% 5.5% 16.0%
Share of renewable energy in transport 1.3% 1.9% 2.4% 10.0%
Share of renewable energy in electricity 13.7% 14.8% 0.0% n.a.
Share of renewable energy in heating & cooling 3.3% 3.9% 4.0% n.a.
Source: EurostatSource and additional information
Greenhouse gas emission data and EU ETS data
Ireland was among the few countries with decreasing emissions between 2009 and 2010 (0.7%). GHG emissions mainly declined from the transport sector (-7%) in 2010 compared with 2009 levels. This primarily reflects the continued economic downturn in 2010 as well as the impact of policies and measures such as linking vehicle registration tax and motor tax to CO2 emissions and penetration of biofuels through the Biofuels Obligation Scheme. In addition, emissions from cement production and from agriculture decreased. Latter was mainly due to continuing decline in cattle and sheep numbers in 2010.
www.eea.europa.eu/themes/climate/data-viewers
(5) All installations included. This includes new entrants and closures. Data from the community independent transaction log (CITL) as of 31 July 2012. The CITL regularly receives new information (including delayed verified emissions data, new entrants and closures) so the figures shown may change over time.
(7) "+" and "-" mean that verified emissions exceeded allowances or were below allowances, respectively. Annual allowances include allocated allowances and allowances auctioned during the same year.
(8) LULUCF sector and emissions from international bunkers excluded. Due to independent rounding the sums may not necessarily add up.
(6) Constant scope: includes only those installations with verified emissions available for 2008, 2009, 2010 and 2011.
(1) Total greenhouse gas emissions (GHG), GHG per capita, GHG per GDP and shares of GHG do not include emissions and removals from LULUCF (carbon sinks) and emissions from international bunkers.
(3) International bunkers: international aviation and international maritime transport.
(4) Gross domestic product (GDP) in 2005 market prices - not suitable for a ranking or quantitative comparison between countries for the same year. GDP information for the year 1990 is not available for some countries. For this reason, the 'GHG per GDP' values presented in the '1990' column correspond to the following years: 1991 (EU-15, Bulgaria, Germany, Hungary and Malta), 1992 (Slovakia), 1993 (EU-27 and Estonia) and 1995 (Croatia). Source GDP: Annual macro-economic database (AMECO), European Commission, 2012.
(2) Based on national estimate of 2011 emissions.
GHG trends and projections in Ireland
21.8 %
25.4 %
18.9 %
3.2 %
29.2 %
1.4 % 0.1 % Energy supply
Energy use (excluding transport)
Transport
Industrial processes
Agriculture
Waste
Other67.3 %
18.9 %
12.7 % 1.0 %
CO2
CH4
N2O
F-gases
0%
2%
4%
6%
8%
10%
12%
14%
16%
18%
2004 2006 2008 2010 2012 2014 2016 2018 2020
Share of renewable energy in gross final consumptionShare of renewable energy in final consumption of energy in transportShare of renewable energy in final electricity consumptionShare of renewable energy in final consumption of energy for heating and coolingRenewable energy target (gross final energy consumption)Renewable energy target (transport)
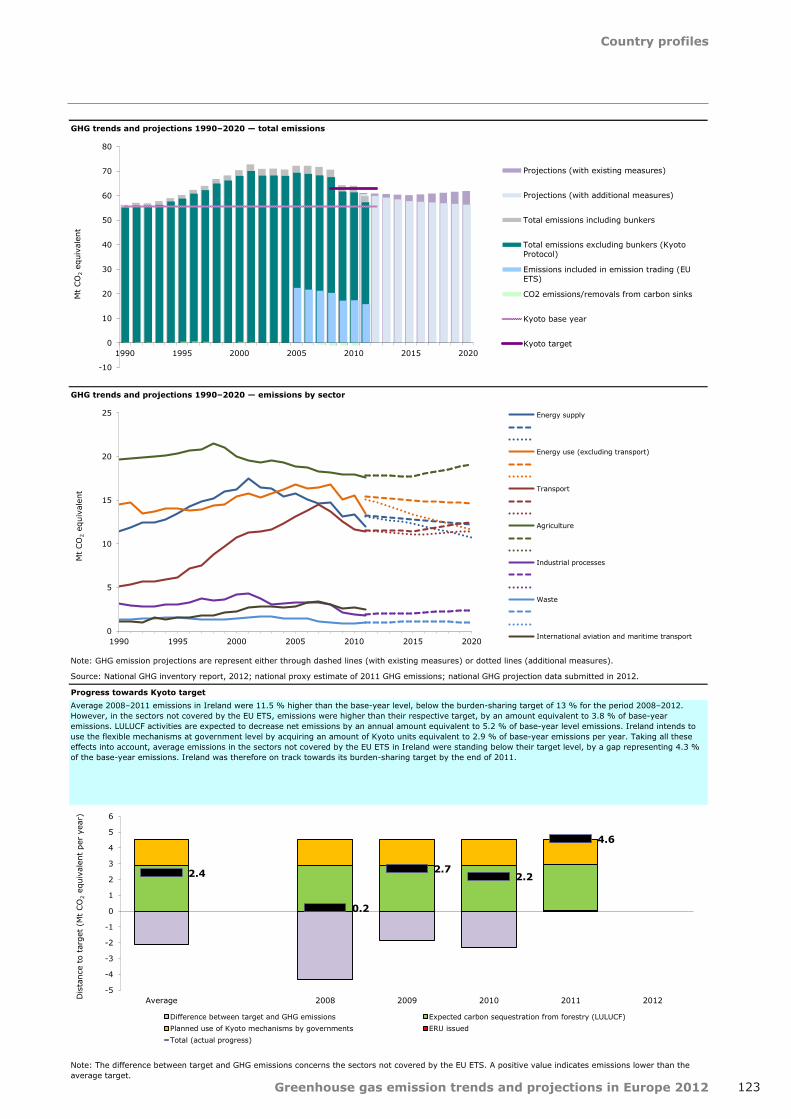
Country profiles
123Greenhouse gas emission trends and projections in Europe 2012
GHG trends and projections 1990–2020 — total emissions
GHG trends and projections 1990–2020 — emissions by sector
Progress towards Kyoto target
Note: The difference between target and GHG emissions concerns the sectors not covered by the EU ETS. A positive value indicates emissions lower than the average target.
Average 2008–2011 emissions in Ireland were 11.5 % higher than the base-year level, below the burden-sharing target of 13 % for the period 2008–2012. However, in the sectors not covered by the EU ETS, emissions were higher than their respective target, by an amount equivalent to 3.8 % of base-year emissions. LULUCF activities are expected to decrease net emissions by an annual amount equivalent to 5.2 % of base-year level emissions. Ireland intends to use the flexible mechanisms at government level by acquiring an amount of Kyoto units equivalent to 2.9 % of base-year emissions per year. Taking all these effects into account, average emissions in the sectors not covered by the EU ETS in Ireland were standing below their target level, by a gap representing 4.3 % of the base-year emissions. Ireland was therefore on track towards its burden-sharing target by the end of 2011.
Source: National GHG inventory report, 2012; national proxy estimate of 2011 GHG emissions; national GHG projection data submitted in 2012.
Note: GHG emission projections are represent either through dashed lines (with existing measures) or dotted lines (additional measures).
-10
0
10
20
30
40
50
60
70
80
1990 1995 2000 2005 2010 2015 2020
Mt
CO
2 eq
uiva
lent
Projections (with existing measures)
Projections (with additional measures)
Total emissions including bunkers
Total emissions excluding bunkers (KyotoProtocol)
Emissions included in emission trading (EUETS)
CO2 emissions/removals from carbon sinks
Kyoto base year
Kyoto target
0
5
10
15
20
25
1990 1995 2000 2005 2010 2015 2020
Mt
CO
2 eq
uiva
lent
Energy supply
Energy use (excluding transport)
Transport
Agriculture
Industrial processes
Waste
International aviation and maritime transport
2.4
0.2
2.7 2.2
4.6
-5
-4
-3
-2
-1
0
1
2
3
4
5
6
Average 2008 2009 2010 2011 2012Dis
tanc
e to
tar
get
(Mt
CO
2 eq
uiva
lent
per
yea
r)
Difference between target and GHG emissions Expected carbon sequestration from forestry (LULUCF)Planned use of Kyoto mechanisms by governments ERU issuedTotal (actual progress)
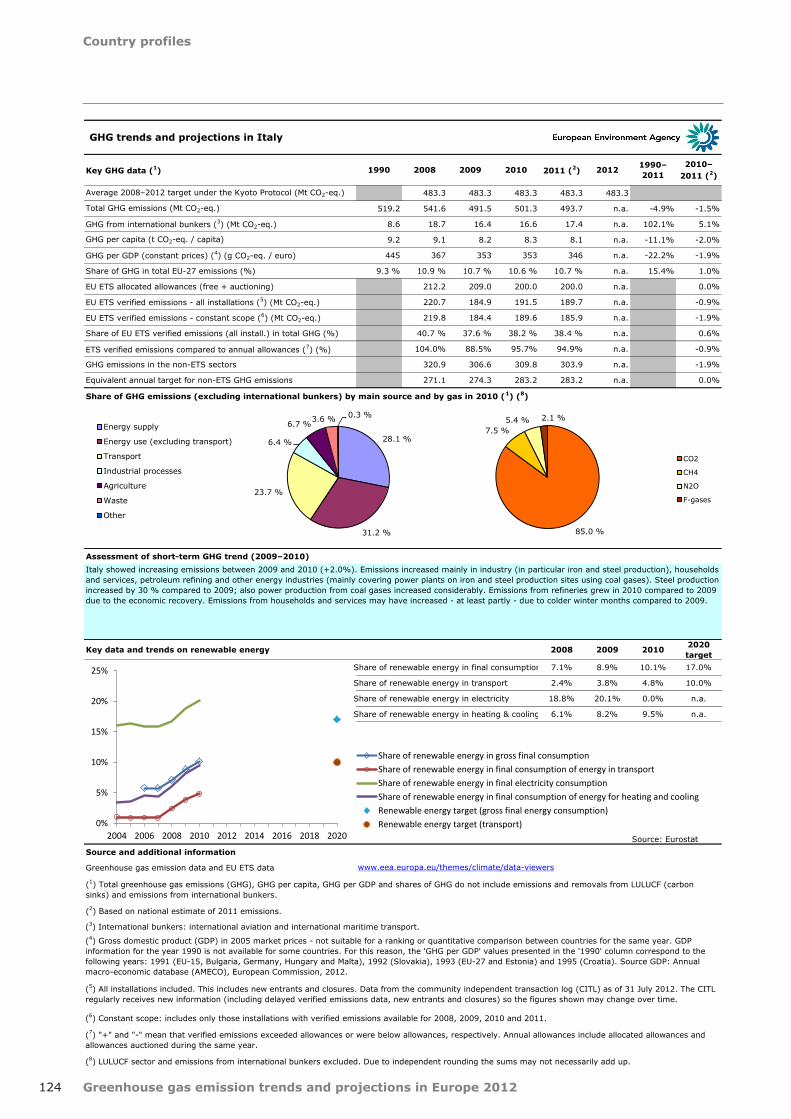
Country profiles
124 Greenhouse gas emission trends and projections in Europe 2012
Key GHG data (1) 1990 2008 2009 2010 2011 (2) 2012 1990–2011
2010–2011 (2)
Average 2008–2012 target under the Kyoto Protocol (Mt CO2-eq.) 483.3 483.3 483.3 483.3 483.3
Total GHG emissions (Mt CO2-eq.) 519.2 541.6 491.5 501.3 493.7 n.a. -4.9% -1.5%
GHG from international bunkers (3) (Mt CO2-eq.) 8.6 18.7 16.4 16.6 17.4 n.a. 102.1% 5.1%
GHG per capita (t CO2-eq. / capita) 9.2 9.1 8.2 8.3 8.1 n.a. -11.1% -2.0%
GHG per GDP (constant prices) (4) (g CO2-eq. / euro) 445 367 353 353 346 n.a. -22.2% -1.9%
Share of GHG in total EU-27 emissions (%) 9.3 % 10.9 % 10.7 % 10.6 % 10.7 % n.a. 15.4% 1.0%
EU ETS allocated allowances (free + auctioning) 212.2 209.0 200.0 200.0 n.a. 0.0%
EU ETS verified emissions - all installations (5) (Mt CO2-eq.) 220.7 184.9 191.5 189.7 n.a. -0.9%
EU ETS verified emissions - constant scope (6) (Mt CO2-eq.) 219.8 184.4 189.6 185.9 n.a. -1.9%
Share of EU ETS verified emissions (all install.) in total GHG (%) 40.7 % 37.6 % 38.2 % 38.4 % n.a. 0.6%
ETS verified emissions compared to annual allowances (7) (%) 104.0% 88.5% 95.7% 94.9% n.a. -0.9%
GHG emissions in the non-ETS sectors 320.9 306.6 309.8 303.9 n.a. -1.9%
Equivalent annual target for non-ETS GHG emissions 271.1 274.3 283.2 283.2 n.a. 0.0%
Share of GHG emissions (excluding international bunkers) by main source and by gas in 2010 (1) (8)
Assessment of short-term GHG trend (2009–2010)
Key data and trends on renewable energy 2008 2009 2010 2020 target
Share of renewable energy in final consumption 7.1% 8.9% 10.1% 17.0%
Share of renewable energy in transport 2.4% 3.8% 4.8% 10.0%
Share of renewable energy in electricity 18.8% 20.1% 0.0% n.a.
Share of renewable energy in heating & cooling 6.1% 8.2% 9.5% n.a.
Source: EurostatSource and additional information
Greenhouse gas emission data and EU ETS data
Italy showed increasing emissions between 2009 and 2010 (+2.0%). Emissions increased mainly in industry (in particular iron and steel production), households and services, petroleum refining and other energy industries (mainly covering power plants on iron and steel production sites using coal gases). Steel production increased by 30 % compared to 2009; also power production from coal gases increased considerably. Emissions from refineries grew in 2010 compared to 2009 due to the economic recovery. Emissions from households and services may have increased - at least partly - due to colder winter months compared to 2009.
www.eea.europa.eu/themes/climate/data-viewers
(5) All installations included. This includes new entrants and closures. Data from the community independent transaction log (CITL) as of 31 July 2012. The CITL regularly receives new information (including delayed verified emissions data, new entrants and closures) so the figures shown may change over time.
(7) "+" and "-" mean that verified emissions exceeded allowances or were below allowances, respectively. Annual allowances include allocated allowances and allowances auctioned during the same year.
(8) LULUCF sector and emissions from international bunkers excluded. Due to independent rounding the sums may not necessarily add up.
(6) Constant scope: includes only those installations with verified emissions available for 2008, 2009, 2010 and 2011.
(1) Total greenhouse gas emissions (GHG), GHG per capita, GHG per GDP and shares of GHG do not include emissions and removals from LULUCF (carbon sinks) and emissions from international bunkers.
(3) International bunkers: international aviation and international maritime transport.
(4) Gross domestic product (GDP) in 2005 market prices - not suitable for a ranking or quantitative comparison between countries for the same year. GDP information for the year 1990 is not available for some countries. For this reason, the 'GHG per GDP' values presented in the '1990' column correspond to the following years: 1991 (EU-15, Bulgaria, Germany, Hungary and Malta), 1992 (Slovakia), 1993 (EU-27 and Estonia) and 1995 (Croatia). Source GDP: Annual macro-economic database (AMECO), European Commission, 2012.
(2) Based on national estimate of 2011 emissions.
GHG trends and projections in Italy
28.1 %
31.2 %
23.7 %
6.4 %
6.7 % 3.6 % 0.3 % Energy supply
Energy use (excluding transport)
Transport
Industrial processes
Agriculture
Waste
Other
85.0 %
7.5 % 5.4 % 2.1 %
CO2
CH4
N2O
F-gases
0%
5%
10%
15%
20%
25%
2004 2006 2008 2010 2012 2014 2016 2018 2020
Share of renewable energy in gross final consumptionShare of renewable energy in final consumption of energy in transportShare of renewable energy in final electricity consumptionShare of renewable energy in final consumption of energy for heating and coolingRenewable energy target (gross final energy consumption)Renewable energy target (transport)

Country profiles
125Greenhouse gas emission trends and projections in Europe 2012
GHG trends and projections 1990–2020 — total emissions
GHG trends and projections 1990–2020 — emissions by sector
Progress towards Kyoto target
Note: The difference between target and GHG emissions concerns the sectors not covered by the EU ETS. A positive value indicates emissions lower than the average target.
Average 2008–2011 emissions in Italy were 1.9 % lower than the base-year level, above the burden-sharing target of -6.5 % for the period 2008–2012. In the sectors not covered by the EU ETS, emissions were significantly higher than their respective target, by an amount equivalent to 6.3 % of base-year emissions. LULUCF activities are expected to decrease net emissions by an annual amount equivalent to 3.2 % of base-year level emissions. Italy intends to use the flexible mechanisms at government level by acquiring an amount of Kyoto units equivalent to 0.4 % of base-year emissions per year. Taking all these effects into account, average emissions in the sectors not covered by the EU ETS in Italy were standing above their target level, by a gap representing 2.7 % of the base-year emissions. Italy was therefore not on track towards its burden-sharing target by the end of 2011. Although it did not put a threshold on the use of flexible mechanisms in its national climate change strategy, Italy has not reported any concrete plan to purchase more Kyoto units than those already envisaged. Furthermore, Italy is the only EU‑15 Member State using flexible mechanisms that has not provided information as to the allocation of financial resources for using the Kyoto mechanisms.
Note: GHG emission projections are represent either through dashed lines (with existing measures) or dotted lines (additional measures).
Source: National GHG inventory report, 2012; national proxy estimate of 2011 GHG emissions; national GHG projection data submitted in 2011.
-100
0
100
200
300
400
500
600
700
1990 1995 2000 2005 2010 2015 2020
Mt
CO
2 eq
uiva
lent
Projections (with existing measures)
Projections (with additional measures)
Total emissions including bunkers
Total emissions excluding bunkers (KyotoProtocol)
Emissions included in emission trading (EUETS)
CO2 emissions/removals from carbon sinks
Kyoto base year
Kyoto target
0
20
40
60
80
100
120
140
160
180
200
1990 1995 2000 2005 2010 2015 2020
Mt
CO
2 eq
uiva
lent
Energy supply
Energy use (excluding transport)
Transport
Agriculture
Industrial processes
Waste
International aviation and maritime transport
-14.1
-31.5
-14.1 -8.3
-2.4
-60
-50
-40
-30
-20
-10
0
10
20
30
Average 2008 2009 2010 2011 2012Dis
tanc
e to
tar
get
(Mt
CO
2 eq
uiva
lent
per
yea
r)
Difference between target and GHG emissions Expected carbon sequestration from forestry (LULUCF)Planned use of Kyoto mechanisms by governments ERU issuedTotal (actual progress)
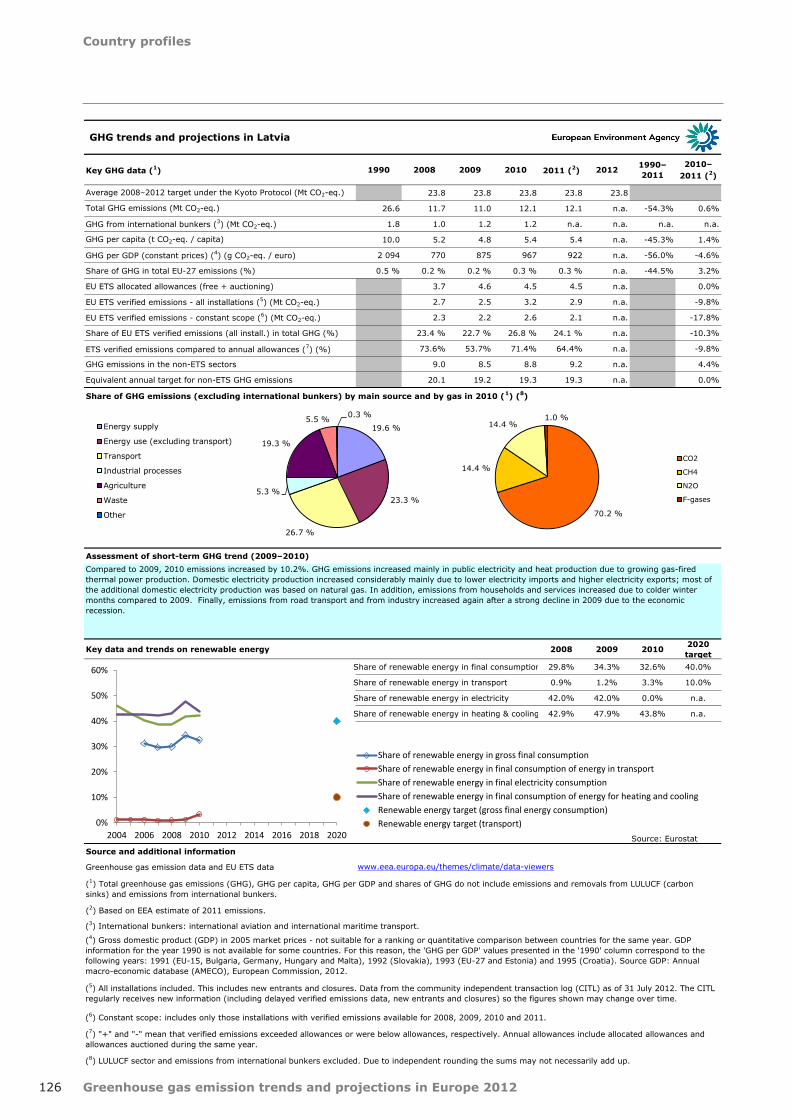
Country profiles
126 Greenhouse gas emission trends and projections in Europe 2012
Key GHG data (1) 1990 2008 2009 2010 2011 (2) 2012 1990–2011
2010–2011 (2)
Average 2008–2012 target under the Kyoto Protocol (Mt CO2-eq.) 23.8 23.8 23.8 23.8 23.8
Total GHG emissions (Mt CO2-eq.) 26.6 11.7 11.0 12.1 12.1 n.a. -54.3% 0.6%
GHG from international bunkers (3) (Mt CO2-eq.) 1.8 1.0 1.2 1.2 n.a. n.a. n.a. n.a.
GHG per capita (t CO2-eq. / capita) 10.0 5.2 4.8 5.4 5.4 n.a. -45.3% 1.4%
GHG per GDP (constant prices) (4) (g CO2-eq. / euro) 2 094 770 875 967 922 n.a. -56.0% -4.6%
Share of GHG in total EU-27 emissions (%) 0.5 % 0.2 % 0.2 % 0.3 % 0.3 % n.a. -44.5% 3.2%
EU ETS allocated allowances (free + auctioning) 3.7 4.6 4.5 4.5 n.a. 0.0%
EU ETS verified emissions - all installations (5) (Mt CO2-eq.) 2.7 2.5 3.2 2.9 n.a. -9.8%
EU ETS verified emissions - constant scope (6) (Mt CO2-eq.) 2.3 2.2 2.6 2.1 n.a. -17.8%
Share of EU ETS verified emissions (all install.) in total GHG (%) 23.4 % 22.7 % 26.8 % 24.1 % n.a. -10.3%
ETS verified emissions compared to annual allowances (7) (%) 73.6% 53.7% 71.4% 64.4% n.a. -9.8%
GHG emissions in the non-ETS sectors 9.0 8.5 8.8 9.2 n.a. 4.4%
Equivalent annual target for non-ETS GHG emissions 20.1 19.2 19.3 19.3 n.a. 0.0%
Share of GHG emissions (excluding international bunkers) by main source and by gas in 2010 (1) (8)
Assessment of short-term GHG trend (2009–2010)
Key data and trends on renewable energy 2008 2009 2010 2020 target
Share of renewable energy in final consumption 29.8% 34.3% 32.6% 40.0%
Share of renewable energy in transport 0.9% 1.2% 3.3% 10.0%
Share of renewable energy in electricity 42.0% 42.0% 0.0% n.a.
Share of renewable energy in heating & cooling 42.9% 47.9% 43.8% n.a.
Source: EurostatSource and additional information
Greenhouse gas emission data and EU ETS data
Compared to 2009, 2010 emissions increased by 10.2%. GHG emissions increased mainly in public electricity and heat production due to growing gas-fired thermal power production. Domestic electricity production increased considerably mainly due to lower electricity imports and higher electricity exports; most of the additional domestic electricity production was based on natural gas. In addition, emissions from households and services increased due to colder winter months compared to 2009. Finally, emissions from road transport and from industry increased again after a strong decline in 2009 due to the economic recession.
www.eea.europa.eu/themes/climate/data-viewers
(5) All installations included. This includes new entrants and closures. Data from the community independent transaction log (CITL) as of 31 July 2012. The CITL regularly receives new information (including delayed verified emissions data, new entrants and closures) so the figures shown may change over time.
(7) "+" and "-" mean that verified emissions exceeded allowances or were below allowances, respectively. Annual allowances include allocated allowances and allowances auctioned during the same year.
(8) LULUCF sector and emissions from international bunkers excluded. Due to independent rounding the sums may not necessarily add up.
(6) Constant scope: includes only those installations with verified emissions available for 2008, 2009, 2010 and 2011.
(1) Total greenhouse gas emissions (GHG), GHG per capita, GHG per GDP and shares of GHG do not include emissions and removals from LULUCF (carbon sinks) and emissions from international bunkers.
(3) International bunkers: international aviation and international maritime transport.
(4) Gross domestic product (GDP) in 2005 market prices - not suitable for a ranking or quantitative comparison between countries for the same year. GDP information for the year 1990 is not available for some countries. For this reason, the 'GHG per GDP' values presented in the '1990' column correspond to the following years: 1991 (EU-15, Bulgaria, Germany, Hungary and Malta), 1992 (Slovakia), 1993 (EU-27 and Estonia) and 1995 (Croatia). Source GDP: Annual macro-economic database (AMECO), European Commission, 2012.
(2) Based on EEA estimate of 2011 emissions.
GHG trends and projections in Latvia
19.6 %
23.3 %
26.7 %
5.3 %
19.3 %
5.5 % 0.3 % Energy supply
Energy use (excluding transport)
Transport
Industrial processes
Agriculture
Waste
Other 70.2 %
14.4 %
14.4 % 1.0 %
CO2
CH4
N2O
F-gases
0%
10%
20%
30%
40%
50%
60%
2004 2006 2008 2010 2012 2014 2016 2018 2020
Share of renewable energy in gross final consumptionShare of renewable energy in final consumption of energy in transportShare of renewable energy in final electricity consumptionShare of renewable energy in final consumption of energy for heating and coolingRenewable energy target (gross final energy consumption)Renewable energy target (transport)

Country profiles
127Greenhouse gas emission trends and projections in Europe 2012
GHG trends and projections 1990–2020 — total emissions
GHG trends and projections 1990–2020 — emissions by sector
Progress towards Kyoto target
Note: The difference between target and GHG emissions concerns the sectors not covered by the EU ETS. A positive value indicates emissions lower than the average target.
Average 2008–2011 emissions in Latvia were 54.7 % lower than the base-year level, well below the Kyoto target of -8 % for the period 2008–2012. In the sectors not covered by the EU ETS, emissions were significantly lower than their respective target, by an amount equivalent to 40.9 % of base-year emissions. LULUCF activities are expected to decrease net emissions by an annual amount equivalent to 5.1 % of base-year level emissions. Latvia intends to use the flexible mechanisms at government level by selling an amount of Kyoto units equivalent to 32.4 % of base-year emissions per year. Taking all these effects into account, average emissions in the sectors not covered by the EU ETS in Latvia were standing below their target level, by a gap representing 13.6 % of the base-year emissions. Latvia was therefore on track towards its Kyoto target by the end of 2011.
Note: GHG emission projections are represent either through dashed lines (with existing measures) or dotted lines (additional measures).
Source: National GHG inventory report, 2012; EEA proxy estimate of 2011 GHG emissions; national GHG projection data submitted in 2011.
-30
-20
-10
0
10
20
30
40
1990 1995 2000 2005 2010 2015 2020
Mt
CO
2 eq
uiva
lent
Projections (with existing measures)
Projections (with additional measures)
Total emissions including bunkers
Total emissions excluding bunkers (KyotoProtocol)
Emissions included in emission trading (EUETS)
CO2 emissions/removals from carbon sinks
Kyoto base year
Kyoto target
0
2
4
6
8
10
12
1990 1995 2000 2005 2010 2015 2020
Mt
CO
2 eq
uiva
lent
Energy supply
Energy use (excluding transport)
Transport
Agriculture
Industrial processes
Waste
International aviation and maritime transport
3.5 4.1 3.7 3.4 3.0
-10
-5
0
5
10
15
Average 2008 2009 2010 2011 2012Dis
tanc
e to
tar
get
(Mt
CO
2 eq
uiva
lent
per
yea
r)
Difference between target and GHG emissions Expected carbon sequestration from forestry (LULUCF)Planned use of Kyoto mechanisms by governments ERU issuedTotal (actual progress)

Country profiles
128 Greenhouse gas emission trends and projections in Europe 2012
Key GHG data (1) 1990 2008 2009 2010 2011 (2) 2012 1990–2011
2010–2011 (2)
Average 2008–2012 target under the Kyoto Protocol (Mt CO2-eq.) 0.211 0.211 0.211 0.211 0.211
Total GHG emissions (Mt CO2-eq.) 0.231 0.265 0.249 0.233 n.a. n.a. n.a. n.a.
GHG from international bunkers (3) (Mt CO2-eq.) 0.000 0.001 0.001 0.001 n.a. n.a. n.a. n.a.
GHG per capita (t CO2-eq. / capita) 8.1 7.5 7.0 6.5 n.a. n.a. n.a. n.a.
GHG per GDP (constant prices) (4) (g CO2-eq. / euro) n.a n.a n.a n.a n.a. n.a. n.a. n.a.
EU ETS allocated allowances (free + auctioning) 0.021 0.019 0.018 0.018 n.a. 0.0%
EU ETS verified emissions - all installations (5) (Mt CO2-eq.) 0.020 0.013 0.002 n.a. n.a. n.a.
Share of EU ETS verified emissions (all install.) in total GHG (%) 7.5 % 5.4 % 0.8 % n.a. n.a. n.a.
ETS verified emissions compared to annual allowances (7) (%) 94.2% 68.6% 10.2% n.a. n.a. n.a.
GHG emissions in the non-ETS sectors 0.245 0.235 0.231 n.a. n.a. n.a.
Equivalent annual target for non-ETS GHG emissions 0.190 0.192 0.194 0.194 n.a. 0.0%
Share of GHG emissions (excluding international bunkers) by main source and by gas in 2010 (1) (8)
Assessment of short-term GHG trend (2009–2010)
Source and additional information
Greenhouse gas emission data and EU ETS data
Liechtenstein was among the countries with decreasing emissons between 2009 and 2010 (-6.2%). Since 2008 GHG emissions in the residential sector have constantly decreased until 2010. This negative trend can partly be attributed to the installation of a new district heating pipeline, that was considered stepwise in 2009 and 2010. Furthermore the various emission reduction measures in Liechtenstein, such as the increase of the CO2-tax in 2010, might have resulted in a respective decrease.
www.eea.europa.eu/themes/climate/data-viewers
(8) LULUCF sector and emissions from international bunkers excluded. Due to independent rounding the sums may not necessarily add up.
(1) Total greenhouse gas emissions (GHG), GHG per capita, GHG per GDP and shares of GHG do not include emissions and removals from LULUCF (carbon sinks) and emissions from international bunkers.
(3) International bunkers: international aviation and international maritime transport.
(4) Gross domestic product (GDP) in 2005 market prices - not suitable for a ranking or quantitative comparison between countries for the same year. GDP information for the year 1990 is not available for some countries. For this reason, the 'GHG per GDP' values presented in the '1990' column correspond to the following years: 1991 (EU-15, Bulgaria, Germany, Hungary and Malta), 1992 (Slovakia), 1993 (EU-27 and Estonia) and 1995 (Croatia). Source GDP: Annual macro-economic database (AMECO), European Commission, 2012.
(2) Based on EEA estimate of 2011 emissions.
GHG trends and projections in Liechtenstein
1.8 %
50.2 %
34.4 %
2.9 %
9.7 % 0.7 % 0.2 % Energy supply
Energy use (excluding transport)
Transport
Industrial processes
Agriculture
Waste
Other
85.3 %
6.5 % 5.3 % 2.9 %
CO2
CH4
N2O
F-gases
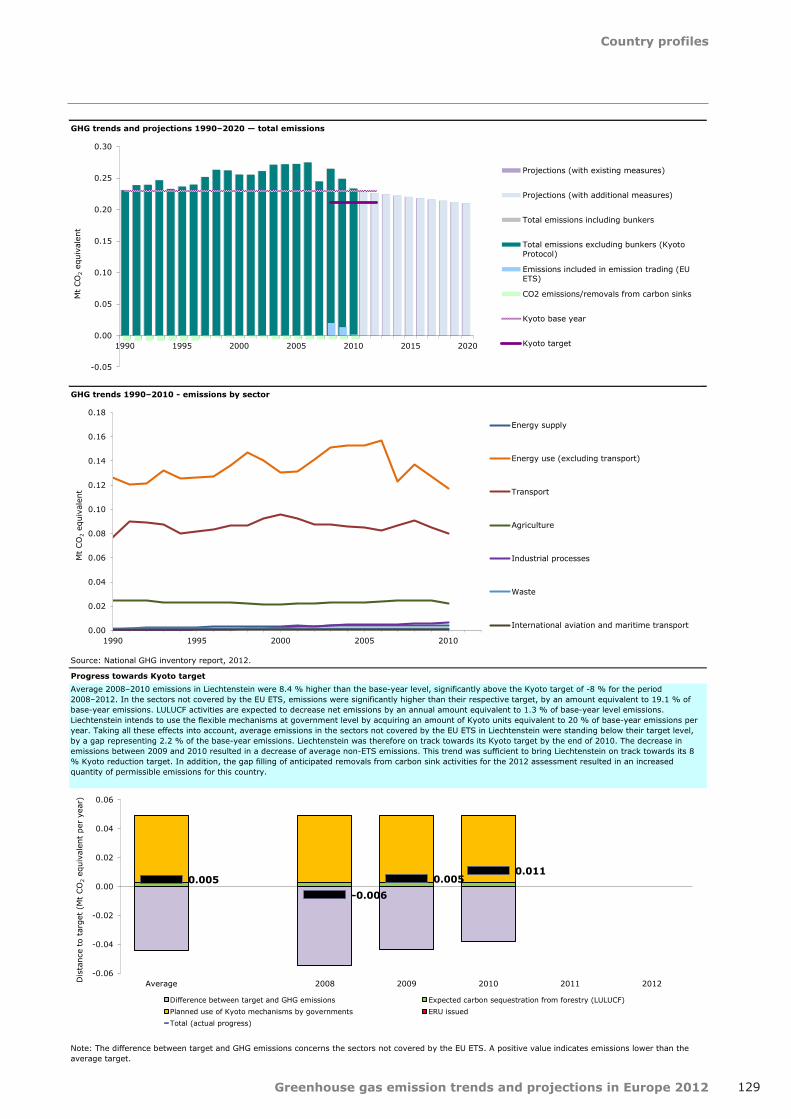
Country profiles
129Greenhouse gas emission trends and projections in Europe 2012
GHG trends and projections 1990–2020 — total emissions
GHG trends 1990–2010 - emissions by sector
Source: National GHG inventory report, 2012.
Progress towards Kyoto target
Note: The difference between target and GHG emissions concerns the sectors not covered by the EU ETS. A positive value indicates emissions lower than the average target.
Average 2008–2010 emissions in Liechtenstein were 8.4 % higher than the base-year level, significantly above the Kyoto target of -8 % for the period 2008–2012. In the sectors not covered by the EU ETS, emissions were significantly higher than their respective target, by an amount equivalent to 19.1 % of base-year emissions. LULUCF activities are expected to decrease net emissions by an annual amount equivalent to 1.3 % of base-year level emissions. Liechtenstein intends to use the flexible mechanisms at government level by acquiring an amount of Kyoto units equivalent to 20 % of base-year emissions per year. Taking all these effects into account, average emissions in the sectors not covered by the EU ETS in Liechtenstein were standing below their target level, by a gap representing 2.2 % of the base-year emissions. Liechtenstein was therefore on track towards its Kyoto target by the end of 2010. The decrease in emissions between 2009 and 2010 resulted in a decrease of average non-ETS emissions. This trend was sufficient to bring Liechtenstein on track towards its 8 % Kyoto reduction target. In addition, the gap filling of anticipated removals from carbon sink activities for the 2012 assessment resulted in an increased quantity of permissible emissions for this country.
-0.05
0.00
0.05
0.10
0.15
0.20
0.25
0.30
1990 1995 2000 2005 2010 2015 2020
Mt
CO
2 eq
uiva
lent
Projections (with existing measures)
Projections (with additional measures)
Total emissions including bunkers
Total emissions excluding bunkers (KyotoProtocol)
Emissions included in emission trading (EUETS)
CO2 emissions/removals from carbon sinks
Kyoto base year
Kyoto target
0.00
0.02
0.04
0.06
0.08
0.10
0.12
0.14
0.16
0.18
1990 1995 2000 2005 2010
Mt
CO
2 eq
uiva
lent
Energy supply
Energy use (excluding transport)
Transport
Agriculture
Industrial processes
Waste
International aviation and maritime transport
0.005 -0.006
0.005 0.011
-0.06
-0.04
-0.02
0.00
0.02
0.04
0.06
Average 2008 2009 2010 2011 2012Dis
tanc
e to
tar
get
(Mt
CO
2 eq
uiva
lent
per
yea
r)
Difference between target and GHG emissions Expected carbon sequestration from forestry (LULUCF)Planned use of Kyoto mechanisms by governments ERU issuedTotal (actual progress)

Country profiles
130 Greenhouse gas emission trends and projections in Europe 2012
Key GHG data (1) 1990 2008 2009 2010 2011 (2) 2012 1990–2011
2010–2011 (2)
Average 2008–2012 target under the Kyoto Protocol (Mt CO2-eq.) 45.5 45.5 45.5 45.5 45.5
Total GHG emissions (Mt CO2-eq.) 49.4 24.3 20.0 20.8 21.4 n.a. -56.7% 2.8%
GHG from international bunkers (3) (Mt CO2-eq.) 0.7 0.5 0.5 0.6 n.a. n.a. n.a. n.a.
GHG per capita (t CO2-eq. / capita) 13.4 7.2 6.0 6.3 6.6 n.a. -50.7% 5.5%
GHG per GDP (constant prices) (4) (g CO2-eq. / euro) 2 481 953 918 943 916 n.a. -63.1% -2.9%
Share of GHG in total EU-27 emissions (%) 0.9 % 0.5 % 0.4 % 0.4 % 0.5 % n.a. -47.5% 5.5%
EU ETS allocated allowances (free + auctioning) 7.5 7.6 8.2 9.0 n.a. 10.4%
EU ETS verified emissions - all installations (5) (Mt CO2-eq.) 6.1 5.8 6.4 5.6 n.a. -12.3%
EU ETS verified emissions - constant scope (6) (Mt CO2-eq.) 6.1 5.8 6.4 5.6 n.a. -12.3%
Share of EU ETS verified emissions (all install.) in total GHG (%) 25.1 % 29.0 % 30.7 % 26.2 % n.a. -14.7%
ETS verified emissions compared to annual allowances (7) (%) 81.3% 76.5% 78.4% 62.3% n.a. -20.6%
GHG emissions in the non-ETS sectors 18.2 14.2 14.4 15.8 n.a. 9.5%
Equivalent annual target for non-ETS GHG emissions 38.0 37.9 37.3 36.5 n.a. -2.3%
Share of GHG emissions (excluding international bunkers) by main source and by gas in 2010 (1) (8)
Assessment of short-term GHG trend (2009–2010)
Key data and trends on renewable energy 2008 2009 2010 2020 target
Share of renewable energy in final consumption 17.9% 20.0% 19.7% 23.0%
Share of renewable energy in transport 4.1% 4.2% 3.6% 10.0%
Share of renewable energy in electricity 5.9% 7.4% 0.0% n.a.
Share of renewable energy in heating & cooling 32.7% 34.5% 33.0% n.a.
Source: EurostatSource and additional information
Greenhouse gas emission data and EU ETS data
In 2010 emissions increased by 4.3% compared to 2009. GHG emissions increased mainly in public electricity and heat production due to growing gas-based thermal power production. After the closure of Ignalina nuclear power plant in 2009 thermal power production based on natural gas is the most important source of electricity production in Lithuania. In addition, emissions from households and services increased due to colder winter months compared to 2009. Finally, emissions from road transport and from industry increased reflecting the gradual economic recovery after the strong decline in 2009.
www.eea.europa.eu/themes/climate/data-viewers
(5) All installations included. This includes new entrants and closures. Data from the community independent transaction log (CITL) as of 31 July 2012. The CITL regularly receives new information (including delayed verified emissions data, new entrants and closures) so the figures shown may change over time.
(7) "+" and "-" mean that verified emissions exceeded allowances or were below allowances, respectively. Annual allowances include allocated allowances and allowances auctioned during the same year.
(8) LULUCF sector and emissions from international bunkers excluded. Due to independent rounding the sums may not necessarily add up.
(6) Constant scope: includes only those installations with verified emissions available for 2008, 2009, 2010 and 2011.
(1) Total greenhouse gas emissions (GHG), GHG per capita, GHG per GDP and shares of GHG do not include emissions and removals from LULUCF (carbon sinks) and emissions from international bunkers.
(3) International bunkers: international aviation and international maritime transport.
(4) Gross domestic product (GDP) in 2005 market prices - not suitable for a ranking or quantitative comparison between countries for the same year. GDP information for the year 1990 is not available for some countries. For this reason, the 'GHG per GDP' values presented in the '1990' column correspond to the following years: 1991 (EU-15, Bulgaria, Germany, Hungary and Malta), 1992 (Slovakia), 1993 (EU-27 and Estonia) and 1995 (Croatia). Source GDP: Annual macro-economic database (AMECO), European Commission, 2012.
(2) Based on EEA estimate of 2011 emissions.
GHG trends and projections in Lithuania
27.5 %
12.3 %
21.9 %
10.8 %
21.4 %
5.6 % 0.4 % Energy supply
Energy use (excluding transport)
Transport
Industrial processes
Agriculture
Waste
Other66.5 %
15.4 %
17.2 % 0.9 %
CO2
CH4
N2O
F-gases
0%
5%
10%
15%
20%
25%
30%
35%
40%
2004 2006 2008 2010 2012 2014 2016 2018 2020
Share of renewable energy in gross final consumptionShare of renewable energy in final consumption of energy in transportShare of renewable energy in final electricity consumptionShare of renewable energy in final consumption of energy for heating and coolingRenewable energy target (gross final energy consumption)Renewable energy target (transport)

Country profiles
131Greenhouse gas emission trends and projections in Europe 2012
GHG trends and projections 1990–2020 — total emissions
GHG trends and projections 1990–2020 — emissions by sector
Progress towards Kyoto target
Note: The difference between target and GHG emissions concerns the sectors not covered by the EU ETS. A positive value indicates emissions lower than the average target.
Average 2008–2011 emissions in Lithuania were 56.2 % lower than the base-year level, well below the Kyoto target of -8 % for the period 2008–2012. In the sectors not covered by the EU ETS, emissions were significantly lower than their respective target, by an amount equivalent to 44 % of base-year emissions. LULUCF activities are expected to decrease net emissions by an annual amount equivalent to 2.3 % of base-year level emissions. Lithuania intends to use the flexible mechanisms at government level by selling an amount of Kyoto units equivalent to 28.6 % of base-year emissions per year. Taking all these effects into account, average emissions in the sectors not covered by the EU ETS in Lithuania were standing below their target level, by a gap representing 17.7 % of the base-year emissions. Lithuania was therefore on track towards its Kyoto target by the end of 2011.
Note: GHG emission projections are represent either through dashed lines (with existing measures) or dotted lines (additional measures).
Source: National GHG inventory report, 2012; EEA proxy estimate of 2011 GHG emissions; national GHG projection data submitted in 2011.
-20
-10
0
10
20
30
40
50
60
1990 1995 2000 2005 2010 2015 2020
Mt
CO
2 eq
uiva
lent
Projections (with existing measures)
Projections (with additional measures)
Total emissions including bunkers
Total emissions excluding bunkers (KyotoProtocol)
Emissions included in emission trading (EUETS)
CO2 emissions/removals from carbon sinks
Kyoto base year
Kyoto target
0
2
4
6
8
10
12
14
16
18
1990 1995 2000 2005 2010 2015 2020
Mt
CO
2 eq
uiva
lent
Energy supply
Energy use (excluding transport)
Transport
Agriculture
Industrial processes
Waste
International aviation and maritime transport
8.7 6.7
10.7 9.9 7.7
-20
-15
-10
-5
0
5
10
15
20
25
30
Average 2008 2009 2010 2011 2012Dis
tanc
e to
tar
get
(Mt
CO
2 eq
uiva
lent
per
yea
r)
Difference between target and GHG emissions Expected carbon sequestration from forestry (LULUCF)Planned use of Kyoto mechanisms by governments ERU issuedTotal (actual progress)

Country profiles
132 Greenhouse gas emission trends and projections in Europe 2012
Key GHG data (1) 1990 2008 2009 2010 2011 (2) 2012 1990–2011
2010–2011 (2)
Average 2008–2012 target under the Kyoto Protocol (Mt CO2-eq.) 9.5 9.5 9.5 9.5 9.5
Total GHG emissions (Mt CO2-eq.) 12.8 12.0 11.5 12.1 12.3 n.a. -4.2% 1.8%
GHG from international bunkers (3) (Mt CO2-eq.) 0.4 1.3 1.3 1.3 n.a. n.a. n.a. n.a.
GHG per capita (t CO2-eq. / capita) 33.8 24.9 23.3 24.1 24.0 n.a. -29.0% -0.2%
GHG per GDP (constant prices) (4) (g CO2-eq. / euro) 826 353 356 364 364 n.a. -55.9% 0.2%
Share of GHG in total EU-27 emissions (%) 0.2 % 0.2 % 0.2 % 0.3 % 0.3 % n.a. 16.2% 4.4%
EU ETS allocated allowances (free + auctioning) 2.5 2.5 2.5 2.5 n.a. 0.0%
EU ETS verified emissions - all installations (5) (Mt CO2-eq.) 2.1 2.2 2.3 2.1 n.a. -8.9%
EU ETS verified emissions - constant scope (6) (Mt CO2-eq.) 2.1 2.2 2.3 2.1 n.a. -8.9%
Share of EU ETS verified emissions (all install.) in total GHG (%) 17.4 % 18.9 % 18.7 % 16.7 % n.a. -10.5%
ETS verified emissions compared to annual allowances (7) (%) 84.4% 87.7% 90.5% 82.5% n.a. -8.9%
GHG emissions in the non-ETS sectors 9.9 9.3 9.8 10.2 n.a. 4.2%
Equivalent annual target for non-ETS GHG emissions 7.0 7.0 7.0 7.0 n.a. 0.0%
Share of GHG emissions (excluding international bunkers) by main source and by gas in 2010 (1) (8)
Assessment of short-term GHG trend (2009–2010)
Key data and trends on renewable energy 2008 2009 2010 2020 target
Share of renewable energy in final consumption 2.8% 2.8% 2.8% 11.0%
Share of renewable energy in transport 2.1% 2.2% 2.0% 10.0%
Share of renewable energy in electricity 4.1% 3.8% 0.0% n.a.
Share of renewable energy in heating & cooling 4.8% 4.6% 5.0% n.a.
Source: EurostatSource and additional information
Greenhouse gas emission data and EU ETS data
In 2010 emissions increased by 4.9% compared to 2009, mainly due to the increase of heavy good transportation after the decline in 2009 caused by the economic crisis. In addition, emissions increased from industry, in particular iron and steel production, and from electricity and heat production. The latter was mainly due to growing electricity demand which was partly met by increased thermal power production.
www.eea.europa.eu/themes/climate/data-viewers
(5) All installations included. This includes new entrants and closures. Data from the community independent transaction log (CITL) as of 31 July 2012. The CITL regularly receives new information (including delayed verified emissions data, new entrants and closures) so the figures shown may change over time.
(7) "+" and "-" mean that verified emissions exceeded allowances or were below allowances, respectively. Annual allowances include allocated allowances and allowances auctioned during the same year.
(8) LULUCF sector and emissions from international bunkers excluded. Due to independent rounding the sums may not necessarily add up.
(6) Constant scope: includes only those installations with verified emissions available for 2008, 2009, 2010 and 2011.
(1) Total greenhouse gas emissions (GHG), GHG per capita, GHG per GDP and shares of GHG do not include emissions and removals from LULUCF (carbon sinks) and emissions from international bunkers.
(3) International bunkers: international aviation and international maritime transport.
(4) Gross domestic product (GDP) in 2005 market prices - not suitable for a ranking or quantitative comparison between countries for the same year. GDP information for the year 1990 is not available for some countries. For this reason, the 'GHG per GDP' values presented in the '1990' column correspond to the following years: 1991 (EU-15, Bulgaria, Germany, Hungary and Malta), 1992 (Slovakia), 1993 (EU-27 and Estonia) and 1995 (Croatia). Source GDP: Annual macro-economic database (AMECO), European Commission, 2012.
(2) Based on national estimate of 2011 emissions.
GHG trends and projections in Luxembourg
10.9 %
25.2 %
52.1 %
5.5 % 5.7 % 0.5 % 0.1 %
Energy supply
Energy use (excluding transport)
Transport
Industrial processes
Agriculture
Waste
Other
91.7 %
3.8 % 3.9 % 0.6 %
CO2
CH4
N2O
F-gases
0%
2%
4%
6%
8%
10%
12%
2004 2006 2008 2010 2012 2014 2016 2018 2020
Share of renewable energy in gross final consumptionShare of renewable energy in final consumption of energy in transportShare of renewable energy in final electricity consumptionShare of renewable energy in final consumption of energy for heating and coolingRenewable energy target (gross final energy consumption)Renewable energy target (transport)
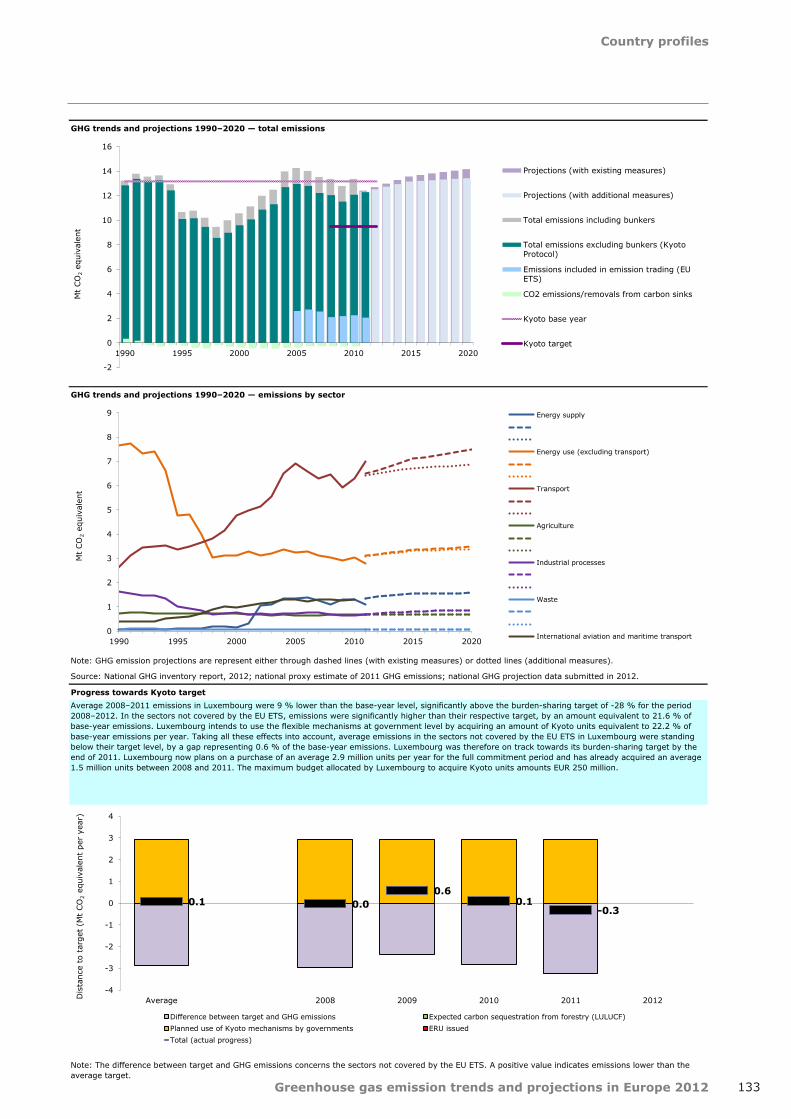
Country profiles
133Greenhouse gas emission trends and projections in Europe 2012
GHG trends and projections 1990–2020 — total emissions
GHG trends and projections 1990–2020 — emissions by sector
Progress towards Kyoto target
Note: The difference between target and GHG emissions concerns the sectors not covered by the EU ETS. A positive value indicates emissions lower than the average target.
Average 2008–2011 emissions in Luxembourg were 9 % lower than the base-year level, significantly above the burden-sharing target of -28 % for the period 2008–2012. In the sectors not covered by the EU ETS, emissions were significantly higher than their respective target, by an amount equivalent to 21.6 % of base-year emissions. Luxembourg intends to use the flexible mechanisms at government level by acquiring an amount of Kyoto units equivalent to 22.2 % of base-year emissions per year. Taking all these effects into account, average emissions in the sectors not covered by the EU ETS in Luxembourg were standing below their target level, by a gap representing 0.6 % of the base-year emissions. Luxembourg was therefore on track towards its burden-sharing target by the end of 2011. Luxembourg now plans on a purchase of an average 2.9 million units per year for the full commitment period and has already acquired an average 1.5 million units between 2008 and 2011. The maximum budget allocated by Luxembourg to acquire Kyoto units amounts EUR 250 million.
Source: National GHG inventory report, 2012; national proxy estimate of 2011 GHG emissions; national GHG projection data submitted in 2012.
Note: GHG emission projections are represent either through dashed lines (with existing measures) or dotted lines (additional measures).
-2
0
2
4
6
8
10
12
14
16
1990 1995 2000 2005 2010 2015 2020
Mt
CO
2 eq
uiva
lent
Projections (with existing measures)
Projections (with additional measures)
Total emissions including bunkers
Total emissions excluding bunkers (KyotoProtocol)
Emissions included in emission trading (EUETS)
CO2 emissions/removals from carbon sinks
Kyoto base year
Kyoto target
0
1
2
3
4
5
6
7
8
9
1990 1995 2000 2005 2010 2015 2020
Mt
CO
2 eq
uiva
lent
Energy supply
Energy use (excluding transport)
Transport
Agriculture
Industrial processes
Waste
International aviation and maritime transport
0.1 0.0 0.6
0.1 -0.3
-4
-3
-2
-1
0
1
2
3
4
Average 2008 2009 2010 2011 2012Dis
tanc
e to
tar
get
(Mt
CO
2 eq
uiva
lent
per
yea
r)
Difference between target and GHG emissions Expected carbon sequestration from forestry (LULUCF)Planned use of Kyoto mechanisms by governments ERU issuedTotal (actual progress)

Country profiles
134 Greenhouse gas emission trends and projections in Europe 2012
Key GHG data (1) 1990 2008 2009 2010 2011 (2) 2012 1990–2011
2010–2011 (2)
Total GHG emissions (Mt CO2-eq.) 2.0 3.1 3.0 3.0 2.9 n.a. 43.0% -4.0%
GHG from international bunkers (3) (Mt CO2-eq.) 0.5 3.4 4.3 3.7 n.a. n.a. n.a. n.a.
GHG per capita (t CO2-eq. / capita) 5.8 7.5 7.3 7.3 7.0 n.a. 20.7% -4.8%
GHG per GDP (constant prices) (4) (g CO2-eq. / euro) 739 576 577 567 533 n.a. -27.8% -6.0%
Share of GHG in total EU-27 emissions (%) 0.0 % 0.1 % 0.1 % 0.1 % 0.1 % n.a. 73.6% -1.6%
EU ETS allocated allowances (free + auctioning) 2.1 2.1 2.2 2.2 n.a. 0.0%
EU ETS verified emissions - all installations (5) (Mt CO2-eq.) 2.0 1.9 1.9 1.9 n.a. 2.8%
EU ETS verified emissions - constant scope (6) (Mt CO2-eq.) 2.0 1.9 1.9 1.9 n.a. 2.8%
Share of EU ETS verified emissions (all install.) in total GHG (%) 65.2 % 62.9 % 61.9 % 66.3 % n.a. 7.2%
ETS verified emissions compared to annual allowances (7) (%) 95.8% 89.4% 87.0% 89.5% n.a. 2.8%
Share of GHG emissions (excluding international bunkers) by main source and by gas in 2010 (1) (8)
Assessment of short-term GHG trend (2009–2010)
Key data and trends on renewable energy 2008 2009 2010 2020 target
Share of renewable energy in final consumption 0.2% 0.2% 0.4% 10.0%
Share of renewable energy in transport 0.0% 0.0% 0.3% 10.0%
Share of renewable energy in electricity 0.0% 0.1% 0.0% n.a.
Share of renewable energy in heating & cooling 3.6% 2.1% 3.1% n.a.
Source: EurostatSource and additional information
Greenhouse gas emission data and EU ETS data
Emissions were at the level of the previous year, the change between 2009 and 2010 was minor (0.6%). Emission increases from road transport and industry were offset by emission decreases from public electricity and heat production and from households and services.
www.eea.europa.eu/themes/climate/data-viewers
(5) All installations included. This includes new entrants and closures. Data from the community independent transaction log (CITL) as of 31 July 2012. The CITL regularly receives new information (including delayed verified emissions data, new entrants and closures) so the figures shown may change over time.
(7) "+" and "-" mean that verified emissions exceeded allowances or were below allowances, respectively. Annual allowances include allocated allowances and allowances auctioned during the same year.
(8) LULUCF sector and emissions from international bunkers excluded. Due to independent rounding the sums may not necessarily add up.
(6) Constant scope: includes only those installations with verified emissions available for 2008, 2009, 2010 and 2011.
(1) Total greenhouse gas emissions (GHG), GHG per capita, GHG per GDP and shares of GHG do not include emissions and removals from LULUCF (carbon sinks) and emissions from international bunkers.
(3) International bunkers: international aviation and international maritime transport.
(4) Gross domestic product (GDP) in 2005 market prices - not suitable for a ranking or quantitative comparison between countries for the same year. GDP information for the year 1990 is not available for some countries. For this reason, the 'GHG per GDP' values presented in the '1990' column correspond to the following years: 1991 (EU-15, Bulgaria, Germany, Hungary and Malta), 1992 (Slovakia), 1993 (EU-27 and Estonia) and 1995 (Croatia). Source GDP: Annual macro-economic database (AMECO), European Commission, 2012.
(2) Based on EEA estimate of 2011 emissions.
GHG trends and projections in Malta
62.4 % 6.1 %
19.0 %
3.3 % 2.6 % 6.6 % 0.0 %
Energy supply
Energy use (excluding transport)
Transport
Industrial processes
Agriculture
Waste
Other
87.0 %
8.2 % 1.6 % 3.3 %
CO2
CH4
N2O
F-gases
0%
2%
4%
6%
8%
10%
12%
2004 2006 2008 2010 2012 2014 2016 2018 2020
Share of renewable energy in gross final consumptionShare of renewable energy in final consumption of energy in transportShare of renewable energy in final electricity consumptionShare of renewable energy in final consumption of energy for heating and coolingRenewable energy target (gross final energy consumption)Renewable energy target (transport)
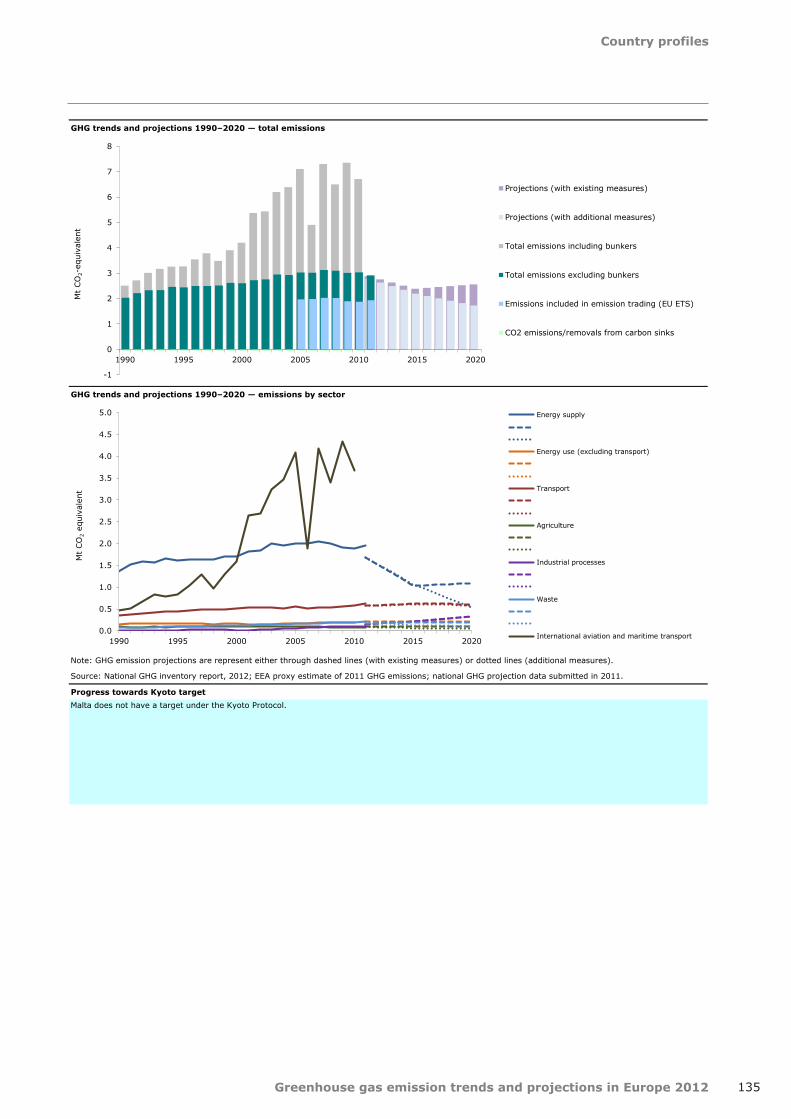
Country profiles
135Greenhouse gas emission trends and projections in Europe 2012
GHG trends and projections 1990–2020 — total emissions
GHG trends and projections 1990–2020 — emissions by sector
Progress towards Kyoto targetMalta does not have a target under the Kyoto Protocol.
Note: GHG emission projections are represent either through dashed lines (with existing measures) or dotted lines (additional measures).
Source: National GHG inventory report, 2012; EEA proxy estimate of 2011 GHG emissions; national GHG projection data submitted in 2011.
-1
0
1
2
3
4
5
6
7
8
1990 1995 2000 2005 2010 2015 2020
Mt
CO
2-eq
uiva
lent
Projections (with existing measures)
Projections (with additional measures)
Total emissions including bunkers
Total emissions excluding bunkers
Emissions included in emission trading (EU ETS)
CO2 emissions/removals from carbon sinks
0.0
0.5
1.0
1.5
2.0
2.5
3.0
3.5
4.0
4.5
5.0
1990 1995 2000 2005 2010 2015 2020
Mt
CO
2 eq
uiva
lent
Energy supply
Energy use (excluding transport)
Transport
Agriculture
Industrial processes
Waste
International aviation and maritime transport

Country profiles
136 Greenhouse gas emission trends and projections in Europe 2012
Key GHG data (1) 1990 2008 2009 2010 2011 (2) 2012 1990–2011
2010–2011 (2)
Average 2008–2012 target under the Kyoto Protocol (Mt CO2-eq.) 200.3 200.3 200.3 200.3 200.3
Total GHG emissions (Mt CO2-eq.) 212.0 204.6 198.9 210.1 195.8 n.a. -7.6% -6.8%
GHG from international bunkers (3) (Mt CO2-eq.) 39.0 60.8 56.2 53.6 58.2 n.a. 49.0% 8.6%
GHG per capita (t CO2-eq. / capita) 14.2 12.5 12.1 12.7 11.8 n.a. -17.4% -7.2%
GHG per GDP (constant prices) (4) (g CO2-eq. / euro) 602 364 367 381 351 n.a. -41.7% -7.8%
Share of GHG in total EU-27 emissions (%) 3.8 % 4.1 % 4.3 % 4.4 % 4.3 % n.a. 12.1% -4.3%
EU ETS allocated allowances (free + auctioning) 76.8 83.8 92.8 88.8 n.a. -4.3%
EU ETS verified emissions - all installations (5) (Mt CO2-eq.) 83.5 81.0 84.7 80.0 n.a. -5.6%
EU ETS verified emissions - constant scope (6) (Mt CO2-eq.) 82.9 80.9 83.7 78.3 n.a. -6.4%
Share of EU ETS verified emissions (all install.) in total GHG (%) 40.8 % 40.7 % 40.3 % 40.8 % n.a. 1.2%
ETS verified emissions compared to annual allowances (7) (%) 108.8% 96.7% 91.3% 90.0% n.a. -1.4%
GHG emissions in the non-ETS sectors 121.1 117.9 125.3 115.9 n.a. -7.5%
Equivalent annual target for non-ETS GHG emissions 123.5 116.4 107.4 111.4 n.a. 3.7%
Share of GHG emissions (excluding international bunkers) by main source and by gas in 2010 (1) (8)
Assessment of short-term GHG trend (2009–2010)
Key data and trends on renewable energy 2008 2009 2010 2020 target
Share of renewable energy in final consumption 3.4% 4.1% 3.8% 14.0%
Share of renewable energy in transport 2.6% 4.2% 3.0% 10.0%
Share of renewable energy in electricity 9.1% 9.7% 0.0% n.a.
Share of renewable energy in heating & cooling 2.7% 3.1% 2.8% n.a.
Source: EurostatSource and additional information
Greenhouse gas emission data and EU ETS data
In 2010 emissions increased by 5.6% compared to 2009. GHG emissions increased mainly due to increasing emissions from households and services. In addition, emissions increased in industry and in public electricity and heat production. The emission increases from households and services are - at least partly - due to colder winter months compared to 2009. The emission increases in industry reflect the economic recovery in particular in the chemicals sector. The emission increase from public electricity and heat production mainly reflects growing electricity demand which was mainly met by growing thermal power production.
www.eea.europa.eu/themes/climate/data-viewers
(5) All installations included. This includes new entrants and closures. Data from the community independent transaction log (CITL) as of 31 July 2012. The CITL regularly receives new information (including delayed verified emissions data, new entrants and closures) so the figures shown may change over time.
(7) "+" and "-" mean that verified emissions exceeded allowances or were below allowances, respectively. Annual allowances include allocated allowances and allowances auctioned during the same year.
(8) LULUCF sector and emissions from international bunkers excluded. Due to independent rounding the sums may not necessarily add up.
(6) Constant scope: includes only those installations with verified emissions available for 2008, 2009, 2010 and 2011.
(1) Total greenhouse gas emissions (GHG), GHG per capita, GHG per GDP and shares of GHG do not include emissions and removals from LULUCF (carbon sinks) and emissions from international bunkers.
(3) International bunkers: international aviation and international maritime transport.
(4) Gross domestic product (GDP) in 2005 market prices - not suitable for a ranking or quantitative comparison between countries for the same year. GDP information for the year 1990 is not available for some countries. For this reason, the 'GHG per GDP' values presented in the '1990' column correspond to the following years: 1991 (EU-15, Bulgaria, Germany, Hungary and Malta), 1992 (Slovakia), 1993 (EU-27 and Estonia) and 1995 (Croatia). Source GDP: Annual macro-economic database (AMECO), European Commission, 2012.
(2) Based on national estimate of 2011 emissions.
GHG trends and projections in the Netherlands
33.0 %
35.0 %
16.7 %
5.0 %
7.9 % 2.4 % 0.1 % Energy supply
Energy use (excluding transport)
Transport
Industrial processes
Agriculture
Waste
Other
86.3 %
8.0 % 4.5 % 1.3 %
CO2
CH4
N2O
F-gases
0%
2%
4%
6%
8%
10%
12%
14%
16%
2004 2006 2008 2010 2012 2014 2016 2018 2020
Share of renewable energy in gross final consumptionShare of renewable energy in final consumption of energy in transportShare of renewable energy in final electricity consumptionShare of renewable energy in final consumption of energy for heating and coolingRenewable energy target (gross final energy consumption)Renewable energy target (transport)
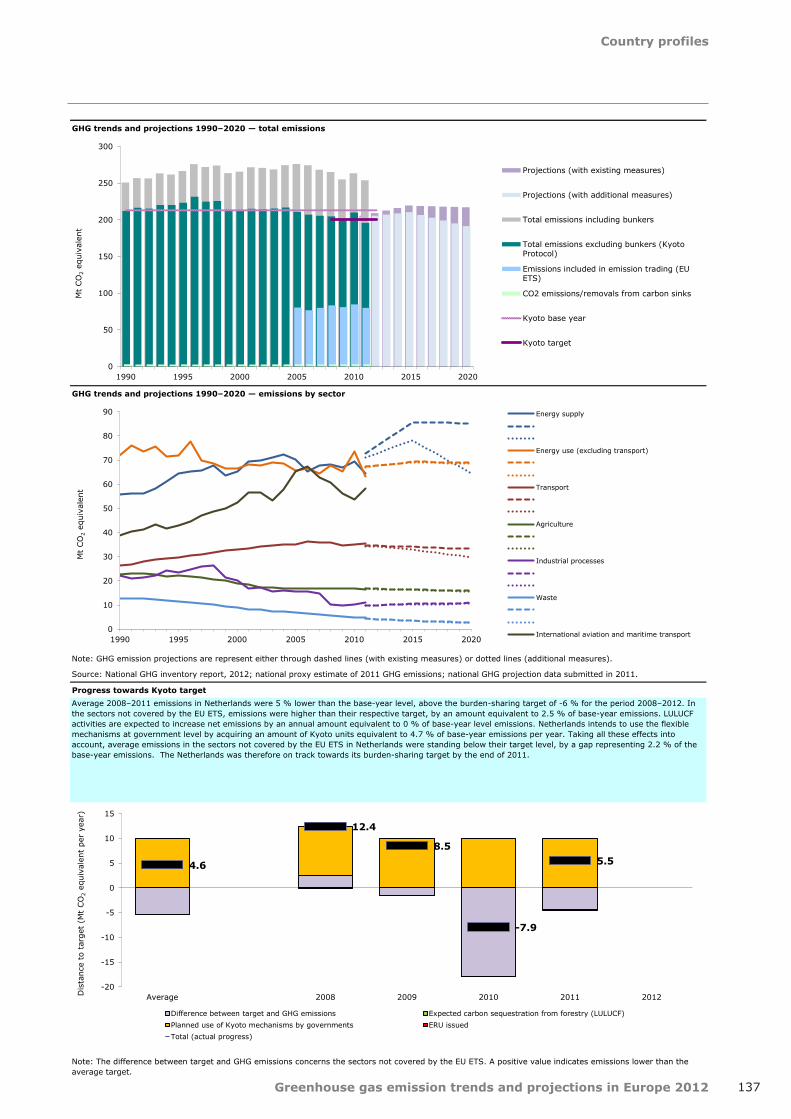
Country profiles
137Greenhouse gas emission trends and projections in Europe 2012
GHG trends and projections 1990–2020 — total emissions
GHG trends and projections 1990–2020 — emissions by sector
Progress towards Kyoto target
Note: The difference between target and GHG emissions concerns the sectors not covered by the EU ETS. A positive value indicates emissions lower than the average target.
Average 2008–2011 emissions in Netherlands were 5 % lower than the base-year level, above the burden-sharing target of -6 % for the period 2008–2012. In the sectors not covered by the EU ETS, emissions were higher than their respective target, by an amount equivalent to 2.5 % of base-year emissions. LULUCF activities are expected to increase net emissions by an annual amount equivalent to 0 % of base-year level emissions. Netherlands intends to use the flexible mechanisms at government level by acquiring an amount of Kyoto units equivalent to 4.7 % of base-year emissions per year. Taking all these effects into account, average emissions in the sectors not covered by the EU ETS in Netherlands were standing below their target level, by a gap representing 2.2 % of the base-year emissions. The Netherlands was therefore on track towards its burden-sharing target by the end of 2011.
Note: GHG emission projections are represent either through dashed lines (with existing measures) or dotted lines (additional measures).
Source: National GHG inventory report, 2012; national proxy estimate of 2011 GHG emissions; national GHG projection data submitted in 2011.
0
50
100
150
200
250
300
1990 1995 2000 2005 2010 2015 2020
Mt
CO
2 eq
uiva
lent
Projections (with existing measures)
Projections (with additional measures)
Total emissions including bunkers
Total emissions excluding bunkers (KyotoProtocol)
Emissions included in emission trading (EUETS)
CO2 emissions/removals from carbon sinks
Kyoto base year
Kyoto target
0
10
20
30
40
50
60
70
80
90
1990 1995 2000 2005 2010 2015 2020
Mt
CO
2 eq
uiva
lent
Energy supply
Energy use (excluding transport)
Transport
Agriculture
Industrial processes
Waste
International aviation and maritime transport
4.6
12.4
8.5
-7.9
5.5
-20
-15
-10
-5
0
5
10
15
Average 2008 2009 2010 2011 2012Dis
tanc
e to
tar
get
(Mt
CO
2 eq
uiva
lent
per
yea
r)
Difference between target and GHG emissions Expected carbon sequestration from forestry (LULUCF)Planned use of Kyoto mechanisms by governments ERU issuedTotal (actual progress)

Country profiles
138 Greenhouse gas emission trends and projections in Europe 2012
Key GHG data (1) 1990 2008 2009 2010 2011 (2) 2012 1990–2011
2010–2011 (2)
Average 2008–2012 target under the Kyoto Protocol (Mt CO2-eq.) 50.1 50.1 50.1 50.1 50.1
Total GHG emissions (Mt CO2-eq.) 49.8 53.8 51.5 53.9 52.7 n.a. 5.8% -2.2%
GHG from international bunkers (3) (Mt CO2-eq.) 2.1 3.3 2.9 2.7 n.a. n.a. n.a. n.a.
GHG per capita (t CO2-eq. / capita) 11.8 11.4 10.7 11.1 10.7 n.a. -9.0% -3.5%
GHG per GDP (constant prices) (4) (g CO2-eq. / euro) 327 209 203 212 204 n.a. -37.7% -3.8%
EU ETS allocated allowances (free + auctioning) 7.5 20.6 14.3 14.3 n.a. 0.0%
EU ETS verified emissions - all installations (5) (Mt CO2-eq.) 19.3 19.2 19.3 19.2 n.a. -0.7%
EU ETS verified emissions - constant scope (6) (Mt CO2-eq.) 19.3 19.2 18.9 18.4 n.a. -2.6%
Share of EU ETS verified emissions (all install.) in total GHG (%) 35.9 % 37.3 % 35.9 % 36.4 % n.a. 1.5%
ETS verified emissions compared to annual allowances (7) (%) 256.6% 93.4% 134.9% 133.9% n.a. -0.7%
GHG emissions in the non-ETS sectors 34.5 32.3 34.6 33.5 n.a. -3.0%
Equivalent annual target for non-ETS GHG emissions 42.6 29.5 35.8 35.8 n.a. 0.0%
Share of GHG emissions (excluding international bunkers) by main source and by gas in 2010 (1) (8)
Assessment of short-term GHG trend (2009–2010)
Key data and trends on renewable energy 2008 2009 2010 2020 target
Share of renewable energy in final consumption 62.0% 65.1% 61.1% 67.5%
Share of renewable energy in transport 3.3% 3.7% 3.9% 10.0%
Share of renewable energy in electricity 104.8% 97.3% 0.0% n.a.
Share of renewable energy in heating & cooling 36.1% 37.3% 36.9% n.a.
Source: EurostatSource and additional information
Greenhouse gas emission data and EU ETS data
In 2010 emissions increased by almost 5% compared to 2009, mainly due to economic growth causing higher emissions in almost all sectors. Emissions from fuel combustion in energy industries have increased by 3% from 2009 to 2010. The CO2 emissions from stationary combustion have increased by nearly 12% from 2009 to 2010 which is mainly due to increased emissions from gas fired, combined heat and power plant and increased emissions from combustion in production of ferroalloys.
www.eea.europa.eu/themes/climate/data-viewers
(5) All installations included. This includes new entrants and closures. Data from the community independent transaction log (CITL) as of 31 July 2012. The CITL regularly receives new information (including delayed verified emissions data, new entrants and closures) so the figures shown may change over time.
(7) "+" and "-" mean that verified emissions exceeded allowances or were below allowances, respectively. Annual allowances include allocated allowances and allowances auctioned during the same year.
(8) LULUCF sector and emissions from international bunkers excluded. Due to independent rounding the sums may not necessarily add up.
(6) Constant scope: includes only those installations with verified emissions available for 2008, 2009, 2010 and 2011.
(1) Total greenhouse gas emissions (GHG), GHG per capita, GHG per GDP and shares of GHG do not include emissions and removals from LULUCF (carbon sinks) and emissions from international bunkers.
(3) International bunkers: international aviation and international maritime transport.
(4) Gross domestic product (GDP) in 2005 market prices - not suitable for a ranking or quantitative comparison between countries for the same year. GDP information for the year 1990 is not available for some countries. For this reason, the 'GHG per GDP' values presented in the '1990' column correspond to the following years: 1991 (EU-15, Bulgaria, Germany, Hungary and Malta), 1992 (Slovakia), 1993 (EU-27 and Estonia) and 1995 (Croatia). Source GDP: Annual macro-economic database (AMECO), European Commission, 2012.
(2) Based on national estimate of 2011 emissions.
GHG trends and projections in Norway
33.6 %
13.9 % 28.1 %
13.9 %
7.9 % 2.3 % 0.3 % Energy supply
Energy use (excluding transport)
Transport
Industrial processes
Agriculture
Waste
Other
84.3 %
8.1 % 5.7 % 1.9 %
CO2
CH4
N2O
F-gases
0%
20%
40%
60%
80%
100%
120%
2004 2006 2008 2010 2012 2014 2016 2018 2020
Share of renewable energy in gross final consumptionShare of renewable energy in final consumption of energy in transportShare of renewable energy in final electricity consumptionShare of renewable energy in final consumption of energy for heating and coolingRenewable energy target (gross final energy consumption)Renewable energy target (transport)

Country profiles
139Greenhouse gas emission trends and projections in Europe 2012
GHG trends and projections 1990–2020 — total emissions
GHG trends 1990–2010 - emissions by sector
Source: National GHG inventory report, 2012.
Progress towards Kyoto target
Note: The difference between target and GHG emissions concerns the sectors not covered by the EU ETS. A positive value indicates emissions lower than the average target.
Average 2008–2011 emissions in Norway were 6.8 % higher than the base-year level, significantly above the Kyoto target of 1 % for the period 2008–2012. In the sectors not covered by the EU ETS, emissions were lower than their respective target, by an amount equivalent to 4.5 % of base-year emissions. Norway intends to use the flexible mechanisms at government level by acquiring an amount of Kyoto units equivalent to 9.1 % of base-year emissions per year. Taking all these effects into account, average emissions in the sectors not covered by the EU ETS in Norway were standing below their target level, by a gap representing 13.5 % of the base-year emissions. Norway was therefore on track towards its Kyoto target by the end of 2011.
-40
-20
0
20
40
60
80
1990 1995 2000 2005 2010 2015 2020
Mt
CO
2 eq
uiva
lent
Projections (with existing measures)
Projections (with additional measures)
Total emissions including bunkers
Total emissions excluding bunkers (KyotoProtocol)
Emissions included in emission trading (EUETS)
CO2 emissions/removals from carbon sinks
Kyoto base year
Kyoto target
0
2
4
6
8
10
12
14
16
18
20
1990 1995 2000 2005 2010
Mt
CO
2 eq
uiva
lent
Energy supply
Energy use (excluding transport)
Transport
Agriculture
Industrial processes
Waste
International aviation and maritime transport
6.7
12.6
1.8
5.7 6.8
-4
-2
0
2
4
6
8
10
12
14
Average 2008 2009 2010 2011 2012Dis
tanc
e to
tar
get
(Mt
CO
2 eq
uiva
lent
per
yea
r)
Difference between target and GHG emissions Expected carbon sequestration from forestry (LULUCF)Planned use of Kyoto mechanisms by governments ERU issuedTotal (actual progress)
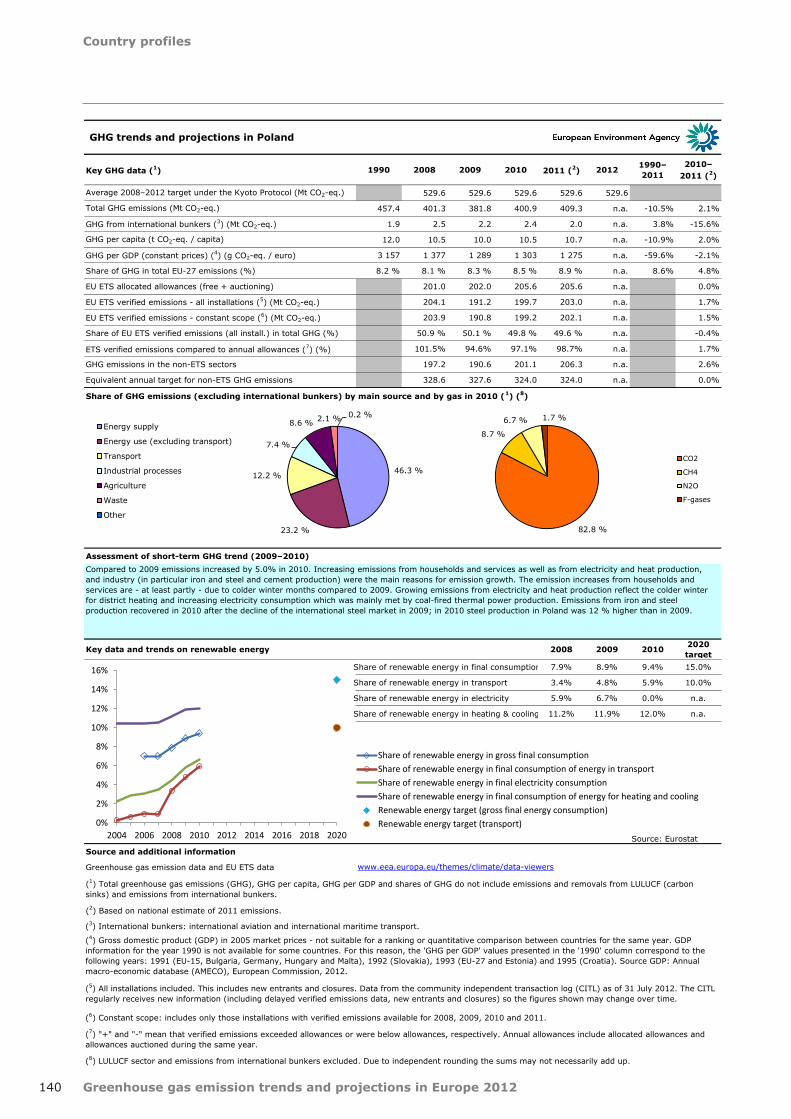
Country profiles
140 Greenhouse gas emission trends and projections in Europe 2012
Key GHG data (1) 1990 2008 2009 2010 2011 (2) 2012 1990–2011
2010–2011 (2)
Average 2008–2012 target under the Kyoto Protocol (Mt CO2-eq.) 529.6 529.6 529.6 529.6 529.6
Total GHG emissions (Mt CO2-eq.) 457.4 401.3 381.8 400.9 409.3 n.a. -10.5% 2.1%
GHG from international bunkers (3) (Mt CO2-eq.) 1.9 2.5 2.2 2.4 2.0 n.a. 3.8% -15.6%
GHG per capita (t CO2-eq. / capita) 12.0 10.5 10.0 10.5 10.7 n.a. -10.9% 2.0%
GHG per GDP (constant prices) (4) (g CO2-eq. / euro) 3 157 1 377 1 289 1 303 1 275 n.a. -59.6% -2.1%
Share of GHG in total EU-27 emissions (%) 8.2 % 8.1 % 8.3 % 8.5 % 8.9 % n.a. 8.6% 4.8%
EU ETS allocated allowances (free + auctioning) 201.0 202.0 205.6 205.6 n.a. 0.0%
EU ETS verified emissions - all installations (5) (Mt CO2-eq.) 204.1 191.2 199.7 203.0 n.a. 1.7%
EU ETS verified emissions - constant scope (6) (Mt CO2-eq.) 203.9 190.8 199.2 202.1 n.a. 1.5%
Share of EU ETS verified emissions (all install.) in total GHG (%) 50.9 % 50.1 % 49.8 % 49.6 % n.a. -0.4%
ETS verified emissions compared to annual allowances (7) (%) 101.5% 94.6% 97.1% 98.7% n.a. 1.7%
GHG emissions in the non-ETS sectors 197.2 190.6 201.1 206.3 n.a. 2.6%
Equivalent annual target for non-ETS GHG emissions 328.6 327.6 324.0 324.0 n.a. 0.0%
Share of GHG emissions (excluding international bunkers) by main source and by gas in 2010 (1) (8)
Assessment of short-term GHG trend (2009–2010)
Key data and trends on renewable energy 2008 2009 2010 2020 target
Share of renewable energy in final consumption 7.9% 8.9% 9.4% 15.0%
Share of renewable energy in transport 3.4% 4.8% 5.9% 10.0%
Share of renewable energy in electricity 5.9% 6.7% 0.0% n.a.
Share of renewable energy in heating & cooling 11.2% 11.9% 12.0% n.a.
Source: EurostatSource and additional information
Greenhouse gas emission data and EU ETS data
Compared to 2009 emissions increased by 5.0% in 2010. Increasing emissions from households and services as well as from electricity and heat production, and industry (in particular iron and steel and cement production) were the main reasons for emission growth. The emission increases from households and services are - at least partly - due to colder winter months compared to 2009. Growing emissions from electricity and heat production reflect the colder winter for district heating and increasing electricity consumption which was mainly met by coal-fired thermal power production. Emissions from iron and steel production recovered in 2010 after the decline of the international steel market in 2009; in 2010 steel production in Poland was 12 % higher than in 2009.
www.eea.europa.eu/themes/climate/data-viewers
(5) All installations included. This includes new entrants and closures. Data from the community independent transaction log (CITL) as of 31 July 2012. The CITL regularly receives new information (including delayed verified emissions data, new entrants and closures) so the figures shown may change over time.
(7) "+" and "-" mean that verified emissions exceeded allowances or were below allowances, respectively. Annual allowances include allocated allowances and allowances auctioned during the same year.
(8) LULUCF sector and emissions from international bunkers excluded. Due to independent rounding the sums may not necessarily add up.
(6) Constant scope: includes only those installations with verified emissions available for 2008, 2009, 2010 and 2011.
(1) Total greenhouse gas emissions (GHG), GHG per capita, GHG per GDP and shares of GHG do not include emissions and removals from LULUCF (carbon sinks) and emissions from international bunkers.
(3) International bunkers: international aviation and international maritime transport.
(4) Gross domestic product (GDP) in 2005 market prices - not suitable for a ranking or quantitative comparison between countries for the same year. GDP information for the year 1990 is not available for some countries. For this reason, the 'GHG per GDP' values presented in the '1990' column correspond to the following years: 1991 (EU-15, Bulgaria, Germany, Hungary and Malta), 1992 (Slovakia), 1993 (EU-27 and Estonia) and 1995 (Croatia). Source GDP: Annual macro-economic database (AMECO), European Commission, 2012.
(2) Based on national estimate of 2011 emissions.
GHG trends and projections in Poland
46.3 %
23.2 %
12.2 %
7.4 %
8.6 % 2.1 % 0.2 % Energy supply
Energy use (excluding transport)
Transport
Industrial processes
Agriculture
Waste
Other
82.8 %
8.7 %
6.7 % 1.7 %
CO2
CH4
N2O
F-gases
0%
2%
4%
6%
8%
10%
12%
14%
16%
2004 2006 2008 2010 2012 2014 2016 2018 2020
Share of renewable energy in gross final consumptionShare of renewable energy in final consumption of energy in transportShare of renewable energy in final electricity consumptionShare of renewable energy in final consumption of energy for heating and coolingRenewable energy target (gross final energy consumption)Renewable energy target (transport)
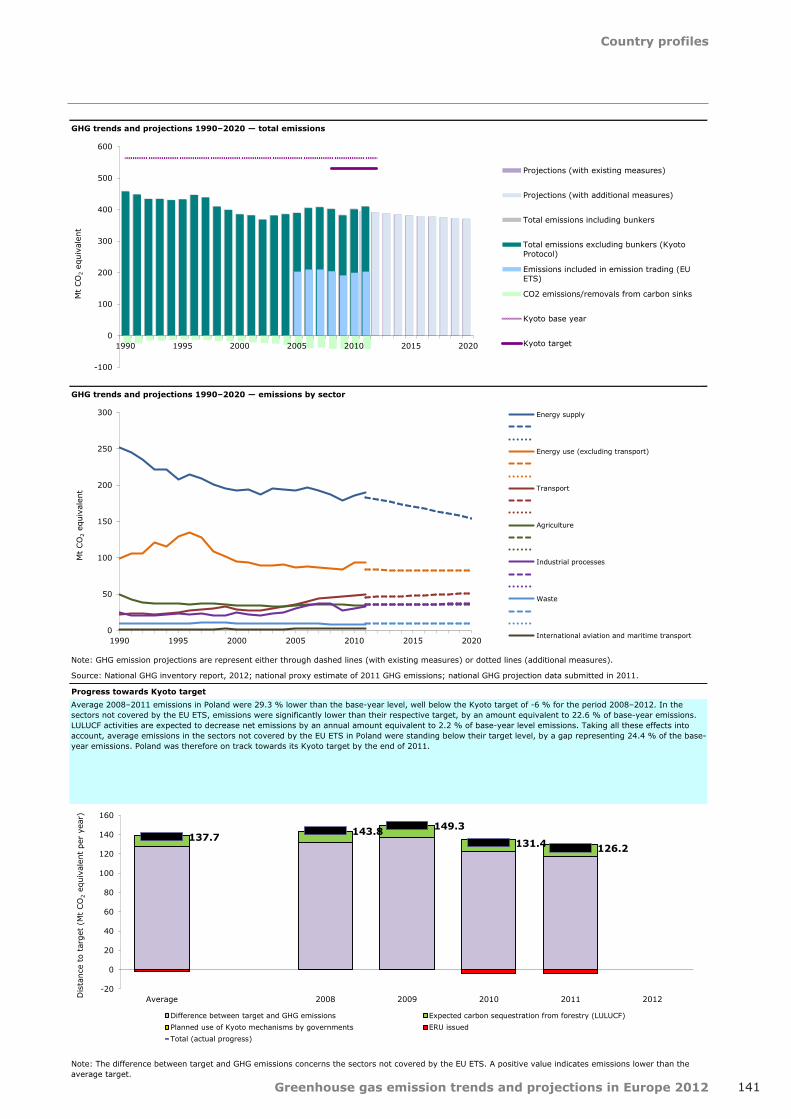
Country profiles
141Greenhouse gas emission trends and projections in Europe 2012
GHG trends and projections 1990–2020 — total emissions
GHG trends and projections 1990–2020 — emissions by sector
Progress towards Kyoto target
Note: The difference between target and GHG emissions concerns the sectors not covered by the EU ETS. A positive value indicates emissions lower than the average target.
Average 2008–2011 emissions in Poland were 29.3 % lower than the base-year level, well below the Kyoto target of -6 % for the period 2008–2012. In the sectors not covered by the EU ETS, emissions were significantly lower than their respective target, by an amount equivalent to 22.6 % of base-year emissions. LULUCF activities are expected to decrease net emissions by an annual amount equivalent to 2.2 % of base-year level emissions. Taking all these effects into account, average emissions in the sectors not covered by the EU ETS in Poland were standing below their target level, by a gap representing 24.4 % of the base-year emissions. Poland was therefore on track towards its Kyoto target by the end of 2011.
Note: GHG emission projections are represent either through dashed lines (with existing measures) or dotted lines (additional measures).
Source: National GHG inventory report, 2012; national proxy estimate of 2011 GHG emissions; national GHG projection data submitted in 2011.
-100
0
100
200
300
400
500
600
1990 1995 2000 2005 2010 2015 2020
Mt
CO
2 eq
uiva
lent
Projections (with existing measures)
Projections (with additional measures)
Total emissions including bunkers
Total emissions excluding bunkers (KyotoProtocol)
Emissions included in emission trading (EUETS)
CO2 emissions/removals from carbon sinks
Kyoto base year
Kyoto target
0
50
100
150
200
250
300
1990 1995 2000 2005 2010 2015 2020
Mt
CO
2 eq
uiva
lent
Energy supply
Energy use (excluding transport)
Transport
Agriculture
Industrial processes
Waste
International aviation and maritime transport
137.7 143.8 149.3
131.4 126.2
-20
0
20
40
60
80
100
120
140
160
Average 2008 2009 2010 2011 2012Dis
tanc
e to
tar
get
(Mt
CO
2 eq
uiva
lent
per
yea
r)
Difference between target and GHG emissions Expected carbon sequestration from forestry (LULUCF)Planned use of Kyoto mechanisms by governments ERU issuedTotal (actual progress)

Country profiles
142 Greenhouse gas emission trends and projections in Europe 2012
Key GHG data (1) 1990 2008 2009 2010 2011 (2) 2012 1990–2011
2010–2011 (2)
Average 2008–2012 target under the Kyoto Protocol (Mt CO2-eq.) 76.4 76.4 76.4 76.4 76.4
Total GHG emissions (Mt CO2-eq.) 60.1 77.8 74.4 70.6 70.0 n.a. 16.5% -0.9%
GHG from international bunkers (3) (Mt CO2-eq.) 2.9 4.6 4.2 4.3 n.a. n.a. n.a. n.a.
GHG per capita (t CO2-eq. / capita) 6.0 7.3 7.0 6.6 6.6 n.a. 9.5% -0.9%
GHG per GDP (constant prices) (4) (g CO2-eq. / euro) 549 486 478 448 451 n.a. -17.9% 0.7%
Share of GHG in total EU-27 emissions (%) 1.1 % 1.6 % 1.6 % 1.5 % 1.5 % n.a. 41.3% 1.7%
EU ETS allocated allowances (free + auctioning) 30.5 30.9 32.5 32.5 n.a. 0.0%
EU ETS verified emissions - all installations (5) (Mt CO2-eq.) 29.9 28.3 24.2 25.0 n.a. 3.5%
EU ETS verified emissions - constant scope (6) (Mt CO2-eq.) 29.6 27.5 22.7 22.7 n.a. 0.1%
Share of EU ETS verified emissions (all install.) in total GHG (%) 38.5 % 38.0 % 34.2 % 35.7 % n.a. 4.4%
ETS verified emissions compared to annual allowances (7) (%) 98.1% 91.5% 74.4% 77.0% n.a. 3.5%
GHG emissions in the non-ETS sectors 47.9 46.1 46.4 45.0 n.a. -3.2%
Equivalent annual target for non-ETS GHG emissions 45.9 45.5 43.9 43.9 n.a. 0.0%
Share of GHG emissions (excluding international bunkers) by main source and by gas in 2010 (1) (8)
Assessment of short-term GHG trend (2009–2010)
Key data and trends on renewable energy 2008 2009 2010 2020 target
Share of renewable energy in final consumption 23.0% 24.6% 24.6% 31.0%
Share of renewable energy in transport 2.4% 3.9% 5.6% 10.0%
Share of renewable energy in electricity 38.2% 41.2% 0.0% n.a.
Share of renewable energy in heating & cooling 37.3% 37.9% 34.5% n.a.
Source: EurostatSource and additional information
Greenhouse gas emission data and EU ETS data
Portugal was among those few contries with declining emissions between 2009 and 2010 (-5.1%). Emissions mainly declined from public electricity and heat production. Thermal power production declined by 24 % whereas hydro power production increased by more than 80 %.
www.eea.europa.eu/themes/climate/data-viewers
(5) All installations included. This includes new entrants and closures. Data from the community independent transaction log (CITL) as of 31 July 2012. The CITL regularly receives new information (including delayed verified emissions data, new entrants and closures) so the figures shown may change over time.
(7) "+" and "-" mean that verified emissions exceeded allowances or were below allowances, respectively. Annual allowances include allocated allowances and allowances auctioned during the same year.
(8) LULUCF sector and emissions from international bunkers excluded. Due to independent rounding the sums may not necessarily add up.
(6) Constant scope: includes only those installations with verified emissions available for 2008, 2009, 2010 and 2011.
(1) Total greenhouse gas emissions (GHG), GHG per capita, GHG per GDP and shares of GHG do not include emissions and removals from LULUCF (carbon sinks) and emissions from international bunkers.
(3) International bunkers: international aviation and international maritime transport.
(4) Gross domestic product (GDP) in 2005 market prices - not suitable for a ranking or quantitative comparison between countries for the same year. GDP information for the year 1990 is not available for some countries. For this reason, the 'GHG per GDP' values presented in the '1990' column correspond to the following years: 1991 (EU-15, Bulgaria, Germany, Hungary and Malta), 1992 (Slovakia), 1993 (EU-27 and Estonia) and 1995 (Croatia). Source GDP: Annual macro-economic database (AMECO), European Commission, 2012.
(2) Based on EEA estimate of 2011 emissions.
GHG trends and projections in Portugal
22.5 %
21.0 %
26.8 %
8.2 %
10.6 %
10.5 % 0.3 %
Energy supply
Energy use (excluding transport)
Transport
Industrial processes
Agriculture
Waste
Other74.5 %
17.0 %
6.7 % 1.8 %
CO2
CH4
N2O
F-gases
0%
5%
10%
15%
20%
25%
30%
35%
40%
45%
2004 2006 2008 2010 2012 2014 2016 2018 2020
Share of renewable energy in gross final consumptionShare of renewable energy in final consumption of energy in transportShare of renewable energy in final electricity consumptionShare of renewable energy in final consumption of energy for heating and coolingRenewable energy target (gross final energy consumption)Renewable energy target (transport)

Country profiles
143Greenhouse gas emission trends and projections in Europe 2012
GHG trends and projections 1990–2020 — total emissions
GHG trends and projections 1990–2020 — emissions by sector
Progress towards Kyoto target
Note: The difference between target and GHG emissions concerns the sectors not covered by the EU ETS. A positive value indicates emissions lower than the average target.
Average 2008–2011 emissions in Portugal were 21.7 % higher than the base-year level, well below the Kyoto target of 27 % for the period 2008–2012. However, in the sectors not covered by the EU ETS, emissions were higher than their respective target, by an amount equivalent to 2.6 % of base-year emissions. LULUCF activities are expected to decrease net emissions by an annual amount equivalent to 7.8 % of base-year level emissions. Portugal intends to use the flexible mechanisms at government level by acquiring an amount of Kyoto units equivalent to 2.5 % of base-year emissions per year. Taking all these effects into account, average emissions in the sectors not covered by the EU ETS in Portugal were standing below their target level, by a gap representing 7.7 % of the base-year emissions. Portugal was therefore on track towards its Kyoto target by the end of 2011.
Source: National GHG inventory report, 2012; EEA proxy estimate of 2011 GHG emissions; Primes–Gains GHG projections, 2010.
Note: GHG emission projections are represent either through dashed lines (with existing measures) or dotted lines (additional measures).
-20
0
20
40
60
80
100
1990 1995 2000 2005 2010 2015 2020
Mt
CO
2 eq
uiva
lent
Projections (with existing measures)
Projections (with additional measures)
Total emissions including bunkers
Total emissions excluding bunkers (KyotoProtocol)
Emissions included in emission trading (EUETS)
CO2 emissions/removals from carbon sinks
Kyoto base year
Kyoto target
0
5
10
15
20
25
30
1990 1995 2000 2005 2010 2015 2020
Mt
CO
2 eq
uiva
lent
Energy supply
Energy use (excluding transport)
Transport
Agriculture
Industrial processes
Waste
International aviation and maritime transport
4.6 4.2
5.6
3.6
5.1
-3
-2
-1
0
1
2
3
4
5
6
7
Average 2008 2009 2010 2011 2012Dis
tanc
e to
tar
get
(Mt
CO
2 eq
uiva
lent
per
yea
r)
Difference between target and GHG emissions Expected carbon sequestration from forestry (LULUCF)Planned use of Kyoto mechanisms by governments ERU issuedTotal (actual progress)

Country profiles
144 Greenhouse gas emission trends and projections in Europe 2012
Key GHG data (1) 1990 2008 2009 2010 2011 (2) 2012 1990–2011
2010–2011 (2)
Average 2008–2012 target under the Kyoto Protocol (Mt CO2-eq.) 256.0 256.0 256.0 256.0 256.0
Total GHG emissions (Mt CO2-eq.) 253.3 146.7 123.4 121.4 123.7 n.a. -51.2% 1.9%
GHG from international bunkers (3) (Mt CO2-eq.) 3.5 0.7 0.6 0.6 n.a. n.a. n.a. n.a.
GHG per capita (t CO2-eq. / capita) 10.9 6.8 5.7 5.7 5.8 n.a. -47.1% 2.2%
GHG per GDP (constant prices) (4) (g CO2-eq. / euro) 3 655 1 493 1 344 1 344 1 338 n.a. -63.4% -0.5%
Share of GHG in total EU-27 emissions (%) 4.5 % 2.9 % 2.7 % 2.6 % 2.7 % n.a. -40.8% 4.6%
EU ETS allocated allowances (free + auctioning) 71.8 73.9 75.0 75.0 n.a. 0.0%
EU ETS verified emissions - all installations (5) (Mt CO2-eq.) 63.8 49.0 47.3 51.2 n.a. 8.2%
EU ETS verified emissions - constant scope (6) (Mt CO2-eq.) 63.6 48.9 46.7 49.9 n.a. 6.8%
Share of EU ETS verified emissions (all install.) in total GHG (%) 43.5 % 39.7 % 39.0 % 41.4 % n.a. 6.1%
ETS verified emissions compared to annual allowances (7) (%) 88.9% 66.3% 63.1% 68.3% n.a. 8.2%
GHG emissions in the non-ETS sectors 82.9 74.4 74.0 72.5 n.a. -2.1%
Equivalent annual target for non-ETS GHG emissions 184.2 182.0 181.0 181.0 n.a. 0.0%
Share of GHG emissions (excluding international bunkers) by main source and by gas in 2010 (1) (8)
Assessment of short-term GHG trend (2009–2010)
Key data and trends on renewable energy 2008 2009 2010 2020 target
Share of renewable energy in final consumption 20.3% 22.4% 23.4% 24.0%
Share of renewable energy in transport 1.7% 1.6% 3.2% 10.0%
Share of renewable energy in electricity 30.9% 30.5% 0.0% n.a.
Share of renewable energy in heating & cooling 23.2% 26.4% 27.2% n.a.
Source: EurostatSource and additional information
Greenhouse gas emission data and EU ETS data
Romania was among those few countries whose emissions decreased between 2009 and 2010 (-1.6%). Emissions decreased mainly in public electricity and heat production, road transport and agriculture. The emission decrease from public electricity and heat production reflects an increase in hydro power production and a decline of thermal power production. The lower emissions from road transport are mainly due to the continuation of the economic crisis. In addition agricultural emissions declined considerably because of strong declines of cattle and sheep population.
www.eea.europa.eu/themes/climate/data-viewers
(5) All installations included. This includes new entrants and closures. Data from the community independent transaction log (CITL) as of 31 July 2012. The CITL regularly receives new information (including delayed verified emissions data, new entrants and closures) so the figures shown may change over time.
(7) "+" and "-" mean that verified emissions exceeded allowances or were below allowances, respectively. Annual allowances include allocated allowances and allowances auctioned during the same year.
(8) LULUCF sector and emissions from international bunkers excluded. Due to independent rounding the sums may not necessarily add up.
(6) Constant scope: includes only those installations with verified emissions available for 2008, 2009, 2010 and 2011.
(1) Total greenhouse gas emissions (GHG), GHG per capita, GHG per GDP and shares of GHG do not include emissions and removals from LULUCF (carbon sinks) and emissions from international bunkers.
(3) International bunkers: international aviation and international maritime transport.
(4) Gross domestic product (GDP) in 2005 market prices - not suitable for a ranking or quantitative comparison between countries for the same year. GDP information for the year 1990 is not available for some countries. For this reason, the 'GHG per GDP' values presented in the '1990' column correspond to the following years: 1991 (EU-15, Bulgaria, Germany, Hungary and Malta), 1992 (Slovakia), 1993 (EU-27 and Estonia) and 1995 (Croatia). Source GDP: Annual macro-economic database (AMECO), European Commission, 2012.
(2) Based on EEA estimate of 2011 emissions.
GHG trends and projections in Romania
34.5 %
24.0 %
12.5 %
10.5 %
13.8 % 4.7 % 0.1 %
Energy supply
Energy use (excluding transport)
Transport
Industrial processes
Agriculture
Waste
Other 71.8 %
18.2 %
9.4 % 0.6 %
CO2
CH4
N2O
F-gases
0%
5%
10%
15%
20%
25%
30%
35%
2004 2006 2008 2010 2012 2014 2016 2018 2020
Share of renewable energy in gross final consumptionShare of renewable energy in final consumption of energy in transportShare of renewable energy in final electricity consumptionShare of renewable energy in final consumption of energy for heating and coolingRenewable energy target (gross final energy consumption)Renewable energy target (transport)

Country profiles
145Greenhouse gas emission trends and projections in Europe 2012
GHG trends and projections 1990–2020 — total emissions
GHG trends and projections 1990–2020 — emissions by sector
Progress towards Kyoto target
Note: The difference between target and GHG emissions concerns the sectors not covered by the EU ETS. A positive value indicates emissions lower than the average target.
Average 2008–2011 emissions in Romania were 53.7 % lower than the base-year level, well below the Kyoto target of -8 % for the period 2008–2012. In the sectors not covered by the EU ETS, emissions were significantly lower than their respective target, by an amount equivalent to 38.1 % of base-year emissions. LULUCF activities are expected to decrease net emissions by an annual amount equivalent to 1.1 % of base-year level emissions. Taking all these effects into account, average emissions in the sectors not covered by the EU ETS in Romania were standing below their target level, by a gap representing 39.1 % of the base-year emissions. Romania was therefore on track towards its Kyoto target by the end of 2011.
Source: National GHG inventory report, 2012; EEA proxy estimate of 2011 GHG emissions; Primes–Gains GHG projections, 2010.
Note: GHG emission projections are represent either through dashed lines (with existing measures) or dotted lines (additional measures).
-50
0
50
100
150
200
250
300
1990 1995 2000 2005 2010 2015 2020
Mt
CO
2 eq
uiva
lent
Projections (with existing measures)
Projections (with additional measures)
Total emissions including bunkers
Total emissions excluding bunkers (KyotoProtocol)
Emissions included in emission trading (EUETS)
CO2 emissions/removals from carbon sinks
Kyoto base year
Kyoto target
0
10
20
30
40
50
60
70
80
90
100
1990 1995 2000 2005 2010 2015 2020
Mt
CO
2 eq
uiva
lent
Energy supply
Energy use (excluding transport)
Transport
Agriculture
Industrial processes
Waste
International aviation and maritime transport
108.8 104.3 110.7 109.5 110.5
-20
0
20
40
60
80
100
120
Average 2008 2009 2010 2011 2012Dis
tanc
e to
tar
get
(Mt
CO
2 eq
uiva
lent
per
yea
r)
Difference between target and GHG emissions Expected carbon sequestration from forestry (LULUCF)Planned use of Kyoto mechanisms by governments ERU issuedTotal (actual progress)

Country profiles
146 Greenhouse gas emission trends and projections in Europe 2012
Key GHG data (1) 1990 2008 2009 2010 2011 (2) 2012 1990–2011
2010–2011 (2)
Average 2008–2012 target under the Kyoto Protocol (Mt CO2-eq.) 66.3 66.3 66.3 66.3 66.3
Total GHG emissions (Mt CO2-eq.) 71.8 50.1 44.2 46.0 45.9 n.a. -36.0% -0.1%
GHG from international bunkers (3) (Mt CO2-eq.) 0.1 0.2 0.1 0.1 n.a. n.a. n.a. n.a.
GHG per capita (t CO2-eq. / capita) 13.6 9.3 8.2 8.5 8.4 n.a. -37.8% -0.3%
GHG per GDP (constant prices) (4) (g CO2-eq. / euro) 2 736 1 028 954 953 921 n.a. -66.3% -3.4%
Share of GHG in total EU-27 emissions (%) 1.3 % 1.0 % 1.0 % 1.0 % 1.0 % n.a. -22.4% 2.5%
EU ETS allocated allowances (free + auctioning) 32.2 32.1 32.4 32.4 n.a. 0.0%
EU ETS verified emissions - all installations (5) (Mt CO2-eq.) 25.3 21.6 21.7 22.2 n.a. 2.4%
EU ETS verified emissions - constant scope (6) (Mt CO2-eq.) 25.1 20.8 20.7 21.0 n.a. 1.4%
Share of EU ETS verified emissions (all install.) in total GHG (%) 50.6 % 48.9 % 47.2 % 48.4 % n.a. 2.5%
ETS verified emissions compared to annual allowances (7) (%) 78.8% 67.2% 67.1% 68.7% n.a. 2.4%
GHG emissions in the non-ETS sectors 24.7 22.6 24.3 23.7 n.a. -2.4%
Equivalent annual target for non-ETS GHG emissions 34.1 34.1 33.9 33.9 n.a. 0.0%
Share of GHG emissions (excluding international bunkers) by main source and by gas in 2010 (1) (8)
Assessment of short-term GHG trend (2009–2010)
Key data and trends on renewable energy 2008 2009 2010 2020 target
Share of renewable energy in final consumption 8.4% 10.4% 9.8% 14.0%
Share of renewable energy in transport 6.4% 9.2% 7.8% 10.0%
Share of renewable energy in electricity 17.8% 17.8% 0.0% n.a.
Share of renewable energy in heating & cooling 6.3% 8.5% 8.0% n.a.
Source: EurostatSource and additional information
Greenhouse gas emission data and EU ETS data
In 2010 emissions increased by 4.1% compared to 2009. As a result of the economic recovery emissions from petroleum refining and from iron and steel production increased most. Steel production grew by 22 % compared to 2009. In addition, emissions from road transport increased considerably.
www.eea.europa.eu/themes/climate/data-viewers
(5) All installations included. This includes new entrants and closures. Data from the community independent transaction log (CITL) as of 31 July 2012. The CITL regularly receives new information (including delayed verified emissions data, new entrants and closures) so the figures shown may change over time.
(7) "+" and "-" mean that verified emissions exceeded allowances or were below allowances, respectively. Annual allowances include allocated allowances and allowances auctioned during the same year.
(8) LULUCF sector and emissions from international bunkers excluded. Due to independent rounding the sums may not necessarily add up.
(6) Constant scope: includes only those installations with verified emissions available for 2008, 2009, 2010 and 2011.
(1) Total greenhouse gas emissions (GHG), GHG per capita, GHG per GDP and shares of GHG do not include emissions and removals from LULUCF (carbon sinks) and emissions from international bunkers.
(3) International bunkers: international aviation and international maritime transport.
(4) Gross domestic product (GDP) in 2005 market prices - not suitable for a ranking or quantitative comparison between countries for the same year. GDP information for the year 1990 is not available for some countries. For this reason, the 'GHG per GDP' values presented in the '1990' column correspond to the following years: 1991 (EU-15, Bulgaria, Germany, Hungary and Malta), 1992 (Slovakia), 1993 (EU-27 and Estonia) and 1995 (Croatia). Source GDP: Annual macro-economic database (AMECO), European Commission, 2012.
(2) Based on EEA estimate of 2011 emissions.
GHG trends and projections in Slovakia
23.0 %
32.2 % 14.5 %
18.5 %
6.7 % 4.8 % 0.4 %
Energy supply
Energy use (excluding transport)
Transport
Industrial processes
Agriculture
Waste
Other
82.7 %
9.2 %
7.4 % 0.8 %
CO2
CH4
N2O
F-gases
0%2%4%6%8%
10%12%14%16%18%20%
2004 2006 2008 2010 2012 2014 2016 2018 2020
Share of renewable energy in gross final consumptionShare of renewable energy in final consumption of energy in transportShare of renewable energy in final electricity consumptionShare of renewable energy in final consumption of energy for heating and coolingRenewable energy target (gross final energy consumption)Renewable energy target (transport)
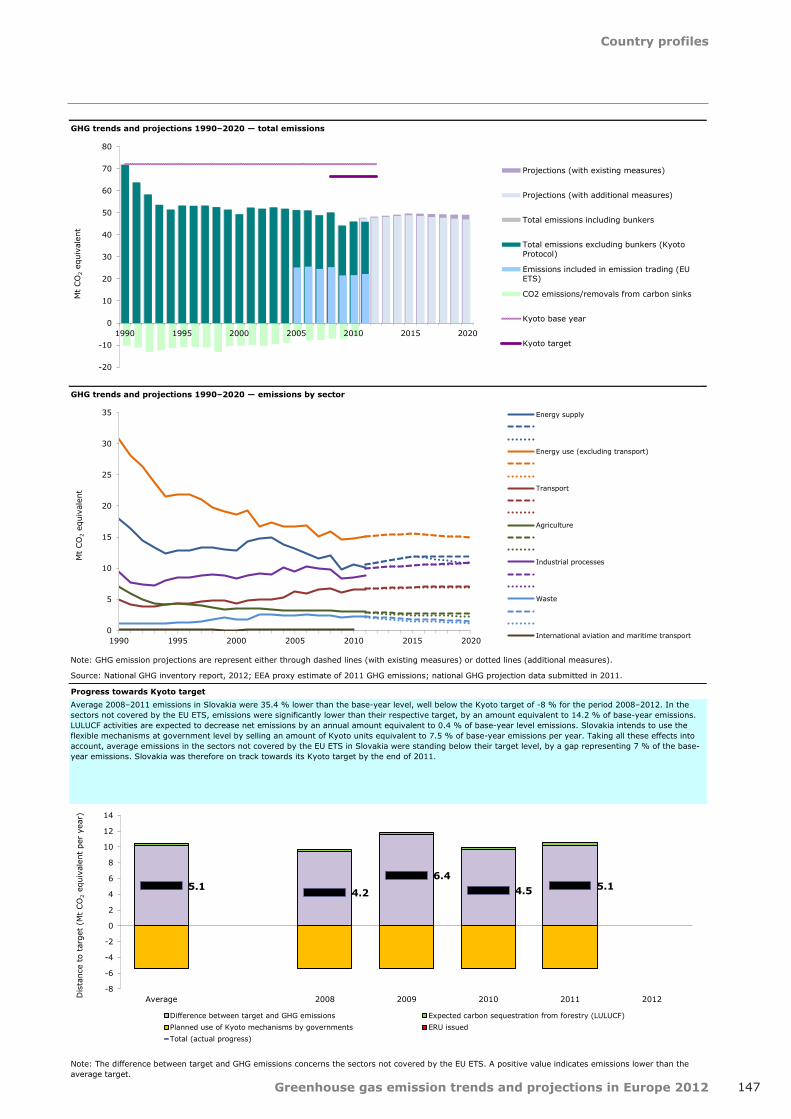
Country profiles
147Greenhouse gas emission trends and projections in Europe 2012
GHG trends and projections 1990–2020 — total emissions
GHG trends and projections 1990–2020 — emissions by sector
Progress towards Kyoto target
Note: The difference between target and GHG emissions concerns the sectors not covered by the EU ETS. A positive value indicates emissions lower than the average target.
Average 2008–2011 emissions in Slovakia were 35.4 % lower than the base-year level, well below the Kyoto target of -8 % for the period 2008–2012. In the sectors not covered by the EU ETS, emissions were significantly lower than their respective target, by an amount equivalent to 14.2 % of base-year emissions. LULUCF activities are expected to decrease net emissions by an annual amount equivalent to 0.4 % of base-year level emissions. Slovakia intends to use the flexible mechanisms at government level by selling an amount of Kyoto units equivalent to 7.5 % of base-year emissions per year. Taking all these effects into account, average emissions in the sectors not covered by the EU ETS in Slovakia were standing below their target level, by a gap representing 7 % of the base-year emissions. Slovakia was therefore on track towards its Kyoto target by the end of 2011.
Note: GHG emission projections are represent either through dashed lines (with existing measures) or dotted lines (additional measures).
Source: National GHG inventory report, 2012; EEA proxy estimate of 2011 GHG emissions; national GHG projection data submitted in 2011.
-20
-10
0
10
20
30
40
50
60
70
80
1990 1995 2000 2005 2010 2015 2020
Mt
CO
2 eq
uiva
lent
Projections (with existing measures)
Projections (with additional measures)
Total emissions including bunkers
Total emissions excluding bunkers (KyotoProtocol)
Emissions included in emission trading (EUETS)
CO2 emissions/removals from carbon sinks
Kyoto base year
Kyoto target
0
5
10
15
20
25
30
35
1990 1995 2000 2005 2010 2015 2020
Mt
CO
2 eq
uiva
lent
Energy supply
Energy use (excluding transport)
Transport
Agriculture
Industrial processes
Waste
International aviation and maritime transport
5.1 4.2
6.4 4.5 5.1
-8
-6
-4
-2
0
2
4
6
8
10
12
14
Average 2008 2009 2010 2011 2012Dis
tanc
e to
tar
get
(Mt
CO
2 eq
uiva
lent
per
yea
r)
Difference between target and GHG emissions Expected carbon sequestration from forestry (LULUCF)Planned use of Kyoto mechanisms by governments ERU issuedTotal (actual progress)
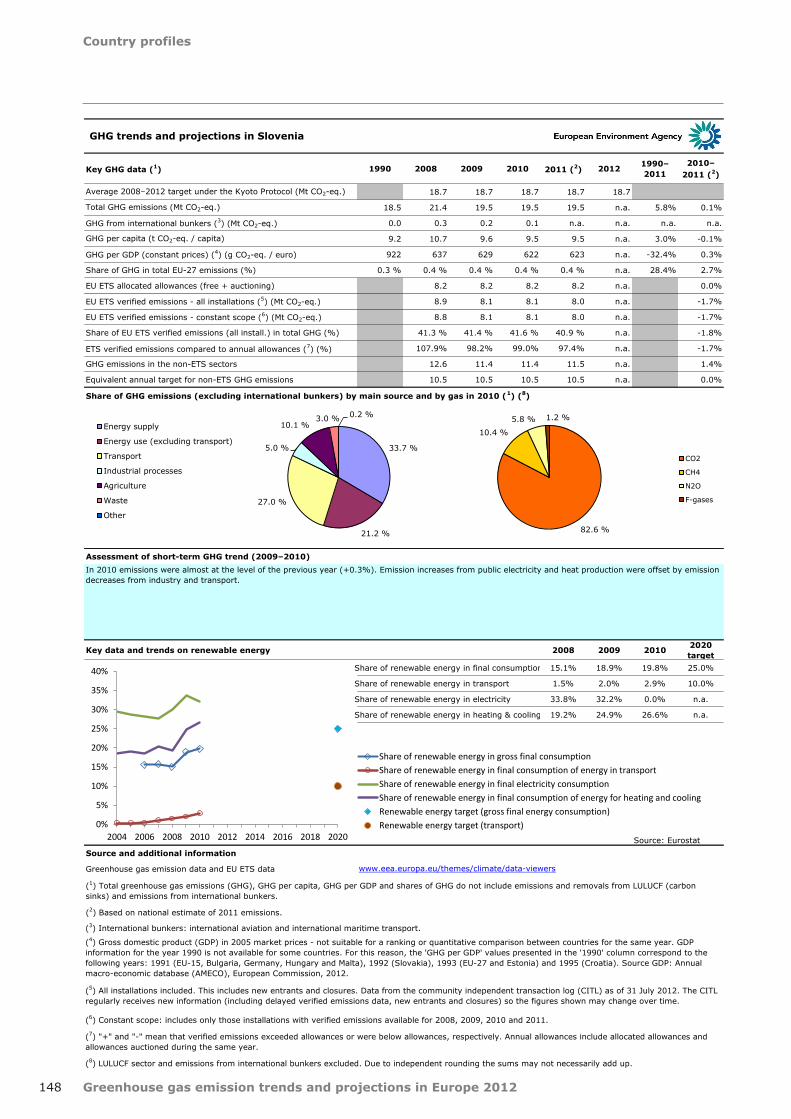
Country profiles
148 Greenhouse gas emission trends and projections in Europe 2012
Key GHG data (1) 1990 2008 2009 2010 2011 (2) 2012 1990–2011
2010–2011 (2)
Average 2008–2012 target under the Kyoto Protocol (Mt CO2-eq.) 18.7 18.7 18.7 18.7 18.7
Total GHG emissions (Mt CO2-eq.) 18.5 21.4 19.5 19.5 19.5 n.a. 5.8% 0.1%
GHG from international bunkers (3) (Mt CO2-eq.) 0.0 0.3 0.2 0.1 n.a. n.a. n.a. n.a.
GHG per capita (t CO2-eq. / capita) 9.2 10.7 9.6 9.5 9.5 n.a. 3.0% -0.1%
GHG per GDP (constant prices) (4) (g CO2-eq. / euro) 922 637 629 622 623 n.a. -32.4% 0.3%
Share of GHG in total EU-27 emissions (%) 0.3 % 0.4 % 0.4 % 0.4 % 0.4 % n.a. 28.4% 2.7%
EU ETS allocated allowances (free + auctioning) 8.2 8.2 8.2 8.2 n.a. 0.0%
EU ETS verified emissions - all installations (5) (Mt CO2-eq.) 8.9 8.1 8.1 8.0 n.a. -1.7%
EU ETS verified emissions - constant scope (6) (Mt CO2-eq.) 8.8 8.1 8.1 8.0 n.a. -1.7%
Share of EU ETS verified emissions (all install.) in total GHG (%) 41.3 % 41.4 % 41.6 % 40.9 % n.a. -1.8%
ETS verified emissions compared to annual allowances (7) (%) 107.9% 98.2% 99.0% 97.4% n.a. -1.7%
GHG emissions in the non-ETS sectors 12.6 11.4 11.4 11.5 n.a. 1.4%
Equivalent annual target for non-ETS GHG emissions 10.5 10.5 10.5 10.5 n.a. 0.0%
Share of GHG emissions (excluding international bunkers) by main source and by gas in 2010 (1) (8)
Assessment of short-term GHG trend (2009–2010)
Key data and trends on renewable energy 2008 2009 2010 2020 target
Share of renewable energy in final consumption 15.1% 18.9% 19.8% 25.0%
Share of renewable energy in transport 1.5% 2.0% 2.9% 10.0%
Share of renewable energy in electricity 33.8% 32.2% 0.0% n.a.
Share of renewable energy in heating & cooling 19.2% 24.9% 26.6% n.a.
Source: EurostatSource and additional information
Greenhouse gas emission data and EU ETS data
In 2010 emissions were almost at the level of the previous year (+0.3%). Emission increases from public electricity and heat production were offset by emission decreases from industry and transport.
www.eea.europa.eu/themes/climate/data-viewers
(5) All installations included. This includes new entrants and closures. Data from the community independent transaction log (CITL) as of 31 July 2012. The CITL regularly receives new information (including delayed verified emissions data, new entrants and closures) so the figures shown may change over time.
(7) "+" and "-" mean that verified emissions exceeded allowances or were below allowances, respectively. Annual allowances include allocated allowances and allowances auctioned during the same year.
(8) LULUCF sector and emissions from international bunkers excluded. Due to independent rounding the sums may not necessarily add up.
(6) Constant scope: includes only those installations with verified emissions available for 2008, 2009, 2010 and 2011.
(1) Total greenhouse gas emissions (GHG), GHG per capita, GHG per GDP and shares of GHG do not include emissions and removals from LULUCF (carbon sinks) and emissions from international bunkers.
(3) International bunkers: international aviation and international maritime transport.
(4) Gross domestic product (GDP) in 2005 market prices - not suitable for a ranking or quantitative comparison between countries for the same year. GDP information for the year 1990 is not available for some countries. For this reason, the 'GHG per GDP' values presented in the '1990' column correspond to the following years: 1991 (EU-15, Bulgaria, Germany, Hungary and Malta), 1992 (Slovakia), 1993 (EU-27 and Estonia) and 1995 (Croatia). Source GDP: Annual macro-economic database (AMECO), European Commission, 2012.
(2) Based on national estimate of 2011 emissions.
GHG trends and projections in Slovenia
33.7 %
21.2 %
27.0 %
5.0 %
10.1 % 3.0 % 0.2 %
Energy supply
Energy use (excluding transport)
Transport
Industrial processes
Agriculture
Waste
Other
82.6 %
10.4 %
5.8 % 1.2 %
CO2
CH4
N2O
F-gases
0%
5%
10%
15%
20%
25%
30%
35%
40%
2004 2006 2008 2010 2012 2014 2016 2018 2020
Share of renewable energy in gross final consumptionShare of renewable energy in final consumption of energy in transportShare of renewable energy in final electricity consumptionShare of renewable energy in final consumption of energy for heating and coolingRenewable energy target (gross final energy consumption)Renewable energy target (transport)
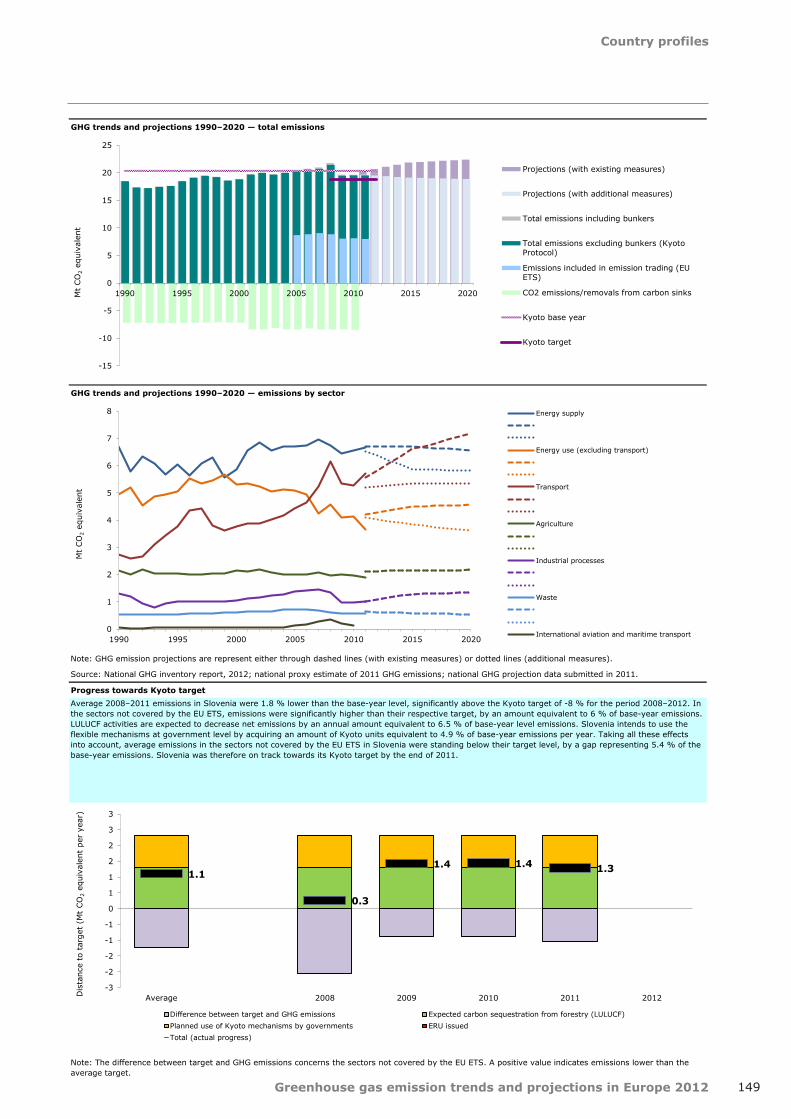
Country profiles
149Greenhouse gas emission trends and projections in Europe 2012
GHG trends and projections 1990–2020 — total emissions
GHG trends and projections 1990–2020 — emissions by sector
Progress towards Kyoto target
Note: The difference between target and GHG emissions concerns the sectors not covered by the EU ETS. A positive value indicates emissions lower than the average target.
Average 2008–2011 emissions in Slovenia were 1.8 % lower than the base-year level, significantly above the Kyoto target of -8 % for the period 2008–2012. In the sectors not covered by the EU ETS, emissions were significantly higher than their respective target, by an amount equivalent to 6 % of base-year emissions. LULUCF activities are expected to decrease net emissions by an annual amount equivalent to 6.5 % of base-year level emissions. Slovenia intends to use the flexible mechanisms at government level by acquiring an amount of Kyoto units equivalent to 4.9 % of base-year emissions per year. Taking all these effects into account, average emissions in the sectors not covered by the EU ETS in Slovenia were standing below their target level, by a gap representing 5.4 % of the base-year emissions. Slovenia was therefore on track towards its Kyoto target by the end of 2011.
Note: GHG emission projections are represent either through dashed lines (with existing measures) or dotted lines (additional measures).
Source: National GHG inventory report, 2012; national proxy estimate of 2011 GHG emissions; national GHG projection data submitted in 2011.
-15
-10
-5
0
5
10
15
20
25
1990 1995 2000 2005 2010 2015 2020Mt
CO
2 eq
uiva
lent
Projections (with existing measures)
Projections (with additional measures)
Total emissions including bunkers
Total emissions excluding bunkers (KyotoProtocol)
Emissions included in emission trading (EUETS)
CO2 emissions/removals from carbon sinks
Kyoto base year
Kyoto target
0
1
2
3
4
5
6
7
8
1990 1995 2000 2005 2010 2015 2020
Mt
CO
2 eq
uiva
lent
Energy supply
Energy use (excluding transport)
Transport
Agriculture
Industrial processes
Waste
International aviation and maritime transport
1.1
0.3
1.4 1.4 1.3
-3
-2
-2
-1
-1
0
1
1
2
2
3
3
Average 2008 2009 2010 2011 2012Dis
tanc
e to
tar
get
(Mt
CO
2 eq
uiva
lent
per
yea
r)
Difference between target and GHG emissions Expected carbon sequestration from forestry (LULUCF)Planned use of Kyoto mechanisms by governments ERU issuedTotal (actual progress)

Country profiles
150 Greenhouse gas emission trends and projections in Europe 2012
Key GHG data (1) 1990 2008 2009 2010 2011 (2) 2012 1990–2011
2010–2011 (2)
Average 2008–2012 target under the Kyoto Protocol (Mt CO2-eq.) 333.2 333.2 333.2 333.2 333.2
Total GHG emissions (Mt CO2-eq.) 282.8 403.8 366.3 355.9 356.1 n.a. 25.9% 0.1%
GHG from international bunkers (3) (Mt CO2-eq.) 17.5 41.8 40.6 40.1 n.a. n.a. n.a. n.a.
GHG per capita (t CO2-eq. / capita) 7.3 8.9 8.0 7.7 7.7 n.a. 5.9% -0.3%
GHG per GDP (constant prices) (4) (g CO2-eq. / euro) 481 409 385 374 372 n.a. -22.7% -0.6%
Share of GHG in total EU-27 emissions (%) 5.1 % 8.1 % 7.9 % 7.5 % 7.7 % n.a. 52.8% 2.7%
EU ETS allocated allowances (free + auctioning) 153.9 150.7 150.9 150.9 n.a. 0.0%
EU ETS verified emissions - all installations (5) (Mt CO2-eq.) 163.5 136.9 121.5 132.7 n.a. 9.2%
EU ETS verified emissions - constant scope (6) (Mt CO2-eq.) 162.6 136.4 120.3 128.9 n.a. 7.1%
Share of EU ETS verified emissions (all install.) in total GHG (%) 40.5 % 37.4 % 34.1 % 37.3 % n.a. 9.1%
ETS verified emissions compared to annual allowances (7) (%) 106.2% 90.9% 80.5% 87.9% n.a. 9.2%
GHG emissions in the non-ETS sectors 240.4 229.3 234.4 223.4 n.a. -4.7%
Equivalent annual target for non-ETS GHG emissions 179.4 182.5 182.4 182.4 n.a. 0.0%
Share of GHG emissions (excluding international bunkers) by main source and by gas in 2010 (1) (8)
Assessment of short-term GHG trend (2009–2010)
Key data and trends on renewable energy 2008 2009 2010 2020 target
Share of renewable energy in final consumption 10.6% 12.8% 13.8% 20.0%
Share of renewable energy in transport 1.9% 3.5% 4.7% 10.0%
Share of renewable energy in electricity 27.8% 29.5% 0.0% n.a.
Share of renewable energy in heating & cooling 11.2% 12.8% 12.7% n.a.
Source: EurostatSource and additional information
Greenhouse gas emission data and EU ETS data
Spain showed decreasing emissions between 2009 and 2010 together with only a few other EU countries (-2.8%). The emission decrease is mainly due to public electricity and heat production and road transport. The emission decline from public electricity and heat productions reflects a marked decline in thermal power production mainly due to increasing hydro, wind and nuclear power production. Emission decreases from transport mainly reflect the continuing economic crisis in Spain.
www.eea.europa.eu/themes/climate/data-viewers
(5) All installations included. This includes new entrants and closures. Data from the community independent transaction log (CITL) as of 31 July 2012. The CITL regularly receives new information (including delayed verified emissions data, new entrants and closures) so the figures shown may change over time.
(7) "+" and "-" mean that verified emissions exceeded allowances or were below allowances, respectively. Annual allowances include allocated allowances and allowances auctioned during the same year.
(8) LULUCF sector and emissions from international bunkers excluded. Due to independent rounding the sums may not necessarily add up.
(6) Constant scope: includes only those installations with verified emissions available for 2008, 2009, 2010 and 2011.
(1) Total greenhouse gas emissions (GHG), GHG per capita, GHG per GDP and shares of GHG do not include emissions and removals from LULUCF (carbon sinks) and emissions from international bunkers.
(3) International bunkers: international aviation and international maritime transport.
(4) Gross domestic product (GDP) in 2005 market prices - not suitable for a ranking or quantitative comparison between countries for the same year. GDP information for the year 1990 is not available for some countries. For this reason, the 'GHG per GDP' values presented in the '1990' column correspond to the following years: 1991 (EU-15, Bulgaria, Germany, Hungary and Malta), 1992 (Slovakia), 1993 (EU-27 and Estonia) and 1995 (Croatia). Source GDP: Annual macro-economic database (AMECO), European Commission, 2012.
(2) Based on national estimate of 2011 emissions.
GHG trends and projections in Spain
21.3 %
28.9 % 25.7 %
7.9 %
11.2 % 4.2 % 0.8 %
Energy supply
Energy use (excluding transport)
Transport
Industrial processes
Agriculture
Waste
Other79.9 %
9.8 %
7.8 % 2.5 %
CO2
CH4
N2O
F-gases
0%
5%
10%
15%
20%
25%
30%
35%
2004 2006 2008 2010 2012 2014 2016 2018 2020
Share of renewable energy in gross final consumptionShare of renewable energy in final consumption of energy in transportShare of renewable energy in final electricity consumptionShare of renewable energy in final consumption of energy for heating and coolingRenewable energy target (gross final energy consumption)Renewable energy target (transport)

Country profiles
151Greenhouse gas emission trends and projections in Europe 2012
GHG trends and projections 1990–2020 — total emissions
GHG trends and projections 1990–2020 — emissions by sector
Progress towards Kyoto target
Note: The difference between target and GHG emissions concerns the sectors not covered by the EU ETS. A positive value indicates emissions lower than the average target.
Average 2008–2011 emissions in Spain were 27.9 % higher than the base-year level, significantly above the burden-sharing target of 15 % for the period 2008–2012. In the sectors not covered by the EU ETS, emissions were significantly higher than their respective target, by an amount equivalent to 17.3 % of base-year emissions. LULUCF activities are expected to decrease net emissions by an annual amount equivalent to 3.9 % of base-year level emissions. Spain intends to use the flexible mechanisms at government level by acquiring an amount of Kyoto units equivalent to 13.4 % of base-year emissions per year. Taking all these effects into account, a very small current shortfall of 0.1 Mt CO2-equivalent per year (0.03 % of base-year emissions) remains. Such a gap could, for example, be bridged if non-ETS emissions were not to increase in 2012 compared to 2011 levels. Nevertheless, Spain faces the challenge of fulfilling by 2015 its plan to acquire an average of 38.8 million units per year of the commitment period. Although the total projected quantities of credits from flexible mechanisms for the first commitment period increased from 159 to 194 million units compared to 2011, a concurrent rise in the budget was not reported. The reported budget of over EUR 400 million would currently be equivalent to a price of about EUR 2 per tonne of CO2.
Note: GHG emission projections are represent either through dashed lines (with existing measures) or dotted lines (additional measures).
Source: National GHG inventory report, 2012; national proxy estimate of 2011 GHG emissions; national GHG projection data submitted in 2011.
-100
0
100
200
300
400
500
600
1990 1995 2000 2005 2010 2015 2020
Mt
CO
2 eq
uiva
lent
Projections (with existing measures)
Projections (with additional measures)
Total emissions including bunkers
Total emissions excluding bunkers (KyotoProtocol)
Emissions included in emission trading (EUETS)
CO2 emissions/removals from carbon sinks
Kyoto base year
Kyoto target
0
20
40
60
80
100
120
140
1990 1995 2000 2005 2010 2015 2020
Mt
CO
2 eq
uiva
lent
Energy supply
Energy use (excluding transport)
Transport
Agriculture
Industrial processes
Waste
International aviation and maritime transport
-0.1 -10.8
3.4 -1.9 8.9
-80
-60
-40
-20
0
20
40
60
Average 2008 2009 2010 2011 2012Dis
tanc
e to
tar
get
(Mt
CO
2 eq
uiva
lent
per
yea
r)
Difference between target and GHG emissions Expected carbon sequestration from forestry (LULUCF)Planned use of Kyoto mechanisms by governments ERU issuedTotal (actual progress)

Country profiles
152 Greenhouse gas emission trends and projections in Europe 2012
Key GHG data (1) 1990 2008 2009 2010 2011 (2) 2012 1990–2011
2010–2011 (2)
Average 2008–2012 target under the Kyoto Protocol (Mt CO2-eq.) 75.0 75.0 75.0 75.0 75.0
Total GHG emissions (Mt CO2-eq.) 72.8 63.6 59.7 66.2 62.8 n.a. -13.6% -5.1%
GHG from international bunkers (3) (Mt CO2-eq.) 3.6 9.5 9.4 8.9 n.a. n.a. n.a. n.a.
GHG per capita (t CO2-eq. / capita) 8.5 6.9 6.4 7.1 6.7 n.a. -21.8% -5.9%
GHG per GDP (constant prices) (4) (g CO2-eq. / euro) 343 199 197 206 188 n.a. -45.2% -8.7%
Share of GHG in total EU-27 emissions (%) 1.3 % 1.3 % 1.3 % 1.4 % 1.4 % n.a. 4.8% -2.7%
EU ETS allocated allowances (free + auctioning) 20.8 21.1 23.6 23.6 n.a. 0.0%
EU ETS verified emissions - all installations (5) (Mt CO2-eq.) 20.1 17.5 22.7 19.8 n.a. -12.5%
EU ETS verified emissions - constant scope (6) (Mt CO2-eq.) 19.4 17.3 22.6 19.8 n.a. -12.3%
Share of EU ETS verified emissions (all install.) in total GHG (%) 31.6 % 29.3 % 34.2 % 31.6 % n.a. -7.7%
ETS verified emissions compared to annual allowances (7) (%) 96.7% 82.9% 96.2% 84.2% n.a. -12.5%
GHG emissions in the non-ETS sectors 43.5 42.2 43.6 43.0 n.a. -1.3%
Equivalent annual target for non-ETS GHG emissions 54.3 53.9 51.5 51.5 n.a. 0.0%
Share of GHG emissions (excluding international bunkers) by main source and by gas in 2010 (1) (8)
Assessment of short-term GHG trend (2009–2010)
Key data and trends on renewable energy 2008 2009 2010 2020 target
Share of renewable energy in final consumption 45.2% 48.1% 47.9% 49.0%
Share of renewable energy in transport 6.6% 7.3% 7.7% 10.0%
Share of renewable energy in electricity 58.3% 56.0% 0.0% n.a.
Share of renewable energy in heating & cooling 64.9% 68.1% 66.2% n.a.
Source: EurostatSource and additional information
Greenhouse gas emission data and EU ETS data
In comparison to 2009, in 2010 emissions increased by 11.0%. Emissions increased mainly in public electricity and heat production and in industry in particular in iron and steel production. Electricity consumption increased due to the economic recovery; thermal power production increased by more than one third and iron and steel production increased by more than 70%.
www.eea.europa.eu/themes/climate/data-viewers
(5) All installations included. This includes new entrants and closures. Data from the community independent transaction log (CITL) as of 31 July 2012. The CITL regularly receives new information (including delayed verified emissions data, new entrants and closures) so the figures shown may change over time.
(7) "+" and "-" mean that verified emissions exceeded allowances or were below allowances, respectively. Annual allowances include allocated allowances and allowances auctioned during the same year.
(8) LULUCF sector and emissions from international bunkers excluded. Due to independent rounding the sums may not necessarily add up.
(6) Constant scope: includes only those installations with verified emissions available for 2008, 2009, 2010 and 2011.
(1) Total greenhouse gas emissions (GHG), GHG per capita, GHG per GDP and shares of GHG do not include emissions and removals from LULUCF (carbon sinks) and emissions from international bunkers.
(3) International bunkers: international aviation and international maritime transport.
(4) Gross domestic product (GDP) in 2005 market prices - not suitable for a ranking or quantitative comparison between countries for the same year. GDP information for the year 1990 is not available for some countries. For this reason, the 'GHG per GDP' values presented in the '1990' column correspond to the following years: 1991 (EU-15, Bulgaria, Germany, Hungary and Malta), 1992 (Slovakia), 1993 (EU-27 and Estonia) and 1995 (Croatia). Source GDP: Annual macro-economic database (AMECO), European Commission, 2012.
(2) Based on EEA estimate of 2011 emissions.
GHG trends and projections in Sweden
21.3 %
22.0 %
31.3 %
10.3 %
11.9 % 2.8 % 0.5 %
Energy supply
Energy use (excluding transport)
Transport
Industrial processes
Agriculture
Waste
Other79.8 %
7.9 %
10.6 % 1.6 %
CO2
CH4
N2O
F-gases
0%
10%
20%
30%
40%
50%
60%
70%
80%
2004 2006 2008 2010 2012 2014 2016 2018 2020
Share of renewable energy in gross final consumptionShare of renewable energy in final consumption of energy in transportShare of renewable energy in final electricity consumptionShare of renewable energy in final consumption of energy for heating and coolingRenewable energy target (gross final energy consumption)Renewable energy target (transport)

Country profiles
153Greenhouse gas emission trends and projections in Europe 2012
GHG trends and projections 1990–2020 — total emissions
GHG trends and projections 1990–2020 — emissions by sector
Progress towards Kyoto target
Note: The difference between target and GHG emissions concerns the sectors not covered by the EU ETS. A positive value indicates emissions lower than the average target.
Average 2008–2011 emissions in Sweden were 12.6 % lower than the base-year level, well below the burden-sharing target of 4 % for the period 2008–2012. In the sectors not covered by the EU ETS, emissions were significantly lower than their respective target, by an amount equivalent to 13.5 % of base-year emissions. LULUCF activities are expected to decrease net emissions by an annual amount equivalent to 3 % of base-year level emissions. Taking all these effects into account, average emissions in the sectors not covered by the EU ETS in Sweden were standing below their target level, by a gap representing 16.4 % of the base-year emissions. Sweden was therefore on track towards its burden-sharing target by the end of 2011.
Note: GHG emission projections are represent either through dashed lines (with existing measures) or dotted lines (additional measures).
Source: National GHG inventory report, 2012; EEA proxy estimate of 2011 GHG emissions; national GHG projection data submitted in 2011.
-60
-40
-20
0
20
40
60
80
100
1990 1995 2000 2005 2010 2015 2020Mt
CO
2 eq
uiva
lent
Projections (with existing measures)
Projections (with additional measures)
Total emissions including bunkers
Total emissions excluding bunkers (KyotoProtocol)
Emissions included in emission trading (EUETS)
CO2 emissions/removals from carbon sinks
Kyoto base year
Kyoto target
0
5
10
15
20
25
30
1990 1995 2000 2005 2010 2015 2020
Mt
CO
2 eq
uiva
lent
Energy supply
Energy use (excluding transport)
Transport
Agriculture
Industrial processes
Waste
International aviation and maritime transport
11.9 12.9
13.9
10.0 10.6
0
2
4
6
8
10
12
14
16
Average 2008 2009 2010 2011 2012Dis
tanc
e to
tar
get
(Mt
CO
2 eq
uiva
lent
per
yea
r)
Difference between target and GHG emissions Expected carbon sequestration from forestry (LULUCF)Planned use of Kyoto mechanisms by governments ERU issuedTotal (actual progress)

Country profiles
154 Greenhouse gas emission trends and projections in Europe 2012
Key GHG data (1) 1990 2008 2009 2010 2011 (2) 2012 1990–2011
2010–2011 (2)
Average 2008–2012 target under the Kyoto Protocol (Mt CO2-eq.) 48.6 48.6 48.6 48.6 48.6
Total GHG emissions (Mt CO2-eq.) 53.1 53.8 52.5 54.2 50.1 n.a. -5.6% -7.6%
GHG from international bunkers (3) (Mt CO2-eq.) 3.2 4.3 4.1 4.3 n.a. n.a. n.a. n.a.
GHG per capita (t CO2-eq. / capita) 8.0 7.1 6.8 7.0 6.4 n.a. -19.9% -8.6%
GHG per GDP (constant prices) (4) (g CO2-eq. / euro) 210 164 163 164 149 n.a. -29.2% -9.3%
Share of GHG emissions (excluding international bunkers) by main source and by gas in 2010 (1) (8)
Assessment of short-term GHG trend (2009–2010)
Source and additional information
Greenhouse gas emission data and EU ETS data
In 2010 emissions increased by 3.4% in 2009. A rise of energy use in households and the tertiary sector in 2010 resulted in higher energy-related emissions compared to 2009. Emissions from gaseous fuel consumption increased by 5.7% due to the coldest winter in the past 15 years. Increased process-related emissions from the chemical industries (16%), from metal production (21%) and from mineral industries (6%) were also observed compared to the previous year.
www.eea.europa.eu/themes/climate/data-viewers
(8) LULUCF sector and emissions from international bunkers excluded. Due to independent rounding the sums may not necessarily add up.
(1) Total greenhouse gas emissions (GHG), GHG per capita, GHG per GDP and shares of GHG do not include emissions and removals from LULUCF (carbon sinks) and emissions from international bunkers.
(3) International bunkers: international aviation and international maritime transport.
(4) Gross domestic product (GDP) in 2005 market prices - not suitable for a ranking or quantitative comparison between countries for the same year. GDP information for the year 1990 is not available for some countries. For this reason, the 'GHG per GDP' values presented in the '1990' column correspond to the following years: 1991 (EU-15, Bulgaria, Germany, Hungary and Malta), 1992 (Slovakia), 1993 (EU-27 and Estonia) and 1995 (Croatia). Source GDP: Annual macro-economic database (AMECO), European Commission, 2012.
(2) Based on national estimate of 2011 emissions.
GHG trends and projections in Switzerland
8.2 %
42.7 %
30.3 %
6.8 %
10.5 % 1.1 % 0.4 % Energy supply
Energy use (excluding transport)
Transport
Industrial processes
Agriculture
Waste
Other
84.7 %
7.0 % 5.9 % 2.3 %
CO2
CH4
N2O
F-gases
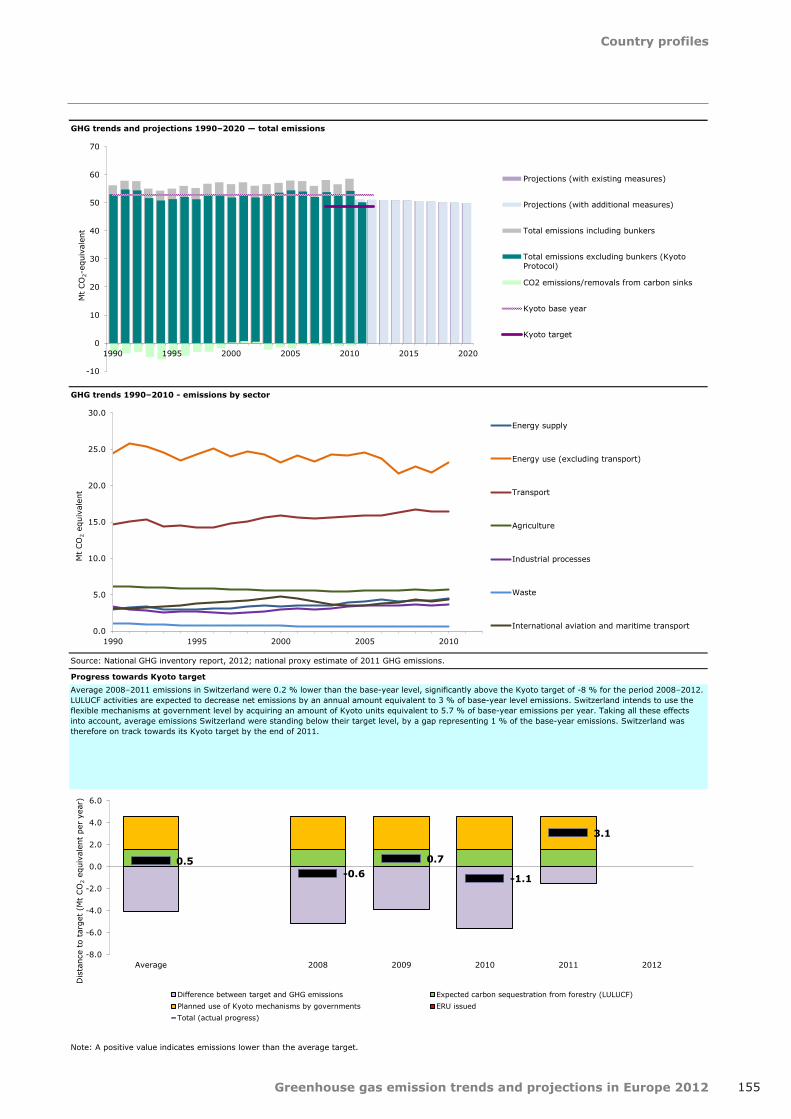
Country profiles
155Greenhouse gas emission trends and projections in Europe 2012
GHG trends and projections 1990–2020 — total emissions
GHG trends 1990–2010 - emissions by sector
Progress towards Kyoto target
Note: A positive value indicates emissions lower than the average target.
Average 2008–2011 emissions in Switzerland were 0.2 % lower than the base-year level, significantly above the Kyoto target of -8 % for the period 2008–2012. LULUCF activities are expected to decrease net emissions by an annual amount equivalent to 3 % of base-year level emissions. Switzerland intends to use the flexible mechanisms at government level by acquiring an amount of Kyoto units equivalent to 5.7 % of base-year emissions per year. Taking all these effects into account, average emissions Switzerland were standing below their target level, by a gap representing 1 % of the base-year emissions. Switzerland was therefore on track towards its Kyoto target by the end of 2011.
Source: National GHG inventory report, 2012; national proxy estimate of 2011 GHG emissions.
0.5 -0.6
0.7
-1.1
3.1
-8.0
-6.0
-4.0
-2.0
0.0
2.0
4.0
6.0
Average 2008 2009 2010 2011 2012
Dis
tanc
e to
tar
get
(Mt
CO
2 eq
uiva
lent
per
yea
r)
Difference between target and GHG emissions Expected carbon sequestration from forestry (LULUCF)Planned use of Kyoto mechanisms by governments ERU issuedTotal (actual progress)
-10
0
10
20
30
40
50
60
70
1990 1995 2000 2005 2010 2015 2020
Mt
CO
2-eq
uiva
lent
Projections (with existing measures)
Projections (with additional measures)
Total emissions including bunkers
Total emissions excluding bunkers (KyotoProtocol)
CO2 emissions/removals from carbon sinks
Kyoto base year
Kyoto target
0.0
5.0
10.0
15.0
20.0
25.0
30.0
1990 1995 2000 2005 2010
Mt
CO
2 eq
uiva
lent
Energy supply
Energy use (excluding transport)
Transport
Agriculture
Industrial processes
Waste
International aviation and maritime transport
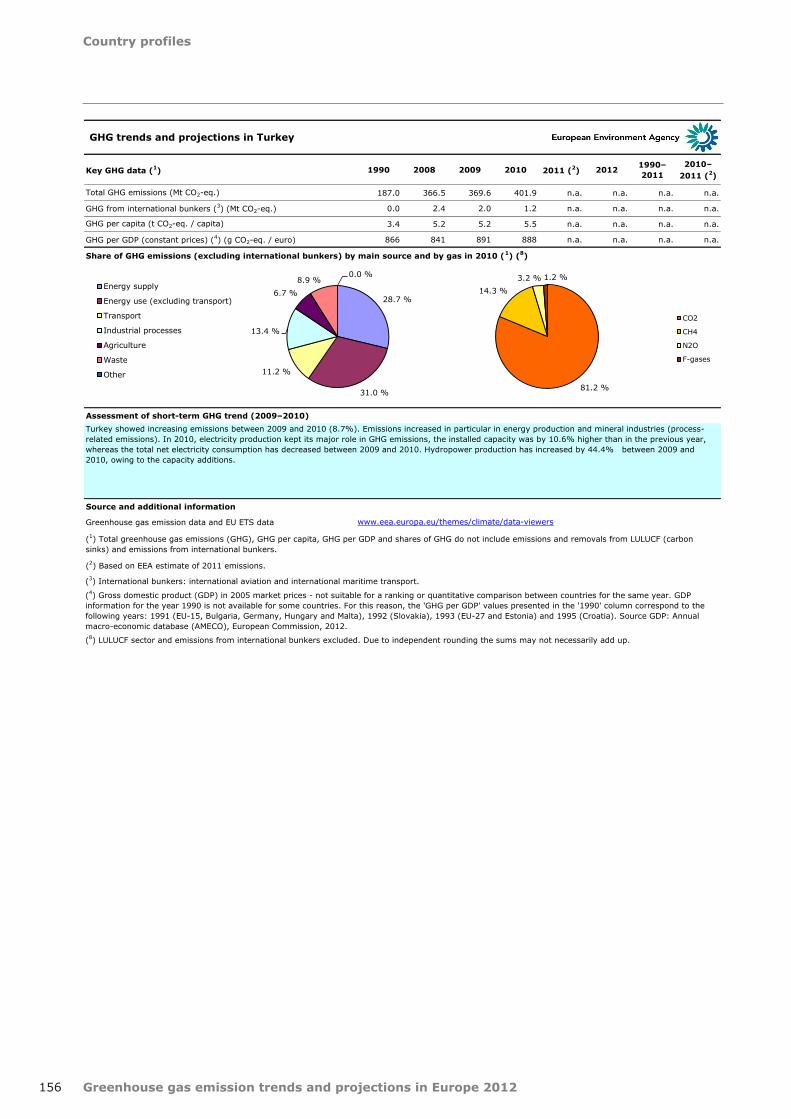
Country profiles
156 Greenhouse gas emission trends and projections in Europe 2012
Key GHG data (1) 1990 2008 2009 2010 2011 (2) 2012 1990–2011
2010–2011 (2)
Total GHG emissions (Mt CO2-eq.) 187.0 366.5 369.6 401.9 n.a. n.a. n.a. n.a.
GHG from international bunkers (3) (Mt CO2-eq.) 0.0 2.4 2.0 1.2 n.a. n.a. n.a. n.a.
GHG per capita (t CO2-eq. / capita) 3.4 5.2 5.2 5.5 n.a. n.a. n.a. n.a.
GHG per GDP (constant prices) (4) (g CO2-eq. / euro) 866 841 891 888 n.a. n.a. n.a. n.a.
Share of GHG emissions (excluding international bunkers) by main source and by gas in 2010 (1) (8)
Assessment of short-term GHG trend (2009–2010)
Source and additional information
Greenhouse gas emission data and EU ETS data
Turkey showed increasing emissions between 2009 and 2010 (8.7%). Emissions increased in particular in energy production and mineral industries (process-related emissions). In 2010, electricity production kept its major role in GHG emissions, the installed capacity was by 10.6% higher than in the previous year, whereas the total net electricity consumption has decreased between 2009 and 2010. Hydropower production has increased by 44.4% between 2009 and 2010, owing to the capacity additions.
www.eea.europa.eu/themes/climate/data-viewers
(8) LULUCF sector and emissions from international bunkers excluded. Due to independent rounding the sums may not necessarily add up.
(1) Total greenhouse gas emissions (GHG), GHG per capita, GHG per GDP and shares of GHG do not include emissions and removals from LULUCF (carbon sinks) and emissions from international bunkers.
(3) International bunkers: international aviation and international maritime transport.
(4) Gross domestic product (GDP) in 2005 market prices - not suitable for a ranking or quantitative comparison between countries for the same year. GDP information for the year 1990 is not available for some countries. For this reason, the 'GHG per GDP' values presented in the '1990' column correspond to the following years: 1991 (EU-15, Bulgaria, Germany, Hungary and Malta), 1992 (Slovakia), 1993 (EU-27 and Estonia) and 1995 (Croatia). Source GDP: Annual macro-economic database (AMECO), European Commission, 2012.
(2) Based on EEA estimate of 2011 emissions.
GHG trends and projections in Turkey
28.7 %
31.0 %
11.2 %
13.4 %
6.7 % 8.9 %
0.0 % Energy supply
Energy use (excluding transport)
Transport
Industrial processes
Agriculture
Waste
Other81.2 %
14.3 % 3.2 % 1.2 %
CO2
CH4
N2O
F-gases
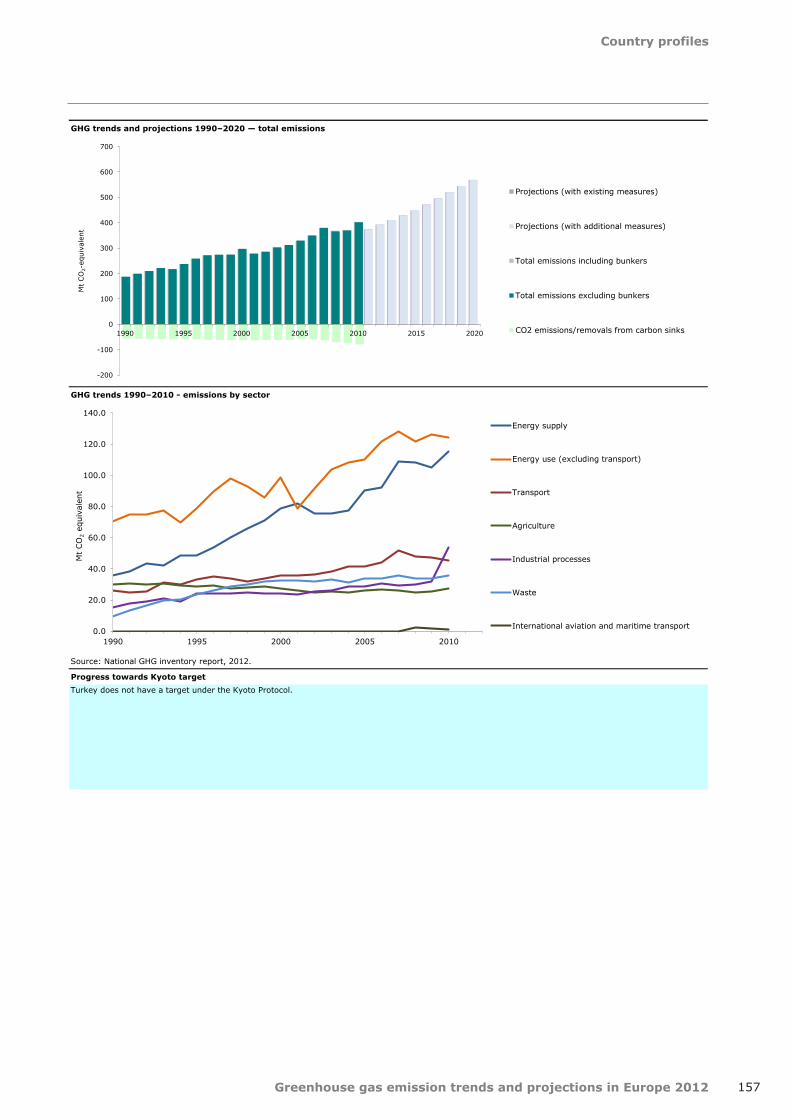
Country profiles
157Greenhouse gas emission trends and projections in Europe 2012
GHG trends and projections 1990–2020 — total emissions
GHG trends 1990–2010 - emissions by sector
Source: National GHG inventory report, 2012.
Progress towards Kyoto targetTurkey does not have a target under the Kyoto Protocol.
-200
-100
0
100
200
300
400
500
600
700
1990 1995 2000 2005 2010 2015 2020
Mt
CO
2-eq
uiva
lent
Projections (with existing measures)
Projections (with additional measures)
Total emissions including bunkers
Total emissions excluding bunkers
CO2 emissions/removals from carbon sinks
0.0
20.0
40.0
60.0
80.0
100.0
120.0
140.0
1990 1995 2000 2005 2010
Mt
CO
2 eq
uiva
lent
Energy supply
Energy use (excluding transport)
Transport
Agriculture
Industrial processes
Waste
International aviation and maritime transport
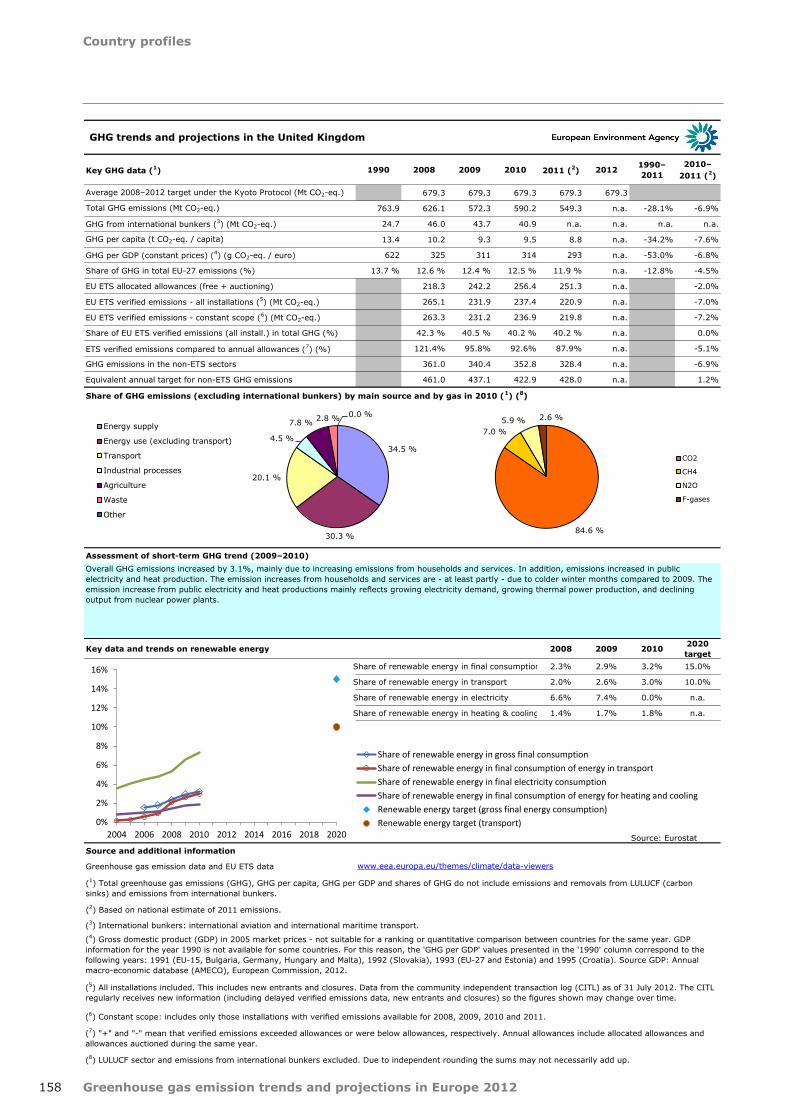
Country profiles
158 Greenhouse gas emission trends and projections in Europe 2012
Key GHG data (1) 1990 2008 2009 2010 2011 (2) 2012 1990–2011
2010–2011 (2)
Average 2008–2012 target under the Kyoto Protocol (Mt CO2-eq.) 679.3 679.3 679.3 679.3 679.3
Total GHG emissions (Mt CO2-eq.) 763.9 626.1 572.3 590.2 549.3 n.a. -28.1% -6.9%
GHG from international bunkers (3) (Mt CO2-eq.) 24.7 46.0 43.7 40.9 n.a. n.a. n.a. n.a.
GHG per capita (t CO2-eq. / capita) 13.4 10.2 9.3 9.5 8.8 n.a. -34.2% -7.6%
GHG per GDP (constant prices) (4) (g CO2-eq. / euro) 622 325 311 314 293 n.a. -53.0% -6.8%
Share of GHG in total EU-27 emissions (%) 13.7 % 12.6 % 12.4 % 12.5 % 11.9 % n.a. -12.8% -4.5%
EU ETS allocated allowances (free + auctioning) 218.3 242.2 256.4 251.3 n.a. -2.0%
EU ETS verified emissions - all installations (5) (Mt CO2-eq.) 265.1 231.9 237.4 220.9 n.a. -7.0%
EU ETS verified emissions - constant scope (6) (Mt CO2-eq.) 263.3 231.2 236.9 219.8 n.a. -7.2%
Share of EU ETS verified emissions (all install.) in total GHG (%) 42.3 % 40.5 % 40.2 % 40.2 % n.a. 0.0%
ETS verified emissions compared to annual allowances (7) (%) 121.4% 95.8% 92.6% 87.9% n.a. -5.1%
GHG emissions in the non-ETS sectors 361.0 340.4 352.8 328.4 n.a. -6.9%
Equivalent annual target for non-ETS GHG emissions 461.0 437.1 422.9 428.0 n.a. 1.2%
Share of GHG emissions (excluding international bunkers) by main source and by gas in 2010 (1) (8)
Assessment of short-term GHG trend (2009–2010)
Key data and trends on renewable energy 2008 2009 2010 2020 target
Share of renewable energy in final consumption 2.3% 2.9% 3.2% 15.0%
Share of renewable energy in transport 2.0% 2.6% 3.0% 10.0%
Share of renewable energy in electricity 6.6% 7.4% 0.0% n.a.
Share of renewable energy in heating & cooling 1.4% 1.7% 1.8% n.a.
Source: EurostatSource and additional information
Greenhouse gas emission data and EU ETS data
Overall GHG emissions increased by 3.1%, mainly due to increasing emissions from households and services. In addition, emissions increased in public electricity and heat production. The emission increases from households and services are - at least partly - due to colder winter months compared to 2009. The emission increase from public electricity and heat productions mainly reflects growing electricity demand, growing thermal power production, and declining output from nuclear power plants.
www.eea.europa.eu/themes/climate/data-viewers
(5) All installations included. This includes new entrants and closures. Data from the community independent transaction log (CITL) as of 31 July 2012. The CITL regularly receives new information (including delayed verified emissions data, new entrants and closures) so the figures shown may change over time.
(7) "+" and "-" mean that verified emissions exceeded allowances or were below allowances, respectively. Annual allowances include allocated allowances and allowances auctioned during the same year.
(8) LULUCF sector and emissions from international bunkers excluded. Due to independent rounding the sums may not necessarily add up.
(6) Constant scope: includes only those installations with verified emissions available for 2008, 2009, 2010 and 2011.
(1) Total greenhouse gas emissions (GHG), GHG per capita, GHG per GDP and shares of GHG do not include emissions and removals from LULUCF (carbon sinks) and emissions from international bunkers.
(3) International bunkers: international aviation and international maritime transport.
(4) Gross domestic product (GDP) in 2005 market prices - not suitable for a ranking or quantitative comparison between countries for the same year. GDP information for the year 1990 is not available for some countries. For this reason, the 'GHG per GDP' values presented in the '1990' column correspond to the following years: 1991 (EU-15, Bulgaria, Germany, Hungary and Malta), 1992 (Slovakia), 1993 (EU-27 and Estonia) and 1995 (Croatia). Source GDP: Annual macro-economic database (AMECO), European Commission, 2012.
(2) Based on national estimate of 2011 emissions.
GHG trends and projections in the United Kingdom
34.5 %
30.3 %
20.1 %
4.5 %
7.8 % 2.8 % 0.0 % Energy supply
Energy use (excluding transport)
Transport
Industrial processes
Agriculture
Waste
Other
84.6 %
7.0 % 5.9 % 2.6 %
CO2
CH4
N2O
F-gases
0%
2%
4%
6%
8%
10%
12%
14%
16%
2004 2006 2008 2010 2012 2014 2016 2018 2020
Share of renewable energy in gross final consumptionShare of renewable energy in final consumption of energy in transportShare of renewable energy in final electricity consumptionShare of renewable energy in final consumption of energy for heating and coolingRenewable energy target (gross final energy consumption)Renewable energy target (transport)

Country profiles
159Greenhouse gas emission trends and projections in Europe 2012
GHG trends and projections 1990–2020 — total emissions
GHG trends and projections 1990–2020 — emissions by sector
Progress towards Kyoto target
Note: The difference between target and GHG emissions concerns the sectors not covered by the EU ETS. A positive value indicates emissions lower than the average target.
Average 2008–2011 emissions in United Kingdom were 24.7 % lower than the base-year level, well below the burden-sharing target of -12.5 % for the period 2008–2012. In the sectors not covered by the EU ETS, emissions were significantly lower than their respective target, by an amount equivalent to 11.8 % of base-year emissions. LULUCF activities are expected to decrease net emissions by an annual amount equivalent to 0.4 % of base-year level emissions. Taking all these effects into account, average emissions in the sectors not covered by the EU ETS in United Kingdom were standing below their target level, by a gap representing 12.2 % of the base-year emissions. The United Kingdom was therefore on track towards its burden-sharing target by the end of 2011.
Note: GHG emission projections are represent either through dashed lines (with existing measures) or dotted lines (additional measures).
Source: National GHG inventory report, 2012; national proxy estimate of 2011 GHG emissions; national GHG projection data submitted in 2011.
-100
0
100
200
300
400
500
600
700
800
900
1990 1995 2000 2005 2010 2015 2020
Mt
CO
2 eq
uiva
lent
Projections (with existing measures)
Projections (with additional measures)
Total emissions including bunkers
Total emissions excluding bunkers (KyotoProtocol)
Emissions included in emission trading (EUETS)
CO2 emissions/removals from carbon sinks
Kyoto base year
Kyoto target
0
50
100
150
200
250
300
1990 1995 2000 2005 2010 2015 2020
Mt
CO
2 eq
uiva
lent
Energy supply
Energy use (excluding transport)
Transport
Agriculture
Industrial processes
Waste
International aviation and maritime transport
95.1 103.4 100.2
73.6
103.1
0
20
40
60
80
100
120
Average 2008 2009 2010 2011 2012Dis
tanc
e to
tar
get
(Mt
CO
2 eq
uiva
lent
per
yea
r)
Difference between target and GHG emissions Expected carbon sequestration from forestry (LULUCF)Planned use of Kyoto mechanisms by governments ERU issuedTotal (actual progress)

European Environment Agency
Greenhouse gas emission trends and projections in Europe 2012 Tracking progress towards Kyoto and 2020 targets
2012 — 159 pp. — 21 x 29.7 cm
ISBN 978-92-9213-331-3 doi:10.2800/56770
HOW TO OBTAIN EU PUBLICATIONS
Free publications:• via EU Bookshop (http://bookshop.europa.eu);• at the European Union's representations or delegations. You can obtain their
contact details on the Internet (http://ec.europa.eu) or by sending a fax to +352 2929-42758.
Priced publications:• via EU Bookshop (http://bookshop.europa.eu).
Priced subscriptions (e.g. annual series of the Official Journal of the European Union and reports of cases before the Court of Justice of the European Union):• via one of the sales agents of the Publications Office of the European Union
(http://publications.europa.eu/others/agents/index_en.htm).
European Environment AgencyKongens Nytorv 61050 Copenhagen KDenmark
Tel.: +45 33 36 71 00Fax: +45 33 36 71 99
Web: eea.europa.euEnquiries: eea.europa.eu/enquiries
TH
-AL-1
2-0
06-E
N-C
doi:1
0.2
800/5
6770


