40
Greenhouse Gas Intensity of LNG as Fuel Dr. Oliver Schuller thinkstep AG Royal Netherlands Society of Engineers, Oil & Gas Technology, December 2017 NGVA-thinkstep - Study Results
| Date post: | 18-Sep-2018 |
| Category: |
Documents |
| Upload: | nguyencong |
| View: | 222 times |
| Download: | 1 times |

Greenhouse Gas Intensity
of LNG as Fuel
Dr. Oliver Schuller
thinkstep AG
Royal Netherlands Society of Engineers, Oil & Gas Technology, December 2017
NGVA-thinkstep - Study Results

Agenda
08.12.2017 2
1. About thinkstep
2. Motivation
3. Scope and Methodology
4. Results
5. Lessons Learned and Key Findings
Copyright (c) (2017) thinkstep AG – All rights reserved
08.12.2017 3
About thinkstep
Copyright (c) (2017) thinkstep AG – All rights reserved
Sustainability Consulting, Software and Data
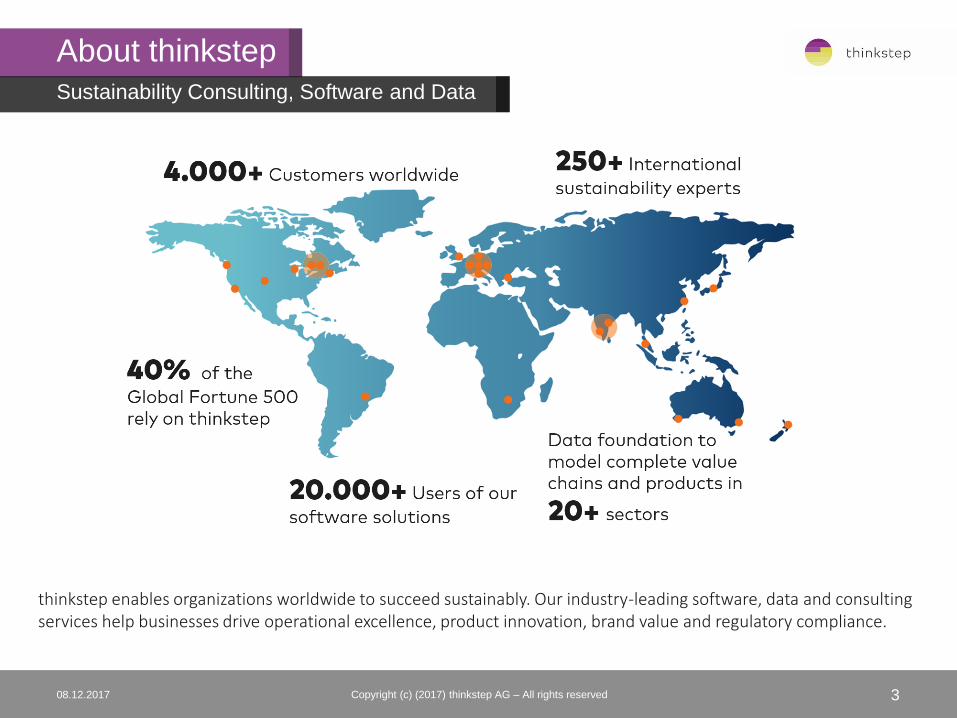
thinkstep enables organizations worldwide to succeed sustainably. Our industry-leading software, data and consulting services help businesses drive operational excellence, product innovation, brand value and regulatory compliance.

About thinkstep
08.12.2017 4Copyright (c) (2017) thinkstep AG – All rights reserved
Competencies
* BOM = Bill of Material; CPM = Compliance Process Manager; IMM = Integrated Material Management

About thinkstep
08.12.2017 5
Strategic Planning
Sustainability Strategy
Development
thinkstepGO™ Workshop
Materiality Assessment
Benchmarking
Vision, Focus areas and
target setting
Governance and policies
Business Value of
Sustainability
Sustainable Solution
Steering™
Performance Improvement
Life Cycle Assessment (LCA)
Product Environmental
Footprinting (PEF)
Corporate Environmental
Footprinting
Product Portfolio Improvement
(Eco-Design)
Energy Management
(EN 16247, ISO 50001)
Environmental Management
(ISO 14001, EMAS)
Sustainable Supply Chain
Management (SSCM)
Communication
Environmental Product
Declaration (EPD)
Environmental Health
Declaration (HPD)
GRI-Reporting
CDP-Reporting
Green Building Certification
(DGNB, LEED, BREEAM)
Stakeholder Engagement
Copyright (c) (2017) thinkstep AG – All rights reserved
Professional Consulting Services

08.12.2017 6
2,000 Customers
Copyright (c) (2017) thinkstep AG – All rights reserved
08.12.2017 7
Motivation
Copyright (c) (2017) thinkstep AG – All rights reserved

08.12.2017 8
Motivation
Copyright (c) (2017) thinkstep AG – All rights reserved
Roadmap of Road Transport
Source: Roadmap of road transport energy towards 2040, ERTRAC, June 2016
In this way technology neutrality
is guaranteed.
• Road transport system is asked to move from
the current oil derived monopoly towards a
more complex system composed by different
propulsion systems, based on both Internal
Combustion Engines and Electrified
powertrains.
• Those systems should rely on different forms
of energies, produced with very different
processes, incl. primary energy sources.
• When referring to decarbonisation, it is
fundamental to consider the entire fuel chain
(from extraction to its end usage, meaning
from Well-to-Wheel) to have a proper
comparison among different solutions.

• The gas industry is increasingly challenged in the EU
on how the greenhouse gas intensity (GHG) of NG
compares with other fuels.
• This topic will be a key point under the review of the
Fuel Quality Directive which will, inter alia, set the
default values of fuels used in transport.
• Accurate, updated and reliable GHG inventory
data is key to understand the current benefits, as
well as the future potential for supporting Europe’s
activities in developing a strategic vision for a real
sustainable mobility.
08.12.2017 9
Motivation
Copyright (c) (2017) thinkstep AG – All rights reserved
Why a new study?
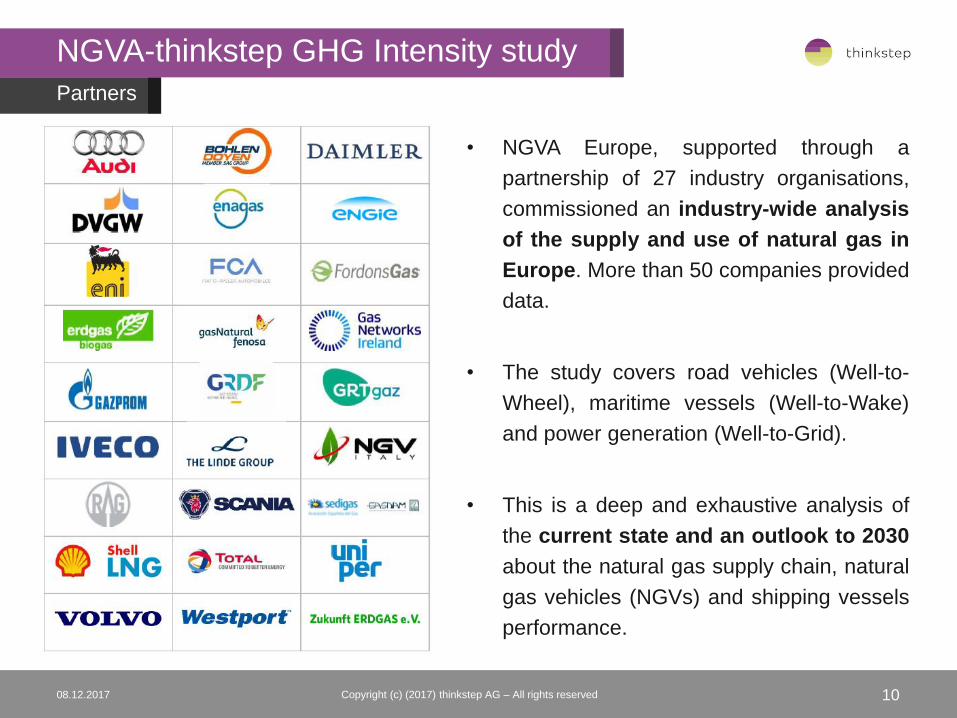
• NGVA Europe, supported through a
partnership of 27 industry organisations,
commissioned an industry-wide analysis
of the supply and use of natural gas in
Europe. More than 50 companies provided
data.
• The study covers road vehicles (Well-to-
Wheel), maritime vessels (Well-to-Wake)
and power generation (Well-to-Grid).
• This is a deep and exhaustive analysis of
the current state and an outlook to 2030
about the natural gas supply chain, natural
gas vehicles (NGVs) and shipping vessels
performance.
08.12.2017 10
NGVA-thinkstep GHG Intensity study
Copyright (c) (2017) thinkstep AG – All rights reserved
Partners

08.12.2017 11
Scope and Methodology
Copyright (c) (2017) thinkstep AG – All rights reserved

08.12.2017 12
What does “Greenhouse Gas Intensity” mean?
ProcessingProduction Transport Usage End-of-life
Environmental impacts e.g. Climate ChangeLife Cycle
Impact
Assessment
Life Cycle
Phases
Life Cycle Thinking
Resources
Emissions
Life Cycle
Inventory
Copyright (c) (2017) thinkstep AG – All rights reserved
Source: thinkstep, 2017

• The analysis was performed for four EU
regions, corresponding to the Exergia study.
• The LCA software system GaBi is used to
synthesise the collected data and information
and to build the basis for the GHG model.
• The study is subject to critical review by a
panel of independent experts according to
ISO 14044.
08.12.2017 13
Scope and Methodology
Copyright (c) (2017) thinkstep AG – All rights reserved
Geographical boundaries and critical review
Source: NGVA Europe, 2017

08.12.2017 14
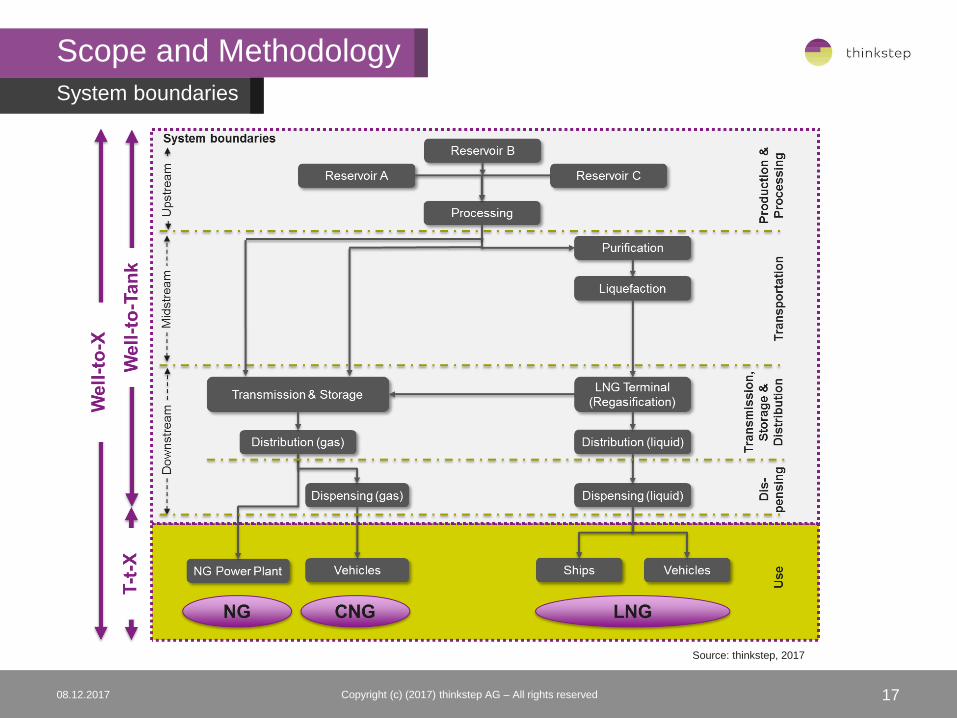
Scope and Methodology
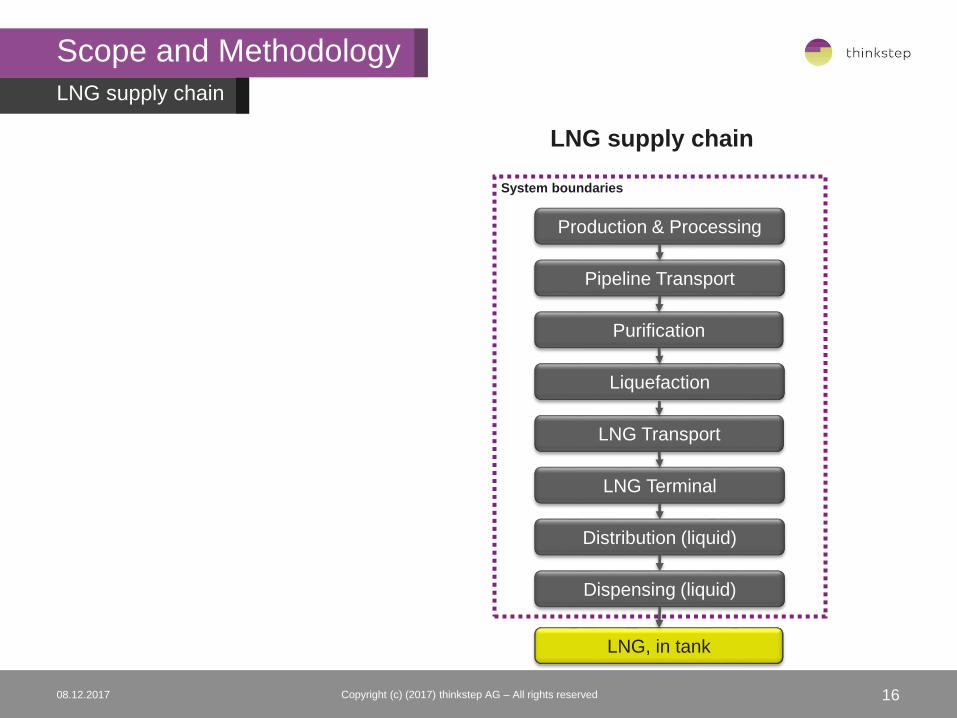
System boundaries
Copyright (c) (2017) thinkstep AG – All rights reserved
Pipeline Transport
Purification
Liquefaction
LNG Terminal (Regas.)
LNG Transport
LNG, in tank
Production & Processing
LNG supply chainsPipeline supply chain
Distribution (liquid)
Dispensing (liquid)
Production & Processing
Transmission & Storage
Pipeline Transport
CNG, in tank
Distribution (gas)
Dispensing (gas)

08.12.2017 15
Scope and Methodology
Pipeline Transport
Purification
Liquefaction
LNG Terminal (Regas.)
LNG Transport
Production & Processing
CNG supply chain
CNG supply chain
Production & Processing
Transmission & Storage
Pipeline Transport
CNG, in tank
System boundaries
Distribution (gas)
Dispensing (gas)
Copyright (c) (2017) thinkstep AG – All rights reserved
08.12.2017 16
Scope and Methodology
Pipeline Transport
Purification
Liquefaction
LNG Terminal
LNG Transport
LNG, in tank
Production & Processing
LNG supply chain
LNG supply chain
System boundaries
Distribution (liquid)
Dispensing (liquid)
Copyright (c) (2017) thinkstep AG – All rights reserved
08.12.2017 17
Scope and Methodology
Copyright (c) (2017) thinkstep AG – All rights reserved
System boundaries
Source: thinkstep, 2017

08.12.2017 18
Scope and MethodologyIncluded and excluded elements or activities
Copyright (c) (2017) thinkstep AG – All rights reserved
Source: thinkstep
Included Excluded
✓ Well drilling and well installation Seismic exploration and exploratory drilling
✓ Production & processing (CO2 removal, water
removal, H2S removal)
Maintenance efforts for infrastructure (e.g., pipeline,
LNG carriers, liquefaction plants)
✓ Pipeline transport Auxiliary materials, like lubricants
✓ Purification Overhead of production plants, e.g., personnel
lodging and transport, employee commute,
administration
✓ Liquefaction Accidents
✓ LNG transport
✓ LNG terminals (Regasification)
✓ Transmission & Storage
✓ Distribution (CNG and LNG)
✓ Dispensing (CNG and LNG)
✓ Energy supply: gas turbine, gas engines, diesel
generators, grid electricity
✓ Methane emissions
✓ Consideration of co-products (crude oil, NGLs, LPG)
✓ Life cycle burdens of infrastructure (e.g., pipelines,
LNG carriers, liquefaction plants, etc.)

08.12.2017 19
Natural gas supply – Total EU
Copyright (c) (2016) thinkstep AG – All rights reserved
CNG and LNG consumption mix used in the study
Source: Own calculations based on IEA – Natural Gas mix 2015p, 2016
Germany 1.9%
Denmark 1.0%
Algeria 5.9%
Algeria LNG 2.2%
UK 9.1%
Hungary 0.4%
Italy 1.5%
Libya 1.7%
Nigeria LNG 1.5%
Netherlands11.7%
Norway 22.4%
Norway LNG 0.7%
Poland 1.3%
Qatar LNG 5.6%
Romania 2.4%
Russia 30.8%
Natural Gas Consumption Mix for EU Total
Algeria LNG22.1%
Nigeria LNG14.6%
Norway LNG 7.3%
Qatar LNG56.0%
LNG Consumption Mix for EU Total
- For 90.3% primary data are collected (i.e. 8 countries)
- For 8.3% literature data were used (i.e. 6 countries)
- 1.4% were neglected and the remaining mix scaled to 100%
- For 95.2% primary data are collected (i.e. 4 countries)
- 4.8% were neglected and the remaining mix scaled to 100%

08.12.2017 20
EU-28 LNG supply
Imports to Europe
Copyright (c) (2017) thinkstep AG – All rights reserved
Source: thinkstep
Bovanenkovskoye, Russia
Ras Laffan, Qatar
Arzew / Skikda, Algeria
Transport by LNG carrier
Transport by pipeline
Bonny, Nigeria
Snohvit, Norway Norway
the Netherlands
UKGermany

08.12.2017 21
EU-28 LNG supply
GaBi Screenshot
Copyright (c) (2017) thinkstep AG – All rights reserved
Each box represented a stage/process in the life cycle
On/Offshore Oil/Gas Field,
(conv. and unconv.
technology)
Pipeline with
Compressors
LNG Terminal LNG Vessel LNG Terminal Natural Gas to
Transmission Network
Production & Processing Pipeline Transport Purification and Liquefaction LNG Transport Regasification Transmission & Distribution
Source: thinkstep, 2017
08.12.2017 22
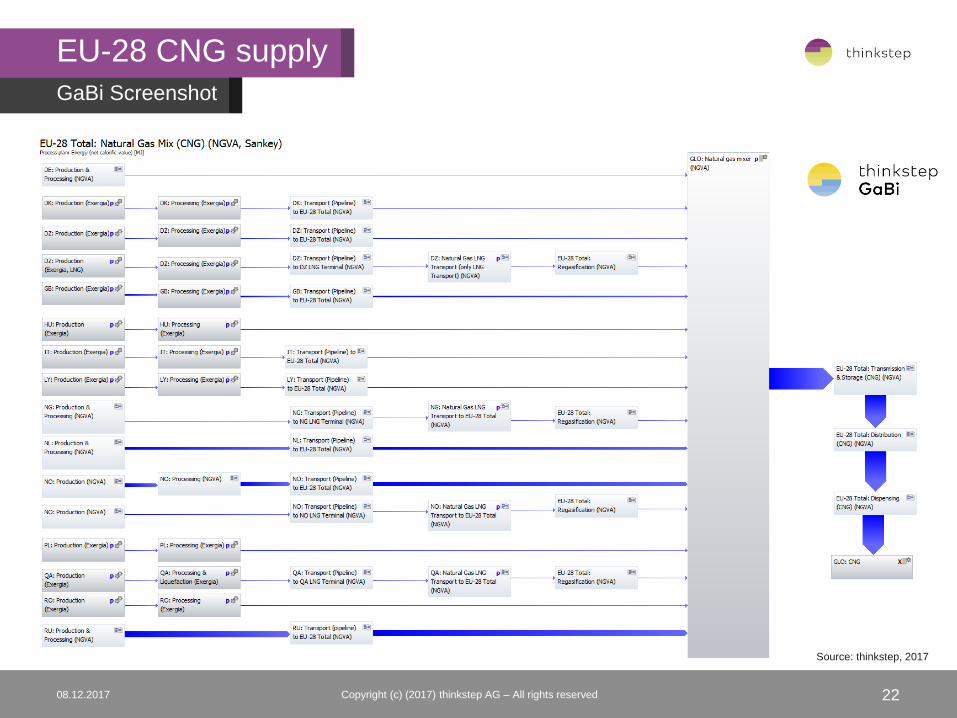
EU-28 CNG supply
GaBi Screenshot
Copyright (c) (2017) thinkstep AG – All rights reserved
Source: thinkstep, 2017

08.12.2017 23
EU-28 LNG supply
Qatar: Production & Processing and Pipeline Transport
Copyright (c) (2017) thinkstep AG – All rights reserved
08.12.2017 24
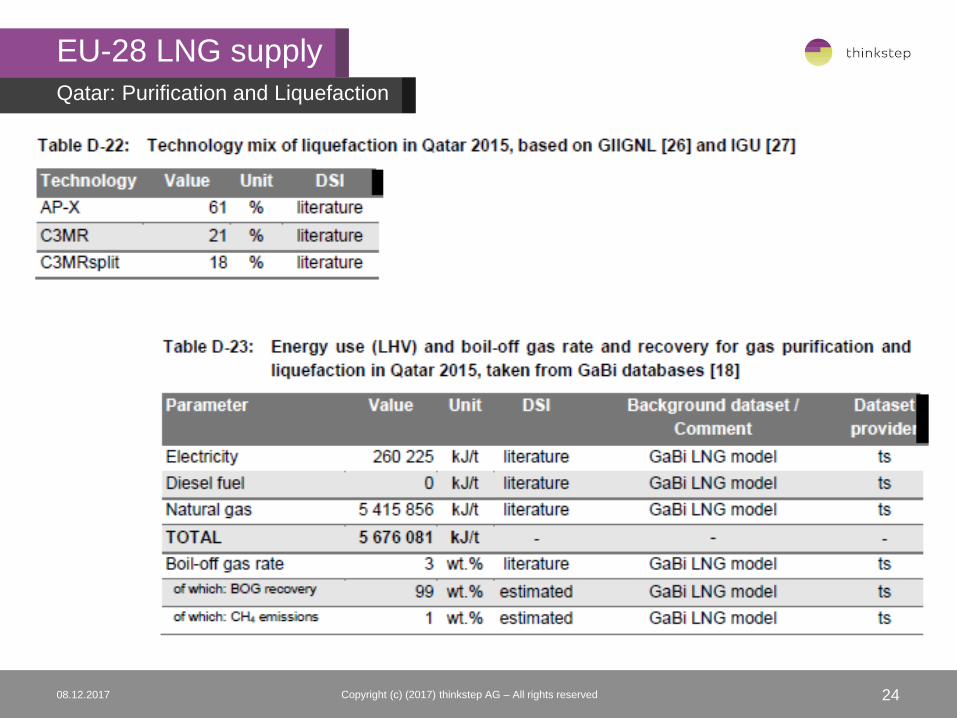
EU-28 LNG supply
Qatar: Purification and Liquefaction
Copyright (c) (2017) thinkstep AG – All rights reserved

08.12.2017 25
EU-28 LNG supply
Qatar: LNG Transport
Copyright (c) (2017) thinkstep AG – All rights reserved
• The share of the LNG carriers by vessel is based on GIIGNL and IGU.
• The shortest route for the maritime LNG transportation from Qatar to Europe is considered,
i.e., through the Suez Canal, since QFlex are able to pass the canal.

08.12.2017 26
EU-28 LNG supply
LNG carrier fuel consumption (LHV) and methane emissions
Copyright (c) (2017) thinkstep AG – All rights reserved
• All fuel consumption values are based on round-trip considerations per km,
i.e., 0.5 km laden and 0.5 km ballast shipping.
• The data also considers that 93 % of the LNG is unloaded. The remaining 7 % stays in the vessel.
• The data are taken from thinkstep’s GaBi databases crosschecked with literature and
were considered good proxies for LNG transport by representatives of ENGIE and Shell.

08.12.2017 27
EU-28 LNG supply
LNG Terminals
Copyright (c) (2017) thinkstep AG – All rights reserved
• The inventory data are based on information from 10 data providers covering 15 LNG terminals
out of 21 in operation in Europe.
• The 15 terminals were identified to be representative for Europe.

08.12.2017 28
EU-28 LNG supply
LNG Distribution and Dispensing
Copyright (c) (2017) thinkstep AG – All rights reserved
LNG Distribution
• performed by a 44 tonnes long haul diesel fuelled truck with 16.5 tonnes payload capacity.
• The average distance from the terminal to the filling station was assessed to be ~200 km (one way).
LNG Dispensing
• The modelled station is equipped with boil-off gas (BOG) treatment.
• LNG dispensing data were provided by GrDF and are based on averaged industry data for the year 2016.
• In addition, the data were discussed with industry experts of the NGVA and Shell and
are considered as technology representative industry average.

08.12.2017 29
Results
Copyright (c) (2017) thinkstep AG – All rights reserved

08.12.2017 30
Well-to-Tank (GHG) emissions
Copyright (c) (2017) thinkstep AG – All rights reserved
CNG
12.5
13.0
19.2
0 5 10 15 20 25
NGVA
JEC-WtW
EXERGIA
Well-to-Tank - CNG, in tank - GHG (EU Total)
[g CO2-eq/MJ]
3.4
3.6
3.8
3.5
1.7
1.6
1.2
1.6
2.1
1.4
2.9
1.2
3.2
3.9
1.9
4.7
5
2.2
6.1
9.4
12.5
11
10.8
15.6
14.4
0 5 10 15 20
EU Total
EU North
EU Central
EU South East
EU West
[g CO2-eq/MJ (LHV)], in tank
Well-to-Tank – GHG Emissions: CNG supply Breakdown by main individual emissions per
region
Fuel dispensing
Gas transmission, storage and distribution
Feedstock transportation (Pipeline, LNG carrier)
Gas production, processing and liquefaction
9 3.4
0.1
12.5
0 2 4 6 8 10 12 14
Well-to-Tank – GHG Emissions: CNG supply breakdown by main individual emissions
CO2 CH4 N20
Source: Exergia (2015), JEC (2014)
0.3
1.1
0.5
1.5
Well-to-Tank – CNG, in tank -Methane Emissions

08.12.2017 31
Well-to-Tank (GHG) emissions
Copyright (c) (2017) thinkstep AG – All rights reserved
LNG
16.8
19.9
19.4
24.6
0 5 10 15 20 25 30
NGVA (Scenario Algeria)
NGVA
JEC-WtW
EXERGIA
Well-to-Tank - LNG, in tank -GHG (EU Total) [g CO2-eq/MJ]
1.2
1.2
1.2
1.2
1.1
0.4
0.4
0.4
0.4
0.4
2.9
3.7
2.6
2.7
2.5
15.4
11.2
9.1
12.3
20.3
19.9
16.5
13.3
16.6
24.3
0 5 10 15 20 25 30
EU Total
EU North
EU Central
EU South East
EU West
[g CO2-eq/MJ (LHV)], in tank
Well-to-Tank – GHG Emissions: LNG supply Breakdown by main individual emissions per region
Fuel dispensing
Gas transmission, storage and distribution
Feedstock transportation (Pipeline, LNG carrier)
Gas production, processing and liquefaction
14.4 5.4
0.1
19.9
0 5 10 15 20
Well-to-Tank – GHG Emissions: LNG supply breakdown by main individual emissions
CO2 CH4 N20 1.1
0.0
0.1
4.2
Well-to-Tank - LNG, in tank -Methane Emissions
Note: LNG distribution is incl. in fuel dispensing

08.12.2017 32
Well-to-Wheel (GHG) emissions
Copyright (c) (2017) thinkstep AG – All rights reserved
Passenger Vehicles
Benefits and reduced GHG emissions from passenger cars are possible with CNG.
131
140
169
0 20 40 60 80 100 120 140 160 180
CNG
Diesel (FQD)
Petrol (FQD)
Well-to-Wheel - Passenger Vehicles -GHG Intensity [g CO2-eq/km]
-7%
-23%
Vehicle from the C-segment being used according to the New European Driving Cycle

08.12.2017 33
Well-to-Wheel (GHG) emissions
Copyright (c) (2017) thinkstep AG – All rights reserved
Heavy-Duty Vehicles
40 t tractor + trailer combination with 75% payload in long haul use
For long-haul missions, both CNG and LNG are having lower emissions
compared with diesel.
908
1005
912
1074
800 850 900 950 1000 1050 1100
SI (CNG)
SI (LNG)
HPDI (LNG)
Diesel (FQD)
Well-to-Wheel - Heavy-Duty Vehicles -GHG Intensity [g CO2-eq/km]
-15%
-6%
-16%

08.12.2017 34
Well-to-Wheel (GHG) emissions
Copyright (c) (2017) thinkstep AG – All rights reserved
Ships
588.8
661.6
742.1
749.6
0 100 200 300 400 500 600 700 800
Dual-fuel [2-stroke]
Dual-fuel [4-stroke]
HFO (JEC-WtW)
MDO (FQD)
Well-to-Wake - Ships - GHG Intensity [g CO2-eq/kWh]
-11%
-21%
In maritime applications, the use of LNG provides a clear Well-to-Wake benefit
compared with petroleum based fuels.
The benchmark for maritime comparison here is Heavy-Fuel Oil, results from JEC.
at 85 % load

08.12.2017 35
Well-to-Wheel (GHG) emissions
Copyright (c) (2017) thinkstep AG – All rights reserved
Renewable gas
30
108
131
140
169
0 20 40 60 80 100 120 140 160 180
bio CNG (100%)
CNG (10% bioCNG, 10% SNG)
CNG
Diesel (FQD)
Petrol (FQD)
Well-to-Wheel - Passenger Vehicles -GHG Intensity [g CO2-eq/km]
-23%
-36%
-82%
• Renewable gas has the key property to be 100% compatible with natural gas,
being easily blended or used directly as a neat fuel in engines
• Locally produced
• Renewable gas represents a fast drive towards decarbonisation

08.12.2017 36
Well-to-Wheel (GHG) emissions
Copyright (c) (2017) thinkstep AG – All rights reserved
Passenger Vehicle – GHG by Contributors
122.4 (94%)7.7 (5.9%)0.6 (0.5%)
130.7
0 20 40 60 80 100 120 140 160
CNG
WtW - Passenger Vehicle - GHG by Contributors [g CO2-eq/km]
CO2 CH4 N20
On both CNG and LNG applications no leakage is admitted at vehicle level.
CH4 emissions are generated as unburned hydrocarbon at the exhaust and considered
as CO2 equivalent.

08.12.2017 37
Lessons learnt
Copyright (c) (2017) thinkstep AG – All rights reserved

• GHG studies give valuable insights in the whole natural gas (NG) supply chain
• GHG emissions of the NG supply chains to Europe differ by region/country. Country
of origin and technology used for production, processing, transport does matter as well
as methane emissions
• Standardised environmental analysis (ISO 14044) is key to support EU goals
• Results were confirmed by three independent experts
• Uncertainty of results can be reduced by collecting most accurate data. These will
increase validity of results Good data quality is key!
CNG and LNG fuelled transport is having benefits
and lower emissions than conventional fuels.
08.12.2017 38
Lessons Learned
Copyright (c) (2017) thinkstep AG – All rights reserved
Key Findings

1. Well-to-Wheel GHG emissions must be taken into account when comparing vehicles.
This is the main way to achieve true technology neutrality.
2. NGVs must be acknowledged as a solution to ensure improved air quality (NOx,
PM) in a cost efficient way.
3. Continuous development of CNG and LNG infrastructure to further reduce footprint.
4. Company specific supply chains may differ from the average
Perform your own analyses lower your risks, reduce costs, increase revenue and
enhance your brand!
5. Read more:
08.12.2017 39
Recommendations
Copyright (c) (2017) thinkstep AG – All rights reserved
Take away
Full report available under:
http://ngvemissionsstudy.eu/
Hauptstraße 111-113
70771 Leinfelden-Echterdingen
Germany
Phone: +49 711 341817-0
Fax: +49 711 341817-25
www.thinkstep.com
4008.12.2017
Dr. Oliver Schuller
Principal Consultant
Team Lead Energy and Oil & Gas
Phone +49 711 341817-20
Your contact at
thinkstep AG
Copyright (c) (2017) thinkstep AG – All rights reserved


![[Energi]LNG Transportasi Gas Alam](https://static.documents.pub/doc/80x56/577d204c1a28ab4e1e927a52/energilng-transportasi-gas-alam.jpg)


