Greenhouse gas mitigation scenarios for major emitting countries Analysis of current climate policies and mitigation commitments: 2017 update Takeshi Kuramochi, Hanna Fekete, Frederic Hans, Lisa Luna, Sofia Gonzales-Zuñiga, Sebastian Sterl, Markus Hagemann, Niklas Höhne (NewClimate Institute) Heleen van Soest, Michel den Elzen, Kendall Esmeijer, Mark Roelfsema (PBL Netherlands Environmental Assessment Agency) Nicklas Forsell, Olga Turkovska (International Institute for Applied Systems Analysis) November 2017
Transcript
Greenhouse gas mitigation scenarios for major emitting countries Analysis of current climate policies and mitigation commitments:
2017 update
Takeshi Kuramochi, Hanna Fekete, Frederic Hans, Lisa Luna, Sofia Gonzales-Zuñiga,
Sebastian Sterl, Markus Hagemann, Niklas Höhne (NewClimate Institute)
Heleen van Soest, Michel den Elzen, Kendall Esmeijer, Mark Roelfsema (PBL Netherlands
Environmental Assessment Agency)
Nicklas Forsell, Olga Turkovska (International Institute for Applied Systems Analysis)
November 2017
Greenhouse gas mitigation scenarios for major emitting countries
Analysis of current climate policies and mitigation
Takeshi Kuramochi, Hanna Fekete, Frederic Hans, Lisa Luna, Sofia Gonzales-Zuñiga, Sebastian Sterl, Markus Hagemann, Niklas Höhne (NewClimate Institute) Heleen van Soest, Michel den Elzen, Kendall Esmeijer, Mark Roelfsema (PBL Netherlands Environmental Assessment Agency) Nicklas Forsell, Olga Turkovska (International Institute for Applied Systems Analysis) Contributors
Petr Havlik, Michael Obersteiner (International Institute for Applied Systems Analysis) This update report builds on Kuramochi et al. (2016). This report has been prepared by
PBL/NewClimate Institute/IIASA under contract to DG CLIMA (EC service contract N°
340201/2015/717962/SERJCLIMA.A4) started in December 2015.
This project is funded by the EU:
Disclaimer
The views and assumptions expressed in this report represent the views of the authors and not necessarily those of the client. Cover picture: Patrick Tomasso
Download the report http://newclimate.org/publications/
the Congo (DRC), Ethiopia, the European Union, India, Indonesia, Japan, Kazakhstan, Mexico,
Morocco, the Philippines, Republic of Korea, the Russian Federation, Republic of South Africa, Saudi
Arabia, Thailand, Turkey, Ukraine, and the United States) up to 2030, based on current policies and the
implementation of (intended) nationally determined contributions ((I)NDCs).
The main updates and methodological changes made in this report compared to our 2016 report
(Kuramochi et al. 2016) include the following:
• Policy developments since the last report (e.g. the changes in U.S. climate policy) have been
taken into account in the emissions projections (cut-off date: 1 July 2017).
• GHG emissions projections under current policies took into account reviews from in-country
experts involved in the European CD-LINKS project (CD-LINKS 2017) to identify policies, not
limited to those focused on energy and climate, expected to deliver significant impact.
• Historical GHG emissions data was taken from latest inventories, many of which have been
submitted to the UNFCCC in 2017.
• GHG emissions projections under current policies were harmonised to the latest historical
emissions data described above. The harmonisation year was changed to 2015 for Annex I
countries and 2010 for non-Annex I countries, with exceptions of China (2012) and Brazil (2015)
(previously 2010 for all 25 countries).
• 2020 pledges and NDCs were consistently quantified in terms of 100-year global warming
potentials (GWP) from the Second Assessment Report (SAR) of the Intergovernmental Panel on
Climate Change (IPCC).
The findings of the current study are:
• The degree to which countries/regions are likely to achieve their INDCs/NDCs under current
policies was found to vary (Figure ES-1):
o Countries likely or roughly on track to achieve or even overachieve their self-determined
unconditional 2025/2030 targets with currently implemented policies: Brazil, China, Colombia
(new), India, Japan (new), Mexico (new), the Russian Federation, Turkey and Ukraine.
o Countries that require additional measures to achieve their 2030 targets are: Argentina,
Australia, Canada, Chile (new), DRC, Ethiopia, the EU, Indonesia, Kazakhstan, Morocco,
Republic of Korea, Saudi Arabia, South Africa, Thailand, the Philippines and the United
States.
o Colombia is now assessed to as achieving its INDC, because recent emissions, in particular
from forestry, were lower than assumed in the business-as-usual (BAU) projections provided
in Colombia's INDC.
o Mexico is now assessed to as achieving its NDC with currently implemented measures,
mainly because of the historical emissions data update and an updated and lower baseline
projections.
o Chile is now assessed to as requiring additional measures to achieve their its 2030 targets,
mainly because of the change in the baseline projections used for the assessment.
• Currently implemented policies are projected to influence greenhouse gas emissions, but do not
prevent emissions from increasing up to 2030 (above 2010 levels). This is the case, not only in
developing countries (Argentina, China, DRC, Ethiopia, India, Indonesia, Kazakhstan, Morocco,
the Philippines, Saudi Arabia, South Africa, and Thailand) but also in OECD countries (Australia,
Chile, Mexico, Republic of Korea, and Turkey) up to 2030, compared to 2010 levels. Greenhouse
gas emissions in Brazil, Canada, Colombia, the Russian Federation, and the Ukraine are
Greenhouse gas mitigation scenarios for major emitting countries
NewClimate Institute | November 2017 ii
projected to remain stable, approximately at current levels, with currently implemented policies.
In Japan and the EU, greenhouse gas emissions are projected to decrease further, under current
policies.
Figure ES-1: Progress of countries to achieve their self-chosen 2030 targets under current policies.
Note: current policies do not include implementation measures that are under development at the time
of publication.
It should be noted that a country likely to meet its NDC/INDC not necessarily is undertaking more
stringent action on mitigation than a country that is not on track due to mainly two reasons. First, the
targets differ in their ambition levels across countries because they are nationally determined and
heterogeneous by nature. Second, it has only been around two years since the countries formulated
their NDCs/INDCs. It is not surprising to see a gap between the mitigation targets and current policy
trajectories if countries pledged something above what they would have achieved anyway.
Nevertheless, as countries are adopting implementation measures, it is essential that the gaps between
mitigation targets and current policy trajectories begin to close, in the years to come. Most of the
countries analysed in this report show progress towards meeting their NDC; some through additional
policies and new market developments, some through revision of the underlying data. A few countries
risk reversal of the trends (Table ES-1). For this reason, it is essential that this report and similar efforts
are updated in the coming years. We also believe that this study provides useful information for the 2018
facilitative dialogue.
Greenhouse gas mitigation scenarios for major emitting countries
NewClimate Institute | November 2017 iii
Table ES-1: Progress of countries in meeting their NDCs
Country Meeting
NDC with
current
policies?
Current policy path closer to NDC than last year (may be due
to new policies, updates of historical data, selection of other
projections or lower assumed economic growth)?
Argentina No No (one of the few countries that made NDC more ambitious than
INDC)
Australia No Yes (projections lower due to inclusion of recent developments)
Brazil Yes No (reversal of trends in the reduction of deforestation)
Canada No No change
Chile No No (projection revised upwards)
China Yes Yes (the observed stagnation of coal consumption makes peaking
CO2 emissions earlier than 2030 more likely)
Colombia Yes Yes (now meeting NDC due to revision of LULUCF data)
DRC No No (projections revised upwards)
Ethiopia No Yes (new and lower data source for projections added)
EU28 No Yes (projections lower due to inclusion of recent developments)
India Yes Yes (implementation of new planned policies could lead to
overachievement of NDC)
Indonesia No No (lower end projections on LULUCF emissions from last year
were removed)
Japan Yes Yes (more likely to overachieve NDC, mainly because of lower
GDP growth assumptions)
Kazakhstan No No change
Mexico Yes Yes (projection lower due to historical data update and lower
baseline projections)
Morocco No No change
Philippines No No change
Republic of Korea No Yes (more optimistic partly due to use of a different source for the
baseline projections)
Russia Yes No change
Saudi Arabia No No change
South Africa No Yes (substantially lower projection because of lower economic
growth assumption)
Thailand No No change
Turkey Yes No change
Ukraine Yes Yes (projections lower due to inclusion of recent developments)
USA No Yes (lower projections, even in case of Clean Power Plan
cancellation, mainly due to historical data update)
Greenhouse gas mitigation scenarios for major emitting countries
NewClimate Institute | November 2017 iv
Uncertainty around future estimates remains high:
• In the United States, the Trump administration officially communicated to the United Nations its
intent to abandon the Paris Agreement and cease implementation of the NDC (The
Representative of the United States of America to the United Nations 2017). At the same time,
there are several sub-national and non-state initiatives emerging, including the “America’s
Pledge” recently launched by California Governor Jerry Brown and Former Mayor of New York
Michael Bloomberg to move forward with the “country’s commitments under the Paris
Agreement — with or without Washington” (America's Pledge 2017). The potential mitigation
impact of these actions was not quantified in this study.
• Canada is currently expected to apply the net-net accounting rule for the LULUCF sector, but
there is still some uncertainty on the treatment of the LULUCF sector and it is possible that a
different accounting approach for the LULUCF sector will be applied.
• In Japan, decisions on the future of nuclear power will strongly influence the development of
emissions in the power sector.
• In the Republic of Korea, it remains to be seen if the long-term phase-out of nuclear and coal-
fired power announced by the new President would be supported by policies and laws.
• In Australia, the effect of policies replacing the carbon pricing mechanism is difficult to assess.
• China and India have pledges indexed to economic growth, implying that the absolute emission
target level is very uncertain.
• Emissions projections for Turkey and other developing countries are subject to considerable
uncertainty related to economic growth.
• In Argentina, Colombia, DRC, Ethiopia, Indonesia and the Philippines, emissions from land use,
land use change, and forestry (LULUCF), which are very uncertain, strongly determine total
emissions projections. Our evaluation on Colombia’s progress has been revised from the 2016
report largely due to the downward revision of the GHG inventory data for the LULUCF sector.
Greenhouse gas mitigation scenarios for major emitting countries
NewClimate Institute | November 2017 v
Table of Contents
Acronyms ................................................................................................................................................ vii
Acknowledgements ................................................................................................................................. ix
Summary of methods ........................................................................................................................ 2
Limitations of this report .................................................................................................................... 3
2 Main findings ..................................................................................................................................... 4
3 Results per country ........................................................................................................................... 7
Argentina ......................................................................................................................................... 10
Australia .......................................................................................................................................... 13
Brazil ............................................................................................................................................. 16
Greenhouse gas mitigation scenarios for major emitting countries
NewClimate Institute | November 2017 vi
Table of Contents (continued)
Appendix ................................................................................................................................................... I
A1: Harmonisation of GHG emissions projections under current policies to the historical emissions
data ................................................................................................................................................ I
A2: Quantification of 2020 pledges and (I)NDCs ............................................................................... I
A3: NewClimate Institute calculations (based on the Climate Action Tracker analysis) ................. IV
A4: The IMAGE model ..................................................................................................................... VI
A5: The GLOBIOM and G4M models ............................................................................................ VIII
Greenhouse gas mitigation scenarios for major emitting countries
NewClimate Institute | November 2017 vii
Acronyms
AFOLU agriculture, forestry and other land use
BAU
CAFE
business-as-usual
Corporate Average Fuel Economy Standards
CAT Climate Action Tracker
CH4 methane
CNG compressed natural gas
CO2 carbon dioxide
CO2e carbon dioxide equivalent
COP21 UNFCCC Conference of the Parties 21st session (Paris)
CPP United States of America’s Clean Power Plan
CSP
DESA
concentrated solar power
UN Department of Economic and Social Affairs
EDGAR Emissions Database for Global Atmospheric Research
EEA European Energy Agency
EPA United States Environmental Protection Agency
ERF Emissions Reduction Fund
ETS emissions trading system
FAIR PBL’s Framework to Assess International Regimes for differentiation of commitments
NF3 nitrogen trifluoride
F-gas fluorinated gas
G4M IIASA’s Global Forest Model
GCF Green Climate Fund
GDP gross domestic product
GHG greenhouse gas
GLOBIOM IIASA's Global Biosphere Management Model
Gt gigatonne (billion tonnes)
GW gigawatt (billion watts)
GWh gigawatt-hour (billionwatts per hour)
GWP
H2
Global Warming Potential
hydrogen
Ha
HWP
hectare
harvested wood products
HEPS High Energy Performance Standards
HFC
ICCT
hydrofluorocarbon
International Council on Clean Transportation
IEA International Energy Agency
IIASA International Institute for Applied Systems Analysis
IMAGE PBL’s Integrated Model to Assess the Global Environment
INDC intended nationally determined contribution
IPCC Intergovernmental Panel on Climate Change
IPPU Industrial Processes and Product Use
km/l kilometre per litre
ktoe thousand tonnes of oil equivalent
kWh kilowatt-hour (thousand watts-hour)
LPG liquefied petroleum gas
LULUCF land use, land use change, and forestry
MEPS Minimum Energy Performance Standards
MJ megajoule (million joules)
Mm3 mega cubic metres (million cubic metres)
Greenhouse gas mitigation scenarios for major emitting countries
NewClimate Institute | November 2017 viii
Acronyms (continued)
mpg miles per gallon
Mt megatonne (million tonnes)
Mtoe million tonnes of oil equivalent
MW megawatt (million watts)
N2O nitrous oxide
N/A not available
NAMA Nationally Appropriate Mitigation Actions
NC6 Sixth National Communication
NDC nationally determined contribution
NOX nitrogen oxides
NRE New and Renewable Energies
OECD Organisation for Economic Co-operation and Development
General Accounting method • IPCC 2006 guidelines; 100-year GWPs from the
2nd Assessment Report
GHGs covered • CO2, CH4, N2O, HFCs, PFCs and SF6
Consideration of LULUCF • Land use sector is included in the target
• Accounting approaches and methodologies are not
specified
Other sector-level targets • N/A
Use of bilateral, regional and international
credits
• N/A
Availability of reference scenarios in the
latest UNFCCC submissions
• Yes, NDC also includes a BAU scenario
Last available year for GHG inventory
reporting
• 2012 (Government of Argentina 2015).
Note: Argentina has not set its 2020 pledge.
Greenhouse gas mitigation scenarios for major emitting countries
NewClimate Institute | November 2017 11
Table 5: Overview of key climate change mitigation policies in Argentina. Source: (Ministry of the
Environment and Sustainable Development 2015)
Sector Policies (marked with “(+)” when
mentioned in the NDC document)
Description
Economy-
wide
National Program for Rational and
Efficient Use of Energy
(PRONUREE) (2007)
• 10-12% of energy savings by 2016 in
residential, public/private services
• Decrease electricity consumption by
6% compared to baseline scenario and
energy savings of 1500 MW by 2016
Energy
supply
Renewable Energy Programme in
Rural Markets (2000)
• Reduce GHG emissions by replacing
small-diesel electricity generation with
renewable energy systems
Renewable Energy Law 27191.
National Development Scheme for
the Use of Renewable Energy
Sources (RenovAr) (2016)
• Total individual electric consumption to
be substituted with renewable sources
given the following schedule: 8% by
2017, 18% by 2023 and 20% by 2025 1)
PROBIOMASA: promotion of
biomass energy (2013)
• Additional biomass capacity: each
200 MW electric and thermal by 2018,
each 1325 MW electric and thermal by
20301)
Energy Efficiency Project (2009) • USD 99.44 million to reduce 10.7
MtCO2e by the end of 2016 are the
global benefits of the Energy Efficiency
Project
Transport Biofuels Law (updated 2016) • 12% requirement of biodiesel or
ethanol blend in the gasoline from
2016 1)
Industry N/A • N/A
Buildings Program for Rational and Efficient
use of Energy in Public Buildings
(2007)
• Various measures in line with the 10%
energy savings by 2016
F-gases N/A • N/A
Forestry &
Agriculture
Minimum Budgets for Environmental
Protection of Native Forest
(Presupuestos Minimos de
Proteccion) (2007) (+)
• Regulatory frame to control the
reduction of native forest surface and
achieve lasting surface over time 1)
National Forest Management Plan
with Integrated Livestock (Plan
Nacional de Manejo de Bosques con
Ganadería Integrada) (2015)
• To improve and maintain ecological
and cultural processes in native forest
and promote activities for a
sustainable management of native
forest 2)
• Contributes to sustainable use of
native forests through incorporating
livestock activities in native forest area
in a sustainable manner 2) 1) No information available on implementation status. For the current analysis, we have assumed full
implementation. 2) Policy not quantified in the IIASA LULUCF projections
Greenhouse gas mitigation scenarios for major emitting countries
NewClimate Institute | November 2017 12
Table 6: Impact of climate policies on greenhouse gas emissions (including LULUCF) in Argentina.
Absolute emission levels and emission levels relative to 2010 levels are presented. References for
official emission data are provided in Table 3.
2010 GHG
emissions, incl.
LULUCF
2020 pledge and NDC Current policies
Official data NewClimate
estimates
Official data NewClimate
estimates
Absolute:
448 MtCO2e
369 to 483
MtCO2e by
2030
370 to 485 MtCO2e, -
18% to 8% by 2030
463 MtCO2e,
3% by 2020
549 MtCO2e,
23% by 2030
510 MtCO2e, 14%
to 14% by 2020
610 MtCO2e, 36%
by 2030
Per capita:
10.9 tCO2e/capita
N/A 7.5 to 9.8 tCO2e/capita
by 2030
N/A 11.2 tCO2e/capita
by 2020
12.3 to 12.4
tCO2e/capita by
2030
Figure 1: Impact of climate policies on greenhouse gas emissions in Argentina (including land use, i.e.
LULUCF). Source: NewClimate Institute calculations excluding LULUCF based on its analysis for
Climate Action Tracker (CAT 2017) and IIASA calculations on LULUCF emissions and removals.
Greenhouse gas mitigation scenarios for major emitting countries
NewClimate Institute | November 2017 13
Australia
The Australian government states that it is “on track” to meet its target of 5% below 2000 levels by 2020
(Australian Government 2015a), and that the Emissions Reduction Fund (ERF) plays a major role in
lowering the abatement task. However, our current policies scenario that include the abatements of the
ERF projects emissions above the pledge level (2 to 4% below 2010 levels by 2020). This contrasting
conclusion drawn from our assessment is partly due to the accounting approach for the emissions
reductions purchased through ERF. The Australian Government (2015a) counts all emissions
reductions purchased in 2015 (92 MtCO2e) in the 2015/16 emissions reporting, although they occur over
many years. In our analysis, we distributed the expected emissions reductions over the average contract
period of 9 years. The Australian government further considers that it will meet its unconditional 2020
target using surplus (‘carryover’) of the first commitment period of the Kyoto Protocol
(Australian Government 2015b, Australian Government 2016, Loynes 2016).
Australia has stated that it will also meet the 2030 targets (26 to 28% GHG reduction by 2030 from 2005
level) through policies that provide positive incentives to reduce emissions (Australian Government
2016). At the core of Australia’s climate change policies is the Emissions Reduction Fund and linked
safeguard mechanisms. Our current policies scenario (9 below to 5% above 2010 levels in 2030) shows
a significant difference with the NDC trajectory in 2030 (21 to 23% below 2010 levels).
Table 7: Description of Australia’s 2020 pledge and NDC
Indicator 2020 pledge NDC (submitted 9
November 2016)
Target: unconditional • 5% GHG reduction by 2020
from 2000 level
• Kyoto target: 108% of 1990
levels 2013-2020
• 26 to 28% GHG reduction
by 2030 from 2005 level
Target: conditional • 15% and 25% GHG reduction
by 2020 from 2000 level
• Not specified
Sectoral coverage • All GHG emissions, including
emissions from afforestation,
reforestation and deforestation
• Economy wide
General Accounting
method
• IPCC guidelines; 100-year
GWPs from the Fourth
Assessment Report
• IPCC guidelines; 100-year
GWPs from the Fourth
Assessment Report
GHGs covered • CO2, CH4, N2O, HFCs, PFCs,
SF6 and NF3
• CO2, CH4, N2O, HFCs,
PFCs, SF6 and NF3
Consideration of LULUCF • Land use sector is included
• Accounting approach is
specified as Kyoto Protocol
accounting rules (Article 3.7) 1)
• Land use credits: 27 MtCO2e by
2020 (den Elzen et al. 2015)
• Land use sector is
included in the target
• Net-net approach will be
used for emission
accounting
Use of bilateral, regional
and international credits
• N/A • N/A
Availability of reference
scenarios in the latest
UNFCCC submissions
• Yes • Yes
1) Specifics of the accounting rules are elaborated in Iversen et al. (2014) .
Greenhouse gas mitigation scenarios for major emitting countries
NewClimate Institute | November 2017 14
Table 8: Overview of key climate change mitigation policies in Australia (Australian Government 2015a).
See Supporting Information for details.
Sector Policies (marked
with “(+)” when
mentioned in the
NDC document)
Description
Economy-wide Emissions
Reduction Fund
(ERF) (2014) (+)
• Auctions are set up to purchase emissions reductions
at the lowest available cost, thereby contracting
successful bidders1)
Energy supply Renewable Energy
Target (RET) (2010)
(+)
• 23.5% of electricity should come from renewable
sources by 2020, compared to 13% in 2014. The new
target2) for large-scale generation of 33,000 GWh in
2020 would double the amount of large-scale
renewable energy being delivered by the scheme
compared to current levels
Transport Fuel tax (2015) • Fuel tax for diesel and gasoline is set at AUD 0.3814
per litre3)
Forestry &
Agriculture,
Waste
The Carbon Farming
Initiative 4) (2014)
(Now integrated into
ERF)
• Encourages sustainable farming and thereby
increase carbon storage or reducing GHG emissions
from land use. Expected 4.2 MtCO2e reduction of net
LULUCF emissions and 1.9 MtCO2e reduction of net
agriculture emissions by 2020, relative to 2010.
20 Million Trees
Programme (2014)
• Plant 20 million trees by 2020 (20,000 ha) to re-
establish green corridors and urban forests.
The Carbon Farming
Futures (2011) (Now
integrated into ERF)
(+)
• Ensures that advances in land management
technologies and techniques for emissions reduction
and adaptation will lead to enhanced productivity and
sustainable land use under a changing climate.5)
Other HFC emissions
reduction under the
Montreal Protocol
(2016)
• Reduce HFC emissions by 55% by 2030, relative to
2010 (85% by 2036)
1) Not quantified in PBL IMAGE framework
2) The target was reduced in 2015 from its original 41,000 GWh (Scott 2015) 3) OECD (2013). Policy instrument not quantified separately by NewClimate Institute and PBL. 4) Australian Government (2015c) 5) Policy not quantified in the IIASA LULUCF projections
Greenhouse gas mitigation scenarios for major emitting countries
NewClimate Institute | November 2017 15
Table 9: Impact of climate policies on greenhouse gas emissions (including LULUCF) in Australia.
Absolute emission levels and emission levels relative to 2010 levels are presented. Note that the official
values for 2020 and 2030 are based on GWP values from the IPCC 4th Assessment Report. References
for official emission data are provided in Table 3.
Figure 2: Impact of climate policies on greenhouse gas emissions in Australia (left panel: all gases and
sectors, middle panel: excluding land use (i.e. LULUCF) and right panel: only land use). Source: PBL
calculations and NewClimate Institute calculations based on Climate Action Tracker (CAT 2017)
excluding LULUCF, and IIASA calculations on LULUCF emissions and removals. The LULUCF
projections excludes removals from non-anthropogenic natural disturbances in line with Australia’s 2017
GHG Inventory Submission to the UNFCCC (Government of Australia 2017).
2010 GHG
emissions, incl.
LULUCF
2020 pledge and NDC Current policies
Official data PBL and
NewClimate
estimates
Official data PBL and
NewClimate
estimates
Absolute:
544 MtCO2e
530 MtCO2e
by 2020
400 to 505 MtCO2e,
-27% to -7% by
2020
415 to 430 MtCO2e,
-23% to -21% by
2030
577 to 656
Mt CO2e by
2020
724 MtCO2e
by 2030
520 to 535 MtCO2e,
-4% to -2% by 2020
495 to 570 MtCO2e,
-9% to 5% by 2030
Per capita:
24.6 tCO2e/capita
N/A 15.7 to 19.9
tCO2e/capita by
2020
14.8 to 15.2
tCO2e/capita by
2030
N/A 20.5 to 21
tCO2e/capita by
2020
17.4 to 20.2
tCO2e/capita by
2030
Greenhouse gas mitigation scenarios for major emitting countries
NewClimate Institute | November 2017 16
Brazil
The main GHG mitigation policies in Brazil include the policies in the LULUCF sector, i.e. the
enforcement of the Brazilian Forest Code and efforts to reduce deforestation in the Amazon and Cerrado
regions. Even though the annual deforestation rate in the Legal Amazon has risen during the last two
years (PRODES 2016), it is expected that successful implementation and enforcement of the proposed
measures can lead to long-term reduction of net GHG emissions. Other updates with respect to
Kuramochi et al. (2016) include biofuel policy updates and power capacity targets only including capacity
that is currently under construction. If all implemented policies are successful, emissions (including those
from LULUCF) may reach about 8% below to 11% above 2010 levels by 2030. Our analysis shows that
Brazil is likely on track to meet its NDC with currently implemented policies. In its NDC Brazil announced
a 45% share of renewables in the energy mix by 2030, and a 75% share of renewables in its electricity
supply by 2030, but we don’t include these planned policies in our analysis.
Table 10: Description of Brazil’s 2020 pledge and NDC
Indicator 2020 pledge NDC (21 September 2016)
Target: unconditional • Between 36.1 and
38.9% reduction by
2020 from a baseline
scenario
• 37% GHG reduction by 2025 from 2005
level and indicative contribution of 43%
GHG reduction by 2030 from 2005 level
(equivalent to 4% to 8% below 2010
levels by 2030)
Target: conditional • N/A • N/A
Sectoral coverage • Economy wide • Economy wide
General Accounting
method
• 100-year GWPs from
the IPCC Second
Assessment Report
• IPCC guidelines; 100-year GWPs from
the Fifth Assessment Report
GHGs covered • CO2, CH4, N2O, HFCs,
PFCs, and SF6
• CO2, CH4, N2O, HFCs, PFCs, and SF6
Consideration of
LULUCF
• Land use sector is
included in the target
• Accounting
approaches and
methodologies are not
specified
• Land use sector is included in the target
• Accounting approaches and
methodologies are not specified
Use of bilateral,
regional and
international credits
• N/A • Possible use of market mechanisms
that may be established under the Paris
Agreement
Other sector-level
targets
• N/A • 45% share of renewables in total
energy mix by 2030
Availability of
reference scenarios in
the latest UNFCCC
submissions
• No • No
Last available year for
GHG inventory
reporting
• 2012 (national inventory)
• 2015 (2017)
Greenhouse gas mitigation scenarios for major emitting countries
NewClimate Institute | November 2017 17
Table 11: Overview of key climate change mitigation policies in Brazil. Source: (Ministry of Mines and
Energy 2012); (Government of Brazil 2008)
Sector Policies (marked with
“(+)” when mentioned in
the NDC document)
Description
Economy-
wide
2020 pledge anchored in
national law (2010)
• Not specified
Energy
supply
10-year National Energy
Expansion Plan (2011)
• 16.5 GW wind, 13 GW biomass, 5.6 GW small
hydropower2) and 88.5 GW large hydropower
installed by 2025 (currently under construction)
• 41.4% renewable share in total primary energy
supply by 2022 (45% by 2024)
National Plan on Climate
Change (2008)
• 16% renewable electricity (excl. hydro) by 2020
(supported by renewable energy auctions,
Government of Brazil 2007)
Transport National Plan on Climate
Change (2008)
• Not specified
National Biodiesel
Programme (2005)
• Biodiesel share in diesel of 7% from 2015 and
10% from 2019 onwards
Ethanol Blending Mandate
(1993)
• Bioethanol share in gasoline of 25% from 2015
onwards
Inovar-Auto (2012) • 30% tax on cars sold between 2013 and 2017,
but not for cars meeting 1.82 MJ/km. Expected
average fuel efficiency 1.14 MJ/pkm by 2017
Forestry &
Agriculture
The Brazilian Forest Code
(2012) (+)
• Enforcement of the Brazilian Forest Code for the
Cerrado region and the rest of Brazil
• Restoring and reforesting 12 million hectares of
forests by 2030
The Low-Carbon
Agriculture (ABC) Plan)
(2010) (+)
• Restoring an additional 15 million hectares of
degraded pasturelands by 2030 and enhancing 5
million hectares of integrated cropland-livestock-
forestry systems by 2030
Plan for Prevention and
Control of Deforestation in
the Amazon (1996)
• Zero illegal deforestation by 2030 in the Amazon
and compensating for greenhouse gas emissions
from legal suppression of vegetation by 2030 1) The energy- and industry-related NDC policies are not quantified, but partly covered in the current policies
projection 2) Not included in PBL TIMER model
Greenhouse gas mitigation scenarios for major emitting countries
NewClimate Institute | November 2017 18
Table 12: Impact of climate policies on greenhouse gas emissions (including LULUCF) in Brazil.
Absolute emission levels and emission levels relative to 2010 levels are presented. References for
official emission data are provided in Table 3.
2010 GHG
emissions, incl.
LULUCF
2020 pledge and NDC Current policies
Official
data
PBL and
NewClimate
estimates
Official
data
PBL and
NewClimate
estimates
Absolute:
1,301 MtCO2e
2,070
MtCO2e by
2020
1,975 to 2070
MtCO2e, 52% to 59%
by 2020
1,195 MtCO2e, -8%
by 2030
1,300
MtCO2e by
2025
1,200
MtCO2e by
2030
1,270 to 1,425
MtCO2e, -3% to 10%
by 2020
1,205 to 1,445
MtCO2e, -8% to 11%
by 2030
Per capita:
6.6 tCO2e/capita
N/A 9.2 to 9.7
tCO2e/capita by 2020
5.3 tCO2e/capita by
2030
N/A 5.9 to 6.7
tCO2e/capita by 2020
5.3 to 6.4
tCO2e/capita by 2030
Figure 3: Impact of climate policies on greenhouse gas emissions in Brazil (left panel: all gases and
sectors, middle panel: excluding land use (i.e. LULUCF) and right panel: only land use). Source:
NewClimate Institute calculations based on Climate Action Tracker (CAT 2017) and PBL calculations
excluding LULUCF, and IIASA calculations on LULUCF emissions and removals (REDD-PAC Brazil
2015).
Greenhouse gas mitigation scenarios for major emitting countries
NewClimate Institute | November 2017 19
Canada
Canada’s fuel efficiency standard for passenger vehicles has the largest projected effect on GHG
emissions of any policy, and is harmonised with US standards. Another policy is the carbon standard
for newly built coal-fired power plants, but its impact on future GHG emissions may be limited as it does
not apply to existing power plants. Under current policies, Canada is projected to emit about 650 to 760
MtCO2e by 2030 excluding LULUCF (5% below to 11% above 2010 levels) and therefore not meet its
NDC (17% below 2005 level). Canada has recently proposed a plan to price carbon pollution that would
require individual provinces to either place a direct price on carbon pollution or adopt a cap and trade
system. This planned policy was not included in our analysis. Four provinces already have carbon
pricing systems in place (considered as current policies).
Historical net LULUCF emissions comes from the GHG inventory data presented in the National
Inventory report which excludes emissions and removals from natural disturbances. The current policy
projections for the LULUCF sector have thereby been revised downwards compared to our earlier
assessment to be consistent with the NDC target which excludes emissions from natural disturbances.
Table 13: Description of Canada’s 2020 pledge and NDC
Indicator 2020 pledge NDC (5 October 2016)
Target: unconditional • 17% GHG reduction by 2030
from 2005 level
• 30% GHG reduction by 2030
from 2005 level
Target: conditional • N/A • N/A
Sectoral coverage • Economy-wide • Economy-wide
General Accounting
method
• IPCC guidelines; 100-year
GWPs from the Fourth
Assessment Report
• IPCC guidelines; 100-year
GWPs from the Fourth
Assessment Report
GHGs covered • CO2, CH4, N2O, HFCs, PFCs,
SF6 and NF3
• CO2, CH4, N2O, HFCs, PFCs,
SF6 and NF3
Consideration of
LULUCF
• Land use sector is included in
the target
• Net-net approach will be used
for emission accounting 1)
• Excludes emissions from
natural disturbances
• LULUCF accounting could
produce 19 MtCO2e to 28
MtCO2e of credits per year
(Government of Canada 2014,
CAT 2015) 2)
• Land use sector is included in
the target
• Accounting approach not
specified, approach being
used to account for the
LULUCF sector being
examined 1)
• Excludes emissions from
natural disturbances and only
account for anthropogenic
emissions and removals
Use of bilateral,
regional and
international credits
• N/A • International mechanisms may
be used
Availability of
reference scenarios in
the latest UNFCCC
submissions
• Yes • Yes
1) Canada does though specify that it intends to use the production approach for accounting for harvested wood
products (HWP) consistent with IPCC guidance (Iversen et al. 2014, Government of Canada 2017) 2) Credits are not accounted for in the NDC. For consistency reasons the credits mentioned in the 2020 pledge
are therefore not considered in the calculation of the pledge emissions
Greenhouse gas mitigation scenarios for major emitting countries
NewClimate Institute | November 2017 20
Table 14: Overview of key climate change mitigation policies in Canada. Source: Government of Canada
(2014, 2015)
Sector Policies (marked with “(+)”
when mentioned in the NDC
document)
Description
Energy supply CO2 standard for new power
plants (2012)
• 420 gCO2/kWh from 1 July 2015
Transport Efficiency standards light
commercial vehicles (2004)
• 34.1 mpg (14.9 km/l) by 2017, 55
mpg (23.2 km/l / 0.91 MJ/pkm) by
2025
Efficiency standards heavy-
duty trucks (2013)
• Differs per type of truck (aligned
with federal-level regulations in the
US) – 1.38 MJ/tkm by 2027 for
medium trucks, 0.92 MJ/tkm by
2027 for heavy trucks
Renewable fuel regulations
(biofuel bill - amendment to
CEPA) (2008)
• Bio-ethanol share in gasoline of
5% from 2011 onwards
• Biodiesel share in diesel of 2%
from 2011 onwards
Buildings EcoENERGY efficiency (2011) • Supported the implementation of
energy codes, among other things,
to improve energy efficiency of
buildings.1)
Forestry & Agriculture The Growing Forward 2
(2013)
• Supports the initiatives to advance
environmentally sustainable
agriculture 2) 1) Quantified in PBL TIMER model as building codes for space heating, which resulted in 0.1 MtCO2 emission
reduction by 2020, relative to the SSP2 baseline. The second biennial report estimated the mitigation impact
of this policy to be 6.5 MtCO2 by 2020, relative to their baseline (Government of Canada 2015).
2) Policy not quantified in the IIASA LULUCF projections
Greenhouse gas mitigation scenarios for major emitting countries
NewClimate Institute | November 2017 21
Table 15: Impact of climate policies on greenhouse gas emissions (excluding LULUCF) in Canada.
Absolute emission levels and emission levels relative to 2010 levels are presented. Note that the official
values are based on GWP values from the IPCC 4th Assessment Report. References for official emission
data are provided in Table 3.
2010 GHG
emissions, excl.
LULUCF
2020 pledge and NDC Current policies
Official
data
PBL and
NewClimate
estimates
Official
data
PBL and NewClimate
estimates
Absolute:
685 MtCO2e
622 MtCO2e
by 2020,
523 MtCO2e
by 2030
605 MtCO2e, -12%
by 2020
510 MtCO2e, -25%
by 2030
768 MtCO2e
by 2020,
815 MtCO2e
by 2030
670 to 725 MtCO2e, -
2% to 6% by 2020
650 to 760 MtCO2e, -
5% to 11% by 2030
Per capita:
20.1 tCO2e/capita
N/A 16.1 tCO2e/capita
by 2020
12.6 tCO2e/capita
by 2030
N/A 17.9 to 19.2
tCO2e/capita by 2020
16 to 18.7
tCO2e/capita by 2030
Figure 4: Impact of climate policies on greenhouse gas emissions in Canada (left panel: including land
use (i.e. LULUCF) and right panel: only land use). Source: NewClimate Institute calculations adapted
from Climate Action Tracker (CAT 2017) and PBL calculations excluding LULUCF, and IIASA
calculations on LULUCF emissions and removals.
Greenhouse gas mitigation scenarios for major emitting countries
NewClimate Institute | November 2017 22
Chile
By 2030 Chile aims to reduce its GHG emissions intensity per unit GDP by 30% from 2007 levels under
unconditional NDC and 35% to 45% under conditional NDC, which is subject international support. Chile
is estimated to emit 163 MtCO2e/year by 2030 and 128-151 MtCO2e/year under its unconditional
conditional NDC, respectively. Some of its most relevant current policies are the Non-Conventional
Renewable Energy Law (NCRE) Law 20698 (20% renewable energy target for 2025) and the Energy
Efficiency Action Plan (12% reduction of the final energy demand below BAU by 2020).
Under current policies, GHG emissions in 2030 are projected to be around 185 MtCO2e excluding
LULUCF. We conclude that Chile is not on track to achieve its unconditional NDC target.
Table 16: Description of Chile’s 2020 pledge and NDC
Indicator 2020 pledge NDC (submitted 10 February 2017)
Greenhouse gas mitigation scenarios for major emitting countries
NewClimate Institute | November 2017 23
Table 17: Overview of key climate change mitigation policies in Chile. Source: (National Environmental
Commission 2010, National Forest Corporation and Ministry of Agriculture 2012, Government of Chile
2013, Ministry of Energy 2014, FAO 2015, Government of Chile 2015, Ministry of Environment 2015,
IEA/IRENA 2016, Ministry of Environment 2016)
Sector Policies (marked with
“(+)” when
mentioned in the
NDC document)
Description
Economy-
wide
Energy Efficiency
Action Plan (2012)
• 12% reduction of final energy demand below business-
as-usual (BAU) by 2020 (as projected from 2010)
Energy
supply
Law 20698: Non-
Conventional
Renewable Energy
Law (NCRE) (2013)
(+)
• Utilities larger than 200MW to generate 5% of
electricity from renewable sources in 2013 with
continued increase to 12% in 2020, 18% in 2024 and
20% in 2025. The non-conventional renewable energy
sources do not include hydro larger than 40MW.
Law 20698: Non-
Conventional
Renewable Energy
Law (NCRE) (2013)
(+)
• Utilities larger than 200MW to generate 5% of
electricity from non-conventional renewable sources in
2013 with continued increase to 12% in 2020, 18% in
2024 and 20% in 2025. The non-conventional
renewable energy sources do not include hydro larger
than 40MW.
Energy Plan 2050
(2016)
• Target to generate 60% of electricity from renewable
sources (incl. large hydro) in 2035 and 70% in 2050
Transport
Law 20780: “Green
tax” second stage1)2)
(+) 2016
• The second stage of the “green tax” mandates: 50%
tax increase of NOx emissions by 2016, this is: 10%
tax increase for gasoline based vehicles and 40%
increase for diesel based vehicles. By 2017, there will
be another 50% tax increase for NOx emissions
Energy Efficiency
Action Plan (2012)
• Vehicle labelling system and setting of minimum
energy efficiency standards for vehicles to achieve a
12% of energy saving below BAU by 2020
Industry Energy Efficiency
Action Plan (2012)
• Promote energy management systems, energy efficient
technologies, and cogeneration to reduce energy
consumption
Buildings Energy efficiency in
public buildings (2012)
• 20% of energy savings below BAU by 2020
F-gases N/A • N/A
Forestry
National Forest and
Climate Change
Strategy (+) (2013)
• Recovery of 100,000 hectares of forest land, mainly
native species
Forestation program • Reforestation of 100,000 hectares of forest 1) Exemption for public transportation for over 10 seats and cargo vans for over 2,000 kg load and closed vans
of lower capacity 2) No information available on implementation status. For the current analysis, we have assumed full
implementation.
Greenhouse gas mitigation scenarios for major emitting countries
NewClimate Institute | November 2017 24
Table 18: Impact of climate policies on greenhouse gas emissions (excluding LULUCF) in Chile.
Absolute emission levels and emission levels relative to 2010 levels are presented. References for
official emission data are provided in Table 3.
2010 GHG
emissions, excl.
LULUCF
2020 pledge and NDC Current policies
Official data NewClimate
estimates
Official data NewClimate
estimates
Absolute:
92 MtCO2e
N/A 100 MtCO2e, 8%
by 2020
130 to 165
MtCO2e, 40% to
78% by 2030
N/A 150 MtCO2e, 62%
by 2020
185 MtCO2e, 100%
by 2030
Per capita:
5.4 tCO2e/capita
N/A 5.4 tCO2e/capita by
2020
6.6 to 8.3
tCO2e/capita by
2030
N/A 8.1 tCO2e/capita by
2020
9.4 tCO2e/capita by
2030
Figure 5: Impact of climate policies on greenhouse gas emissions in Chile (left: excluding land use (i.e.
LULUCF), right: only land use). Source: NewClimate Institute calculations based on its analysis for
Climate Action Tracker (CAT 2017) excluding LULUCF, and IIASA calculations on LULUCF emissions
and removals. Please see Appendix (A2) on the consideration of LULUCF for the NDC quantification.
Greenhouse gas mitigation scenarios for major emitting countries
NewClimate Institute | November 2017 25
China
China has pledged to peak CO2 emissions around 2030, to achieve 20% share of non-fossil energy
sources in total primary energy consumption by 2030, and to reduce the carbon intensity of its GDP by
60-65% compared to 2005 levels. Our current policies scenario, which take the latest renewable
capacity targets into account, as well as a cap on coal consumption, projects that China’s policies are
more or less in line with what the NDC targets would mean for overall emissions, which will keep rising
until 2030 but with a much slower growth rate than in the previous decade, reaching 12.4 to 14.9
GtCO2e/year in 2030. In the lower end of the range shown in the graph, CO2 emissions have already
peaked and slowly decrease toward 2030, based on the assumption that the trend in decreasing coal
consumption observed in the last years will continue. The timing of the emissions peak in China is still
uncertain: while some are optimistic and say China may have peaked already in 2014 (Green and Stern
2016), others are more pessimistic and consider potentially increasing emissions from energy
consumption in spite of a decline of coal (Peters 2017).
Table 19: Description of China’s 2020 pledge and NDC
Indicator 2020 pledge NDC (submitted 3 September 2016)
Target:
unconditional
• 40-45% CO2 emission
intensity reduction by 2020;
15% non-fossil fuels in
primary energy consumption
and increased forest stock
volume
• Peaking CO2 emissions around
2030; 60-65% CO2 emission intensity
reduction by 2030, compared to 2005
levels; 20% non-fossil fuels in
primary energy consumption by 2030
and increased forest stock volume
Target: conditional • N/A • N/A
Sectoral coverage • Not specified • Not specified
General Accounting
method
• Not specified • Not specified
GHGs covered • CO2 only • CO2 only
Consideration of
LULUCF
• Targets for the land use
sector are included
• The forest stock in China will
be increased by 1.3 billion
m3 by 2020, compared to the
2005 level
• Accounting approaches and
methodologies are not
specified
• Targets for the land use sector are
included the INDC
• The forest stock in China will be
increased by 4.5 billion m3 by 2030,
compared to the 2005 level
• Accounting approaches and
methodologies are not specified
Use of bilateral,
regional and
international credits
• Not specified • Not specified
Other sector-level
targets
• Not specified • Non-fossil target (20% of TPES by
2030)
• Gas target (10% of TPES by 2020)
• Coal cap (max. 58% of TPES by
2020)
Availability of
reference scenarios
in the latest
UNFCCC
submissions
• N/A • N/A
Greenhouse gas mitigation scenarios for major emitting countries
NewClimate Institute | November 2017 26
Table 20: Overview of key climate change mitigation policies in China, Source: (The People’s Republic
of China 2012, The People’s Republic of China 2014a, The People’s Republic of China 2014b, State
Council 2015). Note: Policy targets may change significantly under the 13th Five Year Plan (2016-2020)
currently in action.
Sector Policies (marked with “(+)”
when mentioned in the NDC
document)
Description
Economy-
wide
National Action Plan on Climate
Change (2014)
• Emission trading program to be expanded to
nationwide scale by 2017
13th Five Year Plan (2016-
2020)
• Cap on total primary energy use in 2020 at 5.0
billion tce
• Decrease CO2 intensity by 18% between 2015
and 2020
The Thirteenth Five Year
Energy Development Plan
• Limit share of coal to 58% of total energy
consumption
Energy
supply
Energy Development Strategy
Action Plan 2014-2020
• Cap on coal consumption in 2020 at 4.2 billion
tce
• A 10% target share of gas in primary energy
supply in 2020
• 15% non-fossil share in TPES in 2020
• Renewable electricity: 350 GW hydropower
excl. pumped storage, 200 GW wind, 100 GW
solar, 30 GW biomass, 0.1 GW tidal4)
• 800 million m2 collector area
• 10 million tonnes ethanol, 2 million tonnes
biodiesel
• 58 GW nuclear power (150 GW by 2030)
Action Plan for Upgrading of
Coal Power Energy
Conservation and Emission
Reduction Released (2014)
• Reduce average net coal consumption rate of
new coal-fired power plants to 300 g of
standard coal per kWh (implemented as a
power plant standard of 889 gCO2/kWh by
2020)
Transport Vehicle fuel economy standards
(2005)
• Fuel efficiency of new light duty vehicles:
1.5 MJ/pkm by 2015, 1.1 MJ/pkm by 2020
• Fuel efficiency of new medium duty trucks: 0.19
MJ/tkm to 0.29 MJ/tkm and 0.08 to 0.13 MJ/tkm
since 2015
Biofuel targets • Ethanol blending mandates 10% in selected
provinces
Industry “Made in China 2025” CO2
intensity target (2013)
• Manufacturing industries reduce their CO2
emissions per unit of added value by 22% by
2020 and 40% by 2025 from 2015 levels1),2)
Green industry development
plan (2016-2020) China 2016
• Decrease energy consumption per value added
by 18% between 2015 and 2020.
Buildings Appliance standards and
labelling programme
• Supplemented with subsidies and awareness-
raising campaigns*
National Building Energy
Standard
• 30% of newly constructed to meet standards by
20205)
Table to be continued on next page
Greenhouse gas mitigation scenarios for major emitting countries
NewClimate Institute | November 2017 27
F-gases N/A • N/A
Forestry
Promotion of afforestation and
sustainable forest management
• Increasing the forest area by 40 million
hectares and the forest stock volume by 1.3
billion m3 from 2005 levels by 2020.
Program Plan of Fast Growing
and High Yielding Timber
Plantations (2001)
• Establishment of at least 15 million hectares of
fast-growing, high-yield plantations, of which
5.8 million hectares of fast-growing pulpwood
plantations
Mid and Long-Term Plan for
National Forest Management
(2011)
• Building young and mid-aged forest tending
areas and transformation of low-yield forest
area in the range of 35 million hectares 3) 1) Not quantified in PBL TIMER model 2) Not quantified by NewClimate Institute calculations 3) Policy not quantified in the IIASA LULUCF projections 4) NewClimate used capacity targets from 13th FYP: 340 GW hydro, 210 GW wind, 110 GW solar, 15 GW
biomass, 58 GW nuclear 5) Implemented by PBL via assuming standard means 439 MJ/m²
Table 21: Impact of climate policies on greenhouse gas emissions (including LULUCF) in China.
Absolute emission levels and emission levels relative to 2010 levels are presented. References for
official emission data are provided in Table 3.
2010 GHG
emissions, incl.
LULUCF
2020 pledge and NDC Current policies
Official data PBL and
NewClimate
estimates
Official data PBL and
NewClimate
estimates
Absolute:
10,100 MtCO2e
14,500
MtCO2e
11,415 to 14,040
MtCO2e, 12% to
34% by 2020
12,180 to 14,830
MtCO2e, 19% to
39% by 2030
N/A 12,170 to 13,485
MtCO2e, 21% to
34% by 2020
12,380 to 14,910
MtCO2e, 23% to
48% by 2030
Per capita:
7.4 tCO2e/capita
N/A 8.0 to 9.9
tCO2e/capita by
2020
8.5 to 10.3
tCO2e/capita by
2030
N/A 8.5 to 9.5
tCO2e/capita by
2020
8.6 to 10.3
tCO2e/capita by
2030
Greenhouse gas mitigation scenarios for major emitting countries
NewClimate Institute | November 2017 28
Figure 6: Impact of climate policies on greenhouse gas emissions in China (left panel: all gases and
sectors, and right panel: only land use (i.e. LULUCF)). Source: NewClimate Institute calculations
(excluding LULUCF) based on its analysis for the Climate Action Tracker (CAT 2017) and PBL
Calculations excluding LULUCF, and IIASA calculations on LULUCF emissions and removals.
Greenhouse gas mitigation scenarios for major emitting countries
NewClimate Institute | November 2017 29
Colombia
In its INDC, Colombia intends to reduce its GHG emissions by 20% from BAU level by 2030 and commits
to increase the target to 30% subject to provision of international support. Colombia’s INDC partially
includes LULUCF; emissions and removals from forest plantations and permanent crops are included
but removals from natural forests that remain as natural forests are excluded. Colombia’s unconditional
and conditional reduction targets translate to 268 MtCO2e and 235 MtCO2e, respectively, by 2030
including LULUCF.
The emissions projections under current policies range at 155 to 215 MtCO2e in 2030, thus Colombia
will overachieve its unconditional INDC target with existing policies. The projections have been revised
downward from the 2016 report because BAU projections provided in Colombia’s INDC used for the
calculations have been harmonised with the recently submitted inventory (last data year: 2012), which
led to significant reductions in BAU emission levels in 2020 (ranging from 58 to 69 MtCO2e/year) and
2030 (ranging from 58 to 83 MtCO2e/year).
Table 22: Description of Colombia’s 2020 pledge and INDC
Indicator INDC (submitted 7 September 2015)
Target: unconditional • 20% GHG reduction with respect to BAU by 2030
Target: conditional • 30% GHG reduction with respect to BAU by 2030, subject
to international support
Sectoral coverage • Economy-wide
General Accounting method • IPCC guidelines; 100-year GWPs from the 2nd IPCC
Assessment Report
GHGs covered • CO2, CH4, N2O, HFCs, PFCs, SF6
Consideration of LULUCF • Land use sector is included in the target
• BAU calculation excludes removals from natural forests
that still remain as natural forests in the target year
• Accounting approaches and methodologies are not
specified
Use of bilateral, regional and
international credits
• Colombia will explore the use of market instruments (or
other economic instruments) with the objective of
contributing the emissions reduction target
Availability of reference
scenarios in the latest UNFCCC
submissions
• Yes, INDC shows a BAU emissions pathway
Note: Colombia has not set its 2020 pledge.
Greenhouse gas mitigation scenarios for major emitting countries
NewClimate Institute | November 2017 30
Table 23: Overview of key climate change mitigation policies in Colombia. Source: (IEA 2013,
Colombian Government 2014, Ministry of Environment and Sustainable Development 2016, Ministry of
External Relations 2016, NAMA Facility 2016)
Sector Policies (marked with “(+)”
when mentioned in the INDC
document)
Description
Economy-
wide
Colombian Low-Carbon
Development Strategy (+)
(ECDBC) (2012)
• Through the implementation of 8 Sectorial
Mitigation Action Plans (SMAPs), approved by
the relevant sectorial Ministries, the ECDBC aims
to deviate from BAU emissions growth, estimated
to be over 60% from current levels by 2030
Energy
supply
Law 697: Programme for
rational and efficient use of
energy and other forms of
non-conventional Energy
(PROURE) (2010)
• PROURE plans to achieve a 20% and 30% of
RE sources by 2015 and 2020, respectively
Buildings NAMA II Project – For the
domestic refrigeration sector
(2017-2021)
• GHG emissions reduction of 16.8 MtCO2e over
the lifetime of the equipment, and an annual
reduction of around 3.8 MtCO2e by 2030, which
is a 50% reduction from BAU in the sector
Transport NAMA I Project – Colombia
Transit Development (TOD)
(2015)
• Estimated reductions of annual GHG emissions
by 3.6 to 5.5 MtCO2e by 2040.
F-gases N/A • N/A
Forestry
The National Development
Plan of Colombia (+) (2015)
• Reduction of the annual deforestation rate from
121,000 hectares in 2013 to 90,000 hectares by
2018
The Amazon Vision Program
(+) (2016)
• Achieve zero net deforestation by 2020 1)
REDD+ Zero Deforestation in
the Amazon by 2020 (2009)
• REDD+ consists of 4 phases strategy with a total
of 18.5 million USD for planning and
implementation 11) 1) Policy is not implemented in the IIASA LULUCF projections
Greenhouse gas mitigation scenarios for major emitting countries
NewClimate Institute | November 2017 31
Table 24: Impact of climate policies on greenhouse gas emissions (including LULUCF but excluding net
removals from natural forests) in Colombia. Absolute emission levels and emission levels relative to
2010 levels are presented. References for official emission data are provided in Table 3.
2010 GHG
emissions, incl.
LULUCF
2020 pledge and INDC Current policies
Official data NewClimate
estimates
Official
data
NewClimate
estimates
Absolute:
181 MtCO2e
235 to 268 MtCO2e
by 2030, 29% to
48% by 2030
235 to 270 MtCO2e,
29% to 48% by
2030
N/A 155 to 170 MtCO2e,
-16% to -5% by
2020
155 to 215 MtCO2e,
-14% to 19% by
2030
Per capita:
3.9 tCO2e/capita
N/A 4.4 to 5.0
tCO2e/capita by
2030
N/A 3.0 to 3.4
tCO2e/capita by
2020
2.9 to 4 tCO2e/capita
by 2030
Figure 7: Impact of climate policies on greenhouse gas emissions in Colombia (left: including land use
(i.e. LULUCF), right: only land use). Source: NewClimate Institute calculations excluding LULUCF and
IIASA calculations on LULUCF emissions and removals.
Note: the BAU emission projection in Colombia’s INDC excludes removals from natural forests, which
accounted for 263 MtCO2e/yr in 2010. Therefore, net removals from natural forests are excluded from
the current policies scenario and INDC analysis (figure on the left) but included in the figure on the right.
Greenhouse gas mitigation scenarios for major emitting countries
NewClimate Institute | November 2017 32
Democratic Republic of the Congo (DRC)
In its INDC, the Democratic Republic of the Congo (DRC) pledges to reduce emissions by 17% by 2030
compared to a business-as-usual (BAU) emissions scenario, or a 73 MtCO2e/year reduction in absolute
terms. The target covers the agriculture, forestry and energy sectors and it is conditional on international
financial support. Under its INDC, DRC’s GHG emissions including LULUCF would increase from 234
MtCO2e/year in 2010 up to 357 MtCO2e/year by 2030.
Under current policies, DRC’s GHG emissions are projected to increase to 455 MtCO2e/year by 2030.
This means that DRC is not on track to achieve its INDC in the LULUCF sector. While current peatland
emissions in the DRC are reported to be minor, they may become large in the future if concessions are
provided for the vast peat land areas and they were to become exploited in an industrial manner (Dargie,
Lewis et al. 2017).
Table 25: Description of the Democratic Republic of the Congo’s INDC
Indicator INDC (submitted 18 August 2015)
Target: unconditional • The INDC is partially conditional, see below
Target: conditional • 17% reduction compared to BAU emission levels (430 MtCO2e, i.e.
slightly more than 70 MtCO2e reduction) by 2030; actions conditional
to the provision of adequate support in terms of financial resources,
technology transfer and the reinforcement of national capacity (mix
of domestic and international resources not specified)
Sectoral coverage • Agriculture, forestry and energy
General Accounting
method
• IPCC 1996 (revised) and 2006 guidelines; GWP values not specified
GHGs covered • CO2, CH4, N2O
Consideration of
LULUCF
• Land use sector is included in the target
• Accounting approaches and methodologies are not specified
Use of bilateral,
regional and
international credits
• Not specified
Other sector-level
targets
• Not specified
Availability of reference
scenarios in the latest
UNFCCC submissions
• The INDC refers to the emissions level under a BAU scenario by
2030 (430 MtCO2e) and provides a graph showing the pathways of
the emissions development.
Note: D.R. Congo has not set its 2020 pledge.
Greenhouse gas mitigation scenarios for major emitting countries
NewClimate Institute | November 2017 33
Table 26: Overview of key climate change mitigation policies in the Democratic Republic of the Congo
(only LULUCF policies were assessed). Source: (REDD-PAC DRC 2016). References for official
emission data are provided in Table 3.
Sector Policies (marked with “(+)” when
mentioned in the INDC document)
Description
Economy-wide Not assessed • Not assessed
Energy supply Not assessed • Not assessed
Transport Not assessed • Not assessed
Industry Not assessed • Not assessed
Buildings Not assessed • Not assessed
F-gases Not assessed • Not assessed
Forestry &
Agriculture
Protection of permanent forest
domains (Plan de convergence
COMIFAC) (2015)
• No expansion of agriculture into
protected forest areas
• No expansion of agriculture into forest
concessions
Afforestation and reforestation
measures (Plan de convergence
COMIFAC) (2015) (+)
• Increase the national forest cover 1)
Sustainable timber management
(Plan de convergence COMIFAC)
(2015)
• Sustainable timber harvests in
existing forest concessions following
management plans 1) Policy not quantified in the IIASA LULUCF projections
Table 27: Impact of LULUCF policies on greenhouse gas emissions (including LULUCF) in the
Democratic Republic of the Congo. Absolute emission levels and emission levels relative to 2010 levels
are presented.
2010 GHG emissions,
incl. LULUCF
2020 pledge and INDC Current policies
Official data NewClimate
estimates
Official
data
NewClimate
estimates
Absolute:
234 MtCO2e
357 MtCO2e in
2030, 94% by
2030
355 MtCO2e, 94%
by 2030
N/A 365 MtCO2e, 56%
by 2020
455 MtCO2e, 94%
by 2030
Per capita:
3.6 tCO2e/capita
N/A 3.0 tCO2e/capita
by 2030
N/A 4.1 tCO2e/capita
by 2020
3.8 tCO2e/capita
by 2030
Greenhouse gas mitigation scenarios for major emitting countries
NewClimate Institute | November 2017 34
Figure 8: Impact of climate policies on greenhouse gas emissions (upper figure: incl. land use (i.e.
LULUCF), lower figure: land use only) in the Democratic Republic of the Congo. Source: NewClimate
Institute calculations excluding LULUCF and IIASA calculations on LULUCF emissions and removals
(REDD-PAC DRC 2016).
Greenhouse gas mitigation scenarios for major emitting countries
NewClimate Institute | November 2017 35
Ethiopia
Ethiopia pledged a partially conditional NDC target to reduce GHG emissions by 64% below BAU by
2030, which constitutes a total reduction of at least 255 MtCO2e. The current policies projection mainly
considers the Growth and Transformation Plan (GTP) phase I (2010-2015) and some initiatives under
the Climate Resilience and Green Economy Strategy.
Ethiopia’s GHG emissions are projected to be 235-300 MtCO2e by 2030 (including LULUCF) under
current policies. Ethiopia would, therefore, need to implement additional policies to achieve its NDC
target. The current policies projections currently do not consider the second phase of the Growth and
Transformation Plan (GTP II) (2016-2020) due to uncertainty on how the Climate Resilience and Green
Economy Strategy shall is fully implemented until 2025.
Table 28: Description of Ethiopia’s 2020 pledge and NDC
Indicator NDC (submitted 9 March 2016)
Target: unconditional • N/A
Target: partially
conditional
• 64% GHG reduction (255 MtCO2e reduction) from the BAU
scenario in 2030 (partially conditional on international financial
resources)
Sectoral coverage • Agriculture, Forestry, Industry (including mining), Transport,
Buildings (including Waste and Green Cities), Electric power
General Accounting
method
• IPCC 2006 guidelines; 100-year GWPs from the Fourth
Assessment Report
GHGs covered • CO2, CH4 and N2O
Consideration of LULUCF • Land use sector is included in the target
• A reduction of net LULUCF emissions is expected in the range of
90 MtCO2e from agriculture and 130 MtCO2e from forestry by
2030 as compared to projected BAU levels. These reductions
are part of the total reduction target.
• Accounting approaches and methodologies are not specified
Use of bilateral, regional
and international credits
• Yes. Expected amount not quantified.
Availability of reference
scenarios in the latest
UNFCCC submissions
• Yes. BAU scenario until 2030 (Federal Democratic Republic of
Ethiopia 2015).
Note: Ethiopia has not set its 2020 pledge.
Greenhouse gas mitigation scenarios for major emitting countries
NewClimate Institute | November 2017 36
Table 29: Overview of key climate change mitigation policies in Ethiopia. Source: (Ethiopia Rural Energy
Development and Promotion Centre (EREDPC) 2007, Federal Democratic Republic of Ethiopia 2010,
Federal Democratic Republic of Ethiopia 2011, Federal Democratic Republic of Ethiopia - Ministry of
Water and Energy 2012, Federal Democratic Republic of Ethiopia 2015, Federal Democratic Republic
of Ethiopia 2016)
Sector Policies (marked with “(+)”
when mentioned in the NDC
document)
Description
Economy-
wide
Climate Resilience and Green
Economy Strategy (CRGE)
(2011) (+) 1) 2)
• Strategy with various mitigation initiatives to
limit economy-wide GHG emissions in 2030
to 150 MtCO2e (250 MtCO2e below BAU)
• Development of up to 25 GW in renewable
power capacity by 2030
Energy
supply
Scaling-Up Renewable Energy
Program for Ethiopia (SREP
Investment Plan) (2012) 1)
• Increase power generation capacity from the
present level of 2 GW to 10 GW by 2015 and
to 25 GW by 2030
• Focus on five major investment projects of
wind, geothermal and hydroelectric energy
generation
National Biogas Programme
(2007) 1)
• Construction of 20,000 biogas plants by 2017
(2nd phase: 2014-2017)
Transport Intra-Urban Electric Rail NAMA
(2012) 3)
• Replace 50% of the cargo transport with
electric rail transport
• Expected emissions reduction of 8.9
MtCO2e/yr by 2030
Industry N/A • N/A
Buildings N/A • N/A
F-gases N/A • N/A
Forestry
Afforestation and reforestation
actions (part of the CRGE)
(2011) (+)
• Target is 7 million hectares of afforestation
and reforestation by 2030. 1)
• 17,000 hectares of forest to be brought under
protection and natural regeneration over a 30
years planning period. 1) See Supporting Information for detailed assumptions on the policies and measures under the First Growth
and Transformation Plan (GTP I) quantified in the current policies scenario. 2) The Second Growth and Transformation Plan (GTP II) aims for the full implementation of CRGE until 2025
(Federal Democratic Republic of Ethiopia 2016), but is excluded from the current policies emissions
projections. See Supporting Information for details. 3) Excluded due to its uncertain development status.
Greenhouse gas mitigation scenarios for major emitting countries
NewClimate Institute | November 2017 37
Table 30: Impact of climate policies on greenhouse gas emissions (including LULUCF) in Ethiopia.
Absolute emission levels and emission levels relative to 2010 levels are presented. Official values for
2030 are based on GWP values from the IPCC 4th Assessment Report. References for official emission
data are provided in Table 3.
2010 GHG
emissions, incl.
LULUCF
2020 pledge and NDC Current policies
Official data NewClimate
estimates
Official
data
NewClimate
estimates
Absolute:
169 MtCO2e
145 MtCO2e, -
18% by 2030
145 MtCO2e, -
15% by 2030
N/A 190 to 200 MtCO2e,
11% to 19% by 2020
235 to 300 MtCO2e,
38% to 78% by 2030
Per capita:
1.9 tCO2e/capita
N/A 1.0 tCO2e/capita
by 2030
N/A 1.7 to 1.8 tCO2e/capita
by 2020
1.7 to 2.2 tCO2e/capita
by 2030
Figure 9: Impact of climate policies on greenhouse gas emissions (CO2, CH4 and N2O) including land
use (i.e. LULUCF) in Ethiopia. Source: NewClimate Institute calculations excluding LULUCF based on
its analysis for Climate Action Tracker (CAT 2017) and IIASA calculations on LULUCF emissions and
removals.
Greenhouse gas mitigation scenarios for major emitting countries
NewClimate Institute | November 2017 38
European Union
The EU’s NDC aims to reduce its GHG emissions by at least 40% by 2030 from 1990 levels. For 2020,
the EU made unconditional and conditional pledges of reducing its GHG emissions by 20% and 30%
from 1990 levels, respectively.
Under current policies, the EU is likely to overachieve its unconditional 2020 pledge but is projected to
be short of its NDC target. Compared to the 2016 report, the projection range has been revised
downward mainly due the revised historical emissions data (about 50 MtCO2e/year lower in 2010,
excluding the LULUCF sector) and the revised data harmonisation year. Emissions projections for
Annex I countries are harmonised to 2015 inventory emissions (instead of 2010 in the previous report).
For the EU the rate of emissions reductions observed between 2010 and 2015 was faster than our
model projections for the same period.
Table 31: Description of EU’s 2020 pledge and NDC
Indicator 2020 pledge NDC (5 October 2016)
Target: unconditional • 20% GHG reduction by 2020 from
1990 level
• Kyoto target: 20% GHG reduction
by 2020 from base year averaged
over the second commitment
period 2013-2020
• At least 40% greenhouse
gas reduction by 2030
from 1990 level
Target: conditional • 30% GHG reduction by 2020 from
1990 level
• N/A
Sectoral coverage • Economy wide • Economy wide
General Accounting
method
• IPCC guidelines; 100-year GWPs
from the Fourth Assessment
Report
• IPCC guidelines; 100-year
GWPs from the Fourth
Assessment Report
GHGs covered • CO2, CH4, N2O, HFCs, PFCs, SF6
and NF3
• CO2, CH4, N2O, HFCs,
PFCs, SF6 and NF3
Consideration of LULUCF • Land use sector is not included in
the target
• Land use sector is
included in the target
• A decision on how to
include land use is
specified to be taken at a
later stage 1)
Use of bilateral, regional
and international credits
• No • No
Availability of reference
scenarios in the latest
UNFCCC submissions
• Yes • Yes
Last available year for
GHG inventory reporting
• 2015 (GHG inventory report submitted to the UNFCCC)
1) A legislative proposal has since then been presented by the European Commission (European Commission
2016)
Greenhouse gas mitigation scenarios for major emitting countries
NewClimate Institute | November 2017 39
Table 32: Overview of key climate change mitigation policies in the EU. Source: (European Parliament
2009b, European Parliament 2009d, European Parliament 2009c, European Parliament 2009a,
European Parliament 2012, European Commission 2015, EEA 2016, European Commission 2016)
Sector Policies (marked with “(+)”
when mentioned in the NDC
document)
Description
Economy/
state wide
EU ETS Directive (2003/87/EC
revised by Directive 2009/29/EC)
• Emission cap on emissions from
electricity/heat and industry of 21% below
2005 levels, by 2020
Energy
supply
Renewable Energy Roadmap/
Directive (2009/28/EC)
• Target of 20% renewable energy by 2020
Energy Efficiency Directive
(2012/27/EC)
• Target of 20% energy efficiency improvement
by 2020
Buildings Eco-design Framework Directive
(Directive 2009/125/EC)
• Specific standards for a wide range of
appliances
Building Energy Efficiency
Directive (2012)
• Near zero energy buildings by 2020
(residential) and by 2018 (public)1)
Transport Regulation of CO2 emissions from
passenger vehicles (443/2009)
• Emission standard of 95 gCO2/km, phasing in
for 95% of vehicles by 2020 with 100%
compliance by 2021
• Light commercial vehicle standards of 147
gCO2/km by 2020
Directive 2009/28/EC Biofuel
target
• 10% quota for RE in transport fuels (also
electricity) 1) NewClimate only quantified the policy for residential buildings
Table 33: Impact of climate policies on greenhouse gas emissions (excluding LULUCF) in the EU.
Absolute emission levels and emission levels relative to 2010 levels are presented. Note that the official
values for 2020 and 2030 are based on GWP values from the IPCC 4th Assessment Report. References
for official emission data are provided in Table 3.
2010 GHG
emissions,
excl.
LULUCF
2020 pledge and NDC Current policies
Official data 1) PBL and
NewClimate
estimate 2)
Official data 1) PBL and NewClimate
estimate 2)
Absolute:
4,700
MtCO2e
4,588 MtCO2e
by 2020
(unconditional)
3,441 MtCO2e
by 2030
3,875 to 4,425
MtCO2e, -18% to -
6% by 2020
3,320 MtCO2e, -
29% by 2030
4,387 MtCO2e
by 2020
4,229 MtCO2e
by 2030
3,955 to 4,115 MtCO2e, -16%
to -12% by 2020
3,465 to 3,870 MtCO2e, -26%
to -18% by 2030
Per capita:
9.3
tCO2e/capita
N/A 7.6 to 8.7
tCO2e/capita by
2020
6.5 tCO2e/capita by
2030
N/A 7.7 to 8.1 tCO2e/capita by
2020
6.8 to 7.5 tCO2e/capita by
2030
1) International aviation is included as a component of the 2020 pledge and NDC, and as part of the projections
produced by EEA (2016) (projected at 152 and 174 MtCO2e/year in 2020 and 2030 respectively).
2) NewClimate Institute estimates are based on the Climate Action Tracker analysis, using projections from
the European Environment Agency (EEA 2016) (upper end) and the EU Reference Scenario 2016 (Capros
et al. 2016) (lower end). The absolute values presented here differ from the sources for two reasons: (i) the
projections were harmonised to historic data, (ii) the EEA data does not include a full implementation of the
Building Energy Efficiency Directive, which we thus quantified separately (see details of approach in
supplementary information).
Greenhouse gas mitigation scenarios for major emitting countries
NewClimate Institute | November 2017 40
Figure 10: Impact of climate policies on greenhouse gas emissions in the EU (left: excluding land use
(i.e. LULUCF), right: only land use). Source: NewClimate Institute calculations based on Climate Action
Tracker (CAT 2017) and PBL calculations excluding LULUCF, and IIASA calculations on LULUCF
emissions and removals.
Greenhouse gas mitigation scenarios for major emitting countries
NewClimate Institute | November 2017 41
India
India has pledged to reduce its emissions intensity per unit GDP by 33 to 35 % below 2005 by 2030 and
create an additional carbon sink of 2.5 to 3 GtCO2. The country further sets a new target to increase its
share of non-fossil-based power in total capacity from 30 % today to about 40 % by 2030 (with the help
of international support). The main mitigation-related policies implemented in India include the market-
based mechanism Perform Achieve and Trade (PAT) scheme for energy efficiency, Clean Energy Cess
(coal tax), renewable energy targets and a range of support schemes laid out under the 12 th Five Year
Plan.
We project that India is likely to overachieve its 2020 pledge roughly on track to achieve its NDC under
current policies, but it is not possible to make definitive conclusions because emission projections
depend heavily on future economic growth. In December 2016, India published the Draft Electricity Plan,
outlying plans for the development of the power sector. This draft plan projects a stabilisation of the coal
capacity at 250 GW in the next decade, while it expects renewable energy technologies to expand
substantially, to 275 GW by 2026/2027, reflecting a 57% share in total capacity (Central Electricity
Authority 2016), compared to the conditional target of the NDC. If implemented, these targets are
expected to have a substantial impact on emissions.
Table 34: Description of India’s 2020 pledge and NDC
Indicator 2020 pledge NDC (2 October 2016)
Target: unconditional • Reduce emissions per
unit of GDP by 20% to
25% below 2005 level by
2030 (excluding
agriculture emissions)
• Reduce emissions per unit of GDP by 33% to
35% below 2005 levels by 2030
Target: conditional • N/A • Non-fossil fuel energy to increase to about 40%
of total power capacity with the help of transfer
of technology and low cost international finance
including from Green Climate Fund (GCF);
• Additional forest carbon stock of 2.5 to 3
GtCO2e through additional forest and tree
cover by 2030
Sectoral coverage • Excluding agriculture • Not specified
General Accounting
method
• Not specified • Not specified
GHGs covered • Not specified • Not specified
Consideration of
LULUCF
• Not specified • Targets for the land use sector are included. An
additional carbon sink of 2.5 to 3 GtCO2 through
additional forest and tree cover by 2030.
However, it is unclear whether the land use
sector is included in the GHG intensity targets
• Accounting approaches and methodologies are
not specified
Use of bilateral,
regional and
international credits
• N/A • Yes. Expected amount not quantified.
Other sector-level
targets
• Not specified • (various existing policies and targets are
described)
Availability of
reference scenarios in
the latest UNFCCC
submissions
• N/A • N/A
Greenhouse gas mitigation scenarios for major emitting countries
NewClimate Institute | November 2017 42
Table 35: Overview of key climate change mitigation policies in India (planned policies in italics). Source:
(MNRE 2009, BEE 2015, Government of India 2015a, Government of India 2015b, Ministry of Consumer
Affairs Food and Public Distribution 2015)
Sector Policies (marked with
“(+)” when mentioned in
the NDC document)
Description
Economy-
wide
Clean energy cess (coal
tax) (2010)
• Implemented in 2010; currently a tax of INR 400/tonne
is imposed on coal, lignite and peat
Energy
supply
Renewable energy targets
and support schemes (12th
Five Year Plan (2012–
2017), National Solar and
Wind Missions (2010)) (+)
• Previous capacity targets for 2022 to be overachieved
(20GW solar, 38.5GW wind, 6.5 GW small hydro) 1)
• Budgetary support for solar power under the National
Solar Mission 2)
• Renewable Purchase Obligations scheme (2003)2)
• Renewable Energy Certificate (REC) mechanism
(2011) 2)
Government Assistance for
Small Hydropower Stations
(2003), National Solar and
Wind Missions (2010)
• 5 GW small hydropower, 10 GW biomass, 100 GW
solar power, 60 GW wind power capacity by 2022
12th Five Year Plan (2012–
2017): supercritical power
generation
• Base new thermal power plants mainly on supercritical
technology from 2017 onwards. Implemented as
power plant standard after 2016 for new coal-fired
power plants, resulting in 47% efficiency (820
gCO2/kWh)3)
Draft Electricity Plan (2016) 4)
• Capacity additions for various energy technologies
• Demand reductions
• Slow-down in installation of new coal fired power
plants
Transport Fuel economy standards • 1.3 MJ/pkm – 130 g CO2/km by 2017 and 0.9 MJ/pkm
– 113 g CO2/km by 2022, for light-duty vehicles
Electric vehicle target • 15% share in new sales by 2020 5)
Support for biofuels (2007) • 5% blending target for ethanol with petrol (no timeline
set)
Industry Energy efficiency in industry
(PAT scheme) (2011)
• The first phase was expected to save 6.6 Mtoe (4.8%
energy reduction in the industries covered,
representing around 60% of primary energy
consumption) and to reduce 26 MtCO2e over the
2012-2015 period
Forestry Green India Mission (2011) 3)
• Increase the forest/tree cover in moderately dense
forests: 5 million hectares
• Improve forest/tree cover on forest areas: 5 million
hectares
Agriculture National Mission on
Sustainable Agriculture
(2012) (+) 3)
• Enhancing food security and protection of resources
such as land, water, biodiversity and genetics
1) Based on: Planning Commission Government of India (2011). The assumptions for current policies projections
are described in detail in the Supporting Information. 2) Not quantified separately 3) Policy not quantified in IIASA LULUCF projections.
4) Considered in the planned policies scenario 5) Not considered in NewClimate Institute calculations
Greenhouse gas mitigation scenarios for major emitting countries
NewClimate Institute | November 2017 43
Table 36: Impact of climate policies on greenhouse gas emissions (including LULUCF) in India. Absolute
emission levels and emission levels relative to 2010 levels are presented. References for official
emission data are provided in Table 3.
2010 GHG
emissions, incl.
LULUCF
2020 pledge and NDC Current policies Planned policies
Official
data
PBL and
NewClimate
estimates
Official
data
PBL and
NewClimate
estimates
PBL and
NewClimate
estimates
Absolute: 1,848
MtCO2e
3,815
MtCO2e
3,360 to 4,305
MtCO2e, 82% to
133% by 2020
4,170 to 5,840
MtCO2e, 126% to
216% by 2030
N/A 2,700 to 3,275
MtCO2e, 46% to
77% by 2020
4,015 to 5,125
MtCO2e, 117% to
177% by 2030
2,570 to 3,180
MtCO2e, 39% to
72% by 2020
3,820 to 4,295
MtCO2e, 107% to
132% by 2030
Per capita: 1.5
tCO2e/capita
N/A 2.4 to 3.1
tCO2e/capita by
2020
2.8 to 3.9
tCO2e/capita by
2030
N/A 2.0 to 2.4
tCO2e/capita by
2020
2.7 to 3.4
tCO2e/capita by
2030
1.9 to 2.3
tCO2e/capita by
2020
2.5 to 2.8
tCO2e/capita by
2030
Figure 11: Impact of climate policies on greenhouse gas emissions in India (including land use (i.e.
LULUCF)). Source: NewClimate Institute calculations adapted from Climate Action Tracker (CAT 2017)
and PBL Calculations excluding LULUCF, and IIASA calculations on LULUCF emissions and removals.
For reporting reasons, the emission projections excluding LULUCF are not presented, as these are
similar to those including LULUCF.
Greenhouse gas mitigation scenarios for major emitting countries
NewClimate Institute | November 2017 44
Indonesia
Indonesia’s NDC target aims for a 29% emissions reduction by 2030 relative to a baseline scenario. Our
latest estimates indicate that GHG emissions from land use, land use change and forestry (LULUCF)
are expected to increase over time, driven to a large extent by continued expansion of large scale oil
palm plantations, and that other emissions might roughly double by 2030 compared to current levels.
As such, Indonesia would likely fall slightly short of meeting its unconditional NDC target under current
policies, with overall emission levels ranging from 2,060 to 2,140 MtCO2e/year in 2030.
Table 37: Description of Indonesia’s 2020 pledge and NDC.
Indicator 2020 pledge NDC (submitted 6 November 2016)
Target:
unconditional
• 26% GHG reduction
by 2020 from
baseline scenario
• 29% GHG reduction by 2030 from baseline
scenario
Target: conditional • N/A • 41% GHG reduction by 2030 from baseline
scenario
Sectoral coverage • Not Specified • Energy including transport, industrial
processes and product use, agriculture,
LULUCF, waste
General
Accounting
method
• Not Specified • IPCC guidelines; 100-year GWPs from the
Fourth Assessment Report
GHGs covered • Not Specified • All IPCC sectors CO2, CH4, N2O
Consideration of
LULUCF
• Land use sector is
included in the target
• Accounting
approaches and
methodologies are
not specified
• Land use sector is included in the target;
• Accounting approaches and methodologies
are not specified
Use of bilateral,
regional and
international
credits
• N/A • International market mechanisms will not be
used to meet the NDC, but Indonesia
“welcomes bilateral, regional and international
market mechanisms that facilitate and
expedite technology development and
transfer, payment for performance, technical
cooperation, and access to financial
resources to support Indonesia's climate
mitigation and adaptation efforts towards a
climate resilient future”.
Availability of
reference
scenarios in the
latest UNFCCC
submissions
• N/A • N/A
Greenhouse gas mitigation scenarios for major emitting countries
NewClimate Institute | November 2017 45
Table 38: Overview of key climate change mitigation policies in Indonesia. Sources: (ADB 2016, Kharina
et al. 2016, Republic of Indonesia 2016a, Republic of Indonesia 2016c)
Sector Policies (marked with “(+)”
when mentioned in the NDC
document)
Description
Energy
supply
Renewable energy targets (2014)
(+)
• 15%-23% share of renewable energy in primary
energy supply by 20251)
National Electricity Plan • 19% new and renewable energy (including
nuclear) by 20251) (planned: 25%)
Electricity Supply Business Plan • Added electricity capacity by 2019: 2 GW hydro,
0.7 GW geothermal, 0.2 GW solar/wind2)
Transport Biofuel targets (2013) • 15% share of biofuels in all transportation fuels by
2025 (25% biodiesel, 20% bioethanol)3)
Forestry Presidential Instruction number
6/2013 on Forest Moratorium 4)
• Restricting oil palm extension to peatland or to
primary forest as defined in the Ministry of
Forestry land cover map 1) Not included separately, but checked if achieved after implementation of other policies 2) NewClimate additionally includes the target of 25 GW of coal-fired power plants included in the plan. PBL
does not prescribe a target for coal, its scenario reaches 19.5 GW in 2019, 3.3 GW additional compared to
2015. 3) Implemented in PBL TIMER model as 22.5% total biofuel share (only 18% reached) 4) Unclear whether this policy is included in the NewClimate Institute current policies projection, as information
is not available in original data source.
Table 39: Impact of climate policies on greenhouse gas emissions (including LULUCF) in Indonesia.
Absolute emission levels and emission levels relative to 2010 levels are presented. References for
official emission data are provided in Table 3.
2010 GHG
emissions, incl.
LULUCF
2020 pledge and NDC 1) Current policies
Official data PBL and
NewClimate
estimates
Official
data
PBL and
NewClimate
estimates
Absolute:
1,120 MtCO2e 2)
2,050 MtCO2e by
2030 (1700 MtCO2
conditional) 2)
1,155 to 1,445
MtCO2e, 3% to 29%
by 2020
1,695 to 2,035
MtCO2e, 51% to 82%
by 2030
N/A 1,465 to 1,540
MtCO2e, 31% to 37%
by 2020
2,060 to 2,140
MtCO2e, 84% to 91%
by 2030
Per capita:
4.6 tCO2e/capita
N/A 4.2 to 5.3
tCO2e/capita by 2020
5.7 to 6.9
tCO2e/capita by 2030
N/A 5.4 to 5.7
tCO2e/capita by 2020
7.0 to 7.2
tCO2e/capita by 2030 1) Conditional NDC 2) The 2010 emissions are based on energy-related emissions (IEA, 2012), non-energy-related emissions
(EDGAR 4.2) (JRC/PBL 2014) and the 1st Biennial Update Report by Indonesia (Republic of Indonesia
2016b). It should be noted that 2010 estimates of peat oxidation and peat fires have been revised by Indonesia
several times. BAPPENAS (2015) presented estimates of 559 MtCO2e, which are much lower compared to
1442 MtCO2e estimated in the Second National communication (SNC) (see sheet 19 of BAPPENAS (2015)).
BAPPENAS (2015) has reduced the 2010 net AFOLU emissions estimates from 2,505 (SNC) to 1,460
MtCO2e, and the BAU 2020 projection from 2,949 to 1,804 MtCO2e. BAPPENAS (2015) has a BAU projection
of net AFOLU emissions in the range of 2,877 MtCO2e by 2030, which is also used in the NDC submission.
Greenhouse gas mitigation scenarios for major emitting countries
NewClimate Institute | November 2017 46
Figure 12: Impact of climate policies on greenhouse gas emissions in Indonesia. Left panel: Total
emissions including land use (i.e. LULUCF), middle panel: total emissions excluding land use, and right
panel: land use emissions and removals only. Source: NewClimate Institute calculations based on its
analysis for Climate Action Tracker (CAT 2017) and PBL calculations excluding LULUCF, and IIASA
calculations on LULUCF emissions and removals.
For comparison, the CAIT Indonesia tool (WRI 2016) gives a higher estimate of 1,805 MtCO2e for the
projected national 2020 emissions, based on the same historical emissions.
Greenhouse gas mitigation scenarios for major emitting countries
NewClimate Institute | November 2017 47
Japan
Japan proposes in its NDC to reduce GHG emissions by 26% by 2030 compared to 2013 levels,
equivalent to a 25.4 % reduction from 2005 levels and 3% increase from 2010 levels. The main GHG
mitigation policies currently implemented in Japan include the renewable feed-in tariff scheme, 2014
Basic Energy Plan, Top Runner Standards programme and the global warming tax.
The lower end of our 2030 projection range meets the NDC target. We conclude that Japan is roughly
on track to meet its NDC. Also for 2020, the current policies emissions projections indicate that Japan
would overachieve its current pledge (3.8% below 2005 levels by 2020) even with full nuclear phase-
out.
The large range of projections is caused by the uncertainty about the future role of nuclear energy, as it
is not yet fully clear to what extent this restarting will occur and which energy carriers will replace nuclear
electricity capacity.
Table 40: Description of Japan’s 2020 pledge and NDC
Indicator 2020 pledge NDC (submitted 3 November
2016)
Target: unconditional • 3.8% reduction by 2020 from
2005 level
• 26% GHG reduction by
2030 from 2013 level
Target: conditional • N/A • N/A
Sectoral coverage • Economy wide • Economy wide
General Accounting
method
• IPCC guidelines; 100-year
GWPs from the Fourth
Assessment Report
• IPCC guidelines; 100-year
GWPs from the Fourth
Assessment Report
GHGs covered • CO2, CH4, N2O, HFCs, PFCs,
SF6 and NF3
• CO2, CH4, N2O, HFCs,
PFCs, SF6 and NF3
Consideration of LULUCF • Land use sector is included in
the target
• Accounting approach is
specified as Kyoto Protocol
approach (gross-net
accounting)
• Land use sector is included
in the target
• Accounting approach is
specified as Kyoto Protocol
approach (gross-net
accounting)
• A reduction of net LULUCF
emissions is expected in the
range of 37 MtCO2e 1)
Other sector-level targets • N/A • N/A
Use of bilateral, regional
and international credits
• Yes. Expected amount not
specified.
• Yes. Cumulative 50-100
MtCO2e through the Joint
Crediting Mechanism (JCM).
Availability of reference
scenarios in the latest
UNFCCC submissions
• No • No
Other information • 2020 pledge assumes zero
nuclear power generation
following the Fukushima
nuclear disaster
• N/A
1) The estimate is provided in Japans NDC’s and the reduction of LULUCF emissions and removals corresponds
to 2.6% reduction of total emissions in 2013.
Greenhouse gas mitigation scenarios for major emitting countries
NewClimate Institute | November 2017 48
Table 41: Overview of key climate change mitigation policies in Japan. Source: (Government of Japan
2013, Kuramochi 2014, Government of Japan 2015, IEA 2015)
Sector Policies (marked with “(+)”
when mentioned in the NDC
document)
Description
Economy-
wide
Global warming countermeasures
tax (2012)
• An upstream tax of 289 JPY/tCO2 (around
2.3€) is imposed on fossil fuels on top of
existing petroleum and coal tax
Energy
supply
2014 Basic Energy Plan1) and the
long-term energy demand and
supply outlook (+)
• Renewable electricity (incl. large hydro): at
least 13.5% by 2020 and 22-24% by 2030
(supported by FIT scheme), nuclear
electricity: 20-22%.
Renewable Energy Act (feed-in
tariff) (2012)
• Electric utility operators required to purchase
all electricity generated at designated prices;
applicable to most renewable technologies
Buildings Energy Conservation Act (2007) • Energy reduction of 1%/year and annual
reports to the government by large
operators2)
• Energy efficiency standards for buildings and
houses larger than 300 m2
Transport Top Runner Programme: vehicle
efficiency standards (1999)
• 20.3 km/l by 2020
F-gases Act on Rational Use and Proper
Management of Fluorocarbons
(2013)
• Stricter control of the entire F-gas chain
(GWP targets for equipment types, obligation
of F-gas destruction for entities re-using
recovered F-gases) 1) Due to the large uncertainty regarding the feasibility of the 2014 Basic Energy Plan on 2030 electricity mix,
NewClimate Institute performed independent calculations on a possible 2030 electricity mix. 2) Policy not quantified in the IIASA LULUCF model projections
Table 42: Impact of climate policies on greenhouse gas emissions (excluding LULUCF, excluding
credits) in Japan. Absolute emission levels and emission levels relative to 2010 levels are presented.
Note that the official values for 2020 and 2030 are based on GWP values from the IPCC 4th Assessment
Report. References for official emission data are provided in Table 3.
2010 GHG
emissions, excl.
LULUCF
2020 pledge and NDC Current policies
Official data PBL and
NewClimate
estimates
Official
data
PBL and NewClimate
estimates
Absolute:
1,280 MtCO2e
1,399
MtCO2e by
2020,
1,079
MtCO2e by
2030
1,365 MtCO2e, 6%
by 2020
1,055 MtCO2e, -
17% by 2030
N/A 1,120 to 1,195 MtCO2e,
-13% to -7% by 2020
1,020 to 1,105 MtCO2e,
-20% to -13% by 2030
Per capita:
10 tCO2e/capita
N/A 10.8 tCO2e/capita
by 2020
8.7 tCO2e/capita by
2030
N/A 8.8 to 9.5 tCO2e/capita
by 2020
8.4 to 9.1 tCO2e/capita
by 2030
Greenhouse gas mitigation scenarios for major emitting countries
NewClimate Institute | November 2017 49
Figure 13: Impact of climate policies on greenhouse gas emissions in Japan (left: excluding land use
(i.e. LULUCF), right: only land use). 2020 and 2030 targets include LULUCF credits (in line with the
Kyoto accounting rules) as well as overseas credits. Source: NewClimate Institute calculations based
on its analysis for Climate Action Tracker (CAT 2017) and PBL calculations excluding LULUCF, and
IIASA calculations on LULUCF emissions and removals. Please see Appendix (A2) on the consideration
of LULUCF for the NDC quantification.
Greenhouse gas mitigation scenarios for major emitting countries
NewClimate Institute | November 2017 50
Kazakhstan
Kazakhstan pledged an unconditional NDC target to reduce GHG emissions by 15% below 1990 levels
by 2030, and a conditional target to reduce emissions by 25% below 1990 by 2030. The current policies
projection includes the Action Plan for the development of alternative and renewable energy in
Kazakhstan for 2013–2020. Kazakhstan’s GHG emissions are projected to be 400–415 MtCO2e/year
by 2030 (including LULUCF) under the current policies projection. Kazakhstan would, therefore, fail to
achieve its unconditional NDC target by 2030 (270–305 MtCO2e/year including LULUCF).
Table 43: Description of Kazakhstan’s 2020 pledge and NDC
Indicator 2020 pledge NDC (submitted 6 December 2016)
Target:
unconditional
• 15% reduction from
1990 levels 1)
• 7% reduction from
1990 base year
levels 1)
• 15% reduction in GHG emissions by 2030
compared to the 1990 base year
Target: conditional • N/A • 25% reduction in GHG emissions by 2030
compared to the 1990 base year, conditional
on international investments, the transfer of
low carbon technologies, green climate funds
and flexible mechanisms for transition
economy countries
Sectoral coverage • N/A • All sectors, incl. LULUCF
1) Kazakhstan’s Copenhagen pledge was to reduce emissions by 15% below 1992 levels incl. LULUCF by
2020, with the base year changed to 1990 later in 2012. For the 2nd commitment period of the Kyoto Protocol,
Kazakhstan submitted a target of 7% reduction below 1990 levels (Government of the Republic of Kazakhstan
2015, Ministry of Energy of the Republic of Kazakhstan 2015).
Greenhouse gas mitigation scenarios for major emitting countries
NewClimate Institute | November 2017 51
Table 44: Overview of key climate change mitigation policies in Kazakhstan. Source: (Braliyev 2007,
Republic of Kazakhstan 2009, Republic of Kazakhstan 2012, Decree of the President of the Republic of
Kazakhstan 2013, Ministry of Environment and water resources of the Republic of Kazakhstan 2013,
UNFCCC 2016)
Sector Policies (marked with “(+)” when
mentioned in the NDC document) 1)
Description
Economy-
wide
Concept for Kazakhstan’s Transition to
Green Economy: Energy efficiency targets
(2015) (+) 2)
• Reduction of energy intensity per
GDP of 25% by 2020, of 30% by
2030 and of 50% by 2050 compared
to 2008 levels
• Combined share of wind and solar in
total electricity production more than
3% in 2020 and 30% by 2030
Strategic Development Plan before 2020
(Decree No. 922) (2010) 3)
• Increase renewable energy share in
total energy consumption to 1.5% by
2015 and 3% by 2020
• Reduction of energy intensity by at
least 10% by 2015 and by at least
25% by 2025 as compared to 2008
Concept of Transition of the Republic of
Kazakhstan to Sustainable Development
for the Period 2007-2024 (Presidential
Decree No. 216 of 2006) 3)
• 5% of national energy consumption
provided by renewable sources by
2024
Energy
supply
Support scheme for renewable energy
(2014) 2)
• Feed-in-tariff for wind, solar, small
hydro and biogas plants
Action Plan for the development of
alternative and renewable energy in
Kazakhstan for 2013-2020 (2013)
• Plan to build around 106 renewable
energy installations with a total
installed capacity of 3054.55 MW
into operation by 2020
Buildings Program on modernization of housing and
communal services (2012)
• Reduction of emissions associated
with housing and communal services
by 10% by 2030
Forestry
Strategic Plan of the Ministry of
Environment and Water Resources (2011)
• Plan to reforest and afforest a total
of 5,000 hectares of land
Carbon sequestration activities 4) • An increase of the carbon sink
through appropriate management 1) Kazakhstan’s ETS (phase III: 2016-2020) is suspended until 2018 (ICAP 2016). None of the policies in this
overview were quantified in PBL’s TIMER model. 2) Policy not included. 3) Policy not included (only indirectly via renewable energy capacity deployment under the Action Plan for the
development of alternative and renewable energy in Kazakhstan for 2013-2020). 4) Policy not quantified in the IIASA LULUCF model projections.
Greenhouse gas mitigation scenarios for major emitting countries
NewClimate Institute | November 2017 52
Table 45: Impact of climate policies on greenhouse gas emissions (including LULUCF) in Kazakhstan.
Absolute emission levels and emission levels relative to 2010 levels are presented. References for
official emission data are provided in Table 3.
2010 GHG
emissions, incl.
LULUCF
2020 pledge and NDC Current policies
Official
data
PBL and NewClimate
estimates
Official
data
PBL and NewClimate
estimates
Absolute: 302 MtCO2e N/A 305 to 330 MtCO2e,
0% to 10% by 2020
270 to 305 MtCO2e, -
11% to 0% by 2030
N/A 335 to 345 MtCO2e,
11% to 14% by 2020
400 to 415 MtCO2e,
33% to 37% by 2030
Per capita:
18.4 tCO2e/capita
N/A 16.1 to 17.7
tCO2e/capita by 2020
13.2 to 14.9
tCO2e/capita by 2030
N/A 17.9 to 18.3
tCO2e/capita by 2020
19.7 to 20.4
tCO2e/capita by 2030
Figure 14: Impact of climate policies on greenhouse gas emissions in Kazakhstan (left panel: all gases,
including land use (i.e. LULUCF), right panel: only land use emissions). Source: NewClimate Institute
calculations based on its analysis for Climate Action Tracker (CAT 2017) and PBL calculations excluding
LULUCF, and IIASA calculations on LULUCF emissions and removals.
Greenhouse gas mitigation scenarios for major emitting countries
NewClimate Institute | November 2017 53
Mexico
Mexico aims, in its NDC, to reduce its GHG emissions by 22% (unconditional), and by 36% (conditional)
from BAU by 2030. An assessment of the new Energy Transition Law (24/12/2015) that provides a
framework for clean energy, energy efficiency and GHG emissions reductions, reveals that this target is
less ambitious compared to what was proposed by previous renewable energy laws and the Secretariat
of Energy (SENER) projections.
Under its current policies, Mexico is roughly on track to meet its unconditional NDC target, but to meet
their conditional NDC target additional mitigation actions are needed. Our evaluation changed from our
2016 report mainly because of the historical emissions data update and an updated and lower baseline
projections.
In its NDC, Mexico also includes the target to reduce black carbon by 51% unconditionally and 70%
conditionally below BAU of 124 MtCO2e in 2030. While the reduction of black carbon has important
health benefits, its impact on temperature levels is highly uncertain (Bond et al. 2013).
Table 46: Description of Mexico’s 2020 pledge and NDC
Indicator 2020 pledge NDC (21 September 2016)
Target: unconditional • N/A • 22% GHG reduction by 2030 from
baseline scenario
Target: conditional • 30% GHG reduction
by 2030 from
baseline scenario
• 36% GHG reduction by 2030 from
baseline scenario
Sectoral coverage • Economy-wide • Economy-wide
General Accounting
method
• Not-specified • IPCC guidelines; 100-year GWPs from the
General Accounting method • 1996 IPCC Guidelines; GWP values of Fourth IPCC
Assessment Report
GHGs covered • CO2, CH4, N2O
Consideration of LULUCF • Land use sector is included in target
• Morocco’s Green Plan (PMV) and Preservation and
Sustainable Forest Management Strategy are part of NDC
as key sectoral strategies
• Accounting approaches and methodologies are not
specified
Other sector-level targets • NDC outlines key sectoral policy strategies and respective
sectoral emission targets
Use of bilateral, regional and
international credits
• Yes. Expected amount not quantified.
Availability of reference
scenarios in the latest UNFCCC
submissions
• Yes. BAU scenario until 2030 (Kingdom of Morocco 2015))
Greenhouse gas mitigation scenarios for major emitting countries
NewClimate Institute | November 2017 57
Table 50: Overview of key climate change mitigation policies in Morocco. Source: (Kingdom of Morocco
Ministry of Equipment and Transport 2010, Kingdom of Morocco - Ministry Delegate of the Minister of
Energy Mines Water and Environment 2013, Kingdom of Morocco - Ministry Delegate of the Minister of
Energy Mines Water and Environment 2014, Kingdom of Morocco 2016b, Kingdom of Morocco 2016a,
Schinke and Klawitter 2016))
Sector Policies (marked with “(+)”
when mentioned in the NDC
document)
Description
Economy-
wide
Moroccan Climate Change
Policy (MCCP) (2014)
• Overarching coordination and alignment of
various sectoral and cross-sectoral national
policies tackling climate change
Energy
supply
National Energy Strategy (2009,
updated 2012) (+)
• Morocco Integrated Wind
Energy Program (2010)
• Morocco Solar Plan (2009) 1)
• Morocco Hydro-Electric Plan
(continuation of plan started
in 1970s) 1)
• Aim for an installed renewable electricity
capacity of 42% by 2020 and 52% by 2030
• Energy savings of 12-15% in 2020 and 20%
in 2030
• Supply 10-12% of the country's primary
energy demand with renewable energy
sources by 2020 and 15-20% by 2030
Transport Extension of Rabat and
Casablanca tramways (2016)
• Extension of Rabat tramway by 20 km by
2019
• Extension of Casablanca tramway by 45 km
by 2025
Industry Energy efficiency program in the
industry sector (2011)
• Energy efficiency program for industry,
buildings and transport sector (excluding
large energy consuming industries)
Buildings Energy efficiency program in the
building sector (2009)
• Minimum requirements for new residential
and commercial buildings
Energy efficiency program for
public lighting (2009)
• Instalment of new public lightening
technologies
F-gases N/A • N/A
Forestry
Preservation and Sustainable
Forest Management Strategy (+)
• Afforestation and regeneration of
approximately 50,000 hectares of forest per
year
Morocco Green Plan (PMV)
(2008) (+)
• Promotion of natural resources and
sustainable management 2)
• Modernization of the agricultural sector 2) 1) See Supporting Information for the implementation status 2) Policy not quantified in the IIASA model projections
Greenhouse gas mitigation scenarios for major emitting countries
NewClimate Institute | November 2017 58
Table 51: Impact of climate policies on greenhouse gas emissions (including LULUCF) in Morocco.
Absolute emission levels and emission levels relative to 2010 levels are presented. References for
official emission data are provided in Table 3.
2010 GHG emissions,
incl. LULUCF
2020 pledge and NDC Current policies
Official data NewClimate
estimates
Official
data
NewClimate
estimates
Absolute:
105 MtCO2e
99 to 141
MtCO2e by
2030
100 to 140 MtCO2e,
-6% to 35% by 2030
N/A 120 MtCO2e,
15% by 2020
165 MtCO2e,
57% by 2030
Per capita:
3.2 tCO2e/capita
N/A 2.4 to 3.5
tCO2e/capita by
2030
N/A 3.3 tCO2e/capita
by 2020
4.0 tCO2e/capita
by 2030
Figure 16: Impact of climate policies on greenhouse gas emissions in Morocco (CO2, CH4 and N2O;
including land use (i.e. LULUCF)). Source: NewClimate Institute calculations excluding LULUCF based
on its analysis for Climate Action Tracker and IIASA calculations on LULUCF emissions and removals.
Greenhouse gas mitigation scenarios for major emitting countries
NewClimate Institute | November 2017 59
Philippines
The Philippines’ INDC includes a conditional GHG reduction target of 70% below BAU levels by 2030.
Calculations for 2030 emissions levels under the INDC show 38% below 2010 levels (excl. LULUCF).
The INDC emissions level excluding LULUCF is estimated to be about 95 MtCO2e in 2030. Under
current policies, the Philippines’ emissions level is projected to reach 220 MtCO2e in 2020 and 320
MtCO2e in 2030, excluding LULUCF.
Although there is uncertainty related to LULUCF emissions and the lack of data on the BAU scenario
mentioned in the country’s INDC, our projections suggest that the Philippines is not on track to meet its
conditional INDC target.
Table 52: Description of The Philippines’ 2020 pledge and INDC
Indicator INDC (submitted 1 October 2015)
Target: unconditional • N/A
Target: conditional • 70% GHG reduction by 2030 relative to its BAU scenario
2000-2030. Conditioned to financial resources, technology
development & transfer, and capacity building
Sectoral coverage • Energy, transport, waste, forestry and industry
General Accounting method • IPCC guidelines; 100-year GWPs from the Fourth IPCC
Assessment Report
GHGs covered • Not specified
Consideration of LULUCF • The forest sector is included in the target. Forests are
expected to contribute to the GHG emission reduction target
• Accounting approaches and methodologies are not specified
Use of bilateral, regional and
international credits
• N/A
Availability of reference
scenarios in the latest
UNFCCC submissions
• N/A
Note: The Philippines has not set its 2020 pledge.
Greenhouse gas mitigation scenarios for major emitting countries
NewClimate Institute | November 2017 60
Table 53: Overview of key climate change mitigation policies in the Philippines. Source: (Philippine
Institute for Development Studies 2014, Department of Energy 2015b, Department of Energy 2015a,
The London School of Economics and Political Science 2015, Asia-Pacific Economic Cooperation 2016)
Sector Policies (marked with “(+)”
when mentioned in the
INDC document)
Description
Economy-
wide
Energy Efficiency and
Conservation Roadmap
(EE&C) (2014)
Energy Efficiency and
Conservation Action Plan
(2016)
• 20.2% energy saving by 2030 compared to BAU,
from 2005 levels
• 3% per year economy-wide improvement in
energy intensity compared to BAU
• 21 MtCO2 reduction by 2030, compared to BAU
• Savings of c.a. 10,665 ktoe (1/3 of current
demand) by 2030
Energy
supply
Sitio Electrification Program
(SEP) of the National
Electrification Administration
(2012)
• Aims to energize sitios1) through on-grid
electrification
• 2015 target: 100% sitios energized; covering at
least 648,820 households 2)
Household Electrification
Program (HEP) of the DOE
(2012)
• Targets to provide electricity at least 2,000
households every year using renewable energy
technologies; 90% households electrified by 2017
National Renewable Energy
Program (NREP) (2012)
• Increase renewable energy capacity of the
country to an estimated 15,304 MW by 2030
(almost triple its 2010 level)
• The aimed installed capacity by 2030 is broken
down as follows: 3,461 MW from geothermal;
8,724 from small hydropower (<50 MW); 316 from
biomass; 2,378 from wind; 285 from solar; 71 from
ocean.
Transport EE&C Roadmap (2014) and
Action Plan (2016)
• 14.3% energy savings in transport sector
compared to BAU by 2020
• 25% energy savings compared to BAU by 2030
Industry EE&C Roadmap (2014) and
Action Plan (2016)
• 8.7% energy savings in industrial sector by 2020
compared to BAU, 15% energy savings by 2030
Buildings EE&C Roadmap (2014) and
Action Plan (2016)
• Appliance Standards and
Labelling Program
• Government Buildings
Efficiency Program
• 10% energy savings in commercial buildings by
2020 and 25% by 2030, compared to BAU by
2030
• 6.6% energy savings in residential buildings by
2020 and 20% by 2030, compared to BAU by
2030
F-gases N/A • N/A
Forestry
National Greening Program
(2011)
• Plant 1.5 billion trees by 2016 covering 1.5 million
hectares
The Philippine National
REDD+ Strategy (2010) (+)
• Continued reduction deforestation and forest
degradation 3) 1) A “sitio” is defined as territorial enclave within a barangay (smallest administrative division in the Philippine,
equivalent to town or district) which may be distant from the barangay centre. 2) A sitio is considered energized if it is successfully connected to the grid and at least 20 households are given
electricity connections. 3) Policy not quantified in the IIASA LULUCF model projections.
Greenhouse gas mitigation scenarios for major emitting countries
NewClimate Institute | November 2017 61
Table 54: Impact of climate policies on greenhouse gas emissions (excluding LULUCF) in The
Philippines. Absolute emission levels and emission levels relative to 2010 levels are presented.
References for official emission data are provided in Table 3.
2010 GHG emissions,
excl. LULUCF
2020 pledge and INDC Current policies
Official
data
NewClimate
estimates
Official
data
NewClimate
estimates
Absolute:
158 MtCO2e
N/A 85 MtCO2e, -46%
by 2030
N/A 220 MtCO2e, 40% by
2020
320 MtCO2e, 104%
by 2030
Per capita:
1.7 tCO2e/capita
N/A 0.7 tCO2e/capita by
2030
N/A 2.0 tCO2e/capita by
2020
2.6 tCO2e/capita by
2030
Figure 17: Impact of climate policies on greenhouse gas emissions in the Philippines (left: excluding
land use (i.e. LULUCF), right: only land use). Source: NewClimate Institute calculations excluding
LULUCF based on its analysis for Climate Action Tracker (CAT 2017) and IIASA calculations on
LULUCF emissions and removals.
Greenhouse gas mitigation scenarios for major emitting countries
NewClimate Institute | November 2017 62
Republic of Korea
The Republic of Korea’s NDC aims to reduce GHG emissions by 37% below BAU levels by 2030. The
government also pledged internationally to reduce its GHG emissions by 30% below BAU levels by
2020, but this target has been abandoned domestically through the amended Green Growth Act.
Current policies considered here are renewable energy targets for 2020 and 2030 and the national
emissions trading system (ETS). According to our assessment, the ETS and the renewable energy
targets could result in stabilisation of Republic of Korea’s emission levels (excluding LULUCF) at 685 to
730 MtCO2e by 2020 and 730 to 775 MtCO2e by 2030. This is a deviation from the historical trend of
strongly increasing emissions, and is an important step towards achieving the pledge. However, it is not
expected to be sufficient to achieve the pledged emissions levels by 2020 and 2030.
Table 55: Description of the Republic of Korea’s 2020 pledge and NDC
Indicator 2020 pledge NDC (submitted 3 November 2016)
1) In the amended Green Growth Act (Presidential Decree no.27180, 24 May 2016), the 2020 pledge was
abandoned domestically and was replaced by the 2030 NDC target, but to date there is no report that the
Republic of Korea abandoned its 2020 pledge made under the UNFCCC.
Greenhouse gas mitigation scenarios for major emitting countries
NewClimate Institute | November 2017 63
Table 56: Overview of key climate change mitigation policies in the Republic of Korea. Source: (Republic
of Korea 2012, Hwang 2014, Republic of Korea 2014, Ministry of Trade 2015)
Sector Policies (marked with “(+)” when
mentioned in the NDC document)
Description
Economy-
wide
Emissions Trading System (2015) • Emission cap is in line with the 30%
reduction below baseline
Energy
supply
Renewable energy targets (4th
Basic Plan on New and Renewable
Energies, 7th Basic Plan for Long-
term Electricity Supply and
Demand) (2014)
• 11% share of new and renewable energy
(NRE) in TPES by 2035 (5% by 2020, 9.7%
by 2030);
• 13.4% of total electricity supplied by NRE
by 2035 (4th Basic Plan on NRE), 11.7%
by 2029 (7th Basic Plan for Long-term
Electricity Supply and Demand);
1.8 GW hydropower, 0.8 GW onshore
wind, 1 GW offshore wind, 16.6 GW solar
power, 0.2 GW biomass, and 0.2 GW
waste capacity by 2029
Renewable portfolio standards
(2012)
• 10% supply of NRE in total electricity
generation by 20241)
Buildings Renewable energy targets (4th
Basic Plan on New and Renewable
Energies, 7th Basic Plan for Long-
term Electricity Supply and
Demand) (2014)
• Budgetary support for one million green
homes (which covers various renewable
energy resources such as solar PV, solar
thermal, geothermal, small wind and
bioenergy) by 2020 2) 3)
Transport Fuel efficiency standard (2005) (+) • 140 gCO2/km (16.7 km/l) by 2015, 97 g
CO2/km (24.1 km/l) by 2020 3)
Renewable Fuel Standard (2013) • Biodiesel share in diesel of 3% from 2018
onwards
Forestry
Act on the Sustainable use of
Timber (2012)
• The forest harvest level will increase by 2.3
million m3 by 2020, compared to the 2014
level
Act on the Management and
Improvement of Carbon Sink (2013)
• Increase the forest carbon stocks by 200
million t-CO2 by 2019, compared to the
2014 level 1) Not included separately 2) Quantified in the PBL TIMER model as a tax on the residential sector, resulting in 19% emission reduction by
2030, in the residential sector and relative to the PBL baseline 3) Not included by NewClimate Institute
Greenhouse gas mitigation scenarios for major emitting countries
NewClimate Institute | November 2017 64
Table 57: Impact of climate policies on greenhouse gas emissions (excluding LULUCF) in Republic of
Korea. Absolute emission levels and emission levels relative to 2010 levels are presented. References
for official emission data are provided in Table 3.
2010 GHG emissions,
excl. LULUCF
2020 pledge and NDC Current policies
Official
data
PBL and
NewClimate
estimates
Official
data
PBL and NewClimate
estimates
Absolute:
657 MtCO2e
N/A 545 MtCO2e,
-17% by 2020
535 MtCO2e,
-18% by 2030
N/A
685 to 730 MtCO2e,
4% to 11% by 2020
730 to 775 MtCO2e,
11% to 18% by 2030
Per capita: 13.3
tCO2e/capita
N/A 10.5 tCO2e/capita by
2020
10.2 tCO2e/capita by
2030
N/A
13.3 to 14.2
tCO2e/capita by 2020
13.8 to 14.7
tCO2e/capita by 2030
Figure 18: Impact of climate policies on greenhouse gas emissions in Republic of Korea (left panel:
excluding land use (i.e. LULUCF), right panel: land use emissions and removals only). Source:
NewClimate Institute calculations based on Climate Action Tracker (CAT 2017) and PBL calculations
excluding LULUCF, and IIASA calculations on LULUCF emissions and removals.
Greenhouse gas mitigation scenarios for major emitting countries
NewClimate Institute | November 2017 65
Russian Federation
Russia’s INDC aims to limit GHG emissions to 70–75% of 1990 levels by 2030. The current policies
analysed here include the Russian State Programme’s targets for energy efficiency and renewable
electricity generation. Russia’s gas flaring policy could lead to additional emission reductions, but it is
unclear whether this policy will be fully implemented. The current policies are projected to lead to an
emission level of 2,550 to 2,575 MtCO2e/year by 2020 (3% to 4% above 2010 levels) and 2,650 to 2,790
MtCO2e/year by 2030 (7% to 13% above 2010 levels), excluding LULUCF. Russia is, therefore, likely to
reach its 2020 pledge, and reach the lower end of its 2030 INDC range (2,530 to 3,400 MtCO2e/year).
Table 58: Description of The Russian Federation’s 2020 pledge and INDC
Indicator 2020 pledge INDC (submitted 1 April
2015)
Target: unconditional • 15-25% GHG reduction by 2030
from 1990 level
• Limiting anthropogenic
greenhouse gases in Russia
to 70-75% of 1990 levels by
2030
Target: conditional • N/A • N/A
Sectoral coverage • Economy wide • Economy wide
General Accounting
method
• IPCC guidelines; 100-year
GWPs from the Fourth
Assessment Report
• IPCC guidelines; 100-year
GWPs from the Fourth
Assessment Report
GHGs covered • CO2, CH4, N2O, HFCs, PFCs and
SF6
• CO2, CH4, N2O, HFCs,
PFCs and SF6
Consideration of
LULUCF
• Acknowledges the need for an
appropriate accounting for the
potential of its LULUCF sector in
meeting its target
• Land use sector is included
in the target
• Accounting approaches and
methodologies are unclear 1)
Use of bilateral, regional
and international credits
• N/A • No use of international
market mechanisms
Availability of reference
scenarios in the latest
UNFCCC submissions
• Not assessed • Not assessed
1) Russian Federation’s INDC states that target is "subject to the maximum possible account of absorbing
capacity of forests". We assume that Russia applies a gross-net accounting approach (see Appendix A2 for
details). The current policy projection for the LULUCF sector would provide Russia with 690 MtCO2e land-use
credits in 2030 (the difference between the historic 1990 LULUCF emissions/removals and the projected 2030
LULUCF levels). The NDC range presented is a combination of a minimum amount of land-use (0 MtCO2e)
and maximum (690 MtCO2e) amount of land-use credits for the unconditional targets.
Greenhouse gas mitigation scenarios for major emitting countries
NewClimate Institute | November 2017 66
Table 59: Overview of key climate change mitigation policies in the Russian Federation. Source:
(Nachmany et al. 2015)
Sector Policies (marked with
“(+)” when mentioned
in the INDC document)
Description
Economy-
wide
Energy intensity targets
(2008)
• 40% reduction of energy intensity of GDP by 2020,
relative to 2007 1)
Energy
supply
Renewable energy
targets (2013)
• 2.5% renewable energy in the power sector by 2020
(excluding hydro larger than 25 MW) (supported by
regulated capacity prices for renewable energy,
Government of the Russian Federation 2013)
• 3.6 GW wind, 1.52 GW solar and 75 MW small
hydropower2) capacity by 2020
Industry Decrease flaring in oil
(2009)
• 5% limit on associated gas flaring for 2012 and
subsequent years 3)
Forestry National Strategy of
Forestry Development by
2020 (2008)
• Increase in forest intensification and harvest of wood
by 5.8% per year compared to 2007
1) Checked after implementation of other policies (please refer to the Supplementary Information) 2) Small hydropower is not distinguished from hydropower in the TIMER model, so this target was excluded from
PBL’s projection. 3) Not quantified in PBL TIMER model (but the target is met)
Table 60: Impact of climate policies on greenhouse gas emissions (excluding LULUCF) in the Russian
Federation. Absolute emission levels and emission levels relative to 2010 levels are presented.
References for official emission data are provided in Table 3.
2010 GHG
emissions, excl.
LULUCF
2020 pledge and INDC Current policies
Official
data
PBL and NewClimate
estimates
Official
data
PBL and NewClimate
estimates
Absolute:
2,470 MtCO2e
N/A 2,710 to 3,755
MtCO2e, 10% to 52%
by 2020
2,530 to 3,400
MtCO2e, 2% to 38% by
2030
2,590
MtCO2e by
2030
2,550 to 2,575
MtCO2e, 3% to 4% by
2020
2,650 to 2,790
MtCO2e, 7% to 13%
by 2030
Per capita:
17.3 tCO2e/capita
N/A 18.9 to 26.1
tCO2e/capita by 2020
18.0 to 24.2
tCO2e/capita by 2030
N/A 17.8 to 17.9
tCO2e/capita by 2020
18.8 to 19.9
tCO2e/capita by 2030
Greenhouse gas mitigation scenarios for major emitting countries
NewClimate Institute | November 2017 67
Figure 19: Impact of climate policies on greenhouse gas emissions in the Russian Federation (left panel:
excluding land use (i.e. LULUCF), right panel: land use emissions only). Source: NewClimate Institute
calculations based on Climate Action Tracker (CAT 2017) and PBL calculations excluding LULUCF, and
IIASA calculations on LULUCF emissions and removals. Please see Appendix (A2) on the consideration
of LULUCF for the NDC quantification.
Greenhouse gas mitigation scenarios for major emitting countries
NewClimate Institute | November 2017 68
Saudi Arabia
In its NDC submitted on 3rd of November 2016, Saudi Arabia pledged to reduce up to 130 MtCO2e by
2030 through actions that contribute to economic diversification and adaptation. The Saudi government
has not yet defined a baseline scenario. In 2013, the government announced its plan to build 54GW of
renewable power and 17GW of nuclear power by 2032 to cover 40-45% of future electricity production.
In 2015, the government announced an eight-year delay of its implementation.
In 2016, the government further downscaled the target to only 9.5 GW of renewable electricity capacity
until 2023 without specifying any additional capacity extension targets for the time after 2023. This
downward revision of the renewable electricity target leads to an additional 75-135 MtCO2e/year in 2030.
We conclude that Saudi Arabia is not on track to meet its NDC target.
Table 61: Description of Saudi Arabia’s NDC
Indicator NDC (submitted 3 November 2016)
Target: unconditional • Emissions reduction of up to 130 MtCO2e annually in 2030
Target: conditional • N/A
Sectoral coverage • Mostly energy focused
General Accounting
method
• Not specified
GHGs covered • Not specified
Consideration of
LULUCF
• Land use sector is not covered by NDC ‘s emission reduction target
Use of bilateral,
regional and
international credits
• Not specified
Other sector-level
targets
• Not specified
Availability of
reference scenarios in
the latest UNFCCC
submissions
• No
Other information • Achievement of this goal is not conditional on international financial
support, but is contingent on the continuation of economic growth,
and “a robust contribution from oil export revenues to the national
economy.” Additionally, it is stated that technology cooperation and
capacity building for NDC implementation will play a key role in the
process.
• Baseline not yet defined: “dynamic baseline will be developed on a
basis of a combination of two scenarios, which are scenarios based
on whether more oil is locally consumed, or exported.1)
Note: Saudi Arabia has no mitigation pledge for 2020.
Greenhouse gas mitigation scenarios for major emitting countries
NewClimate Institute | November 2017 69
Table 62: Overview of key climate change mitigation policies in Saudi Arabia. Source: (Al-Ghabban
2013, KSA 2015, Borgmann 2016, Kingdom of Saudi Arabia 2016) .
Sector Policies (marked with
“(+)” when mentioned
in the NDC document)
Description
Economy-
wide
King Abdullah City for
Atomic and Renewable
Energy (K.A.CARE) (+)
(2010)
Aims to develop a substantial alternative energy
capacity. Initially aiming to deploy 54GW of renewable
electricity by 2032, the target has been revised
downward to 9.5 GW by 2023.
Energy National Renewable
Energy Plan (NREP)
Increased share of renewable energy in the total energy
mix, targeting the generation of 3.45 GW of renewable
energy by 2020 under the National Transformation
Program and 9.5 GW by 2023 towards Vision 2030
Transport Corporate Average Fuel
Economy Standards
(CAFE) Saudi Arabia
(2013)
Fuel efficiency targets for new vehicles as of 2020:
13.9 to 18.5 km/l for passenger vehicles, 10.7 to 15.4
km/l for light trucks.
Buildings Energy efficiency labels
for appliances (2008)
Energy efficiency labels for a range of household
appliances
Insulation standards for
new buildings (2007)
Insulation standards for some insulation products used in
residential buildings
Table 63: Impact of climate policies on greenhouse gas emissions (excluding LULUCF) in Saudi Arabia.
Absolute emission levels and emission levels relative to 2010 levels are presented. References for
official emission data are provided in Table 3.
2010 GHG
emissions, excl.
LULUCF
2020 pledge and NDC Current policies
Official
data
NewClimate estimates 1)
Official
data
NewClimate estimates 1)
Absolute: 525
MtCO2e
N/A 855 to 1,055 MtCO2e,
63% to 101% by 2030
N/A 795 to 810 MtCO2e, 51%
to 55% by 2020
1,135 to 1,200 MtCO2e,
116% to 128% by 2030
Per capita: 19.2
tCO2e/capita
N/A 21.7 to 26.7
tCO2e/capita by 2030
N/A 22.9 to 23.4
tCO2e/capita by 2020
28.8 to 30.3
tCO2e/capita by 2030 1) Only the results from NewClimate Institute are presented.
Greenhouse gas mitigation scenarios for major emitting countries
NewClimate Institute | November 2017 70
Figure 20: Impact of climate policies on greenhouse gas emissions (excluding land use (i.e. LULUCF))
in Saudi Arabia. Source: NewClimate Institute calculations excluding LULUCF adapted from Climate
Action Tracker (CAT 2017) and IIASA calculations on LULUCF emissions and removals.
Greenhouse gas mitigation scenarios for major emitting countries
NewClimate Institute | November 2017 71
South Africa
South Africa’s NDC submission consists of a peak, plateau and decline (PPD) greenhouse gas
emissions trajectory range, with a range of 398–614 MtCO2e by 2025 and 2030, a peak between 2020
and 2025, a plateau for the following decade, and absolute declines thereafter. The current policies
projection includes the Integrated Resource Plan for electricity, the most important policy affecting South
Africa’s GHG emissions. Under current policies, South Africa’s GHG emissions are projected to be 645–
745 MtCO2e by 2030 (including LULUCF), thus higher than the upper range of the PPD trajectory.
Table 64: Description of South Africa’s 2020 pledge and NDC
Indicator 2020 pledge NDC (submitted 1 November 2016)
Target:
unconditional
• N/A • 398–614 MtCO2e by 2025 and 2030
(Peak, Plateau and Decline trajectory)
Target: conditional • 34% reduction below
BAU by 2020
• “South Africa’s INDC is premised on the
adoption of a comprehensive, ambitious,
fair, effective and binding multilateral
rules-based agreement under the
UNFCCC at the 21st Conference of the
Parties (COP21) in Paris”
Sectoral coverage • N/A • Economy-wide, all sectors
• IPCC: energy, IPPU, waste and AFOLU
General Accounting
method
• N/A • IPCC 2006 guidelines; 100-year GWPs
from the Fourth Assessment Report
GHGs covered • N/A • Six GHGs, material focus on CO2, CH4,
N2O
Consideration of
LULUCF
• Not specified • Land use sector is included in the target
• Accounting approaches and
methodologies are not specified
Other sector-level
targets
• N/A • N/A
Use of bilateral,
regional and
international credits
• N/A • N/A
Availability of
reference scenarios
in the latest
UNFCCC
submissions
• Yes: “With Existing
Measures (WEM)”
scenario developed for
South Africa’s
Greenhouse Gas
Mitigation Potential
Analysis Report
(Department of
Environmental Affairs
2014)
• Yes: “With Existing Measures (WEM)”
scenario developed for South Africa’s
Greenhouse Gas Mitigation Potential
Analysis Report (Department of
Environmental Affairs 2014)
Greenhouse gas mitigation scenarios for major emitting countries
NewClimate Institute | November 2017 72
Table 65: Overview of key climate change mitigation policies in South Africa. Source: (Department of
Minerals and Energy 2007, Department of Energy South Africa 2011, Government of South Africa 2012,
National Planning Commission 2012, Department of Energy South Africa 2013, Department of
Environmental Affairs 2014, Republic of South Africa 2015)
Sector Policies (marked with “(+)”
when mentioned in the NDC
document)
Description
Economy-
wide
National Development Plan
(2012) (+)
• Among other targets: eliminate poverty, reduce
inequality, increase access to water and
electricity 1)
National Climate Change
Response Policy (2011) (+)
• Objectives: effectively manage climate change
impacts and make a fair contribution to the global
effort to stabilise GHG concentrations 1)
Energy
supply
Integrated Resource Plan for
electricity (supported by
REIPP, Renewable Energy
Independent Power Producer
Programme) (2011) (+)
• Additional renewable electricity generation
capacity to be built between 2010 and 2030 in
the policy-adjusted plan2): 8.4 GW solar PV, 8.4
GW wind (plus 800 MW already committed), 1
GW CSP; resulting total capacity3) 8.4 GW solar
PV, 9.2 GW wind, 1 GW CSP
Transport Mandatory blending of
biofuels under the Petroleum
Products Act (Biofuels
Industrial Strategy) (2007)
• Concentration for blending: 2%-10% for bio-
ethanol and minimum 5% for biodiesel from 2015
onwards4)
Buildings National Building Regulation
(2011)
• Building codes and standards5)
Forestry
Long term mitigation
scenarios
• Establishment of 760,000 hectares of commercial
forest by 2030
National Forest Act (1998) • Securing ecologically sustainable development
and use of natural resources while promoting
justifiable economic and social development 6)
• Facilitate improved timber availability and secure
supply of timber to ensure sustainability of entire
timber value chain 6)
Strategic Plan for the
Development of Agriculture,
Forestry and Fisheries (2013)
• Promote conservation of forest biological
diversity, ecosystems and habitats, while
promoting the fair and equitable distribution of
their economic, social, health and environmental
benefits 6) 1) Not included in current policies scenario 2) Based on Table 1 in the IRP update report of 2013 (Department of Energy South Africa 2013). The decision
to install nuclear capacity might be delayed. As the status was uncertain at the time of developing the
projections, the target was excluded from the current policies scenario (see Supporting Information for more
details) 3) Based on Table 4 in the promulgated IRP (Department of Energy South Africa 2011) 4) Implemented in PBL TIMER model as 5% total biofuel share from 2015 onwards 5) Not included by PBL 6) Policy not quantified in the IIASA LULUCF model projections.
Greenhouse gas mitigation scenarios for major emitting countries
NewClimate Institute | November 2017 73
Table 66: Impact of climate policies on greenhouse gas emissions (including LULUCF) in South Africa.
Absolute emission levels and emission levels relative to 2010 levels are presented. References for
official emission data are provided in Table 3.
2010 GHG
emissions, incl.
LULUCF
2020 pledge and NDC Current policies
Official data PBL and
NewClimate
estimates
Official
data
PBL and
NewClimate
estimates
Absolute:
518 MtCO2e
398 to 614
MtCO2e by
2025-2030
400 to 585 MtCO2e, -
23% to 12% by 2020
400 to 615 MtCO2e, -
23% to 18% by 2030
N/A 580 to 640 MtCO2e,
12% to 23% by 2020
645 to 745 MtCO2e,
24% to 43% by 2030
Per capita:
10.0 tCO2e/capita
N/A 6.8 to 9.9
tCO2e/capita by 2020
6.2 to 9.5
tCO2e/capita by 2030
N/A 9.9 to 10.9
tCO2e/capita by 2020
10.0 to 11.5
tCO2e/capita by 2030
Figure 21: Impact of climate policies on greenhouse gas emissions in South Africa (left panel: all gases
and sectors, right panel: land use (i.e. LULUCF) emissions and removals only). Source: NewClimate
Institute calculations based on Climate Action Tracker (CAT 2017) and PBL calculations excluding
LULUCF, and IIASA calculations on LULUCF emissions and removals.
Greenhouse gas mitigation scenarios for major emitting countries
NewClimate Institute | November 2017 74
Thailand
Thailand pledged an unconditional NDC target to reduce GHG emissions by 20% below BAU by 2030,
and a conditional target to reduce emissions by 25% below BAU by 2030. The current policies projection
includes the Thailand Integrated Energy Blueprint, comprising policies on alternative energy
development, energy efficiency, smart grid, oil and gas. Thailand’s GHG emissions are projected to be
515 MtCO2e by 2030 (including LULUCF) under current policies projections. Thailand would, therefore,
fail to achieve its NDC target by 2030 including LULUCF by 70-100 MtCO2e.
Table 67: Description of Thailand’s 2020 pledge and NDC
Greenhouse gas mitigation scenarios for major emitting countries
NewClimate Institute | November 2017 75
Table 68: Overview of key climate change mitigation policies in Thailand. Source: (National Economic
and Social Development Board of the Kingdom of Thailand 2012, Ministry of Energy of the Kingdom of
Thailand 2015b, Ministry of Energy of the Kingdom of Thailand 2015a, Office of Natural Resources and
Environmental Policy and Planning of the Kingdom of Thailand 2015a, APERC 2016, Asia Pacific
Energy Research Centre (APERC) 2016, Ministry of Energy of the Kingdom of Thailand 2016)
Sector Policies (marked with “(+)” when
mentioned in the NDC document)
Description
Economy-
wide
Climate Change Master Plan (2015-
2050) (2015) (+)1)
• 7-20% GHG emission reduction by 2020 below
BAU in the energy and transport sectors
• Share of at least 25% of the total energy
consumption from renewable energy sources by
2021
• Reduction of energy intensity by at least 25%
compared to BAU by 2030
Energy
supply
Thailand Integrated Energy Blueprint
(2015) 1)
• Alternative Energy Development
Plan (2015-36) (2015) (+) and
Power Development Plan (2015-
36) (+)
• Increase of renewable energy shares by 2036 to:
30% of total energy consumption, 20% of power
generation (plus additional 15% from imported
hydro), 35% of heat generation and 35% of
transport fuels
• Energy Efficiency Plan (2015-36)
(+)
• Reduction of energy intensity per GDP by 30% by
2036, as compared to 2010 baseline, with total
savings of 90 TWh by 20363)
• Oil Plan (2015-2036)
• Support measures to save fuel in the
transportation sector and enhance ethanol and
biodiesel consumption
• Smart Grid Development Master
Plan (2015-36) (+)
• Aims for high penetration of renewable energy,
mainly mini-hydro and solar PV
Transport Environmentally Sustainable Transport
System Plan (2013-30) (2012) (+)
• Improvement of rail infrastructure to reduce annual
logistics costs and the annual energy bill by about
2% and 1% of GDP respectively
Industry Energy Conservation and Promotion
Act (1992, amended 2007)
• Stabilise share of energy demand for the three
most energy-intensive sectors at 40% by 2030
Buildings Minimum Energy and High Energy
Performance Standards
(MEPS/HEPS) (2011)
• Mandatory MEPS for air conditioners,
refrigerators, self-ballasted compact fluorescent
lamps and double-capped fluorescent lamps
• HEPS for 28 appliances and types of equipment
Building energy code (2009) • Reduce electricity use for large commercial
buildings by > 50% by 2030 compared with BAU
F-gases N/A • N/A
Forestry National Economic and Social
Development Plan (2012)
• Several non-quantifiable long-term targets to
reduce GHG emissions in the agriculture and land
transport sector 2)
• Expansion of conservation areas to at least 19%
of total area, expansion of forest reserves up to
40%, and annual mangrove coastal reforestation
of at least 800 hectares 2) 1) See Supporting Information for detailed assumptions on the policies and measures quantified. 2) Policy not quantified in the IIASA LULUCF model projections 3) No information available on implementation status. For the current analysis we have assumed full
implementation.
Greenhouse gas mitigation scenarios for major emitting countries
NewClimate Institute | November 2017 76
Table 69: Impact of climate policies on greenhouse gas emissions (excluding LULUCF) in Thailand.
Absolute emission levels and emission levels relative to 2010 levels are presented. References for
official emission data are provided in Table 3.
2010 GHG emissions,
excl. LULUCF
2020 pledge and NDC Current policies
Official
data
NewClimate estimates Official
data
NewClimate
estimates
Absolute: 299 MtCO2e N/A 395 to 440 MtCO2e, 31%
to 47% by 2020
415 to 445 MtCO2e, 39%
to 48% by 2030
N/A 395 MtCO2e, 32%
by 2020
515 MtCO2e, 72%
by 2030
Per capita: 4.5
tCO2e/capita
N/A
5.7 to 6.3 tCO2e/capita by
2020
6.0 to 6.4 tCO2e/capita by
2030
N/A 5.7 tCO2e/capita
by 2020
7.4 tCO2e/capita
by 2030
Figure 22: Impact of climate policies on greenhouse gas emissions in Thailand (left: excluding land use
(i.e. LULUCF), right: only land use). Source: NewClimate Institute calculations excluding LULUCF and
IIASA calculations on LULUCF emissions and removals.
Greenhouse gas mitigation scenarios for major emitting countries
NewClimate Institute | November 2017 77
Turkey
In its INDC submission, Turkey established an economy-wide greenhouse gas emission reduction target
of up to 21% below business as usual (BAU) in 2030. The government provides a BAU scenario in the
INDC, against which the target is estimated to result in a reduction of 246 MtCO2e.
The current policies projection includes renewable energy and energy intensity targets. If effective
policies are implemented to achieve these targets, they could lead to emission levels of 525–1,000
MtCO2e by 2030 (49% to 183% above 2010 levels). This large range means the INDC could be either
easily achieved (based on the current policies projection by PBL), or not met (based on government
estimates reflected in NewClimate Institute’s projection). Considering that the INDC is on the upper end
of the projection range, we conclude that Turkey is roughly on track to meet its INDC.
Table 70: Description of Turkey’s 2020 pledge and INDC
Indicator 2020
pledge
INDC (submitted 30 September 2015)
Target: unconditional • N/A • 21% GHG reduction by 2030 from baseline
scenario
Target: conditional • N/A • N/A
Sectoral coverage • N/A • Economy-wide
General Accounting method • N/A • IPCC guidelines; 100-year GWPs from the
Consideration of LULUCF • N/A • Land use sector is included in the target
• Accounting approaches and methodologies
are not specified
Use of bilateral, regional and
international credits
• N/A • Carbon credits from international market
mechanisms will be used to achieve the
2030 target
Availability of reference scenarios
in the latest UNFCCC submissions
• N/A • Yes, INDC refers to a BAU scenario and
gives values for the emissions pathway until
2030
Greenhouse gas mitigation scenarios for major emitting countries
NewClimate Institute | November 2017 78
Table 71: Overview of key climate change mitigation policies in Turkey. Source: (Ministry of Energy and
Natural Resources 2009, Ministry of Environment and Urbanization 2010, Ministry of Environment and
Urbanization 2011, Ministry of Energy and Natural Resources 2014)
Sector Policies (marked with “(+)” when
mentioned in the INDC document)
Description
Economy-
wide
Energy intensity target (Energy
Efficiency Law) (2012)
• Reduce primary energy intensity by
20% by 2023, compared to the 2008
level1)
Energy
supply
Renewable energy target (Law for the
Utilisation of the Renewable Energy
Resources for the Electricity Energy
Production) (2005)
• 13% to 30% share of renewable
energy resources in electricity
production by 2023 (supported by
feed-in tariffs, IEA 2011)
Renewable capacity target (Renewable
Energy Action Plan) (2014)
• 61 GW renewable capacity by 2023:
34 GW of hydro, 20 GW wind, 5 GW
solar, 1 GW geothermal, 1 GW
biomass2)
Forestry National Climate Change Action Plan
(2011)
• Decreasing deforestation by 20% by
2020, compared to the 2007 level
• Increasing carbon sequestered in
forested areas by 15% until 2020,
compared with 2007 1) Not included separately (but target achieved in PBL scenario) 2) No information available on implementation status. For the current analysis we have assumed full
implementation.
Table 72: Impact of climate policies on greenhouse gas emissions (including LULUCF) in Turkey.
Absolute emission levels and emission levels relative to 2010 levels are presented. References for
official emission data are provided in Table 3.
2010 GHG emissions,
incl. LULUCF
2020 pledge and INDC Current policies
Official
data
PBL and
NewClimate
estimates
Official
data
PBL and NewClimate
estimates
Absolute: 353 MtCO2e N/A 930 MtCO2e, 163%
by 2030
N/A 435 to 530 MtCO2e, 24%
to 50% by 2020
525 to 1,000 MtCO2e,
49% to 183% by 2030
Per capita:
4.9 tCO2e/capita
N/A 10.5 tCO2e/capita by
2030
N/A 5.2 to 6.3 tCO2e/capita by
2020
6.0 to 11.3 tCO2e/capita
by 2030
Greenhouse gas mitigation scenarios for major emitting countries
NewClimate Institute | November 2017 79
Figure 23: Impact of climate policies on greenhouse gas emissions in Turkey (left panel: including land
use (i.e. LULUCF), right panel: land use emissions only). Source: NewClimate Institute calculations
adapted from Climate Action Tracker (CAT 2017) and PBL projections excluding LULUCF, and IIASA
calculations on LULUCF emissions and removals. NewClimate calculations are based on a government-
published reference scenario, which assumes a strong economic growth of 4% from 2020 onwards
compared to a current rate of 2%, resulting in rapidly increasing GHG emissions up to 2030.
Greenhouse gas mitigation scenarios for major emitting countries
NewClimate Institute | November 2017 80
Ukraine
Ukraine’s NDC aims to limit GHG emissions to less than 60% of the 1990 levels by 2030. The
NewClimate Institute’s current policies projection was based on the ‘with measures’ scenario from
Ukraine’s Sixth National Communication, most importantly accounting for the National Renewable
Energy Action Plan 2020. No current policies were included in the PBL projection because of the political
circumstances as well as administrative and bureaucratic barriers in Ukraine, leading to uncertainties
about the policy implementation status.
The current policies projections still suggest that Ukraine is on track to achieve its NDC (525 MtCO2e/yr
by 2030), with estimated emission levels of 355–390 MtCO2e/year by 2030 (5% decrease to 5% increase
from 2010 levels), including LULUCF.
Table 73: Description of Ukraine’s 2020 pledge and NDC
Indicator 2020 pledge NDC (submitted 19 September
2016)
Target: unconditional • 20% emissions reductions
below 1990 levels. Update
Kyoto target: 76% of 1990
levels 2013-2020 (not yet
ratified)
• Not exceed 60% of 1990 GHG
emission level in 2030
Target: conditional • N/A • N/A
Sectoral coverage • Economy-wide • Energy, industrial processes and
product use, agriculture, LULUCF,
waste
General Accounting
method
• IPCC guidelines; 100-year
GWPs from the Second
Assessment Report
• IPCC guidelines; 100-year GWPs
from the Fourth Assessment
Report GHGs covered • CO2, CH4, N2O, NF3, HFC,
PFC and SF6
• CO2, CH4, N2O, NF3, HFC, PFC
and SF6
Consideration of
LULUCF
• LULUCF is excluded from the
target
• The impact of LULUCF
credits is expected to be
small (Grassi et al. 2012))
• Land use is included in the NDC
target
• Accounting approach to be used
for the land use sector is to be
defined not later than 2020
Other sector-level
targets
• N/A • N/A
Use of bilateral,
regional and
international credits
• Condition: “To keep the
existing flexible mechanisms
of the Kyoto Protocol”
• Ukraine will participate in
development and implementation
of market mechanisms, but the
2030 GHG target does not
account for this participation.
Availability of
reference scenarios
in the latest UNFCCC
submissions
• “With measures” scenario
from Ukraine’s Sixth National
Communication (NC6)
(Government of Ukraine,
2013)
• “With measures” scenario from
Ukraine’s Sixth National
Communication (NC6)
(Government of Ukraine, 2013)
Greenhouse gas mitigation scenarios for major emitting countries
NewClimate Institute | November 2017 81
Table 74: Overview of key climate change mitigation policies in Ukraine. Source: (Energy in Central and
Eastern Europe 2014, State Agency on Energy Efficiency and Energy Saving of Ukraine 2014, Energy
Community Secretariat 2015, Supreme Council of Ukraine 2015, International Carbon Action
Partnership 2016).
Sector Policies1) (marked with
“(+)” when mentioned in
the NDC document)
Description
Economy-
wide
National Renewable Energy
Action Plan 2020 (2014)2)
• 20% reduction of CO2 emissions per final
consumption of fuel by 2035 from 2010 levels (5%
by 2020, 10% by 2025, 15% by 2030)
• 11% share of renewable energy sources in gross
final energy consumption by 2020 to achieve
78080 ktoe in heating and cooling, electricity and
transport
Energy
supply
Green Tariff (renewables
feed-in-tariff) (2015
amendment)2)
• 5% premium for 30% of domestic equipment
• 10% premium when using 50% of domestic
equipment
Transport Law on Alternative Liquid
and Gaseous Fuels (2012
amendment)
• Gradual increase in the share of production and
use of biofuels and blended motor fuels of: 5% by
2013; 5% by 2014-2015; 7% by 2016; 10% by
2020
Industry Corporate income tax
exemptions for Renewable
Energy Sector (2011)
• Reduction of 80% in corporate profit tax for 5 years
for the sale of equipment that operates on
renewable energy sources and/or that is used for
producing alternative fuels
Forestry
Enhancement of forest
cover
• Increase of the forest area up to 17% of total land
cover by 2020
State Programme “Forest of
Ukraine” (2009)
• Target of 429,000 hectares of afforestation and
231,000 hectares of reforestation by 2030 1) Policies that are implemented after 2013 were not explicitly considered in the current policies scenarios due
to the lack of data and the uncertainty on their implementation status. PBL did not quantify any of the policies
in this overview. 2) Not included in NewClimate calculations.
Greenhouse gas mitigation scenarios for major emitting countries
NewClimate Institute | November 2017 82
Table 75: Impact of climate policies on greenhouse gas emissions (including LULUCF) in Ukraine.
Absolute emission levels and emission levels relative to 2010 levels are presented. References for
official emission data are provided in Table 3.
2010 GHG
emissions, incl.
LULUCF
2020 pledge and NDC Current policies
Official
data
PBL and NewClimate
estimates
Official data PBL and NewClimate
estimates
Absolute:
370 MtCO2e
N/A 755 MtCO2e,
104% by 2020
525 MtCO2e,
42% by 2030
448 MtCO2e by
2020
525 MtCO2e by
2030
285 to 320 MtCO2e,
-23% to -13% by 2020
355 to 390 MtCO2e,
-5% to 5% by 2030
Per capita:
8.1 tCO2e/capita
N/A 17.3 tCO2e/capita by
2020
12.7 tCO2e/capita by
2030
N/A 6.5 to 7.4 tCO2e/capita by
2020
8.6 to 9.4 tCO2e/capita by
2030
Figure 24: Impact of climate policies on greenhouse gas emissions in Ukraine (left panel: all gases and
sectors, right panel: land use (i.e. LULUCF) emissions and removals only). Source: NewClimate Institute
calculations adapted from Climate Action Tracker (CAT 2017) and PBL calculations excluding LULUCF,
and IIASA projections on LULUCF emissions and removals.
Greenhouse gas mitigation scenarios for major emitting countries
NewClimate Institute | November 2017 83
United States of America
The United States of America submitted its NDC to reduce its GHG emissions by 26-28% from 2005
levels (20-24% from 2010 levels) by 2025, and ratified the Paris Agreement in September 2016. The
government also sets a 2020 pledge of a 17% reduction from 2005 levels (13% from 2010 levels).
However, on June 1st, 2017, President Donald Trump announced that the United States would withdraw
from the Paris Agreement and cease implementation of the NDC. On August 4th, 2017, the United
States notified the UN Secretary-General that it intends to “exercise its right to withdraw” from the Paris
Agreement, which will first be possible in 2019. The main federal level mitigation-related policies
implemented to date include the Clean Air Act, vehicle fuel efficiency standards (CAFE), and the Clean
Power Plan (the legal status of which is under dispute in the courts). There are also various state or
regional-level policies such as renewable portfolio standards (RPS) and regional emissions trading
schemes.
PBL and NewClimate calculations indicate that the United States is not on track to meet its 2020 and
2025 NDC targets with existing policies. Excluding the impact of the Clean Power Plan, 2020 emission
levels are projected to be 5 to 7% below 2010 levels, and 2025 emissions levels are projected to be 5
to 13% below 2010 levels. NewClimate and PBL estimates that including the Clean Power Plan would
result in 200-250 MtCO2e/year lower emissions in 2025. In either case, the NDC target would not be
reached unless additional measures were implemented.
Table 76: Description of the United States’ 2020 pledge and NDC
Indicator 2020 pledge NDC (submitted 3 September
2016)
Target: unconditional • GHG reduction in the range of
17% by 2020 below 2005
levels
• 26-28% GHG reduction by
2025 from 2005 levels
Target: conditional • N/A • N/A
Sectoral coverage • Economy wide • Economy wide
General Accounting
method
• IPCC guidelines; 100-year
GWPs from the Fourth
Assessment Report
• IPCC guidelines; 100-year
GWPs from the Fourth
Assessment Report
GHGs covered • CO2, CH4, N2O, HFCs, PFCs,
SF6 and NF3
• CO2, CH4, N2O, HFCs, PFCs,
SF6 and NF3
Consideration of
LULUCF
• Land use sector is included in
the target
• Net-net accounting is specified
to be used for emission
accounting
• Land use sector is included in
the target
• Net-net accounting is specified
to be used for emission
accounting 1)
Use of bilateral,
regional and
international credits
• N/A • N/A
Availability of
reference scenarios in
the latest UNFCCC
submissions
• Yes: Current Measures
scenario presented in the 2nd
Biennial Report reflects the
impacts of only existing policies
and measures
• Yes: Current Measures
scenario presented in the 2nd
Biennial Report reflects the
impacts of only existing policies
and measures 1) The United States also specifies that it intends to use the production approach for accounting for harvested
wood products (HWP) consistent with IPCC guidance.
Greenhouse gas mitigation scenarios for major emitting countries
NewClimate Institute | November 2017 84
Table 77: Overview of key climate change mitigation policies in the United States. Source: (Executive
Office of the President 2013, United States of America 2014, IEA 2015, United States of America 2015,
N.C. Clean Energy Technology Cente 2016, NewClimate Institute 2016)). State-level policies are
presented in Supporting Information.
Sector Policies (marked with “(+)” when
mentioned in the NDC
document)
Description
Economy-
wide
Clean Air Act (1963) (+) • Act governed by the EPA that is
implemented through actions such as the
Clean Power Plan (CPP)
Energy
supply
Clean Power Plan (CPP) (2014)
(+) 1)
• CPP aims to reduce emissions from the
power sector by 32% below 2005 levels by
2030
• CO2 standard for new and existing power
plants
Reduction in CH4 emissions from
oil and gas production
• 40% to 45%, from 2012 levels, by 20254)
• Specific standards for oil and gas
production
Blueprint for a Secure Energy
Future
• Reduce oil imports 50% by 20204)
Transport Efficiency standards light-duty
vehicles (CAFE) (+)
• 34.1 mpg (14.9 km/l) by 2016, 55 mpg (23.2
km/l) by 2025
Efficiency standards heavy-duty
vehicles
• Differentiated standards per truck type
Renewable fuel standard (2015) • Volume of renewable fuel required to be
blended into transportation fuel from 9
billion gallons in 2008 to 36 billion gallons
by 2022
Buildings Better buildings Challenge
(commercial buildings)
• Help American commercial and industrial
buildings become at least 20% more energy
efficient by 20202)
Energy Star Tax credits for
buildings
• Tax credits for energy efficiency products
and solar energy systems
Building Energy Codes Program • Efficiency codes are adopted at a state
level
Federal Appliance standards • Appliance standards for a large number of
appliances 2)
Industry Curbing emissions of
hydrofluorocarbons (HFCs) (+)
• Mix of actions to reduce HFCs use and
encouraging the use of alternatives
Forestry Forest Ecosystem Restoration and
Hazardous Fuels Reduction
Programs (2000)
• Mix of actions to increase forest resilience,
reduce wildfire, and increase the area of set
aside forests 3) 1) The legal status of the CPP is uncertain. The analysis by NewClimate and PBL considered cases with and
without CPP. 2) Not quantified in PBL TIMER model 3) Policy not quantified in the IIASA LULUCF model projections 4) Not quantified in NewClimate calculations.
Greenhouse gas mitigation scenarios for major emitting countries
NewClimate Institute | November 2017 85
Table 78: Impact of climate policies on greenhouse gas emissions (including LULUCF) in the United
States. Absolute emission levels and emission levels relative to 2010 levels are presented. Note that
the official values for 2020 and 2030 are based on GWP values from the IPCC 4th Assessment Report.
References for official emission data are provided in Table 3.
2010 GHG
emissions,
incl. LULUCF
2020 pledge and NDC Current policies
Official
data
PBL and
NewClimate
estimates
Official
data
PBL and NewClimate estimates
Absolute:
6,085 MtCO2e
5,344
MtCO2e
by 2020
5,365 MtCO2e, -
12% by 2020
4,655 to 4,785
MtCO2e, -23%
to -21% by 2025
5,451 to
5,597
MtCO2e by
2020
5,379 to
5,672
MtCO2e by
2025
Without Clean Power Plan
5,665 to 5,770 MtCO2e, -7% to -5% by 2020
5,320 to 5,790 MtCO2e, -13% to -5% by 2025
With Clean Power Plan
5,660 to 5,755 MtCO2e, -7% to -5% by 2020
5,070 to 5,590 MtCO2e, -17% to -8% by 2025
Per capita:
19.7
tCO2e/capita
N/A 16.2
tCO2e/capita by
2020
13.6 to 13.9
tCO2e/capita by
2025
N/A Without Clean Power Plan
17.1 to 17.4 tCO2e/capita by 2020
15.5 to 16.9 tCO2e/capita by 2025
With Clean Power Plan
17.1 to 17.4 tCO2e/capita by 2020
14.8 to 16.3 tCO2e/capita by 2025
Figure 25: Impact of climate policies on greenhouse gas emissions in the United States (upper figure:
all gases and sectors, including land use (i.e. LULUCF), lower figure: excluding land use (left) and only
land use (right) separately). Source: NewClimate Institute calculations based on its analysis for Climate
Action Tracker (CAT 2017) and PBL calculations excluding LULUCF, and IIASA projections on LULUCF
emissions and removals.
Greenhouse gas mitigation scenarios for major emitting countries
NewClimate Institute | November 2017 86
References
ADB (2016). Indonesia Energy Sector Assessment, Strategy and Road Map. Manila, the Philippines, Asian Development Bank.
Al-Ghabban, A. (2013). Saudi Arabia’s Renewable Energy Strategy and Solar Energy Deployment Roadmap, King Abdullah City for Atomic and Renewable Energy. . Retrieved from: https://www.irena.org/DocumentDownloads/masdar/Abdulrahman%20Al%20Ghabban%20Presentation.pdf.
America's Pledge. (2017). "Press Release: California Governor Jerry Brown and Michael Bloomberg Launch "America's Pledge"." Retrieved 14 July, 2017, from https://www.americaspledgeonclimate.com/.
APERC (2016). World Energy Demand and Supply Outlook 6th edition. Tokyo, Japan, Asia Pacific Energy Research Centre, Institute of Energy Economics, Japan.
Asia-Pacific Economic Cooperation. (2016). "Philippine Energy Efficiency Roadmap 2014-2030." Retrieved 27 May, 2016, from http://aperc.ieej.or.jp/file/2016/4/28/Philippines_Compendium_2015_-_Final.pdf.
Asia Pacific Energy Research Centre (APERC). (2016). "APEC Energy Demand and Supply Outlook 6th Edition: Economic Reviews." Retrieved 4 August, 2016, from http://aperc.ieej.or.jp/file/2016/5/10/APEC_Outlook6th_VolumeII_EconomyReviews.pdf.
Australian Government. (2016). "Australia’s emissions projections 2016." Retrieved 28 August, 2017, from http://www.environment.gov.au/climate-change/emissions-projections.
Australian Government (2015a). Australia's abatement task: tracking to 2020. http://www.environment.gov.au/climate-change/publications/factsheet-emissions-projections-2015-16, Department of the Environment, Australia.
Australian Government (2015b). Australia’s emissions projections 2014 –15, Department of Environment, March 2015. http://www.environment.gov.au/climate-change/publications/emissions-projections-2014-15, Department of the Environment, Australia.
Australian Government. (2015c). "Carbon Farming Initiative project transition into the Emissions Reduction Fund." Australian Government, Department of the Environment and Energy. Retrieved 3 November, 2016, from http://www.environment.gov.au/climate-change/emissions-reduction-fund/carbon-farming-initiative-project-transition.
Australian Government (2016). Tracking to Australia’s emissions reduction targets. http://www.environment.gov.au/system/files/resources/9437fe27-64f4-4d16-b3f1-4e03c2f7b0d7/files/fact-sheet-tracking-emissions.pdf, Department of the Environment and Energy, Australia.
BAPPENAS (2015). Sekretariat RAN-GRK, Available at: http://ranradgrk.bappenas.go.id/rangrk/component/content/article/92-bahasa/informasi-sektoral/193-hasil-indc.
BEE. (2015). "Deepening &Widening of PAT scheme and Provisions of EC Act Applicable to DCs." Bureau of Energy Efficiency. Retrieved 27 April, 2016, from https://beeindia.gov.in/sites/default/files/Milind_Deore_widening_Deepening.pptx.compressed_0.pdf.
Blok, K. (2007). Introduction to Energy Analysis. Amsterdam, The Netherlands, Techne Press. Bond, T. C., S. J. Doherty, D. W. Fahey, P. M. Forster, T. K. Berntsen, O. Boucher, B. DeAngelo, M. G.
Flanner, S. J. Ghan, B. Karcher, D. Koch, S. Kinne, Y. Kondo, U. Lohmann, P. K. Quinn, M. C. Sarofim, M. G. Schultz, M. G. Schulz, C. Venkataraman, H. Zhang, S. Zhang, N. Bellouin, S. Guttikunda, P. K. Hopke, M. Z. Jacobson, J. Kaiser, Z. Klimont, J. P. Schwarz, D. Shindell, T. Storelvmo, S. G. Warren and C. S. Zender (2013). "Bounding the role of black carbon in the climate system: A scientific assessment." J. Geophys. Res. 118: 1-173.
Borgmann, M. (2016). "Potentially Game-Changing Saudi Arabian Government Restructuring Bolsters 9.5 GW Renewable Energy Target by 2023." Retrieved 24 October, 2016, from http://www.apricum-group.com/saudi-arabia-announces-9-5-gw-renewable-energy-target-new-king-salman-renewable-energy-initiative/.
Braliyev, A. (2007). "Statement in the 15th session of the United Nations Commission on Sustainable Development." Retrieved 4 August, 2016, from https://sustainabledevelopment.un.org/content/documents/kazakhstan_9may.pdf.
Cámara de Diputados (2015). Ley De Transición Energética. http://www.diputados.gob.mx/LeyesBiblio/pdf/LTE.pdf Congreso General de los Estados Unidos Mexicanos.
Capros, P., A. De Vita, N. Tasios, P. Siskos, M. Kannavou, A. Petropoulos, S. Evangelopoulou, M. Zampara, D. Papadopoulos and C. Nakos (2016). EU Reference Scenario 2016 - Energy,
Greenhouse gas mitigation scenarios for major emitting countries
NewClimate Institute | November 2017 87
Transport and GHG Emissions - Trends to 2050. https://ec.europa.eu/energy/sites/ener/files/documents/20160713%20draft_publication_REF2016_v13.pdf, European Commission.
2017, from http://climateactiontracker.org/countries.html. CD-LINKS. (2017). "CD-LINKS Project." Retrieved 28 August, 2017, from http://www.cd-links.org/. Central Electricity Authority. (2016). "Draft National Electricity Plan." Retrieved 31 July, 2017, from
http://www.cea.nic.in/reports/committee/nep/nep_dec.pdf. Colombian Government. (2014). "For the regulation of the integration of Non-conventional Renewable
Energy to the National Energy System." Retrieved 4 August, 2016, from https://www.minminas.gov.co/documents/10180//23517//22602-11506.pdf.
Dargie, G. C., S. L. Lewis, I. T. Lawson, E. T. A. Mitchard, S. E. Page, Y. E. Bocko and S. A. Ifo (2017). "Age, extent and carbon storage of the central Congo Basin peatland complex." Nature 542(7639): 86-90.
de Boer, H. S. and D. van Vuuren (2017). "Representation of variable renewable energy sources in TIMER, an aggregated energy system simulation model." Energy Economics 64: 600-611.
Decree of the President of the Republic of Kazakhstan. (2013). "Concept for transition of the Republic of Kazakhstan to Green Economy. Approved by Decree of the President of the Republic of Kazakhstan on May 30, 2013, #557." Retrieved 1 August, 2016, from http://gbpp.org/wp-content/uploads/2014/04/Green_Concept_En.pdf.
den Elzen, M., A. Admiraal, M. Roelfsema, H. van Soest, A. F. Hof and N. Forsell (2016a). "Contribution of the G20 economies to the global impact of the Paris agreement climate proposals." Climatic Change 137(3): 655-665.
den Elzen, M. G. J., H. Fekete, A. Admiraal, N. Forsell, N. Höhne, A. Korosuo, M. Roelfsema, H. van Soest, K. Wouters, T. Day, M. Hagemann and A. F. Hof (2015). Enhanced policy scenarios for major emitting countries. Analysis of current and planned climate policies, and selected enhanced mitigation measure. Bilthoven, the Netherlands, http://www.pbl.nl/sites/default/files/cms/publicaties/pbl-2015-enhanced-policy-scenarios-for-major-emitting-countries_1631.pdf, PBL Netherlands Environmental Assessment Agency.
den Elzen, M. G. J., H. Fekete, N. Höhne, A. Admiraal, N. Forsell, A. F. Hof, J. G. J. Olivier, M. Roelfsema and H. van Soest (2016b). "Greenhouse gas emissions from current and enhanced policies of China until 2030: Can emissions peak before 2030?" Energy Policy 89: 224-236.
Department of Energy. (2015a). "Philippine Energy Plan 2012-2030." Retrieved 27 May, 2016, from http://www.doe.gov.ph/policy-and-planning/philippine-energy-plan
Department of Energy. (2015b). "Philippines Energy Efficiency and Conservation Action Plan 2016-2020." Retrieved 27 May, 2016, from http://www.doe.gov.ph/doe_files/pdf/05_Energy_Efficiency/philippines_energy_efficiency_action_plan2016-20.pdf.
Department of Energy South Africa (2011). Integrated Resource Plan for Electricity 2010-2030 - Revision 2 - Final Report. http://www.doe-irp.co.za/content/IRP2010_promulgated.pdf, Department of Energy.
Department of Energy South Africa (2013). Integrated Resource Plan for Electricity (IRP) 2010-2030 - Update Report 2013. http://www.doe-irp.co.za/content/IRP2010_updatea.pdf, Department of Energy.
Department of Environmental Affairs (2014). Mitigation Report - South Africa's Greenhouse Gas Mitigation Potential Analysis. Pretoria, Department of Environmental Affairs, Government of South Africa & Deutsche Gesellschaft fuer Internationale Zusammenarbeit (GIZ) GmbH.
Department of Environmental Affairs Republic of South Africa. (2011a). "Explanatory note: Defining South Africa’s Peak, Plateau and Decline Greenhouse Gas Emission Trajectory. SA Government Position on Climate Change " Retrieved 31 October, 2015, from http://www.climateaction.org.za/cop17-cmp7/sa-government-position-on-climate-change.
Department of Environmental Affairs Republic of South Africa (2011b). South Africa’s Second National Communication under the United Nations Framework Convention on Climate Change, Available at: http://unfccc.int/resource/docs/natc/zafnc02.pdf [Accessed 14 October 2016].
Department of Minerals and Energy (2007). Biofuels Industrial Strategy of the Republic of South Africa. http://www.energy.gov.za/files/esources/renewables/biofuels_indus_strat.pdf(2).pdf, Department of Minerals and Energy.
EEA (2016). Total greenhouse gas emissions trends and projections (published 21 June 2016, last modified 30 October 2017). Retrieved 31 October, 2017, from https://www.eea.europa.eu/data-and-maps/indicators/greenhouse-gas-emission-trends-6/assessment
Greenhouse gas mitigation scenarios for major emitting countries
NewClimate Institute | November 2017 88
Energy Community Secretariat. (2015). "Annual Implementation Report 2014/2015." Retrieved 31 May, 2016, from https://www.energy-community.org/portal/page/portal/ENC_HOME/DOCS/3872267/23B450386A075E64E053C92FA8C0F69F.PDF.
Energy in Central and Eastern Europe. (2014). "Energy Strategy of Ukraine through 2035. White Book of Ukrainian Energy Policy." Retrieved 31 May, 2016, from http://www.enercee.net/fileadmin/enercee/images-2016/Ukraine/Energy_strategy_2035_eng.pdf.
Ethiopia Rural Energy Development and Promotion Centre (EREDPC). (2007). "National Biogas Programme, Ethiopia: Brief Programme Profile." Retrieved 4 August, 2016, from http://www.bibalex.org/Search4Dev/files/284294/116537.pdf.
European Commission. (2016, 25 October, 2016). "Land use and forestry in the EU." Retrieved 31 October, 2016, from http://ec.europa.eu/clima/policies/forests/lulucf/index_en.htm.
Executive Office of the President. (2013). "“The President’s Climate Action Plan.” Washington, D.C., USA. (26 June): 21." Retrieved 4/16/2014, from https://obamawhitehouse.archives.gov/sites/default/files/image/president27sclimateactionplan.pdf.
FAO. (2015). "Climate change and forestry legislation in support of REDD+." Food and Agriculture Organization of the United Nations. . from http://www.fao.org/fileadmin/user_upload/legal/docs/lpo_92.pdf.
Federal Democratic Republic of Ethiopia - Ministry of Water and Energy. (2012). "Scaling - Up Renewable Energy Program Ethiopia Investment Plan (Draft Final). ." Retrieved 4 August, 2016, from http://www.epa.gov.et/Lists/News/Attachments/17/SREP%20Ethiopia%20Investment%20Plan%20-%20Version%20for%20External%20Review%20-%20January%202012.pdf.
Federal Democratic Republic of Ethiopia. (2010). "Growth and Transformation Plan." Retrieved 4 August, 2016, from https://www.imf.org/external/pubs/ft/scr/2011/cr11304.pdf.
Federal Democratic Republic of Ethiopia. (2011). "Ethiopia’s Climate-Resilient Green Economy. Green economy strategy." Retrieved 4 August, 2016, from https://www.undp-aap.org/sites/undp-aap.org/files/Ethiopia%20CRGE%20Strategy%20Final.pdf.
Federal Democratic Republic of Ethiopia. (2015). "Ethiopia’s Second National Communication to the United Nations Framework Convention on Climate Change (UNFCCC)." Retrieved 4 August, 2016, from http://unfccc.int/resource/docs/natc/ethnc2.pdf.
Federal Democratic Republic of Ethiopia. (2016). "Growth and Transformation Plan II (GTP II) (2015/16-2019/20)." Retrieved 24 October, 2016, from http://dagethiopia.org/new/docstation/com_content.article/100/gtpii__english_translation__final__june_21_2016.pdf.
Federative Republic of Brazil. (2015). "Intended Nationally Determined Contribution towards achieving the objective of the United Nations Framework Convention on Climate Change." UNFCCC. Retrieved 31 October, 2016, from http://www4.unfccc.int/submissions/INDC/Published%20Documents/Brazil/1/BRAZIL%20iNDC%20english%20FINAL.pdf.
Girod, B., D. P. van Vuuren and S. Deetman (2012). "Global travel within the 2°C climate target." Energy Policy 45.
Government of Argentina. (2015). "Tercera Comunicación Nacional del Gobierno de la República Argentina a las Partes de la Convención Marco de las Naciones Unidas sobre Cambio Climático." Secretaría de Ambiente y Desarrollo Sustentable de la Nación. Retrieved 4 August, 2016, from http://unfccc.int/resource/docs/natc/argnc3s.pdf
Government of Argentina (2016). Primera Revisión de su Contribución Determinada a Nivel Nacional, http://www4.unfccc.int/ndcregistry/PublishedDocuments/Argentina%20First/17112016%20NDC%20Revisada%202016.pdf.
Government of Australia (2017). National Inventory Report 2015 Volume 1, Commonweath of Australia 2017.
Government of Brazil. (2007). "Decreto No 6.048, De 27 de Fevereiro de 2007." Retrieved 13 October, 2016, from http://www.planalto.gov.br/ccivil_03/_Ato2007-2010/2007/Decreto/D6048.htm.
Government of Canada (2014). Canada’s Sixth National Report on Climate Change, http://ec.gc.ca/cc/16153A64-BDA4-4DBB-A514-B159C5149B55/6458_EC_ID1180-MainBook_high_min%20FINAL-s.pdf.
Government of Canada (2015). Canada's Second Biennial Report on Climate Change. http://unfccc.int/files/national_reports/biennial_reports_and_iar/submitted_biennial_reports/application/pdf/canadas_2nd_biennial_report.pdf., Government of Canada.
Greenhouse gas mitigation scenarios for major emitting countries
NewClimate Institute | November 2017 89
Government of Canada (2016). Canada’s Second Biennial Report on Climate Change, Environment and Climate Change Canada, , https://www.ec.gc.ca/ges-ghg/02D095CB-BAB0-40D6-B7F0-828145249AF5/3001%20UNFCCC%202nd%20Biennial%20Report_e_v7_lowRes.pdf.
Government of Canada. (2017). "Canada's 2017 Nationally Determined Contribution Submission to the United Nations Framework Convention on Climate Change." UNFCCC. Retrieved 1 September, 2017, from http://www4.unfccc.int/ndcregistry/PublishedDocuments/Canada%20First/Canada%20First%20NDC-Revised%20submission%202017-05-11.pdf.
Government of Chile. (2013). "Action Plan for Energy Efficiency 2020." Ministry of Energy. from http://www.amchamchile.cl/UserFiles/Image/Events/octubre/energia/plan-de-accion-de-eficiencia-energetica2020.pdf & http://www.kallman.com/shows/iftenergy_2012/pdfs/Energy-for-the-Future-Chile's-National-Energy-Strategy-2012-2030-English.pdf.
Government of Chile. (2015). "Intended National Determined Contribution (INDC) for Paris Agreement 2015." from http://www4.unfccc.int/submissions/INDC/Published%20Documents/Chile/1/Chile%20INDC%20FINAL.pdf.
Government of India (2015a). First Biennial Update Report to the United Nations Framework Convention on Climate Change. Government of India, Ministry of Environment, Forest and Climate Change.
Government of India (2015b). India’s Intended Nationally Determined Contribution: Working Towards Climate Justice. .
Government of Japan. (2013). "Japan's 6th National Communication to the UNFCCC." from http://unfccc.int/files/national_reports/annex_i_natcom/submitted_natcom/application/pdf/nc6_japan_webversion.pdf.
Government of Japan. (2015). "Japan’s National Greenhouse Gas Emissions in Fiscal Year (FY) 2013 (Vol. 2013). http://www.env.go.jp/press/files/en/591.pdf." from http://unfccc.int/files/national_reports/annex_i_natcom/submitted_natcom/application/pdf/nc6_japan_webversion.pdf.
Government of Japan. (2016). "Japan’s Second Biennial Report Under the United Nations Framework Convention on Climate Change, Available at: http://unfccc.int/files/national_reports/biennial_reports_and_iar/submitted_biennial_reports/application/pdf/japan_br2_revised.pdf."
Government of Russia. (2014). "First Biennial Report of the Russian Federation." UNFCCC, Bonn, available at: http://unfccc.int/files/national_reports/biennial_reports_and_iar/submitted_biennial_reports/application/pdf/1br_rus_unoffical_translation_eng.pdf Retrieved 12 December, 2014.
Government of Russia. (2015). "Second Biennial Report of the Russian Federation." UNFCCC, Bonn, available at: http://unfccc.int/resource/docs/2016/trr/rus.pdf. 2015.
Government of South Africa (2012). National Climate Change Response White Paper. Pretoria, Government of South Africa.
Government of the Republic of Kazakhstan. (2015). "Intended Nationally Determined Contribution. Submission of the Republic of Kazakhstan." UNFCCC. Retrieved 4 August, 2016, from http://www4.unfccc.int/Submissions/INDC/Published%20Documents/Kazakhstan/1/INDC%20Kz_eng.pdf.
Government of the Russian Federation. (2013). "Decree No. 449 on the Mechanism for the Promotion of Renewable Energy on the Wholesale Electricity and Market " Retrieved 13 October, 2016, from http://www.iea.org/media/pams/russia/Russia_Decreeno449_MechanismforthePromotionofRenewableEnergyontheWholesaleElectricityandMarket.pdf.
Government of Ukraine. (2013). "Sixth National Communication." UNFCCC. from http://unfccc.int/files/national_reports/annex_i_natcom/submitted_natcom/application/pdf/6nc_v7_final_[1].pdf.
Government of Brazil (2008). National Plan on Climate Change Brazil, Executive Summary. Decree No. 6263. I. C. o. C. Change. Brasília, Brazil, http://www.mma.gov.br/estruturas/208/_arquivos/national_plan_208.pdf
Government of Brazil (2010). DECREE No. 7390, 9 December 2010, http://www.planalto.gov.br/ccivil_03/_Ato2007-2010/2010/Decreto/D7390.htm
Government of Mexico (2012). Programas para mitigar el cambio climático, Available at: http://www2.inecc.gob.mx/publicaciones/libros/685/programas2.pdf [Accessed 10 November 2015].
Greenhouse gas mitigation scenarios for major emitting countries
NewClimate Institute | November 2017 90
Grassi, G., M. G. J. den Elzen, A. F. Hof, R. Pilli and S. Federici (2012). "The role of the land use, land use change and forestry sector in achieving Annex I reduction pledges." Climatic Change 115(3): 873-881.
Green, F. and N. Stern (2016). "China's changing economy: implications for its carbon dioxide emissions." Climate Policy: 1-15.
Gusti, M. and G. Kindermann (2011). An approach to modeling landuse change and forest management on a global scale. Proceedings, 1st International Conference on Simulation and Modeling Methodologies, Technologies and Applications (SIMULTECH 2011).
Gütschow, J., L. Jeffery, R. Gieseke and R. Gebel (2017). "The PRIMAP-hist national historical emissions time series (1850-2014). V. 1.1. GFZ Data Services. http://doi.org/10.5880/PIK.2017.001."
Havlík, P., H. Valin, M. Herrero, M. Obersteiner, E. Schmid, M. C. Rufino, A. Mosnier, P. K. Thornton, H. Böttcher, R. T. Conant, S. Frank, S. Fritz, S. Fuss, F. Kraxner and A. Notenbaert (2014). "Climate change mitigation through livestock system transitions." PNAS 111(10): 3709-3714.
Hwang, I.-H. (2014). South Korea’s National Basic Plan for New and Renewable Energies. EDMC Energy Trends. Tokyo, Japan, Institute of Energy Economics, Japan. https://eneken.ieej.or.jp/data/5842.pdf [accessed 1 November, 2016].
ICAP. (2016). "Kazakhstan ETS suspended until 2018 " Retrieved 6 July, 2016, from https://icapcarbonaction.com/en/news-archive/387-kazakhstan-ets-suspended-until-2018.
ICCT (2012). Global Transportation Roadmap. Model Documentation and User Guide: ICCT Roadmap Model Version 1-0, The International Council on Clean Transportation.
IEA. (2011, 27 October, 2015). "Renewable Energy Law 2010." Retrieved 13 October, 2016, from http://www.iea.org/policiesandmeasures/pams/turkey/name-24961-en.php.
IEA. (2013). "Programme for Rational and Efficient Use of Energy and Other Forms of Non-Conventional Energy (Resolution 180919) " IEA/IRENA Joint Policies and Measures database. Retrieved 4 August, 2016, from http://www.iea.org/policiesandmeasures/pams/colombia/name-38072-en.php?s=dHlwZT1yZSZzdGF0dXM9T2s,&return=PG5hdiBpZD0iYnJlYWRjcnVtYiI-PGEgaHJlZj0iLyI-SW50ZXJuYXRpb25hbCBFbmVyZ3kgQWdlbmN5Jnp3bmo7PC9hPjxzcGFuPiAmZ3Q7IDwvc3Bhbj48YSBocmVmPSIvcG9saWNpZXNhbmRtZWFzdXJlcy8iPlBvbGljaWVzIGFuZCBNZWFzdXJlczwvYT48c3Bhbj4gJmd0OyA8L3NwYW4-PGEgaHJlZj0iL3BvbGljaWVzYW5kbWVhc3VyZXMvcmVuZXdhYmxlZW5lcmd5LyI-UmVuZXdhYmxlIEVuZXJneTwvYT48c3BhbiBjbGFzcz0ibGFzdCI-PC9zcGFuPjwvbmF2Pg.
IEA (2015). World Energy Outlook 2015. Paris, France, International Energy Agency. IEA. (2016). "Renewable Energy - Renewable Policy Update." Retrieved 13 October, 2016, from
IEA/IRENA. (2016). "Joint Policies and Measures database." International Energy Agency. Retrieved 19 May, 2016, from http://www.iea.org/policiesandmeasures/pams/chile/
International Carbon Action Partnership. (2016). "ETS Detailed Information Ukraine." Retrieved 31 May, 2016, from https://icapcarbonaction.com/en/?option=com_etsmap&task=export&format=pdf&layout=list&systems[]=74.
Iversen, P., D. Lee and M. Rocha (2014). Understanding land use in the UNFCCC. Climate and Land Use Alliance.
JRC/PBL. (2014). "Emission Database for Global Atmospheric Research (EDGAR) version 4.2FT2012 " Joint Research Centre of the European Commission/PBL Netherlands Environmental Assessment Agency. from http://edgar.jrc.ec.europa.eu/index.php.
Keenan, R. J., G. A. Reams, F. Achard, J. V. de Freitas, A. Grainger and E. Lindquist (2015). "Dynamics of global forest area: results from the FAO Global Forest Resources Assessment 2015." Forest Ecology and Management 352: 9-20.
Kharina, A., C. Malins and S. Searle (2016). Biofuels Policy in Indonesia : Overview and Status Report. http://www.theicct.org/sites/default/files/publications/Indonesia Biofuels Policy_ICCT_08082016.pdf, ICCT: 1-13.
King Abdullah University of Science and Technology (2014). Appraisal and Evaluation of Energy Utilization and Efficiency in the Kingdom of Saudi Arabia. Volume 2: Energy Efficiency Audit: Case Studies, http://www.kaust.edu.sa/assets/downloads/kicp-annual-strategic-study-appraisal-and-evaluation-of-energy-utilization-and-efficiency-in-the-ksa%202014-volume1.pdf.
Greenhouse gas mitigation scenarios for major emitting countries
NewClimate Institute | November 2017 91
Kingdom of Morocco - Ministry Delegate of the Minister of Energy Mines Water and Environment. (2013). "La nouvelle Stratégie Energétique Nationale. Bilan d’étape." Retrieved 4 August, 2016, from http://taqaway.net/sites/default/files/uploads/documents/doc98.pdf.
Kingdom of Morocco - Ministry Delegate of the Minister of Energy Mines Water and Environment. (2014). "Moroccan Climate Change Policy." from http://www.4c.ma/medias/MCCP%20-%20Moroccan%20Climate%20Change%20Policy.pdf.
Kingdom of Morocco (2015). Intended National Determined Contribution (INDC). http://www4.unfccc.int/Submissions/INDC/Published%20Documents/Morocco/1/Morocco%20INDC%20submitted%20to%20UNFCCC%20-%205%20june%202015.pdf, UNFCCC.
Kingdom of Morocco. (2016a). "Premier Rapport Biennal Actualisé du Royaume du Maroc." Retrieved 4 August, 2016, from http://unfccc.int/resource/docs/natc/marbur1.pdf.
Kingdom of Morocco. (2016b). "Troisième Communication Nationale a la Convention Cadre des Nations Unies sur les Changements Climatiques." Retrieved 4 August, 2016, from http://unfccc.int/resource/docs/natc/marnc3.pdf.
Kingdom of Morocco Ministry of Equipment and Transport. (2010). "Stratégie nationale de développement de la compétitivité logistique. Synthèse de la stratégie et du Contrat-Programme 2010 - 2015." Retrieved 4 August, 2016, from http://www.orientalinvest.ma/telechargementfichiers/logistique/Doc1FR.pdf.
Kingdom of Saudi Arabia. (2016). "Vision 2030." Retrieved 24 October, 2016, from www.vision2030.gov.sa/download/file/fid/417.
KSA (2015). The Intended Nationally Determined Contribution (INDC) of the Kingdom of Saudi Arabia under the UNFCCC. Retrieved from http://www4.unfccc.int/submissions/INDC/Published%20Documents/Saudi%20Arabia/1/KSA-INDCs%20English.pdf.
Kuramochi, T. (2014). GHG Mitigation in Japan: An Overview of the Current Policy Landscape. Washington, Working Paper. Washington, DC: World Resources Institute. Available online at wri.org/publication/ghg-mitigation-policy-japan
Kuramochi, T., N. Höhne, S. Gonzales-Zuniga, F. Hans, S. Sterl, M. Hagemann, E. Hernandez Legaria, M. G. J. Den Elzen, M. Roelfsema, H. Van Soest, N. Forsell and O. Turkovska (2016). Greenhouse gas mitigation scenarios for major emitting countries: Analysis of current climate policies and mitigation pledges (Update: November 2016). Cologne, Germany, NewClimate Institute.
Loynes, K. (2016). Australia and the Doha Amendment: a quick guide. http://parlinfo.aph.gov.au/parlInfo/download/library/prspub/4971944/upload_binary/4971944.pdf, Parliament of Australia.
MAPS Chile (2014). Opciones de mitigación para enfrentar el cambio climático: resultados de Fase 2. Santiago, Chile, Ministerio del Medio Ambiente.
Ministry of Consumer Affairs Food and Public Distribution. (2015, 22 December, 2015). "Ethanol blending targets scaled up from 5% to 10% to improve the liquidity position of sugar mills." Press Information Bureau, Government of India, Ministry of Consumer Affairs, Food & Public Distribution. from http://pib.nic.in/newsite/PrintRelease.aspx?relid=133773
Ministry of Energy (2014). Energy Agenda. A challenge for the country, progress for everyone. Chile Ministry of Energy.
Ministry of Energy and Natural Resources (2009). Electricity Energy Market and Supply Security Strategy Paper. Ankara, Ministry of Energy and Natural Resources.
Ministry of Energy and Natural Resources (2014). National Renewable Energy Action Plan for Turkey. Ankara, MInistry of Energy and Natural Resources.
Ministry of Energy of Argentina. (2016). "Ministry of Energy Database: Generación Eléctrica - Centrales de Generación." Retrieved 28 July, 2017, from http://datos.minem.gob.ar/dataset/anuarios-de-energia-electrica.
Ministry of Energy of the Kingdom of Thailand. (2015a). "Oil Plan (2015-2036)." Retrieved 4 August, 2016, from http://www.eppo.go.th/images/POLICY/ENG/oil_plan2558.pdf.
Ministry of Energy of the Kingdom of Thailand. (2015b). "Thailand Power Development Plan 2015-2036 (PDP2015)." Retrieved 4 August, 2016, from http://www2.eppo.go.th/power/PDP2015/PDP2015_Eng.pdf.
Ministry of Energy of the Kingdom of Thailand. (2016). "Thailand Integrated Energy Blueprint. EPPO Journal, (Special Issue 2016)." Retrieved 4 August, 2016, from http://www.eppo.go.th/images/Infromation_service/journalissue/ISSUE-SPECIAL2559.pdf.
Ministry of Energy of the Republic of Kazakhstan. (2015). "The Second Biennial Report of the Republic of Kazakhstan submitted in accordance with the Decision 1/СР.16 of the Conference of the Parties to the United Nations Framework Convention on Climate Change." United Nations
Greenhouse gas mitigation scenarios for major emitting countries
NewClimate Institute | November 2017 92
Framework Convention on Climate Change. Retrieved 28 July, 2016, from http://unfccc.int/files/national_reports/biennial_reports_and_iar/submitted_biennial_reports/application/pdf/br-text_eng_kz.pdf.
Ministry of Energy of the Republic of Kazakhstan. (2016). "The Second Biennial Report of the Republic of Kazakhstan CTF submission workbook,,." UNFCCC. Retrieved 28 July, 2016, from http://unfccc.int/files/national_reports/biennial_reports_and_iar/submitted_biennial_reports/application/pdf/kaz_2016_v2.0_resubmission.pdf.
Ministry of Environment. (2015). "Second stage of green tax implementation in 2016." Government of Chile. Retrieved 19 May, 2016, from http://portal.mma.gob.cl/en-2016-comienza-segunda-etapa-de-implementacion-de-impuestos-verdes/.
Ministry of Environment. (2016). "National Action Plan of Climate Change (2017-2022)." Government of Chile. from http://portal.mma.gob.cl/wp-content/uploads/2016/04/Anteproyecto-PANCC-2017-2022-FINAL-2016-04-18.pdf.
Ministry of Environment and Sustainable Development. (2016). "National Plan for Adaptation to Climate Change." Retrieved 4 August, 2016, from https://www.minambiente.gov.co/images/cambioclimatico/pdf/Plan_nacional_de_adaptacion/1._Plan_Nacional_de_Adaptación_al_Cambio_Climático.pdf.
Ministry of Environment and Urbanization (2010). Climate Change Strategy 2010-2020. Ankara, Ministry of Environment and Urbanization.
Ministry of Environment and Urbanization (2011). National Climate Change Action Plan. Ankara, Ministry of Environment and Urbanization.
Ministry of Environment and water resources of the Republic of Kazakhstan. (2013). "The III-VI National Communication of the Republic of Kazakhstan to the UN Framework Convention on Climate Change." Ministry of Environment and water resources of the Republic of Kazakhstan, United Nations Development Program in Kazakhstan, Global Environment Facility. Retrieved 4 August, 2016, from http://unfccc.int/files/national_reports/annex_i_natcom_/application/pdf/kaz_nc3,4,5,6_eng.pdf.
Ministry of External Relations. (2016). "Convention of UN against desertification –CNULD-." Retrieved 4 August, 2016, from http://www.ideam.gov.co/documents/11769/153422/20121210_Convención_Naciones_Unidas_Lucha_contra_Desertificación_Cancilleria.pdf/b8332e85-6719-4bbf-b7eb-56c6722bb249.
Ministry of Mines and Energy (2012). Plano Decenal de Expansão de Energia 2020. Brasília, Brazil, Ministério de Minas e Energia, Empresa de Pesquisa Energética.
Ministry of the Environment and Sustainable Development. (2015). "Inventario general de GEIs en Argentina." Retrieved 4 August, 2016, from http://ambiente.gob.ar/tercera-comunicacion-nacional/
Ministry of Trade, I. a. E., , (2015). The 7th Basic Plan for Long-term Electricity Supply and Demand (2015 – 2029). MOTIE Notice #2015-403, July 24, 2015. Seoul, Republic of Korea, Ministry of Trade, Industry and Energy.
MNRE (2009). National Policy on Biofuels. http://mnre.gov.in/file-manager/UserFiles/biofuel_policy.pdf, Ministry of New and Renewable Energy, Government of India.
N.C. Clean Energy Technology Cente (2016). Database of State Incentives for Renewables & Efficiency - DSIRE. Retrieved April 10, 2016, from http://www.dsireusa.org/.
Nachmany, M., S. Fankhauser, J. Davidová, N. Kingsmill, T. Landesman, H. Roppongi, P. Schleifer, J. Setzer, A. Sharman, C. Stolle Singleton, J. Sundaresan and T. Townshend (2015). Climate change legislation in Russia. An excerpt from The 2015 Global Climate Legislation Study - A Review of Climate Change Legislation in 99 Countries. Retrieved from http://www.lse.ac.uk/GranthamInstitute/wp-content/uploads/2015/05/RUSSIA.pdf.
NAMA Facility. (2016). "Projects: Colombia Transit-oriented Development (TOD)." Retrieved 4 August, 2016, from http://www.nama-facility.org/projects/colombia-i.html.
National Economic and Social Development Board of the Kingdom of Thailand. (2012). "The Eleventh National Economic and Social Development Plan (2012-2016)." Retrieved 4 August, 2016, from http://portal.mrcmekong.org/assets/documents/Thai-Law/11th-National-Economic-and-Social-Development-Plan-2012-2016.pdf.
National Environmental Commission. (2010). "National Climate Change Action Plan 2008-2012." from http://www.mma.gob.cl/1304/articles-49744_Plan_02.pdf.
National Forest Corporation and Ministry of Agriculture. (2012). "Law 20.283 on native forest recovery and forestry development. ." from http://www.conaf.cl/wp-content/files_mf/1368741650LibroLey_Bosque_NativoReglamentos.pdf.
Greenhouse gas mitigation scenarios for major emitting countries
NewClimate Institute | November 2017 93
National Planning Commission (2012). Our future - make it work. National Development Plan 2030 - Executive Summary, National Planning Commission, Republic of South Africa.
NCCS (2013). "National Climate Change Strategy. 10-20-40 Vision. Mexico: Federal Government of Mexico."
NewClimate Institute. (2016). "Climate Policy Database." Retrieved 10 April, 2016, from http://www.climatepolicydatabase.org.
OECD (2013). Australia. Taxing Energy Use: A Graphical Analysis. http://www.keepeek.com/Digital-Asset-Management/oecd/taxation/taxing-energy-use/australia_9789264183933-5-en#page1, OECD Publishing.
Office of Natural Resources and Environmental Policy and Planning of the Kingdom of Thailand. (2015a). "Thailand’s First Biennial Update Report under the United Nations Framework Convention on Climate Change." Retrieved 4 August, 2016, from http://unfccc.int/resource/docs/natc/thabur1.pdf.
Office of Natural Resources and Environmental Policy and Planning of the Kingdom of Thailand (2015b). Thailand’s Intended Nationally Determined Contribution (INDC). Bangkok, Thailand: http://www4.unfccc.int/Submissions/INDC/Published%20Documents/Thailand/1/Thailand_INDC.pdf., Office of Natural Resources and Environmental Policy and Planning. .
Peters, G. (2017). "Have Chinese CO2 emissions really peaked?" Climate Home. Retrieved 20 August, 2017, from http://www.climatechangenews.com/2017/03/31/chinese-co2-emissions-really-peaked/.
Philippine Institute for Development Studies. (2014). "Cost Efficiency and Effectiveness of the Sitio and Household Electrification Program. Good governance dialogues: A forum on open government and the national budget Environment." Retrieved 27 May, 2016, from http://www.gov.ph/governance/wp-content/uploads/2015/04/ZBB-Electrification-Open-Govt-Forum.pdf.
Planning Commission Government of India (2011). Low Carbon Strategies for Inclusive Growth: An Interim Report. Interim Report of the Expert Group on Low Carbon Strategies for Inclusive Growth, New Delhi, India, http://moef.nic.in/downloads/public-information/Interim%20Report%20of%20the%20Expert%20Group.pdf.
Planning Commission Government of India (2014). The Final Report of the Expert Group on Low Carbon Strategies for Inclusive Growth. Interim Report of the Expert Group on Low Carbon Strategies for Inclusive Growth, New Delhi, India, http://planningcommission.nic.in/reports/genrep/rep_carbon2005.pdf.
PRODES. (2016). "Monitoramento da Floresta Amazônica Brasileira por Satélite." Retrieved 28 August, 2017, from http://www.obt.inpe.br/OBT/assuntos/programas/amazonia/prodes.
REDD-PAC Brazil (2015). Modelling Land Use Changes in Brazil: 2000-2050, http://www.redd-pac.org/reports/lucc_brazil_folder.pdf.
REDD-PAC DRC (2016). Modelling Future Land Use Changes in the Democratic Republic of Congo: 2000-2030. http://redd-pac.org/reports/DRC-E.pdf, REDD-PAC.
Republic of Indonesia (2016a). First Nationally Determined Contribution. Republic of Indonesia, Jakarta, Government of Indonesia.
Republic of Indonesia. (2016b). "Indonesia first Biennial Update Report (BUR) under the United Nations Framework Convention on Climate Change. ." Retrieved 31 July, 2017, from http://unfccc.int/resource/docs/natc/idnbur1.pdf.
Republic of Indonesia (2016c). Rencana usaha penyediaan tenaga listrik pt perusahaan listrik negara (persero) tahun 2016 S.D. 2025. Jakarta, Indonesia, Menteri energi dan sumber daya mineral Republik Indonesia.
Republic of Kazakhstan. (2009). "Law of the Republic of Kazakhstan About Support of Use of Renewable Sources of Energy." Retrieved 1 August, 2016, from http://www.windenergy.kz/files/1236749650_file.pdf.
Republic of Kazakhstan. (2012). "Law of the Republic of Kazakhstan About energy saving and energy efficiency raise (No. 541-IV)." CIS-Legislation. Retrieved 1 August, 2016, from http://cis-legislation.com/document.fwx?rgn=53341.
Republic of Korea (2012). Korea’s Third National Communication under the United Nations Framework Convention on Climate Change. Low Carbon, Green Growth. Government of South Korea, Available at: http://unfccc.int/resource/docs/natc/kornc3.pdf
Republic of Korea (2014). First Biennial Update Report of the Republic of Korea, Seoul, South Korea: Greenhouse Gas Inventory & Research Center of Korea. Available at: http://unfccc.int/resource/docs/natc/rkorbur1.pdf.
Republic of Korea. (2015). "Intended Nationally Determined Contribution." UNFCCC. Retrieved 2016, 1 November, from
Republic of Korea. (2016). "Submission by the Republic of Korea: Intended Nationally Determined Contribution." UNFCCC. Retrieved 28 July, 2017, from http://www4.unfccc.int/ndcregistry/PublishedDocuments/Republic%20of%20Korea%20First/INDC%20Submission%20by%20the%20Republic%20of%20Korea%20on%20June%2030.pdf.
Republic of South Africa. (2015). "South Africa’s Intended Nationally Determined Contribution (INDC)." UNFCCC. Retrieved 12 July, 2016, from http://www4.unfccc.int/submissions/INDC/Published%20Documents/South%20Africa/1/South%20Africa.pdf.
Republic of Turkey Ministry of Environment and Urbanization (2016). Sixth National Communication of Turkey. Ankara, Turkey.
Roelfsema, M., M. G. J. den Elzen, N. Höhne, A. F. Hof, N. Braun, H. Fekete, R. Brandsma, J. Larkin and H. Böttcher (2014). Are major economies on track to achieve their pledges for 2020? An assessment of domestic climate and energy policies. Energy Policy. 67: 781-796.
Schinke, B. and J. Klawitter. (2016). "Background Paper: Country Fact Sheet Morocco. Energy and Development at a glance 2016. Middle East North Africa Sustainable ELECtricity Trajectories (MENA-SELECT)." Retrieved 4 August, 2016, from https://www.bicc.de/fileadmin/Dateien/pdf/press/2016/Country_Fact_Sheet_Morocco_Background.pdf.
Scott, E. (2015). "Renewable energy target slashed, wind farm commissioner to be established " The Sydney Morning Herald. Retrieved 3 November, 2016, from http://www.smh.com.au/environment/energy-smart/renewable-energy-target-slashed-wind-farm-commissioner-to-be-established-20150623-ghvxl3.html.
SEEG. (2017). "The System Study Greenhouse Gas Emissions Estimates (SEEG). ." Retrieved 21 July, 2017, from http://seeg.eco.br/en/.
Skalský, R., Z. Tarasovičová, J. Balkovič, E. Schmid, M. Fuchs, E. Moltchanova, G. Kindermann and P. Scholtz (2008). "Geo-bene global database for bio-physical modeling v. 1.0. Concepts, methodologies and data." The GEO-BENE database report.
State Agency on Energy Efficiency and Energy Saving of Ukraine. (2014). "National Action Plan for Renewable Energy up to 2020." Retrieved 1 June, 2016, from http://saee.gov.ua/en/documents.
State Council. (2015). "Made in China 2025(中国制造2025). Published 8 May, 2015.
http://www.gov.cn/zhengce/content/2015-05/19/content_9784.htm." Stehfest, E., D. P. Van Vuuren, T. Kram and L. Bouwman (2014). Integrated assessment of global
environmental change with IMAGE 3.0. Model description and policy applications. The Hague, PBL Netherlands Environmental Assessment Agency. Available via http://www.pbl.nl/sites/default/files/cms/PBL-2014-Integrated_Assessment_of_Global_Environmental_Change_with_IMAGE_30-735.pdf.
Supreme Council of Ukraine. (2015). "Law of Ukraine on Alternative Fuels." Retrieved 31 May, 2016, from http://zakon1.rada.gov.ua/laws/show/1391-14.
The London School of Economics and Political Science. (2015). "The Global Climate Legislation Study. Grantham Research Institute on Climate Change and Environment." Retrieved 27 May, 2016, from http://www.lse.ac.uk/GranthamInstitute/legislation/countries/philippines/.
The People’s Republic of China (2012). The second national communication on climate change of the People's Republic of China., National Development and Reform Commission, http://unfccc.int/resource/docs/natc/chnnc2e.pdf.
The People’s Republic of China (2014a). Energy Development Strategy Action Plan (2014 – 2020). http://www.gov.cn/zhengce/content/2014-11/19/content_9222.htm.
The People’s Republic of China (2014b). National Action Plan on Climate Change (2014 – 2020), http://www.sdpc.gov.cn/gzdt/201411/W020141104591413713551.pdf.
The Representative of the United States of America to the United Nations (2017). Reference: C.N.464.2017.TREATIES-XXVII.7.d (Depositary Notification). United Nations, https://treaties.un.org/doc/Publication/CN/2017/CN.464.2017-Eng.pdf
U.S. Department of State (2016). 2016 second biennial report of the United States of America, Under the United Nations Framework Convention on Climate Change, US Department of State, Washington, DC, https://unfccc.int/files/national_reports/biennial_reports_and_iar/submitted_biennial_reports/application/pdf/2016_second_biennial_report_of_the_united_states_.pdf.
Greenhouse gas mitigation scenarios for major emitting countries
NewClimate Institute | November 2017 95
UN DESA. (2015). "World Population Prospects, the 2015 Revision." United Nations - Department of Economic and Social Affairs. Retrieved 2 November, 2016, from https://esa.un.org/unpd/wpp/.
UNEP. (2015). "The Emissions Gap Report 2015: A UNEP Synthesis Report." from http://www.unep.org/emissionsgapreport2015/.
UNFCCC (2015a). Adoption of the Paris Agreement. Proposal by the President. Draft decision -/CP.21. Conference of the Parties. Twenty-first session, Paris, 30 November to 11 December 2015, FCCC/CP/2015/L.9/Rev.1, United Nations Framework Convention on Climate Change.
UNFCCC. (2017a). "Greenhouse Gas Inventory Data - Detailed data by Party." Retrieved 31 July, 2017, from http://di.unfccc.int/detailed_data_by_party
UNFCCC. (2017b). "National Inventory Submissions 2017. Common Reporting Format." UNFCCC. Retrieved 28 July, 2017, from http://unfccc.int/national_reports/annex_i_ghg_inventories/national_inventories_submissions/items/10116.php.
UNFCCC. (2017c). "Submitted Biennial Update Reports (BURs) from Non-Annex I Parties." United Nations Framework Convention on Climate Change. Retrieved 30 August, 2017, from http://unfccc.int/national_reports/non-annex_i_natcom/reporting_on_climate_change/items/8722.php.
UNFCCC. (2017d). "Submitted National Communications from Non-Annex I Parties." United Nations Framework Convention on Climate Change. Retrieved 11 September, 2017, from http://unfccc.int/national_reports/non-annex_i_natcom/items/10124.php.
UNFCCC. (2017e). "Time Series - Annex I." United Nations Framework Convention on Climate Change. Retrieved 11 September, 2017, from http://di.unfccc.int/time_series.
United States of America (2014). Sixth National Communication of the Unites States of America: First Biennial Report of the United States of America. First Biennial Report of the United States of America., http://unfccc.int/national_reports/non-annex_i_natcom/reporting_on_climate_change/items/8722.php.
United States of America (2015). U.S. Cover Note, INDC and Accompanying Information. Retrieved April 10, 2016, from http://www4.unfccc.int/submissions/INDC/Published Documents/United States of America/1/U.S. Cover Note INDC and Accompanying Information.pdf.
US EPA. (2012). "Global Anthropogenic Non-CO2 Greenhouse Gas Emissions: 1990-2030: Revised Version 2012." Office of Atmospheric Programs Climate Change Division, U.S. Environmental Protection Agency Retrieved 9 December, 2013, from http://www.epa.gov/climatechange/Downloads/EPAactivities/EPA_Global_NonCO2_Projections_Dec2012.pdf.
Van Vuuren, D., B. Van Ruijven, B. Girod, V. Daioglou, O. Edelenbosch and S. Deetman (2014). Energy Supply and Demand. Integrated Assessment of Global Environmental Change with IMAGE 3.0 - Model description and policy applications. E. Stehfest, D. Van Vuuren, T. Kram and L. Bouwman. The Hague, PBL: 71-152.
van Vuuren, D. P., E. Stehfest, D. Gernaat, J. Doelman, M. van den Berg, M. Harmsen, H. S. de Boer, L. Bouwman, V. Daioglou, O. Edelenbosch, B. Girod, T. Kram, L. Lassaletta, P. Lucas, H. van Meijl, C. Müller, B. van Ruijven, S. van der Sluis and A. Tabeau (2017). "Energy, land-use and greenhouse gas emissions trajectories under a green growth paradigm." Global Environmental Change 42: 237-250.
van Vuuren, D. P., B. van Ruijven, M. Hoogwijk, M. Isaac and H. J. M. de Vries (2006). TIMER 2.0: Model description and application. Integrated modelling of global environmental change. An overview of IMAGE 2.4. A. F. Bouwman, T. Kram and K. Klein Goldewijk. Bilthoven, the Netherlands, Netherlands Environmental Assessment Agency (MNP).
WRI. (2016). "CAIT Indonesia Climate Data Explorer - PINDAI." Retrieved 31 October, 2016, from http://cait.wri.org/indonesia?lng=en.
WRI. (2017). "Paris Agreement Tracker." 2017, from http://cait.wri.org/indc/#/ratification.
Greenhouse gas mitigation scenarios for major emitting countries
NewClimate Institute | November 2017 96
Greenhouse gas mitigation scenarios for major emitting countries
NewClimate Institute | November 2017 I
Appendix
A1: Harmonisation of GHG emissions projections under current
policies to the historical emissions data
The GHG emissions projections under current policies from NewClimate Institute, PBL and IIASA were
all harmonised to the historical emissions dataset presented in A1 by applying a constant offset value
(i.e. the difference in emissions of the two datasets in the harmonisation year) to the entire emission
pathway. For Annex I countries, emissions projections were harmonised to 2015 historical emissions.
For non-Annex I countries, emissions projections were harmonised to 2010, with exceptions of China
(2012) and Brazil (2015).
A2: Quantification of 2020 pledges and (I)NDCs
As with the historical emissions data, AR4 GWPs are used for NDCs from Annex I Parties whereas SAR
GWPs are used for NDCs from non-Annex I Parties. Although it is preferable to convert all official NDC
values expressed in AR4 GWP terms into SAR GWP terms to allow for a fair comparison between
current policies emissions projections and NDC targets, this is not possible because most NDC
documents do not provide enough data on the breakdown of the target emissions by gas to allow for
such a conversion.
In this report, NewClimate Institute and PBL estimates of 2020 pledges and NDCs are quantified in SAR
GWP terms using either the historical emissions data presented in Table 2, BAU emissions projections
provided in the NDC, or other national submissions to the UNFCCC also expressed in SAR GWP terms.
For Annex I countries and Ethiopia, official NDC values (expressed in GWPs of choice by the Parties)
and the estimates from NewClimate Institute and PBL are presented side by side without harmonising
GWPs.
Methodology in more detail:
Target type
The mitigation components of the INDCs and NDCs represent several types of targets, as summarised
below (PBL, 2017):
1. Base year target: economy-wide absolute reduction from historical base year emissions.
INDCs/NDCs report on an absolute reduction from historical base year emissions. The base
year chosen varies, with 1990, 2005 and 2010 being the most common. This category covers
from the selected 25 countries of this report: Australia, Brazil, Canada, the European Union,
Japan, Kazakhstan, the Russian Federation, Ukraine, and the United States.
2. Baseline or BAU target: emission reductions relative to a baseline or business-as-usual
projection (specified in the INDCs/NDCs). The mitigation component of the INDCs/NDCs
specifies the business-as-usual emission projection. The type of emission reduction relative to
a baseline or business-as-usual projection has been chosen for many INDCs/NDCs, and in this
report for: Argentina, Colombia, Democratic Republic of the Congo, Indonesia, Mexico,
Morocco, Republic of Korea, Thailand and Turkey.
3. Baseline or BAU target (not specified): emission reductions relative to a baseline projection
(not specified). Same as under point 2, but here, for the INDCs/NDCs, baseline or business-as-
usual emission projections are not specified, such as for those of the Philippines and Saudi
Arabia. For the calculations, we used the baseline projections from national studies (when
available) and the PBL business-as-usual projections.
Greenhouse gas mitigation scenarios for major emitting countries
NewClimate Institute | November 2017 II
For Saudi Arabia, we assumed a baseline based on recent national CO2 emissions
projections (King Abdullah University of Science and Technology 2014).
4. Intensity target: emission reductions relative to GDP as the main type of mitigation. Chile is
the only country that falls in this category.
5. Intensity and non-GHG target: emission intensity target and non-GHG target. China and India
aim for emission intensity improvements, a target for non-fossil fuels in primary energy
consumption/power capacity, and for China, a target year for the peaking of emissions.
6. Trajectory and fixed-level target: South Africa has a trajectory target stating the emission
ranges for 2025 and 2030. Several countries, such as Ethiopia, put forward a fixed-level target,
specifying the MtCO2e that they intend not to exceed in a given year.
7. Submitted actions (cannot be quantified): finally, many countries include mere qualitative
descriptions of mitigation actions in their INDCs/NDCs, or specific targets for sub-sectors, such
as for the implementation of renewable energy. As such targets complicate a precise
quantification, we have not analysed them here. This group of countries covers about 6% of the
global emissions of 2010, and none of the selected countries.
The calculation of the NDC projection for the countries for all groups except group 5 is straightforward.
China and India are the only G20 economies from group 5 that have proposed a combination of targets,
which are less straightforward in the calculation, and highly depend on model parameterization. The
targets include non-fossil energy targets, forest targets, and emission intensity targets (i.e.,
improvements of the ratio of emissions to GDP). For the PBL calculations, their combined effect was
calculated using the PBL TIMER energy model (Van Vuuren et al. 2014) for energy- and industry-related
emissions and the IIASA GLOBIOM/G4M land use model (Havlík et al. 2014) for the land use, land-use
change and forestry (LULUCF) emissions (see den Elzen et al. 2016a, and for further details for China,
den Elzen et al. 2016b). The NDC projection for China of PBL is also harmonised to 2012 emissions,
which leads to a higher projection. For NewClimate calculations, we refer to Climate Action Tracker
(CAT 2017).
Accounting method chosen for quantification
Table A-1 provides an overview of how the NDC targets have been quantified and lists them by the
accounting method which we have assumed. Most of the analysed countries report emission target
levels that include removals from activities related to the LULUCF sector. Although there are
uncertainties concerning which accounting approaches and methodologies countries will apply to
account for LULUCF related emissions and removals, we assume that a majority of countries will apply
the net-net accounting approach3 (den Elzen et al. 2016a).
This report identified three countries that apply the gross-net accounting approach4 (Chile, Japan and
Russian Federation). These countries expect the LULUCF sector to be net carbon sink in the target
year, thus treating the LULUCF sector as a source of carbon credits. For these countries, our NDC
target estimates account for the expected amount of carbon credits.
For countries that explicitly mentioned in their NDCs that emissions and removals from the LULUCF
sector are excluded, the LULUCF sector is excluded from the calculation of the NDC target (Republic
of Korea, the Philippines, Saudi Arabia and Thailand). There are also countries that state that emissions
and removals from the LULUCF sector is included in their NDC, but refrain from specifying how exactly
3 In this approach, activities are accounted using the reported net emissions in each year of the accounting period
minus the net emissions in the base year. In the situation where the net emissions have decreased, a country may issue credits (i.e. removal units, or RMUs) and if net emissions have increased, it must cancel units (i.e. take on debits). The net-net LULUCF accounting method implies that credits and debits from the LULUCF sector are treated in the same way as any other GHG inventory sector, where emissions are compared to those in the base year. 4 In this approach the actual reported net emissions (or removals) in each year of the commitment period is
accounted for without comparing the estimates with a base year.
Greenhouse gas mitigation scenarios for major emitting countries
NewClimate Institute | November 2017 III
to include them in the NDC calculations (Canada and the European Union). For these two sets of
countries we assumed neither accounting approaches and exclude the LULUCF sector from the
calculations of NDC target.
Table A-1: Overview of NDC configuration per country
Country Target type LULUCF
sector is
included
in the
NDC
Approach for NDC quantification by
authors
Reference
emissions
include
LULUCF
LULUCF
treated
separately
LULUCF
accounting
method applied
Argentina Baseline specified Yes Yes No Net-Net
Australia Base year Yes Yes No Net-Net
Brazil Base year Yes Yes No Net-Net
China Intensity and non-
GHG
Yes Yes No Net-Net
Colombia Baseline specified Yes Yes No Net-Net
DRC Baseline specified Yes Yes No Net-Net
Ethiopia Baseline specified Yes Yes No Net-Net
India Intensity and non-
GHG
Yes Yes No Net-Net
Indonesia Baseline specified Yes Yes No Net-Net
Kazakhstan Base year Yes Yes No Net-Net
Mexico Baseline specified Yes Yes No Net-Net
Morocco Baseline specified Yes Yes No Net-Net
South Africa Trajectory Yes Yes No Net-Net
Turkey Baseline specified Yes Yes No Net-Net
Ukraine Base year Yes Yes No Net-Net
USA Base year Yes Yes No Net-Net
Canada Base year Yes No No None
Republic of
Korea
Baseline specified No No No None
The
Philippines
Baseline not
specified
No No No None
Saudi Arabia Trajectory No No No None
Thailand Baseline specified No No No None
European
Union
Base year Yes No No None
Chile Intensity Yes No Yes Gross-net
Japan Base year Yes No Yes Gross-net
Russian
Federation
Base year Yes No Yes Gross-net
Greenhouse gas mitigation scenarios for major emitting countries
NewClimate Institute | November 2017 IV
A3: NewClimate Institute calculations (based on the Climate Action
Tracker analysis)
Current policies projections
The NewClimate Institute analysis follows the calculation steps used in the Climate Action Tracker (CAT
2017). The starting point for the calculation of current policies emissions projections is a publicly
available “baseline” policy scenario projections for economy-wide GHG emissions or energy-related CO2
emissions. For most countries, we use one of the sources below or a combination or two to show a
range:
• Most recent government submissions to the UNFCCC (e.g. National Communications,
Biennial Reports and Biennial Update Reports);
• Other national policy projections (government source);
• Projections from international organisations such as the International Energy Agency (IEA)
World Energy Outlook (WEO) and other internationally accredited research organisations and
think tanks.
The choice of a “baseline” scenario depends on a number of factors such as the coverage of policies
(determined partly by the publication year), detailedness of the projections and its description (sector,
gas, policies considered), and the reasonableness of key underlying assumptions (e.g. GDP and
population growth).
The IEA WEO projections on energy-CO2 emissions were used for several countries. The Current
Policies Scenario (CPS), which only considers policy measures implemented as of mid-publication year,
was used in most cases.
When a scenario with only energy-related CO2 emissions was used as basis, emissions projections for
other GHGs were gathered from various sources to ensure complete coverage of all emissions sources.
For non-CO2 GHG emissions, the US EPA report on global anthropogenic GHG emissions (2012) were
used for several countries. Projections for non-energy CO2 emissions are most often taken from national
governments’ submissions to the UNFCCC.
For all publicly available emissions projections we used for the analysis, we examined whether important
policies implemented to date and planned policies with a high degree of certainty of implementation in
the near future are included. If a recently implemented policy with a considerable expected mitigation
impact potential is not covered, the impact of that policy is accounted for by carrying out separate “add-
on” calculations based on the information from various sources. Moreover, where considered relevant,
strong implementation barriers such as for example political resistance or technical difficulties are taken
into account in projecting the effect of specific policies or targets, by assuming that only a fraction of the
target is achieved.
Methodology for specific policy instruments and targets
Current policies projections by NewClimate Institute include add-on mitigation impact calculations for
recently implemented policies. The calculation steps are policy specific; in some cases CO2 reduction
impact values estimated in external sources are applied directly to “baseline” scenarios for energy-
related CO2 emissions, whereas in other cases more detailed technical calculations are carried out.
However, below is a generic approach to different policy types:
Renewable energy targets: CO2 emissions reductions are calculated based on the energy balance
projections underlying the “baseline” scenario for energy-related CO2 emissions. A number of case-
specific assumptions are usually made on which fuels would be replaced by the increased renewable
energy production.
Greenhouse gas mitigation scenarios for major emitting countries
NewClimate Institute | November 2017 V
Vehicle fuel efficiency standards: A simplified stock turnover model is used for a number of countries.
Calculations were done using the underlying data from the Global Transportation Roadmap Model of
the International Council on Clean Transportation (ICCT 2012).
Building codes: as with vehicle fuel efficiency standards, a simplified stock turnover model is used for
the EU.
Emissions trading schemes: The targeted emission levels are applied to the sectors covered by the
scheme. Carbon price levels are not considered in the analysis.
Economic measures: Due to the limitation of bottom-up, spreadsheet-based calculations, NewClimate
calculations consider economic measures such as carbon tax, feed-in tariff scheme and subsidies only
if their mitigation impacts have already been quantified by other institutions.
Table A-2 presents the URLs and the posted dates of country assessment updates by the Climate Action
Tracker project.
Table A-2: Country assessments by Climate Action Tracker referenced in this report.
Country URL Date updated
Argentina climateactiontracker.org/countries/argentina/2017.html 9 May 2017
Australia climateactiontracker.org/countries/australia/2017.html 6 July 2017
Brazil climateactiontracker.org/countries/brazil/2017.html 17 May 2017
Canada climateactiontracker.org/countries/canada/2017.html 17 May 2017
Morocco, Republic of Korea, Russia Federation, Saudi Arabia, South Africa, Thailand, Turkey, United
States of America, and Ukraine), the G4M was calibrated to historical afforestation and deforestation
rates for the period of 2000-2010 as reported by the country to the 2015 FAO Forest Resources
Assessment (FAO FRA) (Keenan et al. 2015). The calibration is done in such a way that net forest area
change rate (afforestation rate minus deforestation rate) matches that of FAO FRA data. Additional
constraints were imposed on minimum afforestation rate, minimum deforestation rate and the trend of
net forest area change (a difference between 2000-2005 average net forest area change and 2005-
2010 average net forest area change).
Methodology for specific policy instruments and targets
Current policies projections by IIASA have been assessed for the specific country using the GLOBIOM
and/or the G4M model. The model that has been used to develop the projection for a specific county is
Greenhouse gas mitigation scenarios for major emitting countries
NewClimate Institute | November 2017 IX
specified in the country chapters. Below follows a generic description of the methodology used for
calculating the effect of the policies for the LULUCF sector. In general, climate policies are implemented
in GLOBIOM and G4M through a carbon tax or directly in the models by changing parameters or adding
constraints in such a way that a target is achieved.
Afforestation / Reforestation targets, i.e. an increase of the annual afforestation/reforestation rate by
X% or X hectares, can be prescribed in G4M using a carbon tax on the forest sector that directly
increases the annual afforestation/reforestation rate. The carbon tax is set at a level that leads to the
target level being reached the desired year.
Deforestation targets, i.e. a reduction of the annual deforestation rate by X% or X hectares, can be
prescribed in G4M using a carbon tax on the forest sector that directly reduced the annual deforestation
rate. The carbon tax is set at a level that leads to the target level being reached the desired year.
Forest area targets, i.e. an increase of the forest area by X% or X hectares, can be prescribed in G4M
using a carbon tax on the forest sector that reduced the annual deforestation rate and increases the
annual afforestation rate.
Harvest intensity targets, i.e. an increase of the forest harvest rate by X% or X m3, can be prescribed
in GLOBIOM or G4M applying constraints directly in the models.
Forest carbon stock targets, i.e. an increase of the forest carbon stock, or the current carbon sink, by
X% or X MtCO2e are implemented through a carbon tax in G4M on the forest sectorial emissions and
removals. The carbon tax is set at a level that leads to the target level being reached the desired year.
Emission reduction targets, i.e. a reduction of the net LULUCF emissions by X% or X MtCO2e are
implemented in GLOBIOM through a carbon tax on the emissions and removals from the LULUCF
sector, and in G4M through a carbon tax on the forest sectorial emissions and removals.
NewClimate – Institute for Climate Policy and Global Sustainability gGmbH
Cologne Office Berlin Office Am Hof 20-26 Brunnenstraße 195 50667 Cologne 10119 Berlin Germany Germany T +49 (0) 221 999833-00 E [email protected] F +49 (0) 221 999833-19 www.newclimate.org
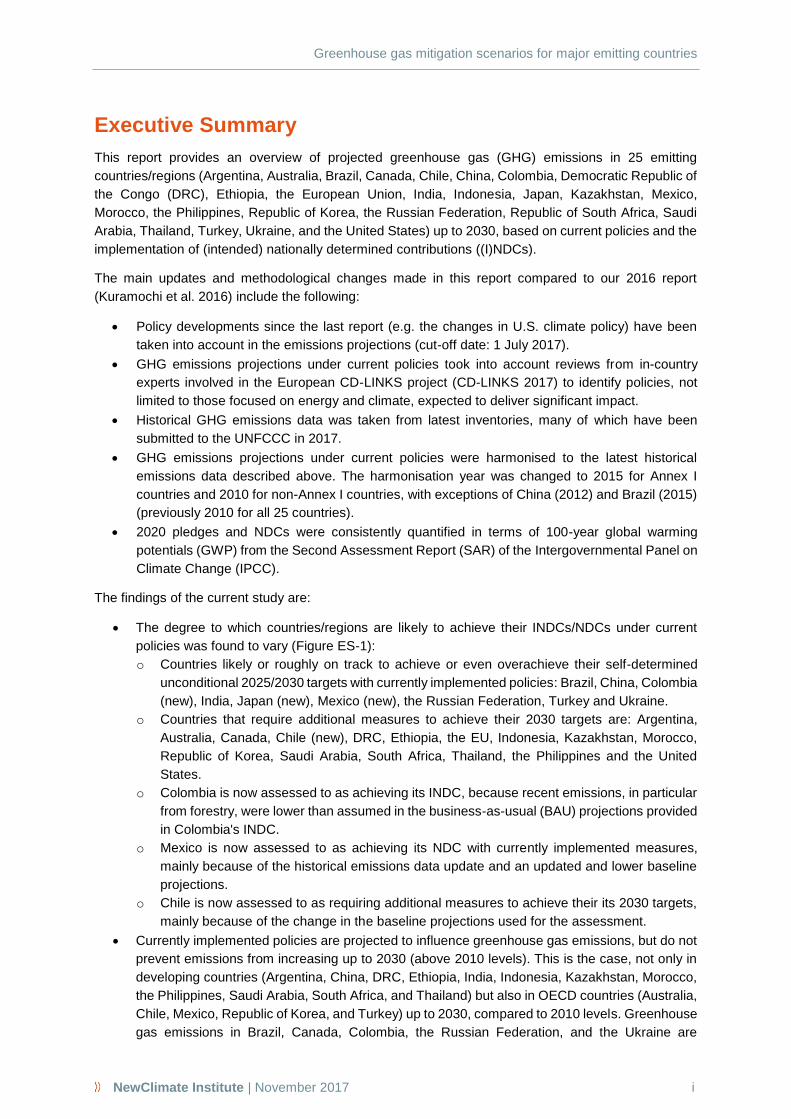

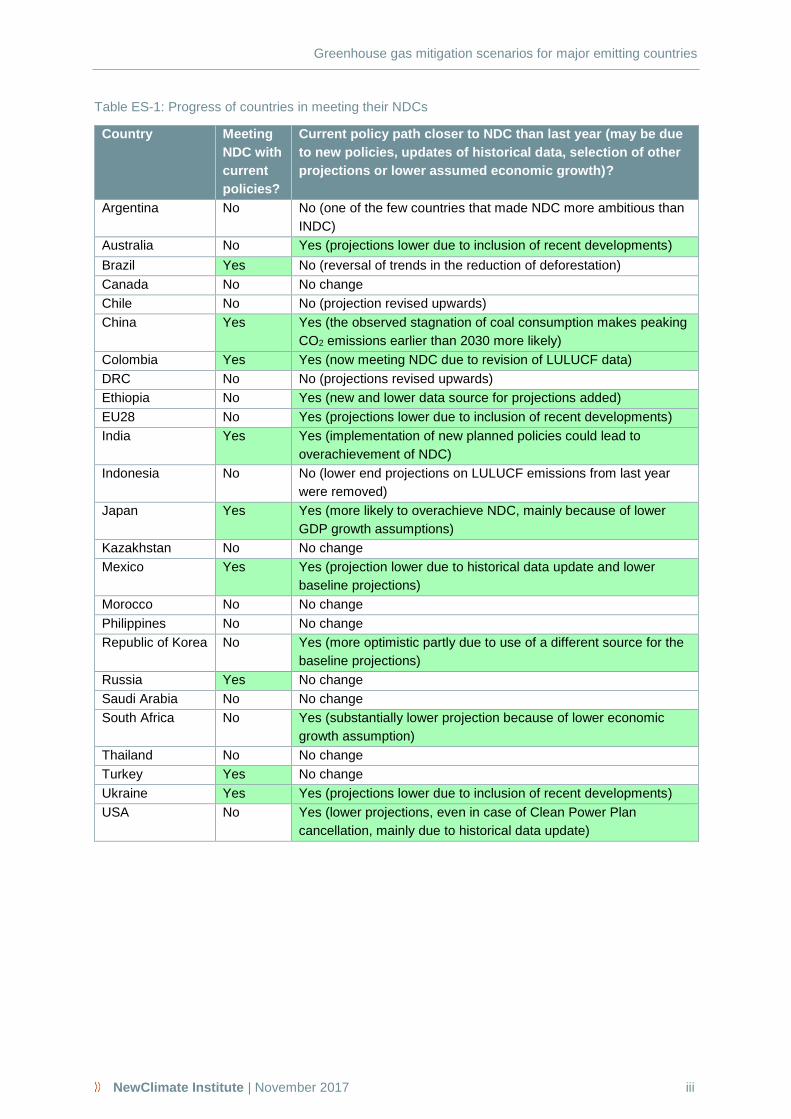
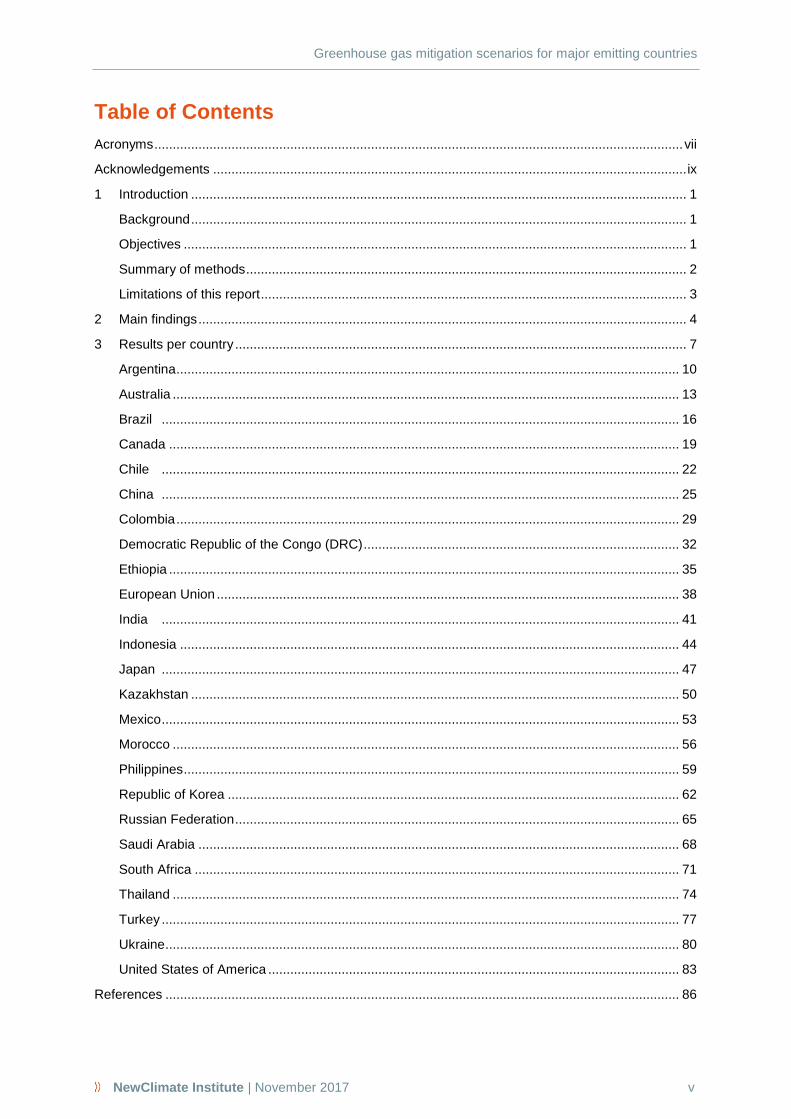


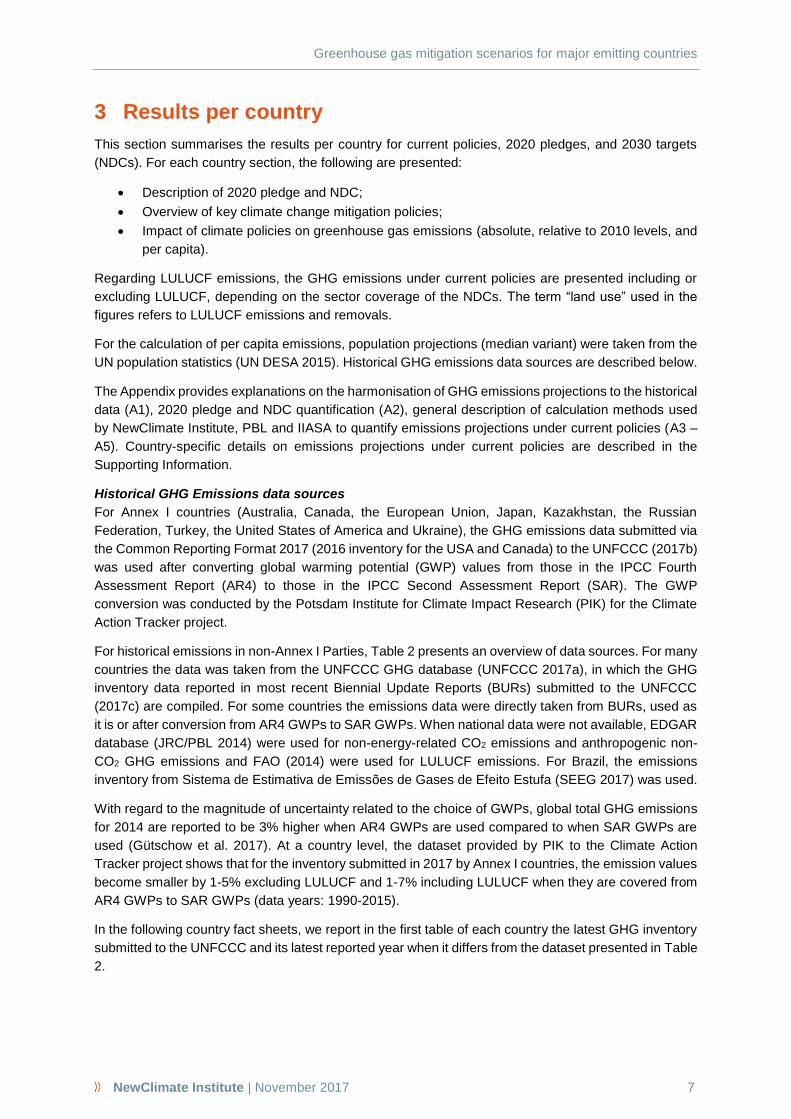
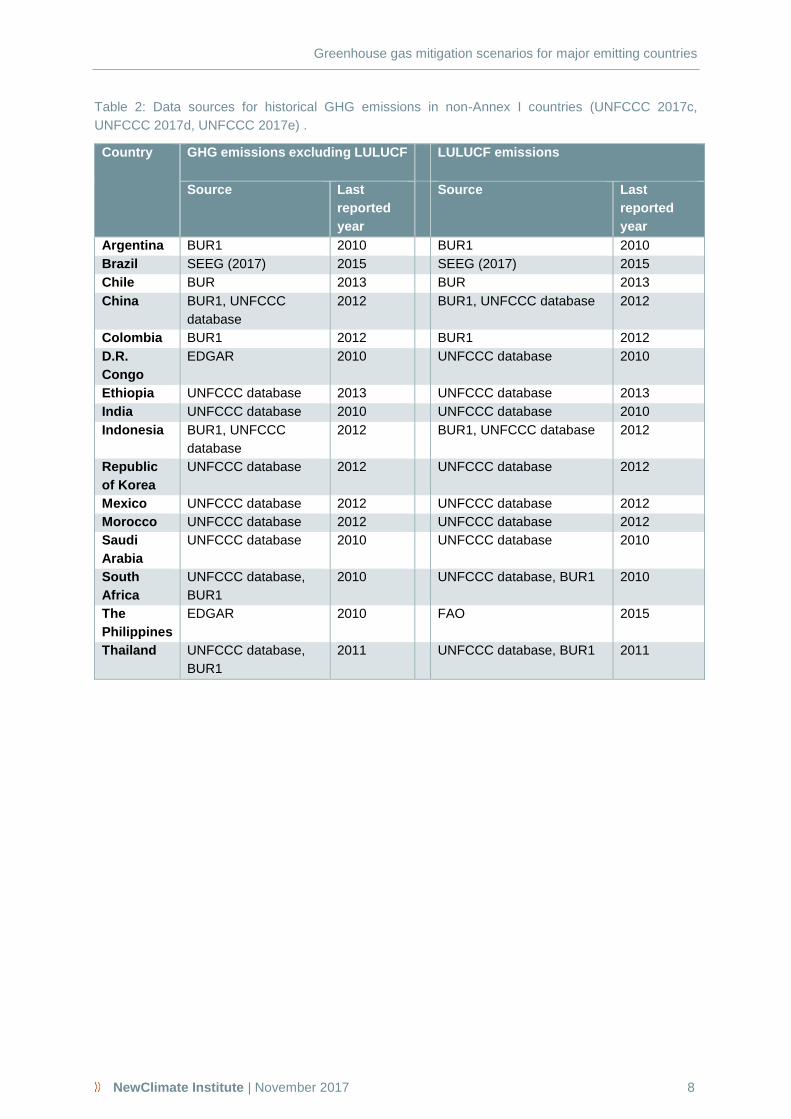


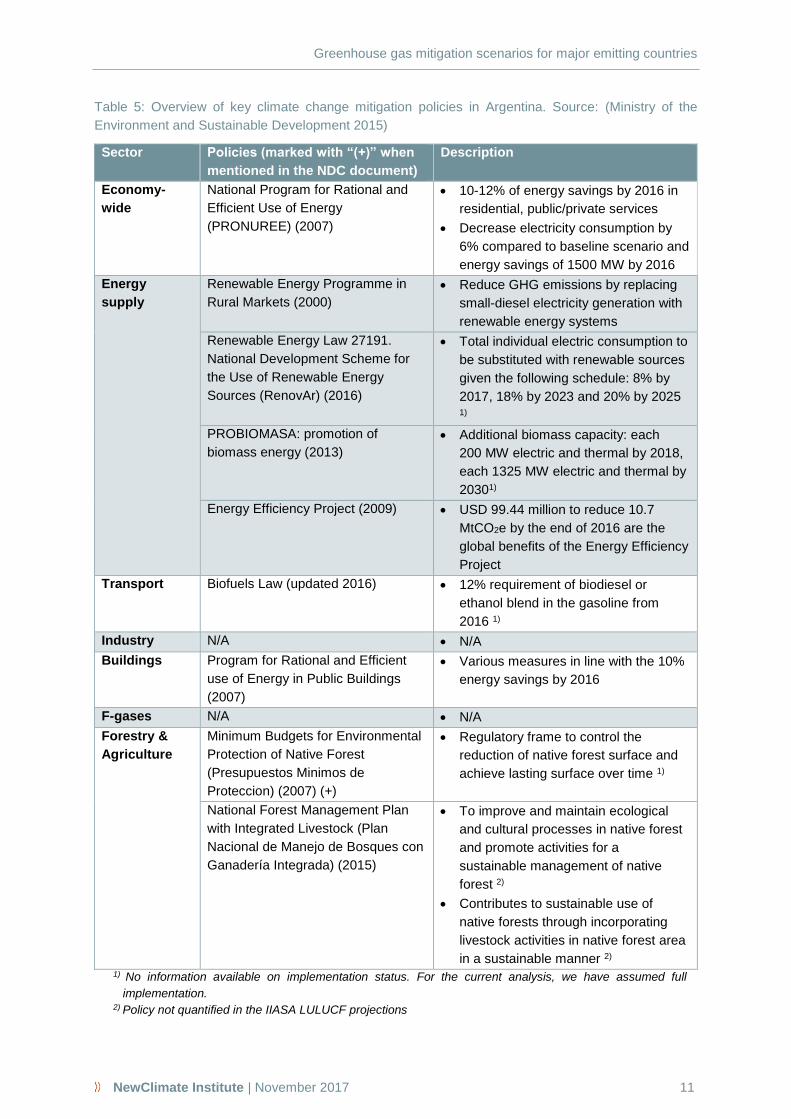
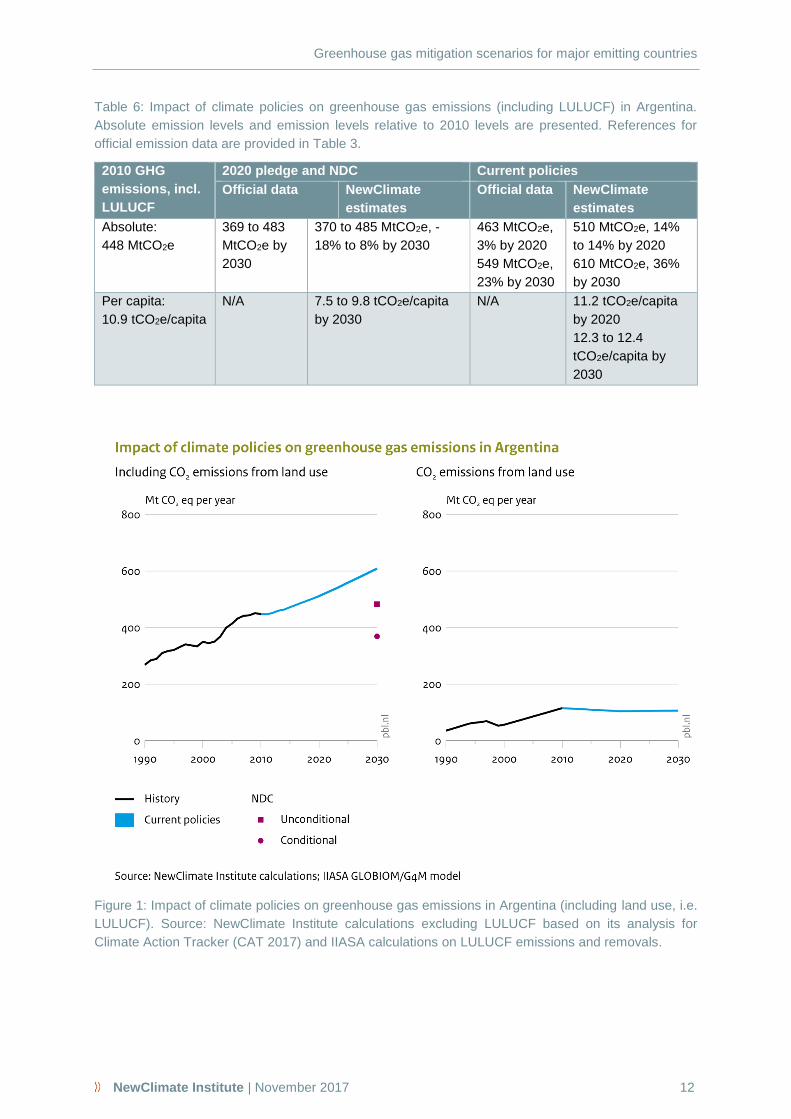
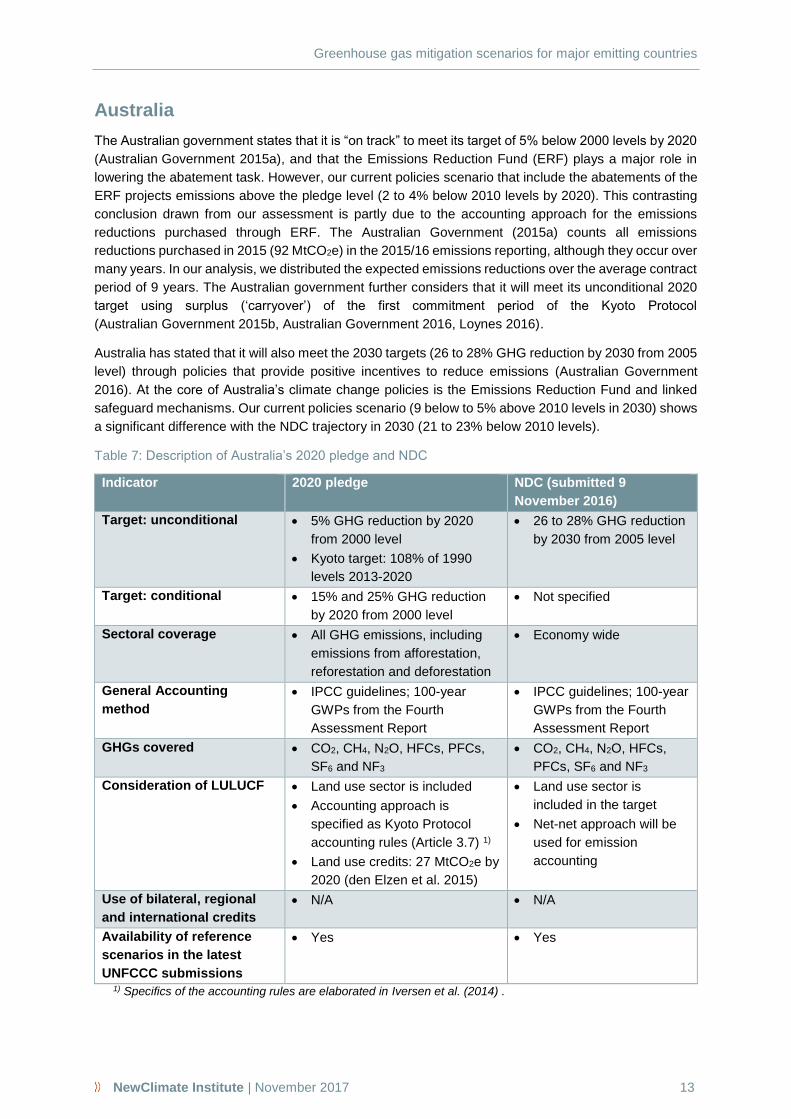


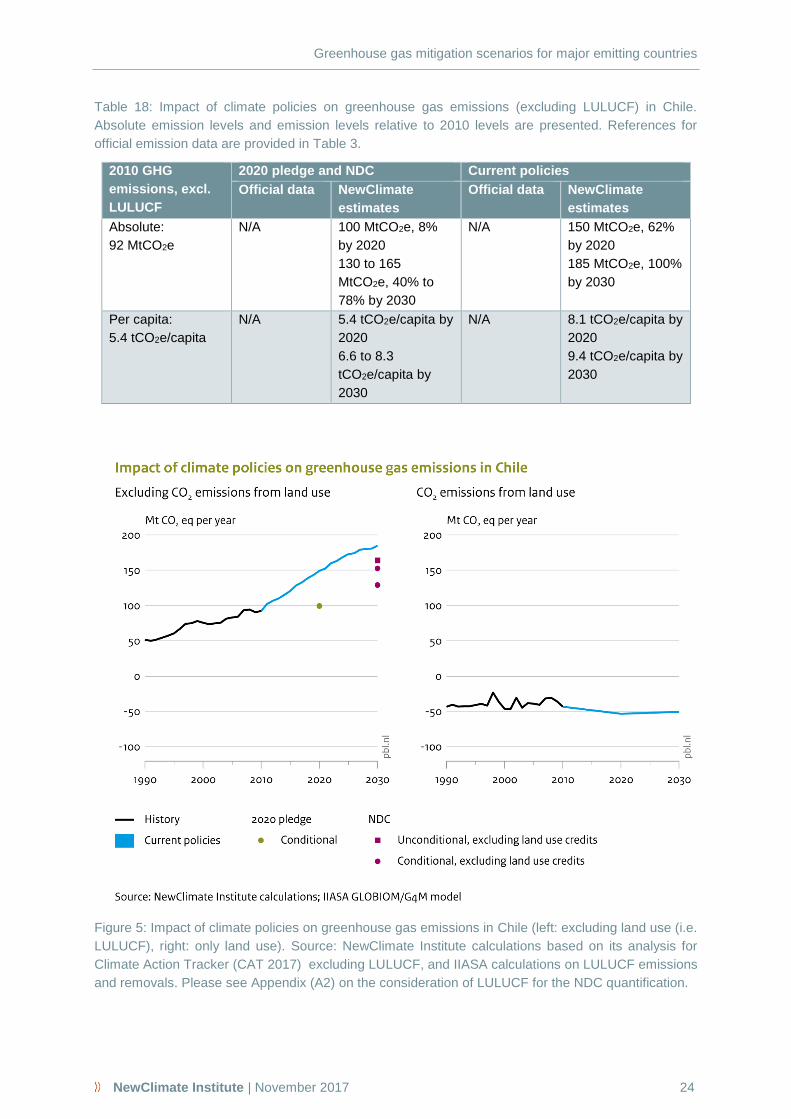
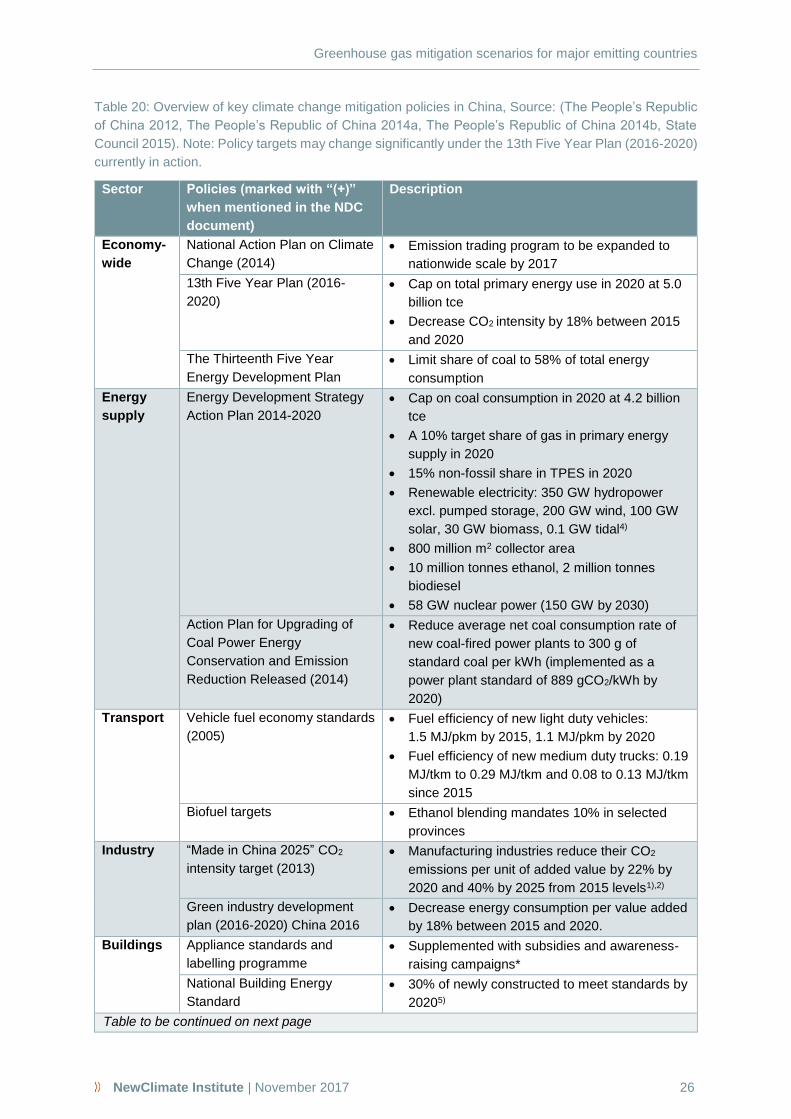


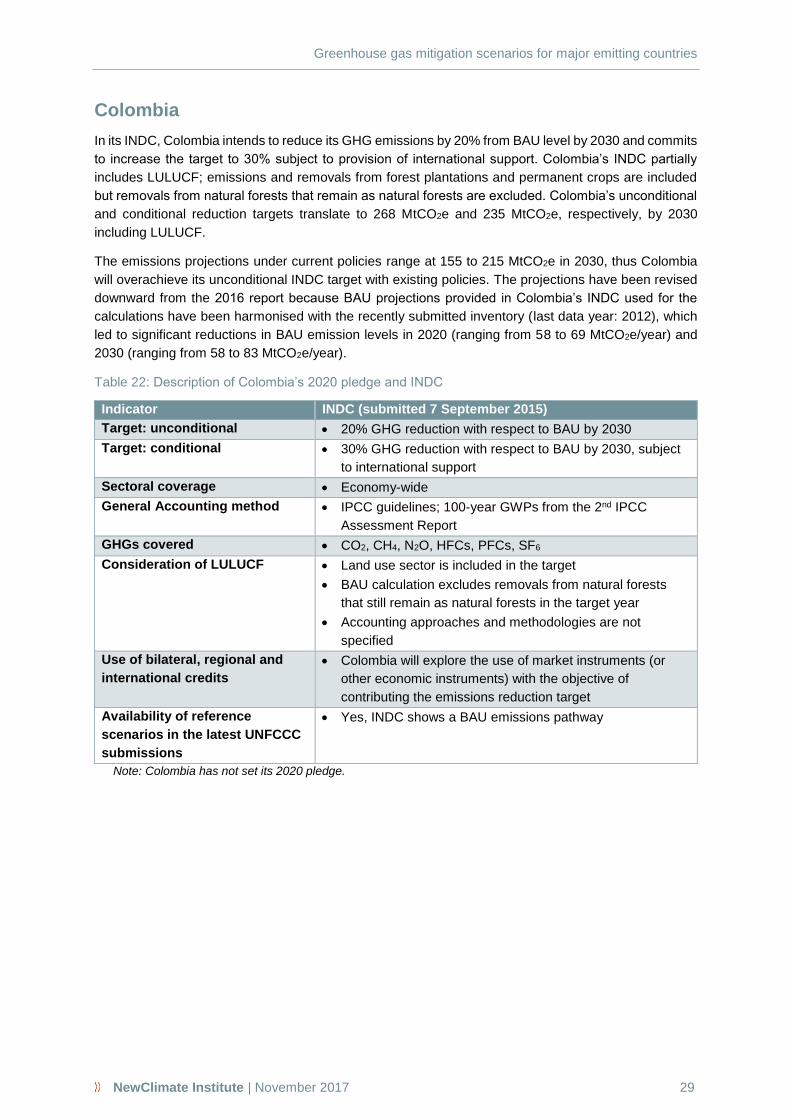
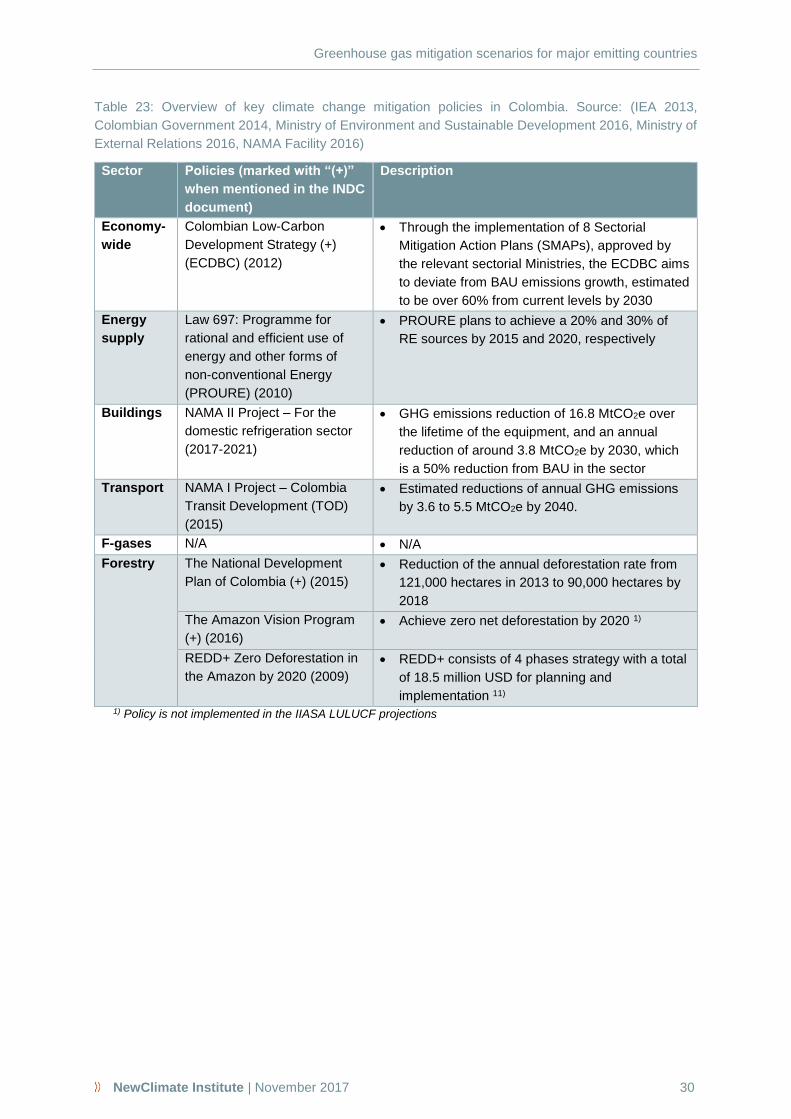

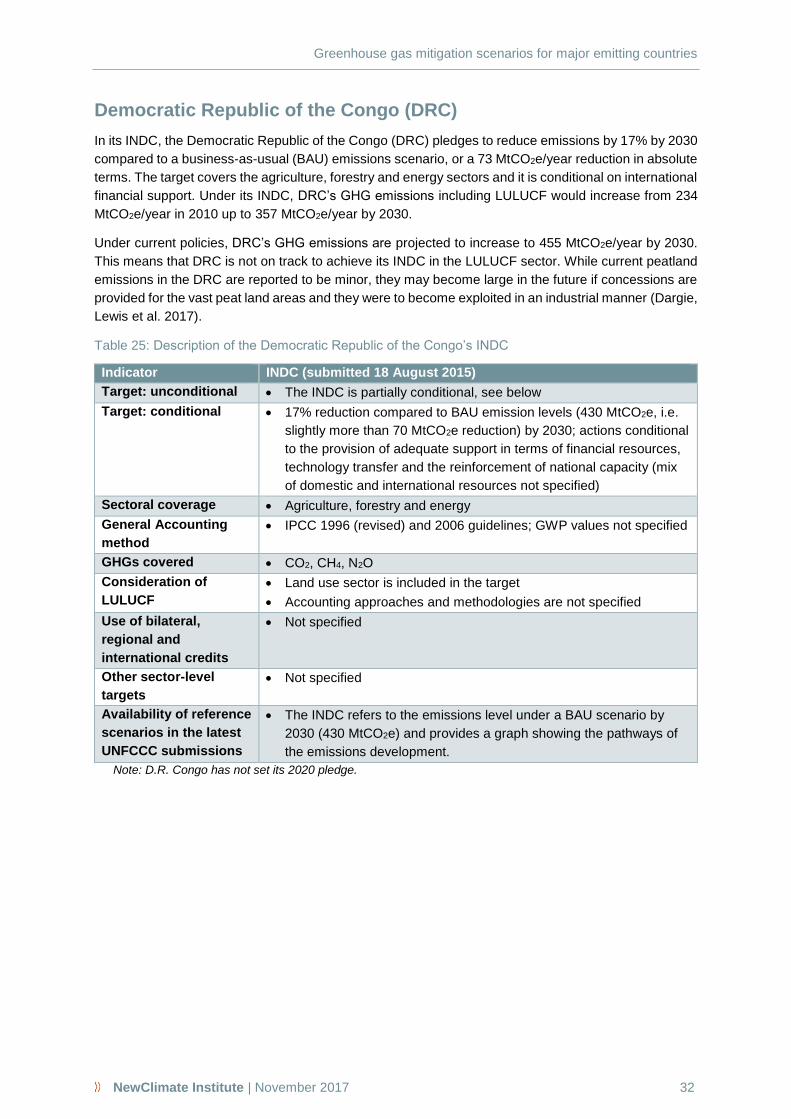


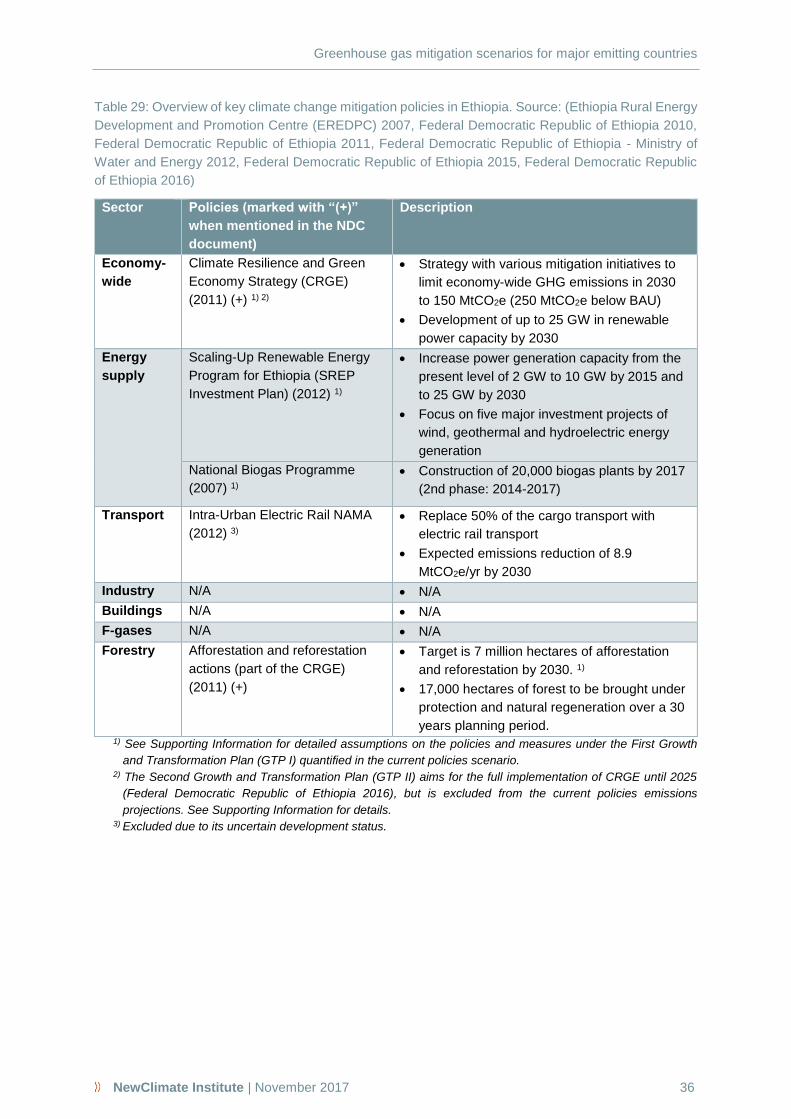
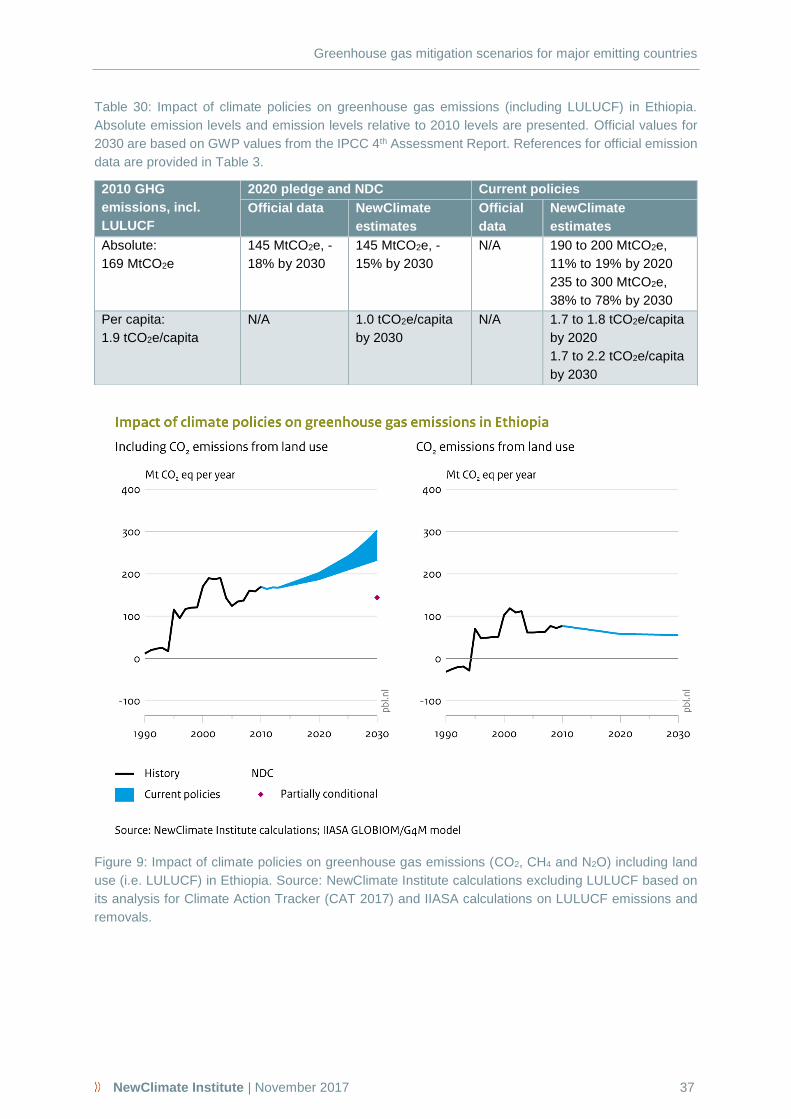


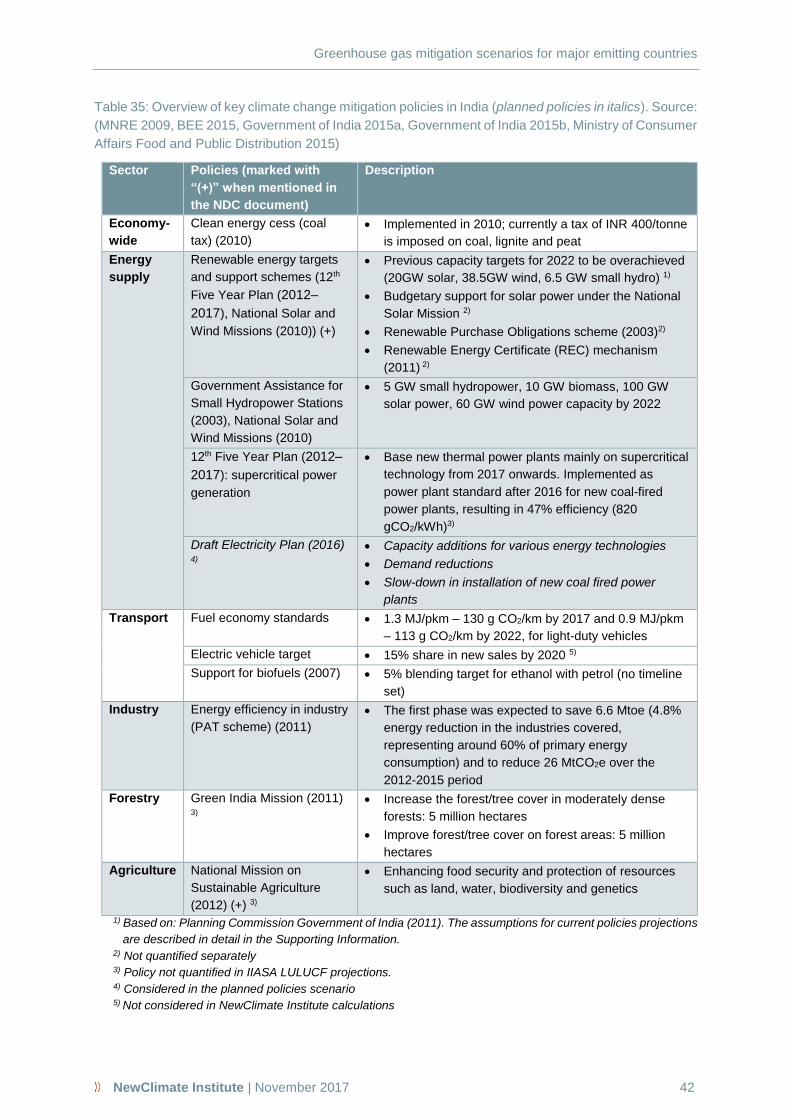
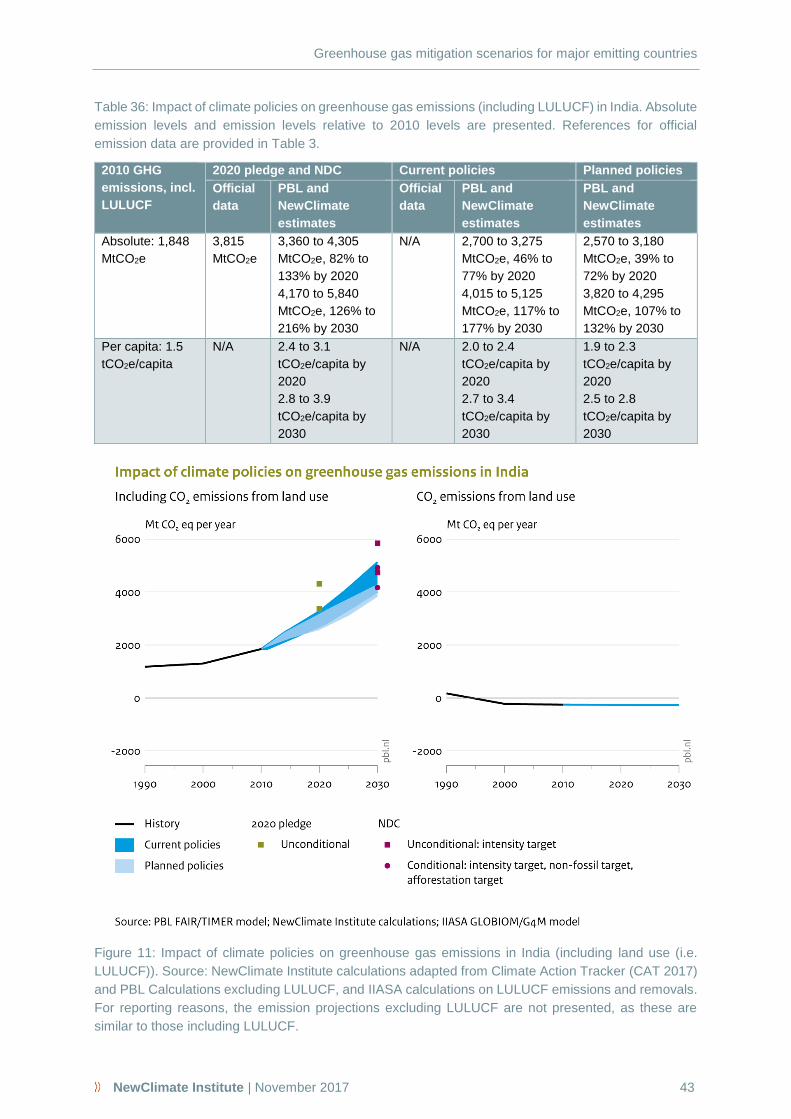
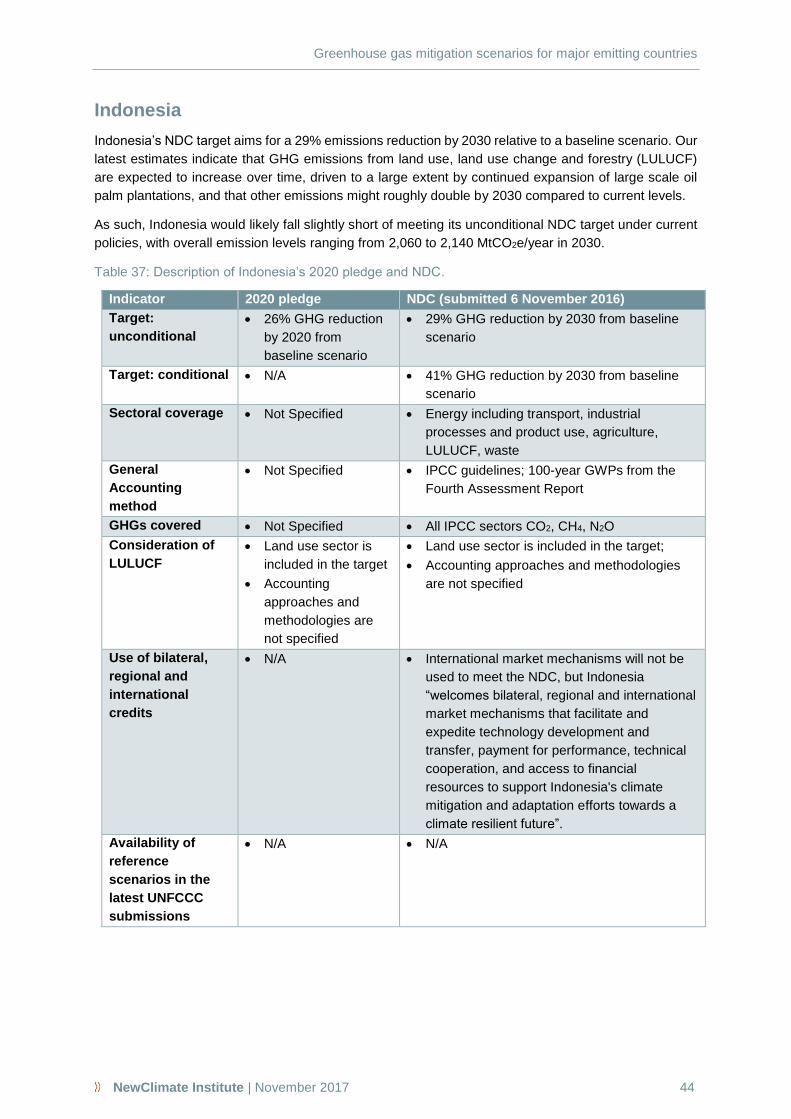


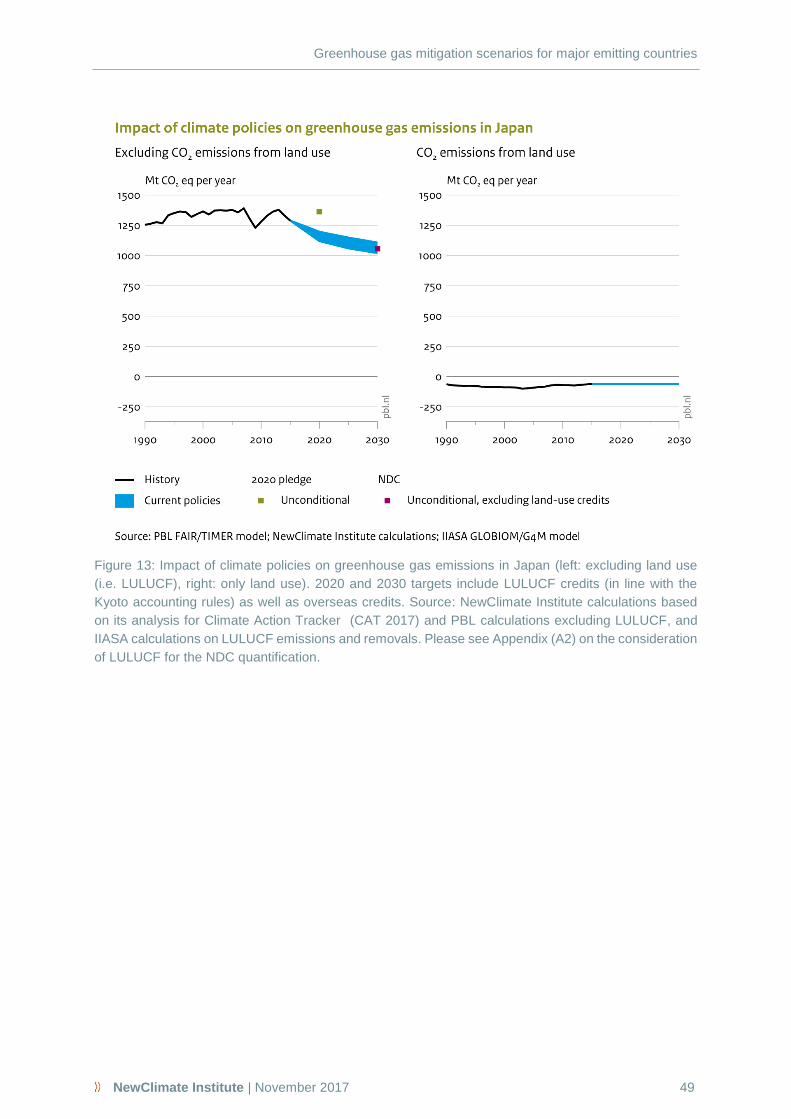


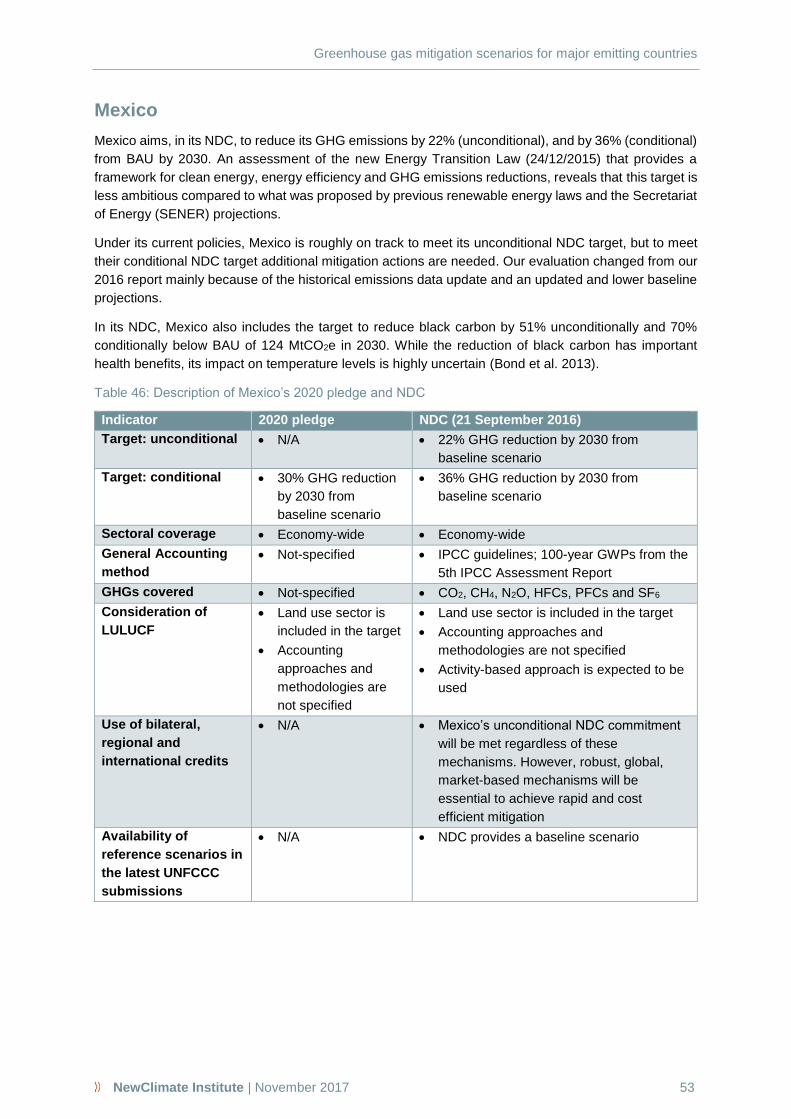


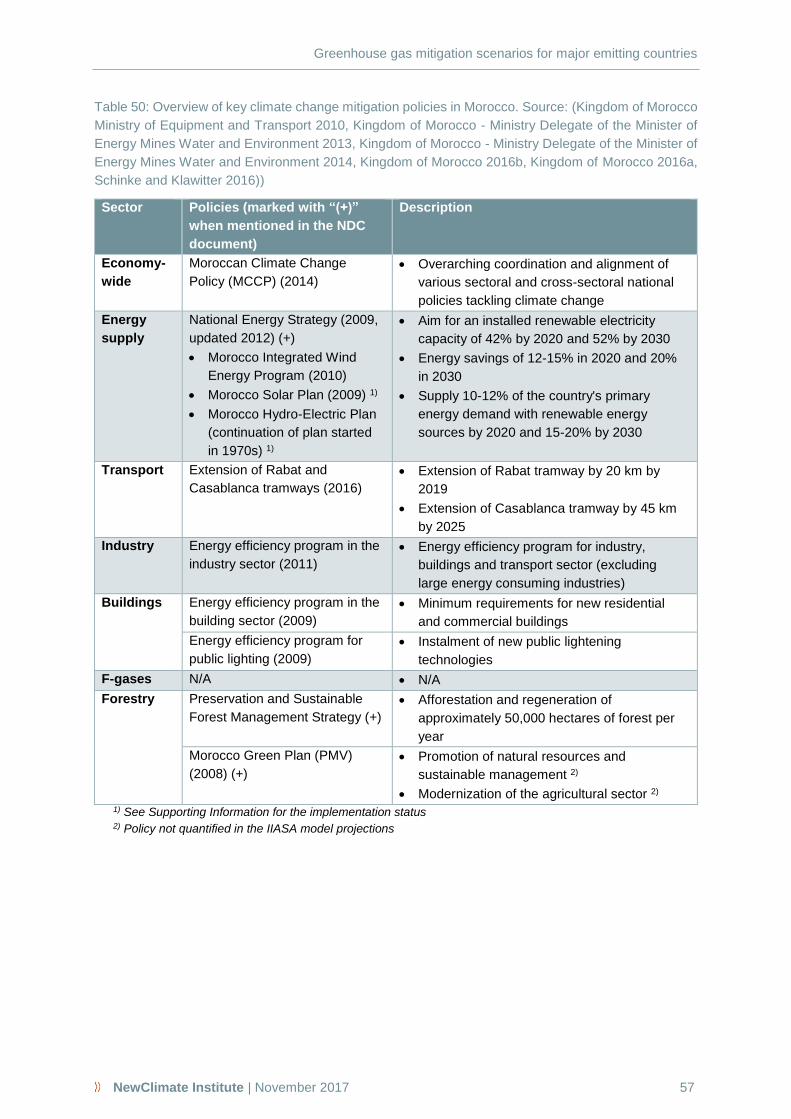
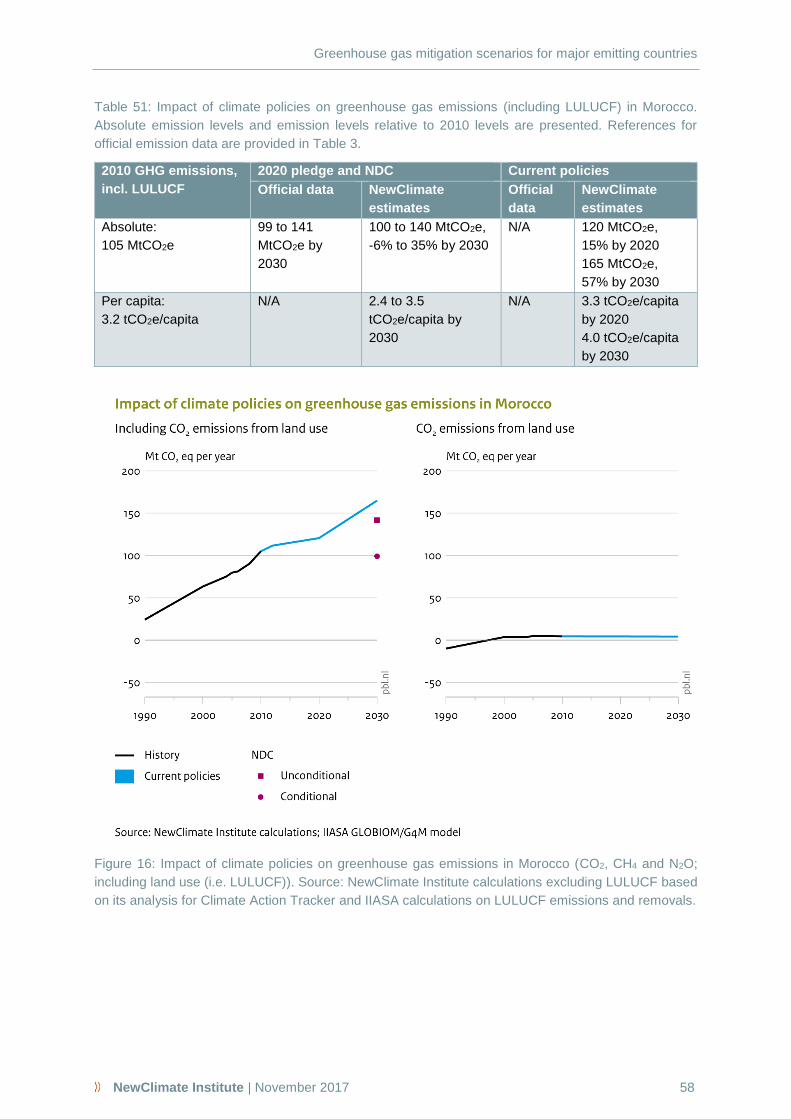


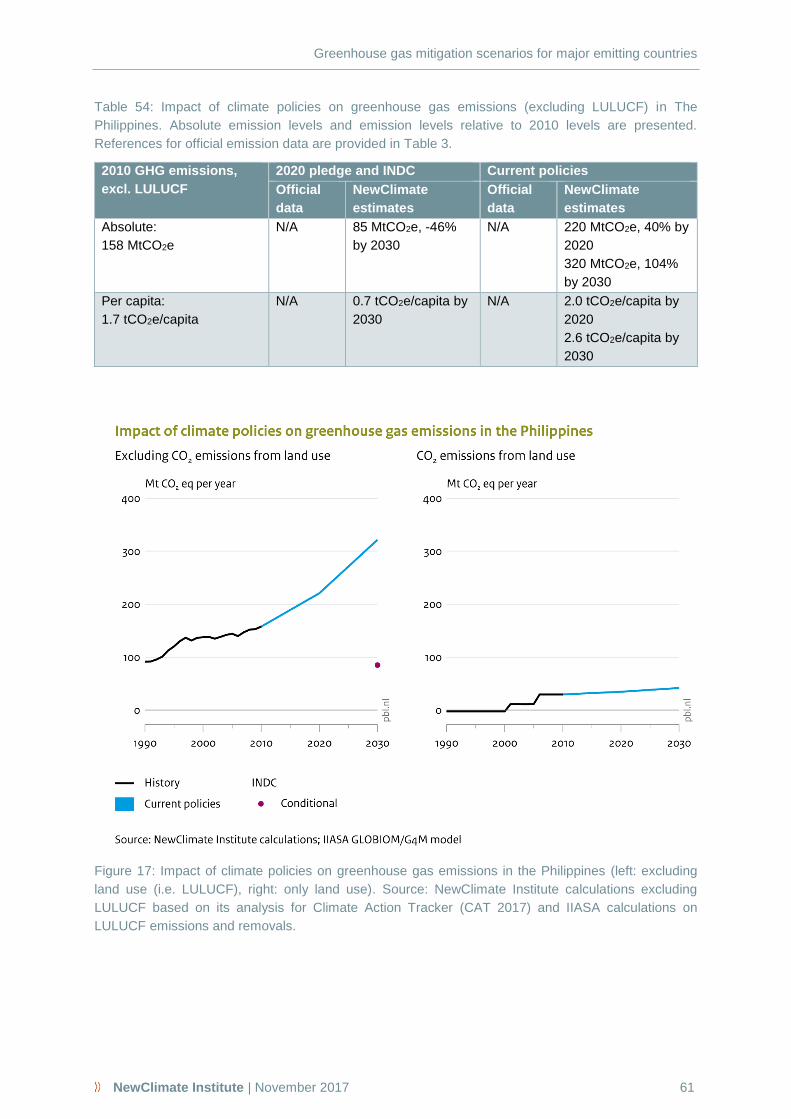

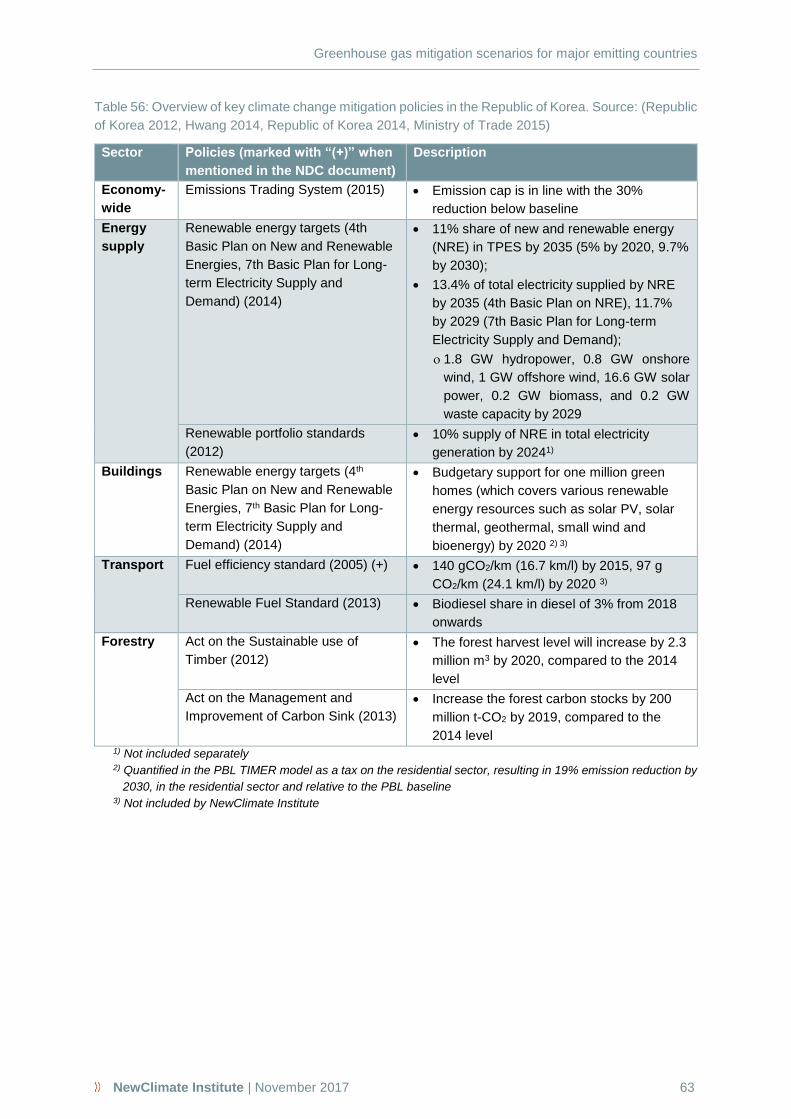
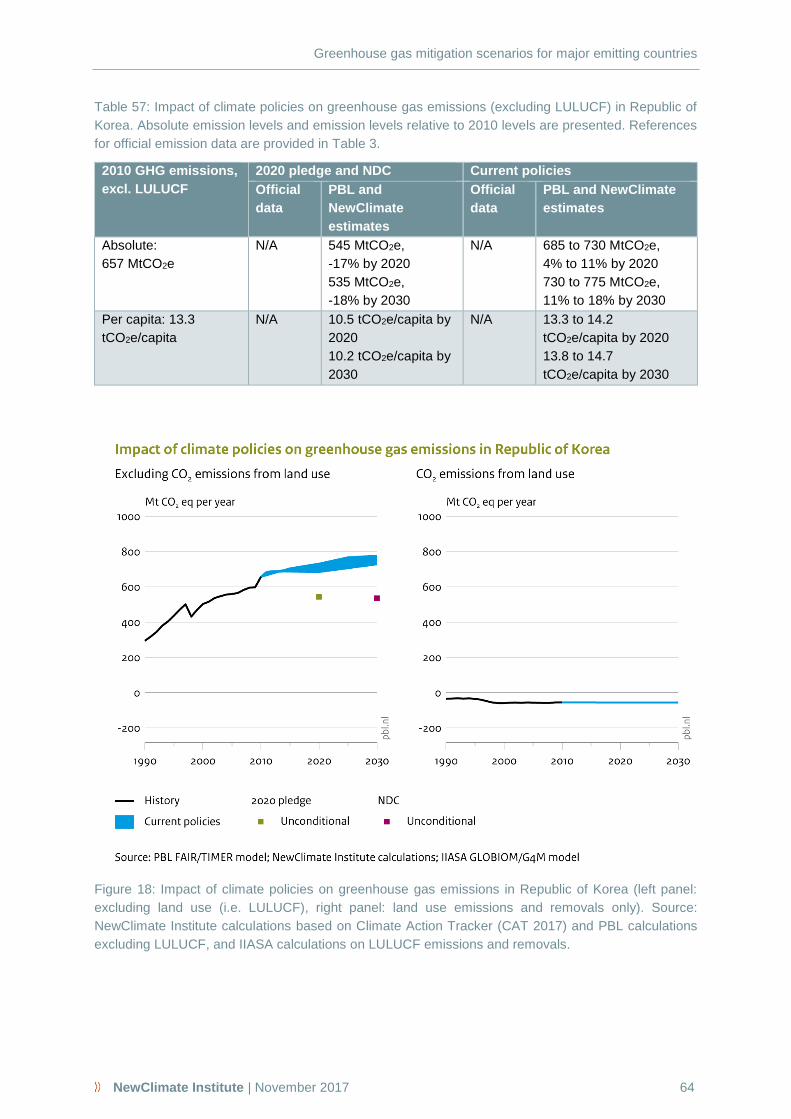

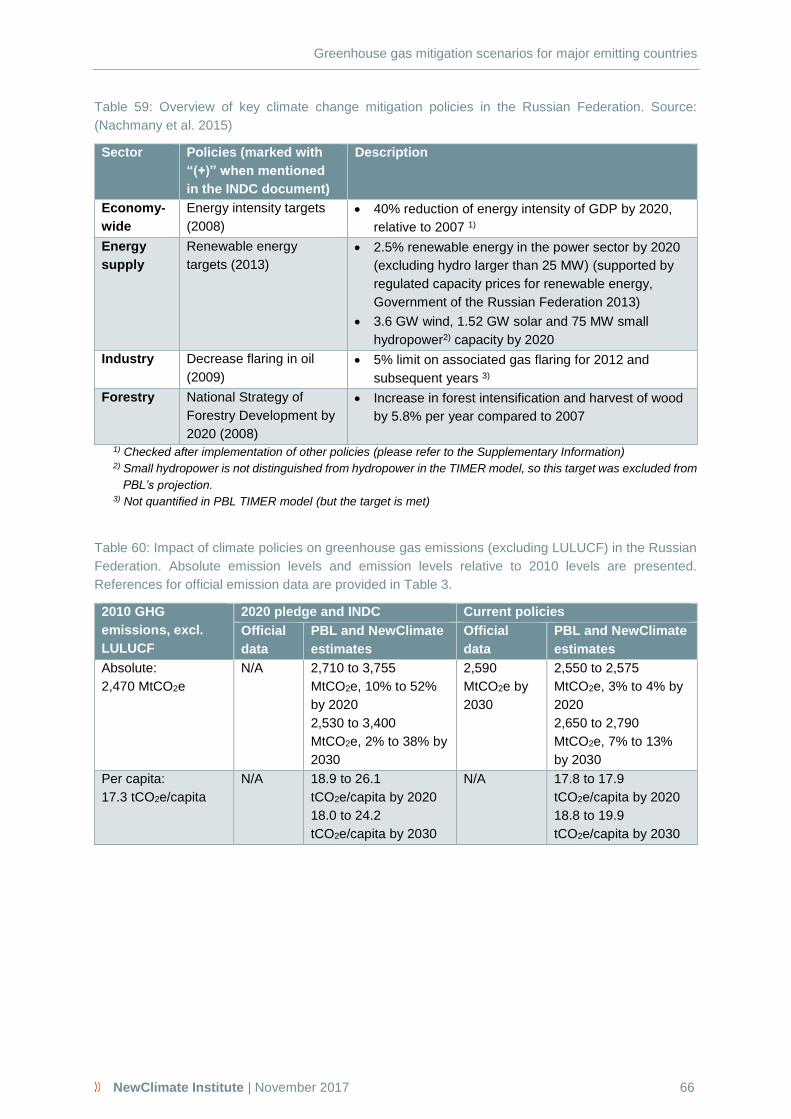


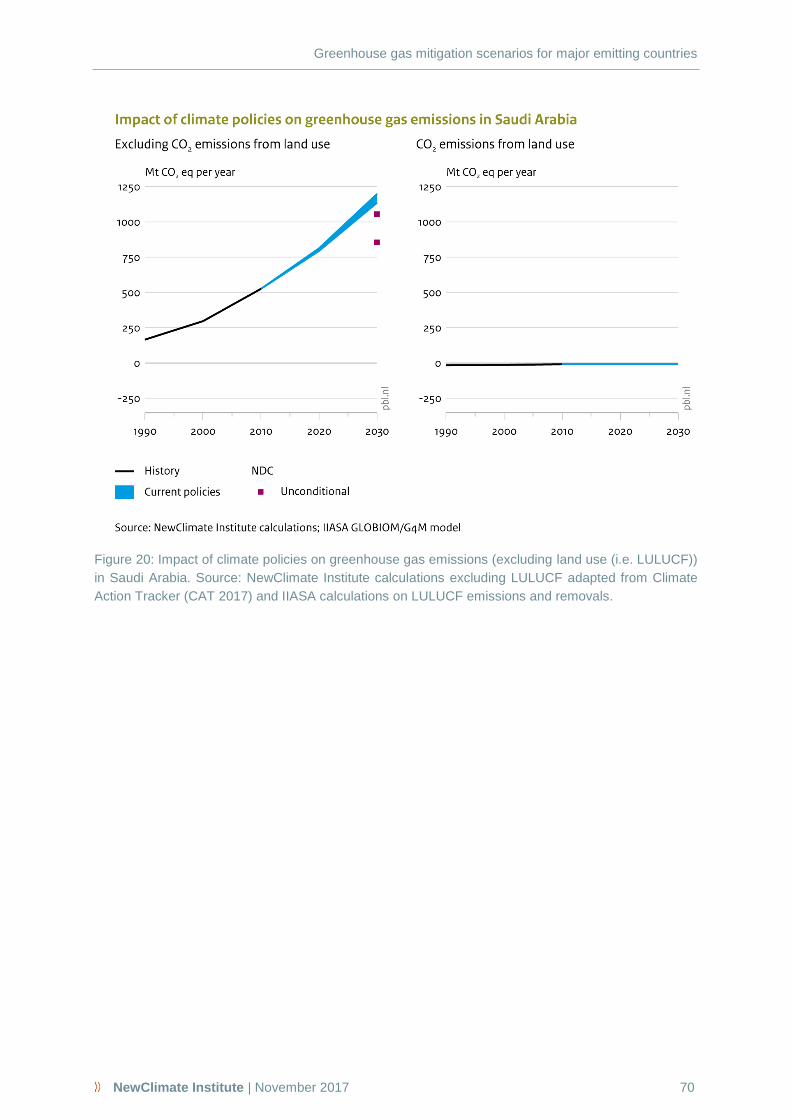
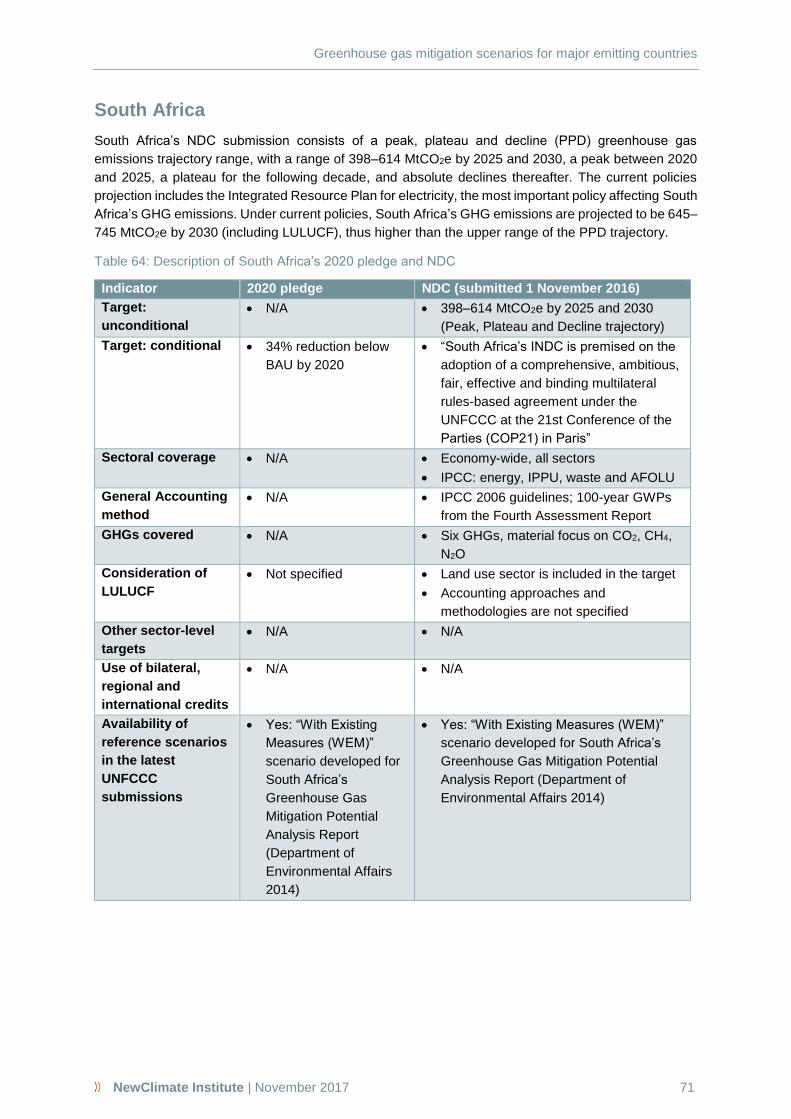
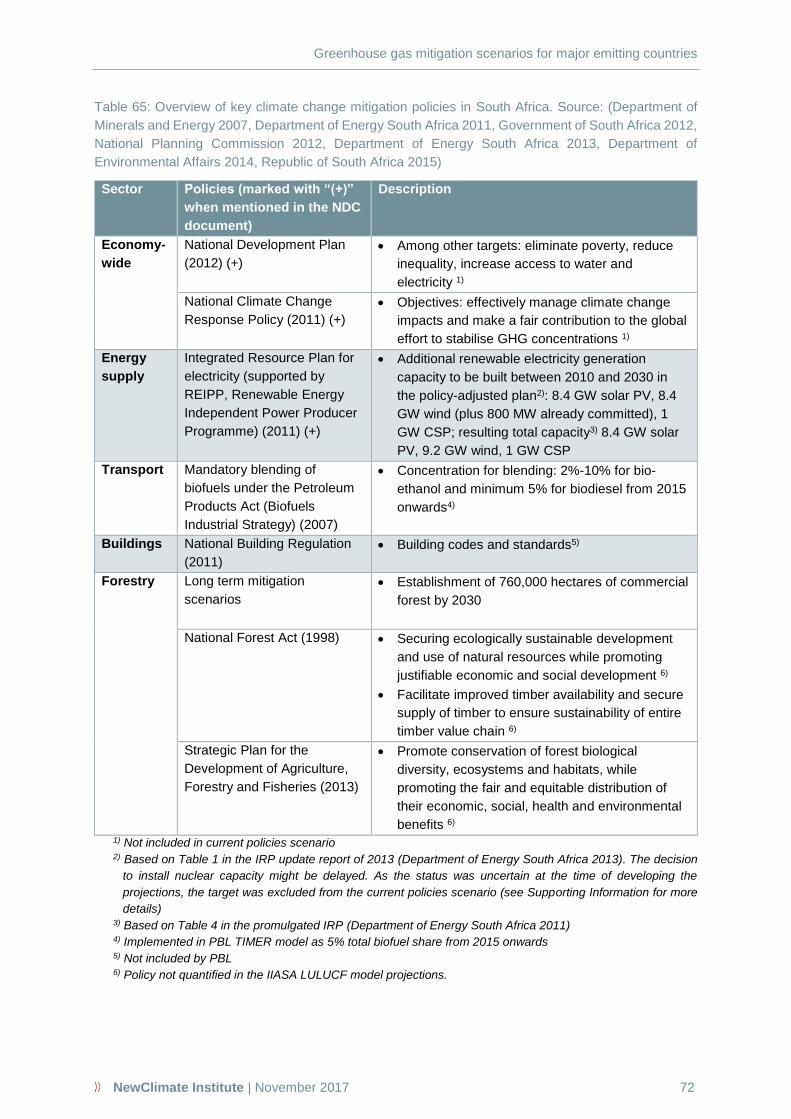
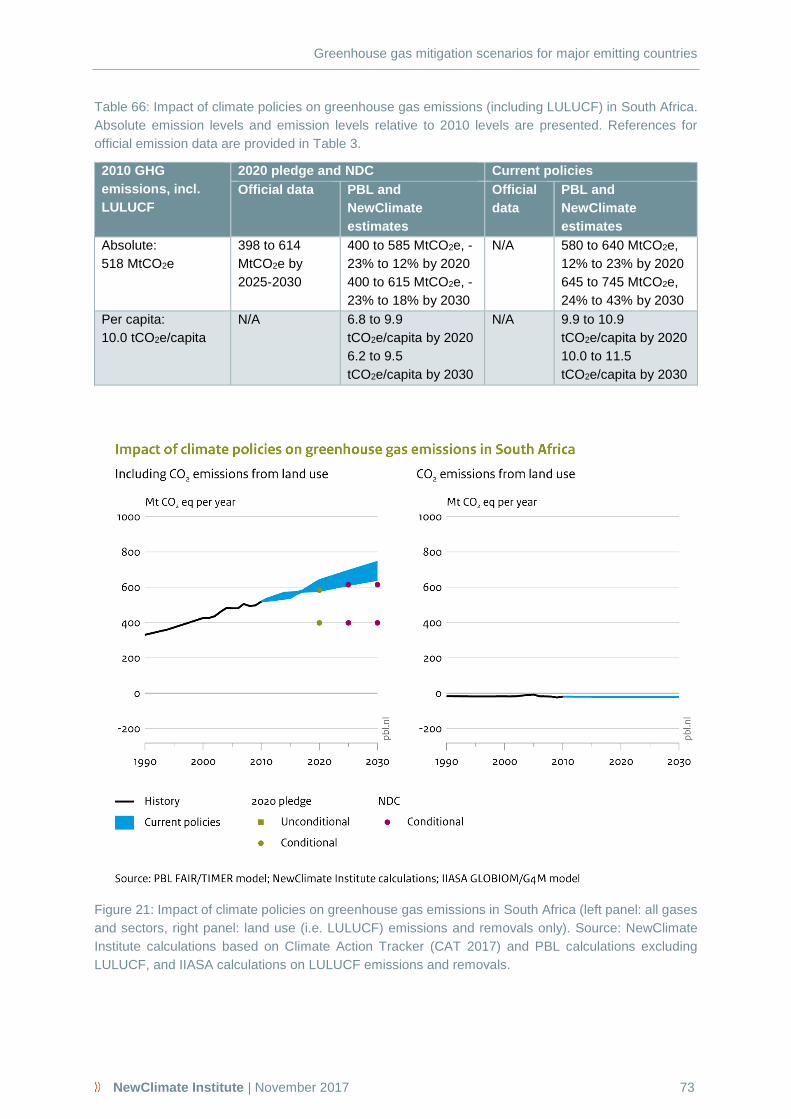


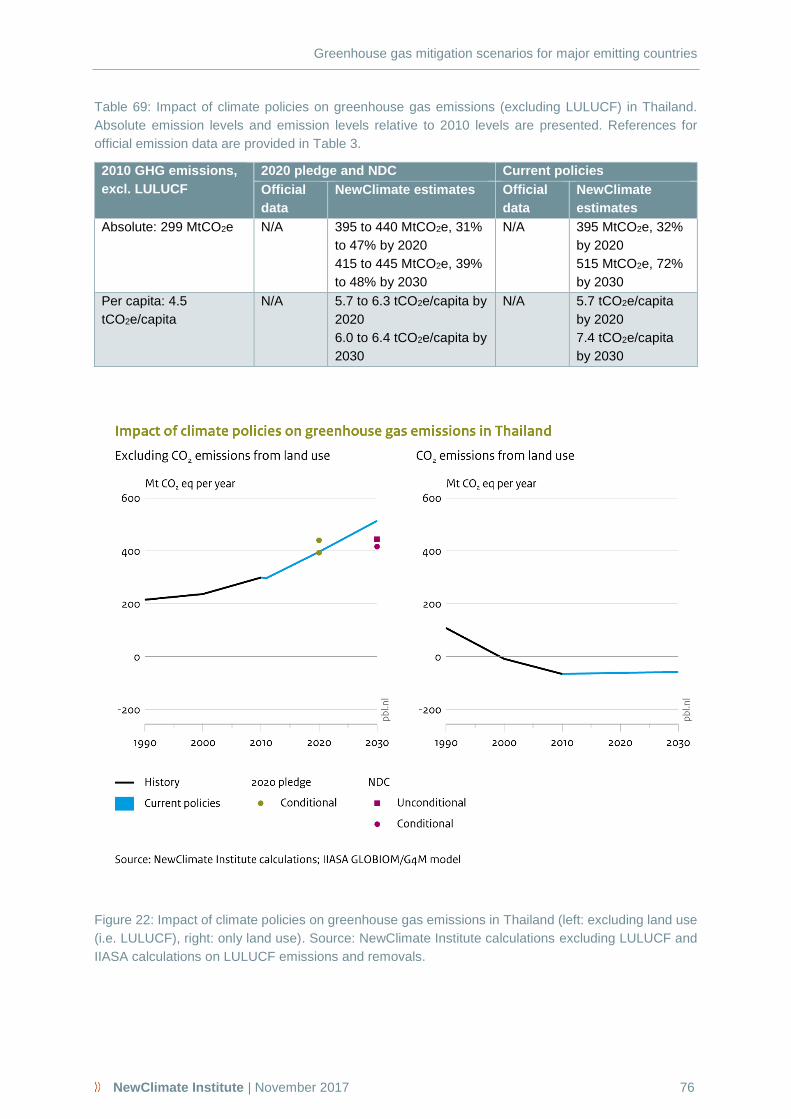


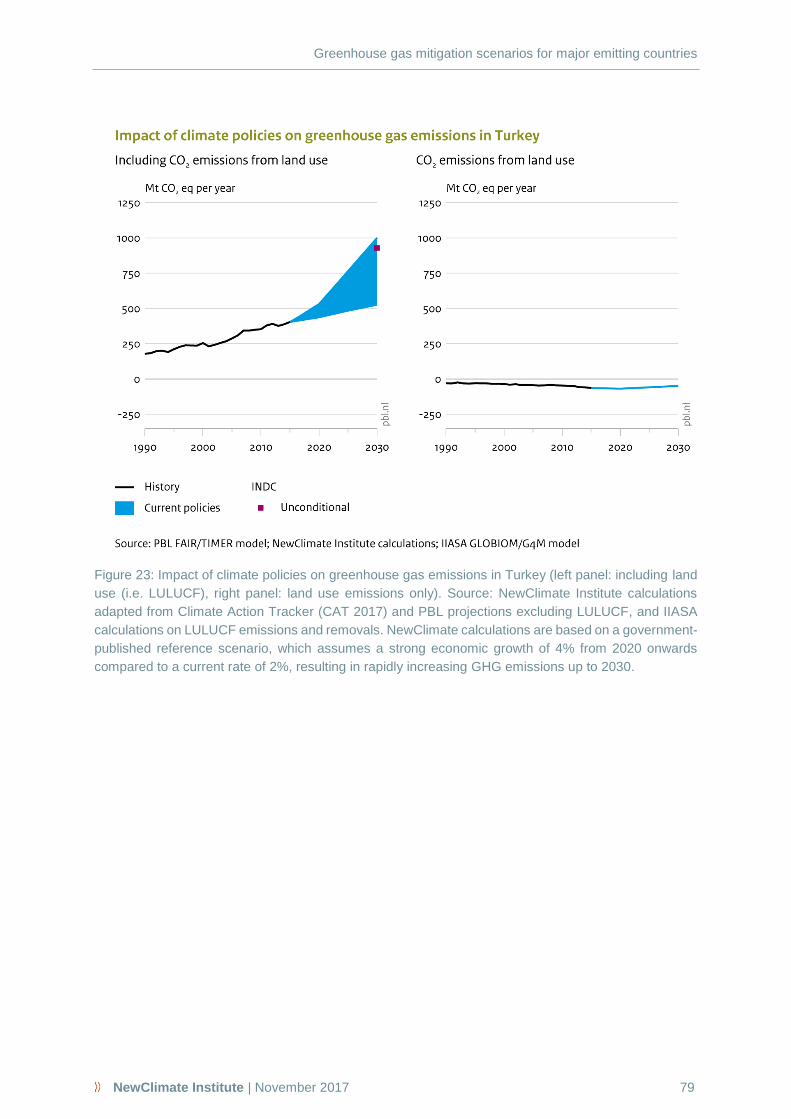

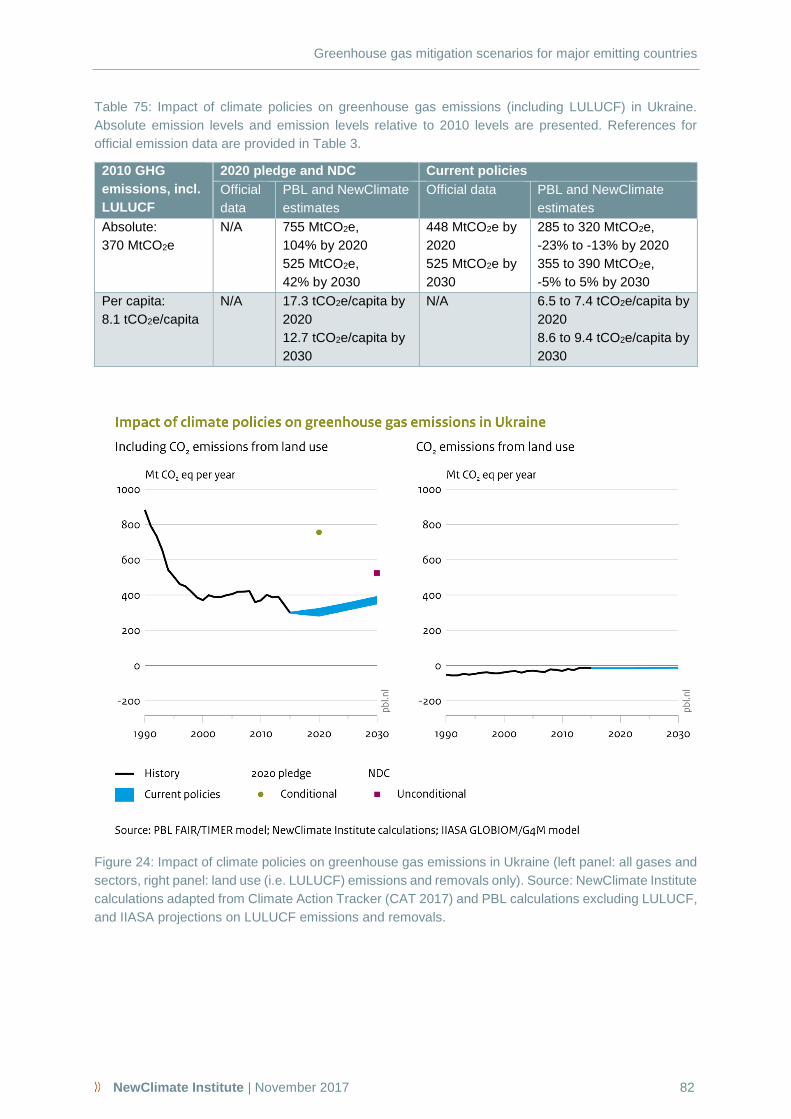
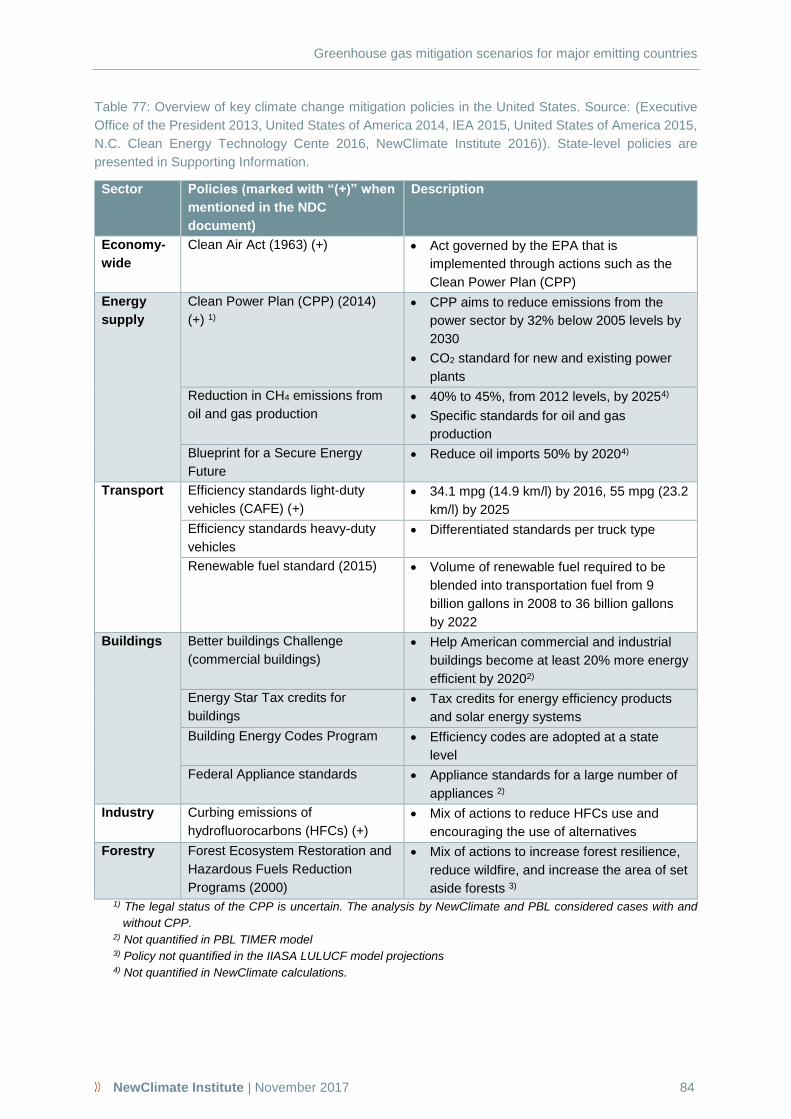
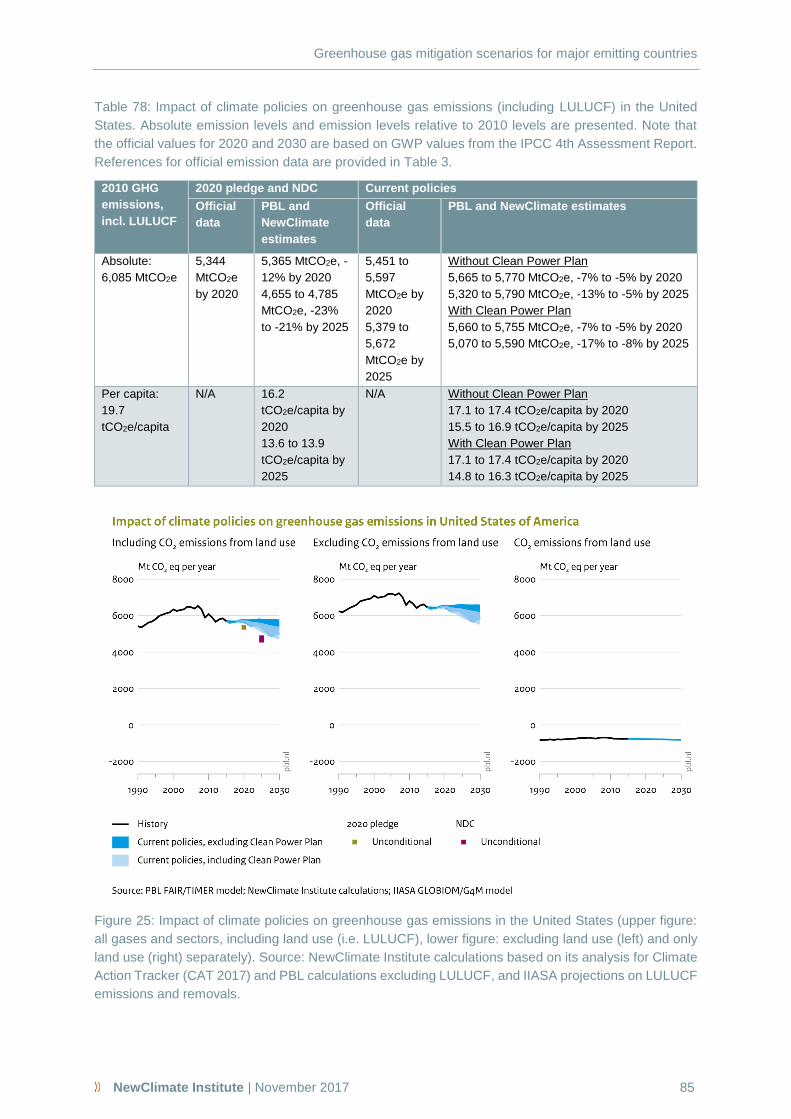


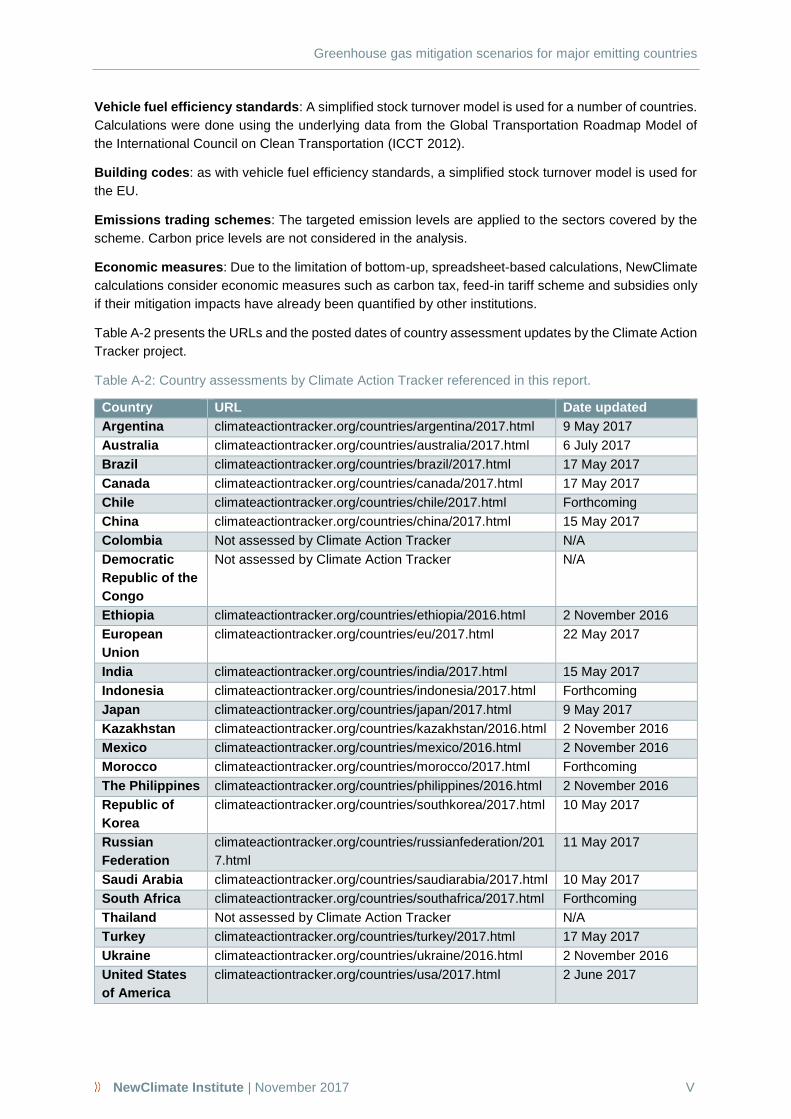


![Takeshi Amemiya-Advanced Econometrics[1]](https://static.documents.pub/doc/80x56/543b86b9afaf9fe7568b4999/takeshi-amemiya-advanced-econometrics1.jpg)

