the effectiveness of the curriculum depends on the type of behavior examined and that there are differences that are affected by type of test, type of behavior, and group assignment, conjointly. For the junior-high-school data, the picture is very different. The training effect is not significant (p < 0.62), nor is there a difference between pretest and posttest conditions. Table 2 gives the data used for a second analysis that compared intersection-path, search, and midblock- path behavior for trained and untrained groups, pretest and posttest, for elementary-school and junior-high students. The elementary-school data set produced re- sults similar to those above: Training, type of test, and type of behavior were all very significant effects (p < 0.0000), the last being once again the most powerful simple effect. Search accounted for the largest number of errors and midblock path the least. However, the interaction of all three variables accounted for a large proportion of the variation in the distribution of errors. For the junior-high data set, these results were also similar to those found previously: no training effect (p < 0.82) and no pretest-posttest effect (p < 0.67). The type of behavior made a significant difference in the proportion of errors, search contributing more heavily. The picture painted by these results is rather dismal. Bicyclists at both age levels made a very large number of dangerous riding errors both before and after train- ing. The fact that there is a statistically significant though slight improvement at the elementary-school level that is attributable to training holds out some hope that a massive training program might be effective. CONCLUSIONS The study reported here demonstrates that it is possible to collect naturalistic bicycle-performance data that have the reliability and validity necessary for a criterion measure. The instrument is sensitive enough to reveal small changes in behavior brought about by short-term training programs. The ability to detect behavioral 29 changes at the elementary-school level, where the numbers were relatively small, and to find strong evidence of no change at the junior-high level, where the numbers were large, is impressive. Since the coders do not need special qualifications and the train- ing time is short, this technique is cost effective. It is available to anyone who wishes to study changes in bicycle-riding behavior. ACKNOWLEDGMENT This study was supported by the California Department of Education with funding from the Office of Traffic Safety of the National Highway Traffic Safety Adminis- tration, U.S. Department of Transportation. The opinions expressed are solely my own. The coopera- tion and assistance of the project monitor, Jack Parks, is acknowledged. Thanks are also due to coders Virginia Duval, Sam Lynch, F. stephan Mayer, and John Wood, who became expert at watching young bicyclists risk death early in the morning. REFERENCES 1. K. Cross and R. DeMille. Human Factors in Bicycle-Motor Vehicle Accidents. Anacapa Sciences, Santa Barbara, CA, 1973. 2. M. H. Jones and G. A. Fleischer. Evaluation of the California Bicycle Safety Curricula. Traffic Safety Center, Univ. of California, Los Angeles, 1978. 3. J. Cohen. A Coefficient of Agreement for Nominal Scales. Educational and Psychological Measure- ment, Vol. 20, 1960, pp. 37-46. 4. D. V. Gokhale and S. Kullback. The Information in Contingency Tables. Marcel Dekker, Inc., New York, 1978. Publication of this paper sponsored by Committee on Bicycling and Bicycle Facilities. Evaluation of the Eugene, Oregon, Greenway Bicycle Bridge S. Gregory Lipton, Urban Planning Program and Center for Public Affairs, University of Kansas, Lawrence The results of a study conducted as part of a National Bikeway Demon- stration Program project that funded the construction of a bicycle bridge- the Greenway Bridge-in Eugene, Oregon, are reported. The bridge spans the Willamette River and connects the north and south parts of Eugene. It reduces the travel time for bicyclists between two major retai I and employment centers and connects the bicycle paths that run along .both banks of the river. Income and age; trip purpose, mode, and frequency; and reason for bicycling were among the variables studied. Surveys of bicyclists who crossed the river showed that approximately one-third of bicycle trips were commuting trips to or from work and an additional 10 percent were commuting trips to or from school. The new bridge is shown to have eliminated approximately 500 automobile trips/week. All income categories were well represented among bicyclists, but the < $5000/year group was overrepresented. The income distribution of bicyclists is almost the same as that of the city as a whole for non- university-related trips. Those in the 16- to 34-year old age groups constitute a larger percentage of bicyclists than they do the city popu- lation. As the Eugene bicycle system grows, it should continue to at- tract more bicyclists and more utilitarian trips. In 1976, the city of Eugene, Oregon, successfully ap- plied for a National Bikeway Demonstration Program grant (Section 119 of the Federal-Aid Highway Amend- ments of 1974) to finance a bicycle and pedestrian bridge to cross the Willamette River near the Valley River shopping center (see Figure 1). In the applica- tion, the city indicated that this bridge was the "most important missing link in the city's bikeway network". It was pointed out that the Willamette River forms a
Transcript
the effectiveness of the curriculum depends on the type of behavior examined and that there are differences that are affected by type of test, type of behavior, and group assignment, conjointly.
For the junior-high-school data, the picture is very different. The training effect is not significant (p < 0.62), nor is there a difference between pretest and posttest conditions.
Table 2 gives the data used for a second analysis that compared intersection-path, search, and midblockpath behavior for trained and untrained groups, pretest and posttest, for elementary-school and junior-high students. The elementary-school data set produced results similar to those above: Training, type of test, and type of behavior were all very significant effects (p < 0.0000), the last being once again the most powerful simple effect. Search accounted for the largest number of errors and midblock path the least. However, the interaction of all three variables accounted for a large proportion of the variation in the distribution of errors. For the junior-high data set, these results were also similar to those found previously: no training effect (p < 0.82) and no pretest-posttest effect (p < 0.67). The type of behavior made a significant difference in the proportion of errors, search contributing more heavily.
The picture painted by these results is rather dismal. Bicyclists at both age levels made a very large number of dangerous riding errors both before and after training. The fact that there is a statistically significant though slight improvement at the elementary-school level that is attributable to training holds out some hope that a massive training program might be effective.
CONCLUSIONS
The study reported here demonstrates that it is possible to collect naturalistic bicycle-performance data that have the reliability and validity necessary for a criterion measure. The instrument is sensitive enough to reveal small changes in behavior brought about by short-term training programs. The ability to detect behavioral
29
changes at the elementary-school level, where the numbers were relatively small, and to find strong evidence of no change at the junior-high level, where the numbers were large, is impressive. Since the coders do not need special qualifications and the training time is short, this technique is cost effective. It is available to anyone who wishes to study changes in bicycle-riding behavior.
ACKNOWLEDGMENT
This study was supported by the California Department of Education with funding from the Office of Traffic Safety of the National Highway Traffic Safety Administration, U.S. Department of Transportation. The opinions expressed are solely my own. The cooperation and assistance of the project monitor, Jack Parks, is acknowledged. Thanks are also due to coders Virginia Duval, Sam Lynch, F. stephan Mayer, and John Wood, who became expert at watching young bicyclists risk death early in the morning.
REFERENCES
1. K. Cross and R. DeMille. Human Factors in Bicycle-Motor Vehicle Accidents. Anacapa Sciences, Santa Barbara, CA, 1973.
2. M. H. Jones and G. A. Fleischer. Evaluation of the California Bicycle Safety Curricula. Traffic Safety Center, Univ. of California, Los Angeles, 1978.
3. J. Cohen. A Coefficient of Agreement for Nominal Scales. Educational and Psychological Measurement, Vol. 20, 1960, pp. 37-46.
4. D. V. Gokhale and S. Kullback. The Information in Contingency Tables. Marcel Dekker, Inc., New York, 1978.
Publication of this paper sponsored by Committee on Bicycling and Bicycle Facilities.
Evaluation of the Eugene, Oregon, Greenway Bicycle Bridge S. Gregory Lipton, Urban Planning Program and Center for Public Affairs,
University of Kansas, Lawrence
The results of a study conducted as part of a National Bikeway Demonstration Program project that funded the construction of a bicycle bridgethe Greenway Bridge-in Eugene, Oregon, are reported. The bridge spans the Willamette River and connects the north and south parts of Eugene. It reduces the travel time for bicyclists between two major retai I and employment centers and connects the bicycle paths that run along .both banks of the river. Income and age; trip purpose, mode, and frequency; and reason for bicycling were among the variables studied. Surveys of bicyclists who crossed the river showed that approximately one-third of bicycle trips were commuting trips to or from work and an additional 10 percent were commuting trips to or from school. The new bridge is shown to have eliminated approximately 500 automobile trips/week. All income categories were well represented among bicyclists, but the < $5000/year group was overrepresented. The income distribution of bicyclists is almost the same as that of the city as a whole for nonuniversity-related trips. Those in the 16- to 34-year old age groups
constitute a larger percentage of bicyclists than they do the city population. As the Eugene bicycle system grows, it should continue to attract more bicyclists and more utilitarian trips.
In 1976, the city of Eugene, Oregon, successfully applied for a National Bikeway Demonstration Program grant (Section 119 of the Federal-Aid Highway Amendments of 1974) to finance a bicycle and pedestrian bridge to cross the Willamette River near the Valley River shopping center (see Figure 1). In the application, the city indicated that this bridge was the "most important missing link in the city's bikeway network". It was pointed out that the Willamette River forms a
30
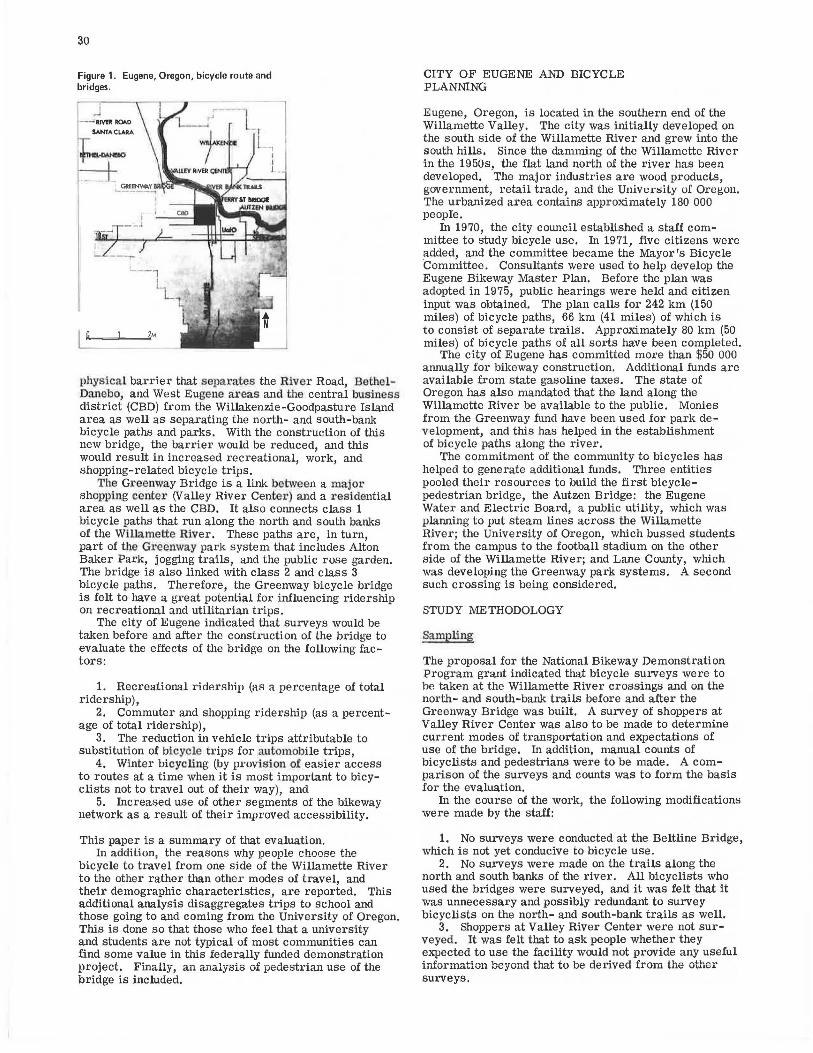
Figure 1. Eugene, Oregon, bicycle route and bridges.
physical barrier that separates the River Road, BethelDanebo, and West Eugene areas and the central business district (CBD) from the Willakenzie-Goodpasture Island area as well as separating the north- and south-bank bicycle paths and parks. With the construction of this new bridge, the barrier would be reduced, and this would result in increased recreational, work, and shopping-related bicycle trips.
The Greenway Bridge is a link between a major shopping center (Valley River Center) and a i·esidential area as well as the CBD. It also connects class 1 bicycle paths that run along the north and south banks of the Willamette River. These paths are, in turn, part of the Gi-eenway park system that includes Alton Baker Park, jogging trails, and the public rose garden. The bridge is also linked with class 2 and class 3 bicycle paths. Therefore, the Greenway bicycle bridge is felt to have a great potential for influencing ridership on recreational and utilitarian trips.
The city of Eugene indicated that surveys would be taken before and after the construction of the bridge to evaluate the effects of the bridge on the following factors:
1. Recreational ridership (as a percentage of total ridership),
2. Commuter and shopping ridership (as a percentage of total ridership),
3. The reduction in vehicle trips attributable to substitution of bicycle trips for automobile trips,
4. Winter bicycling (by provision of easier access to routes at a time when it is most important to bicyclists not to travel out of their way), and
5. Increased use of other segments of the bikeway network as a result of their improved accessibility.
This paper is a summary of that evaluation. In addition; the reasons why people choose the
bicycle to travel from one side of the Willamette River to the other rather than other modes of travel, and their demographic characteristics, are reported. This additional analysis disaggregates trips to school and those going to and coming from the University of Oregon. This is done so that those who feel that a university and students are not typical of most communities can find some value in this federally funded demonstration project. Finally, an analysis of pedestrian use of the bridge is included.
CITY OF EUGENE AND BICYCLE PLANNING
Eugene, Oregon, is located in the southern end of the Willamette Valley. The city was initially developed on the south side of the Willamette River and grew into the south hills, Since the damming of the Willamette River in the 1950s, the flat land north of the river has been developed. The major industries are wood products, government, retail trade, and the University uf Oregun. The urbanized area contains approximately 180 000 people.
In 1970, the city council established a staff committee to study bicycle use. In 1971, five citizens were added, and the committee became the Mayor's Bicycle Committee. Consultants were used to help develop the Eugene Bikeway Master Plan. Before the plan was adopted in 1975, public hearings were held and citizen input was obtained. The plan calls for 242 km (150 miles) of bicycle paths, 66 km (41 miles) of which is to consist of separate trails. Approximately 80 km (50 miles) of bicycle paths of all sorts have been completed.
The city of Eugene has committed more than $50 000 annually for bikeway construction. Additional funds are available from state gasoline taxes. The state of Oregon has also mandated that the land along the Willamette River be available to the public. Monies from the Greenway fund have been used for park development, and this has helped in the establishment of bicycle paths along the river.
The commitment of the community to bicycles has helped to generate additional funds. Three entities pooled their resources to build the first bicyclepedestrian bridge, the Autzen Bridge: the Eugene Water and Electric Board, a public utility, which was planning to put steam lines across the Willamette River; the University of Oregon, which bussed students from the campus to the football stadium on the other side of the Willamette River; and Lane County, which was developing the Greenway park systems. A second such crossing is being considered.
STUDY METHODOLOGY
Sampling
The proposal for the National Bikeway Demonstration Program grant indicated that bicycle surveys were to be taken at the Willamette River crossings and on the north- and south-bank trails before and after the Greenway Bridge was built. A survey of shoppers at Valley River Center was also to be made to determine current modes of transportation and expectations of use of the bridge. In addition, manual counts of bicyclists and pedestrians were to be made. A comparison of the surveys and counts was to form the basis for the evaluation.
In the course of the work, the following modifications were made by the staff:
1. No surveys were conducted at the Beltline Bridge, which is not yet conducive to bicycle use.
2. No surveys were made on the trails along the north and south banks of the river. All bicyclists who used the bridges were surveyed, and it was felt that it was unnecessary and possibly redundant to survey bicyclists on the north- and south-bank trails as well.
3. Shoppers at Valley River Center were not surveyed. It was felt that to ask people whether they expected to use the facility would not provide any useful information beyond that to be derived from the other surveys.
4. Because limited staff made manual bicycle and pedestrian counts impossible, mechanical counters were used.
It was decided to survey people who crossed the bicycle bridges on both a weekday and a weekend in the summer and on a weekday in the winter, before and after the Greenway Bridge was built. This resulted in six surveys. It was therefore possible to compare the difference in trip purpose for different seasons and for weekends versus weekdays. No winter weekend survey was planned for fear of oversurveying and meeting resistance from bicyclists. Each person surveyed filled out only one form per day, usually on their first trip across the river.
Pedestrians were not surveyed before the bridge was built. This was an oversight. Joggers used the bridge but were not surveyed. It was felt to be too dangerous for the surveyors to try and stop Eugene's marathon runners for a survey.
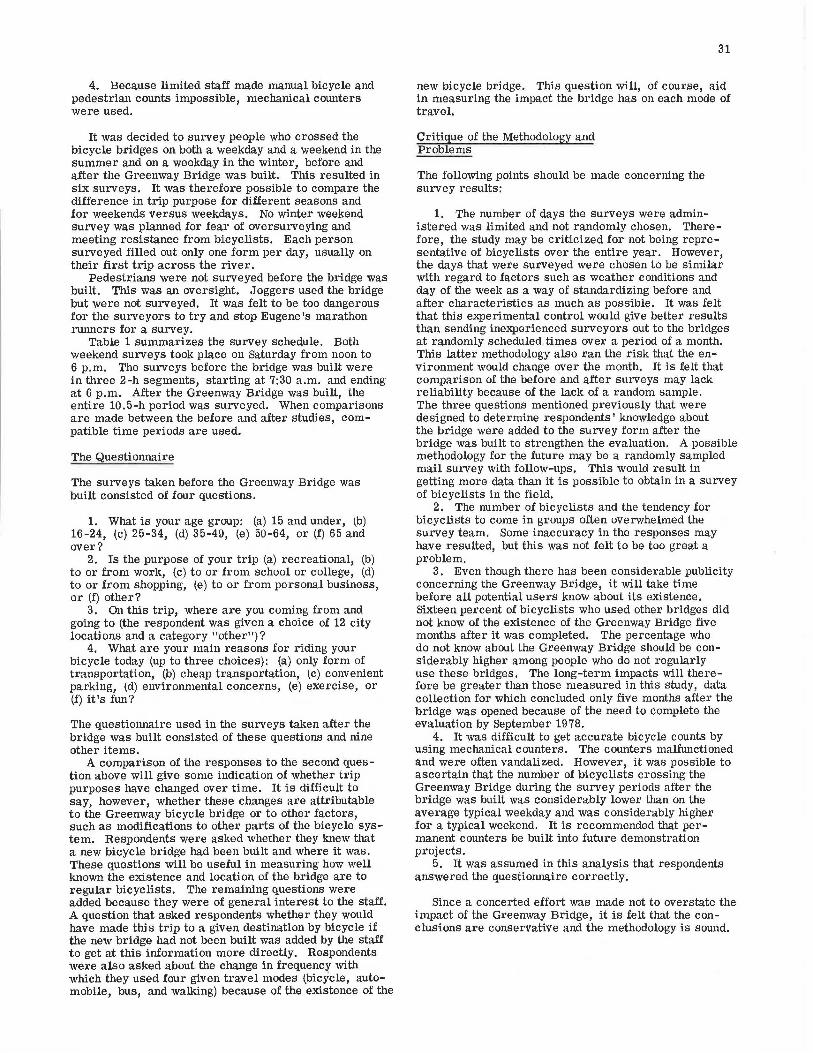
Table 1 summarizes the survey schedule. Both weekend surveys took place on Saturday from noon to 6 p.m. The surveys before the bridge was built were in three 2-h segments, starting at 7:30 a.m. and ending at 6 p.m. After the Greenway Bridge was built, the entire 10.5-h period was surveyed. When comparisons are made between the before and after studies, compatible time periods are used.
The Questionnaire
The surveys taken before the Greenway Bridge was built consisted of four questions.
1. What is your age group: (a) 15 and under, (b) 16-24, (c) 25-34, (d) 35-49, (e) 50-64, or (f) 65 and over?
2. Is the purpose of your trip (a) recreational, (b) to or from work, (c) to or from school or college, (d) to or from shopping, (e) to or from personal business, or (f) other?
3. On this trip, where are you coming from and going to (the respondent was given a choice of 12 city locations and a category "other")?
4. What are your main reasons for riding your bicycle today (up to three choices): (a) only form of transportation, (b) cheap transportation, (c) convenient parking, (d) environmental concerns, (e) exercise, or (f) it's fun?
The questionnaire used in the surveys taken after the bridge was built consisted of these questions and nine other items.
A comparison of the responses to the second question above will give some indication of whether trip purposes have changed over time. It is difficult to say, however, whether these changes are attributable to the Greenway bicycle bridge or to other factors, such as modifications to other parts of the bicycle system. Respondents were asked whether they knew that a new bicycle bridge had been built and where it was. These questions will be useful in measuring how well known the existence and location of the bridge are to regular bicyclists. The remaining questions were added because they were of general interest to the staff. A question that asked respondents whether they would have made this trip to a given destination by bicycle if the new bridge had not been built was added by the staff to get at this information more directly. Respondents were also asked about the change in frequency with which they used four given travel modes (bicycle, automobile, bus, and walking) because of the existence of the
31
new bicycle bridge. This question will, of course, aid in measuring the impact the bridge has on each mode of travel.
Critique of the Methodology and Problems
The following points should be made concerning the survey results:
1. The number of days the surveys were administered was limited and not randomly chosen. Therefore, the study may be criticized for not being representative of bicyclists over the entire year. However, the days that were surveyed were chosen to be similar with regard to factors such as weather conditions and day of the week as a way of standardizing before and after characteristics as much as possible. It was felt that this experimental control would give better results than sending inexperienced surveyors out to the bridges at randomly scheduled times over a period of a month. This latter methodology also ran the risk that the environment would change over the month. It is felt that comparison of the before and after surveys may lack reliability because of the lack of a random sample. The three questions mentioned previously that were designed to determine respondents' knowledge about the bridge were added to the survey form after the bridge was built to strengthen the evaluation. A possible methodology for the future may be a randomly sampled mail survey with follow-ups. This would result in getting more data than it is possible to obtain in a survey of bicyclists in the field.
2. The number of bicyclists and the tendency for bicyclists to come in groups often overwhelmed the survey team. Some inaccuracy in the responses may have resulted, but this was not felt to be too great a problem.
3. Even though there has been considerable publicity concerning the Greenway Bridge, it will take time before all potential users know about its existence. Sixteen percent of bicyclists who used other bridges did not know of the existence of the Greenway Bridge five months after it was completed. The percentage who do not know about the Greenway Bridge should be considerably higher among people who do not regularly use these bridges. The long-term impacts will therefore be greater than those measured in this study, data collection for which concluded only five months after the bridge was opened because of the need to complete the evaluation by September 1978.
4. It was difficult to get accurate bicycle counts by using mechanical counters. The counters malfunctioned and were often vandalized. However, it was possible to ascertain that the number of bicyclists crossing the Greenway Bridge during the survey periods after the bridge was built was considerably lower than on the average typical weekday and was considerably higher for a typical weekend. It is recommended that permanent counters be built into future demonstration projects.
5. It was assumed in this analysis that respondents answered the questionnaire correctly.
Since a concerted effort was made not to overstate the impact of the Greenway Bridge, it is felt that the conclusions are conservative and the methodology is sound.
32
Table 1. Survey schedule. Study Phase• Date
Day of Week Time of Day Weather Conditions Group surveyed
Before 5/ 21/77 Saturday 5/ 31/77 Tuesday
Noan-'6 :00 p.m. Warm and sunny Bicyclists Bicyclists 7:30-9 :30 a.m., Warm and sunny
11:00 a.m. -1 :00 p.m., 4 :00-6:00 p.m.
11/17/77 Thursday 7:30-9:30 a.m ., Cold, overcast, Bicyclists 11:00 a .m. -1:00 with light rain p.m., 4:00 -6:00
After 4/ 4/ 78 Tuesday
5/ 20/ 78 Saturday
5/ 31/78 Tuesday
p.m. 7:30 a.m . -6 :00
p.m. Noon-6 :00 p .m.
7:30 a .m . -6:00 p.rn.
•eefore and after opening of Greenway Bridge, February 1, 1978.
Cold, windy, cloudy
Warm and sunny
Warm and sunny
Bicyclists and pedestrians
Bicyclists and pedestrians
Bicyclists and pedestrians
Table 2. Weekday trip purpose of bicyclists who would not have made the trip if the Greenway Bridge had not been built.
4/14/78 survey
Greenway Autzen and Ferry Bridge Bridges Total
Trip Purpose Number Percent Number Percent Number Percent
Recreation 21 40 .4 9 34 .6 30 38.5 Work 14 26 .9 9 34.6 23 29.5 School 5 9.6 6 23 .1 11 14.1 Shopping 6 11 .5 0 0 6 7.7 Personal business 6 11.5 2 7.7 8 10.3 Other 0 0 _Q 0 0 0
Total 52 26 78
EVALUATION
. Trip Purpose
The effect of the Greenway Bridge on the percentage of bicyclists who ride for recreational purposes, to and from work, and on shopping trips was measured in two ways.
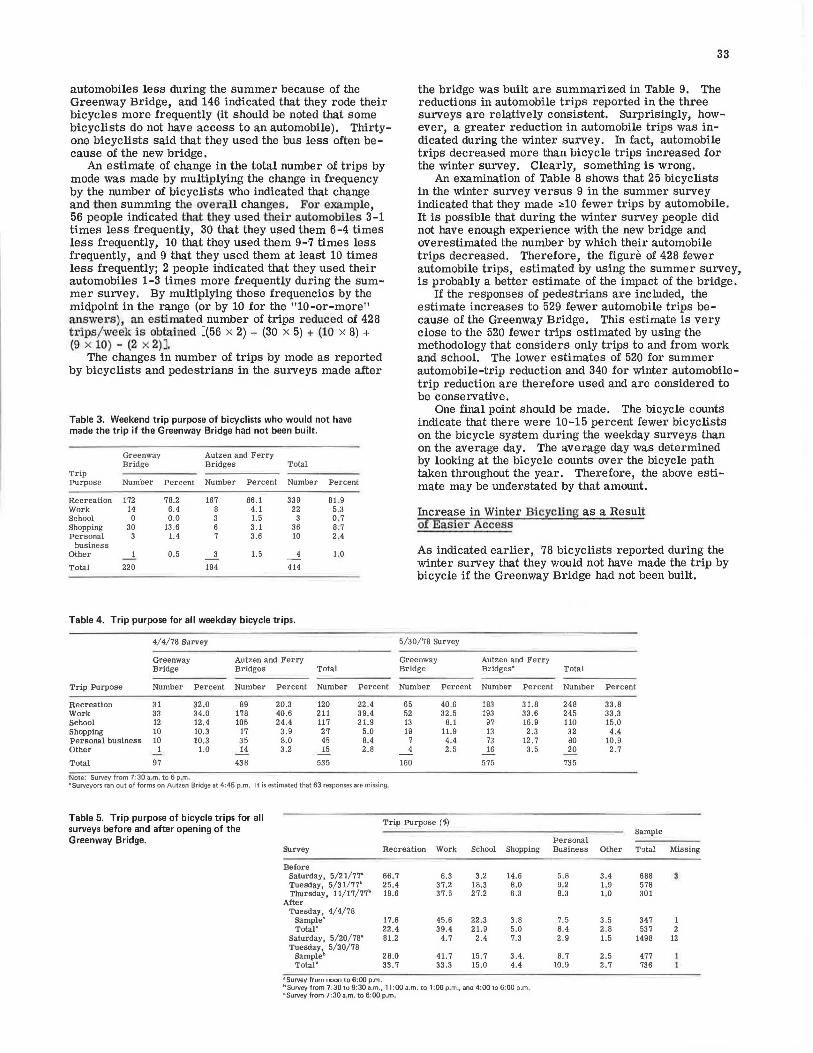
First, each bicyclist crossing the river was asked if he or she would have made the trip if the Greenway Bridge had not been built. The responses or those who said they would not have made the trip were crosstabulated with trip purpose for the two weekday surveys given in Table 2. In both surveys, approximately 40 percent of these additional trips were for recreational purposes, 29 percent were for commuting to or from work, and 8 percent were for shopping. Those being surveyed as they went over the Greenway Bridge made up almost all of those on shopping trips. The data given in Table 3 show that recreational trips predominated on the weekend. Again, the Greenway Bridge accounts for most of the additional shoppers.
Table 4 provides an additional comparison. The purpose of all weekday bicycle trips is given. Here it becomes obvious that the other bridges are being used for shopping trips but that the percentages of these trips are lower than those for the Greenway Bridge. This is as expected because of the proximity of the Greenway Bridge to the Valley River shopping center. Table 4 also indicates that 30-40 percent of all trips are for commuting to and from work. The Greenway Bridge showed a relatively constant percentage of work trips (32.5-34 percent), whereas the other bridges showed a higher percentage during the winter than during the summer.
Table 5 provides a comparison of bicycle trip purposes over all surveys. It is obvious that work trips make up a consistently high percentage (33-45 percent) of the trips of bicyclists surveyed on weekdays and that
recreational trips make up, at most, one-third of the trips.
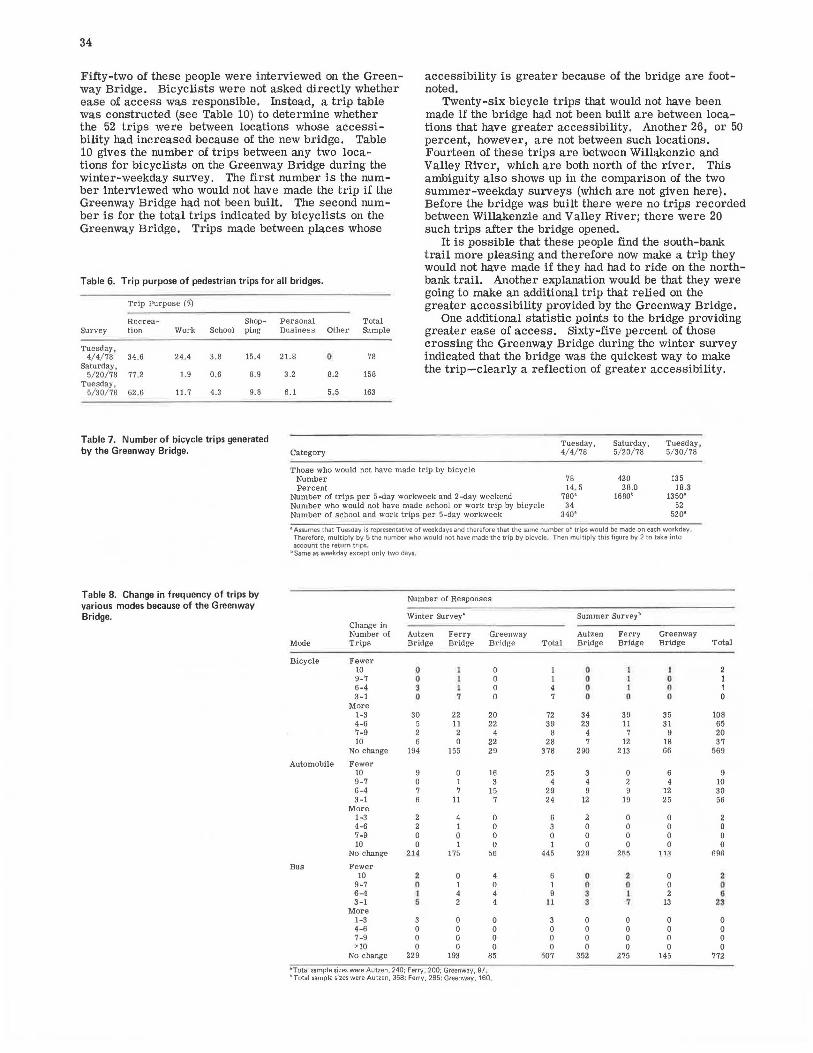
Table 6 gives the trip purposes of pedestrians who crossed all three bridges. Clearly, recreation is the major purpose of pedestrians in using the bridges. This would be expected, since the distance between nonrecreational trip ends is great. Of pedestrians surveyed in the April 4, May 20, and May 30 surveys, 45, 50, and 37 percent, respectively, indicated that they would have not have made the trip if the Greenway Bridge had nol lieen liuilt.
Reduction in Vehicle Trips
Measuring the reduction in vehicle trips as a result of the substitution of bicycle for automobile trips presented a challenge. One measure is provided by looking at the number of trips that would not have been made by bicycles if the Greenway Bridge had not been built (see Table 7). Multiplying the number of trips by 5 to convert to a weekly weekday average and doubling this to take into account return trips results in 780 and 1350 bicycle trips being generated by the Greenway Bridge according to the two summer weekday surveys given in Table 7. However, not all of these trips are substitutes for automobile trips. If one considers commuting trips to school and work as necessary trips, a conservative estimate of 340 and 520 trips/week, respectively, is developed as an estimate for vehicle-trip reduction (Table 7) {because there were few pedestrian, work, and school trips that would not have been made, these were not included in this analysis).
An alternate methodology was also used (see Table 8). People who crossed the three bridges were asked to indicate the change in the number of trips made by each mode (bicycle, automobile, bus, and walking) because of the availability of the Greenway Bridge. If a respondent failed to answer this question, the conservative assumption that no changes occurred was made. Eighty-two bicyclists indicated that they drove their
automobiles less during the summer because of the Greenway Bridge, and 146 indicated that they rode their bicycles more frequently (it should be noted that some bicyclists do not have access to an automobile). Thirtyone bicyclists said that they used the bus less often because of the new bridge.
An estimate of change in the total number of trips by mode was made by multiplying the change in frequency by the number of bicyclists who indicated that change and then summing t he overall changes. For example, 56 people indicated that they used their automobiles 3-1 times less frequently, 30 that they used them 6-4 times less frequently, 10 that they used them 9-7 times less frequently , and 9 that they used them at least 10 times less frequently; 2 people indicated that they used their automobiles 1-3 times more frequently during the summer survey. By multiplying these frequencies by the midpoint in the range (or by 10 for the 11 10-or-more" answers) , an estimat ed number of trips r educed of 428 trips/week is obtained [(56 x 2) + (30 x 5) + (10 x 8) + (9 x 10) - (2 x 2) ].
The changes in number of trips by mode as reported by bicyclists and pedestrians in the surveys made after
Table 3. Weekend trip purpose of bicyclists who would not have made the trip if the Greenway Bridge had not been built.
Greenway Autzen and Ferry Bridge Bridges Total
Trip Purpose Number Percent Number Percent Number Percent
Table 4. Trip purpose for all weekday bicycle trips.
4/ 4/78 Survey
Greenway Autzen and Ferry Bridge Bridges Total
Trip Purpose Number Percent Number Percent Number Percent
Recreation 31 32.0 89 20.3 120 22.4 Work 33 34 .0 178 40.6 211 39.4 School 12 12.4 105 24.4 117 21.9 Shopping 10 10.3 17 3.9 27 5.0 Personal business 10 10.3 35 8.0 45 8.4 other 1 1.0 14 3 .2 15 2 .8
Total 97 438 535
Note: Survey from 7:30 a.m. to 6 p,m. 8 $urveyors ran out of forms on Autzen Bridg~ at 4:45 p.m. It is esti mated that 63 responses are missing
33
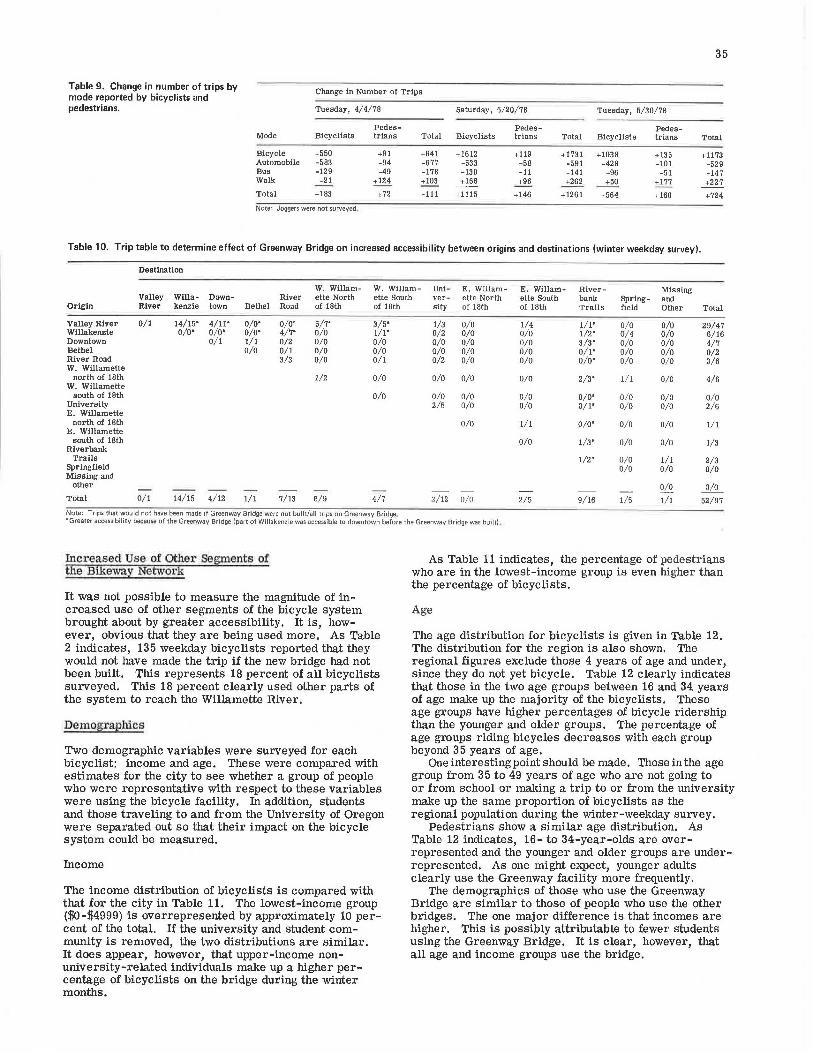
the bridge was built are summarized in Table 9. The reductions in automobile trips reported in the three surveys are relatively consistent. Surprisingly, however, a greater reduction in automobile trips was indicated during the winter survey. In fact, automobile trips decreased more than bicycle trips increased for the winter survey. Clearly, something is wrong.
An examination of Table 8 shows that 25 bicyclists in the winter survey versus 9 in the summer survey indicated that they made ;;,,10 fewer trips by automobile. It is possible that during the winter survey people did not have enough experience with the new bridge and overestimated the number by which their automobile trips decreased. Therefore, the figure of 428 fewer automobile trips, estimated by using the summer survey, is probably a better estimate of the impact of the bridge .
If the responses of pedestrians are included, the estimate increases to 529 fewer automobile trips because of the Greenway Bridge. This estimate is very close to the 520 fewer trips estimated by using the methodology that considers only trips to and from work and school. The lower estimates of 520 for summer automobile-trip reduction and 340 for winter automobiletrip reduction are therefore used and are considered to be conservative.
One final point should be made. The bicycle counts indicate that there were 10-15 percent fewer bicyclists on the bicycle system during the weekday surveys than on the average day. The average day was determined by looking at the bicycle counts over the bicycle path taken throughout the year. Therefore, the above estimate may be understated by that amount.
Increase in Winter Bicycling as a Result of Easier Access
As indicated earlier, 78 bicyclists reported during the winter survey that they would not have made the trip by bicycle if the Greenway Bridge had not been built.
•survey from noon to 6:00 p.m. 11 Survey from 7:30 to 9:30 a.m., 11 :00 a.m. to 1 :00 p.m., and 4:00 to 6:00 p.m. ~survey from 7:30 a,m, to 6:00 p.m.
34
Fifty-two of these people were interviewed on the Greenway Bridge. Bicyclists were not asked directly whether ease of access was responsible. Instead, a trip table was constructed (see Table 10) to determine whether the 52 trips were between locations whose accessibility had increased because of the new bridge. Table 10 gives the number of trips between any two loca-tions for bicyclists on the Greenway Bridge during the winter-weekday survey. The first number is the number interviewed who would not have made the trip if the Greenway Bridge had not been built. The second number is for the total trips indicated by bicyclists on the Greenway Bridge. Trips made between places whose
Table 6. Trip purpose of pedestrian trips for all bridges.
Trip Purpose (%)
Recrea- Shop- Personal Total Survey ti on Work School ping Business Other Sample
Tuesday, 4/4/78 34.6 24.4 3.8 15.4 21.8 0 78
Saturday, 5/20/78 77.2 1.9 0.6 8.9 3.2 8.2 158
Tuesday, 5/ 30/ 78 62.6 11. 7 4.3 9.8 6.1 5.5 163
Table 7. Number of bicycle trips generated by the Greenway Bridge. Category
accessibility is greater because of the bridge are footnoted.
Twenty-six bicycle trips that would not have been made if the bridge had not been built are between locations that have greater accessibility. Another 26, or 50 percent, however, are not between such locations. Fourteen of these trips are betwoon Willakonzio and Valley River, which are both north of the river. This ambiguity also shows up in the comparison of the two summer-weekday surveys (which are not given here). Befo.re the bridge was built there were no trips recorded between Willakenzie and Valley River; there were 20 such trips after the bridge opened.
It is possible that these people find the south-bank trail more pleasing and therefore now make a trip they would not have made if they had had to ride on the northbank trail. Another explanation would be that they were going to make an additional trip that relied on the greater accessibility provided by the Greenway Bridge.
One additional statistic points to the bridge providing greater ease of access. Sixty-five percent of those crossing the Greenway Bridge during the winter survey indicated that the bridge was the quickest way to make the trip-clearly a reflection of greater accessibility.
Those who would not have made trip by bicycle Number 78 420 135 Percent 14. 5 28.0 18.3
Number of trips per 5-day workweek and 2 -day weekend 780' 1680° 1350' Number who would not have made school or work trip by bicycle 34 52 Number of school and work trips per 5-day workweek 340' 520'
•Assumes that Tuesday is representative of weekdays and therefore that the same number of trips would be made on each workday , Therefore, multiply by 5 the number who would not have made the trip by bicycle. Then multiply this figure by 2 to take into account the return trips.
bSame as weekday except only two davs.
Table 8. Change in frequency of trips by Number of Responses various modes because of the Greenway Bridge.
Change in Winter Survey• Summer Surveyb
Number of Autzen Ferry Greenway Autzen Ferry Greenway Mode Trips Bridge Bridge Bridge Total Bridge Bridge Bridge Total
Total -183 +72 -111 +1115 +146 +1261 +564 +160 +724
Note: Joggers were not surveyed.
Table 10. Trip table to determine effect of Greenway Bridge on increased accessibility between origins and destinations (winter weekday survey).
Destination
W. Willam- W. Willam- Uni .. E. Willam- E. Willam- River- Missing Valley Willa- Down- River ette North ette South ver- ette North ette South bank Spring- and
Origin River kenzie town Bethel Road of 18th of 18th sity of 18th of 18th Trails field Other Total
north of 18th 1/2 0/0 0/0 0/0 0/0 2/3' 1/1 0/0 4/6 W. Willamette
south of 18th 0/0 0/0 0/0 0/0 0/0' 0/0 0/0 0/0 University 2/5 0/0 0/0 0/1' 0/0 0/0 2/6 E. Willamette
north of 18th 0/0 1/1 E. Willamette
0/0' 0/0 0/0 1/1
south of 18th Riverbank
0/0 1/3' 0/0 0/0 1/3
Trails 1/2' 0/0 1/1 2/3 Springfield 0/0 0/0 0/0 Missing and
other 0/0 ...Ql2_ Total 0/1 14/15 4/12 1/1 7/13 6/9 4/7 3/12 0/0 2/5 9/16 1/5 1/1 52/97
Note: Trips that would not have been made if Greenway Bridge were not built/all trips on Greenway Bridge. •Greater accessibility because of the Greenway Bridge (part of Willakenzie was accessible to downtown before the Greenway Bridge was built) .
Increased Use of other Segment s of the Bikeway Network
It was not possible to measure the magnitude of increased use of other segments of the bicycle system brought about by greater accessibility. It is, however, obvious that they are being used more. As Table 2 indicates, 135 weekday bicyclists reported that they would not have made the trip if the new bridge had not been built. This represents 18 percent of all bicyclists surveyed. This 18 percent clearly used other parts of the system to reach the Willamette River.
Demographics
Two demographic variables were surveyed for each bicyclist: income and age. These were compared with estimates for the city to see whether a group of people who were representative with respect to these variables were using the bicycle facility. In addition, students and those traveling to and from the University of Oregon were separated out so that their impact on the bicycle system could be measured.
Income
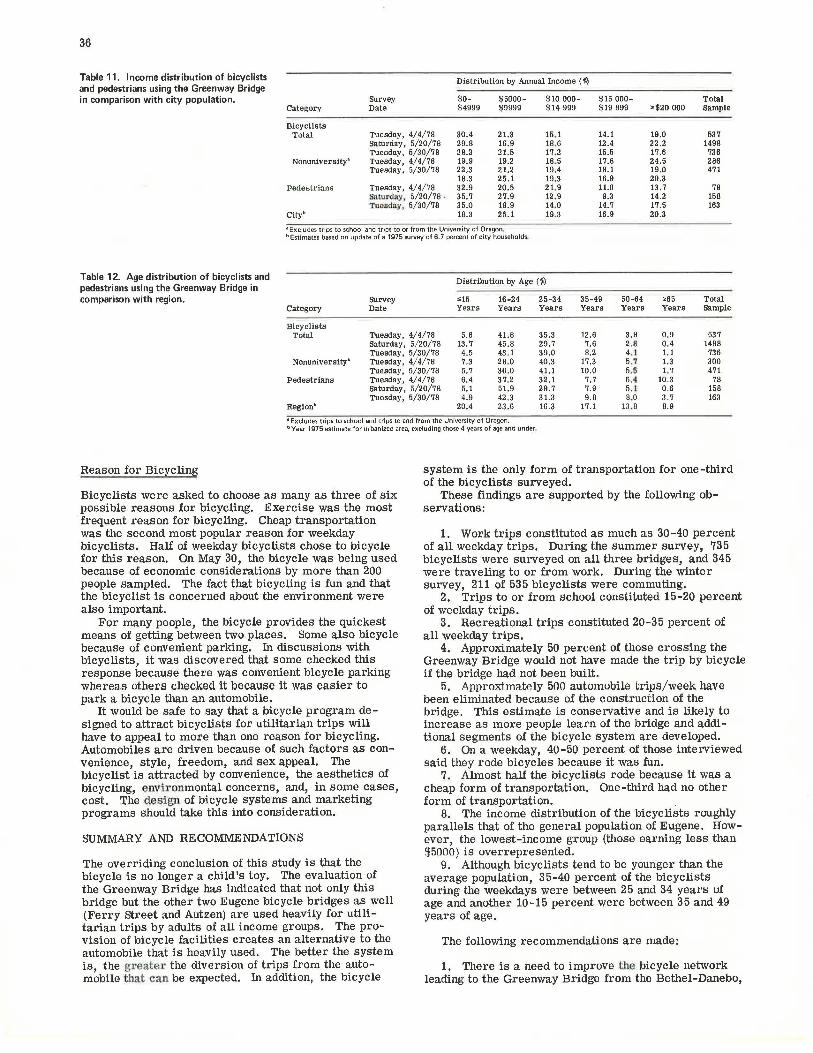
The income distribution of bicyclists is compared with that for the city in Table 11. The lowest-income group ($0-$4999) is overrepresented by approximately 10 percent of the total. If the university and student community is removed, the two distributions are similar. It does appear, however, that upper-income nonuniversity-related individuals make up a higher percentage of bicyclists on the bridge during the winter months.
As Table 11 indicates, the percentage of pedestrians who are in the lowest-income group is even higher than the percentage of bicyclists.
Age
The age distribution for bicyclists is given in Table 12. The distribution for the region is also shown. The regional figures exclude those 4 years of age and under, since they do not yet bicycle. Table 12 clearly indicates that those in the two age groups between 16 and 34 years of age make up the majority of the bicyclists. These age groups have higher percentages of bicycle ridership than the younger and older groups. The percentage of age groups riding bicycles decreases with each group beyond 35 years of age.
One interesting point should be made. Those in the age group from 35 to 49 years of age who are not going to or from school or making a trip to or from the university make up the same proportion of bicyclists as the regional population during the winter-weekday survey.
Pedestrians show a similar age distribution. As Table 12 indicates, 16- to 34-year-olds are overrepresented and the younger and older groups are underrepresented. As one might expect, younger adults clearly use the Greenway facility more frequently.
The demographics of those who use the Greenway Bridge are similar to those of people who use the other bridges. The one major difference is that incomes are higher. This is possibly attributable to fewer students using the Greenway Bridge. It is clear, however, that all age and income groups use the bridge.
36
Table 11. Income distribution of bicyclists and pedestrians using the Greenway Bridge in comparison with city population. Survey
a Excludes trips to school and trips to or from the University of Oregon. b Estimates based on update of a 1975 survey of 6. 7 percent of city households
Table 12. Age distribution of bicyclists and Distribution by Age (i) pedestrians using the Greenway Bridge in comparison with region. Survey ~15 16-24 25-34 35-49 50-64 >65 Total
Category Date Years Years Years Years Years Years Sample
ft Excludes trips to school and trips to and from the University of Oregon. bYear 1975 estimate for urbanized area, excluding those 4 years of age and under.
Reason for Bicycling
Bicyclists were asked to choose as many as three of six possible reasons for bicycling. Exercise was the most frequent reason for bicycling. Cheap transportation was the second most popular reason for weekday bicyclists. Half of weekday bicyclists chose to bicycle for this reason. On May 30, the bicycle was being used because of economic considerations by more than 200 people sampled. The fact that bicycling is fun and that the bicyclist is concerned about the environment were also important.
For many people, the bicycle provides the quickest means of getting between two places. Some also bicycle because of convenient parking. In discussions with bicyclists, it was discovered that some checked this response because there was convenient bicycle parking whereas others checked it because it was easier to park a bicycle than an automobile.
It would be safe to say that a bicycle program designed to attract bicyclists for utilitarian trips will have to appeal to more than one reason for bicycling. Automobiles are driven because of such factors as convenience, style, freedom, and sex appeal. The bicyclist is attracted by convenience, the aesthetics of bicycling, environmental concerns, and, in some cases, cost. The desig11 of bicycle systems and marketing programs should take this into consideration.
SUMMARY AND RECOMMENDATIONS
The overriding conclusion of this study is that the bicycle is no longer a child's toy. The evaluation of the Greenway Bridge has indicated that not only this bridge but the other two Eugene bicycle bridges as well (Ferry street and Autzen) are used heavily for utilitarian trips by adults of all income groups. The provision of bicycle facilities creates an alternative to the automobile that is heavily used. The better the system is, the greater the diversion of trips from the automobile that can be expected. In addition, the bicycle
system is the only form of transportation for one-third of the bicyclists surveyed.
These findings are supported by the following observations:
1. Work trips constituted as much as 30-40 percent of all weekday trips. During the summer survey, 735 bicyclists were surveyed on all three bridges, and 345 were traveling to or from work. During the winter survey, 211 of 535 bicyclists were commuting.
2. Trips to or from school constituted 15-20 percent of weekday trips.
3. Recreational trips constituted 20-35 percent of all weekday trips.
4. Approximately 50 percent of those crossing the Greenway Bridge would not have made the trip by bicycle if the bridge had not been built.
fl. Approximately 500 automobile trips/week have been eliminated because of the construction of the bridge. This estimate is conservative and is likely to increase as more people learn of the bridge and additional segments of the bicycle system are developed.
6. On a weekday, 40-50 percent of those interviewed said they rode bicycles because it was fun.
7. Almost half the bicyclists rode because it was a cheap form of transportation. One-third had no other form of transportation.
8. The income distribution of the bicyclists roughly parallels that of the general population of Eugene. However, the lowest-income group (those earning less than $5000) is overrepresented.
9. Although bicyclists tend to be younger than the average population, 35-40 percent of the bicyclists during the weekdays were between 25 and 34 yeani u.f age and another 10 - 15 percent were between 35 and 49 years of age.
The following recommendations are made:
1. There is a need to improve the bicycle network leading to the Greenway Bridge from the Bethel-Danebo,
River Road-Santa Clara, and Willakenzie areas. No surveys were taken to verify this, but riding the system has convinced me of this need. Railroad and industrial property provide a barrier for those in Bethel-Danebo. The bicycle path running along River Road is narrow and automobile traffic there is heavy, thereby increasing the danger and reducing the enjoyment of bicycling for those in River Road-Santa Clara. Those in Willakenzie are faced with the barrier of major freeways (I-105 and Delta Highway) and must navigate through the parking lot at Valley River Center. These barriers must be eliminated if the Greenway Bridge is to meet its full potential.
2. Parking for bicycles should be expanded. Although only 20 percent of bicyclists indicated that convenient parking was a reason for bicycling, it is something that can be provided. A higher percentage of bicyclists indicated that parking was a factor in the winter when the weather was bad. Covered bicycle parking would be a pleasant addition. Casual observation indicates that covered areas for bicycle parking at the University of Oregon store a higher percentage of all bicycles in the winter than in the summer. There are not enough covered spots.
3. Surveys should be made of randomly chosen individuals to ensure that a representative group of bicyclists and nonbicyclists is interviewed. If this were done by mail, longer surveys could be used and more information could be gathered. Surveys on the
bicycle paths should also be done. A comparison of both surveys would allow for some comparison and validation of the findings.
37
4. This evaluation took place shortly after the Greenway Bridge opened. An evaluation should be made in another year to measure the long-term effects.
5. Permanent counters should be installed in future demonstration projects. The rubber hoses on the temporary counters are vandalized, which makes accurate counts difficult. Permanent counters should also be installed at the Greenway Bridge to facilitate the long-term evaluation.
6. Signing is inadequate and should be improved. The approach to the bicycle-path system from River Road does not indicate that a bridge to Valley River exists.
ACKNOWLEDGMENT
David Reinhard and Diane Bishop of the city of Eugene developed the initial survey and shared in the development of the second survey, and Diane Bishop helped to supervise the survey team. They deserve much of the credit for this paper.
Publication of this paper sponsored by Committee on Bicycling and Bicycle Facilities.
On-Road Improvements for Bicyclists in Maryland Gregory M. Jones, Baltimore County Department of Traffic Engineering, Towson,
Maryland
With the decrease of highway revenues, funds are not available to construct a large system of conventional bicycle routes that are separate from motor-vehicle lanes. The new transportation system management approach to transportation planning places emphasis on efficient use of the existing highway network rather than its expansion. For these reasons, it is now necessary to treat the bicycle as a design vehicle in the design and maintenance of highways without the construction of separate facilities for bicyclists. Three types of low-cost, on-road types of improvements for bicyclists implemented in Baltimore County, Maryland, are discussed: (a) wide curb lanes that provide additional width in the right-most lane by slightly narrowing adjacent lanes, (b) smooth shoulders that facilitate bicycle travel on existing roads, and (c) parking changes that provide more room on the street for bicyclists and increase sight distance for bicyclists and motorists.
Before 1900, bicyclists were a major impetus for improving both urban and rural roads, most of which did not have a hard surface. Bicycle route maps were published that showed roads suitable for bicycling. For example, an 1896 bicycle route map of the Washington, D.C., area Q) not only showed the roads that bicyclists could ride on but also indicated severity of grade and summits of hills by appropriate symbols. As more roads were resurfaced with brick, concrete, and macadam, to the benefit of bicyclists, motor vehicles became dominant and improving roadways for the benefit of bicyclists was forgotten.
Even today, with the increase of interest in the construction of bicycle facilities, adequate consideration is not being given to the bicycle as a design vehicle for the highway network. For the most part, improvements for bicyclists are strictly limited to officially marked or mapped bicycle routes or obvious hazards such as parallel-bar storm-drain grates, which trap bicycle wheels. Unfortunately, these improvements represent only a fraction of the potential improvements that can be made for bicyclists.
This paper reports on three types of improvements for bicyclists and moped riders that have been implemented in Baltimore County, Maryland, and that can be applied economically to many types of roads in the United states. These improvements are
1. Wide curb lanes that provide additional width in the right-most lane where most bicycle travel occurs (this additional width is obtained by narrowing slightly, where possible, the lanes fo1· the same direction and adding this width to the right-most curb lane);
2, Shoulder improvements that facilitate bicycle travel on existing roads; and
3. Prohibiting parking near intersections based on bicycle design speed to provide better sight distance for bicyclists and motorists entering the intersection.