Greenwich Academic Literature Archive (GALA) – the University of Greenwich open access repository http://gala.gre.ac.uk __________________________________________________________________________________________ Citation for published version: Mateus, Cesario, Hall, Thomas and Mateus, Irina B. (2015) Are listed Firms Better Governed? Empirical evidence on board structure and financial performance. Corporate Ownership & Control, 13 (1). pp. 736-755. ISSN ISSN - 1727-9232 (Print), ISSN - 1810-3057 (Online) Publisher’s version available at: http://www.virtusinterpress.org/ARE-LISTED-FIRMS-BETTER-GOVERNED.html __________________________________________________________________________________________ Please note that where the full text version provided on GALA is not the final published version, the version made available will be the most up-to-date full-text (post-print) version as provided by the author(s). Where possible, or if citing, it is recommended that the publisher’s (definitive) version be consulted to ensure any subsequent changes to the text are noted. Citation for this version held on GALA: Mateus, Cesario, Hall, Thomas and Mateus, Irina B. (2015) Are listed Firms Better Governed? Empirical evidence on board structure and financial performance. London: Greenwich Academic Literature Archive. Available at: http://gala.gre.ac.uk/14997/ __________________________________________________________________________________________ Contact: [email protected]
Transcript
Greenwich Academic Literature Archive (GALA)– the University of Greenwich open access repository
Please note that where the full text version provided on GALA is not the final published
version, the version made available will be the most up-to-date full-text (post-print) version as
provided by the author(s). Where possible, or if citing, it is recommended that the publisher’s
(definitive) version be consulted to ensure any subsequent changes to the text are noted.
Citation for this version held on GALA:
Mateus, Cesario, Hall, Thomas and Mateus, Irina B. (2015) Are listed Firms Better Governed? Empirical evidence on board structure and financial performance. London: Greenwich Academic Literature Archive.Available at: http://gala.gre.ac.uk/14997/
Corporate Ownership & Control / Volume 13, Issue 1, Autumn 2015, Continued – 7
736
ARE LISTED FIRMS BETTER GOVERNED? EMPIRICAL EVIDENCE ON BOARD STRUCTURE AND FINANCIAL
PERFORMANCE
Cesario Mateus*, Thomas Hall**, Irina B. Mateus*
Abstract
We examine the relationship among board characteristics (network centrality, leadership structure, outsider participation, portion of male directors, director age, and presence of financial experts) and firm-level financial performance (cash holdings, leverage, ROA, risk, and risk-adjusted return). Our data encompass firms from eight countries during 2003-2012. Unlisted firms are smaller and have less leverage. Despite the fact that unlisted firms have prima facie better average governance (they are less likely to have an executive chair (or CEO as chair of the board) and a higher average portion of outside directors), they exhibit worse risk-adjusted returns. Higher levels of director connectedness (centrality) are generally associated with more observable entrenchment (more cash, less leverage), whereas other board characteristics do not show clear relationships with entrenchment. Our findings are consistent with the view that firmly established CEOs are willing and able to pack the board with qualified and connected members, who nevertheless do not act to constrain CEO entrenchment. This is true for both listed and unlisted firms. Keyword: Directors, Network Centrality, Liquidity, Capital Structure, Firm Performance * University of Greenwich – Faculty of Business, London, United Kingdom ** Christopher Newport University, Newport News, USA 1. Introduction
In this paper, we critically examine the long-held view that managers of firms with dispersed ownership (vis-à-vis privately held firms) are less effective at monitoring and controlling CEO entrenchment.1 Our central research question is whether listing status (broad market, narrow market, unlisted) affects the relationship between board characteristics and firm performance. In general, listing status is associated with the degree of ownership dispersion, such that firms listed on large public stock exchanges, even though they may have blockholders, often face larger agency costs vis-à-vis privately held firms that have little ownership dispersion. In this view, the governance structure of privately held firms2 would be
1 Indeed, incentive realignment has been found to be a major motivation for UK firms that convert from public to private status (Wright, Timmons, and Renneboog, 2006). 2 Although publicly traded firms face conflicts between dispersed owners and managers, privately held firms face conflicts between controlling and minority shareholders, which can lead to tunneling. This is not a key aspect of the present study, however, because presumably shareholders who control a CEO could also control a board. This means the presence of outside board members, split CEO/chair leadership structure, etc. should not be relevant for (by definition) “controlling” shareholders.
expected to have a lower impact on performance than in publicly traded companies (Ferreira, et al 2013).
We measure board structure along several dimensions: network centrality of the directors, executive role of the board’s char (including dual CEO/chair status), portion of outside directors, age, and portion male. Our measures of firm performance are somewhat limited compared to typical studies of publicly traded companies because by definition unlisted firms have less transparent share prices; we focus on cash/total assets, capital structure (long-term debt/total assets), risk (standard deviation of ROA) and risk-adjusted return (measured as the coefficient of variation, or ROA standard deviation. Our data encompass firms from eight countries (Belgium, Finland, France, Germany, Italy, the Netherlands, Spain, and the United Kingdom) during 2003-2012.
We find that unlisted firms are smaller and have less leverage. Despite the fact that unlisted firms have prima facie better average governance (they are less likely to have an executive chair (or CEO as chair of the board) and a higher average portion of outside directors), they exhibit worse risk-adjusted returns. Higher levels of director connectedness (centrality) are generally associated with more observable entrenchment (more cash, less leverage), whereas
Corporate Ownership & Control / Volume 13, Issue 1, Autumn 2015, Continued – 7
737
other board characteristics do not show clear relationships with entrenchment. Our findings are consistent with the view that firmly established CEOs are willing and able to pack the board with qualified and connected members, who nevertheless do not act to constrain CEO entrenchment. This is true for both listed and unlisted firms.
The paper proceeds as follows. Section 2 provides an abridged overview of the vast literature on the relationship between firm performance board characteristics, and clearly enumerates the central hypothesis of our study. Section 3 presents information on the two data sets we employ (BoardEx for information on board characteristics; Orbis for information on firm performance). The models and procedures used to construct variables are covered next. Section 4 presents results, with section 5 devoted to robustness tests. The conclusion is presented in section 6.
2. Literature and Hypotheses
2.1 Literature
There is an extensive literature on the corporate governance of publicly traded firms, but information on corporate governance of privately held companies is much less substantial. Classical finance theory argues that entrenched managers can extract value from dispersed shareholders of publicly traded firms, and more recent analysis of this argument (Bebchuck, et al 2002) is known as the “managerial power” approach. In terms of the present study, because of coordination problems among dispersed shareholders, CEOs of publicly traded firms are more likely to be unconstrained by owners vis-à-vis privately held firms. So, listing status3 (as a proxy for shareholder dispersion) should affect how board characteristics affect financial performance. Of course, even publicly traded firms can be dominated by blockholders (and by the role of the press, as in Kuhnen and Niessen 2012), but that can lead to problems whereby dominant shareholders divert earnings from minority shareholders. Because the latter is more likely in privately held firms, the research to date is ambiguous in terms of how (or whether) ownership structure is related to performance. For this reason, our study addresses a significant gap in understanding of the relationship between performance and governance of privately held vis-à-vis publicly traded firms. Specifically, we address the issue of how board characteristics (network centrality, age, gender, chair executive role or even CEO) relate to performance. 3 The importance of cross listing in allowing a firm to “choose” its corporate governance regime is explored by Goergen and Renneboog, 2008.
Several recent papers (e.g., Brown, et al 2010; Liu 2010; Renneboog and Zhao 2011; Fracassi and Tate 2012; Faleye 2012) have examined the importance of network centrality of either boards of directors or CEOs, but they tend to focus on publicly traded companies. Alonso and Aperto (2011) find that more outsiders on the board increase the chance that CEO pay is linked to equity value; Han and Yang (2013) present a model that examines the implications of social network communication on welfare, cost of capital, liquidity, and trading volume. In general, network centrality seems to confer advantages on those who possess higher levels of it, although for board of directors, the evidence is somewhat ambiguous. On the one hand, there seems to be evidence that interlocking board membership allows the proliferation of bad habits such as option backdating (Bizjak, et al 2007). Directors that serve on multiple boards seem to be less able to monitor and effectively curtail CEO entrenchment (Fich and Shivdasani 2006). In terms of specific competence of board members, Minton et al 2011 find that, for commercial banks in the United States, financial expertise of board members has a negative impact on performance. On the other hand, Larcker, et al (2012), find that firms with well-connected directors earn superior risk-adjusted returns vis-à-vis other firms. Horton, et al (2009) find that network centrality of board members improves performance of their firm. The fact that “friendly” boards have both costs and benefits is explored by Schmidt (2008).
One advantage of comparing listed to unlisted firms is that we can obtain unique insight on a complex feature of the interaction of boards with performance—complementarity among how different mechanisms may have varying impacts in different national contexts (Goergen 2007). A study by de Jong, et al (2002) finds that governance mechanisms are different in different countries, so that where the market for corporate control (take-overs) is robust, board characteristics are not as important in mitigating entrenchment (a related study was undertaken by Dimopoulos and Wagner 2010). Because we have information on companies located in eight European countries, we can present some insight on whether any of the public/private distinctions in board effects on performance are relevant in different institutional contexts (Martynova and Renneboog 2011). The difference between private and public firm investment indicates that there may be substantial differences in governance between the two types of companies (Gilje and Taillard 2013). Because of a high level of cross-sectional variation in Germany and the UK (Goergen 1997), it makes sense to include these two countries in our study; we also include a number of other countries which had a good overlap between the
Corporate Ownership & Control / Volume 13, Issue 1, Autumn 2015, Continued – 7
738
Orbis and BoardEx information we used to construct our data.
A number of recent papers have considered how board strength interacts with performance. Strong CEOs can pack the board with lightweight members (“cheerleaders”) that will not monitor management effectively (Fracassi and Tate 2012; Cohen, et al 2012; Nguyen,2012). On the other hand, a high level of entrenchment-induced job security might mean that the CEO feels confident enough to allow strong boards to be assembled (Cornelli, et al 2010). Board size had an impact on performance during the Great Depression (Graham, et al 2011). Board competence has also been addressed via network centrality, level of experience (Kang 2013), and industry experience (Faleye, et al 2013); the positive and negative aspects of advising vs. monitoring by boards is discussed in Schmidt (2008); the possibility that strong boards could lead to worse corporate performance is explored by Bach and Metzger (2013).
The role of gender in decision-making and boardroom dynamics has been the subject of several recent papers as well. Recent experimental evidence (Hoogendoorn, et al 2013) shows that the gender composition of business teams affects performance. Specifically, Ferreira (2009) surveys research related to gender diversity on boards of directors. Adams and Funk (2011) find evidence that female board members have more tolerance for risk, which could affect firm-level risk-taking. The recent change in Norweigian law mandating that 40% of board members be female allowed examination of the effects of such laws (Ahern and Dittmar 2012; Matsa and Miller 2010). In this unusual situation, the newly hired directors were on average younger and had less experience. But even in more normal circumstances, it makes sense to control for age and specific expertise (e.g., previous service as a financial director or CFO) as well when examining gender of board directors.
2.2 Hypotheses
Our central research question is whether listing status (large index, other index, unlisted) in different countries affects the relationship between board characteristics (network centrality, portion of outside directors, average age, portion male, and presence of financial experts) and firm performance (measured by cash/assets, leverage, standard deviation of ROA, and coefficient of ROA variation). If managerial incentive alignment for unlisted firms is of higher quality due to more ownership concentration, we might find that the composition and characteristics of the board of directors should have no relationship (or, a lesser relationship vis-à-vis publicly listed firms) to
performance. But what types of relationships should we expect in listed companies?
There are some ambiguities regarding how entrenchment could affect board characteristics. Entrenchment should be associated with a number of observable financial outcomes, however. For example, CEOs with little board oversight could be tempted to build up more cash reserves vis-à-vis rivals that exhibit more effective corporate governance (Schauten, et al 2008). Similarly, due to the fact that debt functions as a disciplining4 device, we might expect leverage to be lower in entrenched firms.
Presumably, risk (here, measured as the standard deviation of ROA) should be lower for entrenched firms for the same reasons, although this may not be as straightforward as for leverage due to some complexities concerning unlisted vis-à-vis listed firms. Because publicly traded firm ownership can be easily diversified, shareholders might be more willing to see risk-taking in such settings. But because privately held firms tend to concentrate ownership, we might expect to see lower risk tolerance on the part of such investors (they might be less diversified, especially if the firm is family-owned). Finally, we might expect that one measure of returns adjusted for risk, the coefficient of variation (defined as the standard deviation of ROA over the mean value of ROA) should be lower (meaning, a better investment) for privately held firms for the simple reason that there may be some discount on prices for illiquid shares of unlisted companies, reflected in a higher average return for unit of risk.
3. Data and Models 3.1 Data and Descriptive Statistics
Our paper operationalizes three separate issues: board characteristics, firm performance, and listing status. Board characteristics are primarily measured by (1) whether the chair has a day-to-day role in managing the company (i.e., either as an executive chair or as CEO), (2) the portion of outside (non-executive) members on the board, (3) network centrality defined as the average level of connectedness of the board, (4) the portion of male directors, (5) director age, and (6) whether any director has experience as a financial director or CFO. Centrality is operationalized by taking the mean level of the BoardEx variable “Number of Connections” for each firm-year (Liu, 2010, provides information on how this variable is constructed: “BoardEx consolidates information concerning the board of directors and senior
4 For an examination of disciplining devices in Europe, see Koke, Dherment-Ferere, and Renneboog, 2001.
Corporate Ownership & Control / Volume 13, Issue 1, Autumn 2015, Continued – 7
739
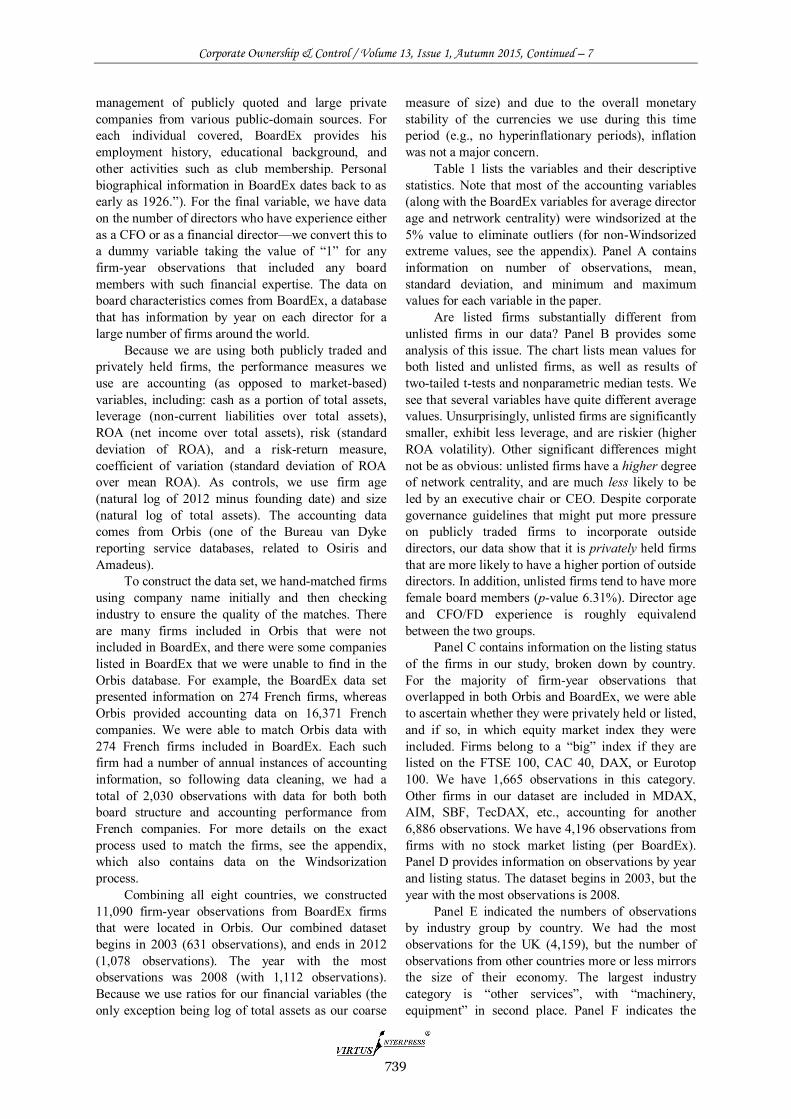
management of publicly quoted and large private companies from various public-domain sources. For each individual covered, BoardEx provides his employment history, educational background, and other activities such as club membership. Personal biographical information in BoardEx dates back to as early as 1926.”). For the final variable, we have data on the number of directors who have experience either as a CFO or as a financial director—we convert this to a dummy variable taking the value of “1” for any firm-year observations that included any board members with such financial expertise. The data on board characteristics comes from BoardEx, a database that has information by year on each director for a large number of firms around the world.
Because we are using both publicly traded and privately held firms, the performance measures we use are accounting (as opposed to market-based) variables, including: cash as a portion of total assets, leverage (non-current liabilities over total assets), ROA (net income over total assets), risk (standard deviation of ROA), and a risk-return measure, coefficient of variation (standard deviation of ROA over mean ROA). As controls, we use firm age (natural log of 2012 minus founding date) and size (natural log of total assets). The accounting data comes from Orbis (one of the Bureau van Dyke reporting service databases, related to Osiris and Amadeus).
To construct the data set, we hand-matched firms using company name initially and then checking industry to ensure the quality of the matches. There are many firms included in Orbis that were not included in BoardEx, and there were some companies listed in BoardEx that we were unable to find in the Orbis database. For example, the BoardEx data set presented information on 274 French firms, whereas Orbis provided accounting data on 16,371 French companies. We were able to match Orbis data with 274 French firms included in BoardEx. Each such firm had a number of annual instances of accounting information, so following data cleaning, we had a total of 2,030 observations with data for both both board structure and accounting performance from French companies. For more details on the exact process used to match the firms, see the appendix, which also contains data on the Windsorization process.
Combining all eight countries, we constructed 11,090 firm-year observations from BoardEx firms that were located in Orbis. Our combined dataset begins in 2003 (631 observations), and ends in 2012 (1,078 observations). The year with the most observations was 2008 (with 1,112 observations). Because we use ratios for our financial variables (the only exception being log of total assets as our coarse
measure of size) and due to the overall monetary stability of the currencies we use during this time period (e.g., no hyperinflationary periods), inflation was not a major concern.
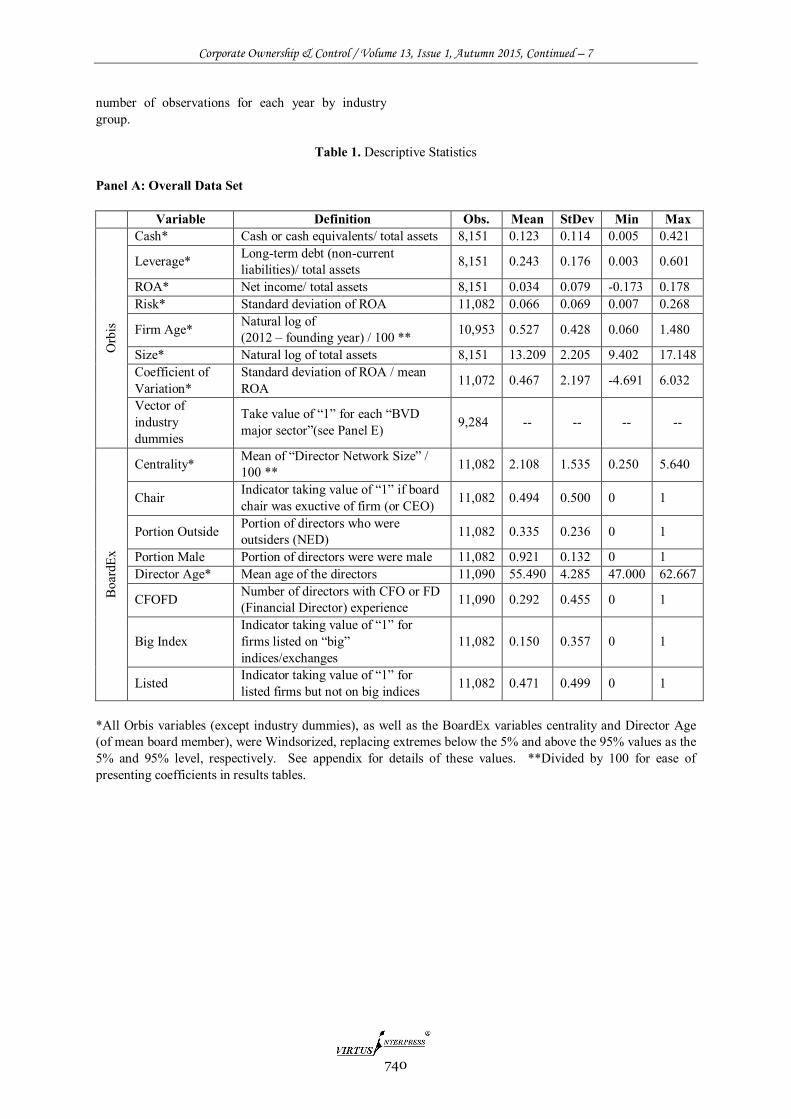
Table 1 lists the variables and their descriptive statistics. Note that most of the accounting variables (along with the BoardEx variables for average director age and netrwork centrality) were windsorized at the 5% value to eliminate outliers (for non-Windsorized extreme values, see the appendix). Panel A contains information on number of observations, mean, standard deviation, and minimum and maximum values for each variable in the paper.
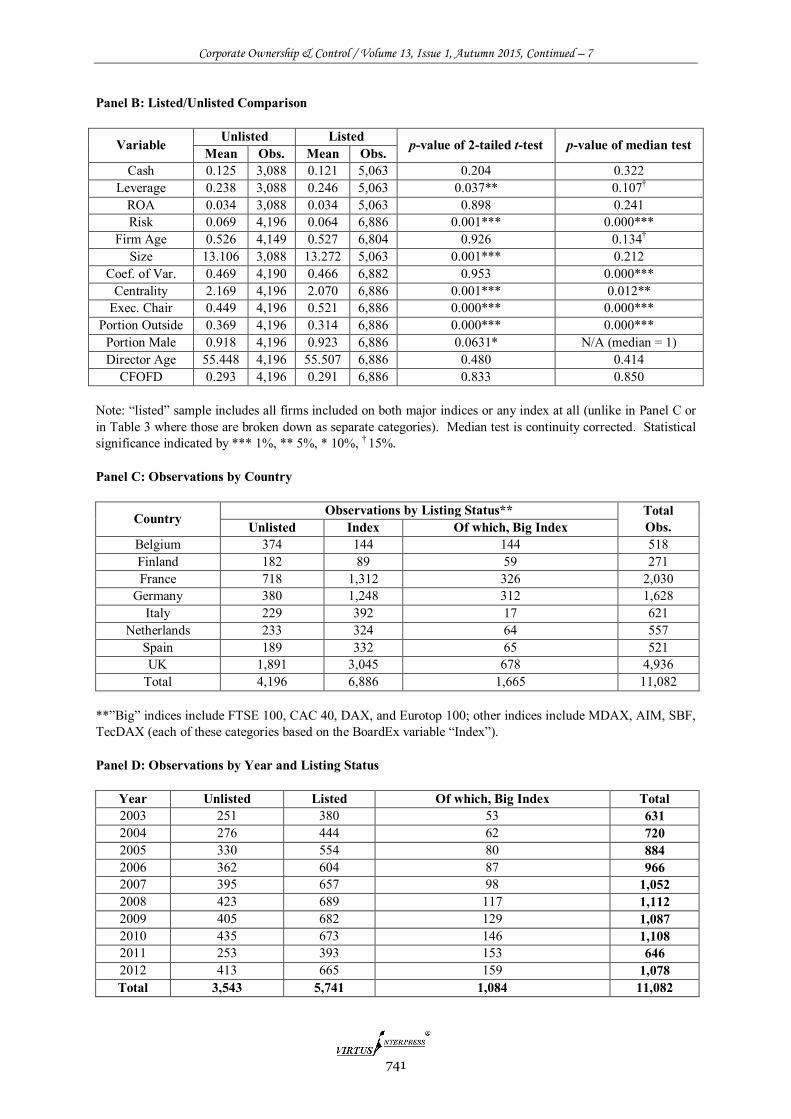
Are listed firms substantially different from unlisted firms in our data? Panel B provides some analysis of this issue. The chart lists mean values for both listed and unlisted firms, as well as results of two-tailed t-tests and nonparametric median tests. We see that several variables have quite different average values. Unsurprisingly, unlisted firms are significantly smaller, exhibit less leverage, and are riskier (higher ROA volatility). Other significant differences might not be as obvious: unlisted firms have a higher degree of network centrality, and are much less likely to be led by an executive chair or CEO. Despite corporate governance guidelines that might put more pressure on publicly traded firms to incorporate outside directors, our data show that it is privately held firms that are more likely to have a higher portion of outside directors. In addition, unlisted firms tend to have more female board members (p-value 6.31%). Director age and CFO/FD experience is roughly equivalend between the two groups.
Panel C contains information on the listing status of the firms in our study, broken down by country. For the majority of firm-year observations that overlapped in both Orbis and BoardEx, we were able to ascertain whether they were privately held or listed, and if so, in which equity market index they were included. Firms belong to a “big” index if they are listed on the FTSE 100, CAC 40, DAX, or Eurotop 100. We have 1,665 observations in this category. Other firms in our dataset are included in MDAX, AIM, SBF, TecDAX, etc., accounting for another 6,886 observations. We have 4,196 observations from firms with no stock market listing (per BoardEx). Panel D provides information on observations by year and listing status. The dataset begins in 2003, but the year with the most observations is 2008.
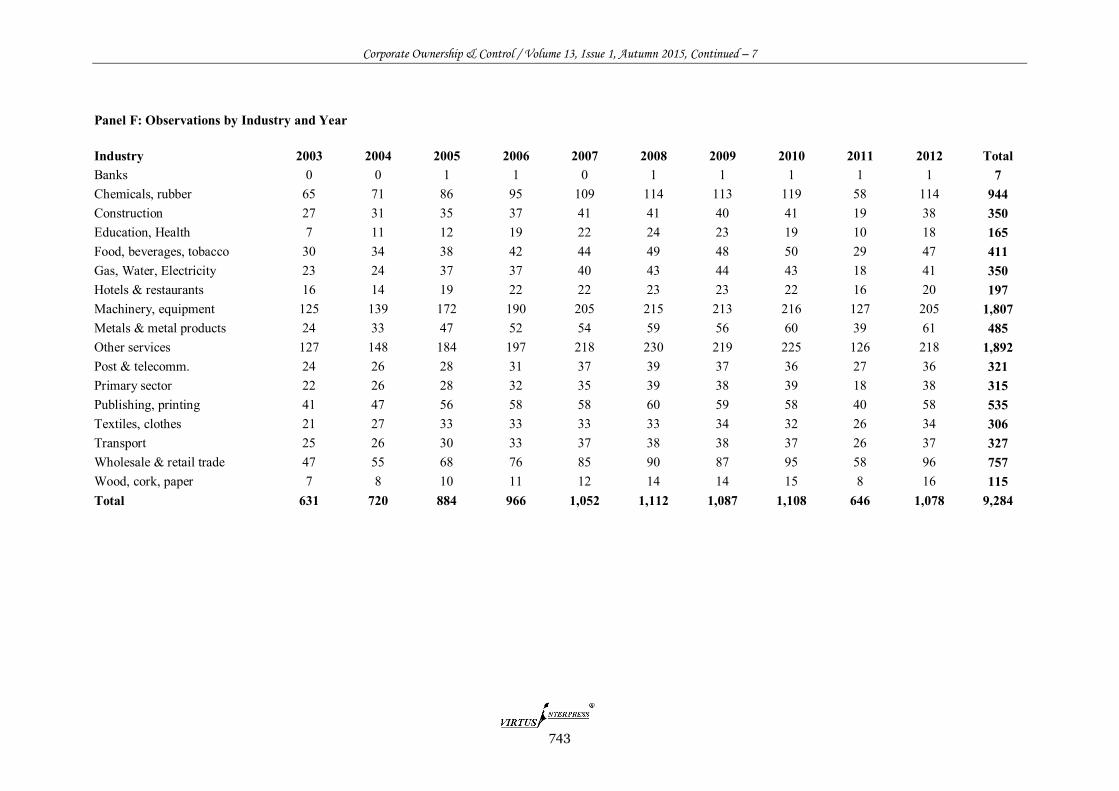
Panel E indicated the numbers of observations by industry group by country. We had the most observations for the UK (4,159), but the number of observations from other countries more or less mirrors the size of their economy. The largest industry category is “other services”, with “machinery, equipment” in second place. Panel F indicates the
Corporate Ownership & Control / Volume 13, Issue 1, Autumn 2015, Continued – 7
740
number of observations for each year by industry group.
Table 1. Descriptive Statistics
Panel A: Overall Data Set
Variable Definition Obs. Mean StDev Min Max
Orb
is
Cash* Cash or cash equivalents/ total assets 8,151 0.123 0.114 0.005 0.421
Size* Natural log of total assets 8,151 13.209 2.205 9.402 17.148 Coefficient of Variation*
Standard deviation of ROA / mean ROA 11,072 0.467 2.197 -4.691 6.032
Vector of industry dummies
Take value of “1” for each “BVD major sector”(see Panel E) 9,284 -- -- -- --
Boa
rdEx
Centrality* Mean of “Director Network Size” / 100 ** 11,082 2.108 1.535 0.250 5.640
Chair Indicator taking value of “1” if board chair was exuctive of firm (or CEO) 11,082 0.494 0.500 0 1
Portion Outside Portion of directors who were outsiders (NED) 11,082 0.335 0.236 0 1
Portion Male Portion of directors were were male 11,082 0.921 0.132 0 1 Director Age* Mean age of the directors 11,090 55.490 4.285 47.000 62.667
CFOFD Number of directors with CFO or FD (Financial Director) experience 11,090 0.292 0.455 0 1
Big Index Indicator taking value of “1” for firms listed on “big” indices/exchanges
11,082 0.150 0.357 0 1
Listed Indicator taking value of “1” for listed firms but not on big indices 11,082 0.471 0.499 0 1
*All Orbis variables (except industry dummies), as well as the BoardEx variables centrality and Director Age (of mean board member), were Windsorized, replacing extremes below the 5% and above the 95% values as the 5% and 95% level, respectively. See appendix for details of these values. **Divided by 100 for ease of presenting coefficients in results tables.
Corporate Ownership & Control / Volume 13, Issue 1, Autumn 2015, Continued – 7
741
Panel B: Listed/Unlisted Comparison
Variable Unlisted Listed p-value of 2-tailed t-test p-value of median test Mean Obs. Mean Obs. Cash 0.125 3,088 0.121 5,063 0.204 0.322
Portion Male 0.918 4,196 0.923 6,886 0.0631* N/A (median = 1) Director Age 55.448 4,196 55.507 6,886 0.480 0.414
CFOFD 0.293 4,196 0.291 6,886 0.833 0.850 Note: “listed” sample includes all firms included on both major indices or any index at all (unlike in Panel C or in Table 3 where those are broken down as separate categories). Median test is continuity corrected. Statistical significance indicated by *** 1%, ** 5%, * 10%, † 15%. Panel C: Observations by Country
Country Observations by Listing Status** Total Obs. Unlisted Index Of which, Big Index
Belgium 374 144 144 518 Finland 182 89 59 271 France 718 1,312 326 2,030
Total 4,196 6,886 1,665 11,082 **”Big” indices include FTSE 100, CAC 40, DAX, and Eurotop 100; other indices include MDAX, AIM, SBF, TecDAX (each of these categories based on the BoardEx variable “Index”). Panel D: Observations by Year and Listing Status
Corporate Ownership & Control / Volume 13, Issue 1, Autumn 2015, Continued – 7
744
3.2 Variables and Models
Our initial dependent variables are performance measured as cash/assets, capital structure, ROA, and
risk (standard deviation of ROA). In a set of extended models, we also examine the coefficient of variation (standard deviation of ROA divided by mean ROA).
where P is a measure of firm performance (initially, we examine separately cash/assets, capital structure measured as long-term debt over total assets, risk measured as standard deviation of ROA—in subsequent specifications, we examine coefficient of variation as the dependent variable). SIZE is measured as the natural log of total assets, AGE is measured in the natural log of years since the firm was founded. BOARD refers to board member characteristics (network centrality, portion of outside or non-executive directors, age, portion male, presence of a financial expert). Finally, CONTROLS refers to several control variables used in some (but not all) specifications, including some of the performance measures (cash, leverage, and ROA). For most specifications, we use GLS (random effects) with the time dimension t as years and indexed i for firm. Generally, we use industry dummies (omitted category is “other services”) and country dummies (omitted category is UK). In specifications using risk (e.g., in Table 2, specifications E, F, and G) or coefficient of variation as the dependent variable, we use OLS with error terms clustered at the firm level (GLS is not appropriate because risk does not vary for an individual firm). In robustness tests (below), we are forced to omit the vectors of dummy variables because we use firm-level fixed effects.
4. Results
4.1 Baseline Model
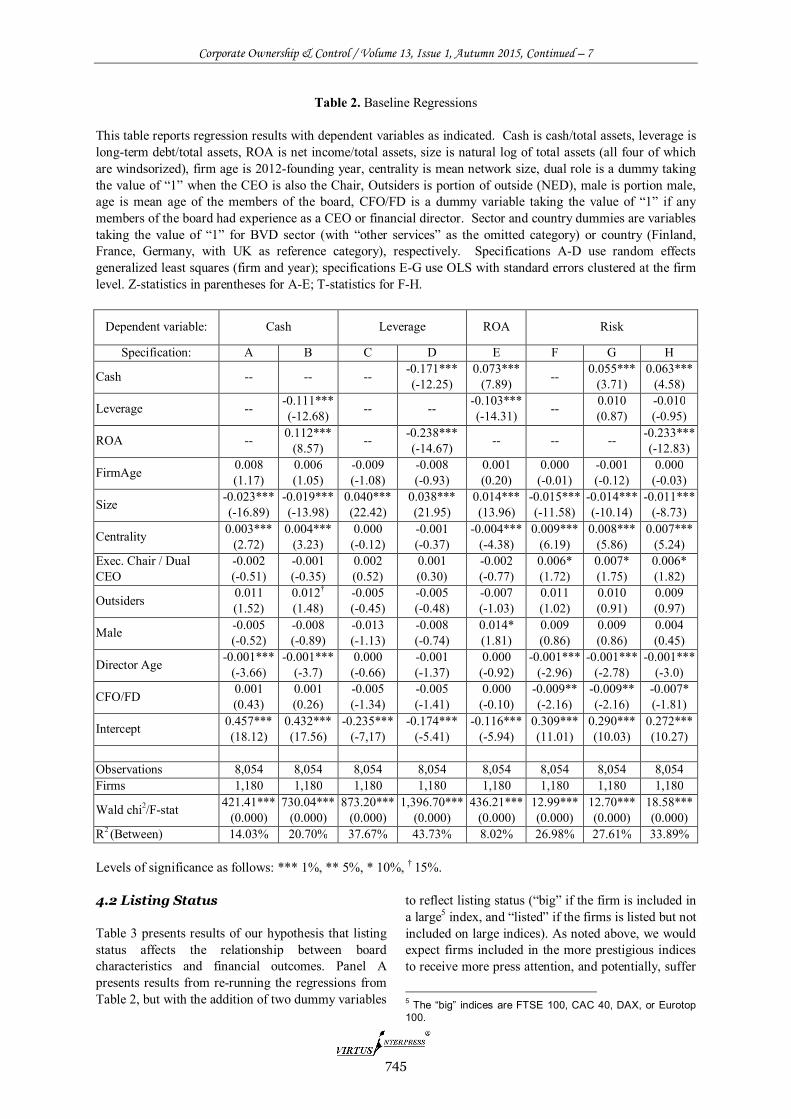
Table 2 provides the first set of results, the baseline models A-G we will employ subsequently. The specifications include the full sample. Overall, the Wald Chi2 figures are large and highly significant, which is not surprising given the sample size. There are 8,054 observations per specification, with 1,180 firms represented, for an average of about eight firm-year observations per company. The R2 values are typical of studies that employ a large amount of firm-level data from privately held companies (Cole 2013; Hall 2012).
One of the clearest findings from the initial tests is the fact that network centrality is closely related to cash holdings and level of risk. Firms with more connected boards have more cash, lower ROA, but are riskier (higher standard deviation of ROA). Director
age is significant in many specifications-older directors are associated with lower levels of cash holdings and less risk. This could indicate that older directors (presumably with more experience) are more able to constrain entrenched CEOs. Later, we will consider the role of directors in firms with executive chairs (including dual CEOs) vis-à-vis non-executive chairs. Surprisingly, the coefficient for the CEO variable is positive and significant in the risk regressions, counter to expectations that an entrenched CEO or executive chair would reduce the riskiness of the firm’s decisions.
In terms of accounting relationships, firm size is (unsurprisingly) correlated with leverage-it is well-documented that larger firms tend to hold more debt as a portion of assets. Cash holdings are lower at larger firms, perhaps due to lesser need for precautionary balances (Schauten, et al 2008; Hall, et al 2013). Smaller firms tend to be riskier, which reflects the fact that they are likely to have less diversified streams of income; generally, larger firms with multiple divisions and product lines are likely to exhibit less cash flow volatility.
Corporate Ownership & Control / Volume 13, Issue 1, Autumn 2015, Continued – 7
745
Table 2. Baseline Regressions This table reports regression results with dependent variables as indicated. Cash is cash/total assets, leverage is long-term debt/total assets, ROA is net income/total assets, size is natural log of total assets (all four of which are windsorized), firm age is 2012-founding year, centrality is mean network size, dual role is a dummy taking the value of “1” when the CEO is also the Chair, Outsiders is portion of outside (NED), male is portion male, age is mean age of the members of the board, CFO/FD is a dummy variable taking the value of “1” if any members of the board had experience as a CEO or financial director. Sector and country dummies are variables taking the value of “1” for BVD sector (with “other services” as the omitted category) or country (Finland, France, Germany, with UK as reference category), respectively. Specifications A-D use random effects generalized least squares (firm and year); specifications E-G use OLS with standard errors clustered at the firm level. Z-statistics in parentheses for A-E; T-statistics for F-H.
R2 (Between) 14.03% 20.70% 37.67% 43.73% 8.02% 26.98% 27.61% 33.89% Levels of significance as follows: *** 1%, ** 5%, * 10%, † 15%. 4.2 Listing Status Table 3 presents results of our hypothesis that listing status affects the relationship between board characteristics and financial outcomes. Panel A presents results from re-running the regressions from Table 2, but with the addition of two dummy variables
to reflect listing status (“big” if the firm is included in a large5 index, and “listed” if the firms is listed but not included on large indices). As noted above, we would expect firms included in the more prestigious indices to receive more press attention, and potentially, suffer
5 The “big” indices are FTSE 100, CAC 40, DAX, or Eurotop 100.
Corporate Ownership & Control / Volume 13, Issue 1, Autumn 2015, Continued – 7
746
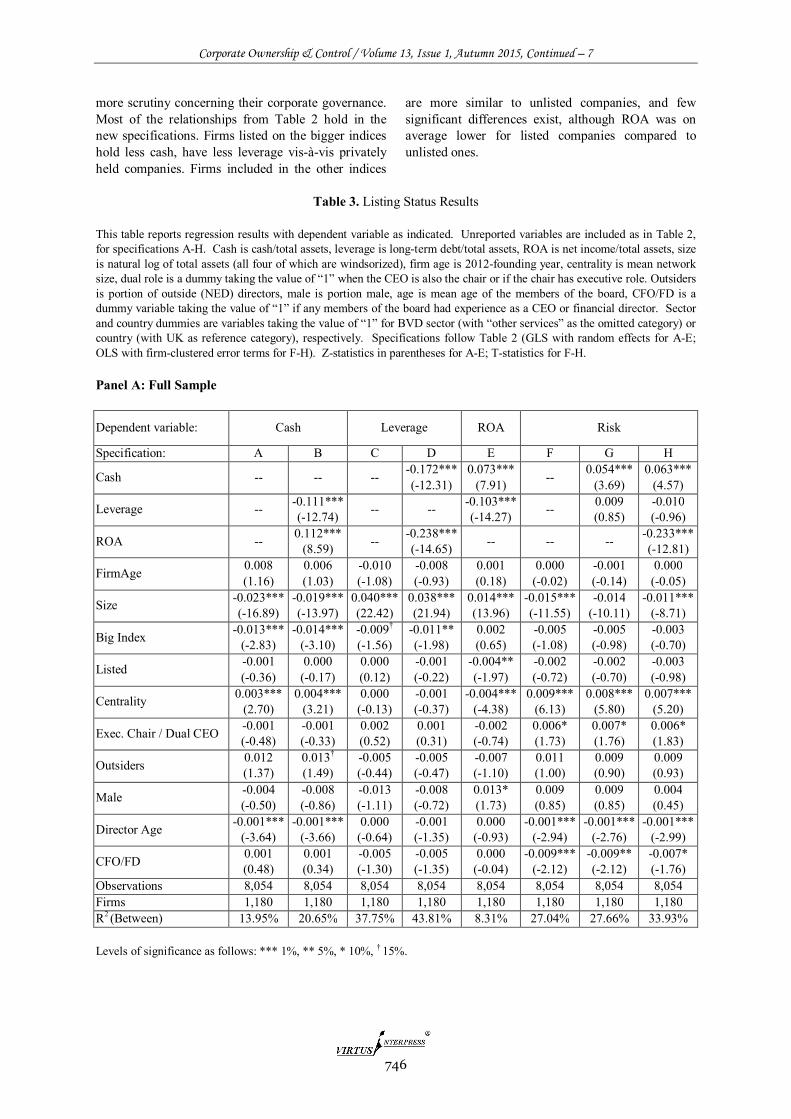
more scrutiny concerning their corporate governance. Most of the relationships from Table 2 hold in the new specifications. Firms listed on the bigger indices hold less cash, have less leverage vis-à-vis privately held companies. Firms included in the other indices
are more similar to unlisted companies, and few significant differences exist, although ROA was on average lower for listed companies compared to unlisted ones.
Table 3. Listing Status Results
This table reports regression results with dependent variable as indicated. Unreported variables are included as in Table 2, for specifications A-H. Cash is cash/total assets, leverage is long-term debt/total assets, ROA is net income/total assets, size is natural log of total assets (all four of which are windsorized), firm age is 2012-founding year, centrality is mean network size, dual role is a dummy taking the value of “1” when the CEO is also the chair or if the chair has executive role. Outsiders is portion of outside (NED) directors, male is portion male, age is mean age of the members of the board, CFO/FD is a dummy variable taking the value of “1” if any members of the board had experience as a CEO or financial director. Sector and country dummies are variables taking the value of “1” for BVD sector (with “other services” as the omitted category) or country (with UK as reference category), respectively. Specifications follow Table 2 (GLS with random effects for A-E; OLS with firm-clustered error terms for F-H). Z-statistics in parentheses for A-E; T-statistics for F-H. Panel A: Full Sample
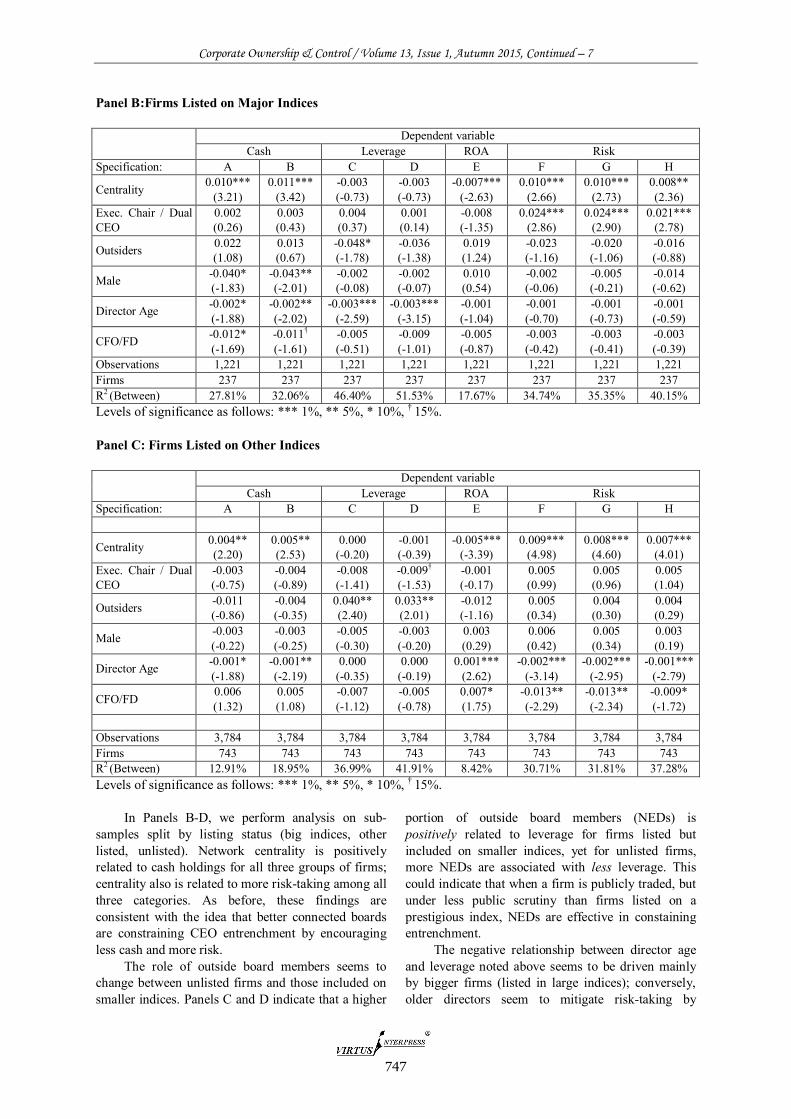
In Panels B-D, we perform analysis on sub-samples split by listing status (big indices, other listed, unlisted). Network centrality is positively related to cash holdings for all three groups of firms; centrality also is related to more risk-taking among all three categories. As before, these findings are consistent with the idea that better connected boards are constraining CEO entrenchment by encouraging less cash and more risk.
The role of outside board members seems to change between unlisted firms and those included on smaller indices. Panels C and D indicate that a higher
portion of outside board members (NEDs) is positively related to leverage for firms listed but included on smaller indices, yet for unlisted firms, more NEDs are associated with less leverage. This could indicate that when a firm is publicly traded, but under less public scrutiny than firms listed on a prestigious index, NEDs are effective in constaining entrenchment.
The negative relationship between director age and leverage noted above seems to be driven mainly by bigger firms (listed in large indices); conversely, older directors seem to mitigate risk-taking by
Corporate Ownership & Control / Volume 13, Issue 1, Autumn 2015, Continued – 7
748
companies listed on smaller indices (but not unlisted firms). The leadership variable (executive chair or CEO as chair) is significantly related to risk for large firms, but not for unlisted firms or firms listed on smaller indices.
How do these findings relate to expectations of entrenchment? Entrenchment is generally associated with high levels of cash, low leverage, and low risk. For all three listing categories (big, listed, unlisted), greater network centrality limits neither cash holdings nor leverage, and is positively associated with risk-taking. Older directors seem to have a negative impact on cash holdings (for all three groups) and do not encourage leverage (all three groups), but do not encourage risk either. Despite the fact that female directors have been found in the past to be less risk averse, where we have any significant relationship (unlisted firms), it appears that more male directors are associated with less volatile profitability. CFO/FD experience on the board is associated with less risk, but only for firms listed on smaller exchanges.
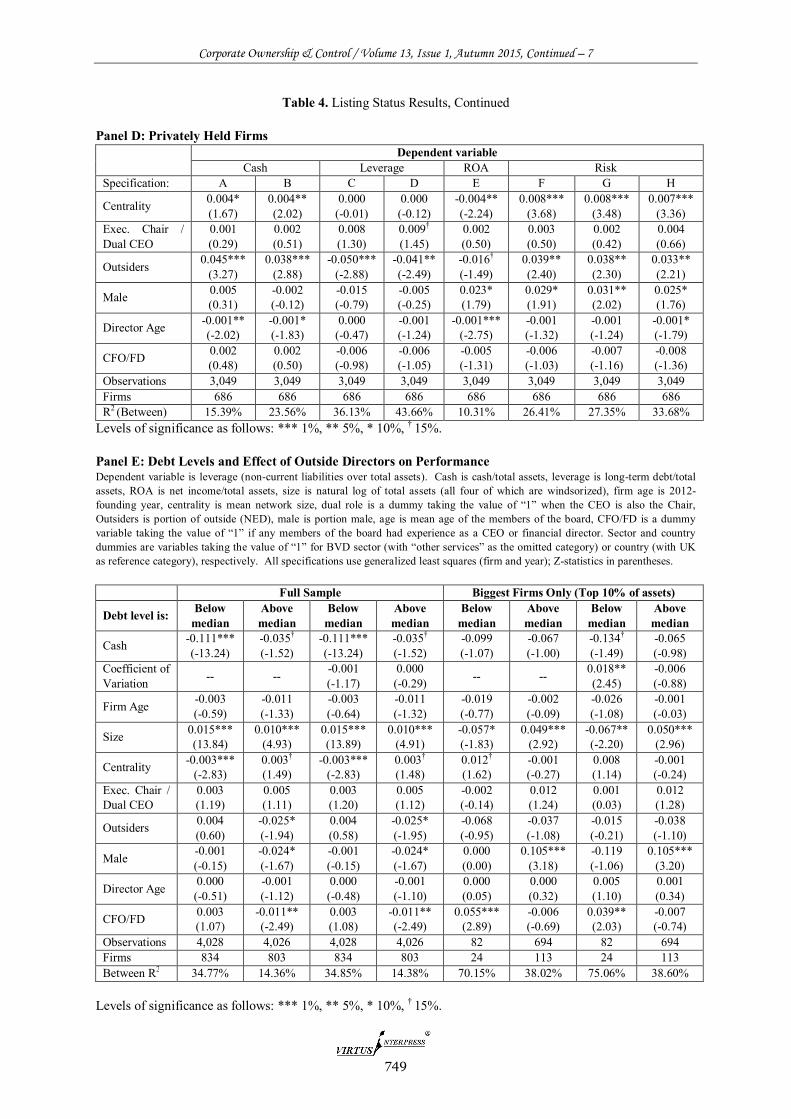
In Panel E, we consider more closely the relationship between non-executive director participation on the board and the firm’s leverage. Generally, entrenched managers would be expected to encourage lower leverage, ceteris paribus. We split the sample into two groups, based on whether leverage (non-current liabilities as a portion of total assets) is either below the median or above the median.6 In the first set of specifications, we use the full sample, and see that, irrespective of whether we use an extra control (risk-adjusted return), the impact of outside directors differs between the low-leverage and high-leverage sub-samples. For firms with debt-heavy capital structure, outside directors tend to actually decrease leverage. For firms with little debt, there is no significant relationship between leverage and the portion of outside directors on the board. This evidence does not support the traditional argument that outside directors limit entrenchment by, for example, encouraging more leverage.
Because the findings concerning the relationship between outside directors and leverage were different among Panels B, C, and D, we perform an additional set of regressions, again with the sample split between the high-leverage (above the median) and low-leverage (below the median) observations. Results of these models are presented in the four rightmost columns of Panel E. Because large firms7 tend to have
6 The median was 22.58%; we end up with 4,075 observations above and 4,076 observations below—of which, 4,028 and 4,026 were usable in terms of having complete data, and are reported in the table. 7 In Panel B of Table 3 the sample is firms listed on blue chip indices, whereas in Panel E we group all large firms together (irrespective of listing status). This is because the number of
more leverage, it is expected that the number of low-leverage observations would be fewer than for high-leverage observations, and this is the case as revealed at the bottom of the table (82 vs. 694 observations, respectively). The effect of size on leverage is different among the two sub-samples, with the larger sample showing a positive effect of size on leverage, whereas in the smaller group (which is the top 10% largest firms), size is associated with smaller amounts of leverage. This is indicative of a U-shaped relationship between size and leverage. There are two other notable difference between the two sub-samples: more male directors are associated with higher debt levels for very large firms (but not for the bottom 90%), and CFO/FD experience on the board is associated with more leverage for the bottom 90%, but not for the top 10% biggest firms. So, for most of the sample, it seems that more male directors as well as CFO/FD experience on the board is consistent with limitations on managerial entrenchment.
4.3 Dual vs. Split CEO/Chair Structure Many corporate governance reform recommendations involve splitting executive responsibilities (most clearly, in the case of the CEO) from the board of directors, and this bears further consideration in our paper. Ideally, we would consider how the dual nature of certain firms affects their risk-weighted (market) returns in a traditional setting. But because our study encompasses privately held firms, we are unable to consider risk-weighted returns as operationalized in traditional asset pricing models (CAPM, arbitrage pricing theory, or three factor models that include book to market value).
Nevertheless, we can utilize stand-alone risk rather than beta (or other factors) as our proxy for risk, and therefore now turn to a dependent variable we term the coefficient of variation in ROA (defined as the standard deviation of ROA divided by the mean value of ROA for that firm). In Table 4, we present results of just such an exercise. Because the coefficient of variation describes the level of risk associated with a given return, independent variables with a negative coefficient are associated with “better” or more desirable performance from the perspective of a risk-averse investor; conversely, positive coefficients represent independent variables for which higher values reduce investor utility (i.e., lead to lower returns per unit of risk, or more risk per unit of return).
observations (1,221) for the firms in Panel B is insufficient to allow for splitting the sample between high and low leverage.
Corporate Ownership & Control / Volume 13, Issue 1, Autumn 2015, Continued – 7
749
Table 4. Listing Status Results, Continued Panel D: Privately Held Firms
Levels of significance as follows: *** 1%, ** 5%, * 10%, † 15%. Panel E: Debt Levels and Effect of Outside Directors on Performance Dependent variable is leverage (non-current liabilities over total assets). Cash is cash/total assets, leverage is long-term debt/total assets, ROA is net income/total assets, size is natural log of total assets (all four of which are windsorized), firm age is 2012-founding year, centrality is mean network size, dual role is a dummy taking the value of “1” when the CEO is also the Chair, Outsiders is portion of outside (NED), male is portion male, age is mean age of the members of the board, CFO/FD is a dummy variable taking the value of “1” if any members of the board had experience as a CEO or financial director. Sector and country dummies are variables taking the value of “1” for BVD sector (with “other services” as the omitted category) or country (with UK as reference category), respectively. All specifications use generalized least squares (firm and year); Z-statistics in parentheses.
Full Sample Biggest Firms Only (Top 10% of assets)
Levels of significance as follows: *** 1%, ** 5%, * 10%, † 15%.
Corporate Ownership & Control / Volume 13, Issue 1, Autumn 2015, Continued – 7
750
The first panel of Table 4 contains very cursory information on a specification we ran that replicates the independent variables included in model G of Table 2, but uses as the dependent variable coefficient of variation. Again, there is no significant relationship from executive participation on the board of directors (although size, network centrality, and director age have positive, negative, and positive relationships, respectively with risk-adjusted return).
We investigate this finding further in Panel B, where we replicate that specification but divide the sample into the three listing categories as well as the dual or split CEO role. There are some notable differences. First, we see that firms listed on big indices with a non-executive chair (NEC), more cash is associated with a higher coefficient of variation - this is consistent with entrenchment. More size is associated with a higher coefficient of variation in almost every specification. In addition, older directors are associated with worse performance in almost every specification, and in five models, significantly so.
The role of outside board members is interesting. For firms listed on large indices with non-executive chairs, more outsiders are associated with worse performance (higher coefficient of variation), but for firms with executive chairs (including dual CEO/chair) which are listed on other indices, NED prevalence has a positive relationship with risk-adjusted returns (indicated by the negative coefficient). The full sample results are clearer in interpretation, in that for firms with an executive chair, more NEDs are associated with better risk-adjusted returns. 4.4 Country-Level Variation We now turn to country-level results, based on the findings of Goergen (2007) and de Jong, et al (2002) that the mechanisms of corporate governance work differently in different countries. In addition, we are able to address the thesis that various mechanisms of incentive alignment are complementary, such that where the market for corporate control is robust (Martynova and Renneboog 2011), there is less need for boards to exhibit anti-entrenchment characteristics.
Given the common viewpoint that corporate governance and market conditions in the UK are substantially different from continental Europe, and that we conveniently have about half of our observations from each, we split the sample into UK observations and on-UK observations. We consider several dependent variables, indicated at the top of each column in Table 5.
There are some differences. Outside the UK, older firms tend to hold more cash (more consistent with entrenchment), whereas in the UK, younger directors tend to be associated with less cash. Director network centrality has no relationship with cash in continental Europe, but is associated with more cash for the UK. Male directors are associated with lower leverage in the UK, but not on the mainland. Younger directors are associated with less leverage outside the UK, but not inside it. The findings for ROA are remarkably similar for both institutional settings (with almost identical signs, significance levels and even coefficient magnitudes for cash, leverage, size, and centrality), but more male directors and older directors are associated with higher ROA outside the UK (and not within it). Finally, although the findings for coefficient of variation are fairly similar in the two different zones, older directors are associated with worse performance (positive coefficient) in the UK, but not on the mainland.
It is difficult to discern a common pattern from the country results. One consistent theme, in fact, is that the relationships are fairly similar among accounting and governance variables in the two areas. Areas of difference are either not very substantial, or when they occur, are not highly persuasive in terms of indicating meaningful differences in governance between the UK and non-UK setting.
5. Robustness To determine whether our results are robust, we revisit the models presented in Tables 2 – 5, but instead of using firm and country level dummy variables, we opt for specifications including firm-level fixed effects. For ease of presentation, we do not reproduce the results in this paper. We find few substantial differences between the findings presented here and those of the fixed effects models.8
8 Results are available upon request from the authors.
Corporate Ownership & Control / Volume 13, Issue 1, Autumn 2015, Continued – 7
751
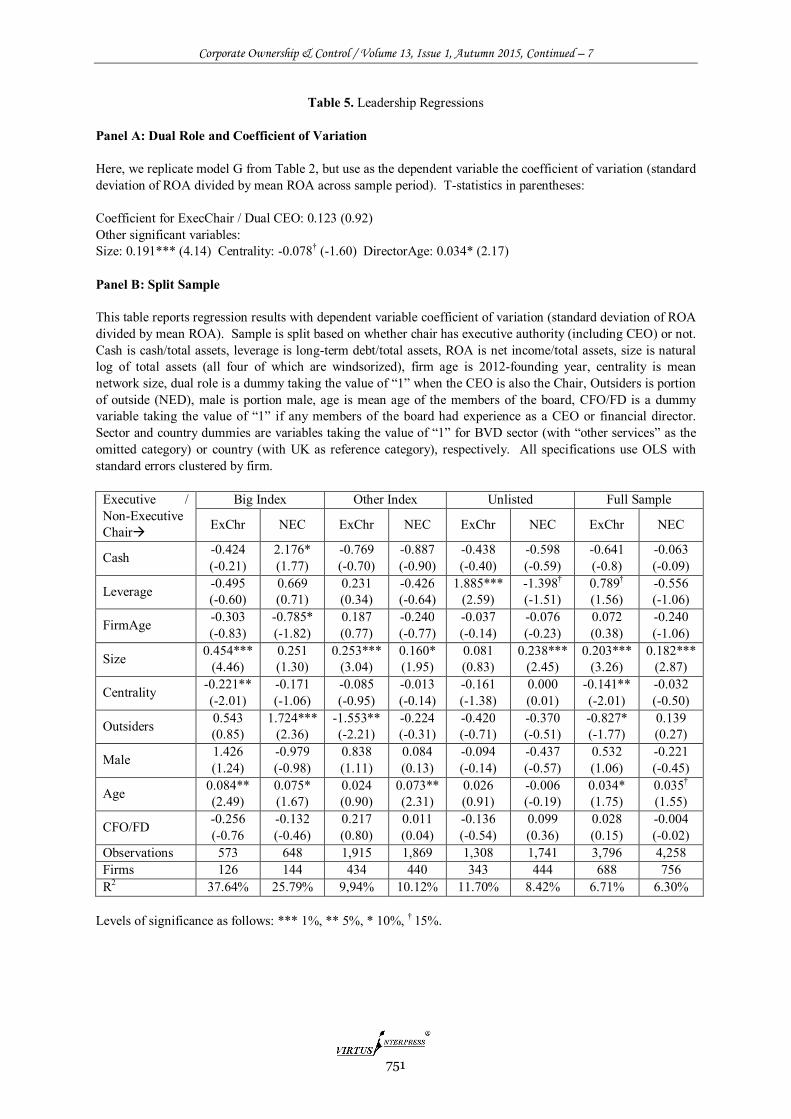
Table 5. Leadership Regressions Panel A: Dual Role and Coefficient of Variation Here, we replicate model G from Table 2, but use as the dependent variable the coefficient of variation (standard deviation of ROA divided by mean ROA across sample period). T-statistics in parentheses: Coefficient for ExecChair / Dual CEO: 0.123 (0.92) Other significant variables: Size: 0.191*** (4.14) Centrality: -0.078† (-1.60) DirectorAge: 0.034* (2.17) Panel B: Split Sample This table reports regression results with dependent variable coefficient of variation (standard deviation of ROA divided by mean ROA). Sample is split based on whether chair has executive authority (including CEO) or not. Cash is cash/total assets, leverage is long-term debt/total assets, ROA is net income/total assets, size is natural log of total assets (all four of which are windsorized), firm age is 2012-founding year, centrality is mean network size, dual role is a dummy taking the value of “1” when the CEO is also the Chair, Outsiders is portion of outside (NED), male is portion male, age is mean age of the members of the board, CFO/FD is a dummy variable taking the value of “1” if any members of the board had experience as a CEO or financial director. Sector and country dummies are variables taking the value of “1” for BVD sector (with “other services” as the omitted category) or country (with UK as reference category), respectively. All specifications use OLS with standard errors clustered by firm.
Levels of significance as follows: *** 1%, ** 5%, * 10%, † 15%.
Corporate Ownership & Control / Volume 13, Issue 1, Autumn 2015, Continued – 7
752
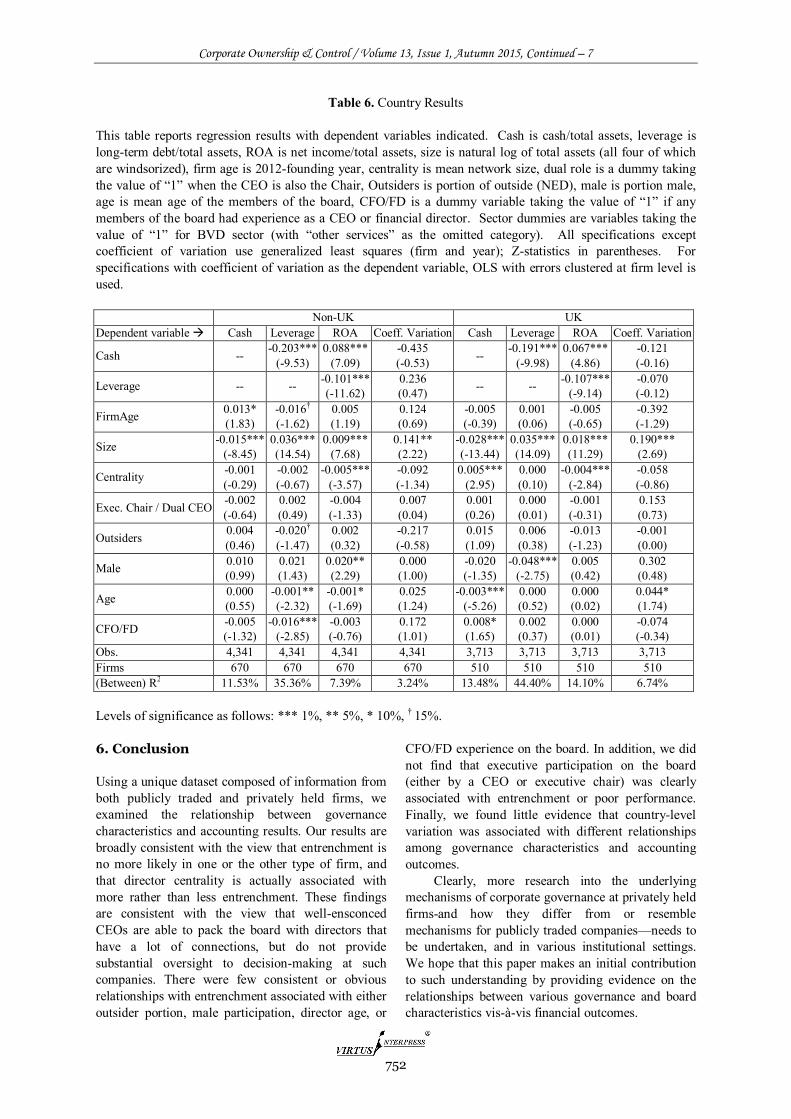
Table 6. Country Results This table reports regression results with dependent variables indicated. Cash is cash/total assets, leverage is long-term debt/total assets, ROA is net income/total assets, size is natural log of total assets (all four of which are windsorized), firm age is 2012-founding year, centrality is mean network size, dual role is a dummy taking the value of “1” when the CEO is also the Chair, Outsiders is portion of outside (NED), male is portion male, age is mean age of the members of the board, CFO/FD is a dummy variable taking the value of “1” if any members of the board had experience as a CEO or financial director. Sector dummies are variables taking the value of “1” for BVD sector (with “other services” as the omitted category). All specifications except coefficient of variation use generalized least squares (firm and year); Z-statistics in parentheses. For specifications with coefficient of variation as the dependent variable, OLS with errors clustered at firm level is used. Non-UK UK Dependent variable Cash Leverage ROA Coeff. Variation Cash Leverage ROA Coeff. Variation
Cash -- -0.203*** (-9.53)
0.088*** (7.09)
-0.435 (-0.53) -- -0.191***
(-9.98) 0.067***
(4.86) -0.121 (-0.16)
Leverage -- -- -0.101*** (-11.62)
0.236 (0.47) -- -- -0.107***
(-9.14) -0.070 (-0.12)
FirmAge 0.013* (1.83)
-0.016† (-1.62)
0.005 (1.19)
0.124 (0.69)
-0.005 (-0.39)
0.001 (0.06)
-0.005 (-0.65)
-0.392 (-1.29)
Size -0.015*** (-8.45)
0.036*** (14.54)
0.009*** (7.68)
0.141** (2.22)
-0.028*** (-13.44)
0.035*** (14.09)
0.018*** (11.29)
0.190*** (2.69)
Centrality -0.001 (-0.29)
-0.002 (-0.67)
-0.005*** (-3.57)
-0.092 (-1.34)
0.005*** (2.95)
0.000 (0.10)
-0.004*** (-2.84)
-0.058 (-0.86)
Exec. Chair / Dual CEO -0.002 (-0.64)
0.002 (0.49)
-0.004 (-1.33)
0.007 (0.04)
0.001 (0.26)
0.000 (0.01)
-0.001 (-0.31)
0.153 (0.73)
Outsiders 0.004 (0.46)
-0.020† (-1.47)
0.002 (0.32)
-0.217 (-0.58)
0.015 (1.09)
0.006 (0.38)
-0.013 (-1.23)
-0.001 (0.00)
Male 0.010 (0.99)
0.021 (1.43)
0.020** (2.29)
0.000 (1.00)
-0.020 (-1.35)
-0.048*** (-2.75)
0.005 (0.42)
0.302 (0.48)
Age 0.000 (0.55)
-0.001** (-2.32)
-0.001* (-1.69)
0.025 (1.24)
-0.003*** (-5.26)
0.000 (0.52)
0.000 (0.02)
0.044* (1.74)
CFO/FD -0.005 (-1.32)
-0.016*** (-2.85)
-0.003 (-0.76)
0.172 (1.01)
0.008* (1.65)
0.002 (0.37)
0.000 (0.01)
-0.074 (-0.34)
Obs. 4,341 4,341 4,341 4,341 3,713 3,713 3,713 3,713 Firms 670 670 670 670 510 510 510 510 (Between) R2 11.53% 35.36% 7.39% 3.24% 13.48% 44.40% 14.10% 6.74% Levels of significance as follows: *** 1%, ** 5%, * 10%, † 15%. 6. Conclusion Using a unique dataset composed of information from both publicly traded and privately held firms, we examined the relationship between governance characteristics and accounting results. Our results are broadly consistent with the view that entrenchment is no more likely in one or the other type of firm, and that director centrality is actually associated with more rather than less entrenchment. These findings are consistent with the view that well-ensconced CEOs are able to pack the board with directors that have a lot of connections, but do not provide substantial oversight to decision-making at such companies. There were few consistent or obvious relationships with entrenchment associated with either outsider portion, male participation, director age, or
CFO/FD experience on the board. In addition, we did not find that executive participation on the board (either by a CEO or executive chair) was clearly associated with entrenchment or poor performance. Finally, we found little evidence that country-level variation was associated with different relationships among governance characteristics and accounting outcomes.
Clearly, more research into the underlying mechanisms of corporate governance at privately held firms-and how they differ from or resemble mechanisms for publicly traded companies—needs to be undertaken, and in various institutional settings. We hope that this paper makes an initial contribution to such understanding by providing evidence on the relationships between various governance and board characteristics vis-à-vis financial outcomes.
Corporate Ownership & Control / Volume 13, Issue 1, Autumn 2015, Continued – 7
753
References:
1. Adams, R. and P. Funk, 2011. Beyond the glass ceiling: Does gender matter? Management Science, vol. 58 (2).
2. Ahern, K. and A. Dittmar, 2012, The Changing of the Boards: The Impact on Firm Valuation of Mandated Female Board Representation. Quarterly Journal of Economics, vol. 127 (1), 137-197.
3. Alonso, P, A, and L, A, Aperta, 2011, CEO Compensation and Board Composition as Alternative Instruments of Corporate Governance, Working paper, University of Valladolid.
4. Armstrong, C. and D. Larcker, 2009, Discussion of ‘The Impact of the Options Backdating Scandal on Shareholders’ and ‘Taxes and the Backdating of Stock Option Exercise Dates, Journal of Accounting and Economics 47: 50-58.
5. Bach, L. and D. Metzger, 2013, The Dark Side of Shareholder Activism: Evidence from CEO Turnovers. Stockholm School of Economics working paper.
6. Bebchuk, L. A., J. M. Fried, and D. I. Walker, 2002, Managerial power and rent extraction in the design of executive compensation. The University of Chicago Law Review 69, 751-846.
7. Bizjak, J., M. Lemmon, and R. Whitby, 2009, Option Backdating and Board Interlocks. Review of Financial Studies. Rev., 22(11): 4821-4847.
8. Brown, R., N. Gao, E. Lee and K. Stathopoulos, 2009, What Are Friends for? CEO Networks, Pay and Corporate Governance, Working paper, The University of Melbourne.
9. Cohen, L.; A. Frazzini and C. Malloy, 2012, Hiring “Cheerleaders”: board appointments of “independent” directors. Management Science, vol. 58 (6).
10. Cole, R. 2013 What Do We Know About the Capital Structure of Privately Held US Firms? Evidence from Surveys of Small Business Finance. Financial Management, vol 42 (4), 777 – 814.
11. Cornelli, F.; Z. Kominek, and A. Ljunqvist, 2010, Monitoring Managers: Does it Matter? NYU Stern School of Business Working Paper.
12. Custodio, C. and D. Metzger, 2012, Financial Expert CEOs., Working paper, Arizona State University.
13. El-Khatib, R., K. Fogel and T. Jandik., 2012, CEO Network Centrality and Merger Performance, Working paper, University of Arkansas.
14. Faleye, O, T, Kovacs, and A, Venkateswaran, 2012, Do Better-connected CEOs Innovate More? Working paper, Northeastern University.
15. Faleye, O.; R. Hoitash, and U. Hoitash, 2013, Industry expertise on corporate boards. Northeastern University working paper.
16. Ferreira, 2009. Board Diversity. In Corporate Governance, ed. by R. Anderson and H. K. Baker, Wily and Sons.
17. Ferreira, D.; G. Manso and A. Silva, Forthcoming (2013) Incentives to Innovate and the Decision to Go Public or Private. Review of Financial Studies.
18. Fich, E. and A. Shivdasani, 2006, Are Busy Boards Effective Monitors? Journal of Finance 61 (2), 689-724.
19. Fracasi, C,and G,Tate, 2012, External Networking and Internal Firm Governance, Journal of Finance, 67 (1), 153–194.
20. Gilje, E. and J. Taillard, 2013, Do Public Firms Invest Differently than Private Firms? Taking Cues from the Natural Gas Industry, Wharton School working paper.
21. Goergen, Marc. 2007. What Do We Know About Different Systems of Corporate Governance? ECGI - Finance Working Paper No. 163/2007.
22. Goergen, Marc. 1997. Does Ownership Matter? A Study Of German And UK IPOs. Cardiff University working paper available at:
24. Goergen, Marc and Luc Renneboog, 2008, Contractual Corporate Governance, Journal of Corporate Finance, Volume 14, Issue 3, June, Pages 166-182.
25. Graham, J.; S. Hazarika; and K. Narasimhan, 2011. Corporate Governance, Debt, and Investment Policy during the Great Depression. Management Science, vol. 57 (12).
26. Hall, Thomas, 2012, The Collateral Channel: Evidence on Leverage and Asset Tangibility, Journal of Corporate Finance, Volume 18, Issue 3, Pages 570-583.
27. Hall, T., Mateus, C., and Mateus, I. 2013. What Determines Cash Holdings at Privately Held and Publicly Traded Firms? Evidence from 20 Emerging Markets. International Review of Financial Analysis (forthcoming).
28. Han, B. and Yang, L., 2013, Social Networks, Information Acquisition, and Asset Prices. Management Science, vol. 59 (6).
29. Hoogendoorn, S.; H. Oosterbeek; M. van Praag, 2013, The Impact of Gender Diversity on the Performance of Business Teams: Evidence from a Field Experiment. Management Science. 59 (7).
30. Horton, J., Millo, Y., Serafeim, G. 2012. Resources or Power? Implications of Social Networks on Compensation and Firm Performance. Journal of Business, Finance and Accounting, 39, 3-4: 399-426.
31. Huang, S., 2013, Zombie boards: board tenure and firm performance, INSEAD working paper.
32. de Jong, Abe; Carles Gispert; Rezaul Kabir; and Luc Renneboog, 2002, International Corporate Governance and Firm Performance: An Empirical Analysis.
33. Kang, Shinwoo. 2013. Experienced Independent Directors. University of Michigan working paper.
34. Koke, Jens; Isabelle Dherment-Ferere, and Luc Renneboog, 2001, Corporate Monitoring by Blockholders in Europe: Empirical Evidence of Managerial Disciplining in Belgium, France, Germany and the UK. ZEW Discussion paper No 01-24. Available at:
36. Kuhnen, C. and Niessen, A. 2012. Public Opinion and Executive Compensation. Management Science, 58 (7).
Corporate Ownership & Control / Volume 13, Issue 1, Autumn 2015, Continued – 7
754
37. Larcker, D, E. So, and C. Wang., 2012, Boardroom Centrality and Firm Performance. Working paper, Stanford University.
38. Liu, Y., 2010, The Impact of Networks on CEO Turnover, Appointment, and Compensation, Working paper, University of Maryland.
39. Martynova, Marina and Luc Renneboog, 2011, The Performance of the European Market for Corporate Control: Evidence from the Fifth Takeover Wave, European Financial Management, Volume 17, Issue 2, March, Pages: 208–259.
40. Minton, B., J. P. Taillard , and R. Williamson, 2011, Do independence and financial expertise of the board matter for risk taking and performance?, Fisher College of Business working paper 2010-03-014, Ohio State University.
41. Nguyen, B., 2011, Does the Rolodex Matter? Corporate Elite’s Small World and the Effectiveness of the Board of Directors. Management Science, vol. 58 (2).
42. Renneboog, Luc and Yang Zhou, 2011. US Knows Us in the UK: On Director Networks and CEO
Compensation. ECGI Finance Working Paper No. 302/2011. Available at: http://papers.ssrn.com/sol3/papers.cfm?abstract_id=1763167.
43. Schmidt, B., 2008, Costs and Benefits of Friendly Boards during Mergers and Acquisitions, Working Paper, Emory University.
44. Schauten, M.; D. van Dijk, and J. van der Waal, 2008. Corporate governance and the value of excess cash holdings of large European firms. Erasmus Research Insitute of Management working paper ERIS-2008-027-F&A.
45. Weir, Charlie; David Laing and Phillip J. McKnight. 2001. An Empirical Analysis of the Impact of Corporate Governance Mechanisms on the Performance of UK Firms
46. Wright, Mike; Tomas Simons, and Luc Renneboog. 2006. Why Do Public Firms go Private in the UK? Working paper available at: http://papers.ssrn.com/sol3/papers.cfm?abstract_id=873673.
Corporate Ownership & Control / Volume 13, Issue 1, Autumn 2015, Continued – 7
755
Appendix: Data Matching Details
We began with two different data sets, BoardEx and Orbis. The latter has a much larger number of observations. For example, of French observations, BoardEx contains 296 firms, whereas Orbis contained 16,371. Our process of matching then began with identifying firms in BoardEx, and then matching them to firms in Orbis. For each firm in the BoardEx database, we attempted to identify its corresponding match in the Orbis file, based on firm name and location. It was necessary to do this manually, because small discrepancies in firm name existed among the different data bases, so an exact match would have substantially reduced the number of observations. To provide an example, there was a firm listed in the BoardEx dataset with name “COMPAGNIE DES ALPES SA (CDA)” which we matched with observations in the Orbis database containing the firm name “COMPAGNIE DES ALPES S.A.”. Next, we removed observations of firms that had been matched by name but had a different country code in the BoardEx database (perhaps due to a coding error or a firm that moved its location over time). This reduced the number of BoardEx firm-year obsevations from 11,139 to 11,089.
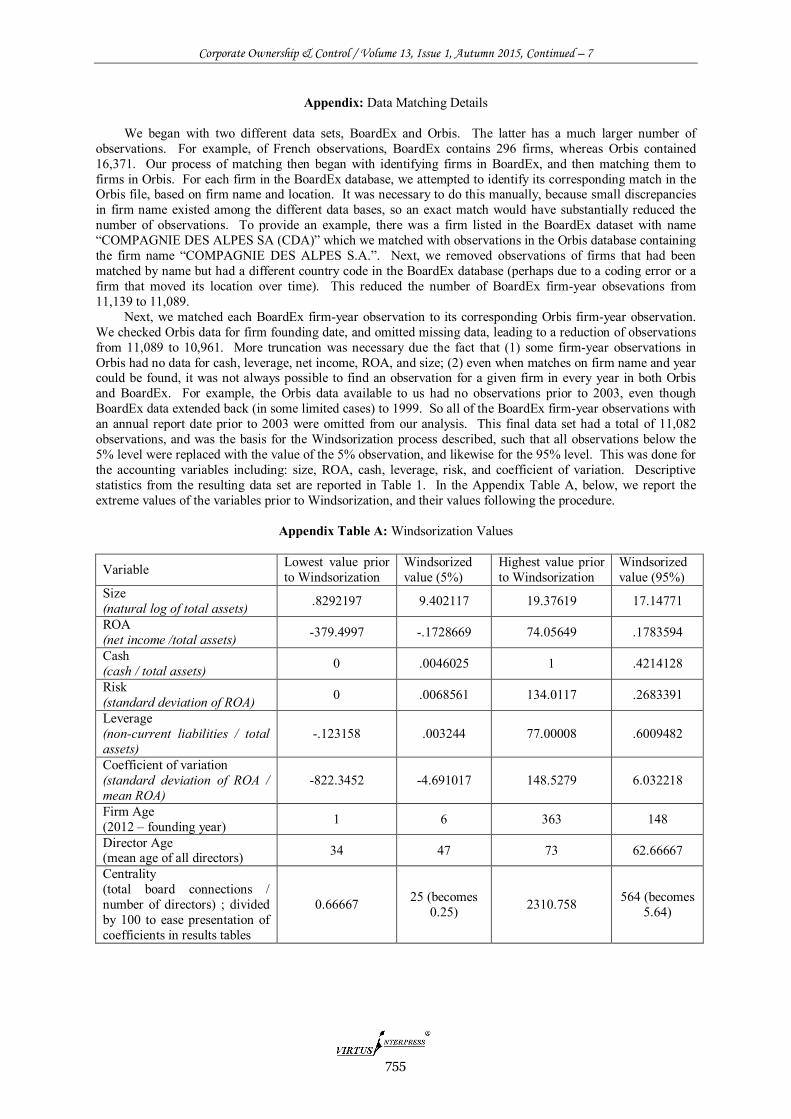
Next, we matched each BoardEx firm-year observation to its corresponding Orbis firm-year observation. We checked Orbis data for firm founding date, and omitted missing data, leading to a reduction of observations from 11,089 to 10,961. More truncation was necessary due the fact that (1) some firm-year observations in Orbis had no data for cash, leverage, net income, ROA, and size; (2) even when matches on firm name and year could be found, it was not always possible to find an observation for a given firm in every year in both Orbis and BoardEx. For example, the Orbis data available to us had no observations prior to 2003, even though BoardEx data extended back (in some limited cases) to 1999. So all of the BoardEx firm-year observations with an annual report date prior to 2003 were omitted from our analysis. This final data set had a total of 11,082 observations, and was the basis for the Windsorization process described, such that all observations below the 5% level were replaced with the value of the 5% observation, and likewise for the 95% level. This was done for the accounting variables including: size, ROA, cash, leverage, risk, and coefficient of variation. Descriptive statistics from the resulting data set are reported in Table 1. In the Appendix Table A, below, we report the extreme values of the variables prior to Windsorization, and their values following the procedure.
Appendix Table A: Windsorization Values
Variable Lowest value prior to Windsorization
Windsorized value (5%)
Highest value prior to Windsorization
Windsorized value (95%)
Size (natural log of total assets) .8292197 9.402117 19.37619 17.14771
ROA (net income /total assets) -379.4997 -.1728669 74.05649 .1783594
Cash (cash / total assets) 0 .0046025 1 .4214128
Risk (standard deviation of ROA) 0 .0068561 134.0117 .2683391
Leverage (non-current liabilities / total assets)
-.123158 .003244 77.00008 .6009482
Coefficient of variation (standard deviation of ROA / mean ROA)
-822.3452 -4.691017 148.5279 6.032218
Firm Age (2012 – founding year) 1 6 363 148
Director Age (mean age of all directors) 34 47 73 62.66667
Centrality (total board connections / number of directors) ; divided by 100 to ease presentation of coefficients in results tables


![Greenwich Academic Literature Archive (GALA)gala.gre.ac.uk/15551/1/15551_Gan_Social networking privacy (pub P… · 2014 [4]. People tweet on their way to work and when they get home](https://static.documents.pub/doc/80x56/60421bf2c72497288933ddb2/greenwich-academic-literature-archive-galagalagreacuk15551115551gansocial.jpg)


