29
EP Energy's Flagship - The Eagle Ford Optimizing Spacing to Maximize Value Greg Givens Vice President, Eagle Ford October 15, 2012
| Date post: | 13-Jan-2015 |
| Category: |
Documents |
| Upload: | nickster66 |
| View: | 321 times |
| Download: | 3 times |

EP Energy's Flagship - The Eagle Ford Optimizing Spacing to Maximize Value
Greg Givens Vice President, Eagle Ford
October 15, 2012
2
Cautionary Statement In this presentation, EP Energy has disclosed its proved reserves using the SEC's definition of proved reserves under rules effective December 31, 2009. Proved reserves are estimated quantities of hydrocarbons that geological and engineering data demonstrate with reasonable certainty to be recoverable in the future from known reservoirs under the assumed economic conditions. In this presentation, EP Energy has provided estimates of its “net risked resources,” “unproved resources” or “inventory” which are different than probable and possible reserves as defined by the SEC. Net risked resources, unproved resources or inventory are estimates of potential reserves that are made using accepted geological and engineering analytical techniques. This presentation presents certain production and reserves-related information on an "equivalency" basis. Equivalent volumes are computed with oil and natural gas liquid quantities converted to Mcf at a ratio of one Bbl to six Mcf, and natural gas converted to barrels at a ratio of six Mcf to one Bbl. A Boe conversion ratio of six Mcf of natural gas to one Bbl, and a Mcfe conversion ratio of one Bbl of crude oil or NGLs to six Mcf, is based on an energy equivalency conversion method primarily applicable at the burner tip and does not represent a value equivalency at the wellhead. Although these conversion factors are industry accepted norms, they are not reflective of price or market value differentials between product types. Certain of the production information in this presentation includes the production attributable to EP Energy’s 48.8 percent interest in Four Star Oil and Gas Company (“Four Star”). In addition, the proved reserves attributable to its interest in Four Star represent estimates prepared by EP Energy and not those of Four Star. This presentation refers to the non-GAAP financial measures “Cash Operating Costs” and “Adjusted Cash Operating Costs”. Definition of these measures and reconciliation between U.S. GAAP and non-GAAP financial measures is included in the Appendix to this presentation.

3
Company Update
May 24, 2011 – Announced EPE spin-off
October 16, 2011 – Kinder Morgan announced acquisition of El Paso Corporation (with intent to sell E&P assets)
May 25, 2012 – Launched EP Energy
Closed sale to private equity group
More information on our new website
epenergy.com

4
Strategy: How We’ll Get There

5
Purpose: What We Do
At EP Energy, we have a passion for finding and producing the
oil and natural gas that enriches people's lives

6
Vision: Where We're Going

7
Values: How We Behave

8
Competitive Advantages 4.0 Tcfe of proved reserves – PV-10 of ~$7 billion1
Rapidly growing oil shale plays -- onshore U.S. unconventional
Producing wells currently 77% operated1
20+ year drilling inventory -- ~4,500 locations, 85% oil - related1
Natural gas inventory is largely held-by-production
2011 drilling success rate of 100% (233 gross wells)
1 As of 12/31/11. Pre-tax PV-10 value assumes SEC pricing, as of 12/31/11 2As of 6/30/12, proforma for the Financing Transaction completed on 8/13/12
Large, Diverse High Quality Asset Base
Industry leading well cost performance in key programs
Top tier lease operating expense performance
Manage returns and margin through commodity price cycles
Base PDP assets (1.7 Tcfe)1 provide predictable cash flow
Favorable hedge position
~$1.6 billion liquidity2
Leadership team comprised of former El Paso employees
Focused – build assets with repeatable programs/inventory
Asset teams and culture remain in place
Strong Financial Position
Experienced Team
Extensive Low-Risk Inventory
Efficient Operations
9
EAGLE FORD
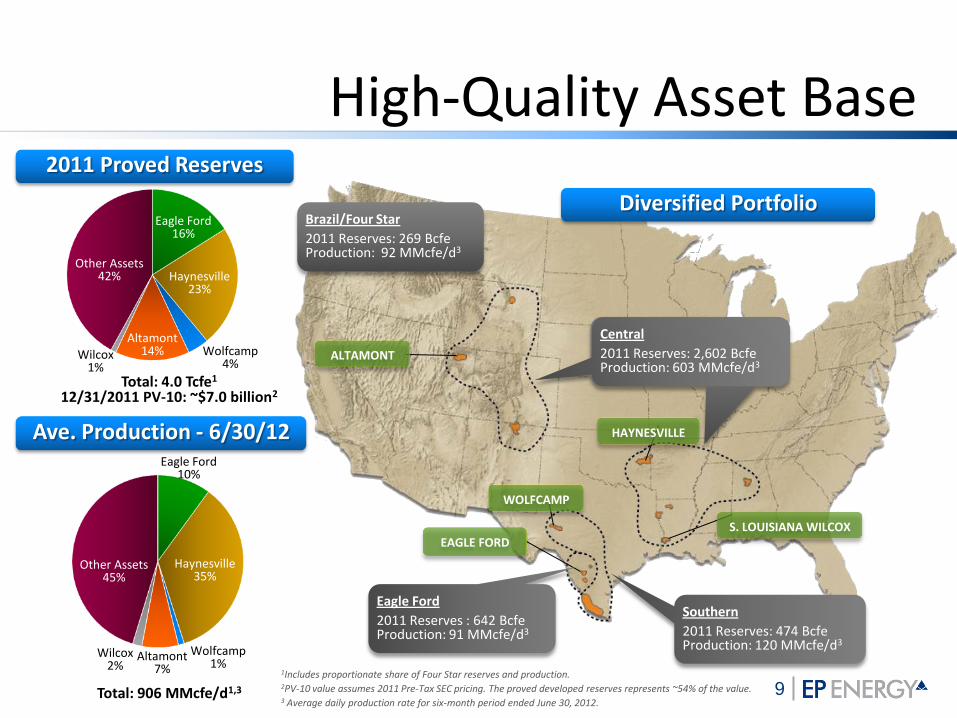
High-Quality Asset Base 2011 Proved Reserves
Total: 4.0 Tcfe1
12/31/2011 PV-10: ~$7.0 billion2
Total: 906 MMcfe/d1,3
Ave. Production - 6/30/12
Altamont 7%
Other Assets 45%
Wolfcamp 1%
Wilcox 2%
Eagle Ford 10%
Haynesville 35%
1Includes proportionate share of Four Star reserves and production. 2PV-10 value assumes 2011 Pre-Tax SEC pricing. The proved developed reserves represents ~54% of the value. 3 Average daily production rate for six-month period ended June 30, 2012.
Altamont 14%
Other Assets 42%
Wolfcamp 4%
Wilcox 1%
Eagle Ford 16%
Haynesville 23%
Central
2011 Reserves (Bcfe): 1,110 4Q 2011 Production (MMcfe/d): 153
Central
2011 Reserves: 2,602 Bcfe Production: 603 MMcfe/d3
Southern
2011 Reserves: 474 Bcfe Production: 120 MMcfe/d3
Brazil/Four Star
2011 Reserves: 269 Bcfe Production: 92 MMcfe/d3
Eagle Ford
2011 Reserves : 642 Bcfe Production: 91 MMcfe/d3
Diversified Portfolio
ALTAMONT
WOLFCAMP
S. LOUISIANA WILCOX
HAYNESVILLE

10
Low-Risk 90% 97% 100%
Drilling Inventory Growth
Liquids 6:1 34% 48% 59%
Domestic 82% 90% 99%
Core Prog1 46% 61% 78%
2009 2010
1Core programs include Altamont, Eagle Ford, Haynesville (includes Middle Bossier), Wolfcamp and South Louisiana Wilcox
Note: Inventory includes unproved resources and proved undeveloped reserves; All inventory is risked, net to EP Energy’s interest
Net Risked Resources Excluding PDP and PDNP (Tcfe)
Significant oil and natural gas inventory with high ownership and control
2011
0.9 1.3 1.9
2.5
4.2
6.2 2.0
2.2
1.6
0.6
0.2
0.0
2009 YE 2010 YE 2011 YE
PUD Unconventional Conventional Lower Risk Conventional Higher Risk
6.0
8.0
9.7
11
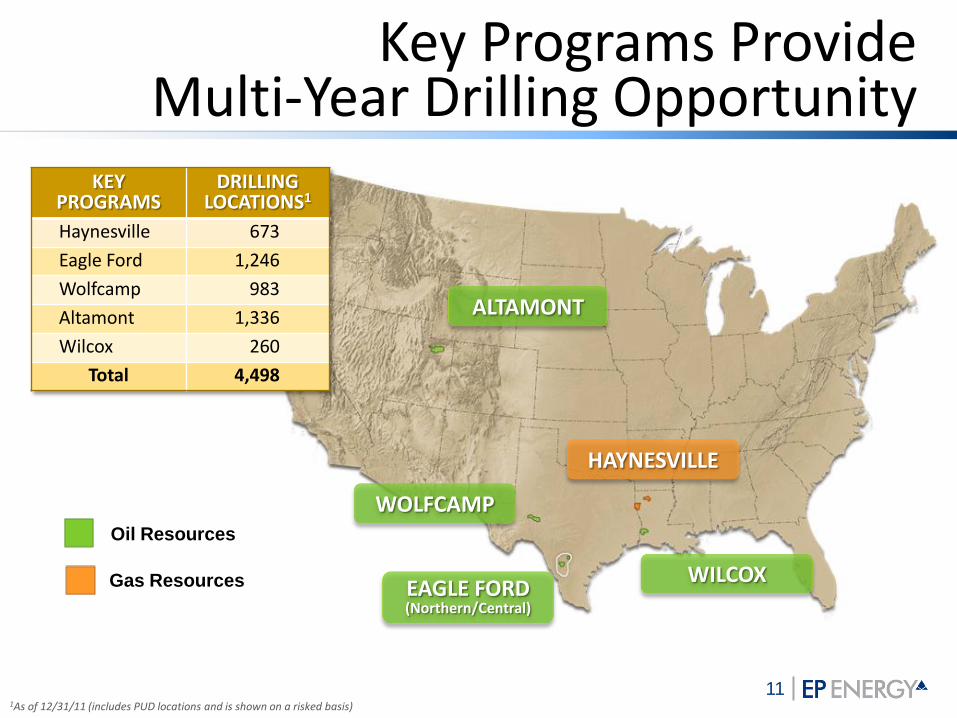
Key Programs Provide Multi-Year Drilling Opportunity
HAYNESVILLE
EAGLE FORD (Northern/Central)
WOLFCAMP
ALTAMONT
WILCOX
1As of 12/31/11 (includes PUD locations and is shown on a risked basis)
KEY PROGRAMS
DRILLING LOCATIONS1
Haynesville 673
Eagle Ford 1,246
Wolfcamp 983
Altamont 1,336
Wilcox 260
Total 4,498
Oil Resources
Gas Resources
12
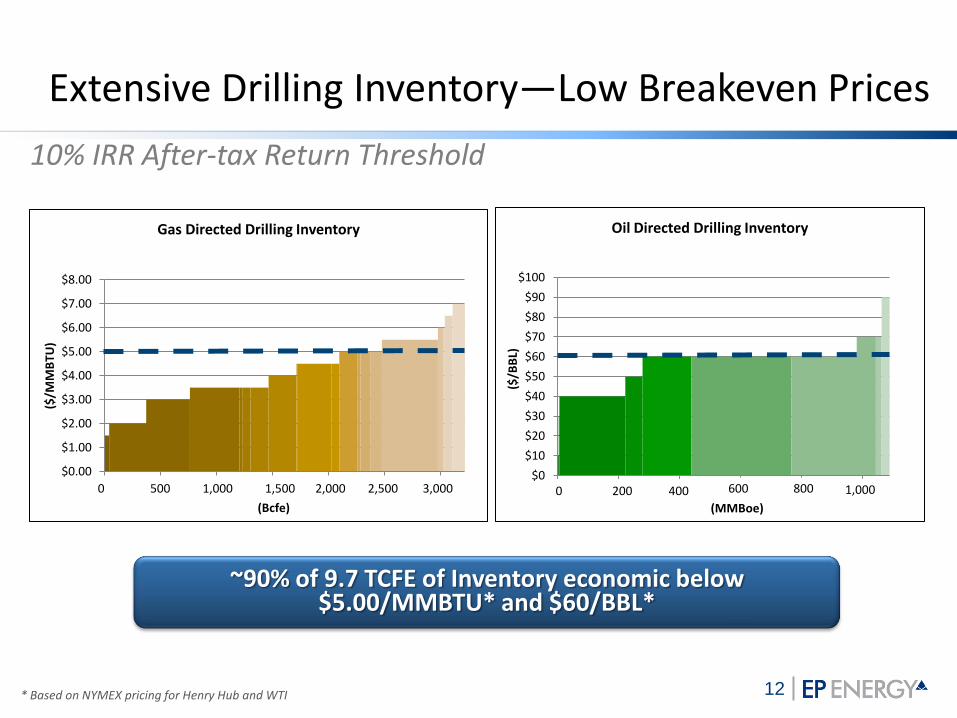
Extensive Drilling Inventory—Low Breakeven Prices
$0.00
$1.00
$2.00
$3.00
$4.00
$5.00
$6.00
$7.00
$8.00
0 500 1,000 1,480 1,980 2,480 2,980
($/M
MB
TU)
(Bcfe)
Gas Directed Drilling Inventory
$0
$10
$20
$30
$40
$50
$60
$70
$80
$90
$100
0 200 399 599 799 999
($/B
BL)
(MMBoe)
Oil Directed Drilling Inventory
500 1,000 1,500 2,000 2,500 3,000 0 0 200 400 600 800 1,000
~90% of 9.7 TCFE of Inventory economic below $5.00/MMBTU* and $60/BBL*
* Based on NYMEX pricing for Henry Hub and WTI
10% IRR After-tax Return Threshold

13
2012 Capital Budget
> 90% allocated to oil-focused key programs
3% 6%
8%
12%
13%
$1.5 - $1.6 Billion1
1Includes ~$100 MM of capitalized interest, information technology and capitalized direct labor costs

14
Favorable Program Economics
Capital
($MM) 1 EUR
(Mboe) 1
Initial Production (Boe/d)1,2 IRR3
Average Working Interest
Eagle Ford, Central 8.0 – 8.4 500 – 600 750 – 900 45 – 65% 92%
Wolfcamp 8.0 – 8.4 465 – 510 575 – 675 20 – 30% 100%
Altamont 4.6 – 7.7 300 – 450 400 – 600 20 – 40% 89%
Wilcox 6.0 – 7.0 320 – 440 500 – 900 30 – 70% 85%
1 Based on 100 percent working interest 2 Based on initial 24 hours of production 3 After-tax internal rate of return net to EP Energy interest based on $3.50 per MMBtu (HH) and $90.00 per Bbl (WTI)
Focused investments delivering excellent returns

15
Continuous Improvement
9.8
10.9
6.6
8.28.2 8.2
6.2 6.5
Eagle Ford Wolfcamp Altamont Wilcox
First 3 Wells Current (median)
Gross Capital Cost Per Well ($MM)
$1.72 $1.71
$1.69
$1.66 Adjusted Cash Operating Costs ($/Mcfe)
16
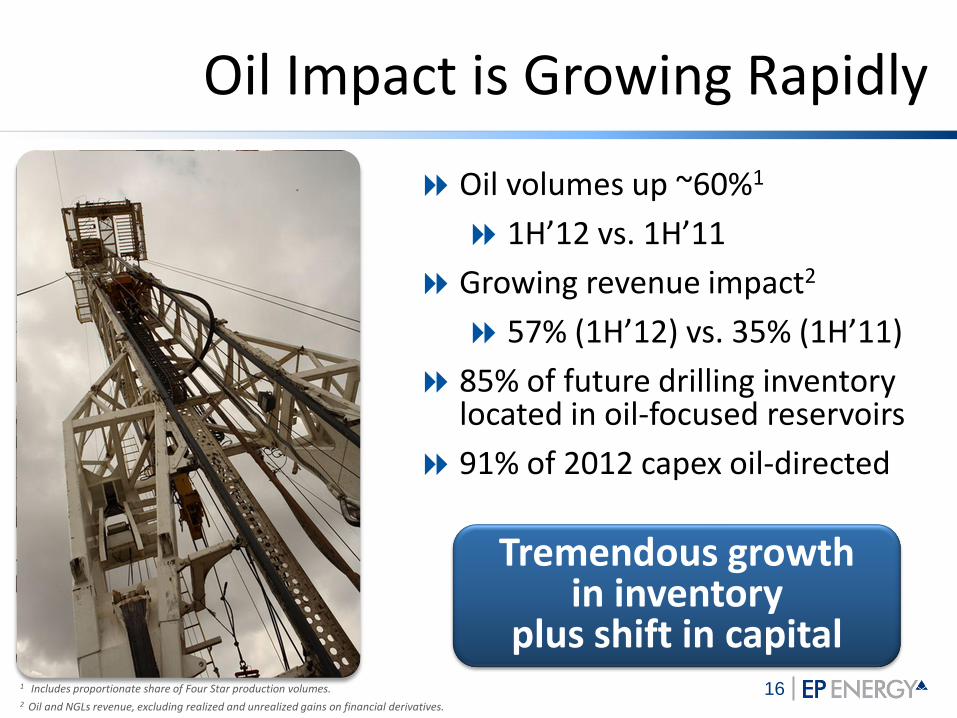
Oil Impact is Growing Rapidly
Tremendous growth in inventory
plus shift in capital
Oil volumes up ~60%1
1H’12 vs. 1H’11
Growing revenue impact2
57% (1H’12) vs. 35% (1H’11)
85% of future drilling inventory located in oil-focused reservoirs
91% of 2012 capex oil-directed
1 Includes proportionate share of Four Star production volumes. 2 Oil and NGLs revenue, excluding realized and unrealized gains on financial derivatives.

17
Eagle Ford
Highest return and highest value asset in portfolio
Advantaged acreage position in Central Area (La Salle/Dimmit Co.)
Significant inventory of oil opportunities (1246 locations1)
Major source of future oil production and reserve adds
2012 Program
Drilling 86 wells
Currently running 5 rigs
~$896 MM capex
Avg. Net Production Growth
0.0
3.0
6.0
9.0
12.0
15.0
18.0
1Q 2010
2Q 2010
3Q 2010
4Q 2010
1Q 2011
2Q 2011
3Q 2011
4Q 2011
1Q 2012
2Q 2012
MB
oe/
d
Gas NGL Oil
157,000 total net acres1
77,000 in Central area
642 Bcfe estimated net proved reserves1
88 net producing wells2
1 As of December 31, 2011 2 As of June 30, 2012
18
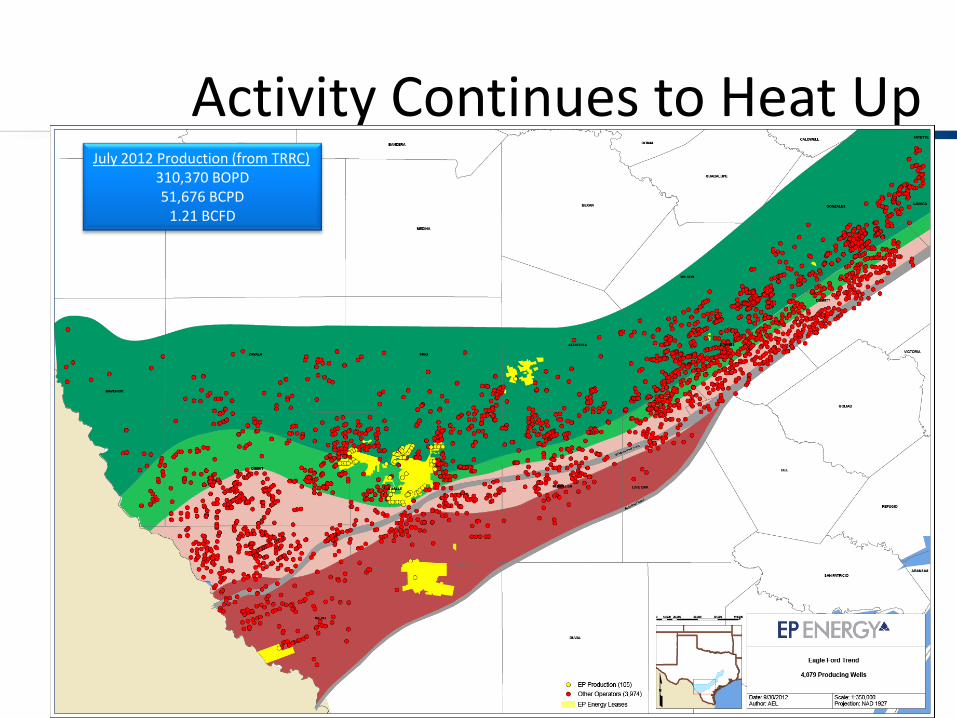
Activity Continues to Heat Up July 2012 Production (from TRRC)
310,370 BOPD 51,676 BCPD
1.21 BCFD

19
21
16 15 14
2010 1H 2011 2H 2011 1H 2012
Rig Days (Spud to Rig Release)
2.3
2.9
3.7
4.5
2010 1H 2011 2H 2011 1H 2012
Stimulation (Stages/Day)
Operational Efficiency Improves over time
1 Rig line now drills >20 wells per year
Higher efficiency lowers total well cost
763 723 721
1036
2010 1H 2011 2H 2011 1H 2012
Initial 24 hr rate1 (BOE/Day)
Well performance continues to improve
1 Maximum continuous 24 hours Note: Based on Central Area wells only

20
Field Gathering/Central Facilities
LACT
Well Paths
Frac Pond
Oil, Gas & Water Flow
Lines
Potential Future Well Locations
Road
Common Facility
Midstream Oil & Gas
Lines
Wells within 3-4 miles gathered at Central Production Facility (CPF)
Oil and Gas connected to regional pipelines through midstream gathering lines
Maintain option to truck oil
30-40 wells connected to each CPF at full development
21
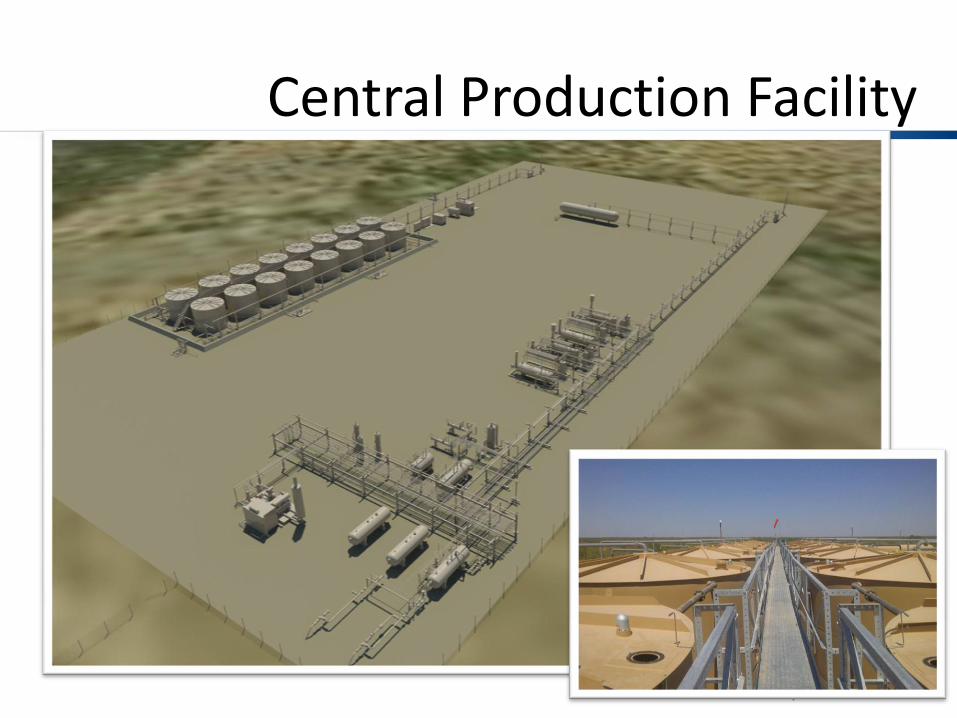
Central Production Facility

22
Eagle Ford Oil & Gas Infrastructure
In-field Gathering
Owned and operated by EP Energy
Wellhead gathering to 12 central batteries currently; additional batteries under construction
Camino Real Gathering System*
Natural gas system capacity of 150–170 MMcf/d
Oil system capacity of 90,000 Bbls/d, with blending capability
Additional connections to new lines under construction in area would substantially increase capacity
Takeaway
Sufficient downstream processing and transportation capacity to accommodate aggressive gas volume growth
Long-term oil sales agreements with premium pricing to WTI
Began oil deliveries to downstream markets via pipeline 1Q 2012
*Camino Real is owned and operated by Kinder Morgan
DIMMI
T
LA SALLE OIL
VOLATILE OIL
WET GAS
DRY GAS
EP acreage
Camino Real Gas line
Gas interconnects
Camino Real Oil line
Oil interconnects
Oil terminal
Gardendale Rail
Facility
Enterprise
Kinder/Copano
ETC
Regency
Hilcorp Gardendale
Hilcorp Cotulla
DIMMIT
23
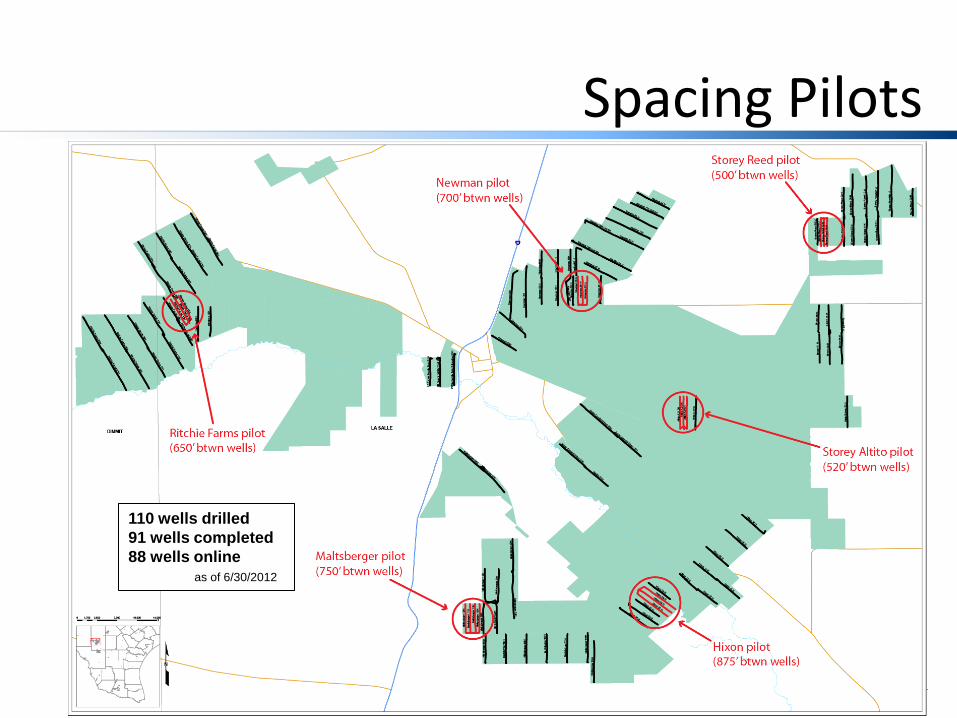
Spacing Pilots
110 wells drilled
91 wells completed
88 wells online
as of 6/30/2012

24
700 ft well spacing
875 ft well spacing
60 acre drainage area
Microseismic used to determine extent of fracture network
Production testing and reservoir simulation aid in selecting the optimal between well spacing
Microseismic Surveys

25
Initial Pilots holding up well

26
Increased density successful to date
27
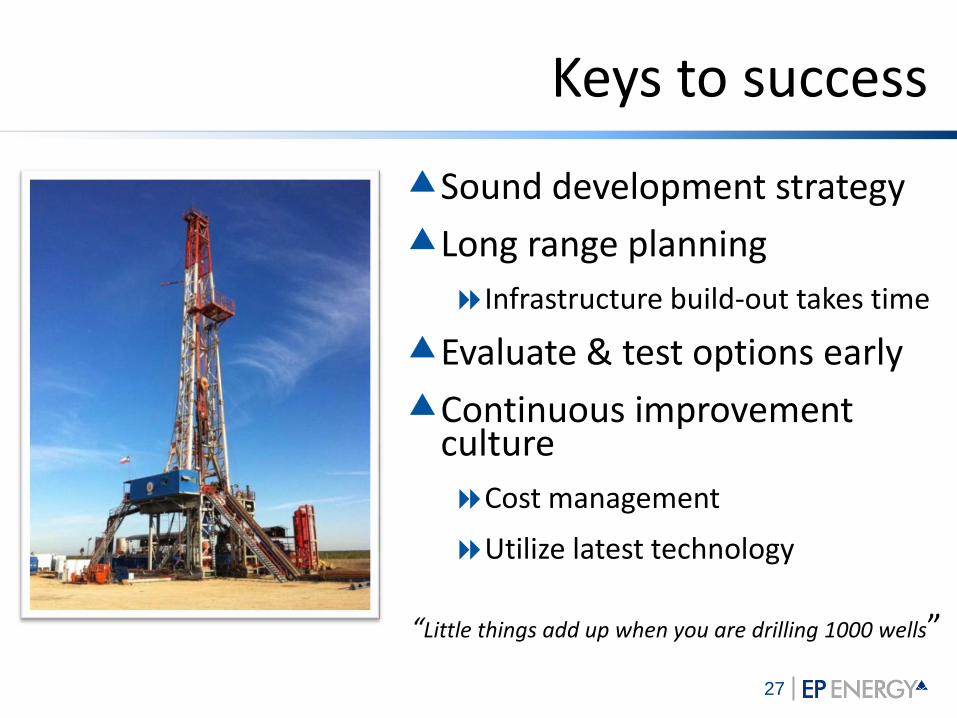
Keys to success
Sound development strategy
Long range planning
Infrastructure build-out takes time
Evaluate & test options early
Continuous improvement culture
Cost management
Utilize latest technology
“Little things add up when you are drilling 1000 wells”
28
Thank you
29
Additional Non-GAAP Information EP Energy uses the non-GAAP financial measures of Cash Operating Costs and Adjusted Cash Operating Costs. We believe these supplemental
measures provide meaningful information to our investors; however, due to the limitations of these measures as analytical tools, we rely primarily
on our GAAP results.
Cash Operating Costs and Adjusted Cash Operating Costs. We monitor cash operating costs required to produce our oil and natural gas
production volumes. Cash operating costs is a non-GAAP measure calculated on a per Mcfe basis and includes total operating expenses less
depreciation, depletion and amortization expense, ceiling test and other impairment charges, exploration expense and transportation costs and
costs of products. Adjusted cash operating costs reflects cash operating costs adjusted for non-recurring transition and restructuring costs,
advisory fees paid to our sponsors, and non-cash equity based compensation expense. We believe cash operating costs and adjusted cash
operating costs per unit are valuable measures to provide management and investors reflecting operating performance and efficiency; however, as
non-GAAP measures, these measures may not be comparable to similarly titled measures used by other companies, have limitations as analytical
tools, and should not be considered in isolation.


