Reperio Capital Research LLC. Important disclosures appear at the back of this report 1 | Page Grendene SA (GRND3:BZ) Consumer Goods / Personal Goods November 19, 2015 Grendene: A Brazilian Footwear Producer with Multiple Competitive Advantages trading on a 10.1% NOPAT Yield Grendene SA Recommendation: Buy Bloomberg Ticker: GRND3:BZ Closing Price (11/19/2015): BRL17.39 1 Year Avg. Daily Vol. (USD mn): 1.53 Estimated Annualized Return: 15-17% INVESTMENT THESIS Grendene is a Brazilian plastics manufacturer and one of the largest footwear producers in the world. The company built multiple competitive advantages in the domestic market and the company is trying to replicate these advantages in the export market. Within the domestic market, it is a low cost operator with scale advantage due to heavy investments in advertising, product development, automation, and process improvements. It produces a low priced experienced good and has built a strong brand allowing f or pricing power. Grendene’s exports are at the low end of the cost curve ensuring the company stays competitive in export markets. The company is run by owner operators with strong operational skills and an understanding of its competitive position who treat all stakeholders with respect. It also has consistently generated stable, excess profit even during periods of industry stress and has a net cash balance sheet. Despite the company’s strengths, there is upside to the bear case scenario of no growth and trough margins with the company trading on a 10.1% NOPAT yield and an 8.5% FCF yield. Total estimated annualized return over the next five years is 15-17%. Grendene seems to be undervalued. FACTOR RATINGS Factor Rating Comment Financial Health 5 Net Cash = 2.2 times EBIT, stable ROIC over 20% Business Quality 4 Multiple competitive advantages (Scale, Low cost production, Brand), stable ROIC over 20% Management Quality 4 Shareholder friendly, strong operationally, slight weakness on allocation Operations 5 Multiple competitive advantages (Scale, Low cost production, Brand), stable ROIC over 20% Capital Allocation 4 Strong capital allocation with a few minor missteps with fixed expenses in international markets and excess cash Corporate Governance 4 Low wages relative to peers, some related party transactions but insignificant Valuation 4 Great quality business at a cheap but not extremely cheap prices Growth Prospects 4 The company expects to grow profit at a low double digit rate for the next few years Scale 1 = worst 5 = best Source: Reperio Capital Research
Transcript
Reperio Capital Research LLC. Important disclosures appear at the back of this report 1 | P a g e
Grendene SA (GRND3:BZ)
Consumer Goods / Personal Goods November 19, 2015
Grendene: A Brazilian Footwear Producer with Multiple Competitive Advantages trading on a 10.1% NOPAT Yield
Grendene SA Recommendation: Buy Bloomberg Ticker: GRND3:BZ Closing Price (11/19/2015): BRL17.39 1 Year Avg. Daily Vol. (USD mn): 1.53 Estimated Annualized Return: 15-17% INVESTMENT THESIS Grendene is a Brazilian plastics manufacturer and one of the largest footwear producers in the world. The company built multiple competitive advantages in the domestic market and the company is trying to replicate these advantages in the export market. Within the domestic market, it is a low cost operator with scale advantage due to heavy investments in advertising, product development, automation, and process improvements. It produces a low priced experienced good and has built a strong brand allowing for pricing power. Grendene’s exports are at the low end of the cost curve ensuring the company stays competitive in export markets. The company is run by owner operators with strong operational skills and an understanding of its competitive position who treat all stakeholders with respect. It also has consistently generated stable, excess profit even during periods of industry stress and has a net cash balance sheet. Despite the company’s strengths, there is upside to the bear case scenario of no growth and trough margins with the company trading on a 10.1% NOPAT yield and an 8.5% FCF yield. Total estimated annualized return over the next five years is 15-17%. Grendene seems to be undervalued. FACTOR RATINGS
Factor Rating Comment
Financial Health 5 Net Cash = 2.2 times EBIT, stable ROIC over 20%
Business Quality 4 Multiple competitive advantages (Scale, Low cost production, Brand), stable ROIC over 20%
Management Quality 4Shareholder friendly, strong operationally, slight weakness on allocation
Capital Allocation 4Strong capital allocation with a few minor missteps with fixed expenses in international markets and excess cash
Corporate Governance 4 Low wages relative to peers, some related party transactions but insignificant
Valuation 4Great quality business at a cheap but not extremely cheap prices
Growth Prospects 4 The company expects to grow profit at a low double digit rate for the next few years
Scale 1 = worst 5 = bestSource: Reperio Capital Research
Reperio Capital Research LLC. Important disclosures appear at the back of this report 2 | P a g e
Grendene SA (GRND3:BZ)
Consumer Goods / Personal Goods November 19, 2015
KEY STATISTICS
COMPANY DESCRIPTION History Grendene was founded in 1971 by Alexandre and Pedro Grendene with a loan from their grandfather. The company started in Rio Grande do Sul in Brazil, the traditional center of the wine industry, making wine demijohns. At the time, this was an innovation as wine was packed in wicker baskets. In 1976, the company provided another innovation to the market in the form of plastic gears to replace cast iron gears in agricultural machinery. Plastic gear parts cost half the price that did not rust. Around this time, the footwear industry began to blossom in the South of Brazil and the company shifted to making plastic footwear parts. Grendene started producing whole plastic shoes after Pedro came back from holiday from France where he saw fishermen wearing plastic sandals. In 1979, the company launched its first plastic shoes under the Nuar brand. Today, it is one of the world’s largest producers of footwear. The company IPO’d in 2004.
Key Statistics TTM 5Yr Avg Valuation TTM 5Yr Avg
Current price (BRL) 17.39 P/NCAV 3.1 4.5 Price range 13.66-18.91 6.90-23.73 EV/IC 1.6 2.0 Average daily volume (shares mn) 0.33 0.29
Net current asset value per share 5.68 3.83 Gross margin 47% 44%Invested capital per share 8.93 7.10 Operating margin 19% 15%Tangible book value per share 7.95 5.47 NOPAT margin 16% 13%Net financial assets per share 3.76 2.27 FCF margin 15% 17%
Sales per share 7.50 5.32 Working capital turnover 2.1 2.1 EBIT per share 1.41 0.81 Fixed capital turnover 1.4 1.6 NOPAT per share 1.23 0.70 IC turnover 1.5 1.3 Earnings per share 1.79 1.11 Growth TTM 5Yr Avg
FCF per share 1.12 0.88 Sales growth 10% 10%Residual income per share (0.50) 0.40 Operating profit growth 41% 5%
NOPAT growth 44% 9%Insider ownership 74.3% FCF growth 0% -7%Fiscal year end December Invested capital growth 4% 14%Source: Company data, Reperio Capital estimates
Reperio Capital Research LLC. Important disclosures appear at the back of this report 3 | P a g e
Grendene SA (GRND3:BZ)
Consumer Goods / Personal Goods November 19, 2015
Production Grendene has integrated operations on six industrial locations with 13 footwear factories. The company’s current annual production capacity is 250 million pairs of footwear. In 2014, it sold 205 million pairs of footwear. The company has a mold producing plant, a PVC production facility, and proprietary technologies for the production of footwear. It also has distribution logistics serving both traditional and non-traditional distributors and retailers in the whole of Brazil, and in the export market.
Grendene’s factories are in the Brazilian states of Ceara, Rio Grande do Sul, and Bahia. The company’s headquarters and largest location, which includes footwear production facilities and a PVC production plant, is in Sobral, Ceara. In Fortaleza, Ceara, the company has two plants producing footwear and PVC components. In Crato, Ceara, it has one plant producing footwear and ethyl vinyl acetate components. In Farroupilha, Rio Grande do Sul, Grendene has two footwear plants and an administrative office. In Carlos Barbosa, Rio Grande do Sul, the company has a mould production plant. In Teixeira de Freitas, Bahia, it also has a footwear production factory. Grendene has manufactured plastic products for forty four years. It produces its own PVC allowing it to produce plastics with over 70 different formulations according to the required hardness or malleability creating flexibility in the design of footwear. These special formulations are created internally and cannot be found on the market. For example, the plastics in Grendene’s Melissa shoes are infused with other ingredients to give them an attractive fragrance. The company uses its own production technology developed over the years. A team of internal engineers modify its machinery to adapt to its production process and perform all the maintenance on the equipment. The company’s production process has a significant amount of automation allowing for lower labor costs. In 2014, Grendene produced almost 24% of Brazilian footwear but only accounted for 8% of the footwear workforce highlighting the efficiencies through automation.
Reperio Capital Research LLC. Important disclosures appear at the back of this report 4 | P a g e
Grendene SA (GRND3:BZ)
Consumer Goods / Personal Goods November 19, 2015
The company’s internal PVC production, automation, and proprietary production technology allows for the production of large volumes quickly allowing the company to employ a fast fashion strategy where new designs are produced every 90 to 180 days. The fast fashion strategy allows the company to re-price goods every 90 to 180 days eliminating raw material price risk to the extent that the market can absorb price increase. It also decreases the possibility of imitation and makes fashion perishable decreasing the risk of competition from imports. The steps in the footwear production process are modeling/design, cutting, backstitch, sewing, and assembly. Grendene’s modeling/design process is differentiated as it often brings in well known designers from fashion and other industries. The company’s use of plastic and in-house PVC capabilities allows for designs that are unavailable to other footwear producers. The cutting stage is where all the pieces of the shoe are cut typically through automation to decrease waste. Backstitch is when the pieces of the upper are prepared, chamfered, folded, perforated, glued, and sewn. This is a very labor intensive step in Brazil. Internationally, it has been automated. Grendene’s production process eliminates this step due to its use of plastics. Sewing is an older approach widely used before synthetic adhesives were used. It is still used for a few types of shoes for safety and firmness. Grendene’s use of plastic injection production process eliminates this stage. Assembly is carried out nearly simultaneously with the cutting and sewing stages. The outsole and the insole are cut, sandpapered, shaped, cleaned, and glued or sewn. Once the sole is attached to the upper, the shoe must go through a few small operations called finishing. Grendene’s production process eliminates parts of the assembly as the sole and the upper are fused during the injection process. Grendene’s production process allows the company to eliminate a few steps in the production process saving time and money. Grendene’s principal raw material is PVC resin and plastic oils. Both are commodities with market prices. All PVC that is not used in the production process is fully recycled and reused by the company. The company concentrates its supply requirements in a small number of suppliers for each type of raw material to increase the company’s bargaining power and obtain more competitive prices. The company’s product development aims to create new fashion trends, identify new fashion tendencies, and attempts to create entry barriers through planned obsolescence using creativity and design by combining the best talent available. The company collaborates with some of the leading designers from fashion and other industries. Grendene has won many awards for its designs including the Brasil Design Award 2014 as an "Innovative company, a highlight for the design" from the Brazilian Association of Design Companies (Abedesing) and the Centro Brasil de Design. Brands The company’s brands include Melissa, Grendha, Rider, Ipanema, Grendene Kids, Cartago, Zaxy, and Zizou. Grendene’s brands account for 20% of domestic footwear consumption by volume and 40% of Brazilian footwear exports by volume.
Reperio Capital Research LLC. Important disclosures appear at the back of this report 5 | P a g e
Grendene SA (GRND3:BZ)
Consumer Goods / Personal Goods November 19, 2015
Launched in the 1980’s, Melissa is a premium product line directed at female consumers. Melissa was the first full plastic shoe in Brazil and the first footwear brand to feature on Brazilian television with actresses on top soap operas wearing Melissa footwear. The brand and its distribution channel were repositioned as a premium brand in 1999. The current distribution channel includes own stores, boutiques, specialized fashion stores, and design stores increasing brand value. To further increase brand value, Grendene partners with fashion brands, fashion designers, and designers outside of fashion. The experimental collaborations started in the 1980’s with Jean Paul Gaultier, Thierry Mugler, and Patrick Cox. Recent collaborators include Karl Lagerfeld, Vivienne Westwood, Jason Wu, and the Campana brothers among many others. Grendene’s unique production capabilities allow designers freedom to create designs that no other footwear makers can. Melissa is now synonymous with plastic shoes inside and outside of Brazil. In 2005, the company opened the Galeria Melissa in Sao Paulo on Rua Oscar Freire as a mixture of art gallery, design gallery, and store selling the Melissa line. According to Excellence Mystery Shopping International, the Rua Oscar Freire is the 8th most luxurious street in the world and second in the Americas behind 5th Avenue in New York. The company opened a second Galeria Melissa in New York on Greene Street and a third Galeria Melissa in London on King Street. The next Galeria Melissa will be in Asia. To further strengthen the positioning of Melissa, Grendene produces designs for Sao Paulo’s fashion week. At the end of Q3 2015, Grendene has 195 Clube Melissa stores close to the company’s initial target of 200 Clube Melissa stores by 2015. Melissa’s main competition is Arezzo, Schultz and Cravo and Canela. Ratings for Melissa’s shoes are listed below. All products illustrated received over 10 reviews with ratings from 4.2 to 4.9 out of 5.0. The high ratings show strong customer acceptance. In 2013, Melissa won the Women’s Footwear Brand of the Year from Drapers magazine in the UK.
Reperio Capital Research LLC. Important disclosures appear at the back of this report 6 | P a g e
Grendene SA (GRND3:BZ)
Consumer Goods / Personal Goods November 19, 2015
Launched in 1994, Grendha is directed at female consumers. The brand is segmented into five categories, according to styles and market positioning including casual, tropical, fashion, summer, and promotional or licensed materials. Products are advertised by celebrities to create an emotional appeal. Grendha’s main competitors are Azaleia, Via Marte, and Beira Rio.
Launched in 2001, the Ipanema brand is directed at mass market consumers. It leverages the company’s performance in unisex slipper, clog, and sandal market with competitive prices. The Ipanema line is segmented into three categories basic, female, and male. Ipanema received positive reviews with an average rating between 4.3 and 4.9. Women’s Maya Thong Sandal was the most reviewed and currently ranks #101 in Amazon for women’s flats out of 11,301 flats options. Ipanema’s main competitors are Havaianas, Sao Paulo Alpargatas, Dupe, and Balina.
Rider, launched in August 1986, is an after-sport sandal directed at male consumers. Within Brazil, Rider is synonymous with after-sport sandals. The brand has a specialized design for extreme comfort and is sold in over 70 countries. Grendene
Reperio Capital Research LLC. Important disclosures appear at the back of this report 7 | P a g e
Grendene SA (GRND3:BZ)
Consumer Goods / Personal Goods November 19, 2015
segments this line into three categories, according to activity and consumer preference: sports (foot-covering slippers), beach (toe slippers), and adventure (sandals and tennis sandals). Rider’s main competitors are Azaleia, Beira Rio and Sao Paulo Alpargatas. Ratings for Rider sandals are listed below. All products with over 25 reviews received a rating from 4.2 to 4.7.
Launched in 1984, the Kid’s product line is directed at child and pre-teenage customers. In addition to Grendene’s own brands, the Kid’s line includes a series of products launched with licensed national and international children’s characters artists bringing emotional appeal to the products. Licensed brands include Mattel and Disney characters among many others. Certain products in this line are also marketed with accessories, adding value and increasing appeal. Grendene Kid’s main competitors are Klin, Bibi, and Marisol. Grendene other brands include Cartago, Zaxy, and Zizou. Cartago is a more fashion oriented men’s sandals, while Zaxy is more oriented to teenage females. All of Grendene’s brands are fast fashion with an average life of 90 and 180 days. Fast fashion decreases the chance of imitation, increases the importance of design (a fixed cost), and decreases the ability of imports to compete as supply time of imports are much longer and fast fashion makes fashion perishable. In 2014, Grendene established a new subsidiary with industrial designer Philippe Starck to produce and sell plastic products including furnishings and accessories. The goal of the project is to produce items with sophisticated design that is affordable to the middle class. This new subsidiary’s name is A3NP with TOG being the brand name of the products. The initial investment was BRL52 million, of which BRL22 million was Grendene’s interest. Initial expectations was for the TOG line to reach USD100 million in revenues in four to five years and become an international brand. As of Q3 2015, A3NP has failed to breakeven and is underperforming expectations. The company has continually found solutions using plastic products. It has created plastic wine packaging, plastic gears for agricultural machinery, footwear, and furniture. Currently, the company’s largest product is footwear but it has the potential to provide many different plastic solutions given its expertise in plastics and operational efficiency.
Reperio Capital Research LLC. Important disclosures appear at the back of this report 8 | P a g e
Grendene SA (GRND3:BZ)
Consumer Goods / Personal Goods November 19, 2015
Marketing To shift the focus from price competition, Grendene uses aggressive marketing to increase emotional appeal by using licensing, celebrities, TV advertising, and alternative media. Aiding the aggressive marketing is Grendene’s commitment to social issues including treating employees, the environment, and all partners well. Grendene periodically invites 25-30 retail partners to tour its factories and it receives input on designs. The company also has a team of commercial representatives acting as consultants to retailers helping them attract and retain customers. The company gives special software to retailers to make the ordering and sales process much easier. Grendene also provides marketing and post sales support. This additional value solidifies relationships with retailers, but is an expensive fixed cost that is difficult for smaller peers to replicate. Grendene won the award Prêmio Top de Marketing ADVB/RS 2012 in the category: market segment - fashion. The Top de Marketing (Marketing Top) award is granted to stand out companies using marketing strategies and tools in the advertising of products and services. Financial In 2014, domestic sales accounted for 76% of revenues. Since 2006, domestic revenues have been declining as a percentage of total revenues.
The company’s key revenue drivers are illustrated below.
72%
74%
76%
78%
80%
82%
84%
86%
2006 2007 2008 2009 2010 2011 2012 2013 2014
Source: Company data
Domestic Revenue % Total
Reperio Capital Research LLC. Important disclosures appear at the back of this report 9 | P a g e
Grendene SA (GRND3:BZ)
Consumer Goods / Personal Goods November 19, 2015
In 2008, Grendene outlined financial targets for 2015. The company extended these financial targets until 2018 in February 2015. The company expects gross revenue growth of 10% (8%-12%) per year, profit growth of 13% (12%-15%), and advertising expense averaging 8% (8%-10%) of net revenue. The company acknowledges it may not meet growth targets every year but over the full period it expects to reach its targets. Mission Grendene’s mission is “To make “democratic” fashion, rapidly meeting the market needs and generating attractive returns for the company and its shareholders.” Strategy Grendene’s strategy is to continue to increase market share in both the domestic and international markets through the constant development of new products with quality, originality, functionality, comfort, and emotional appeal at competitive prices. The company unique activities include: 1. Decades of plastic production allowing for economies of learning 2. Internal production of PVC allowing for different formulations of plastics to make unique products and designs 3. An internal engineering team modifying equipment to increase productivity and decrease costs 4. Higher level of automation than Brazilian peers decreasing employment costs, increasing productivity, and decreasing
waste 5. Size allowing the company to outspend all peers but Alpargatas on the automation, design, advertising, and research
and development 6. Brands particularly the Melissa, Ipanema, and Rider brands. Grendene’s unique activities are supported by a tailored value chain allowing the company to maintain a stable ROIC well above its cost of capital. A stable ROIC that is well above the cost of capital is the best evidence of a competitive advantage.
Reperio Capital Research LLC. Important disclosures appear at the back of this report 10 | P a g e
Grendene SA (GRND3:BZ)
Consumer Goods / Personal Goods November 19, 2015
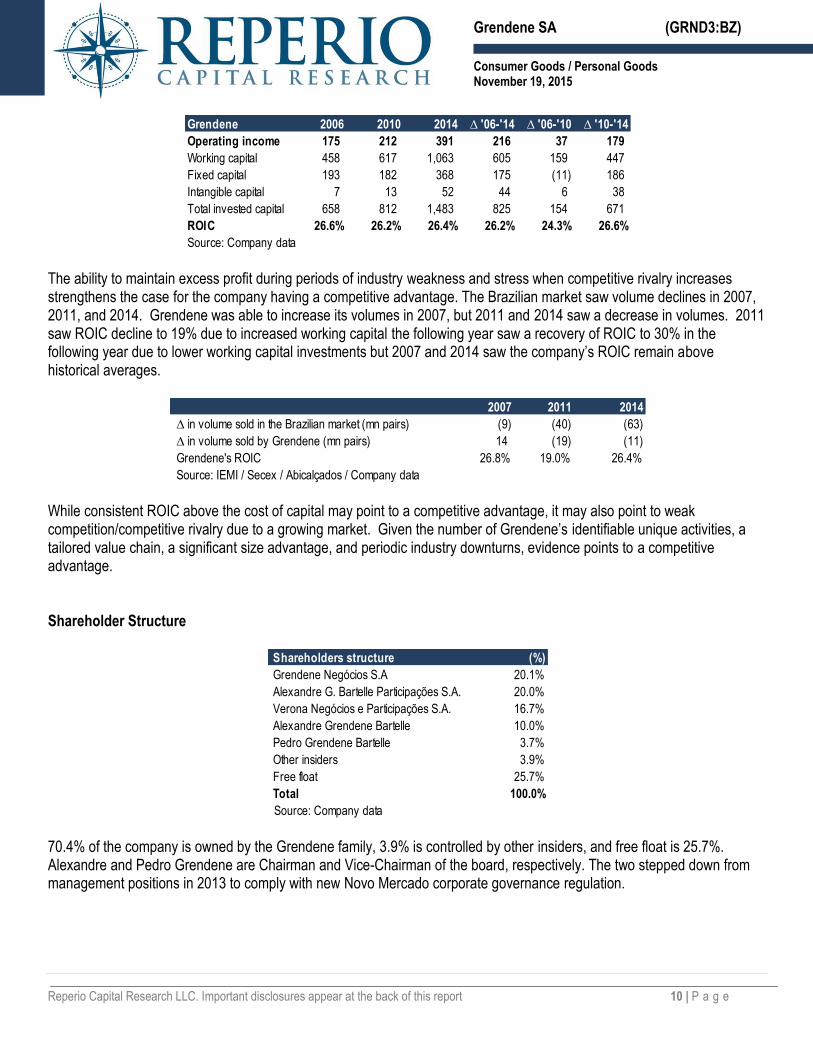
The ability to maintain excess profit during periods of industry weakness and stress when competitive rivalry increases strengthens the case for the company having a competitive advantage. The Brazilian market saw volume declines in 2007, 2011, and 2014. Grendene was able to increase its volumes in 2007, but 2011 and 2014 saw a decrease in volumes. 2011 saw ROIC decline to 19% due to increased working capital the following year saw a recovery of ROIC to 30% in the following year due to lower working capital investments but 2007 and 2014 saw the company’s ROIC remain above historical averages.
While consistent ROIC above the cost of capital may point to a competitive advantage, it may also point to weak competition/competitive rivalry due to a growing market. Given the number of Grendene’s identifiable unique activities, a tailored value chain, a significant size advantage, and periodic industry downturns, evidence points to a competitive advantage. Shareholder Structure
70.4% of the company is owned by the Grendene family, 3.9% is controlled by other insiders, and free float is 25.7%. Alexandre and Pedro Grendene are Chairman and Vice-Chairman of the board, respectively. The two stepped down from management positions in 2013 to comply with new Novo Mercado corporate governance regulation.
Working capital 458 617 1,063 605 159 447 Fixed capital 193 182 368 175 (11) 186 Intangible capital 7 13 52 44 6 38 Total invested capital 658 812 1,483 825 154 671 ROIC 26.6% 26.2% 26.4% 26.2% 24.3% 26.6%
Source: Company data
2007 2011 2014
∆ in volume sold in the Brazilian market (mn pairs) (9) (40) (63) ∆ in volume sold by Grendene (mn pairs) 14 (19) (11) Grendene's ROIC 26.8% 19.0% 26.4%Source: IEMI / Secex / Abicalçados / Company data
Shareholders structure (%)
Grendene Negócios S.A 20.1% Alexandre G. Bartelle Participações S.A. 20.0% Verona Negócios e Participações S.A. 16.7% Alexandre Grendene Bartelle 10.0% Pedro Grendene Bartelle 3.7% Other insiders 3.9% Free float 25.7% Total 100.0%
Source: Company data
Reperio Capital Research LLC. Important disclosures appear at the back of this report 11 | P a g e
Grendene SA (GRND3:BZ)
Consumer Goods / Personal Goods November 19, 2015
INDUSTRY Industry Overview In Grendene’s 2007 Annual Report, the company outlined the domestic footwear industry. The Brazilian footwear market has over 8,000 companies employing 299,000 workers. Within the Brazilian footwear industry, 97.6% of companies were micro and small companies (up to 249 employees), mid-size companies (250 to 999 employees) accounted to 2.0% of the industry, and companies with over 999 employees accounted for 0.4% of the industry. 42.3% of companies are dedicated to the domestic market, 54.1% are dedicated to export markets, and the remaining 3.6% of manufacturers are dedicated to both domestic and export markets. Roughly 91% of Brazilian footwear companies are located in Brazil’s Southern and Southeastern regions, the Northeastern region accounts for 6%, and the mid-western and Northern regions account for 3% of companies in the industry. In 2014, total Brazilian footwear production was 846 million pairs with 130 million pairs exported. Total apparent consumption in Brazil was 753 million pairs with 37 million pairs imported. The table below illustrates key supply and demand data for the Brazilian market.
In 2014, imports accounted for 4.9% of Brazilian apparent consumption and averaged 4.4% of apparent consumption since 2006. Imports have not played a significant part of the market. The two largest players in the Brazilian footwear market are Alpargatas, with a 31.3% domestic volume share and Grendene, with a 20.3% domestic volume share. Grendene is the largest Brazilian exporter with a 40.1% export volume share followed by Alpargatas with a 33.5% volume share. In both the domestic and export markets, both companies continue to gain share.
Brazil (mn of pairs) 2006 2007 2008 2009 2010 2011 2012 2013 2014
Reperio Capital Research LLC. Important disclosures appear at the back of this report 12 | P a g e
Grendene SA (GRND3:BZ)
Consumer Goods / Personal Goods November 19, 2015
Industry Growth Market research firm MarketLine estimates the Brazilian footwear market will grow by 5.3% per year between 2014 and 2019 reaching USD14.58 billion. According to the World Footwear Yearbook 2015, Brazil consumed 4.0 pairs of shoes per capita in 2014 and had a GDP per capita of USD11,200.
There seems to be a relationship between GDP per capita and pair of shoes consumed. If Brazil is able to continue to develop and increase its GDP per capita, the number of pairs of shoes consumed per capita should increase. Additionally, there is a relationship between price and GDP per capita so as GDP per capita increase so will price. Grendene’s products are lower priced products so the company has further room to raise prices. The low priced nature of the company’s products also makes it less sensitive to macroeconomic fluctuations. Grendene has been able to grow domestic volumes at a faster pace than the overall market with the company’s volume share increasing by 5.3% since 2006. Over the same period, ASP grew by 2.0% per year. Periodically, there will be a year with revenue decline driven primarily by a volume decline (2008, 2011, and 2014) but overall the domestic market continues to increase. ASPs have shown consistent uptrend until 2010 when ASPs stalled. In 2010, there was a significant price increase that the market seems to have to absorb, but as shown above as GDP per capita increases prices should continue to increase.
2014
GDP per Capita
(USD '000s)
Pairs Consumed
per Capita
Ave Shoe Price
(USD)
Australia 66.2 6.1 95.3
US 53.0 7.3 83.0 Canada 52.3 4.6 80.5 Germany 46.3 5.4 98.8 UK 41.8 8.2 89.4 Italy 35.9 5.2 104.8 Russia 14.6 2.9 79.7
Poland 13.6 2.9 67.9 Brazil 11.2 4.0 71.6
Mexico 10.3 2.6 61.6 Colombia 7.8 1.8 64.1 China 6.8 2.7 94.7 South Africa 6.6 4.3 66.0
Peru 6.6 2.5 70.2
Indonesia 3.5 2.2 51.4 Nigeria 3.0 0.8 44.7 India 1.5 1.6 42.7
Sources: United Nations, World Footwear Yearbook 2015, Numbeo.com
Reperio Capital Research LLC. Important disclosures appear at the back of this report 13 | P a g e
Grendene SA (GRND3:BZ)
Consumer Goods / Personal Goods November 19, 2015
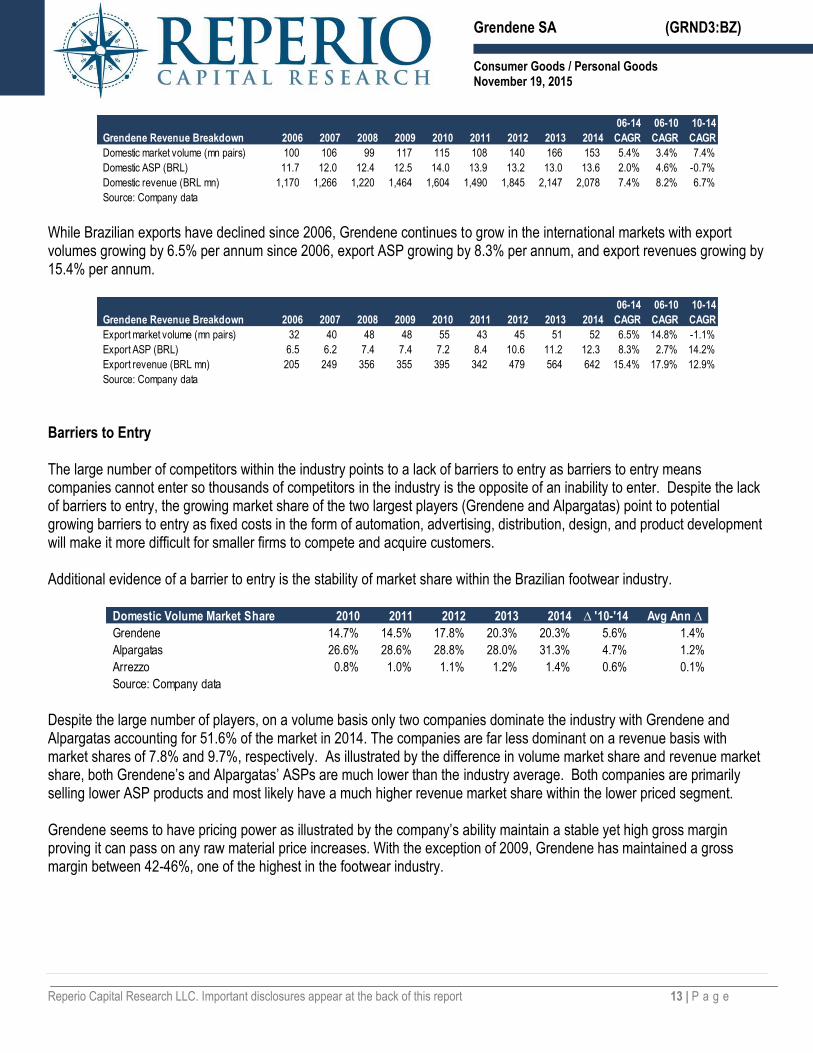
While Brazilian exports have declined since 2006, Grendene continues to grow in the international markets with export volumes growing by 6.5% per annum since 2006, export ASP growing by 8.3% per annum, and export revenues growing by 15.4% per annum.
Barriers to Entry The large number of competitors within the industry points to a lack of barriers to entry as barriers to entry means companies cannot enter so thousands of competitors in the industry is the opposite of an inability to enter. Despite the lack of barriers to entry, the growing market share of the two largest players (Grendene and Alpargatas) point to potential growing barriers to entry as fixed costs in the form of automation, advertising, distribution, design, and product development will make it more difficult for smaller firms to compete and acquire customers. Additional evidence of a barrier to entry is the stability of market share within the Brazilian footwear industry.
Despite the large number of players, on a volume basis only two companies dominate the industry with Grendene and Alpargatas accounting for 51.6% of the market in 2014. The companies are far less dominant on a revenue basis with market shares of 7.8% and 9.7%, respectively. As illustrated by the difference in volume market share and revenue market share, both Grendene’s and Alpargatas’ ASPs are much lower than the industry average. Both companies are primarily selling lower ASP products and most likely have a much higher revenue market share within the lower priced segment. Grendene seems to have pricing power as illustrated by the company’s ability maintain a stable yet high gross margin proving it can pass on any raw material price increases. With the exception of 2009, Grendene has maintained a gross margin between 42-46%, one of the highest in the footwear industry.
Reperio Capital Research LLC. Important disclosures appear at the back of this report 14 | P a g e
Grendene SA (GRND3:BZ)
Consumer Goods / Personal Goods November 19, 2015
The company’s product is low priced and customers purchase the product infrequently meaning the company can pass on small price increases without the customer notice as the low price increases search costs as it is not worth the customer’s time to search for alternatives between relatively low priced items. Infrequent purchases means the customer has to recalibrate a reference point every time there is a purchase decision as the customer does not state up to date on pricing. The low priced product also creates the potential for a brand as the cost of searching between two different low priced items is not worth the customer’s time. Grendene and Alpargatas can charge a premium of 10% on a BRL30 pair of shoes as the companies are known entities. Customers will most likely not bother looking at an unknown competitor’s footwear because they trust both companies’ products and footwear is an experience good. On the other side of the argument is customers are shopping within the low priced segment due to the low price rather than any specific brand therefore a brand within the low price segment is harder to build. Economies of scale are likely to exist in the industry as both Grendene and Alpargatas spend heavily on advertising and have a significant relative size advantage over competitors. Grendene also spends heavily on R&D, automation, process improvements, and distribution. Assuming advertising is the only fixed cost, operating expenses are 20% of revenues (similar to Grendene and Alpargatas), and competitors within the low priced segment have roughly the same ASP and gross margin as Alpargatas (roughly 40%), to reach breakeven competitors would need to reach 8.0% of total Brazilian production. Brazilian production is used as Grendene and Alpargatas advertising and operating expenses go both to the domestic market and export market. With Grendene and Alpargatas producing a combined 57.2% of all footwear produced in Brazil, very few competitors can match their level of advertising and remain profitable giving both companies a huge advantage in acquiring customers.
38.0%
40.0%
42.0%
44.0%
46.0%
48.0%
50.0%
2006 2007 2008 2009 2010 2011 2012 2013 2014
Source: Company data
Gross Margin
Reperio Capital Research LLC. Important disclosures appear at the back of this report 15 | P a g e
Grendene SA (GRND3:BZ)
Consumer Goods / Personal Goods November 19, 2015
Competitive Rivalry In 2014, the total domestic volume consumed decreased due to weak macroeconomics temporarily increasing competitive rivalry. In the longer term, the footwear should continue to grow as Brazilians consume more footwear. 97.6% of the Brazilian footwear industry is smaller firms with less than 250 employees or essentially weaker competition, which also decreases the competitive rivalry within the industry. Footwear is a commodity product, but design, licensing, and marketing can shift the competition away from price. Grendene is favorably positioned in design, licensing, and marketing decreasing competitive rivalry. Grendene’s size and efficient production places it much lower on the cost curve compared to peers allowing it to survive and continue to generate excess profits during period of intense competitive rivalry. There are no exit barriers and products are not perishable keeping rivalry low. Lack of switching costs point to higher competitive rivalry. Overall, the industry may face strong competitive rivalry epitomized by the Alpargatas’ weaker returns during the recent downturn but Grendene’s stable ROIC points to immunity from competitive pressures. In the export market, Grendene faces much heavier competition as the company’s competitive advantages are weaker if there are any leading to weaker profitability. Bargaining Power of Suppliers The main footwear raw materials are commodities produced by many different suppliers similar to the footwear manufacturing industry so neither side has any bargaining power. Grendene tries to use its size to gain bargaining power but it mentions that if it stopped purchasing raw materials from any of its suppliers there would be no disruption to the suppliers’ operations pointing to no bargaining power. The bargaining power of labor is weak as it is fragmented and in an even weaker position at Grendene due to the company’s use of automation. Despite the weak bargaining power of labor, Grendene treats its employees very well and won awards for being one of the best employers in the industry and in Brazil. The company received the Top Ser Humano
ASP (BRL) 11.0 Gross margin 40.0%Gross profit per pair (BRL) 4.40 Operating expense % revenue 20.0%Operating profit per pair before advertising 2.20 Grendene's avg 5 yr ad exp (BRL mn) 149
Break even # of pairs (mn) 67.7 Volume market share of total production 8.0%Source: Company data, Reperio Capital Research estimates
Scale Advantage
Reperio Capital Research LLC. Important disclosures appear at the back of this report 16 | P a g e
Grendene SA (GRND3:BZ)
Consumer Goods / Personal Goods November 19, 2015
ABRH-RS (Top Human Being) for two consecutive years in 2012 and 2013 from the Human Resources Brazilian Association of Rio Grande do Sul (ABRH-RS) for people management practices in the state of Rio Grande do Sul. Bargaining Power of Customers Grendene size, brand name, uniqueness of product, own retail network, lack of customer concentration, fragmentation of customers, and value added services provided to retailers gives it bargaining power over its retail partners in Brazil. Outside of Brazil, the company is not as well known and in a much weaker bargaining position but the uniqueness and quality of its product increases the company’s bargaining power slightly. Threat of Substitutes The threat of substitutes is low. There are many different choices within footwear leading to higher competitive rivalry but currently there is little alternative for footwear. Relative Operational Performance Grendene and Alpargatas combine to account for 388.35 million of the 753 million pairs of shoes consumed in Brazil for a total 51.6% volume share. In 2014, on a revenue basis, Grendene holds a 7.8% market share and Alpargatas holds a 9.7% market share. Both companies have an average ASP of roughly BRL11.00 compared to the average shoe price in Brazil of roughly BRL35.23. If Grendene or Alpargatas can create high quality products at a lower price backed by large amount of advertising the companies will have an opportunity to build a strong brand backed by economies of scale. The low price requires large volumes to cover the fixed costs in the form of marketing, research and development, and depreciation (automation). The low price also increases the search cost. If two pairs of footwear are side by side and one is BRL33 vs. BRL30, the product with a strong brand will be purchased more often than not as the absolute price is not that much different and footwear is an experience good.
Reperio Capital Research LLC. Important disclosures appear at the back of this report 17 | P a g e
Grendene SA (GRND3:BZ)
Consumer Goods / Personal Goods November 19, 2015
The table above exhibits the domestic business for both Grendene and Alpargatas on a per unit basis. Selling expense, administrative expense, working capital investment, and fixed capital investment per unit are from the company rather than the domestic business as these items are not separated out in the financial statements. In 2014, Grendene was able to generate a much higher gross profit than Alpargatas due to a combination of a slightly higher ASP in the Brazilian market and a lower cost of production. The gains from production efficiencies are increased due to operational efficiency as selling expense per pair and administrative expense per pair are lower than Alpargatas. Grendene is much more efficient in capital efficiency with IC turnover of 1.54 compared to Alpargatas’ IC turnover of 1.31. Grendene has weaker working capital turnover in both 2014 and over the last five years as the company sells many different products while Alpargatas’ main product in both domestic and export markets is Havaianas sandals. Overall, Grendene is much more profitable and consistent with an average estimated domestic ROIC of 38.9% over the past five years compared to Alpargatas’ estimated domestic ROIC of 23.1%. Grendene’s total ROIC and incremental ROIC has also been much more consistent than Alpargatas. Alpargatas has been extremely inconsistent and incremental ROIC has deteriorated over last four years while Grendene’s total and incremental ROIC have been remarkably stable.
Per Pair (2014) Grendene Alpargatas Per Pair (5Yr Avg) Grendene Alpargatas
Working capital investment 5.19 3.41 Working capital investment 4.82 2.38 Fixed capital investment 1.80 2.50 Fixed capital investment 1.35 1.88 Intangible capital investment 0.25 2.40 Intangible capital investment 0.14 1.43 Total invested capital 7.24 8.31 Total invested capital 6.31 5.69
Reperio Capital Research LLC. Important disclosures appear at the back of this report 18 | P a g e
Grendene SA (GRND3:BZ)
Consumer Goods / Personal Goods November 19, 2015
Given the large number of manufacturers in the export market and the much larger size of the market, it is much more difficult to build any sort of competitive advantage making the industry similar to a commodity industry where excess profits come from either short term supply/demand imbalances or from being a low cost producer. The industry can bring on supply quickly and cheaply so short term supply/demand imbalances are likely to be very short term; therefore the key driver of profitability is the ability to manufacture at a lower cost. According to the World Footwear Yearbook 2012, in 2011, the average export price was roughly USD15.59. Brazil average export price was very low on the cost curve at USD11.47. The only country with a lower average export price was China with an average export price of USD3.87. The chart below illustrates the cost curve for the largest 15 export countries, which account for 86% of total exports. The y axis is the average export price while the x axis is the total export value in billion of US dollars.
Working capital 235 423 953 718 188 530 Fixed capital 201 302 698 497 101 396 Intangible capital - 259 670 670 259 411 Total invested capital 436 984 2,321 1,885 548 1,337 ROIC 34.4% 30.1% 14.0% 9.3% 26.8% 2.1%
Source: Company data
Reperio Capital Research LLC. Important disclosures appear at the back of this report 19 | P a g e
Grendene SA (GRND3:BZ)
Consumer Goods / Personal Goods November 19, 2015
Grendene accounted for 37.6% of Brazilian exports in 2011 with a gross export ASP of USD5.01 making the company very competitive on a cost basis. It is at the low end of the cost curve and one of the lowest cost producers outside of China. China accounted for 38.3% of global exports.
-
5.00
10.00
15.00
20.00
25.00
30.00
35.00
40.00
45.00
50.00
-
2.00
4.00
6.00
8.00
10.0
0
12.0
0
14.0
0
16.0
0
18.0
0
20.0
0
22.0
0
24.0
0
26.0
0
28.0
0
30.0
0
32.0
0
34.0
0
36.0
0
38.0
0
40.0
0
42.0
0
44.0
0
46.0
0
48.0
0
50.0
0
52.0
0
54.0
0
56.0
0
58.0
0
60.0
0
62.0
0
64.0
0
66.0
0
68.0
0
70.0
0
72.0
0
74.0
0
76.0
0
78.0
0
80.0
0
82.0
0
84.0
0
86.0
0
2011
Ave
rag
e E
xpo
rt P
rice
(U
SD
)
Total Export Value (USD bn)
2011 Average Export Price (USD)
China Brazil India Hong Kong Indonesia UK Vietnam Belgium Netherlands Spain Germany Romania France Portugal Italy
Source: World Footwear Yearbook 2012
Reperio Capital Research LLC. Important disclosures appear at the back of this report 20 | P a g e
Grendene SA (GRND3:BZ)
Consumer Goods / Personal Goods November 19, 2015
MANAGEMENT The largest shareholders and twin brothers Pedro and Alexandre Grendene are Chairman and Vice-chairman. The pair founded Grendene in 1971. In April 2013, they stepped down from the positions of Chief Executive Officer and Vice-President with the Chief Operating Officer Rudimar Dall’Onder taking over as Chief Executive Officer. Mr. Dall’Onder has worked at Grendene for over 30 years. The move was prompted by new regulation prohibiting executives from being on the board. Given Mr. Pedro Grendene’s and Mr. Alexandre Grendene’s shareholding and position on the board, they probably retain influence in company operations. Mr. Dall’Onder has worked with the Grendenes for years and to get into the CEO position he must have fit the mold of the brothers meaning he probably has the same owner operator mentality of the brothers. Operations In plastics manufacturing, Grendene continues to strengthen its advantage through capacity expansion, proprietary processes and equipment, and process improvements. The company has built significant economies of learning in plastics production, illustrated by creating formulations that are not available anywhere else, and in plastics goods manufacturing, highlighted by proprietary machines allowing for designs that no other footwear manufacturer could produce while having one of the highest gross margins in the footwear industry, also pointing to its ability to be a low cost producer. The company continues to automate it production process and produces almost 24% of Brazilian footwear with only 8% of the footwear workforce. Over the past three years, the company’s average spend on process improvements is BRL37 million. Any competitor wishing to replicate these fixed costs and reach breakeven would need to acquire 2.0% market share assuming similar ASP, gross margin, operating margin, and no money spent on advertising. In addition to its unique capabilities in plastic production and plastic good manufacturing, Grendene has a culture of constant improvement and operational efficiency to increase its manufacturing advantage. The company continues to take advantage of its size advantage over all domestic peers except Alpargatas by spending BRL249 million in 2014 on fixed expenses including advertising (BRL169 million), product development (BRL45 million), and process improvements (BRL34 million). Over the past two years, the company has averaged BRL243 million per year in spending on fixed costs including advertising (BRL160 million), product development (BRL46 million), and process improvements (BRL37 million). Assuming a similar ASP and gross margin to Grendene and Alpargatas as well as other operating expenses of 15% of sales, lower than Grendene’s other operating expenses, to match Grendene’s spending on fixed costs and reach breakeven a competitor would need to produce 88.4 million pairs of shoes or 10.4% of all footwear production in Brazil. With Grendene and Alpargatas producing 57.2% of footwear in Brazil, there is little room for other players to compete with both companies.
ASP (BRL) 11.0 Gross margin 40.0%Gross profit per pair (BRL) 4.40 Operating expense % revenue 15.0%Operating profit per pair before advertising 2.75 Grendene's avg 5 yr fixed costs (BRL mn) 243
Break even # of pairs (mn) 88.4 Volume market share of total production 10.4%Source: Company data, Reperio Capital Research estimates
Scale Advantage
Reperio Capital Research LLC. Important disclosures appear at the back of this report 21 | P a g e
Grendene SA (GRND3:BZ)
Consumer Goods / Personal Goods November 19, 2015
As illustrated by the company’s advertising, it continues to build it brand domestically and internationally. In addition to advertising, the company is strengthening Melissa brands position as a high fashion, strong design premium product by completing its third Galeria Melissa in London with plans to build another Galeria Melissa in Asia. Additionally, the company continues to collaborate with top designers such as Karl Lagerfeld, Vivienne Westwood, Jason Wu, and J. Maskrey. The company’s Clube Melissa network reached 195 stores at the end of Q3 2015. The company also opened its first Casa de Ipanema in February 2014 next to the beach from where the brand got its name. In addition, celebrities Ivete Sangalo, Shakira, Paula Fernandes, and Juliana Paes among many others endorsed the company’s product. The company also continued licensing characters from Mattel and Disney as well as adding Peppa Pig Baby. The company also signed licensing agreement with Azaleia and Dijean brands. All these moves aide in building the company’s brands. The company continues to perform strongly on financial metrics with a consistent absolute and incremental ROIC well above its peers and its cost of capital.
The only downside operationally is execution on the new furniture operations A3NP, which is still loss making and operating below expectations. The weakness of the Brazilian economy has not helped the new venture. In 2008, Grendene outlined financial targets for 2015. The company extended the targets until 2018 in February 2015. The company expects gross revenue growth of 10% (8%-12%) per year, profit growth of 13% (12%-15%), and advertising expense averaging 8% (8%-10%) of net revenue. The company acknowledges it may not meet growth targets every year but over the full period it expects to reach its targets.
As illustrated above at the end of 2014, the company is on track to meet its targets of roughly 10% annual revenue growth and 13% net income growth. Capital Allocation The first aspect of capital allocation is the company’s capital structure and whether management is taking excessive risk by overleveraging the company’s balance sheet. Excessive leverage creates two risks; first, it creates the risk of bankruptcy, and second, it limits the flexibility of a company and the ability to take advantage of opportunities. At the end of the third
Reperio Capital Research LLC. Important disclosures appear at the back of this report 22 | P a g e
Grendene SA (GRND3:BZ)
Consumer Goods / Personal Goods November 19, 2015
quarter 2015, the company had a net cash position equal to 2.2 times trailing twelve month EBIT. The company has been conservative with its financial position maintaining a net cash position.
The table below shows how Grendene has allocated all available cash since 2009.
Since 2009, Grendene has generated a total of BRL3.065 billion in earnings available for capital allocation decisions. This is earnings from operations before accounting for depreciation, advertising, and product development expense plus financial income minus income tax expense representing cash generated before management made any capital allocation decision, therefore it is revenue minus all the variable cash expenses to run the business. Depreciation is added back to profit as it is a non-cash expense. Maintenance capex is subtracted later as it is a better measure of economic depreciation. In the case of Grendene, it is roughly equal. Advertising expense and product development are capital allocation decisions therefore are added back to operating profit and subtracted separately.
Reperio Capital Research LLC. Important disclosures appear at the back of this report 23 | P a g e
Grendene SA (GRND3:BZ)
Consumer Goods / Personal Goods November 19, 2015
Since 2009, operating profit before capital allocation decisions accounted for BRL2.28 billion, or 74.5% cash generated, while financial income accounted for BRL783 million, or 25.5% of cash generated before capital allocation decisions. Since 2009, Grendene’s largest capital allocation decision has been BRL1.214 billion spent on dividends, representing 54.2% of reported net income. Over the same period, the company spent freely on fixed costs and capital expenditures yet still had a net increase in cash of BRL250 million, the company could increase the amount of cash returned to shareholders either in the form of dividends or buybacks as Grendene has a very healthy net cash position of 2.2 times trailing twelve month EBIT and a very strong competitive position in the domestic market allowing for continued cash generation. Other than dividends the largest capital allocation decision is fixed expenses feeding through the income statement in the form of advertising, BRL863 million since 2009, and product development, BRL306 million since 2009. With Grendene’s size advantage over peers in the domestic market, fixed expenses should be maximized to cement the company’s competitive position as only Alpargatas can match the company’s spending on these costs and generate profits. In the international market, fixed expenses do not make as much sense. The company is trying to complete the very difficult task of building an international footwear brand. The company is taking the right measures to build a brand by having a differentiated product in the form of plastic shoes designed by famous designers at a low price providing high quality, fashion products at affordable prices, but competition is much more difficult in international markets and the key to the company’s success is probably much more the ability to produce high quality footwear at a very low price. Grendene’s business is not capital intensive. All capex combined is slightly higher than product development expenses and well below advertising expenses. Maintence capex is the largest part of capex, which management states is equal to depreciation. Process improvements should probably be included in maintenance capex as it is required to maintain the company’s margins and competitive position. There was a step up in capacity in 2013 when the company increased capacity from 200 million pairs to 250 million pairs. The company spent BRL64 million for 50 million pair increase in capacity or BRL1.28 per pair. In 2004, the company increased capacity from 160 million pairs to 176 million pairs at an investment cost of BRL25 million or BRL1.56 per pair. It appears that the cost of investing in new capacity is decreasing. The company also recently allocated BRL22 million to A3NP, a plastic furniture collaboration with well known industrial designer Philippe Starck. Many commentators do not like this investment because it is outside of the company’s main market of footwear. The investment in A3NP and potential further investment in the form of losses makes a lot of sense as it caters to Grendene’s strengths of manufacturing plastic products, designing fashion products, and advertising fashion products to consumers, particularly Brazilian consumers. It seems like a low risk high potential reward investment as the company believes the furniture business can reach USD100 million in annual revenues in four to five years. It is underperforming at the moment due to weakness in the Brazilian economy, but the venture makes a lot of sense given the company’s strengths. As long as investment costs do not get out of control, it would be wise to continue the venture. The company has already stated it is keeping an eye on the project to make sure investment costs do not get to high destroying the risk reward profile of the project. Overall, Gredene’s capital allocation has been good but not great. The company could return more cash to shareholders, or invest in high returning projects rather than keeping the cash on the balance sheet. The company is doing a good job of spending on fixed expenses in the domestic market solidifying its competitive position. The furniture business also seems to take advantage of the company’s competitive strengths and has significant upside despite the projects current weakness. The investment in advertising in export markets is probably not generating the returns it would in local markets given its weaker competitive position but the company probably still generates slight excess profits in export markets given its low cost of production.
Reperio Capital Research LLC. Important disclosures appear at the back of this report 24 | P a g e
Grendene SA (GRND3:BZ)
Consumer Goods / Personal Goods November 19, 2015
Accounting The table below illustrates the accounting policies of the three publicly listed Brazilian footwear companies.
Grendene’s accounting policies are in line with peers with nothing pointing to actual profitability being far off reported profits. Salaries
Over the past four years, Grendene’s management has compensated itself at half the rate of industry peers. For a management team that generates consistent excess returns by understanding and exploiting its competitive advantages and running efficient operations, 2.0% of operating income is not excessive compensation. Corporate Governance Grendene has 100% tag along rights meaning minority shareholders will receive the same conditions as controlling shareholder if control is sold.
Accounting Grendene Alpargatas Arezzo
Inventory valuation Production cost Production cost Average costDepreciation method Straight line Straight line Straight lineLand and buildings 25 25 25Machinery, equipment and facilities 10 12 10Furniture and fixtures 10 10 10Vehicles NA 7 5
Data processing equipment 5 NA 5Tools 5 NA NALeasehold improvements NA 5 NASoftware 5 5-10 5Trademarks and patents 10 10 NAGoodwill 5 NA NATechnology 5 NA NACustomer portfolio NA 5 NASource: Company data
Management salaries (BRL mn), 4 yr total 17 55 14 % of operating income 1.2% 3.6% 2.6%
Option expense (BRL mn), 4 yr total 11 9 9 % of operating income 0.8% 0.6% 1.7%Source: Company data
Reperio Capital Research LLC. Important disclosures appear at the back of this report 25 | P a g e
Grendene SA (GRND3:BZ)
Consumer Goods / Personal Goods November 19, 2015
Grendene has a number of related party transactions. The sum of all these transactions is insignificant with an average sum of the related party transactions equal to 2.3% of operating profit. Clearly, no related party transactions would be ideal but given the insignificance, the company’s insider transactions are not a concern. Miscellaneous Grendene’s management has a long term outlook to the business. The first piece of evidence is the company’s conservative financial position. A consistent net cash position signals management is aware of cycles in business and the need for a buffer against poor outcomes either from poor execution, poor decisions, or bad luck. It also provides optionality in case of attractive opportunities present themselves. In publishing long term financial targets and reiterating those targets, management repeatedly stated that year to year the company may not meet the targets due to cyclicality pointing to a concern for long term value creation rather than short term quarterly earnings. Management’s stated “The truth is that we should be humble and recognize that we do not know beforehand the result of one single year, nor can we know for sure how the market is going to act. What we know with reasonable sure is that we are flexible and can quickly adjust to the market demands and that, throughout a sufficiently extended period, we achieved the planned results and, as such, we extended this perspective up to 2018.” In addition to being an example of the company’s long term thinking, it shows management is humble, flexible, and will not fall victim to the illusion of knowledge. Further evidence of management’s long term thinking is the investment in the furniture business. The company explicitly stated short term profitability would be hurt due to investment requirements, but in the long term the business should be strengthened. This low risk high potential reward investment also shows the company understands its strength in manufacturing plastics, design, and marketing of design oriented products. The final piece of evidence of management’s long term thinking is the company continues to state in its annual reports and communications to shareholders “We believe that a fundamental measure of our success will be the generation of value for our stockholders in the long term. This value will be the direct result of our skill in expanding and strengthening our brands and maintaining high volumes of production, since the greater the volumes, and the stronger and more recognized our brands, the more powerful our business model will be. In our view, strong brands will be directly related to higher revenues, higher profitability, high turnover of products and assets and, consequently, greater returns on capital invested.” This statement also points to the company’s understanding of its scale advantage and the focus on returns on invested capital, the best measure of operational profitability. Management is also honest during periods of weakness. It makes no excuses and learns from its mistakes. After a weak 2005 management stated “2005 was a year that fell far short of what we could and should have achieved. But it was also a year of much learning and new experiences. It was also our first complete business year as a listed company. With the listing we began to look at the company in a different way, with continuing evolution from the culture of a privately-held
Related Party Transactions 2009 2010 2011 2012 2013 2014
Total 6.02 5.39 11.49 10.51 10.88 14.12
% of assets 0.3% 0.3% 0.6% 0.5% 0.5% 0.5%% of equity 0.4% 0.3% 0.6% 0.5% 0.5% 0.6%% of sales 0.4% 0.3% 0.8% 0.6% 0.5% 0.6%% of operating profit 2.1% 1.6% 3.4% 2.1% 2.2% 2.7%Source: Company data
Reperio Capital Research LLC. Important disclosures appear at the back of this report 26 | P a g e
Grendene SA (GRND3:BZ)
Consumer Goods / Personal Goods November 19, 2015
company to a listed one…The discipline of reporting to our minority shareholders and to the market has highlighted for us that in 2005 we achieved less than we should have, even considering the difficult macro environment. The attentive eye of approximately 4,000 shareholders – institutional and non-institutional investors – and of the investment analysts continues to give us vital feedback, as they make their perceptions and concerns clear to us, and demand information about the performance of the company and about the future scenario. For us, this factor transformed a period of crisis in the footwear sector also into a year of learning, and significant improvements in our management discipline.” Management has strong relations with employees, suppliers, vendors and is environmentally conscious. The strength of the company’s employee relations are illustrated by the company receiving the Top Ser Humano (Top Human Being Award) for in 2012 and 2013 from the state of Rio Grande do Sul for its treatment of employees. In 2012, Grendene was awarded the 1st place in the category - People Management - Large Companies, receiving the award SESI Qualidade no Trabalho (PSQT) from Crescer+. The award is given to the Brazilian companies that invest in the valuation and life quality of their employees. Its strong relations with suppliers are exhibited by the company receiving multiple awards as top licensee. In 2012, Grendene was recognized as the Best Mattel Licensee Of The World. In Latin America, the company was recognized with Best Barbie Marketing Campaign and Best Hot Wheels Licensee. Also in 2012, it received the "Best Overall Licensee 2012" award, granted by Cartoon Network due to the Ben 10 license. Grendene also received the award Melhor Performance de 2012 (Best performance in 2012), granted by American Greetings, because of the Moranguinho (Strawberry Shortcake) license. In 2011, the company won Licensee of the Year, of the Moranguinho brand (Strawberry Shortcake): best distribution, best product, best sales volume, best relationship with licensor, best investment in media, and best point of sale exposure. The company is environmentally responsible reporting on its environmental impact including improvements to resource consumption. For example, in 2014, only 20% of the company’s water consumption is used in the industrial processes. The other 80% are consumed by Grendene’s personnel. The company decreased its water consumption per manufactured pair by 3%, decreased energy consumption per manufactured pair by 2%, and decreased waste generated per manufactured pair by 38%. Grendene joined WalMart's Sustainability Pact. In 2014, the company became the first footwear company to be granted with the Supply Certificate by the Brazilian Association of Textile Retail (ABVTEX). This certificate allows the retail market to certify and monitor its suppliers regarding environmental, social, and labor relation practices. In 2013, a survey conducted by the AMANHÃ Magazine and Grupo Troiano de Branding awarded Grendene with the Prize Corporate Reputation in the footwear manufacturer category. The survey listed the companies with the most solid image in 25 categories, divided into five basic aspects of corporate reputation: Admiration and Trust, Ability to Innovate, Quality of Products and Services, Social and Environmental Responsibility and History and Evolution. Overall, Grendene is not only strong operationally and strategically, but the company treats all stakeholders well and seems like a caring and respectful organization.
Reperio Capital Research LLC. Important disclosures appear at the back of this report 27 | P a g e
Grendene SA (GRND3:BZ)
Consumer Goods / Personal Goods November 19, 2015
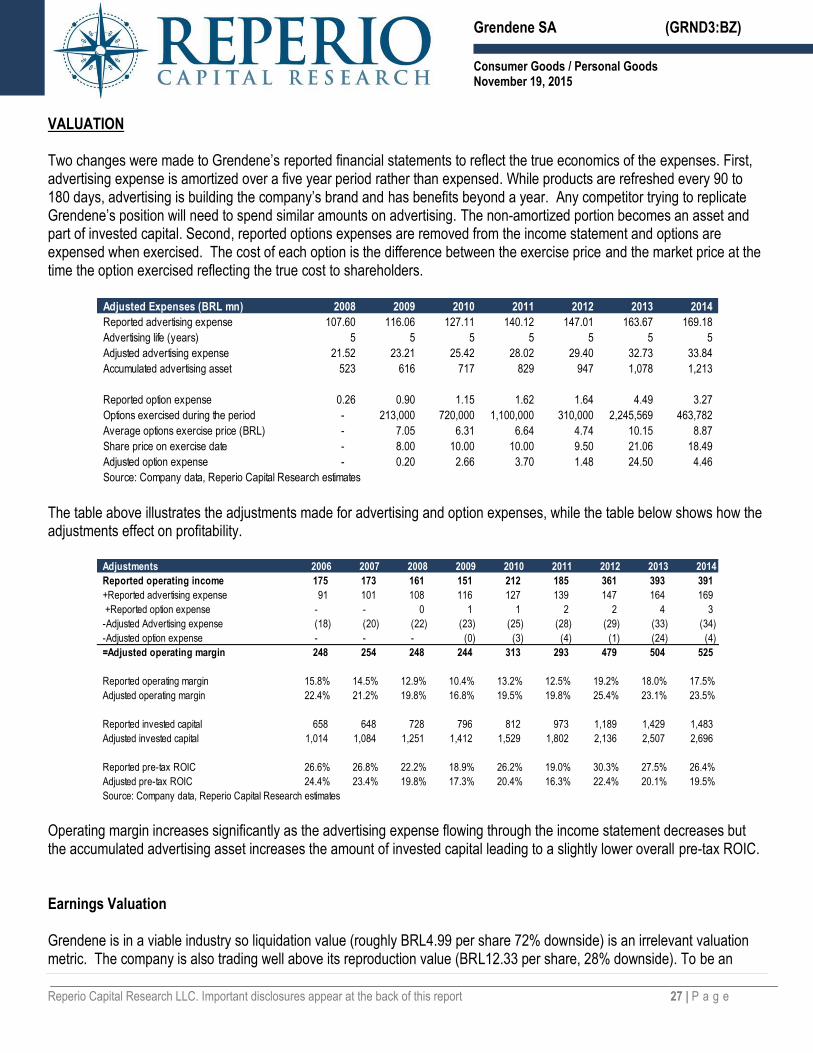
VALUATION Two changes were made to Grendene’s reported financial statements to reflect the true economics of the expenses. First, advertising expense is amortized over a five year period rather than expensed. While products are refreshed every 90 to 180 days, advertising is building the company’s brand and has benefits beyond a year. Any competitor trying to replicate Grendene’s position will need to spend similar amounts on advertising. The non-amortized portion becomes an asset and part of invested capital. Second, reported options expenses are removed from the income statement and options are expensed when exercised. The cost of each option is the difference between the exercise price and the market price at the time the option exercised reflecting the true cost to shareholders.
The table above illustrates the adjustments made for advertising and option expenses, while the table below shows how the adjustments effect on profitability.
Operating margin increases significantly as the advertising expense flowing through the income statement decreases but the accumulated advertising asset increases the amount of invested capital leading to a slightly lower overall pre-tax ROIC. Earnings Valuation Grendene is in a viable industry so liquidation value (roughly BRL4.99 per share 72% downside) is an irrelevant valuation metric. The company is also trading well above its reproduction value (BRL12.33 per share, 28% downside). To be an
Reported pre-tax ROIC 26.6% 26.8% 22.2% 18.9% 26.2% 19.0% 30.3% 27.5% 26.4%Adjusted pre-tax ROIC 24.4% 23.4% 19.8% 17.3% 20.4% 16.3% 22.4% 20.1% 19.5%Source: Company data, Reperio Capital Research estimates
Reperio Capital Research LLC. Important disclosures appear at the back of this report 28 | P a g e
Grendene SA (GRND3:BZ)
Consumer Goods / Personal Goods November 19, 2015
investment with any margin of safety, the company needs to maintain its competitive advantage as competitive pressures attack the company’s excess returns without any competitive advantage profitability will deteriorate to roughly its cost of capital with an intrinsic value equal to its reproduction value. It seems that the company has built multiple competitive advantages driven primarily by scale, production cost advantages, and brand illustrated by a consistent ROIC well above the cost of capital, stable gross margins, low production costs, unique production process, and a low priced product. Some of the company’s competitive advantages are more evident and stronger than others but overall earnings valuation seems like the appropriate valuation methodology. The key assumptions remaining constant throughout the different earnings valuations are shown below. The key value drivers not shown below are sales growth and operating margins, which vary in different valuation scenarios.
A 10% discount rate is used for all valuations eliminating subjectivity. Given beta is a measure of volatility rather than risk, CAPM is not valuable in determining a discount rate. Additionally, beta has +or-0.50 margin of error making it absolutely useless therefore making CAPM useless in the determining a discount rate. Instead of CAPM, a discount rate equivalent to opportunity cost is used. The S&P 500 has roughly returned 10% since 1928. MSCI Emerging Markets returned roughly 10% since inception. A 10% tax rate is used for the first five years before reverting to a 34% tax rate, equivalent to the corporate tax rate in Brazil, in the terminal assumptions. The company gets a number of tax benefits leading to the company paying only an average effective tax rate 7.6% in 2014, and 8.8% effective tax rate since 2006. A brief outline of the company’s tax incentives are below.
The PROVIN tax benefit consists of loans subsidized by the state of Ceara, in an amount equivalent to 75% to 100% of the ICMS (VAT) amount payable by Grendene. The amortization of the loan is 1% or 25% of the amount financed to the company monthly, adjusted by the IGP-M or TJLP. In the event of a timely payment of the amount of the amortization, the company does not need to pay the remaining portion of the ICMS amount payable provided all the other obligations
Key Assumptions Forecast Period Terminal Year 10 Current Average Peak Trough St Dev
Discount rate 10.0% 10.0%Tax rate -10.0% -34.0% -7.6% -8.8% -4.3% -13.7% 3.6%Working capital turnover 2.1 2.1 2.1 2.3 2.6 1.9 0.27 Fixed capital turnover 1.4 1.4 1.4 1.7 2.0 1.4 0.21 Source: Reperio Capital Research estimates
Tax Incentives Incentive % Expiration
period
% Expiration
period
% Expiration
period
Sobral – CE PROVIN - ICMS 81% Feb-19 75% Apr-25 75% Feb-19Crato – CE PROVIN - ICMS 81% Sep-22 75% Apr-25 75% Sep-12Fortaleza – CE PROVIN - ICMS 81% Apr-25 Apr-15Sobral – CE PROAPI- Export Mar-17 Sep-11Crato – CE PROAPI- Export Jan-14State of Bahia PROCOMEX 11% Apr-21Sobral – CE Income Tax 75% Dec-22Sobral – CE Income Tax 75% Dec-23Crato – CE Income Tax 75% Dec-20Fortaleza – CE Income Tax 75% Dec-16Teixeira de Freitas – BA Income Tax 75% Dec-17Source: Company data
20032014
Reperio Capital Research LLC. Important disclosures appear at the back of this report 29 | P a g e
Grendene SA (GRND3:BZ)
Consumer Goods / Personal Goods November 19, 2015
provided for in the respective documents governing the benefit are fulfilled. PROAPI is also an incentive program from the state of Ceara consisting of financing for the manufacturer and export of footwear. PROCOMEX is an 11% IMCS tax credit granted by the Bahia for the export of footwear. PROVIN and PROCOMEX offset value added tax accounted for in net sales revenue. The company recorded BRL195 million in IMCS and export tax incentives in net revenues offsetting value added taxes. The last two columns in the above table highlight tax incentives at the time of the company’s IPO prospectus. The company has increased the number of incentives, increased the amount of incentives, and extended incentives set to expire. Given the business is not capital intensive and the size of Grendene, the company seems to have bargaining power of governments relating to tax incentives as long as the company requires new capacity and modernization of old capacity. The income tax (IRPJ) credit decrease of 75% is for industrial units headquartered in the operation area of the Superintendence for the Development of the Northeast and is recorded directly in the statement of income as a credit to income tax.
The company shielded 43% of taxes on sales and services and 81% of income taxes since 2011, and 2008 respectively. Despite the company’s ability to extend portions of its tax incentives and apparent bargaining power over governments for tax breaks, conservatism states the tax rate should revert to the regulatory rate in the terminal assumptions. Working capital turnover, and fixed asset turnover are assumed to remain constant during the forecast period and in the terminal assumptions as the company’s capital efficiency has been stable, despite the decreased investment requirement associated with capacity expansion. The 2013 capacity increase only costing BRL1.28 per each pair compared to the 2004 capacity increase costing BRL1.56 per pair. The company’s capital efficiency since 2006 is shown below.
Given key value driver assumptions listed above, Grendene is valued under multiple scenarios by varying the company’s sales growth and operating margin. The blended average of a residual income model, DCF model, and earnings power valuation are used to determine the company’s intrinsic value. The residual income and DCF models are three stage models with a five year forecast period followed by a four year fade period, and a terminal value in year ten. The fade period is where the explicit five year forecasts fade to the terminal assumptions. Despite periods of industry weakness, since 2006, Grendene has consistently grown its market share, sales, and operating profit. The company is confident of continue growth with a reiteration of financial targets until 2018. These financial targets
Tax Incentive Amount (BRL mn) 2008 2009 2010 2011 2012 2013 2014 ΣIMCS and export incentive received 107 131 143 140 168 192 195 695 Taxes on sales and service (317) (398) (459) (445) (1,619) Incentive % of tax -44% -42% -42% -44% -43%IRPJ 25 26 33 59 83 87 63 376 Income taxes paid (30) (31) (35) (75) (112) (104) (75) (461) Incentive % of tax -84% -84% -96% -78% -74% -84% -84% -81%Source: Company data
Capital efficiency 2006 2007 2008 2009 2010 2011 2012 2013 2014 06-14 Avg 06-14 St Dev
Working capital turnover 2.4 2.6 2.3 2.4 2.6 1.9 2.0 2.0 2.1 2.3 0.3 Fixed capital turnover 2.0 1.9 1.8 1.8 1.8 1.5 1.6 1.6 1.4 1.7 0.2 IC turnover 1.1 1.1 1.0 1.0 1.0 0.8 0.9 0.9 0.8 1.0 0.1 Source: Company data
Reperio Capital Research LLC. Important disclosures appear at the back of this report 30 | P a g e
Grendene SA (GRND3:BZ)
Consumer Goods / Personal Goods November 19, 2015
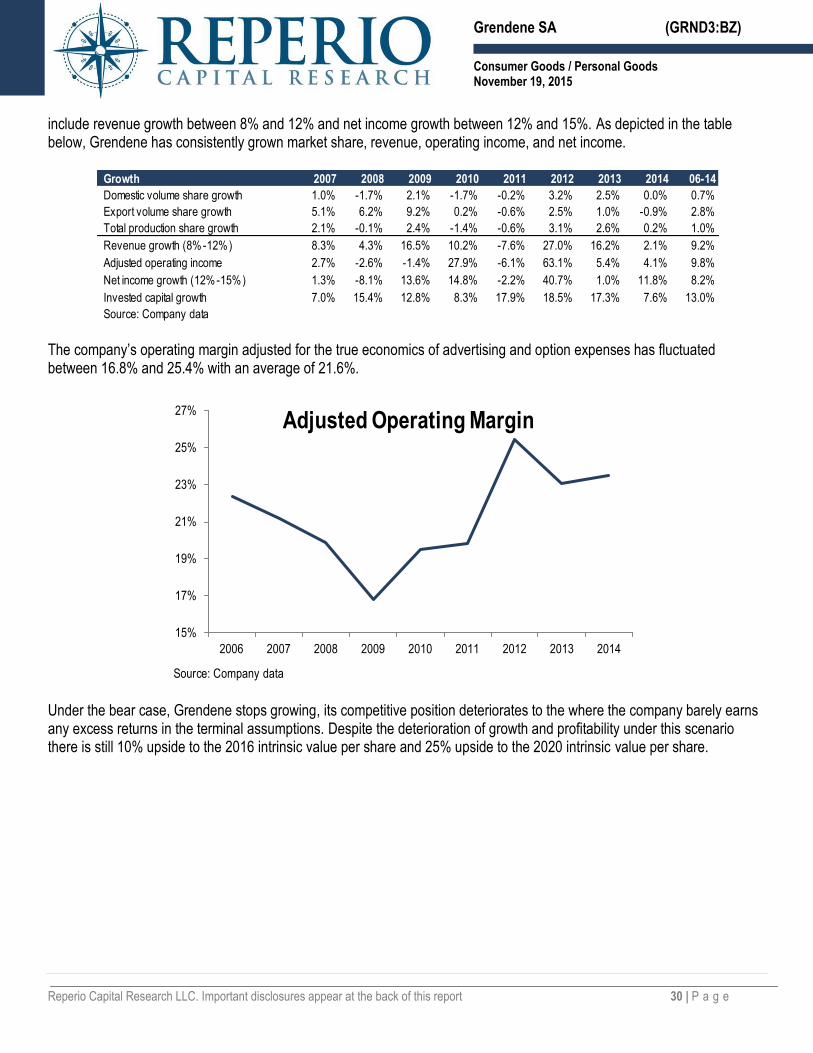
include revenue growth between 8% and 12% and net income growth between 12% and 15%. As depicted in the table below, Grendene has consistently grown market share, revenue, operating income, and net income.
The company’s operating margin adjusted for the true economics of advertising and option expenses has fluctuated between 16.8% and 25.4% with an average of 21.6%.
Under the bear case, Grendene stops growing, its competitive position deteriorates to the where the company barely earns any excess returns in the terminal assumptions. Despite the deterioration of growth and profitability under this scenario there is still 10% upside to the 2016 intrinsic value per share and 25% upside to the 2020 intrinsic value per share.
Net income growth (12%-15%) 1.3% -8.1% 13.6% 14.8% -2.2% 40.7% 1.0% 11.8% 8.2%
Invested capital growth 7.0% 15.4% 12.8% 8.3% 17.9% 18.5% 17.3% 7.6% 13.0%Source: Company data
15%
17%
19%
21%
23%
25%
27%
2006 2007 2008 2009 2010 2011 2012 2013 2014
Source: Company data
Adjusted Operating Margin
Reperio Capital Research LLC. Important disclosures appear at the back of this report 31 | P a g e
Grendene SA (GRND3:BZ)
Consumer Goods / Personal Goods November 19, 2015
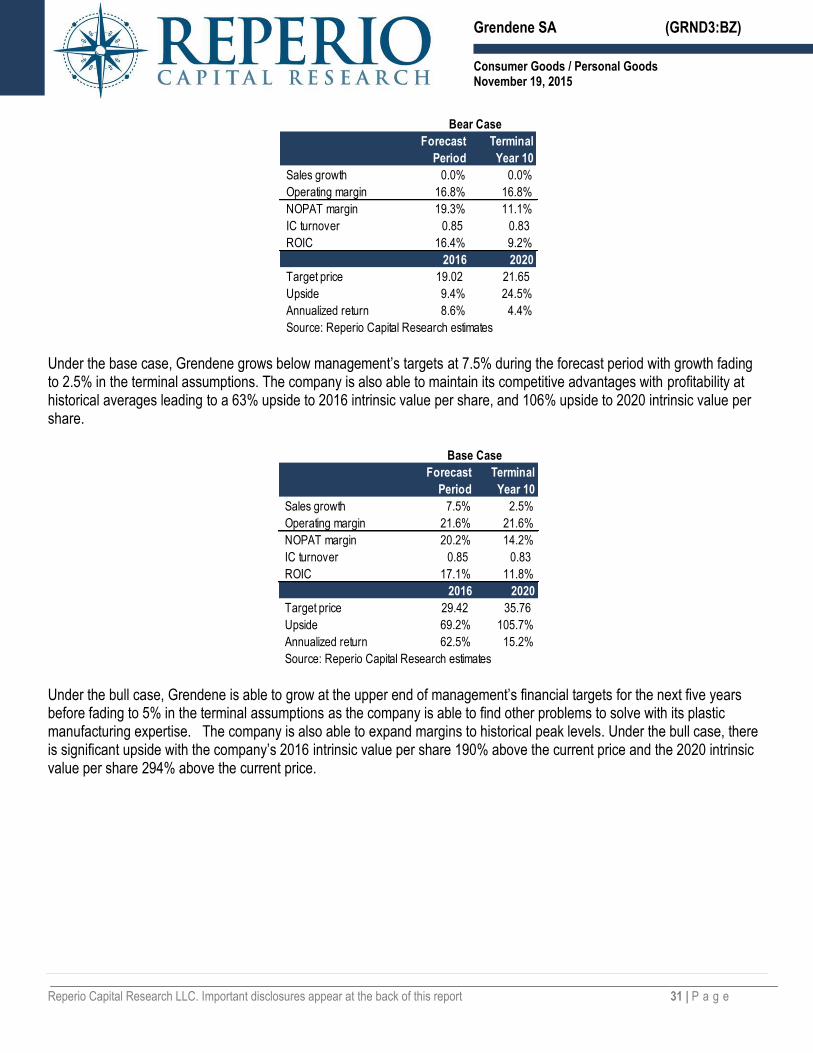
Under the base case, Grendene grows below management’s targets at 7.5% during the forecast period with growth fading to 2.5% in the terminal assumptions. The company is also able to maintain its competitive advantages with profitability at historical averages leading to a 63% upside to 2016 intrinsic value per share, and 106% upside to 2020 intrinsic value per share.
Under the bull case, Grendene is able to grow at the upper end of management’s financial targets for the next five years before fading to 5% in the terminal assumptions as the company is able to find other problems to solve with its plastic manufacturing expertise. The company is also able to expand margins to historical peak levels. Under the bull case, there is significant upside with the company’s 2016 intrinsic value per share 190% above the current price and the 2020 intrinsic value per share 294% above the current price.
Target price 29.42 35.76 Upside 69.2% 105.7%Annualized return 62.5% 15.2%Source: Reperio Capital Research estimates
Base Case
Reperio Capital Research LLC. Important disclosures appear at the back of this report 32 | P a g e
Grendene SA (GRND3:BZ)
Consumer Goods / Personal Goods November 19, 2015
The table below illustrates Grendene’s intrinsic value per share under various growth and margin scenarios.
With the bear case of no growth and trough margins providing upside, Grendene seems to be undervalued. Expected Return Expected return eliminates the need for any forecasts by assuming current earnings are sustainable, which makes sense given Grendene’s competitive advantages. Expected return is calculated using two methods. First, cash return, in the form of current dividend yield, is subtracted from the adjusted NOPAT yield to arrive at the amount of earnings to be reinvested. Reinvested earnings are multiplied by the franchise factor or the return on reinvested earnings divided by the discount rate to arrive at a value for reinvested earnings. For example, if a company has a discount rate of 10% and can reinvest earnings at 20% each reinvested dollar of reinvested earnings, it has a franchise factor of two and generates two dollars of value for
Reperio Capital Research LLC. Important disclosures appear at the back of this report 33 | P a g e
Grendene SA (GRND3:BZ)
Consumer Goods / Personal Goods November 19, 2015
every one dollar of reinvested earnings. The value of reinvested earnings is added to dividend yield and organic growth to arrive at an expected return. The second method of expected return uses the company’s FCF yield and adds the expected growth rate over the next five to ten years. Grendene expected return using multiple return on reinvested earnings and various growth rates is illustrated below.
Adjusted NOPAT yield is the company’s reported NOPAT adjusted for the true economics of advertising expense. The average NOPAT margin since 2006 is multiplied by current revenues to get adjusted NOPAT margin, which is then divided by Grendene’s enterprise value to obtain adjusted NOPAT yield. Average adjusted NOPAT margin since 2006 is used to account for cyclicality and eliminate the use of abnormally high earnings. No organic growth is used despite the company’s assumed pricing power as an additional layer of conservatism. The company’s adjusted ROIC has been fairly consistent around 19% leading to an expected return of roughly 17%. Adjusted FCF yield is the company’s adjusted FCF based on amortizing advertising expense. The average adjusted FCF margin since 2006 is used to account for cyclicality and is multiplied by current revenue to get a FCF figure, which is divided by the current enterprise value to get an adjusted FCF yield. Adjusted FCF yield takes into account growth capital expenditures therefore any expected is growth needs to be added to determine an expected return. Grendene’s adjusted FCF yield is 8.5%. Using 7.5% five year expected growth rate, below the low end of management’s growth targets, leads to an expected return of 16.0%. Using a 10% five year expected growth rate or the low end of management’s expected net income growth leads to an expected return of 18.5%. Why is It Cheap? Grendene is cheap due to macroeconomic and political issues within Brazil. While Brazil is having a difficult time with weaker commodity prices, twin deficits, and political turbulence, the country is still developing and does not have significant amount of debt outstanding with debt to GDP around 60% and external debt to GDP around 20%.
Reperio Capital Research LLC. Important disclosures appear at the back of this report 34 | P a g e
Grendene SA (GRND3:BZ)
Consumer Goods / Personal Goods November 19, 2015
RISKS The company has a net cash position and continues to generate stable excess returns pointing to very little financial risk. The company has a very strong position within the domestic market given its scale, the low cost of its product, low production costs, and uniqueness of its products. The biggest risk to its domestic competitive position is share loss. Share loss would negate the company’s biggest advantage (scale) in the domestic market. In the export market, the company’s has a much weaker competitive position and given the number of players, the size of the overall market, and the lack of any competitive advantage, failure to maintain operational efficiency, and low production costs would lead to decreased profitability. If state governments were to eliminate incentives, Grendene’s profitability would decrease by 20%. The end of the commodity boom could lead to prolonged weakness in the Brazilian economy. Brazilian household debt reached recent highs with domestic credit to GDP reaching 69% in 2014. The debt levels and weaker employment due to falling commodity prices may squeeze households and limit demand for Grendene’s products.
The company’s competitive advantage is weaker than determined and Grendene is unable to withstand competitive forces leading to deteriorating profitability and intrinsic value equal to the company’s reproduction value.
0
20
40
60
80
100
120
140
160
1960
1962
1964
1966
1968
1970
1972
1974
1976
1978
1980
1982
1984
1986
1988
1990
1992
1994
1996
1998
2000
2002
2004
2006
2008
2010
2012
2014
Source: World Bank
Domestic credit to private sector (% of GDP)
Reperio Capital Research LLC. Important disclosures appear at the back of this report 35 | P a g e
DISCLOSURE: This report has been prepared and distributed by Reperio Capital LLC. This report is based on sources that we consider reliable, but we do not represent it is accurate or complete, and it should not be relied on as such. All information contained herein is subject to change without notice. Reperio Capital Research LLC is not registered as an investment adviser nor a broker/dealer with the U.S. Securities & Exchange Commission, FINRA or any other regulator in any jurisdiction for the provision of investment advice. The analysis and information presented in this report by Reperio Capital Research LLC may include summary profiles of key companies in the relevant sector and the information is offered for subscriber interest only. This Report is not to be used or considered as a recommendation to buy, hold or sell any securities or other financial instruments and does not constitute an investment recommendation or investment advice. This report is not an offer to sell or the solicitation of an offer to buy any security in any jurisdiction where such an offer or solicitation would be illegal. It does not constitute a personal recommendation or take into account the particular investment objectives, financial situations, or needs of individual clients. Clients should consider whether any information in this report is suitable for their particular circumstances and, if appropriate, seek professional advice, including tax advice. Statements included in this report may constitute forward-looking statements within the meaning of the Private Securities Litigation Reform Act of 1995. Such statements involve a number of risks and uncertainties such as competitive factors, technological development, market demand and the company's ability to obtain new contracts and accurately estimate net revenues due to variability in size, scope and duration of projects, and internal issues. Neither Reperio Capital Research LLC nor the principals, officers and directors of Reperio Capital Research LLC have a long or short position with respect to any of the shares of the subject company covered in this report. Reperio Capital Research LLC is not a broker-dealer and does not generate any investment banking or commission-based revenue with respect to the securities of the company described herein. Our professionals may provide oral or written market commentary that reflects opinions that are contrary to the opinions expressed in this report. The price and value of the investment referred to in this report may fluctuate. Past performance is not a guide to future performance, future returns are not guaranteed, and a loss of original capital may occur. Certain transactions, including those involving futures, options, and other derivatives, give rise to substantial risk and are not suitable for all investors. Our report is disseminated primarily electronically, and, in some cases, in printed form. Electronic report is simultaneously available to all recipients in any form. The information contained in this report is not incorporated into the contents of our website and should be read independently thereof. No part of this material may be (i) copied, photocopied or duplicated in any for by any means or (ii) redistributed without the prior written consent of Reperio Capital Research LLC.