116
Grip on recovery aſter paediatric forearm fractures Ann Marjolein Hepping

Grip on recovery after paediatric forearm fractures
Ann Marjolein Hepping

Cover image: M. Oude Alink, N.H.M. Fleur & A.M. HeppingLayout and design: Lara Leijtens, Persoonlijk ProefschriftPrinting: Ridderprint
©2020, Ann Marjolein Hepping, Groningen, The Netherlands. All rights reserved. No part of this thesis may be reproduced or transmitted in any form or by any means without the prior permission of the copyright owner.

Grip on recovery after paediatric forearm fractures
Proefschrift
Ter verkrijging van de graad doctor aan de Rijksuniversiteit Groningen
op gezag van de rector magnificus prof. dr. C. Wijmenga
en volgens besluit van het College voor Promoties.
De openbare verdediging zal plaatsvinden op
maandag 11 januari 2021 om 14.30 uur
door
Ann Marjolein Hepping
geboren op 11 september 1984 te Purmerend

Promotores Prof. dr. S.K. Bulstra Prof. dr. J.H.B. Geertzen Dr. M. Stevens Beoordelingscommissie Prof. dr. P.C. Jutte Prof. dr. C.K. van der Sluis Prof. dr. R.M. Castelein

Promotores Prof. dr. S.K. Bulstra Prof. dr. J.H.B. Geertzen Dr. M. Stevens Beoordelingscommissie Prof. dr. P.C. Jutte Prof. dr. C.K. van der Sluis Prof. dr. R.M. Castelein
Paranimfen B. Barvelink B. Fard


CONTENTS
Chapter 1 General introduction 9
Chapter 2 Grip strength is strongly associated with height, weight and gender in childhood: a cross-sectional study of 2241 children and adolescents providing reference values.
17
Chapter 3 The influence of hand preference on grip strength in children and adolescents; a cross-sectional study of 2284 children and adolescents.
33
Chapter 4 The evolution of hand function during remodelling in non-reduced angulated paediatric forearm fractures a prospective cohort study.
49
Chapter 5 Recovery of strength after reduced paediatric fractures of the forearm, wrist or hand; a prospective study.
65
Chapter 6 Recovery of common post-traumatic symptoms, mobility and dexterity after reduced paediatric fractures of the forearm; a prospective study.
85
Chapter 7 General discussion 101
Summary 117
Samenvatting 121
Dankwoord 127
About the author 130


1CHAPTER
General Introduction

- 10 -
Chapter 1
VIRTUAL CASE
Did you ever sustain a fracture as a child?* If so, can you still remember it actually happening, the pain you felt, or the impact of the limitations you experienced thereafter? The answer is probably – and hopefully – only partially. A strictly hypothetical adult can still vividly remember a fall from her bike, the shivering from pain upon arriving at the hospital, and mostly being in tears about her persistent refusal to let the sleeve of her new sweater be cut open. After losing this not-so-lengthy stand she contemplated about the implications the injury could have for swimming during holidays, and realised that breaking the dominant arm could have more far-reaching consequences than breaking the other arm. What in retrospect was presumably a torus fracture was eventually treated by means of a plaster splint, though she can still recall that there was a debate about whether or not she would have to wear a cast. Roughly 30 hypothetical years later, some things have not changed.
INCIDENCE
The overall yearly incidence of paediatric fractures as reported by different epidemiological studies approaches an average of 23/1,000 children (16-36).1-7 Fractures thus constitute a very common paediatric injury; by the time children reach their 16th birthday approximately 44% of all boys and 28% of girls will have suffered at least one kind of fracture.1,3-5,7,8 The upper extremity harbours the top-three affected anatomical locations, namely the forearm (23-42%) and hand (17-28%), on which this thesis will focus, followed by the upper arm (6-11%).1,3-7,9,10 Generally speaking, this means that two-thirds of all sustained paediatric fractures are located in the upper extremity, and one-third is situated in the forearm. Moreover, the incidence of forearm fractures specifically seems to be on the rise, with several studies reporting increases of far over 30% between different cohorts. By contrast, the overall fracture incidence and the rates of femoral and tibial fractures, for example, have decreased.5,7,8,11,12
If you answered my first question* with a ‘yes’, chances are high that you are male, as fracture rates are overall higher in boys than in girls.4,10,11,13 Even though it is difficult to specify exact numbers by gender, as each incidence study has broken these numbers down to slightly different subgroups, fractures of the forearm and hand certainly and consistently form no exception to this rule.1,3,5,6,9,12,14 Overall, slightly under two-thirds of these fractures seem to be sustained by boys. The incidence of both forearm and hand fractures generally increases steadily until adolescence, before peaking at the age of 12-14 in boys and 10-11 in girls, although bimodal curves with a smaller peak incidence at the age of 5-6 have been described.1,3,5,7,9,10,12 From the age of 12 onwards, boys thus dominate this fracture population.7,14
- 11 -
General Introduction
CHILDREN ARE NOT TINY ADULTS
‘Children are not tiny adults, and should not be treated as if they were.’15 Over the course of my career I have come across different variations of this same code of conduct: to medically emphasise that children are susceptible to different external and internal risks than adults, to carefully take their ever-changing developmental physiology into account, and to weigh their (much) longer life expectancy in clinical decision-making. This is similar in other aspects of the medical profession, when it comes to legislation on their participation in research or the beginner’s basics on how to approach a minor patient in daily practise (or how not to). In all circumstances I found this statement to be very true, and it might be particularly accurate in the case of fracture treatment.
Fracture treatment took a giant leap after the introduction of plaster. Although plaster had been previously used for other purposes for thousands of years – including this thesis’ cover artwork - it was not until the early 19th century that it was introduced into the treatment of fractures in the Western world.16 First in liquid form, supposedly by Professor P. Hendriks in Groningen in 1814, later in dry form using ‘plaster of Paris’ in bandages by A. Mathysen in Haarlem in 1852.16,17 Although in modern times bandages are often made from synthetic material, the use of plaster of Paris never quite ran out of fashion. Since the 20th century, displaced fractures are generally treated by reduction followed by cast immobilisation, while non-displaced fractures are treated by means of cast immobilisation alone. However, in contrast to adults, achieving perfect anatomic alignment after sustainment of a fracture is not nearly always a necessity in growing children. Depending on their remaining growth potential, children’s bones have the unique capability to remodel.
ACCEPT, REDUCE OR OPERATE?
Unfortunately, when it comes to clinical decision-making regarding the management of displaced fractures of the forearm, hand or wrist in children, evidence-based recommendations are lacking. The limits of angular deformations allowing for a conservative, non-operative course are currently based on scarce (mostly retrospective) studies, case reports and expert opinions. Conversely, there is no high-level evidence warranting surgical treatment, nor clear-cut advice on which method of stabilisation is superior in which circumstance.18-22 So when to accept, reduce or operate (and how) remains largely unanswered. Inexplicably though, surgical intervention is clearly appearing as an increasingly favourable trend, while calls for randomised clinical trials keep being made.21,23-25 This trend is worrisome, as conducted studies advocate less invasive (conservative) rather than more invasive (operative) courses of treatment.24,26
1

- 12 -
Chapter 1
HOLY GRAIL
So why have well-designed randomised multi-centre trials with adequate power not yet been conducted? The answer is probably multifactorial. First, the logistics are a nightmare. Boys and girls with divergent growth potentials, at different ages, with different fractures and varying angulations, undergoing different treatments by a variety of physicians. Either the study population is too heterogeneous or the numbers are too low to ensure adequate statistical power. To make matters even more challenging, all participants have to be measured in narrow time frames to allow for adequate comparison, and the inflow fluctuates tremendously. Second, conducting such a study would raise several medical and ethical dilemmas. It is not feasible to first conduct such a study in adults, then later translate the study protocol for a minor population based on more substantiated expectancies regarding outcome, since adults’ bones have lost the capability to remodel. Furthermore, giving consent to participate in a study that allocates children to either conservative or operative treatment and all its possible consequences is an entirely different ball game. The same goes for their parents, who may well take issue with deferring to a randomized choice of treatment. In my personal experience, parents tend to regret doing something rather than doing nothing, and the cosmetic appearance of severely angulated fractures can be frightening. On the other hand, reduction and surgical intervention are likely to be high-impact events for both children and parents. Leaving such important considerations to a flip of a coin is difficult, and this is further complicated by the fact that blinding is not an option. Finally, more on topic for this thesis, there is neither consensus nor uniformity on what should be measured. Outcome measures, as well as how and when they are obtained, vary between studies, time in the consultation room is limited, and function is often eyeballed instead of measured. Yet with difficulty comes opportunity, so it is only natural to bring in a paediatric physiatrist to deal with these kinds of questions.
AIM OF THIS THESIS
The scope of this thesis focuses on functional outcome during the recovery of angulated fractures of the forearm and the hand in children and adolescents. The first aim of the thesis is to provide (inter- and intra-personal) reference values for children on one of the most important parameters of hand function: grip strength. Second aim of the thesis is to provide more insight into how commonly used long-term outcome measures as used in adult studies actually recover in non-reduced and reduced fractures in children. Final goal is to provide an easy and quickly obtainable, yet substantiated and standardised, set of outcome measures for future research.

- 13 -
General Introduction
OUTLINE OF THIS THESIS
Chapters 2 and 3 focus on delivering normative data for grip strength in children based on a large and heterogeneous study population. Chapter 2 provides reference values by age, gender and dominance, facilitating easy comparison with patient outcomes. These values can be used to evaluate recovery after fractures, as well as to monitor a broader range of other conditions over time. The association between grip strength and age, gender, weight and height is also examined. Chapter 3 elaborates on the intra-personal differences in grip strength between dominant and non-dominant hand, as earlier research in adults shows the dominant hand to be approximately 10% stronger than the non-dominant hand.27,28 In Chapter 3 this ‘10 percent rule’ is challenged for both left- and right-dominant boys and girls, shedding further light into the minority of left-dominant children. It additionally allows for a quick calculation of the expected grip strength of one (affected) hand, based on the measured grip strength of the other (unaffected) hand. Chapters 4, 5 and 6 focus on recovery after actual sustainment of fractures. Chapter 4 examines recovery after non-reduced forearm fractures, giving a first prospective impression of the progress of fracture remodelling and functional recovery (grip strength and mobility) during the first year post-trauma. Factors influencing remodelling (time post-injury, dominant side affected, type of fracture and involvement of solely the radius or both bones) and the relation between functional outcome and degree of fracture angulation are presented. Chapter 5 focuses specifically on recovery of strength (grip strength, key grip and three-jaw chuck grip) after sustainment of fractures of the forearm, wrist or hand treated by reduction. The extent of loss of strength compared to the unaffected hand and pattern of recovery of the affected hand are examined by different treatment modalities, namely closed reduction without internal fixation, closed reduction with internal fixation, and open reduction with internal fixation in the first six months after trauma. Lastly, it is ascertained which of the following factors are associated with an increase in the ratio between affected grip strength and expected (unaffected) strength: type of fracture, cast immobilisation, occurrence of complications, and degree of pain. Chapter 6 evaluates recovery after reduced forearm fractures. The aim of this study is to prospectively evaluate how a set of pre-defined post-traumatic symptoms (namely pain, swelling, discoloration, temperature asymmetry, hypertrichosis, allodynia and loss of sensory function) recover during the first six months after having sustained a paediatric forearm fracture, as well as follow how mobility and dexterity recover over time. Again, outcome measures are evaluated by type of treatment given, and factors of influence on recovery of either mobility or dexterity (treatment, gender, age, and the dominant hand being the affected hand) are examined. Lastly, Chapter 7 discusses the conclusions of the current thesis and provides suggestions for future research.
1

- 14 -
Chapter 1
REFERENCES
1. Lyons RA, Delahunty AM, Kraus D, et al. Children’s fractures: A population based study. Inj Prev. 1999;5(2):129-132.
2. Lyons RA, Sellstrom E, Delahunty AM, Loeb M, Varilo S. Incidence and cause of fractures in European districts. Arch Dis Child. 2000;82(6):452-455.
3. Rennie L, Court-Brown CM, Mok JY, Beattie TF. The epidemiology of fractures in children. Injury. 2007;38(8):913-922.
4. Landin LA. Epidemiology of children’s fractures. J Pediatr Orthop B. 1997;6(2):79-83.5. Mäyränpää M,K, Mäkitie O, Kallio PE. Decreasing incidence and changing pattern of
childhood fractures: A population-based study. J Bone Miner Res. 2010;25(12):2752-2759.6. Brudvik C, Hove LM. Childhood fractures in Bergen, Norway: Identifying high-risk groups
and activities. J Pediatr Orthop. 2003;23(5):629-634.7. Tiderius CJ, Landin L, Düppe H. Decreasing incidence of fractures in children: An
epidemiological analysis of 1,673 fractures in Malmö, Sweden, 1993-1994. Acta Orthop Scand. 1999;70(6):622-626.
8. Khosla S, Melton LJ,3rd, Dekutoski MB, Achenbach SJ, Oberg AL, Riggs BL. Incidence of childhood distal forearm fractures over 30 years: A population-based study. JAMA. 2003;290(11):1479-1485.
9. Cooper C, Dennison EM, Leufkens HG, Bishop N, van Staa TP. Epidemiology of childhood fractures in Britain: A study using the general practice research database. J Bone Miner Res. 2004;19(12):1976-1981.
10. Hedström EM, Svensson O, Bergström U, Michno P. Epidemiology of fractures in children and adolescents. Acta Orthop. 2010;81(1):148-153.
11. Clark EM. The epidemiology of fractures in otherwise healthy children. Curr Osteoporos Rep. 2014;12(3):272-278.
12. Sinikumpu JJ, Pokka T, Serlo W. The changing pattern of pediatric both-bone forearm shaft fractures among 86,000 children from 1997 to 2009. Eur J Pediatr Surg. 2013;23(4):289-296.
13. Naranje SM, Erali RA, Warner WC,Jr, Sawyer JR, Kelly DM. Epidemiology of pediatric fractures presenting to emergency departments in the United States. J Pediatr Orthop. 2016;36(4):e45-8.
14. Alrashedan BS, Jawadi AH, Alsayegh SO, et al. Patterns of paediatric forearm fractures at a level I trauma centre in KSA. J Taibah Univ Med Sci. 2018;13(4):327-331.
15. WHO. Children’s health and the environment. A global perspective. Geneva. 2005.16. Hernigou P. Plaster of Paris: The orthopaedic surgeon heritage. Int Orthop.
2016;40(8):1767-1779.17. Colditz JC. Plaster of Paris: The forgotten hand splinting material. J Hand Ther.
2002;15(2):144-157.18. Van der Sluijs JA, Bron JL. Malunion of the distal radius in children: Accurate prediction
of the expected remodeling. J Child Orthop. 2016;10(3):235-240.19. Ploegmakers JJ, Verheyen CC. Acceptance of angulation in the non-operative treatment
of paediatric forearm fractures. J Pediatr Orthop B. 2006;15(6):428-432.20. Abraham A, Kumar S, Chaudhry S, Ibrahim T. Surgical interventions for diaphyseal fractures
of the radius and ulna in children. Cochrane Database Syst Rev. 2011;(11):CD007907. doi(11):CD007907.
- 15 -
General Introduction
21. Madhuri V, Dutt V, Gahukamble AD, Tharyan P. Conservative interventions for treating diaphyseal fractures of the forearm bones in children. Cochrane Database Syst Rev. 2013;(4):CD008775. doi(4):CD008775.
22. Vopat ML, Kane PM, Christino MA, et al. Treatment of diaphyseal forearm fractures in children. Orthop Rev (Pavia). 2014;6(2):5325.
23. Cruz AI,Jr, Kleiner JE, DeFroda SF, Gil JA, Daniels AH, Eberson CP. Increasing rates of surgical treatment for paediatric diaphyseal forearm fractures: A national database study from 2000 to 2012. J Child Orthop. 2017;11(3):201-209.
24. Eismann EA, Little KJ, Kunkel ST, Cornwall R. Clinical research fails to support more aggressive management of pediatric upper extremity fractures. J Bone Joint Surg Am. 2013;95(15):1345-1350.
25. Sinikumpu JJ, Lautamo A, Pokka T, Serlo W. The increasing incidence of paediatric diaphyseal both-bone forearm fractures and their internal fixation during the last decade. Injury. 2012;43(3):362-366.
26. Roth KC, Denk K, Colaris JW, Jaarsma RL. Think twice before re-manipulating distal metaphyseal forearm fractures in children. Arch Orthop Trauma Surg. 2014;134(12):1699-1707.
27. Bechtol CO. Grip test; the use of a dynamometer with adjustable handle spacings. J Bone Joint Surg Am. 1954;36-A(4):820-832.
28. Petersen P, Petrick M, Connor H, Conklin D. Grip strength and hand dominance: Challenging the 10% rule. Am J Occup Ther. 1989;43(7):444-447.
1


2CHAPTER
Grip strength is strongly associated with height, weight and gender in childhood: a cross-sectional study of 2241 children
and adolescents providing reference values.
Joris J.W. Ploegmakers*Ann M. Hepping*Jan H.B. Geertzen
Sjoerd K. BulstraMartin Stevens
* Both authors contributed equally
Journal of Physiotherapy 2013 December; 59(4): 255-261

- 18 -
Chapter 2
ABSTRACT
Question: What are reference values for grip strength in children and adolescents based on a large and heterogeneous study population? What is the association of grip strength with age, gender, weight, and height in this population?
Design: Cross-sectional study.
Participants: Participants were recruited from schools in the northern provinces of the Netherlands. The study included healthy children and adolescents ranging in age 4–15 years. Outcome measures: All children had their height (cm) and weight (kg) measured and were allowed a total of four attempts using the Jamar hand dynamometer: twice with each hand. Grip strength scores (kg) were recorded for the dominant and non-dominant hands.
Results: The study population comprised 2241 children and adolescents. Reference values for both genders are provided according to age and dominance. Grip strength shows a linear and parallel progression for both genders until the age of 11 or 12, after which grip strength development shows an acceleration that is more prominent in boys.
Conclusion: There is a significant difference in grip strength with each ascending year of age in favor of the older group, as well as a trend for boys to be stronger than girls in all age groups between 4 and 15 years. Weight and especially height have a strong association with grip strength in children.
Key words: Grip strength, Children, Jamar hand dynamometer, Reference values, Physiotherapy

- 19 -
Grip strength: intra-personal reference values
INTRODUCTION
Grip strength is used extensively in the assessment of hand function. Because it is directly affected by the neural, muscular and skeletal systems, grip strength is used in the evaluation of patients with a large range of pathologies that impair the upper extremities, including rheumatoid arthritis, osteoarthritis, muscular dystrophy, tenosynovitis, stroke, and congenital malformations. Grip strength measurements also have an established role in determining treatment efficacy, such as in the evaluation of different wrist orthoses, the effect of hand exercises in rheumatoid arthritis, and recovery after trauma. Also, they are used as an outcome measure after many different surgical interventions. Grip strength measurements provide a well-established and objective score that is reflective of hand function and that is easily and quickly obtainable by a range of different health professionals.
Since comparison to normative data is important when making statements about specific patient groups or treatments, obtaining normative data for grip strength in adults has been the subject of many studies. In contrast, normative data for children is far less readily available. To identify studies on this topic we searched PubMed, MEDLINE and EMBASE using combinations of the search terms: children, adolescents, grip strength, dynamometer, Jamar hand dynamometer, JHD, normative data and reference values. Reference lists of relevant articles were then screened to identify additional articles that might not have shown up in the search. Although we found several studies focusing specifically on grip strength in children, most of them had not assessed height and weight as factors of influcence.1-5 This is remarkable in the case of growing children, especially when weight and height are known to correlate with strength in children.6-8 Moreover, although some of these studies included a large number of children in total (with exception of Newman at al 1984, varying between 81 and 736), the number of children in each age group and/or the range of age groups is often limited and relatively small for establishing reference values. Also, a variety of methods and instruments was used. For example, some studies did not differentiate between scores of the dominant and non-dominant hand, used a device that is no longer used in clinical practice, or scored the maximum instead of the mean of attempts. Therefore, it can be concluded that there is a need for a study that assesses the development of grip strength in children, based on large groups according to age and gender and performed according to current standardised methods regarding measurement of grip strength.
The primary aim of this study was to provide reference values for grip strength in children and to present these data graphically to allow easy comparison with patient outcomes by a range of clinicians in daily practice. Therefore the research questions were:
2

- 20 -
Chapter 2
1. What are the reference values for grip strength in children aged 4–15 years according to age, gender and dominance based on a large, heterogeneous study population?
2. What is the association of gender, height, and weight with grip strength in children?
METHOD
DesignThis cross-sectional study measured grip strength in a cohort of healthy children and adolescents. The data were used to generate normative values for grip strength. Participants Children and adolescents ranging in age from 4 to 15 years were included. Participants were recruited by approaching schools in the four northern provinces of The Netherlands. All children of participating school classes were invited to take part. Exclusion criteria were: pain or restriction of movement of a hand or arm, neuromuscular disease, generalised bone disease, aneuploidy, any condition that severely interfered with normal growth or required hormonal supplementation, and children who could not be instructed in how to use the dynamometer. All included subjects were assigned to a group based on their calendar age at the time of the assessment, thereby creating nine subgroups in total. The study aimed to include at least 200 children in each age group, with a near to equal representation of boys and girls.
Outcome measuresEach measurement session started with a short lecture by the researchers to introduce themselves to the school class and to explain the procedures and the purpose of the study. A demonstration of the use of the dynamometer was given, using the teacher as an example. Individually, dominance was determined by asking which hand was used to write or, in case of young children, used to perform activities such as cutting or painting. Children aged 4 and 5 years, in whom hand dominance is not yet fully established, and any older children who displayed uncertainty regarding hand dominance, were asked to draw a circle. To avoid suggestion by the researcher, these participants had to pick up the pencil from the table themselves. The hand used to draw the shape was then scored as the dominant hand. The height (in cm) and weight (in kg) of each participating child were then measured. Grip strength was measured using the Jamar® hydraulic hand dynamometer. A total of six calibrated dynamometers were at the researchers’ disposal. The devices were replaced twice, at subsequent time intervals, with two used devices exchanged for two non-used devices after approximately one-third, and again after two-thirds of the total number of children we aimed to recruit had been assessed. The following standardised testing position for measuring grip strength was used, as advocated by the American Society of Hand Therapists (ASHT): the participant is seated with shoulders adducted and neutrally rotated, elbow flexed at 90 degrees, wrist between 0 and 30 degs extension, and between 0 and 15 degs ulnar deviation.9,10
- 21 -
Grip strength: intra-personal reference values
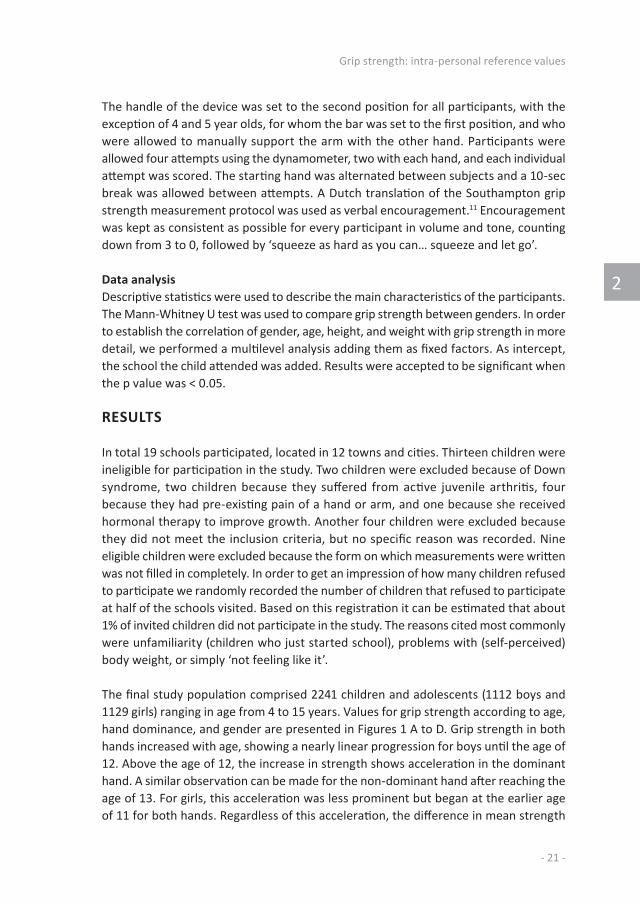
The handle of the device was set to the second position for all participants, with the exception of 4 and 5 year olds, for whom the bar was set to the first position, and who were allowed to manually support the arm with the other hand. Participants were allowed four attempts using the dynamometer, two with each hand, and each individual attempt was scored. The starting hand was alternated between subjects and a 10-sec break was allowed between attempts. A Dutch translation of the Southampton grip strength measurement protocol was used as verbal encouragement.11 Encouragement was kept as consistent as possible for every participant in volume and tone, counting down from 3 to 0, followed by ‘squeeze as hard as you can… squeeze and let go’.
Data analysisDescriptive statistics were used to describe the main characteristics of the participants. The Mann-Whitney U test was used to compare grip strength between genders. In order to establish the correlation of gender, age, height, and weight with grip strength in more detail, we performed a multilevel analysis adding them as fixed factors. As intercept, the school the child attended was added. Results were accepted to be significant when the p value was < 0.05.
RESULTS
In total 19 schools participated, located in 12 towns and cities. Thirteen children were ineligible for participation in the study. Two children were excluded because of Down syndrome, two children because they suffered from active juvenile arthritis, four because they had pre-existing pain of a hand or arm, and one because she received hormonal therapy to improve growth. Another four children were excluded because they did not meet the inclusion criteria, but no specific reason was recorded. Nine eligible children were excluded because the form on which measurements were written was not filled in completely. In order to get an impression of how many children refused to participate we randomly recorded the number of children that refused to participate at half of the schools visited. Based on this registration it can be estimated that about 1% of invited children did not participate in the study. The reasons cited most commonly were unfamiliarity (children who just started school), problems with (self-perceived) body weight, or simply ‘not feeling like it’.
The final study population comprised 2241 children and adolescents (1112 boys and 1129 girls) ranging in age from 4 to 15 years. Values for grip strength according to age, hand dominance, and gender are presented in Figures 1 A to D. Grip strength in both hands increased with age, showing a nearly linear progression for boys until the age of 12. Above the age of 12, the increase in strength shows acceleration in the dominant hand. A similar observation can be made for the non-dominant hand after reaching the age of 13. For girls, this acceleration was less prominent but began at the earlier age of 11 for both hands. Regardless of this acceleration, the difference in mean strength
2

- 22 -
Chapter 2
between all age groups was significant for both hands and in both genders in favor of the older group (p < 0.01), with exception for the values of the non-dominant hand between girls aged 13 and 14 where p was 0.02.
Figure 1 A-B: Reference values for grip strength for boys according to dominance, and age. Scores are plotted as percentiles 3, 10, 50, 90, and 97. The upper and lower limits indicate the borders of reference values for strength at the corresponding age. The darker shaded areas represent the centralised 80% of scores.
Figure 1 C-D: Reference values for grip strength for girls according to dominance, and age. Scores are plotted as percentiles 3, 10, 50, 90, and 97. The upper and lower limits indicate the borders of reference values for strength at the corresponding age. The darker shaded areas represent the centralised 80% of scores.

- 23 -
Grip strength: intra-personal reference values
A more extensive overview of all the results, including additional details regarding the study population, is presented in Table 1. Boys were significantly stronger than girls with the dominant hand at ages 4 (p = 0.02), 5 (p = 0.04), 6 (p = 0.003), 8 (p = 0.001), 9 (p = 0.001), and 14 (p < 0.001). For the non-dominant hand this was true at ages 4 (p = 0.03), 6 (p = 0.02), 8 (p < 0.001), 9 (p < 0.001), 11 (p = 0.01), and 14 ( p < 0.001). With the exception of the dominant hand at age 7, where both genders scored equal, there was a trend for boys to score higher than girls with both their dominant and non-dominant hand in all age groups. The percentage difference in grip strength in favor of boys fluctuated, from 0–14% at ages 4 to 13, rising to 26% at age 14.
In order to establish the association of gender, age, height, and weight with grip strength in more detail, we performed a multilevel analysis adding them as fixed factors. Adding the school the child attended as an intercept resulted in a better fit of the model for both the dominant and the nondominant hand data. For both the dominant and the nondominant hand, the variables age, height, weight, and gender had a significant association with grip strength (p = < 0.001), resulting in the following predictive equations:1. Dominant hand = –20.59 (+ 1.09 if male) + 0.85 * age + 0.17 * height (cm) + 0.14
* weight (kg)2. Non-dominant hand = –19.52 (+ 1.17 if male) + 0.79 * age + 0.16 * height (cm) +
0.12 * weight (kg)A more extensive overview of these results is presented in Table 2.
2

- 24 -
Chapter 2Ta
ble
1: O
verv
iew
of r
esul
ts a
nd s
tudy
pop
ulati
onSh
owin
g nu
mbe
r of p
artic
ipan
ts p
er a
ge g
roup
, sco
res o
f grip
stre
ngth
acc
ordi
ng to
dom
inan
t and
non
-dom
inan
t han
d, h
eigh
t and
wei
ght a
ccor
ding
to
age
and
gend
er. D
ata
is pr
esen
ted
as: M
ean
(SD)
M
inim
um-M
axim
um
Boys
Girl
s
Age
NDo
min
ant (
kg)
Non
-dom
inan
t (kg
)He
ight
(cm
)W
eigh
t (kg
)N
Dom
inan
t (kg
)N
on-d
omin
ant (
kg)
Heig
ht (c
m)
Wei
ght (
kg)
412
45.
7 (2
)1-
125.
3 (2
)2-
1011
1 (5
)10
0-12
619
(3)
15-2
610
95.
1 (2
)1-
114.
7 (2
)2-
1011
1 (5
)10
0-12
619
(3)
13-2
95
102
7.5
(3)
2-14
6.8
(3)
3-14
117
(6)
103-
138
22 (3
)15
-30
105
6.7
(2)
2-15
6.0
(2)
1-12
118
(6)
102-
131
22 (3
)15
-32
612
310
.2 (3
)5-
189.
4 (3
)4-
1712
5 (5
)11
1-13
925
(4)
17-4
410
89.
0 (3
)3-
188.
3 (3
)2-
1612
4 (6
)10
0-13
725
(4)
16-3
97
104
13.0
(4)
7-21
12.0
(3)
5-19
131
(6)
116-
145
28 (5
)20
-54
9812
.9 (3
)7-
2111
.9 (3
)5-
1813
1 (6
)11
3-14
129
(5)
17-4
08
113
15.9
(4)
8-25
14.6
(3)
8-23
139
(6)
124-
155
32 (6
)23
-55
118
14.4
(3)
8-22
13.1
(3)
7-21
136
(6)
122-
151
31 (6
)20
-49
911
618
.2 (4
)10
-29
16.8
(4)
8-33
142
(6)
126-
162
36 (7
)25
-60
119
16.7
(3)
9-26
15.1
(3)
7-23
141
(5)
126-
154
35 (7
)24
-53
1010
919
.6 (2
)12
-29
18.1
(3)
9-28
147
(7)
129-
161
38 (7
)26
-65
103
19.1
(4)
9-29
17.2
(4)
8-29
149
(7)
132-
167
41 (8
)25
-63
1111
322
.0 (5
)9-
3520
.6 (4
)8-
3315
4 (8
)13
4-17
243
(10)
27-7
411
320
.6 (4
)10
-35
19.1
(4)
11-3
015
4 (8
)13
5-18
144
(9)
28-7
912
9624
.7 (5
)13
-36
22.9
(5)
13-3
515
9 (9
)14
0-18
048
(10)
30-7
310
624
.2 (5
)15
-39
22.3
(4)
13-3
316
0 (6
)14
4-17
848
(11)
32-1
1013
6628
.2 (6
)17
-45
25.8
(6)
17-4
216
6 (9
)15
0-18
952
(10)
39-8
597
26.4
(5)
14-3
924
.5 (4
)17
-36
163
(7)
138-
176
49 (8
)33
-89
1446
36.0
(7)
24-5
133
.5 (7
)22
-51
175
(8)
155-
193
60 (1
1)38
-89
5329
.1 (5
)16
-43
26.6
(5)
15-3
616
9 (6
)15
7-18
355
(10)
42-1
03

- 25 -
Grip strength: intra-personal reference values
Table 2: Outcome multilevel analysis
Dominant hand 95% CI
Parameter Est. SE DF t Sig Lower UpperIntercept -20.59 1.16 1707.65 -17.80 0.00 -22.85 -18.32Male 1.09 0.14 2224.61 8.00 0.00 0.83 1.36Height 0.17 0.13 2231.36 13.72 0.00 0.15 0.20Weight 0.14 0.12 2231.41 11.78 0.00 0.12 0.16Age 0.85 0.07 2172.38 12.05 0.00 0.71 0.99Covariance parameters Est. SE Wald Z Sig Lower UpperResidual 10.23 0.31 33.30 0.00 9.64 10.85Intercept school 1.11 0.42 2.64 0.01 0.53 2.33Non-dominant hand 95% CI
Parameter Est. SE DF t Sig Lower UpperIntercept -19.52 1.15 1832.86 -16.92 0.00 -21.78 -17.25Male 1.17 0.14 2226.23 8.58 0.00 0.91 1.44Height 0.16 0.13 2233.39 12.90 0.00 0.14 0.19Weight 0.12 0.12 2233.49 10.47 0.00 0.10 0.15Age 0.79 0.07 2130.14 11.21 0.00 0.65 0.93Covariance parameters Est. SE Wald Z Sig Lower UpperResidual 10.29 0.31 33.30 0.00 9.70 10.91Intercept school 0.87 0.34 2.60 0.01 0.41 1.86
DISCUSSION
To our knowledge, this is the largest study to generate normative values of grip strength in children. Although other studies have provided normative data, the subgroups according to age and gender in most studies were small for establishing reference values.1,4,8,12 Samples for normative data should be ‘large, random, and representative of the population’s heterogeneity’.13,14 This study was designed to meet these criteria not only by including a large number of children, but also by ensuring that each subgroup when broken down according to age and gender included a sufficient number of children. The results of this study show a significant difference in strength with each ascending year of age in favor of the older group, as well as a trend for boys to be stronger than girls in all age groups between 4 and 15 years. In addition, weight and height were strongly associated with grip strength in children.
The described curve of grip strength in boys – higher yet parallel to those of girls until the age of 12 – is consistent with other studies, as is the acceleration of grip strength specifically for boys after the age of 12.1,3,5,8 Considering the strong correlation of height with strength, this is probably a result of the growth spurt. This would also explain why the acceleration described in girls sets in earlier, but is less prominent. At the age
2

- 26 -
Chapter 2
of 12 the curves of height and weight according to gender also show a separation in favor of boys. In contrast, the height curve of females is showing a flattening slope from that age onwards, patterns consistent with those of the national growth study.15 Therefore, the authors predict that the grip strength of girls above the age covered in this study will not increase much further since their average increase in growth after the age of 14 is only 5 cm, and their estimated gain in weight around 5 kg until the age of 21.15 This theory is supported by the data of Newman et al (1984), which showed no further increase in strength of girls after the age of 13. This is in agreement with data retrieved from a literature review regarding grip strength in adults, which showed that norms for females aged 20 in six different studies varied from 28.3 to 35.6 kilograms for the dominant hand, and from 24.2 to 32.7 kilograms for the non-dominant hand.13 For females aged 40 results varied from 28.3 to 35.3 kilograms for the dominant hand, and from 21.9 to 33.2 kilograms for the non-dominant hand. The 14 year old girls in our study scored 29.1 and 26.6 kilograms respectively. In both cases these scores fall within these ranges for adults. For boys, no reliable prediction of grip strength above the age of 14 can be made, as on average they are expected to grow around 16 centimetres taller and gain 14 kilograms before reaching the age of 21.15
Comparing grip strength results with former studies in more detail proved to be difficult, due to differences in methods between studies. For example, the study by Newman et al (1984) contained relatively large subgroups, but it was performed with a different device that is no longer commonly used. The study of Ager et al (1984) reported scores according to the right or left hand, and not according to dominance. Where comparison was possible, the results of the current study where relatively high: 4–12% higher than those of De Smet et al (2001) who allowed only one attempt with each hand, and 8–14% higher than those of Molenaar et al (2010) where three attempts were allowed. The study by Butterfield et al (2009) reported 4% lower to 6% higher scores. Besides differences in methods, the higher results may be a consequence of the ongoing trend in the Netherlands, ie, height is still increasing over the decades.16 This is supported by data from Statistics Netherlands.17 Another factor that must be taken into consideration is that the Dutch population, and in particular those in the three most northern provinces, is known to be relatively tall.17
Besides including a large number of children, a relatively large geographical area was covered and both rural and urban schools were included to ensure a broad diversity and heterogeneity of participants. A vast number of different instruments are available to measure grip strength. The Jamar hand dynamometer was selected because most normative studies have used this device and therefore it allows data to be compared with other (and future) studies.11,13 Moreover, besides having a high test-retest and inter-investigator reliability, it also has high reproducibility when used by children.11,18-20 To ensure all children were measured in the same manner, and again to follow standardised methods, participants were measured according to the ASHT protocol.11,13 However,

- 27 -
Grip strength: intra-personal reference values
we implemented three exceptions. First, for the 4 and 5 year olds, the handle of the device was set to the first setting, which is considered to be less accurate than the second.21-24 These findings result from studies that focus on adults, and young children obviously have smaller hands. Therefore the distance to the handle of the device (3.8 cm) is relatively large compared to their average hand size.2 In practice, they could not reach the second setting adequately, and the first setting has also been used for adults with small hands.25 Second, it is preferred to use the mean of three attempts.20,26 However, other studies showed that scoring fewer attempts, taking fewer attempts into consideration, or even using the maximum attempt, does not lead to significant differences compared with the mean of three attempts.27-29 Additionally, although fatigue does not seem to influence grip strength measurement in adults, we could not find any studies regarding this matter in children. Considering these factors we chose to allow two attempts with each hand. Finally, the ASHT-protocol does not provide details regarding encouragement. Verbal encouragement was given to stimulate children to attempt their very best. The content of encouragement was the same for all children, and the type and volume was kept as consistent as possible. Unfortunately, the goal of including 200 children for each age group was not achieved in the two oldest groups, owing mainly to the fact that participation of high schools was difficult to arrange. Also, we did not systematically record 1exactly how many children refused to participate. However, the available data indicate that only a marginal proportion of children refused, which makes the data highly representative. Other limitations are a direct result of the exclusion criteria, meaning results can only be applied to the healthy population and cannot be extrapolated to other age groups.
In summary, this study presents reference values for grip strength in children. These reference values for both the dominant and the non-dominant hand are provided graphically according to gender and age, to facilitate comparison to patients’ values. These graphics also allow monitoring of progression over time. In addition the results of this study show that gender, age, height, and weight are strongly associated with the development of grip strength in children. Finally, detailed equations are provided to give a more precise prediction regarding a specific patient when height and weight are known.
FootnotesJamar® dynamometer, Lafayette Instrument Company, Lafayette, USA.
EthicsThe study was conducted in accordance with the regulations of the METC Institutional Review Board of the University Medical Center Groningen. Children were included in the study after permission of parents had been given. However, it was also ensured that each child knew the examination was not mandatory, and children were not included if they did not want to participate.
2

- 28 -
Chapter 2
SupportNone.
Competing interestsThere are no competing interests.
ACKNOWLEGDEMENTS
The authors thank all the children, their parents, and the schools for their contribution to this study as well as the students who aided the researchers with measurements. The authors also thank PU Dijkstra, A Shepherd, RE Stewart, and WFA Klijn for their assistance.

- 29 -
Grip strength: intra-personal reference values
REFERENCES
1. Ager CL, Olivett BL, Johnson CL. Grasp and pinch strength in children 5 to 12 years old. Am J Occup Ther. 1984;38(2):107-113.
2. Bear-Lehman J, Kafko M, Mah L, Mosquera L, Reilly B. An exploratory look at hand strength and hand size among preschoolers. J Hand Ther. 2002;15(4):340-346.
3. Butterfield SA, Lehnhard RA, Loovis EM, Coladarci T, Saucier D. Grip strength performances by 5- to 19-year-olds. Percept Mot Skills. 2009;109(2):362-370.
4. De Smet L, Vercammen A. Grip strength in children. J Pediatr Orthop B. 2001;10(4):352-354.5. Mathiowetz V, Wiemer DM, Federman SM. Grip and pinch strength: Norms for 6- to
19-year-olds. Am J Occup Ther. 1986;40(10):705-711.6. Rauch F, Neu CM, Wassmer G, et al. Muscle analysis by measurement of maximal
isometric grip force: New reference data and clinical applications in pediatrics. Pediatr Res. 2002;51(4):505-510.
7. Häger-Ross C, Rösblad B. Norms for grip strength in children aged 4-16 years. Acta Paediatr. 2002;91(6):617-625.
8. Newman DG, Pearn J, Barnes A, Young CM, Kehoe M, Newman J. Norms for hand grip strength. Arch Dis Child. 1984;59(5):453-459.
9. Balogun JA, Akomolafe CT, Amusa LO. Grip strength: Effects of testing posture and elbow position. Arch Phys Med Rehabil. 1991;72(5):280-283.
10. Fess E. Grip strength. American Society of Hand Therapists: Chicago Clinical Assessment Recommendations (2nd ed ). 1992.
11. Roberts HC, Denison HJ, Martin HJ, et al. A review of the measurement of grip strength in clinical and epidemiological studies: Towards a standardised approach. Age Ageing. 2011;40(4):423-429.
12. Molenaar HM, Selles RW, Zuidam JM, Willemsen SP, Stam HJ, Hovius SE. Growth diagrams for grip strength in children. Clin Orthop Relat Res. 2010;468(1):217-223.
13. Innes E. Handgrip strength testing: A review of the literature. Australian Occupational Therapy Journal. 1999;46:120-140.
14. Portney LG, Watkins MP. Foundations of clinical research: Applications to practice. Norwalk: Pearson/prentice hall. 1993.
15. TNO/LUMC. Groei-onderzoek 1997, Bohn Stafleu van Loghum 9000025389. Dutch organization for applied scientific research / Leiden University Medical Center, growth study 1997.
16. Fredriks AM, van Buuren S, Burgmeijer RJ, et al. Continuing positive secular growth change in the Netherlands 1955-1997. Pediatr Res. 2000;47(3):316-323.
17. Frenken F. Vertraging in lengtegroei en gewichtstoename. CBS, bevolkingstrends, 4e kwartaal 2007 [deceleration in height growth and weight gain. statistics Netherlands, population trends, 4th quarter 2007]. 2007:92-98.
18. Lindstrom-Hazel D, Kratt A, Bix L. Interrater reliability of students using hand and pinch dynamometers. Am J Occup Ther. 2009;63(2):193-197.
19. Van den Beld WA, van der Sanden GA, Sengers RC, Verbeek AL, Gabreëls FJ. Validity and reproducibility of the jamar dynamometer in children aged 4-11 years. Disabil Rehabil. 2006;28(21):1303-1309.
20. Mathiowetz V, Weber K, Volland G, Kashman N. Reliability and validity of grip and pinch strength evaluations. J Hand Surg Am. 1984;9(2):222-226.
2

- 30 -
Chapter 2
21. Bechtol CO. Grip test; the use of a dynamometer with adjustable handle spacings. J Bone Joint Surg Am. 1954;36-A(4):820-832.
22. Boadella JM, Kuijer PP, Sluiter JK, Frings-Dresen MH. Effect of self-selected handgrip position on maximal handgrip strength. Arch Phys Med Rehabil. 2005;86(2):328-331.
23. Firrell JC, Crain GM. Which setting of the dynamometer provides maximal grip strength? J Hand Surg Am. 1996;21(3):397-401.
24. Hamilton A, Balnave R, Adams R. Grip strength testing reliability. J Hand Ther. 1994;7(3):163-170.
25. Ruiz-Ruiz J, Mesa JL, Gutiérrez A, Castillo MJ. Hand size influences optimal grip span in women but not in men. J Hand Surg Am. 2002;27(5):897-901.
26. MacDermid JC, Kramer JF, Woodbury MG, McFarlane RM, Roth JH. Interrater reliability of pinch and grip strength measurements in patients with cumulative trauma disorders. J Hand Ther. 1994;7(1):10-14.
27. Crosby CA, Wehbé MA, Mawr B. Hand strength: Normative values. J Hand Surg Am. 1994;19(4):665-670.
28. Coldham F, Lewis J, Lee H. The reliability of one vs. three grip trials in symptomatic and asymptomatic subjects. J Hand Ther. 2006;19(3):318-26; quiz 327.
29. Haidar SG, Kumar D, Bassi RS, Deshmukh SC. Average versus maximum grip strength: Which is more consistent? J Hand Surg Br. 2004;29(1):82-84.

- 31 -
Grip strength: intra-personal reference values
2


3CHAPTER
The influence of hand preference on grip strength in children and
adolescents; a cross-sectional study of 2284 children and adolescents.
Ann M. HeppingJoris J.W. Ploegmakers
Jan H.B. GeertzenSjoerd K. Bulstra
Martin Stevens
PLOS ONE 2015 November 10(11):e0143476

- 34 -
Chapter 3
ABSTRACT
Introduction: In adults the preferred hand is often considered to be around 10% stronger than the non-preferred hand. Whether the same is true for children and adolescents remains unclear. The objective of this study is therefore to determine whether there is a difference in grip strength between the preferred and non-preferred hand in developing children, to establish whether this difference is similar for children of a different gender or hand preference, and whether there is a difference in grip strength of the preferred hand of left-preferent (LP) and right-preferent (RP) children.
Design: Cross-sectional study.
Participants: Participants were recruited from schools in the northern provinces of the Netherlands. The study included healthy children and adolescents in the age range of 4–17 years.
Outcome measures: Each child was allowed a total of four attempts using the JAMAR hand dynamometer, two attempts with each hand. All individual attempts were scored. Hand preference was determined by asking which hand was used to write, or in the case of 4- and 5-year-olds, which hand was used to draw a shape.
Results: The study population comprised 2284 children and adolescents. RP boys and girls scored significantly higher with their preferred hand, the difference amounting to 9.5 and 10.1% respectively. LP girls scored significantly higher with their preferred hand, but this difference was only 3.0%. For LP boys no significant difference was found in favor of either hand. LP children score higher with the non-preferred hand and tie scores on both hands more often than RP children.
Conclusion: The 10% rule of hand preference is applicable to RP children ranging in age between 4 and 17 years, but not to LP children. In contrast to LP boys, LP girls are generally significantly stronger with their preferred hand.

- 35 -
Grip strength: inter-personal reference values
INTRODUCTION
Grip strength measurements have a profound role as a parameter that is reflective of hand function. For this reason, they are used in the evaluation of patients with a large variety of pathologies. When assessing actual degree of impairment, for example in terms of recovery after trauma or surgery, patient values are often compared with reference values. Unfortunately, reliable reference values from a representative study population are not always available, and moreover they do not take into account individual personal characteristics that determine strength. Comparison of the values of the affected and the unaffected hand of the same patient thus provides an alternative method to estimate level of impairment. As such, it is recommended by the American Association of Hand Therapists and the American Medical Association.1-3 However, when making comparisons with the unaffected side, the question arises as to whether hand preference is a factor that must be taken into account.
In 1954 a study performed by Bechtol concluded that the dominant hand was, on average, 5–10% stronger than the non-dominant hand.4 Since then, many studies have examined more thoroughly the influence of hand dominance, or preference, on strength in adults, thereby challenging this statement – often referred to as the 10% rule.5 Results from the various studies on this topic are far from conclusive though.6,7 While some studies found that hand dominance had no important influence on grip strength, others identified significant, albeit more subtle, differences, and yet other studies concurred with the 10% rule but only for specific groups.5,8-15
Such inconsistencies are probably the result of the varying methods and inclusion criteria between studies, as well as a relatively small number of left-preferent individuals tested. When it comes to the grip strength of children, much less research has been performed in general. A search of the literature was unable to identify any studies that examined if or how the influence of hand preference on grip strength develops from childhood to adolescence, or whether there are any differences in this influence between boys and girls or between children with a different hand preference. We therefore believe that there is no clear answer as to how hand preference affects grip strength in children and adolescents.
This study aims to establish the influence of hand preference on grip strength in more detail by challenging the 10% rule in both left-preferent (LP) and right-preferent (RP) boys and girls aged 4–17, as well as to compare the absolute scores between children with a different hand preference. The research questions thus were:1. Is there a difference between the grip strength of the preferred hand and the
non-preferred hand in children?2. If so, is this difference similar for children with another hand preference?3. Is there a difference in grip strength between the preferred hands of LP versus
RP children?
3
- 36 -
Chapter 3
METHOD
Study design and participantsThis study is part of a large cross-sectional study determining reference values of grip strength of children in the Netherlands.16 The Medical Ethical Board of University Medical Center Groningen specifically approved the consent procedure of this study (M13.142928). Healthy children age 4–17 were included by approaching schools in the four northern provinces of the Netherlands. Exclusion criteria comprised pain or restriction of the arm or hand at the time of examination, conditions interfering with normal growth, neuromuscular and generalized bone diseases, and inability to use the dynamometer as instructed. Parents of the children were informed about the study by means of a letter. If parents had objections regarding their child’s participation, the child was not enrolled. Permission of the children was obtained verbally. A list of all children was provided by the teacher of the class. On this list it was registered which parents had objections regarding participation and in addition which child agreed and which child refused to participate. We made sure that the child knew the examination was not mandatory, and children were not included if they didn’t want to participate themselves. Data were processed anonymous. The protocol of the study was approved by the Medical Ethical Board of University Medical Center Groningen (M13.142928).
Outcome measuresResearchers gave a short introduction at the start of each measurement session to explain the purpose and procedures of the study. Use of the dynamometer was demonstrated by letting the teacher perform a grip strength measurement. All measurements took place in a private room at the child’s school. Due to the large number of children that needed to be included, medical students aided performing the measurements, under direct supervision of one of the two researchers (AMH, JJWP). Children were allotted to the respective age groups based on their calendar age at the time of examination. For example, a child was considered to be a 4-year-old from the day of its 4th birthday up to the day before its 5th birthday. To establish hand preference, children were asked what hand they use to write, or in case of 4- and 5-year-olds which hand was used to perform other activities such as cutting or drawing. As an additional confirmation, 4- and 5-year-olds as well as older children who displayed uncertainty about the answer were asked to draw a shape. To this end, they were asked to pick up a pen from the table themselves, to avoid possible bias from the researcher. The hand that was used to draw was then scored to be the preferred one.
MeasurementsTo measure grip strength the Jamar® hydraulic hand dynamometer (JHD) (Lafayette Instrument Company, Lafayette, IN, USA) was used. Subjects were assessed according to the standardized testing position as advised by the American Society of Hand Therapists (ASTH): seated subject, shoulders adducted and neutrally rotated, elbow flexed at 90°,

- 37 -
Grip strength: inter-personal reference values
wrist between 0 and 30° extension and between 0 and 15° ulnar variation.1,17 For all 4- and 5-year-olds the handle of the device was set to the first position and they were allowed to manually support the tested arm with the contralateral hand. For all other subjects the handlebar was set to the second position and supporting the tested arm was prohibited. All subjects were allowed two attempts with each hand with a 10-second break between measurements, and the starting hand was alternated between subjects. Verbal encouragement was given and it was attempted to keep tone and volume as consistent as possible. A Dutch translation of the Southampton Grip Strength Measurement Protocol was used: counting down from 3 to 0, followed by “squeeze as hard as you can … squeeze and let go”.18
Data analysisDescriptive statistics for the main characteristics of the study population were tabulated. To answer all research questions, several two-level multilevel analyses were performed with the mean grip score of the left and right hand as dependent variable, nested under the children as second level. The first model is the empty model to estimate intraclass correlation. Age, gender and hand preference as characteristics of the children and the hand measured (left or right) were included as fixed factors. From the empty model three models were used to answer the three research questions in the total group, thereafter adjusted for gender and subsequently for gender and age.19,20 Results were regarded as significant if the associated p-value was < 0.05. Statistical procedures were carried out using SPSS 22.0 for Windows (IBM SPSS Inc.).
RESULTS
The total study population comprised 2284 children, of whom 1980 were (RP) and 304 (LP). Overall, 15.9% of boys preferred their left hand versus 10.7% of girls. A detailed overview of the study population and the results of grip strength measurements can be found in table 1. Unfortunately there was a decline in the number of participants aged 14 and older included in the study, so for statistical purposes these children were analysed as a single subgroup (age group 14+) to provide a larger sample size.
Difference between grip strength of the preferred and non-preferred handThe grip strength of the preferred hand was first compared to that of the non-preferred hand. This showed that the preferred hand was significantly stronger (p<0.001) for the study population as a whole. Further analysis showed that the same holds true for boys and girls tested separately (p<0.001) as well as for all the different age groups. Results can be found in table 2 (section A).
3

- 38 -
Chapter 3Ta
ble
1: O
verv
iew
of r
esul
ts: m
ean
grip
str
engt
h (k
g) o
f bot
h ha
nds a
ccor
ding
to a
ge, g
ende
r and
han
d pr
efer
ence
Boys
Girl
s
Righ
t pre
fere
ntLe
ft p
refe
rent
Righ
t pre
fere
ntLe
ft p
refe
rent
Age
(yea
rs)
nLe
ft h
and
Righ
t han
dn
Left
han
dRi
ght h
and
nLe
ft h
and
Righ
t han
dn
Left
han
dRi
ght h
and
491
5.1
(2.1
)5.
8 (2
.2)
335.
3 (2
.3)
5.6
(2.4
)96
4.5
(2.0
)4.
9 (2
.1)
136.
2 (2
.1)
6.0
(1.8
)1.
5–10
.02.
0–11
.51.
0–10
.02.
0–10
.01.
5–9.
51.
0–11
.02.
5–9.
52.
5–8.
05
846.
8 (2
.6)
7.7
(2.5
)18
6.5
(2.9
)6.
8 (2
.6)
956.
0 (2
.4)
6.8
(2.3
)10
6.3
(3.1
)6.
0 (2
.9)
2.5–
12.5
3.0–
13.0
2.0–
14.0
3.0–
13.5
1.0–
12.0
2.0–
14.5
2.0–
11.5
1.5–
10.5
610
29.
3 (2
.7)
10.1
(2.6
)21
10.5
(2.5
)10
.1 (2
.8)
938.
4 (3
.1)
9.2
(2.8
)15
8.1
(2.3
)7.
9 (3
.3)
4.0–
16.5
5.0–
17.5
7.5–
16.5
6.5–
162.
0–15
.53.
0–18
.05.
0–13
.02.
5–14
.07
8911
.8 (3
.4)
13.1
(3.3
)15
12.5
(3.2
)12
.7 (3
.4)
9111
.8 (2
.9)
12.9
(2.9
)7
13.4
(3.8
)12
.9 (2
.8)
4.5
–19.
07.
5–21
.06.
5–16
.58.
0–17
.55.
0–17
.56.
5–20
.59.
0–18
.010
.0–1
6.0
810
014
.7 (3
.2)
16.1
(3.4
)13
14.4
(4.4
)14
.3 (3
.8)
107
13.0
(2.8
)14
.4 (2
.9)
1114
.2 (2
.5)
14.0
(1.5
)8.
0–23
.08.
0–25
.08.
0–22
.08.
0–22
.06.
5–20
.58.
0–22
.010
.5–1
8.0
12.0
–16.
09
103
16.7
(3.8
)18
.3 (3
.7)
1317
.2 (2
.9)
17.9
(4.1
)10
515
.1 (3
.0)
16.8
(3.2
)14
15.6
(3.2
)14
.8 (3
.3)
7.5–
32.5
10.0
–29.
012
.5–2
3.0
12.0
–25.
07.
0–23
.09.
0–25
.510
.5–2
1.0
10.0
–21.
010
8817
.7 (3
.2)
19.5
(3.6
)21
19.7
(2.8
)19
.6 (3
.4)
8816
.9 (3
.9)
19.1
(3.6
)15
19.1
(3.7
)18
.6 (3
.7)
9.0–
27.5
11.5
–28.
513
.5–2
5.0
12.0
–24.
57.
5–28
.59.
0–29
.013
.0–2
6.5
10.5
–25.
511
9620
.7 (4
.5)
22.5
(4.9
)17
19.6
(4.3
)19
.9 (4
.3)
9818
.8 (3
.9)
20.8
(4.1
)9
21.6
(3.9
)20
.9 (3
.8)
7.5–
33.0
9.0–
34.5
11.5
–28.
011
.0–2
8.0
11.0
–30.
010
.0–3
4.5
15.5
–30.
016
.5–3
0.0
1280
23.0
(4.5
)25
.1 (4
.8)
1623
.0 (4
.4)
22.7
(4.8
)97
22.3
(4.4
)24
.4 (4
.8)
921
.7 (3
.0)
22.3
(3.8
)13
.0–3
5.0
14.5
–36.
513
.0–3
1.5
15.0
–32.
0)13
.0–3
3.0
15.0
–38.
5)18
.0–2
6.5
16.0
–30.
013
6126
.1 (6
.1)
28.4
(6.3
)5
25.8
(5.6
)22
.1 (4
.1)
9224
.6 (4
.4)
26.5
(4.7
)5
23.0
(6.0
)23
.1 (5
.6)
16.5
–41.
517
.0–4
5.0
20.0
–33.
017
.0–2
8.5
16.5
–36.
018
.0–3
8.5
13.5
–30.
017
.5–3
1.0
14+
5634
.6 (7
.8)
37.5
(7.7
)8
26.1
(5.4
) 28
.8 (5
.2)
6835
.8 (7
.7)
37.3
(6.3
)10
33.1
(5.0
)30
.9 (4
.0)
22.0
–57.
024
.0–6
2.0
13.0
–39.
016
.0–3
9.0
25.5
–48.
028
.0–4
7.0
26.5
–43.
024
.5–3
6.0

- 39 -
Grip strength: inter-personal reference values
Table 2: Results of comparisons of A. score of the preferent versus score of the non-preferent hand and B score of the preferent versus score of the non-preferent hand in LP and RP children tested separatelyAnalyses been performed on group level, according to gender, and finally according to gender and age.
A B
Preferred versus non-preferred
Left-preferent Right-preferent
Mean Difference
SE* P-value Mean Difference
SE* P-value Mean Difference
SE* P-value
Total Group 1.330 0.046 <0.001 0.166 0.123 0.176 1.509 0.048 <0.001Boys 1.262 0.065 <0.001 -0.047 0.159 0.767 1.510 0.069 <0.001Girls 1.397 0.064 <0.001 0.476 0.192 0.013 1.508 0.067 <0.001
Boys 4 yrs 0.391 0.190 0.039 -0.242 0.358 0.498 0.621 0.216 0.004Boys 5 yrs 0.716 0.209 0.001 -0.361 0.485 0.456 0.946 0.224 <0.001Boys 6 yrs 0.744 0.191 <0.001 0.405 0.449 0.367 0.814 0.204 <0.001Boys 7 yrs 1.024 0.207 <0.001 -0.200 0.531 0.707 1.230 0.218 <0.001Boys 8 yrs 1.257 0.199 <0.001 0.154 0.570 0.787 1.400 0.206 <0.001Boys 9 yrs 1.371 0.196 <0.001 -0.692 0.570 0.225 1.631 0.203 <0.001
Boys 10 yrs 1.472 0.202 <0.001 0.071 0.449 0.874 1.807 0.219 <0.001Boys 11 yrs 1.460 0.199 <0.001 -0.324 0.499 0.517 1.776 0.210 <0.001Boys 12 yrs 1.786 0.216 <0.001 0.344 0.514 0.504 2.075 0.230 <0.001Boys 13 yrs 2.356 0.260 <0.001 3.700 0.920 <0.001 2.246 0.263 <0.001
Boys 14+ yrs 2.391 0.264 <0.001 -1.562 0.727 0.032 2.955 0.275 <0.001Girls 4 yrs 0.406 0.202 0.045 0.231 0.570 0.686 0.430 0.210 0.041Girls 5 yrs 0.719 0.206 0.001 0.300 0.650 0.645 0.763 0.211 <0.001Girls 6 yrs 0.681 0.203 0.001 0.167 0.531 0.754 0.763 0.213 <0.001Girls 7 yrs 1.005 0.214 <0.001 0.429 0.777 0.582 1.049 0.216 <0.001Girls 8 yrs 1.212 0.195 <0.001 0.136 0.620 0.826 1.322 0.199 <0.001Girls 9 yrs 1.601 0.194 <0.001 0.786 0.550 0.153 1.710 0.201 <0.001
Girls 10 yrs 1.913 0.208 <0.001 0.567 0.531 0.286 2.142 0.219 <0.001Girls 11 yrs 1.845 0.199 <0.001 0.733 0.531 0.167 2.015 0.208 <0.001Girls 12 yrs 1.910 0.205 <0.001 -0.667 0.686 0.331 2.149 0.209 <0.001Girls 13 yrs 1.840 0.215 <0.001 -0.100 0.920 0.913 1.946 0.214 <0.001
Girls 14+ yrs 2.571 0.239 <0.001 2.200 0.650 0.001 2.625 0.249 <0.001
Difference between grip strength of the preferred and non-preferred hand according to hand preferenceNext, we analyzed whether this difference in strength in favor of the preferred hand exists for left- as well as RP children. RP children are significantly stronger with their preferred hand (p<0.001). Again, the same is true when boys (p<0.001) and girls (p<0.001) are analyzed separately, as well as for all the individual age groups (see table 2 (section B)). In terms of percentage, the advantage of the preferred hand was similar for
3

- 40 -
Chapter 3
both genders and relatively stable across the age groups. RP boys scored 9.5% higher on the average of two grip strength measurements with their preferred hand, fluctuating from 8.5–13.9% between the respective age groups. For RP girls this amounted to 10.1%, fluctuating from 7.9–12.7%.
By contrast, among LP children no difference in favor of either hand was found (p=0.176). Similarly, when dividing the LP group according to gender no significant difference for boys was found (p=0.767); overall, LP boys scored 0.4% lower with their preferred hand. LP girls were significantly stronger with their preferred hand (p=0.013), but the benefit of hand preference on strength was less evident compared to RP girls, namely 3.0% higher. The results according to the separate age groups are presented in table 2 (section B).
When assessing the differences in grip strength between left- and RP children from a different point of view, the children were divided into groups that scored higher, equal or lower with their preferred hand compared to their non-preferred hand, as represented in figure 1. As can be seen, 16% of RP children scored higher with their non-preferred hand, and around 10% of children tied scores; these results were consistent for boys and girls. LP children scored higher with the non-preferred hand more often, at 36% for girls and 41% for boys. Scoring equally with both hands was also more frequent, at 15% and 19% of LP girls and boys respectively.
Hoofdstuk 4
73.9 74.4
43.9 46.0
9.7 9.6
15.0 18.5
16.4 16.0
41.1 35.5
Boys RD Girls RD Boys LD Girls LD
Positive Equal Negative
Figure 1: Percentage of children that scored higher, equal, or lower with their preferred hand compared with their non-preferred hand, according to hand preference and gender.
- 41 -
Grip strength: inter-personal reference values
Difference in grip strength between left- and right preferent childrenLastly, the grip strength of the preferred hand of LP children was compared to that of RP children; similarly this was done for the non-preferred hand. For the preferred hand this showed a significant difference (p=0.001) in favor of the RP group. The same was true for boys tested separately (p<0.001) but not for girls (p=0.486). For the non-preferred hand, no significant difference in strength was found in favor of either RP or LP children (p=0.583), nor for boys (0.079) or girls separately (0.454). Since the results according to gender were non-significant in 3 of the 4 groups tested, results according to the even smaller age groups are not further discussed here. Results of the total analysis have been tabulated for reasons of consistency as well as to facilitate possible future data comparison and can be found in the appendix.
DISCUSSION
The results show that the 10% rule of the dominant hand regarding grip strength in adults holds true for RP children as a group, as well as for boys and girls of all age groups tested separately. However, the 10% rule cannot be generalized for LP children. LP girls are significantly stronger with their preferred hand as a group, but this effect is less evident, amounting to 3%, and thus not present in all of the separate age groups. For LP boys no significant difference in strength in favor of either hand was found. These findings should be taken into account when grip strength measurements are used to assess the degree of impairment or to monitor the patients recovery, as is often done by hand therapists. While the vast majority of RP children scored higher with their preferred hand compared with their non-preferred hand, the same does not hold true for LP children. It is much more common for LP children to have equal scores, or even score higher with their non-preferred hand. This might also contribute to the score of the preferred hand of RP children being significantly greater than that of LP children. The latter was only true for the entire group and could not be observed as a clear trend when the age groups where analyzed separately.
As with studies on grip strength measurements in adults, studies that focus specifically on children have come to different conclusions regarding the influence of hand preference. The current study’s results are in agreement with findings of De Smet and Vercammen (2001); they stated that the 10% rule did hold true for right-hand dominant children, yet their results yielded a non-significant difference. They also found no difference between the strength of hands in left-hand dominant children, but did not look at boys and girls separately.13 Ager et al. (1984) and Bear-Lehman et al. (2002) stated that hand dominance was not significant.8,21 Molenaar et al. (2010) did not evaluate children with a different hand preference separately, and Newman et al. (1984) did not assess results as relative percentages, therefore adequate comparison was not possible.22,23 Several studies focusing on adults have described that the 10%
3

- 42 -
Chapter 3
rule only holds true for right-dominant individuals and that no difference for left-hand-dominant individuals could be found.5,12-15
Regarding the percentage of children that scored higher, equal or lower with their preferred hand compared to their non-preferred hand according to hand preference, a similar phenomenon has also been described in adults. Incel et al. (2002) illustrated in their study that left-hand-dominant adults are frequently stronger with their non-dominant hand compared with their dominant hand as right-hand dominant adults, namely 33.3% versus 10.9%.14 Petersen et al. (1989) described the same, but found a much larger difference of 48% versus 6.9%.5 A search of the literature did not identify any studies examining this in children. The current findings closely resemble those of Incel et al. (2002), which might suggest that these differences remain relatively stable from childhood into adulthood.14
Finally, regarding to the comparison of the strength of LP versus that of RP children, Mathiowetz et al. (1986) evaluated the interpersonal scores of both hands and found no differences.9 However, they compared the scores of the left and right hands between children of a different hand-preference, whilst we compared the scores of the preferred and non-preferred hands. Current results did show a significant difference for the score of the preferred hand on group level as well as for boys.
The absence of a significant difference in strength in favor of the preferred hand in LP individuals has been described previously. Often this was considered to be a consequence of social pressures to become right-handed, but it is an unlikely explanation for the current differences in the Netherlands.24 A Dutch study conducted in 1985 reported that the percentage of left-dominant individuals that actually wrote with their left hand rose from 0% for persons born between 1910 and 1939 to 100% for those born after 1965, suggesting that the writing hand can be considered to be the preferred or dominant one.25 This would concur with more recent studies stating that the hand used to write is the most important predictor of hand dominance in children, more so than performance of other activities, whereas the same did not hold true for adults at the time.26,27 An alternative theory would be that LP children are still forced to become ambidextrous in modern times because objects that are used in daily living are often specifically designed for right-handed individuals. This however would not explain why such differences are already present at the age of 4 and remain relatively consistent across different age groups. Moreover, it does not explain why LP girls are significantly stronger with their preferred hand whilst LP boys are not. The differences in grip strength of the preferred hand and non-preferred hand between LP and RP children are therefore likely to have an intrinsic basis rather than a solely environmental one.
The degree to which left-hand-dominant individuals use their dominant hand is known to be lower than that of right-hand-dominant individuals. Similar differences between

- 43 -
Grip strength: inter-personal reference values
left- and right-dominant individuals are reported in studies focusing on accuracy and speed, and on a higher level in motor-evoked potentials by transcranial magnetic stimulation.28,29 A review by Scharoun et al. (2014) showed that in studies assessing hand preference by means of questionnaires, young left-dominant individuals demonstrated weak preferences while their right-dominant counterparts reported a consistent preference from a young age.30 This difference is likely to contribute to the variations in grip strength between LP and RP children and to be a consequence of nature instead of nurture, especially at a young age (3–5 years). Several studies in adults have shown that there are differences regarding the activation of the motor cortex between LP and RP individuals. Vingerhoets et al. (2012) concluded that whilst pantomiming tool movements the left lateralized activation pattern is similar for LP and RP individuals, that LP individuals show less asymmetry, and that hand preference does not influence the side of lateralization but only the strength.31 Dassonville et al. (1997) found a greater volume of activation in the contra lateral motor cortex when the dominant hand was used, and moreover, a relation between the degree of handedness and the extent of lateralization.32
The study’s very large number of subjects included 1980 children who preferred their right hand. The results provide more evidence to support the 10% rule, as it shows statistical differences in favor of the preferred hand in all age groups for RP children, and that this percentage is present from an early age and remains remarkably constant for both genders. Our study also included a relatively large number of children who preferred their left hand compared with other studies on this subject in children; this enabled us to draw some conclusions about the minority of LP children and to examine differences between LP boys and girls in more detail.8,9,13,23 In contrast there are several limitations. First, this study is cross-sectional and therefore provides results that reflect a snapshot at a certain time. Children were not followed from age 4 to 14+ onwards, instead we choose a large group of children of a certain age. Second, dominance was not additionally confirmed by teachers or parents, hence we choose the term preference when referring to the current study. Third, the number of participating LP children aged >14 was relatively low. We attempted to compensate for this by pooling children aged 14 years or older into a single group for the statistical analyses. Finally, an observer bias cannot be ruled out, owing to the fact that this parameter wasn’t recorded in the database. In this context, the Jamar® hydraulic hand dynamometer (JHD) and similar dynamometers have proven to have a high test-retest and inter-investigator reliability, as well as a high reproducibility when used by children.33-35
Overall it can be concluded that the results of this study show that the 10% rule holds true for RP children, for both boys and girls in all age groups separately, but not for left-preferent children. LP girls are significantly stronger with their preferred hand, but this difference only amounts to 3%. For LP boys no difference in favor of either hand was found. LP children more often score higher with their non-dominant hand or tie
3

- 44 -
Chapter 3
scores on both hands than RP children. However, a small portion of RP children also display this effect.
ACKNOWLEDGEMENTS
The authors thank all the children, their parents and the schools for their contribution to this study, as well as the students who aided the researchers with measurements. The authors specifically thank R. Stewart, PhD, for performing the two-level multilevel analyses, A. Shepherd, PhD, for editorial assistance in the preparation of the manuscript, and W.F.A. Klijn, Msc, for assistance with layout of the figures.

- 45 -
Grip strength: inter-personal reference values
REFERENCES
1. Fess E. Grip strength. American Society of Hand Therapists: Chicago Clinical Assessment Recommendations (2nd ed ). 1992.
2. American Medical Association. Guides to the evaluation of permanent impairment (4th ed.) Chicago. 1993.
3. Clerke A, Clerke J. A literature review of the effect of handedness on isometric grip strength differences of the left and right hands. Am J Occup Ther. 2001;55(2):206-211.
4. Bechtol CO. Grip test; the use of a dynamometer with adjustable handle spacings. J Bone Joint Surg Am. 1954;36-A(4):820-832.
5. Petersen P, Petrick M, Connor H, Conklin D. Grip strength and hand dominance: Challenging the 10% rule. Am J Occup Ther. 1989;43(7):444-447.
6. Bohannon RW. Grip strength: A summary of studies comparing dominant and nondominant limb measurements. Percept Mot Skills. 2003;96(3 Pt 1):728-730.
7. Innes E. Handgrip strength testing: A review of the literature. Australian Occupational Therapy Journal. 1999;46:120-140.
8. Ager CL, Olivett BL, Johnson CL. Grasp and pinch strength in children 5 to 12 years old. Am J Occup Ther. 1984;38(2):107-113.
9. Mathiowetz V, Wiemer DM, Federman SM. Grip and pinch strength: Norms for 6- to 19-year-olds. Am J Occup Ther. 1986;40(10):705-711.
10. Butterfield SA, Lehnhard RA, Loovis EM, Coladarci T, Saucier D. Grip strength performances by 5- to 19-year-olds. Percept Mot Skills. 2009;109(2):362-370.
11. Armstrong CA, Oldham JA. A comparison of dominant and non-dominant hand strengths. J Hand Surg Br. 1999;24(4):421-425.
12. Crosby CA, Wehbé MA, Mawr B. Hand strength: Normative values. J Hand Surg Am. 1994;19(4):665-670.
13. De Smet L, Vercammen A. Grip strength in children. J Pediatr Orthop B. 2001;10(4):352-354.14. Incel NA, Ceceli E, Durukan PB, Erdem HR, Yorgancioglu ZR. Grip strength: Effect of hand
dominance. Singapore Med J. 2002;43(5):234-237.15. Burmeister LF, Flatt AE, Weiss MW. Size and strength development of the hand in
elementary school children. Iowa State Services for Crippled Children, University of Iowa in Iowa City. 1974; ID nr: OL16447325M.
16. Ploegmakers JJ, Hepping AM, Geertzen JH, Bulstra SK, Stevens M. Grip strength is strongly associated with height, weight and gender in childhood: A cross sectional study of 2241 children and adolescents providing reference values. J Physiother. 2013;59(4):255-261.
17. Balogun JA, Akomolafe CT, Amusa LO. Grip strength: Effects of testing posture and elbow position. Arch Phys Med Rehabil. 1991;72(5):280-283.
18. Roberts HC, Denison HJ, Martin HJ, et al. A review of the measurement of grip strength in clinical and epidemiological studies: Towards a standardised approach. Age Ageing. 2011;40(4):423-429.
19. Snijders TAB, Bosker RJ. Multilevel analysis; an introduction to basic and advanced multilevel modelling. 2nd edition ed. London: SAGE publications ltd; 2012.
20. Twisk JWR. Applied multilevel analysis: A practical guide. Cambridge: Cambridge university press. 2006.
21. Bear-Lehman J, Kafko M, Mah L, Mosquera L, Reilly B. An exploratory look at hand strength and hand size among preschoolers. J Hand Ther. 2002;15(4):340-346.
3

- 46 -
Chapter 3
22. Molenaar HM, Selles RW, Zuidam JM, Willemsen SP, Stam HJ, Hovius SE. Growth diagrams for grip strength in children. Clin Orthop Relat Res. 2010;468(1):217-223.
23. Newman DG, Pearn J, Barnes A, Young CM, Kehoe M, Newman J. Norms for hand grip strength. Arch Dis Child. 1984;59(5):453-459.
24. Annett M. The binomial distribution of right, mixed and left handedness. Q J Exp Psychol. 1967;19(4):327-333.
25. Beukelaar LJ, Kroonenberg PM. Changes over time in the relationship between hand preference and writing hand among left-handers. Neuropsychologia. 1986;24(2):301-303.
26. Roszkowski MJ, Snelbecker GE, Sacks R. Young children’s subjective reports of manual preference: Internal consistency and the selection of the most representative activity on the basis of item-total correlations. Clinical Neuropsychology. 1982;4:35-37.
27. Roszkowski MJ, Snelbecker GE, Sacks R. Children’s, adolescents’, and adults’ reports of hand preference: Homogeneity and discriminating power of selected tasks. J Clin Neuropsychol. 1981;3(3):199-213.
28. Yahagi S, Kasai T. Motor evoked potentials induced by motor imagery reveal a functional asymmetry of cortical motor control in left- and right-handed human subjects. Neuroscience Letters. 1999:185-188.
29. Carlier M, Duyme M, Capron C, Dumont AM, Perez-Diaz F. Is a dot-filling group test a good tool for assessing manual performance in children? Neuropsychologia. 1993;31(3):233-240.
30. Scharoun SM, Bryden PJ. Hand preference, performance abilities, and hand selection in children. Front Psychol. 2014;5:82.
31. Vingerhoets G, Acke F, Alderweireldt AS, Nys J, Vandemaele P, Achten E. Cerebral lateralization of praxis in right- and left-handedness: Same pattern, different strength. Hum Brain Mapp. 2012;33(4):763-777.
32. Dassonville P, Zhu XH, Uurbil K, Kim SG, Ashe J. Functional activation in motor cortex reflects the direction and the degree of handedness. Proc Natl Acad Sci U S A. 1997;94(25):14015-14018.
33. Van den Beld WA, van der Sanden GA, Sengers RC, Verbeek AL, Gabreëls FJ. Validity and reproducibility of the jamar dynamometer in children aged 4-11 years. Disabil Rehabil. 2006;28(21):1303-1309.
34. Molenaar HM, Zuidam JM, Selles RW, Stam HJ, Hovius SE. Age-specific reliability of two grip-strength dynamometers when used by children. J Bone Joint Surg Am. 2008;90(5):1053-1059.
35. Mathiowetz V, Weber K, Volland G, Kashman N. Reliability and validity of grip and pinch strength evaluations. J Hand Surg Am. 1984;9(2):222-226.

- 47 -
Grip strength: inter-personal reference values
3


4CHAPTER
The evolution of hand function during remodelling in non-reduced angulated
paediatric forearm fractures: a prospective cohort study.
Britt BarvelinkJoris J.W. PloegmakersArjan G.J. Harsevoort
Martin StevensCees C.P.M. Verheyen
Ann M. HeppingSjoerd K. Bulstra
Journal of Pediatric Orthopaedics. Part B. 2020 March; 29(2): 172-187

- 50 -
Chapter 4
ABSTRACT
Objective: Forearm fractures are very common orthopaedic injuries in children. Most of these fractures are forgiving due to the unique and excellent remodelling capacity of the juvenile skeleton. However, significant evidence stating the limits of acceptable angulations and taking functional outcome into consideration is scarce. The aim of this study is therefore to get a first impression of the remodelling capacity in non-reduced paediatric forearm fractures based on radiological and functional outcome.
Methods: Children aged 0 to 14 years with a traumatic angular deformation of the radius or both the radius and ulna, treated conservatively without reduction, were included in this prospective cohort study. Radiographs were taken and functional outcome was assessed at five fixed follow-up appointments throughout a period of one year. Outcome measurements comprised radiographic angular alignment, grip strength and wrist mobility.
Results: A total of 26 children (aged 3-13 years) with a traumatic angulation of the forearm were included. Mean dorsal angulation at time of presentation amounted to 12° (5-18) and diminished after one year to a mean angulation of 4° (0-13). Grip strength, pronation and supination were significantly diminished compared to the unaffected hand up to six months post-injury. After one year, no significant differences in function between the affected and the unaffected arm were found.
Conclusion: Non-reduced angulated paediatric forearm fractures have the potential to remodel in time and have good radiographic and functional outcome one year after trauma, where pronation and grip strength take the longest to recover.
Key words: Paediatric forearm fractures, Conservative treatment, Remodelling, Angulation, Functional outcome, Grip strength.

- 51 -
Recovery after non-reduced fractures
INTRODUCTION
Fractures of the forearm are very common in children and account for more than 30% of all paediatric fractures.1-3 Angularly deformed forearm fractures are traditionally treated by closed reduction followed by cast immobilisation. Surgical stabilisation is increasingly used as a treatment option, probably due to a relatively high failure rate in the sometimes unpredictable outcome of conservative treatment.4-6 Re-displacement is the most common complication, especially in primary dislocated forearm fractures (21-40%).7,8 Re-displacement or secondary worsening of angulation can be prevented by surgical intervention using percutaneous pinning, intramedullary nailing or plate fixation, which gives maximum stability and the benefit of regaining proper alignment. Fortunately, not all fractures are unstable and require surgical stabilisation since juvenile bone has the unique potency to remodel.9,10 There is little evidence supporting guidelines on angular acceptance.11 The uncertainty of predicting fracture stability and the remodelling potential in forearm fractures hinders making a considered decision between conservative and surgical treatment.5,8,12 Also, there is no convincing literature proving that surgical intervention is superior to conservative treatment in terms of functional outcome.5,8,13
The limits of acceptable angular deformations are currently based on scarce retrospective studies, case reports and expert opinions.14-16 Crawford et al. 2012 demonstrated that even completely overriding distal radial fractures have the potential to remodel in one year without reduction.17 On duration of remodelling, both Friberg et al. 1979 and Jeroense et al. 2015 found remodelling speed to be faster in larger angulations.15 This suggests that deformities can remodel in time and result in a normal functional outcome without experiencing the psychological distress of undergoing a surgical procedure, not to mention exposure to anaesthetic and operative risks. Operative risks should not be underestimated, as earlier studies found a complication rate of 14.6% in patients treated with intramedullary nailing.6 Although research on fracture remodelling is of great importance in clinical decision-making, to our knowledge no prospective studies have been conducted investigating fracture re-angulation in time in conservatively treated paediatric forearm fractures as related to function.
The objective of this prospective study is therefore to first get an initial impression of fracture remodelling and functional outcome in non-reduced paediatric forearm fractures, and second to establish which factors influence remodelling and to determine whether functional outcome is correlated with degree of fracture angulation.
4
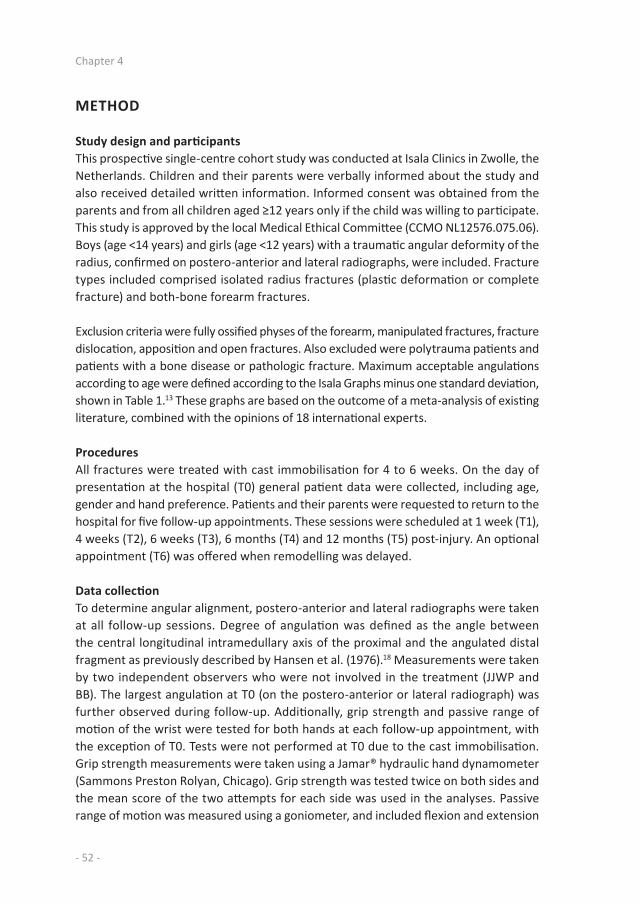
- 52 -
Chapter 4
METHOD
Study design and participantsThis prospective single-centre cohort study was conducted at Isala Clinics in Zwolle, the Netherlands. Children and their parents were verbally informed about the study and also received detailed written information. Informed consent was obtained from the parents and from all children aged ≥12 years only if the child was willing to participate. This study is approved by the local Medical Ethical Committee (CCMO NL12576.075.06). Boys (age <14 years) and girls (age <12 years) with a traumatic angular deformity of the radius, confirmed on postero-anterior and lateral radiographs, were included. Fracture types included comprised isolated radius fractures (plastic deformation or complete fracture) and both-bone forearm fractures.
Exclusion criteria were fully ossified physes of the forearm, manipulated fractures, fracture dislocation, apposition and open fractures. Also excluded were polytrauma patients and patients with a bone disease or pathologic fracture. Maximum acceptable angulations according to age were defined according to the Isala Graphs minus one standard deviation, shown in Table 1.13 These graphs are based on the outcome of a meta-analysis of existing literature, combined with the opinions of 18 international experts.
ProceduresAll fractures were treated with cast immobilisation for 4 to 6 weeks. On the day of presentation at the hospital (T0) general patient data were collected, including age, gender and hand preference. Patients and their parents were requested to return to the hospital for five follow-up appointments. These sessions were scheduled at 1 week (T1), 4 weeks (T2), 6 weeks (T3), 6 months (T4) and 12 months (T5) post-injury. An optional appointment (T6) was offered when remodelling was delayed.
Data collectionTo determine angular alignment, postero-anterior and lateral radiographs were taken at all follow-up sessions. Degree of angulation was defined as the angle between the central longitudinal intramedullary axis of the proximal and the angulated distal fragment as previously described by Hansen et al. (1976).18 Measurements were taken by two independent observers who were not involved in the treatment (JJWP and BB). The largest angulation at T0 (on the postero-anterior or lateral radiograph) was further observed during follow-up. Additionally, grip strength and passive range of motion of the wrist were tested for both hands at each follow-up appointment, with the exception of T0. Tests were not performed at T0 due to the cast immobilisation. Grip strength measurements were taken using a Jamar® hydraulic hand dynamometer (Sammons Preston Rolyan, Chicago). Grip strength was tested twice on both sides and the mean score of the two attempts for each side was used in the analyses. Passive range of motion was measured using a goniometer, and included flexion and extension

- 53 -
Recovery after non-reduced fractures
of the elbow, pronation and supination of the forearm, and palmar and dorsal flexion and ulnar and radial deviation of the wrist.
Statistical analysisAll statistical analyses were conducted using SPSS (version 24.0, SPSS Inc., Chicago). Descriptive statistics were used to describe the main characteristics of the research population and functional outcome parameters. The mean angular deformity as determined by both observers was used in the analyses, as interrater reliability appeared to be excellent (intraclass correlation coefficient 0.98). The Wilcoxon signed-rank test was used to compare grip strength and range of motion of the affected and unaffected hands. A multilevel design was applied, which implies that the follow-up appointments were nested under patients. A multiple regression analysis was performed with fracture angulation as dependent variable. The following factors were tested for association with the above-mentioned variable: time post-injury, dominant arm fractured, type of fracture (plastic deformation or complete fracture), and involvement of the radius or both the radius and ulna. An unconditional growth model will be presented with fracture angulation as dependent variable and time and function tests as independent variables. Results were accepted as significant if p<0.05.
Table 1: Maximum acceptable angulations according to age
Age (y)
0 1 2 3 4 5 6 7 8 9 10 11 12 13 14
Type of fracture Sex Maximum acceptable angulation (°)Greenstick F 21 21 21 20 20 19 18 17 16 14 12 10 8
M 21 21 21 21 21 20 20 19 18 17 16 14 12 10 8Radius F 25 25 25 25 24 24 23 22 19 17 15 10 8
M 25 25 25 25 25 25 24 24 23 22 19 17 15 10 8Both-bone F 18 18 18 18 17 16 15 14 13 12 11 10 8
M 18 18 18 18 18 18 17 16 15 14 13 12 11 10 8
F = female; M = Male
RESULTS
Patient characteristicsA total of 27 children were enrolled in this study. One child did not show up at the follow-up appointments and was therefore excluded. The final study population comprised 26 children (13 boys), ranging from ages 3.3 to 12.6. Mean age at time of injury was 9 years (boys: 9.1, girls: 8.9). Of all children, 88.5% were right-hand dominant and 17 fractures (65.4%) affected the non-dominant side. In 38.5% the fracture concerned a plastic deformation; 61.5% had a complete fracture (both cortices). This was equally
4
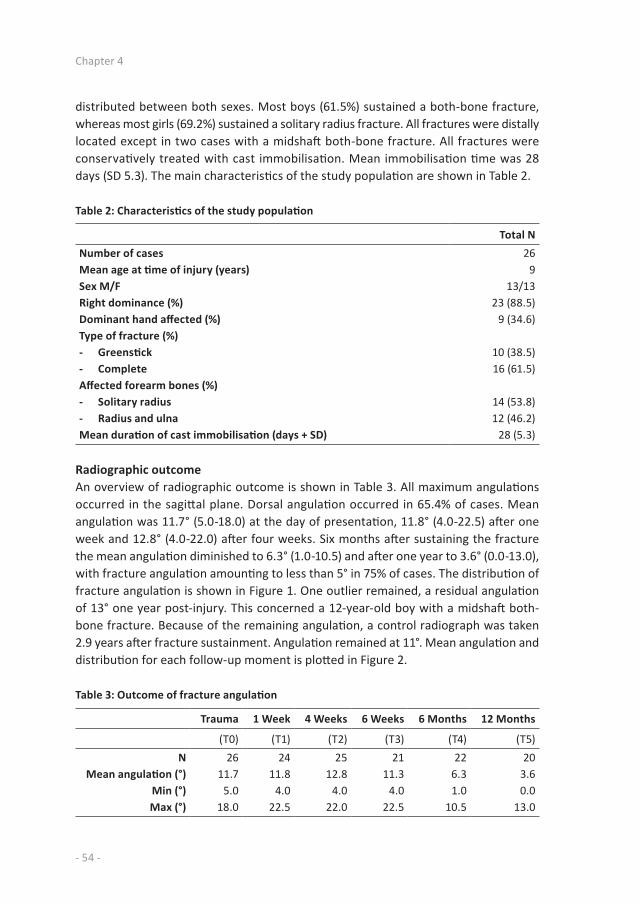
- 54 -
Chapter 4
distributed between both sexes. Most boys (61.5%) sustained a both-bone fracture, whereas most girls (69.2%) sustained a solitary radius fracture. All fractures were distally located except in two cases with a midshaft both-bone fracture. All fractures were conservatively treated with cast immobilisation. Mean immobilisation time was 28 days (SD 5.3). The main characteristics of the study population are shown in Table 2.
Table 2: Characteristics of the study population
Total NNumber of cases 26Mean age at time of injury (years) 9Sex M/F 13/13Right dominance (%) 23 (88.5)Dominant hand affected (%) 9 (34.6)Type of fracture (%)- Greenstick 10 (38.5)- Complete 16 (61.5)Affected forearm bones (%)- Solitary radius 14 (53.8)- Radius and ulna 12 (46.2)Mean duration of cast immobilisation (days + SD) 28 (5.3)
Radiographic outcomeAn overview of radiographic outcome is shown in Table 3. All maximum angulations occurred in the sagittal plane. Dorsal angulation occurred in 65.4% of cases. Mean angulation was 11.7° (5.0-18.0) at the day of presentation, 11.8° (4.0-22.5) after one week and 12.8° (4.0-22.0) after four weeks. Six months after sustaining the fracture the mean angulation diminished to 6.3° (1.0-10.5) and after one year to 3.6° (0.0-13.0), with fracture angulation amounting to less than 5° in 75% of cases. The distribution of fracture angulation is shown in Figure 1. One outlier remained, a residual angulation of 13° one year post-injury. This concerned a 12-year-old boy with a midshaft both-bone fracture. Because of the remaining angulation, a control radiograph was taken 2.9 years after fracture sustainment. Angulation remained at 11°. Mean angulation and distribution for each follow-up moment is plotted in Figure 2.
Table 3: Outcome of fracture angulation
Trauma 1 Week 4 Weeks 6 Weeks 6 Months 12 Months
(T0) (T1) (T2) (T3) (T4) (T5)N 26 24 25 21 22 20
Mean angulation (°) 11.7 11.8 12.8 11.3 6.3 3.6Min (°) 5.0 4.0 4.0 4.0 1.0 0.0Max (°) 18.0 22.5 22.0 22.5 10.5 13.0

- 55 -
Recovery after non-reduced fractures
0%
10%
20%
30%
40%
50%
60%
70%
80%
90%
100%
T0 T1 T2 T3 T4 T5
0° 0-5° 5-10° 10-15° 15-20° 20-25°
Figure 1: Fracture angulation distribution in % for each follow-up appointment.
Functional outcome
Grip strengthGrip strength is significantly diminished in the affected hand compared to the unaffected hand up to six months post-injury (T4). The results show that grip strength is strongly diminished at T1, T2 and T3, and less diminished but still significant at T4. After one year follow-up, grip strength measurements showed no significant difference between the affected and unaffected arm. When describing grip strength of the affected side compared to the unaffected side (%), results show a mean grip strength of 97% at both T4 and T5 (T4: SD 17.6, T5: SD 14.1). An overview of recovery of grip strength is shown in Table 4 and Figure 3.
4

- 56 -
Chapter 4
Hoofdstuk 5
0%
10%
20%
30%
40%
50%
60%
70%
80%
90%
100%
T0 T1 T2 T3 T4 T5
0° (%) 0-5° (%) 5-10° (%)
0
2
4
6
8
10
12
14
16
18
20
T1 T2T3 T4 T5
Max
Mean
Min
Figure 2: Mean dorsal angulation (°) and distribution (SD) plotted in time.
0
10
20
30
40
50
60
70
80
90
100
T1 T2T3 T4 T5
Figure 3: Mean grip strength of the affected arm presented as percentage of the unaffected arm.

- 57 -
Recovery after non-reduced fractures
Table 4: Grip strength of affected hand versus unaffected hand
Unaffected hand Affected hand Strength percentile
N Mean (kg) Min Max N Mean (kg) Min Max Sig. Mean (%) Min (%) Max (%)T1 19 15.7 1.0 29.0 9 4.6 1.0 10.5 <0.001 38 4 88T2 21 15.6 2.0 26.0 15 7.6 1.0 19.0 <0.001 48 6 96T3 22 16.6 3.0 29.0 22 10.8 0.5 26.0 <0.001 63 6 100T4 22 17.9 2.0 29.0 22 16.9 2.0 27.5 0.03 97 61 160T5 15 17.7 2.5 33.0 15 17.1 2.0 30.0 0.57 97 73 125
*Difference in N is explained by inability to perform grip strength tests because of cast immobilisation.
Range of motionAt T2 the affected hand scored significantly lower in all mobility tests, except for extension of the elbow. At T3 the affected hand scored significantly lower in all mobility tests, except for radial deviation. Six months post-injury (T4), only pronation (p = <0.01) and supination (p = 0.03) were significantly diminished in the affected arm. Range of motion after one year follow-up (T5) showed no statistically significant differences in elbow and wrist motion of the affected arm compared to the unaffected arm (see Table 5). Maximum loss of range of motion at T5 was found to be 10° in radial deviation and pronation.
Factors affecting remodellingA multiple regression analysis with fracture angulation as dependent variable shows that fracture angulation significantly diminishes in time (adjusted coefficient = 0.03, p = <0.01). Greenstick fractures show significantly faster remodelling than full-thickness fractures (adjusted coefficient = 3.04, p = 0.015). An affected dominant or non-dominant hand, as well as suffering from a solitary radius fracture or both-bone fracture, are not of significant influence on fracture angulation.
Fracture angulation and functionUsing unconditional growth model analyses, grip strength was found to be significantly influenced by fracture angulation (coefficient = 1.52, p = 0.0223). No association was found between fracture angulation and any range of motion tests.
4

- 58 -
Chapter 4
Table 5: Range of motion after one year follow-up
Affected arm Unaffected arm
Mean Min Max Mean Min Max p-valuePalmar flexion (°) 95 80 115 96 80 115 0.67Dorsal flexion (°) 92 85 105 92 85 105 0.58
Radial deviation (°) 39 20 50 39 25 50 1.00Ulnar deviation (°) 44 30 55 44 30 55 0.33
Pronation (°) 93 80 100 94 80 100 0.10Supination (°) 95 90 100 95 90 110 0.67
Elbow flexion (°) 149 125 175 149 125 175 0.33Elbow extension (°)* -7 -20 5 -8 -20 5 0.33
* Negative value stands for hyperextension of the elbow
DISCUSSION
The current study shows a first impression of the bone remodelling capacity in non-reduced paediatric forearm fractures, thereby evaluating functional outcome in time. Factors that influence fracture angulation were also determined. The rationale was the lack of clear guidance from the literature for definite acceptable angular deformations and functional restoration in time.
After one year the mean fracture angulation of 12° measured at initial presentation was reduced to a mean residual angulation of 4°. At this point in time, no significant differences between the affected and the non-affected hand were found for either grip strength or range of motion. This suggests that a residual angulation of 4° is of no functional concern. Conservative treatment without reduction could therefore be a good treatment option in angulated forearm fractures.
There is a worldwide tendency towards a more aggressive approach in the treatment of the described angular deformities, even without thoroughly weighing non-invasive treatment modalities. Using the Isala Graphs as a safe inclusion, we attempted to obtain more insight into functional outcome in non-reduced angulated fractures. Functional outcome is often overlooked while in daily practice fracture consolidation often equals the end of treatment.
Literature on fracture remodelling in paediatric forearm fractures is scarce, even more so in relation to functional outcome.17 Crawford et al. 2012 performed a retrospective case series amongst fifty-four children with conservatively treated overriding distal radius fractures.16 Angulation improved from 4.0° to 2.2° at final follow-up (one year post fracture) with no functional limitations. Functional outcome during follow up and final scores were however not specified and could therefore not be compared

- 59 -
Recovery after non-reduced fractures
to the recent study. Also, their study population consisted of completely displaced fractures who were excluded in our study. In a retrospectively studied population of 33 children with malunited distal radius fractures, Jeroense et al. (2015) found a mean residual angulation of 8° after a mean follow-up of nine months, compared to 4° residual angulation after twelve months in our study population. However, mean angulation at moment of presentation was larger in their population (23°) than in ours (12°).14 The study of Van der Sluijs et al. (2016) merged data of two studies (including Jeroense et al. 2015), and included 63 children with a mean angulation at initial trauma of 25° which remodelled to a mean residual angulation of 6.7° after a mean of 22 months follow-up.15 Neither of these studies took functional outcome into consideration though.
As mentioned in the Results section, one case maintained a residual angulation of 11°. Stagnation of remodelling in this case could be partially explained by fracture location and age. More proximally located fractures of the radius and ulna are known to have a high probability of residual angulation and pronation loss.18 Johari et al. (1999) described how midshaft forearm fractures in children older than age 10 have a less favourable prognosis in terms of remodelling.17 Despite the residual angulation, grip strength and range of motion were found to be near-normal, with all scores being equal to the unaffected side except for pronation and grip strength. These scores were both 90% of the unaffected hand. The minimum loss of function despite the residual malalignment of 11° could be explained by the extent of malalignment. Colaris et al. (2014) found a significant loss of pronation (<50°) more than six months post-trauma in 31.9% of cases with an angular malunion of 11°-15°.(20) Earlier cadaveric studies with artificially created deformities of the forearm bones revealed that angular malalignment of 10° or less will not limit forearm rotation anatomically, while loss of pronation and supination can be expected when residual angles of 20° or more are measured.19,20
As expected, the radiographs show a reduction of angulation over time. Interestingly, in some cases angulation seems to increase in the first period before a decrease sets in. This phenomenon is not previously described in studies on non-reduced forearm fractures. However, Colaris et al. (2013) described an angulation increase in forearm fractures treated by reduction, in the period between reduction and cast removal.7 In his study, as in ours, remodelling was seen in the period between cast removal and final examination. Previous studies have shown that fractures with any bayonet apposition are prone to lose reduction, which could probably explain the primary worsening of angulation.21,22
It would be reasonable to assume that after correction of angular deformity in time, recovery of function would follow. This study found an excellent functional outcome after one year. No significant differences in elbow or wrist range of motion were observed between the affected and the unaffected arm. Pronation and supination took the longest to recover since the scores on these parameters where both still significantly
4

- 60 -
Chapter 4
diminished up to six months post-fracture. This observation is in line with previous literature, where limitations in pronation and supination were most frequently seen in overall mobility of the wrist after sustaining a forearm fracture.23,24
The potency of angular correction in juvenile bone depends on redirection of the epiphyseal growth plate and remodelling at the fracture site.25,26 An interesting thought would be that remodelling is being promoted by function. Factors supporting this can be derived from e.g. Wolff’s law; malalignment in plane of movement is advantageous and rotational deformities in a fracture do not realign. Redistribution of growth in the physis still remains hard to prove.25,27
To our knowledge, this study is the first to prospectively investigate fracture remodelling in paediatric non-reduced angulated forearm fractures for functional outcome at fixed follow-up moments. Since assessment took place several times during one year, this study provides good insight into the progression of remodelling as well as recovery of function over time
The most important limitation of this study is the relatively small study population. This makes the data less reliable to adequately differentiate between subgroups (e.g. hand dominance, sex, fracture type). Second, the range of fracture angulation at the moment of presentation was large and relatively moderate because of the inclusion criteria. More subjects are needed to adequately observe the difference in fracture remodelling, based on severity of angulation at time of presentation. Lastly, we had to deal with missing data. Not all participants came to all the follow-up appointments. For future studies the recommendation would be to schedule less follow-up appointments at stricter times to improve attendance.
CONCLUSION
This study shows that non-reduced angulated paediatric forearm fractures have the potential to remodel in time, and show good radiographic and functional outcome with respect to grip strength and range of motion after one year. Concerning functional outcome, pronation and grip strength take the longest to recover, with grip strength being strongly associated with fracture alignment.
ACKNOWLEGDEMENTS
The help of R. E. Steward, Methodologist at the University Medical Center Groningen, is greatly appreciated with conducting the analyses.

- 61 -
Recovery after non-reduced fractures
REFERENCES
1. Rennie L, Court-Brown CM, Mok JY, Beattie TF. The epidemiology of fractures in children. Injury. 2007;38(8):913-922.
2. Clark EM. The epidemiology of fractures in otherwise healthy children. Curr Osteoporos Rep. 2014;12(3):272-278.
3. Mäyränpää MK, Makitie O, Kallio PE. Decreasing incidence and changing pattern of childhood fractures: A population-based study. J Bone Miner Res. 2010;25(12):2752-2759.
4. Kosuge D, Barry M. Changing trends in the management of children’s fractures. Bone Joint J. 2015;97-B(4):442-448.
5. Abraham A, Kumar S, Chaudhry S, Ibrahim T. Surgical interventions for diaphyseal fractures of the radius and ulna in children. Cochrane Database Syst Rev. 2011;(11):CD007907. doi(11):CD007907.
6. Flynn JM, Jones KJ, Garner MR, Goebel J. Eleven years experience in the operative management of pediatric forearm fractures. J Pediatr Orthop. 2010;30(4):313-319.
7. Colaris JW, Allema JH, Biter LU, et al. Re-displacement of stable distal both-bone forearm fractures in children: A randomised controlled multicentre trial. Injury. 2013;44(4):498-503.
8. Miller BS, Taylor B, Widmann RF, Bae DS, Snyder BD, Waters PM. Cast immobilization versus percutaneous pin fixation of displaced distal radius fractures in children: A prospective, randomized study. J Pediatr Orthop. 2005;25(4):490-494.
9. Pretell Mazzini J, Rodriguez Martin J. Paediatric forearm and distal radius fractures: Risk factors and re-displacement-role of casting indices. Int Orthop. 2010;34(3):407-412.
10. Rodriguez-Merchan EC. Pediatric fractures of the forearm. Clin Orthop Relat Res. 2005;(432)(432):65-72.
11. Vopat ML, Kane PM, Christino MA, et al. Treatment of diaphyseal forearm fractures in children. Orthop Rev (Pavia). 2014;6(2):5325.
12. Madhuri V, Dutt V, Gahukamble AD, Tharyan P. Conservative interventions for treating diaphyseal fractures of the forearm bones in children. Cochrane Database Syst Rev. 2013;(4):CD008775. doi(4):CD008775.
13. Eismann EA, Little KJ, Kunkel ST, Cornwall R. Clinical research fails to support more aggressive management of pediatric upper extremity fractures. J Bone Joint Surg Am. 2013;95(15):1345-1350.
14. Ploegmakers JJ, Verheyen CC. Acceptance of angulation in the non-operative treatment of paediatric forearm fractures. J Pediatr Orthop B. 2006;15(6):428-432.
15. Jeroense KT, America T, Witbreuk MM, van der Sluijs JA. Malunion of distal radius fractures in children. Acta Orthop. 2015;86(2):233-237.
16. Van der Sluijs JA, Bron JL. Malunion of the distal radius in children: Accurate prediction of the expected remodeling. J Child Orthop. 2016;10(3):235-240.
17. Crawford SN, Lee LS, Izuka BH. Closed treatment of overriding distal radial fractures without reduction in children. J Bone Joint Surg Am. 2012;94(3):246-252.
18. Hansen BA, Greiff J, Bergmann F. Fractures of the tibia in children. Acta Orthop Scand. 1976;47(4):448-453.
19. Johari AN, Sinha M. Remodeling of forearm fractures in children. J Pediatr Orthop B. 1999;8(2):84-87.
20. Price CT, Scott DS, Kurzner ME, Flynn JC. Malunited forearm fractures in children. J Pediatr Orthop. 1990;10(6):705-712.
4

- 62 -
Chapter 4
21. Matthews LS, Kaufer H, Garver DF, Sonstegard DA. The effect on supination-pronation of angular malalignment of fractures of both bones of the forearm. J Bone Joint Surg Am. 1982;64(1):14-17.
22. Tarr RR, Garfinkel AI, Sarmiento A. The effects of angular and rotational deformities of both bones of the forearm. an in vitro study. J Bone Joint Surg Am. 1984;66(1):65-70.
23. Alemdaroglu KB, Iltar S, Cimen O, Uysal M, Alagoz E, Atlihan D. Risk factors in redisplacement of distal radial fractures in children. J Bone Joint Surg Am. 2008;90(6):1224-1230.
24. Asadollahi S, Ooi KS, Hau RC. Distal radial fractures in children: Risk factors for redisplacement following closed reduction. J Pediatr Orthop. 2015;35(3):224-228.
25. Colaris J, Reijman M, Allema JH, et al. Angular malalignment as cause of limitation of forearm rotation: An analysis of prospectively collected data of both-bone forearm fractures in children. Injury. 2014;45(6):955-959.
26. Sinikumpu JJ, Lautamo A, Pokka T, Serlo W. Complications and radiographic outcome of children’s both-bone diaphyseal forearm fractures after invasive and non-invasive treatment. Injury. 2013;44(4):431-436.
27. Ryoppy S, Karaharju EO. Alteration of epiphyseal growth by an experimentally produced angular deformity. Acta Orthop Scand. 1974;45(4):490-498.
28. Karaharju EO, Ryoppy SA, Makinen RJ. Remodelling by asymmetrical epiphysial growth. an experimental study in dogs. J Bone Joint Surg Br. 1976;58(1):122-126.
29. Pauwels F. A clinical observation as example and proof of functional adaptation of bone through longitudinal growth. Z Orthop Ihre Grenzgeb. 1975;113(1):1-5.

- 63 -
Recovery after non-reduced fractures
4


5CHAPTER
Recovery of strength after reduced paediatric fractures of the forearm,
wrist or hand; a prospective study
Ann M. HeppingB. Barvelink
Joris J.W. PloegmakersJob van der PalenJan H.B. GeertzenSjoerd S.K. Bulstra
Jorrit S. HarbersMarin Stevens
PLOS ONE 2020 April 15(4):e0230862

- 66 -
Chapter 5
ABSTRACT
Introduction: The way strength recovers after reduction of pediatric fractures of the upper extremity has not previously been the specific scope of research. This is remarkable, since strength measurements are often used as an outcome measure in studies on trauma of the upper extremity. The aim of this study was to evaluate how strength recovers after sustainment of fractures of the forearm, wrist or hand treated by closed or open reduction in children and adolescents in the first 6 months after trauma. How much strength is lost at 6 weeks, 3 months and 6 months after trauma, and is this loss significant? Are there differences in the pattern of recovery between children who underwent a different treatment? And finally, which of the following factors are associated with an increase in the ratio between affected grip strength and expected strength: type of fracture, cast immobilization, occurrence of complications, and degree of pain?
Design: Prospective observational study
Participants: Children and adolescents aged 4-18 years with a reduced fracture of the forearm, wrist or hand.
Methods: Grip strength, key grip and three-jaw chuck grip were measured twice in each hand 6 weeks, 3 months and 6 months after trauma. Details on fracture type and location, treatment received, cast immobilization and complications were obtained. Hand-dominance and pain were verbally confirmed.
Results: Loss of strength was more prominent and prolonged the more invasive the treatment, hence most extensive in the group receiving open reduction with internal fixation (ORIF), intermediate in the group receiving closed reduction with percutaneous pinning (CRIF), and least extensive in the group undergoing closed reduction without internal fixation (CR). Besides time passed, gender and age were of significant influence on strength, although there was no difference in pattern of recovery over time between children who received a different treatment. In the period of 6 weeks to 3 months after trauma, female gender, type of fracture sustained and occurrence of an unwanted event were associated with an increased ratio between affected and expected grip strength. For the later phase of recovery, between 3 and 6 months, this was only true for the occurrence of an unwanted event.

- 67 -
Recovery of strength after reduced fractures
INTRODUCTION
Within the extensive arsenal of existing functional tests, strength measurements are conducted almost routinely in the follow-up after trauma of the upper extremity in adults because of their well-established role in the assessment of hand function. Strength measurements are quick to assess and have excellent intra- and interrater reliability.1-3 Scores of the affected hand are usually compared to those of the unaffected hand, or when available to reference values, in order to monitor disease activity, recovery and/or treatment efficacy.
Illustrative for the importance of strength measurements in the recovery of pediatric forearm fractures is the prospective study by Pershad et al. 2000.4 Results showed a decrease in grip strength of 20% or more compared to the unaffected hand to be predictive for the presence of a fracture. The difference in grip strength between the fractured and the non-fractured group was found to be significant, whereas surprisingly the same did not hold true for range of motion of the wrist. However, within the field of pediatric traumatology or orthopedic surgery, strength measurements seem to be predominantly used as outcome parameters to compare two different types of treatment and/or in the setting of a long-term follow-up evaluation.5-9 Studies measuring strength shortly after trauma are extremely scarce.5-8,10 Furthermore, we could not identify any studies that assessed recovery of strength itself in children after sustainment of reduced fractures. Comparing the affected hands between different treatment groups in itself gives no actual information about recovery of the individual children, as strength could very well still be diminished in the highest scoring group. More insight is needed into the recovery of strength in the first period after trauma, in particular in comparison to the unaffected hand.
The aim of this prospective study is to evaluate how strength recovers in children and adolescents after having sustained fractures of the forearm, wrist or hand treated by closed or open reduction. The research questions were as follows. How much strength is lost at 6 weeks, 3 months and 6 months after trauma, and is this difference significant in comparison to the unaffected hand? Are there differences in pattern of strength recovery between children treated by means of closed reduction (CR), closed reduction with percutaneous pinning (CRIF), and open reduction using either percutaneous pinning, intramedullary pinning or plate fixation (ORIF)? And finally, which of the following factors are associated with an increase in the ratio between affected grip strength and expected strength: type of fracture, cast immobilization, occurrence of complications, and degree of pain?
5

- 68 -
Chapter 5
METHOD
Study designA prospective observational study. Children and their parents were informed about the study by one of the researchers (AMH/BB) and received additional written information about the study goals and procedures. Written consent was obtained from parents or the legal guardian. Children were only included if they themselves were willing to participate, and the researcher made sure parents as well as children knew that participation was neither mandatory nor would affect their treatment. The study received a waiver from the Medical Ethical Board of University Medical Center Groningen (M.14.150324).
Participants and proceduresAll children and adolescents aged 4-18 years with a reduced fracture distal from the olecranon treated at University Medical Center Groningen in a one year period were invited to participate. Exclusion criteria comprised neuromuscular and bone diseases, any condition interfering with normal growth, and fractures proven or suspected to be the result of child abuse. Also excluded were children who could not be properly instructed, for example due to a language barrier, or who received follow-up at a different hospital. Participating children had 3 appointments: at 6 weeks (T1), 3 months (T2) and 6 months (T3) after sustainment of the fracture. Participants were not measured in the week following cast or osteosynthesis removal. In those cases measurements were postponed. When appointments at the hospital could not be planned concurrently with measurement sessions, a home visit by the researcher was offered. Patients were assigned to each treatment regimen by the treating physician as part of the standard-of-care.
Outcome measuresGeneral characteristics of the participants such as age, gender and hand dominance were registered. Details obtained on the fracture comprised location, type, (post) treatment, cast duration and potential complications. Grip strength was measured with the Jamar® hydraulic hand dynamometer (Lafayette Instrument Company, Lafayette, IN, USA). Participants were positioned according to the standardized testing position of the American Society of Hand Therapists (ASTH): seated subject, shoulders adducted and neutrally rotated, elbow flexed at 90°, wrist at 0-30° extension and 0-15° ulnar variation.11 The handlebar was set to the second position for all participants, except children younger than 6 years, who because of their smaller hand size were tested at the first position. Strength of key grip (or lateral grasp) and three-jaw chuck grip were measured with the Jamar® hydraulic pinch gauge (Lafayette Instrument Company, Lafayette, IN, USA). Figures 1-3 illustrate these grasps. During each session all three strength measurements were performed twice on each side, and all individual attempts were scored. Both devices were calibrated. Verbal encouragement was given to

- 69 -
Recovery of strength after reduced fractures
encourage participants to try their best. Participants were asked if they experienced pain, and if so, whether they could rate it using a numeric rating scale (NRS) ranging from 0 (no pain) to 10 (worst pain imaginable). For those who found this to be difficult a Faces Scale was used, which is based on the same principle as a visual analogue scale but uses smileys.12,13 Hand dominance was determined by asking which hand was used to write, or in the case of 4- and 5-year-olds which hand was used to draw a shape.
Statistical analysisDescriptive statistics were used to describe the main characteristics of the study population. For strength measurements the mean of the two attempts (grip, key or three-jaw chuck) of each hand was used in the analyses. To correct grip strength for the influence of hand dominance, the score of the affected hand was also compared to a calculated expected value of that hand (as if it were unaffected). This calculated value was derived from the adjusted scores of the unaffected hand according to findings from an earlier study by the current research group.14 Scores between hands were compared for each measurement session and further by type of treatment using the Wilcoxon signed rank test.
To examine in more detail if there were differences on pattern of recovery between children who underwent a different treatment, a mixed-model repeated measurements analysis was performed for possible confounders (age, gender, affected dominant hand, fracture type). Variables noteworthy of altering the 2 restricted log likelihood of grip strength were ultimately taken into the final model.
Finally, multivariate linear regression analyses were performed to establish if the variables treatment type, fracture type, cast immobilization, occurrence of unwanted events (re-displacement or complication) and degree of pain were associated with an increase in the ratio between affected grip strength and expected strength. To this end, a ratio variable was created by dividing the affected value by the previously mentioned calculated expected value at all three measurement points. Extent of strength increase was used as the dependent variable and was defined as the difference in this ratio variable between measurement sessions (T2 minus T1 and T3 minus T2). In these analyses, pain was defined as occurrence of pain at 6 weeks or 3 months after trauma respectively. Results were considered to be significant when the associated p-value was <0.05. Statistical procedures were conducted using SPSS 23.0 for Windows (IBM SPSS Inc.).
5

- 70 -
Chapter 5
Figure 1: Photo of grip strength grasp
Figure 2: Photo of key grip grasp
Figure 3: Photo of three-jaw chuck grasp

- 71 -
Recovery of strength after reduced fractures
RESULTS
Demographic characteristicsDuring the study period 97 children underwent an open or closed reduction of their fracture. Twenty children could not participate, 6 failed to meet criteria for inclusion, and another 14 could not be included due to other reasons (3 children had too extensive injuries, 5 families were not willing to participate, 4 children received follow-up in another hospital, and 2 families could not be reached for follow-up). Bilateral fractures occurred in 7.8% (N = 6) of children, all right-dominant. In 3 cases both fractures required repositioning and thus met criteria for inclusion. Since analysing these participants twice could induce dependency within the data, they were excluded. The final study population therefore comprised 74 participants. An enrolment flow diagram is shown in figure 4. The average age at which the fracture was sustained was 11.0 years (SD 3.6). The youngest participant was 4.6 years old, the oldest 17.5. Right-hand dominance was seen in 83.8% of the study population. Among the right-handed children a minority of 35.5% sustained a unilateral fracture on their dominant side, whereas in most left-handed children the dominant side was fractured, namely 66.7% of cases. A more detailed overview of the study population can be found in Table 1.
Table 1: Characteristics of the study population
Total Both-bone Radius Metacarpal Phalanx
N 74 37 17 9 11Mean age (SD) 11.0 (3.7) 9.0 (3.2) 11.8 (3.3) 14.3 (4.0) 10.9 (3.4)Male gender (%) 53 (71.6) 23 (62.2) 16 (94.1) 6 (66.7) 8 (72.7)Right-dominant (%) 62 (83.8) 30 (81.1) 14 (82.4) 9 (100.0) 9 (81.8)Dominant side affected (%) 29 (39.2) 14 (37.8) 9 (52.9) 5 (55.6) 3 (27.3)Treatment (%) CR 36 (48.6) 10 (27.0) 12 (70.6) 7 (77.8) 7 (63.6)
CRIF 26 (35.1) 20 (54.1) 3 (17.6) 2 (22.2) 1 (9.1)ORIF 12 (16.2) 7 (18.9) 2 (11.8) 3 (27.3)
Calendar age at the time the fracture was sustained.CR = closed reduction, CRIF = closed reduction internal fixation, ORIF = open reduction internal fixation.
In 16 participants an unwanted event occurred, either secondary dislocation or the endurance of a complication. In 10 participants angulation or rotation either did not improve or worsened, for which a secondary repositioning was performed. Complications were related to problems with Kirschner wires, imminent malunion or child factors (e.g. second trauma during treatment). Slightly more than half of the study population (53%) was pain-free within 6 weeks of trauma versus 76% at 3 months and 6 months after trauma. None of the participants experienced continuous pain – only in specific situations – and more importantly, none experienced pain while performing the measurements in this study.
5

- 72 -
Chapter 5
Assessed for eligibility (n = 97)
CR n = 36
Follow-up 3x n = 30 Follow-up 2x n = 6
Analysed (n = 36)
CRIF n = 26
Follow-up 3x n = 20 Follow-up 2x n = 6
Analysed (n = 26)
ORIF n = 12
Follow-up 3x n = 10 Follow-up 2x n = 1 Follow-up 1x n = 1
Analysed (n = 12)
Excluded (n = 23) - Not meeting inclusion criteria (n = 9) - Declined to participatie (n = 4) - Other reasons (n = 10)
Hoofdstuk 6
Figure 4: Enrolment Flow Diagram
Grip strengthFor all participants with a unilateral fracture, grip strength of the affected hand was compared to that of the unaffected hand at 3 measurement sessions. Overall, loss of strength amounted to 32.3% at 6 weeks, 12.8% at 3 months and 4.7% 6 months after trauma. This was analysed further by type of treatment. The average loss of strength amounted to 24.1%, 6.8%, and 0.2% for fractures that were treated by CR, versus 42.3%, 15.9%, and 4.9% respectively for fractures treated by CRIF. Finally, loss of strength for fractures treated by ORIF was more prominent, amounting to 37.3%, 20.0% and 10.2%. Results showed a significant difference between the strength of the affected and unaffected hand for all types of treatments at 6 weeks and 3 months after trauma. However, after 6 months only the ORIF group still showed a significant strength difference between the hands. An overview of these results can be found in Table 2.

- 73 -
Recovery of strength after reduced fractures
To correct for the influence of hand dominance, grip strength of the affected hand was further compared to that of the calculated expected value, which was derived from the scores of the unaffected hand as described in the Methods section. This analysis did not lead to any changes in significance compared to the results as shown in Table 2.
Table 2: Grip strength of the affected versus the unaffected hand by type of treatment.
Affected hand Unaffected hand
N Mean (kg) SD Min Max Mean (kg) SD Min Max Sig. (2-tailed)T1 Group 66 15.1 9.4 2.0 49.0 22.4 10.2 4.0 48.5 <0.001
CR 32 17.5 9.8 3.5 49.0 22.5 9.6 8.0 44.0 <0.001CRIF 23 10.3 6.4 2.0 28.5 19.7 10.3 4.0 39.0 <0.001ORIF 11 18.4 10.2 3.5 35.5 27.7 10.6 17.0 48.5 0.003
T2 Group 69 20.1 10.5 3.5 56.0 23.0 11.2 5.5 54.5 <0.001CR 33 23.3 12.0 8.5 56.0 24.8 11.7 9.5 54.5 0.008CRIF 25 15.3 7.1 3.5 31.0 19.0 10.0 5.5 42.0 0.001ORIF 11 21.2 8.3 10.0 41.0 26.7 10.6 12.5 54.5 0.004
T3 Group 63 23.1 10.0 6.5 53.5 24.2 10.8 8.0 54.5 0.011CR 31 26.1 11.1 8.0 53.5 26.3 11.3 8.0 54.5 0.507CRIF 21 18.1 7.8 6.5 32.0 19.6 9.9 10.0 49.5 0.161ORIF 11 24.0 6.4 16.0 37.0 27.2 8.3 15.5 45.5 0.020
CR = closed reduction, CRIF = closed reduction internal fixation, ORIF = open reduction internal fixation.
Key gripOverall loss of strength was 22.0% at 6 weeks, 6.9% at 3 months and 1.8% at 6 months after trauma. For fractures treated by CR a significant loss of strength in key grip could only be observed at T1 (12.5%). Loss of strength after sustainment of fractures treated by CRIF and ORIF at 6 weeks was more prominent, 30.6% and 32.0% respectively, decreasing to 14.4% and 13.8% at 3 months. In both groups this difference was significant. Six months after sustainment of the fracture, loss of strength for the ORIF group was still 13.5%. An overview of these results can be found in Table 3.
Three-jaw chuckOverall loss of strength amounted to 22.1% at 6 weeks, 4.7% at 3 months and 3.2% at 6 months after trauma. For both the CR and CRIF group a significant difference was limited to the 6-week measurement (17.7% and 33.1% respectively). By contrast, the ORIF group still showed a significant difference in strength at 3 months amounting to 14.5%. Six months after trauma no significant difference in strength could be observed in any of the groups. An overview of these results can be found in Table 4.
5

- 74 -
Chapter 5
Table 3: Key grip of the affected versus the unaffected hand by type of treatment.
Affected hand Unaffected hand
N Mean (kg) SD Min Max Mean (kg) SD Min Max Sig. (2-tailed)T1 Group 67 3.3 1.9 0.3 10.4 4.2 2.0 1.3 9.5 <0.001
CR 32 3.8 2.0 0.9 10.4 4.3 1.9 1.4 9.0 0.002CRIF 24 2.5 1.5 0.5 6.6 3.6 1.9 1.3 8.5 <0.001ORIF 11 3.6 1.5 0.3 6.1 5.3 2.2 2.5 9.5 0.005
T2 Group 68 4.2 1.9 0.5 9.8 4.5 1.9 1.0 9.8 0.001CR 33 4.5 2.1 1.0 9.8 4.5 1.8 1.0 8.1 0.549CRIF 24 3.4 1.7 0.5 7.4 4.0 1.9 1.4 8.8 0.001ORIF 11 4.7 1.4 2.6 7.5 5.5 2.1 2.1 9.8 0.032
T3 Group 61 4.6 2.0 1.3 11.4 4.7 2.1 1.5 11.0 0.360CR 30 5.3 2.1 1.5 11.4 5.1 2.2 1.5 11.0 0.309CRIF 21 3.7 1.7 1.3 7.4 3.8 1.7 1.5 8.0 0.294ORIF 10 4.9 1.4 2.9 7.3 5.6 1.8 2.4 9.1 0.041
CR = closed reduction, CRIF = closed reduction internal fixation, ORIF = open reduction internal fixation.
Table 4: Three-jaw chuck of the affected versus the unaffected hand by type of treatment.
Affected hand Unaffected hand
N Mean (kg) SD Min Max Mean (kg) SD Min Max Sig. (2-tailed)T1 Group 64 2.6 1.5 0.4 7.6 3.3 1.9 0.3 7.8 <0.001
CR 32 2.9 1.7 0.5 7.6 3.6 1.7 1.0 7.4 <0.001CRIF 22 2.0 1.3 0.3 5.3 3.0 2.0 0.3 7.8 0.013ORIF 10 2.7 1.4 1.3 6.1 4.0 1.9 1.3 7.3 0.008
T2 Group 68 3.4 1.8 0.5 8.9 3.6 1.9 0.6 9.0 0.082CR 33 3.8 2.2 0.9 8.9 3.8 2.0 0.9 9.0 0.836CRIF 24 2.8 1.3 0.5 5.0 3.0 1.7 0.6 5.9 0.109ORIF 11 3.5 1.8 1.8 7.8 4.1 2.1 1.8 9.0 0.018
T3 Group 61 4.0 1.7 1.1 9.1 4.2 1.8 1.3 8.6 0.401CR 30 4.7 1.8 1.4 9.1 4.8 1.9 1.8 8.6 0.705CRIF 21 3.1 1.5 1.1 5.9 3.1 1.4 1.3 6.8 0.951ORIF 10 4.0 1.0 2.4 5.4 4.6 1.3 2.3 6.3 0.155
CR = closed reduction, CRIF = closed reduction internal fixation, ORIF = open reduction internal fixation.

- 75 -
Recovery of strength after reduced fractures
Pattern of recovery of the affected hand between children who underwent a different treatmentA mixed-model repeated measurements analysis was performed to examine for differences in the pattern of strength recovery of the affected hand over time between participants who underwent different type of treatments (treatment x time). Time, age and gender were found to be of significant influence on all 3 grasps, and were therefore incorporated in the overall model. The dominant hand being affected and location of fracture were not of significant influence on strength recovery of the affected hand, hence removed from the model. Final results showed no difference in the pattern of recovery of the affected hand for any of the grasps over time between participants who received a different treatment. An overview of the p-values of this analysis of can be found in Table 5. Plots for the pattern of recovery for all three grasps can be found in the Supporting information (Fig S1-S3).
Table 5: P-values of variables associated with strength recovery of the affected hand for the different grasps over time.There is no significant difference in the pattern of recovery of the affected hand over time between participants undergoing different treatments (treatment x time).
Grip Key Three-jaw chuckIntercept 0.007 0.057 0.454Treatment 0.042 0.211 0.011Time <0.001 <0.001 <0.001Gender 0.001 0.009 <0.001Age <0.001 <0.001 <0.001Treatment x time 0.161 0.161 0.993
Factors associated with an increase in the ratio between affected grip strength and expected strengthMultivariate linear regression analyses were performed to establish which variables were associated with an increase in the ratio between affected grip strength and expected strength between the different measurement sessions. A larger ratio difference implies a larger strength increase towards ones expected (unaffected) strength during this timeframe, however not necessarily a better recovery as children with a larger delta could simply be worse off at the start of the timeframe. In the period of 6 weeks to 3 months female gender, type of fracture sustained (both-bone) and occurrence of an unwanted event showed to be significantly associated with a larger ratio difference. In the 3-6-month period the occurrence of an unwanted event still was associated with the increase in this ratio difference, whereas the same did no longer hold true for gender and type of fracture sustained. An overview of the p-values of these results can be found in Table 6. More detailed results from the performed analysis can be found in the Supporting information (Table S1).
5

- 76 -
Chapter 5
Table 6: P-values of variables associated with an increased ratio between affected grip strength and expected strength between 6 weeks and 3 months post-trauma (T1 to T2) and 3 months and 6 months post trauma (T2 to T3).
T1-T2 T2-T3Intercept 0.052 0.096Gender 0.021 0.802Fracture type 0.019 0.115Cast 0.163 0.545Unwanted event 0.038 0.009Age 0.876 0.833Pain 0.607 0.962
DISCUSSION
To our knowledge, this is the first study to prospectively focus on how strength recovers after reduced fractures of the forearm, wrist or hand in children. Results showed that loss of strength as compared to the value of the unaffected hand was more prominent and prolonged the more invasive the course of treatment, i.e. most extensive in the group receiving ORIF and least extensive in the group receiving CR only. In participants treated by CR, grip strength was significantly impaired up to 3 months after trauma whereas key grip and three-jaw chuck grip recovered within this period. Grip strength was similarly impaired in children treated by CRIF. Key grip was also still impaired in this group 3 months after trauma. In participants treated by ORIF, both grip strength and key grip were still significantly impaired 6 months after sustaining the fracture. Also, the three-jaw-chuck grip was impaired prolongedly compared to the other groups – up to 3 months. There was however no difference in pattern of recovery between the groups, all following a similar trend. Time passed since sustainment of the fracture, age and gender were of significant influence on the strength of the affected hand over time. The increase in ratio between the affected grip strength and expected strength between 6 weeks and 3 months was associated with female gender, type of fracture sustained (both-bone) and occurrence of an unwanted event. The difference is due to this ratio being lower at the beginning of this timeframe for participants who sustained a both-bone fracture or endured an unwanted event (they were more affected at the start). Between 3 and 6 months after trauma only the occurrence of an unwanted event was still significantly associated with an increase in this ratio. Although around 25% of participants still experienced pain both 3 months and 6 months after trauma, no association between pain score and ratio between affected and expected strength was found. This is most likely because none of the participants experienced pain performing the strength measurements. The presence of pain has thus not influenced the outcome of the strength measurements, but should nonetheless not be ignored as it concerns a substantial amount of children and could very well affect other (more prolonged or intensive) activities that fall beyond the scope of the current study.

- 77 -
Recovery of strength after reduced fractures
Comparison to previous literature is difficult because studies taking strength measurements into account are scarce. Roth et al. (2014) evaluated functional outcome after manipulation of previously reduced re-displaced forearm fractures versus conservative treatment (no secondary manipulation) 1-8 years post-injury.7 The study population was thus comparable to our CR group. Their study concluded that limitation of grip strength was minimal in both groups (3 kg in the re-manipulated and 1 kg in non-re-manipulated group). The CR group in the current study concurrently showed a limitation of 0.2 kg 6 months post-trauma. During a long-term follow-up Valencia et al. (2015) evaluated grip as well as pinch strength in 16 children who sustained nerve injuries due to a supracondylar fracture.15 They found significant loss of strength for both grip and pinch strength on the injured side, yet in 81% of cases the injured side corresponded with the non-dominant hand, which might have negatively influenced these results. Cramer et al. (1992) compared grip strength in children treated either by closed reduction and percutaneous pinning or open reduction and percutaneous pinning in 29 cases of displaced supracondylar humeral fractures.16 They calculated strength ratios (non-dominant/dominant strength) and found an average of 0.86 and 0.87 in children who injured their dominant or non-dominant extremity respectively. Comparisons of the current scores to both Valencia et al. (2015) and Cramer et al. (1992) would be inaccurate though, as these studies focus on an entirely different type of injury.15,16 Yung et al. (2004) evaluated grip strength in displaced diaphyseal forearm fractures on average 70 months post-trauma.6 In 76% of participants the grip strength of the affected hand was at least 95% that of the unaffected hand. The other 24% of participants scored between 70% and 90%. By comparison, in the current study this amounted to 43.9% and 29.8% respectively of participants with a radius or both-bone fracture 6 months after trauma. However, all these studies evaluated grip strength as an end result more than 1 year after trauma. Hence they offer no insight into recovery of strength during the initial months after trauma, whereas this is the focus of the current study. The same holds true for the study of Pershad et al. (2000), since it evaluated grip strength at the time of initial trauma only.4
Sinikumpu et al. 2013 also evaluated grip strength as an end result 9 to 14 years post-trauma. This was the only study using a control group to compare strength after sustainment of forearm shaft fractures in childhood.17 No significant difference in grip strength was found between patients (mean 43.9 kg) and controls (mean 43.9). Boutis et al. (2010) compared grip strength of the affected hand in children with a minimally angulated distal radius fracture and found no difference between the cast and the splint group, although no comparison with the unaffected hand was made.5 Davison et al. (2016) measured grip strength at 3, 6 and 12 weeks after sustainment of a fifth metacarpal neck fracture, finding decreased grip strength at 3 weeks (mean 10.5 kg) and 6 weeks (mean 3.8 kg) post-trauma in the ulnar gutter splint group and no significant differences (mean 0.6 kg) 12 weeks post-trauma.10 In the current study average loss of strength for all metacarpal fractures at 6 weeks and 3 months amounted to 6.1 kg
5

- 78 -
Chapter 5
and 3.1 kg respectively. This might suggest that the fifth digit contributes less to grip strength than the other digits, but might also be the result of an age difference between the two studies.
A strong point of the current study was that besides grip strength, other standardized strength measurements often used by hand therapists – namely key grip and three-jaw chuck – were evaluated. All measurements were obtained at set moments in time corresponding to usual follow-up appointments. The follow-up rate was very high, with only one child withdrawing from further follow-up after the first measurement session. The lowest percentage of children completing a grip measurement session during the entire study period was 91.0%, for key grip and three-jaw grip at 6 months. A limitation of the current study was the heterogeneity of the study population itself, namely a large variance in age, type of fracture and type of treatment. This is why even though the study population was rather substantial to offer a first insight into the recovery of strength, subgroup analyses nonetheless quickly led to small groups. Future research should concentrate on a larger or less heterogenic study population. Also, pinch strength was unfortunately not evaluated even though it was initially intended. Researchers established that this specific measurement was difficult to perform on the smaller children and moreover that the set of measurements became too extensive to maintain the child’s interest. Pinch strength was therefore eliminated from the study protocol after the first measurement sessions.
The current study had a descriptive nature, so no treatment alterations were made. The fact that the ORIF group scored worse than the CRIF (and the CRIF worse than the CR) might simply be a reflection of the severity of the fracture sustained. Therefore, the current study will not have consequences for the management of pediatric forearm fractures. However, the relation between treatment invasiveness and the duration and severity of strength loss has to our knowledge not been described previously. This combined with the trend from conservative treatment toward surgical intervention for displaced fractures of the forearm calls for further research into this topic.18-20 Ideally, a randomized controlled trial comparing recovery of strength between similar fractures (type, location and angulation) treated by means of different modalities should be conducted.
In conclusion, since the extent and duration of muscle strength loss for all strength measurements tend to be more prominent the more invasive the treatment chosen, as well as the fact that a large percentage of children still experience pain 6 months after trauma, referral to a hand therapist for additional guidance should be easily accessible to all children with a reduced fracture. In particular, referral should be considered when ORIF is chosen as the course of treatment.

- 79 -
Recovery of strength after reduced fractures
ACKNOWLEGDEMENTS
The authors thank all the children as well as their parents for participating in the current study. The researchers would also like to thank R.E. Steward for his assistance with statistics, B. Kamies for his assistance with measurements and M. Oude Alink for the photographs of the different grasps.
5

- 80 -
Chapter 5
REFERENCES
1. Lindstrom-Hazel D, Kratt A, Bix L. Interrater reliability of students using hand and pinch dynamometers. Am J Occup Ther. 2009;63(2):193-197.
2. Van den Beld WA, van der Sanden GA, Sengers RC, Verbeek AL, Gabreéls FJ. Validity and reproducibility of the jamar dynamometer in children aged 4-11 years. Disabil Rehabil. 2006;28(21):1303-1309.
3. Innes E. Handgrip strength testing: A review of the literature. Australian Occupational Therapy Journal. 1999;46:120-140.
4. Pershad J, Monroe K, King W, Bartle S, Hardin E, Zinkan L. Can clinical parameters predict fractures in acute pediatric wrist injuries? Acad Emerg Med. 2000;7(10):1152-1155.
5. Boutis K, Willan A, Babyn P, Goeree R, Howard A. Cast versus splint in children with minimally angulated fractures of the distal radius: A randomized controlled trial. CMAJ. 2010;182(14):1507-1512.
6. Yung SH, Lam CY, Choi KY, Ng KW, Maffulli N, Cheng JC. Percutaneous intramedullary kirschner wiring for displaced diaphyseal forearm fractures in children. J Bone Joint Surg Br. 1998;80(1):91-94.
7. Roth KC, Denk K, Colaris JW, Jaarsma RL. Think twice before re-manipulating distal metaphyseal forearm fractures in children. Arch Orthop Trauma Surg. 2014;134(12):1699-1707.
8. Jauregui JJ, Seger EW, Hesham K, Walker SE, Abraham R, Abzug JM. Operative management for pediatric and adolescent scaphoid nonunions: A meta-analysis. J Pediatr Orthop. 2017.
9. Teoh KH, Chee YH, Shortt N, Wilkinson G, Porter DE. An age- and sex-matched comparative study on both-bone diaphyseal paediatric forearm fracture. J Child Orthop. 2009;3(5):367-373.
10. Davison PG, Boudreau N, Burrows R, Wilson KL, Bezuhly M. Forearm-based ulnar gutter versus hand-based thermoplastic splint for pediatric metacarpal neck fractures: A blinded, randomized trial. Plast Reconstr Surg. 2016;137(3):908-916.
11. Balogun JA, Akomolafe CT, Amusa LO. Grip strength: Effects of testing posture and elbow position. Arch Phys Med Rehabil. 1991;72(5):280-283.
12. Tomlinson D, von Baeyer CL, Stinson JN, Sung L. A systematic review of faces scales for the self-report of pain intensity in children. Pediatrics. 2010;126(5):e1168-98.
13. Von Baeyer CL. Children’s self-reports of pain intensity: Scale selection, limitations and interpretation. Pain Res Manag. 2006;11(3):157-162.
14. Hepping AM, Ploegmakers JJ, Geertzen JH, Bulstra SK, Stevens M. The influence of hand preference on grip strength in children and adolescents; A cross-sectional study of 2284 children and adolescents. PLoS One. 2015;10(11):e0143476.
15. Valencia M, Moraleda L, Diez-Sebastian J. Long-term functional results of neurological complications of pediatric humeral supracondylar fractures. J Pediatr Orthop. 2015;35(6):606-610.
16. Cramer KE, Devito DP, Green NE. Comparison of closed reduction and percutaneous pinning versus open reduction and percutaneous pinning in displaced supracondylar fractures of the humerus in children. J Orthop Trauma. 1992;6(4):407-412.
17. Sinikumpu JJ, Pokka T, Serlo W. The changing pattern of pediatric both-bone forearm shaft fractures among 86,000 children from 1997 to 2009. Eur J Pediatr Surg. 2013;23(4):289-296.

- 81 -
Recovery of strength after reduced fractures
18. Eismann EA, Little KJ, Kunkel ST, Cornwall R. Clinical research fails to support more aggressive management of pediatric upper extremity fractures. J Bone Joint Surg Am. 2013;95(15):1345-1350.
19. Abraham A, Kumar S, Chaudhry S, Ibrahim T. Surgical interventions for diaphyseal fractures of the radius and ulna in children. Cochrane Database Syst Rev. 2011;(11):CD007907. doi(11):CD007907.
20. Vopat ML, Kane PM, Christino MA, et al. Treatment of diaphyseal forearm fractures in children. Orthop Rev (Pavia). 2014;6(2):5325.
5

- 82 -
Chapter 5
SUPPORTING INFORMATION
Pattern of recovery of the affected hand
0
1
2
3
4
5
T1 T2 T3
Kg CR
CRIF
ORIF
0
5
10
15
20
25
T1 T2 T3
Kg CR
CRIF
ORIF
Figure S1: Plot for the pattern of recovery of grip strength of the affected hand.
0
1
2
3
4
5
T1 T2 T3
Kg CR
CRIF
ORIF
0
5
10
15
20
25
T1 T2 T3
Kg CR
CRIF
ORIF
Figure S2: Plot for the pattern of recovery of key grip of the affected hand.
0
1
2
3
4
5
T1 T2 T3
Kg CR
CRIF
ORIF
Figure S3: Plot for the pattern of recovery of three-jaw chuck of the affected hand.

- 83 -
Recovery of strength after reduced fractures
Tabl
e S1
: Par
amet
er e
stim
ates
from
the
mul
tivar
iate
line
ar re
gres
sion
est
ablis
hing
if th
e w
hich
var
iabl
es w
ere
asso
ciat
ed w
ith a
n in
crea
se in
the
ratio
bet
wee
n aff
ecte
d gr
ip s
tren
gth
and
expe
cted
str
engt
h fo
r tim
e pe
riod
T1 to
T2
and
T2 to
T3.
T1 to
T2
95%
Wal
d CI
T2 T
o T3
95%
Wal
d CI
Para
met
erB
Std.
Err
orU
pper
Low
erSi
g.B
Std.
Err
orLo
wer
Upp
erSi
gIn
terc
ept
0.29
00.
1116
0.07
10.
509
0.00
90.
185
0.09
97-0
.011
0.38
00.
064
Gen
der
Mal
e-0
.119
0.05
13-0
.219
-0.0
180.
021
-0.0
120.
0466
-0.1
030.
080
0.80
2Fe
mal
e0a
0a
Frac
ture
Both
-bon
e0.
163
0.06
600.
034
0.29
20.
013
0.09
80.
0625
-0.0
240.
221
0.11
6Ra
dius
0.07
90.
0761
-0.0
710.
228
0.30
2-0
.021
0.06
68-0
.152
0.11
00.
751
Met
acar
pal
-0.0
200.
0887
-0.1
940.
154
0.81
90.
093
0.08
24-0
.068
0.25
50.
257
Carp
al0a
0a
Cast
No
-0.0
940.
0673
-0.2
260.
038
0.16
3-0
.035
0.05
85-0
.150
0.07
90.
545
Yes
0a0a
Unw
ante
d ev
ent
No
-0.1
260.
0605
-0.2
44-0
.007
0.03
8-0
.137
0.05
23-0
.239
-0.0
340.
009
Yes
0a0a
Age
0.00
10.
0068
-0.0
120.
014
0.87
6-0
.001
0.00
60-0
.013
0.01
00.
833
Pain
0.00
70.
0143
-0.0
210.
035
0.60
7-0
.001
0.01
37-0
.028
0.02
60.
962
(Sca
le)
,030
b0.
0053
0.02
10.
042
,022
b0.
0041
0.01
60.
032
5


6CHAPTER
Recovery of common post-traumatic symptoms, mobility and dexterity after
reduced paediatric fractures of the forearm, wrist or hand; a prospective
study
Ann M. HeppingB. Barvelink
Joris J.W. PloegmakersJob van der PalenJan H.B. GeertzenSjoerd S.K. Bulstra
Jorrit S. HarbersMarin Stevens
Submitted


7CHAPTER
General Discussion

- 102 -
Chapter 7
This thesis focuses on functional outcome during the recovery of angulated fractures of the forearm and hand in children and adolescents. With an overall goal to offer a better substantiated and more standardised set of outcome measures to be incorporated into future research, the first part of this thesis (Chapters 2 and 3) aims to provide interpersonal and intrapersonal reference values for one of the most important outcome measures reflecting hand function: grip strength. The second part of this thesis (Chapters 4, 5 and 6) investigates prospectively how grip strength and other outcome measures, such as mobility and dexterity, recover after increasingly invasive courses of treatment have been followed.
GRIP STRENGTH
Grip strength measurements have a well-established role in the assessment of hand function in adults, and are thus extensively used.1-5 They have a high inter-rater and test-retest reliability and are quickly obtainable.6-8 However, for the paediatric population representative normative data have not been readily available in the past. Chapter 2 addresses this hiatus by providing interpersonal reference values based on a large, random sample obtained according to current standardised testing procedures.
On a day-to-day (or clinical) basis though, especially for children with unilateral fractures, it might be better to utilise an intrapersonal difference in grip strength between the dominant and the non-dominant hand. Intrapersonal reference values automatically take the individual characteristics that determine strength into account. After all, as shown in Chapter 2, the most important personal factors associated with strength comprise age, height, weight and male gender. These variables are all likely to sort a similar attributing effect on the strength of both hands rather than one. The outcome of the regression analysis from Chapter 2 boosts this hypothesis, as the results for the factors correlated with strength prove to be very similar for either hand.
Chapter 3 investigates whether a strength difference in favour of the dominant hand exists in children, and whether such an advantage is different for left- and right-dominant boys and girls. Results bring forward another advantage of the use of intrapersonal reference values, namely that they do more justice to the minority of left-dominant children. As shown in Chapter 3, the strength difference in favour of the dominant hand for left-dominant boys and girls only amounts to 0% and 3%, respectively. By contrast, this difference amounts to 10% in both right-dominant boys and girls. Several studies measuring grip strength in adults have reported similar findings with respect to the ‘10% rule’ of hand dominance only being applicable to right-dominant males and females.9-11 One study from 2001 performed in minors even reported trends almost identical to our findings from Chapter 3, but when broken down by gender, age and hand dominance their subgroups were way too small to allow for statistical differences or conclusions.12 The latter argument unfortunately also holds true for other studies

- 103 -
General Discussion
performed in minors.13-16 Two studies that appeared after the publication of Chapter 3 stated that hand dominance does not influence grip strength, but these studies either did not analyse children of a different hand dominance separately or compared interpersonal instead of intrapersonal results.17,18 In Chapter 3 a large number of left-dominant children were included in each subgroup by age and gender, enabling us to draw new conclusions about this minority of children and to examine differences between left-dominant boys and girls in more detail. By sheer coincidence, the results make it relatively easy to calculate the expected grip strength value of the affected hand based on the value of the unaffected hand quickly by head, as long as your patient is not a left-dominant girl. But even in the latter case, such a calculation would be much less time-consuming than having to fill in patients’ data into normative data graphs.
In conclusion, when possible, intrapersonal instead of interpersonal reference data on grip strength should be used, as the former are more accurate plus easier to obtain. Our advice thereby follows that of the American Medical Association and the American Association of Hand Therapists, although the mentioned lack of representative normative data also played an important role in recommending intrapersonal data.19,20
STRENGTH MEASUREMENTS
The way strength recovers after sustaining angulated paediatric fractures of the upper extremity has not previously been the specific scope of research. Strength measurements are used predominantly as an outcome parameter to either compare the affected hands between two different types of treatment groups or to compare the affected to the unaffected hand in the setting of a long-term follow-up evaluation.21-24 However, neither comparison gives any actual information about the recovery process of strength itself, as strength could very well be diminished in both treatment groups or be severely affected in the first months (or years) post-injury. In this thesis, recovery of grip strength is evaluated prospectively for both non-reduced fractures in Chapter 4 and reduced fractures in Chapter 5. Results show that for non-reduced fractures grip strength is significantly affected up to 6 months post-injury. By that point strength of the affected hand already amounted to 97% of that of the unaffected hand, and this remained unchanged one year post-injury. This difference could very well be attributed to hand dominance, which was not taken into account as an additional factor due the relatively small study population. The difference in grip strength between both hands up to 6 months post-injury is nonetheless evident. Moreover, Chapter 4 shows that grip strength is associated with extent of angulation. We have not found any other studies assessing this connection.
Chapter 5 further examines the recovery of grip strength for reduced fractures by increasingly invasive types of treatments. Results show that grip strength is more impaired the more invasive the course of treatment given – in other words, most
7

- 104 -
Chapter 7
extensive for open reduction with internal fixation (ORIF), intermediate for closed reduction with percutaneous pinning (CRIF), and least extensive for closed reduction without internal fixation (CR). Grip strength was still significantly diminished at six months post-injury in the ORIF group, while this did not hold true for the CRIF and CR groups.
Chapter 5 additionally investigates recovery of strength of the key grip and three-jaw-chuck grip, showing similar results for the inverse relation between recovery of strength and treatment invasiveness described for grip strength. For all strength measurements, both extent and duration of muscle strength loss were more prominent the more invasive the treatment chosen. However, key grip normalised at 3 months for the CR group, and the three-jaw chuck normalised at 3 months for both the CR group and the CRIF group. In other words, it seems these measurements can be used in conjunction with each other with the three-jaw chuck normalising the earliest, followed by key grip and lastly grip strength. This is a new finding, as no other studies have assessed how these outcome measures recover over time. It would be worthwhile to further examine this finding in future studies (and perhaps even different types of pathologies). For angulated fractures of the forearm though, the three-jaw chuck grip will not likely differentiate between treatment groups beyond 6 weeks post-injury. Its use as an outcome measure in the recovery after angulated forearm fractures is therefore less suited.
Finally, for those who are wondering why tip-to-tip pinch strength was not evaluated in any of the chapters of this thesis, it proved to be a very complex grip. We were not able to obtain a reliable measurement in a vast number of younger children, so we decided to remove it as outcome parameter. Other studies investigating strength measurements in children under the age of 6 have reported similar problems with tip-to-tip pinch strength, choosing to only measure grip strength and key grip.14,25 Hence we logically advise against incorporating tip-to-tip pinch in future studies that include children younger than 6 years; its value in recovery after paediatric forearm fractures in older children is not established. In conclusion, incorporating grip strength as an outcome measure, possibly in combination with key grip, has the highest sensitivity to change and will provide the most important information in the recovery after angulated fractures.
MOBILITY MEASUREMENTS
Recovery of mobility of the elbow, forearm and wrist was also evaluated prospectively for both non-reduced (Chapter 4) and reduced (Chapter 6) angulated forearm fractures. Six weeks post-injury both studies found all movements distal from the elbow to be significantly diminished compared to the unaffected hand. Most affected fractures after non-reduction were supination and pronation, followed by palmar flexion, all with a maximum limitation of 10°. For fractures treated by means of reduction,

- 105 -
General Discussion
supination and palmar flexion were the most affected (18° limitation), followed by dorsal flexion and pronation with 15 and 13° limitation, respectively. Chapter 6 shows that 3 months post-injury, pronation and palmar flexion are still significantly diminished after reduced fractures, although by then the limitation had decreased below 10° for both movements. Pronation and palmar flexion are the only movements significantly influenced by the course of treatment chosen (the ORIF group was associated with the worst outcome). Six months post-injury no significant differences in favour of the unaffected hand were found. Chapter 4 shows that for non-reduced fractures pronation and supination are still significantly diminished 6 months post-injury, although only by 4.1 and 2.5°, respectively. Most likely, the reason why such a small difference turned into a significant result in the non-reduced study as opposed to the reduced study is the fact that pronation and supination were measured with a goniometer in the non-reduced study of Chapter 4 and with an inclinometer in the study of Chapter 6, which was performed later. The standard deviations in the first study with respect to these two measurements were specifically more than twice as low as in the second study, which probably caused these small differences to become significant. Perhaps arbitrarily, we feel that such small limitations (below 5°) should not be considered clinically relevant.
Reason for the introduction of the grip inclinometer to measure forearm rotations was an attempt to obtain more reliable results. Pronation and supination assessment by goniometer are more challenging than assessment of the other measurements, since a bony landmark between the levers is absent and the distance over which the lever can be positioned is small. This challenge is reflected in the literature, with multiple studies examining which of several goniometry methods is most reliable, as well as testing the reliability of smartphone applications, visual estimation, or measurement of a pencil held in the subject’s hand.26-29 Two of these studies show that goniometry is more reliable than visual estimation or the handheld pencil method.26,29 Interestingly, another study showed that a mobile phone held in a selfie stick had both higher test-retest and inter-rater reliability than goniometry and the handheld pencil method.28 Not only that: the setup used in that study was almost identical to the use of our inclinometer. We observed that children quickly find out that the device can be rotated slightly further by lowering the grip of their fifth digit, but when comparing the mean supination scores of the unaffected hands from Chapter 4 (94.5°) and Chapter 6 (95.6°), the difference was only marginal. In conclusion, based on existing literature and the current thesis we cannot give a clear answer as to which of these two methods is most reliable.
In conclusion, the extent of mobility impairment is slightly larger in the reduced than in the non-reduced study. Limitations can be considered mild for both groups 3 months post-injury, and no clinical or other meaningful limitations could be assessed 6 months post-injury. Moreover, unlike grip strength, mobility did not show an association with degree of fracture angulation. Measurements of pronation and palmar flexion will
7

- 106 -
Chapter 7
differentiate the best on functional recovery of mobility between different courses of treatment, but most likely only up to 3 months post-injury.
Comparison of these findings to other studies is difficult, as they are very scarce. Retrospective studies on reduced fractures have shown mild limitations in pronation and supination of less than 10° and negligible restrictions in dorsal and palmar flexion of the wrist over one year post-injury.22,24 One prospective study conducted specifically on angulated both-bone fractures described that limitations of 20° in the pronation-to-supination range of motion do exist 6 months post-injury.30 Results showed that both re-fractures and diaphyseally located fractures were associated with these increased limitations. In our study no re-fractures occurred in reduced fractures, and no significant differences exist in either pronation or supination between distal metaphyseal and diaphyseal fractures 6 months post-injury.
OTHER OUTCOME PARAMETERS
Lastly, Chapter 6 prospectively evaluates the recovery of dexterity and a pre-defined set of post-traumatic symptoms, namely pain, swelling, redness, hypertrichosis, temperature asymmetry, reduced sensitivity and allodynia. For post-traumatic symptoms no significant differences were found between the treatment groups, probably due to the low number of children in the ORIF group. The incidence of pain and reduced sensitivity did seem to show a trend corresponding with treatment invasiveness, and pain and hypertrichosis showed to be common symptoms in children that persist over time. We consider it worthwhile for future studies to further investigate these three symptoms in more detail. By contrast, dexterity – as tested by means of the nine-hole peg test – seems to be an unsuitable test for recovery of hand function after fractures. Scores of both hands improved significantly over time (suggesting a learning effect), no significant differences between affected and unaffected hand were found beyond 6 weeks post-injury, and no association between test score and course of treatment was found.
STRENGTHS AND LIMITATIONS
In research strengths and limitations are often determined by power, and Chapter 2 and Chapter 3 ambiguously take the saying ‘strength lies in numbers’ to a new level. To our knowledge, we have conducted the largest study ever on the obtainment of normative data on grip strength in children, ensuring that each subgroup when broken down by age and gender included a sufficient number of children. Results are presented in similar fashion as children’s growth curves. The plotted percentiles facilitate an at-a-glance determination of what can or cannot still be considered as normal. Because results are shown by gender, hand-dominance and age, adequate comparison over longer periods of time is made possible. These graphics can be of particular use for comparison to

- 107 -
General Discussion
children who endured a complication or children with bilateral fractures, although the curves can of course be used for a much broader range of conditions. With over 2200 children participating, more substantiated statements for the minority of left-dominant boys and girls could be made, and the 10% rule of had dominance could be challenged for children for the first time.
Another strength of this thesis is that all studies on recovery after paediatric fractures were conducted prospectively. Although this might seem like a small step, when it comes to research on angulated paediatric fractures of the upper extremity this can be considered as somewhat of a leap. Prospective studies on this topic are simply extremely rare, let alone those that take functional recovery into account. Children in our studies were measured at pre-defined moments in time, according to the same protocols and by the same researchers, thereby minimizing intra-rater and inter-rater differences.
Finally, this thesis contains several novelties. Chapter 4 is to our knowledge the first study to prospectively investigate fracture remodelling in paediatric non-reduced angulated forearm fractures for functional outcome. Chapter 5 is the first study to prospectively focus on recovery of strength after reduced fractures of the forearm, wrist or hand, and Chapter 6 is the first study to evaluate a pre-defined set of post-traumatic symptoms, dexterity and a broad set of mobility measurements according to increasingly invasive courses of treatment followed.
When strength lies in numbers, weaknesses will often lie in the lack thereof. While heterogeneity was a close friend in those studies focusing on normative data, it became our foe in the fracture studies. As stated in the introduction of this thesis, reaching numbers with power is difficult when measuring boys and girls with diverging growth potentials, at different ages, with different fractures and varying angulations, and undergoing different treatments initiated by different physicians. Hence the study population for both the non-reduced fractures from Chapter 4 (N = 26) and the reduced fractures when broken down into subgroups by treatment from Chapter 5 (N = 12-36) and Chapter 6 (N = 9-23) can be considered small and heterogeneous. However, as stated before, prospective studies on functional recovery after reduced paediatric forearm fractures are extremely rare, and the results from these three studies provide not only new information but also better guidance for future research.
Another limitation is that all studies in this thesis are descriptive by nature, hence no treatment alterations or allocations were made. Suiting several aims of this thesis, namely to provide insight into how commonly used outcome measures actually recover in children, and to provide an easy and quickly obtainable yet substantiated and standardised set of outcome measures, there is a pitfall. Correlation does not equal causation – cum hoc ergo propter hoc: worse outcome is not necessarily caused
7

- 108 -
Chapter 7
by a more invasive course of treatment. One could very well argue that the inverse relation found between several outcome measures and treatment invasiveness is simply a reflection of the severity of the injury sustained. After all, more extensive injuries are more likely to cause functional limitations and thus warrant more invasive treatments. The current thesis cannot provide a definitive answer for this chicken-and-egg paradox, as the descriptive nature of the various studies is not suited to investigate causality. On the other hand, in order to actually investigate causality properly in future studies, one first has to know what should be measured, when it should be measured, and what it should be compared to – and this is where the present thesis comes into play. Still, we can, and will, provide an educated guess by stating that treatment invasiveness is at least partially to blame for poorer functional outcome. First, because no treatment allocations were made there will irrevocably be overlap in severity of fractures between treatment groups. In other words, the fractures included in the different studies and subgroups form a continuum rather than distinct ordinal groups. It is thus not unlikely for differences in outcome between these groups to be at least partially caused by the severity of the treatment undergone. Treading even more carefully, functional results from this thesis at least do not advocate for a more invasive course of treatment.
RECOMMENDATIONS
When working towards a standardisation of testing procedures we suggest measuring children at 6 weeks, 3 months and 6 months post-injury, and additionally at 1 year if treatment by ORIF falls within the scope of the study. For grip strength we advise use of a handheld dynamometer and the testing position as advocated by the American Society of Hand Therapists. This position comprises a seated subject with shoulders adducted and neutrally rotated, elbow flexed at 90°, and wrist between 0 and 30° extension and 0 and 15° ulnar variation.20 Additionally, as elaborated in Chapter 2 and Chapter 3 we recommend using the mean of two instead of three attempts when working with children. Studies have shown that this does not lead to significant differences in results, plus it is less time-consuming for the researcher and less burdensome for the child.9,31,32 It proved to be a challenge to keep children focussed on a rather repetitive task, especially when a broader set of measurements was being obtained. For children aged 4 and 5, we furthermore advise setting the handlebar to the first instead of the second position, since they have smaller hands and have trouble reaching the second setting (as has also been described by others14,17). We feel that verbal encouragement should be given, not only to motivate children to do their best but also because this simply makes them feel more comfortable. Hand dominance should be taken into account. For studies evaluating children in the first 3 months post-injury, key grip could be added as an outcome measure. For measurements of mobility we deem the incorporation of pronation, supination and palmar flexion as sufficient. Lastly, we would advise further investigating the association of pain, reduced sensitivity and hypertrichosis with treatment invasiveness.

- 109 -
General Discussion
FUTURE PERSPECTIVES
Results of this thesis, carefully treading towards a less invasive treatment rather than a more invasive one, are consistent with the very few other existing studies that examine related topics. Eismann et al. (2013) reviewed abstracts on paediatric upper extremity fractures presented at the Pediatric Orthopaedic Society of North America and the American Academy of Orthopaedic Surgeons between 1993 and 2013.33 Results showed that the vast majority of level I and II studies (91%) advised less invasive or at most neutral treatments rather than more aggressive ones. The authors concluded that ‘research fails to support the trend towards increasingly aggressive treatment of paediatric upper extremity fractures’, as also described in the introduction of this thesis.33 Thereafter, Roth et al. (2014) found that re-manipulation of re-angulated distal forearm fractures in children under age 12 did not improve outcome on angulation, grip strength, mobility or pain in a long-term functional and radiographic assessment. Authors deemed re-manipulations in children younger than 12 as unnecessary, and moreover concluded that current guidelines on acceptable angulations for children over 12 are too strict.22 Unfortunately, most other studies that included functional outcome are retrospective, comparing or focussing on different stabilisation methods in children undergoing the most invasive treatment, namely open reduction with internal fixation.34
Back to the future is back to the drawing board. When to accept, reduce or operate (and how) remains the question at hand, almost literally. Future research should focus more on the effects on functional recovery when moving the dividing (arbitrary) lines between two successive treatments towards the least invasive option, rather than comparing outcome between different surgical stabilisation methods after performing an open reduction. Examples are expansion of the acceptable angulations previous to performing a reduction, as well as limits on acceptable re-angulation before reverting to internal fixation. Either way, from a clinical perspective as soon as ORIF is on the table more extensive and prolonged limitations can or rather should be expected, and in our opinion referral to a hand therapist should be seriously considered.
CONCLUSIONS
Grip strength measurements are a well-established outcome measure in the assessment of hand function. Known to have a high intra-rater and inter-rater reliability, they are also easily and quickly obtainable in children. This thesis provides both interpersonal and intrapersonal reference values of grip strength for children and adolescents. Intrapersonal data is easier to obtain and, more important, has higher accuracy, as it automatically takes the individual characteristics that determine strength into account. Compared to other strength measurements, namely key grip and three-jaw chuck, grip strength is more sensitive to change. The extent as well as the duration of strength loss is more prominent the more invasive the treatment and, lastly, grip strength is
7

- 110 -
Chapter 7
associated with fracture angulation whereas range of motion is not. Hence the role of grip strength measurements in the evaluation of recovery after angulated paediatric fractures seems to be undervalued in comparison to mobility measurements.
Loss of mobility of elbow, forearm and wrist can be considered mild with an overall average below 20° in the reduced study and below 10° in the non-reduced study at 6 weeks post-injury. Measurements of pronation and palmar flexion can be of value, as they are significantly impaired up to 3 months post-injury and show to be associated with the undergone treatment. Similarly to strength, an inverse relation was seen between extent of impairment and invasiveness of treatment.
The recovery of the post-traumatic symptoms of pain, reduced sensitivity and hypertrichosis warrants further investigation. Although a trend was observed in relation to treatment invasiveness, the number of children in the ORIF group was too small to yield significant differences between treatment groups. We consider the nine-hole peg test to be an unsuitable test for recovery of hand function after fractures.
Results of this thesis advocate towards a less invasive treatment rather than a more invasive one, or at least cannot support the trend towards more aggressive treatments. Future research should focus more on the effects on functional recovery when moving the dividing (arbitrary) lines between two successive treatments towards the least invasive one.

- 111 -
General Discussion
REFERENCES
1. Bohannon RW. Muscle strength: Clinical and prognostic value of hand-grip dynamometry. Curr Opin Clin Nutr Metab Care. 2015;18(5):465-470.
2. Beumer A, Lindau TR. Grip strength ratio: A grip strength measurement that correlates well with DASH score in different hand/wrist conditions. BMC Musculoskelet Disord. 2014;15:336-2474-15-336.
3. Innes E. Handgrip strength testing: A review of the literature. Australian Occupational Therapy Journal. 1999;46:120-140.
4. Nguyen A, Vather M, Bal G, et al. Does a hand strength-focused exercise program improve grip strength in older patients with wrist fractures managed nonoperatively?: A randomized controlled trial. Am J Phys Med Rehabil. 2020;99(4):285-290.
5. Leong DP, Teo KK, Rangarajan S, et al. Prognostic value of grip strength: Findings from the prospective urban rural epidemiology (PURE) study. Lancet. 2015;386(9990):266-273.
6. Mathiowetz V, Weber K, Volland G, Kashman N. Reliability and validity of grip and pinch strength evaluations. J Hand Surg Am. 1984;9(2):222-226.
7. Van den Beld WA, van der Sanden GA, Sengers RC, Verbeek AL, Gabreëls FJ. Validity and reproducibility of the jamar dynamometer in children aged 4-11 years. Disabil Rehabil. 2006;28(21):1303-1309.
8. Lindstrom-Hazel D, Kratt A, Bix L. Interrater reliability of students using hand and pinch dynamometers. Am J Occup Ther. 2009;63(2):193-197.
9. Crosby CA, Wehbé MA, Mawr B. Hand strength: Normative values. J Hand Surg Am. 1994;19(4):665-670.
10. Petersen P, Petrick M, Connor H, Conklin D. Grip strength and hand dominance: Challenging the 10% rule. Am J Occup Ther. 1989;43(7):444-447.
11. Incel NA, Ceceli E, Durukan PB, Erdem HR, Yorgancioglu ZR. Grip strength: Effect of hand dominance. Singapore Med J. 2002;43(5):234-237.
12. De Smet L, Vercammen A. Grip strength in children. J Pediatr Orthop B. 2001;10(4):352-354.13. Newman DG, Pearn J, Barnes A, Young CM, Kehoe M, Newman J. Norms for hand grip
strength. Arch Dis Child. 1984;59(5):453-459.14. Bear-Lehman J, Kafko M, Mah L, Mosquera L, Reilly B. An exploratory look at hand
strength and hand size among preschoolers. J Hand Ther. 2002;15(4):340-346.15. Molenaar HM, Selles RW, Zuidam JM, Willemsen SP, Stam HJ, Hovius SE. Growth diagrams
for grip strength in children. Clin Orthop Relat Res. 2010;468(1):217-223.16. Omar MT, Alghadir A, Al Baker S. Norms for hand grip strength in children aged 6-12
years in Saudi Arabia. Dev Neurorehabil. 2015;18(1):59-64.17. Shetty M, Balasundaran S, Mullerpatan R. Grip and pinch strength: Reference values for
children and adolescents from India. J Pediatr Rehabil Med. 2019;12(3):255-262.18. McQuiddy VA, Scheerer CR, Lavalley R, McGrath T, Lin L. Normative values for grip and
pinch strength for 6- to 19-year-olds. Arch Phys Med Rehabil. 2015;96(9):1627-1633.19. American Medical Association. Guides to the evaluation of permanent impairment (4th
ed.) Chicago. 1993.20. Fess E. Grip strength. American Society of Hand Therapists: Chicago Clinical Assessment
Recommendations (2nd ed ). 1992.
7

- 112 -
Chapter 7
21. Boutis K, Willan A, Babyn P, Goeree R, Howard A. Cast versus splint in children with minimally angulated fractures of the distal radius: A randomized controlled trial. CMAJ. 2010;182(14):1507-1512.
22. Roth KC, Denk K, Colaris JW, Jaarsma RL. Think twice before re-manipulating distal metaphyseal forearm fractures in children. Arch Orthop Trauma Surg. 2014;134(12):1699-1707.
23. Yung SH, Lam CY, Choi KY, Ng KW, Maffulli N, Cheng JC. Percutaneous intramedullary kirschner wiring for displaced diaphyseal forearm fractures in children. J Bone Joint Surg Br. 1998;80(1):91-94.
24. Teoh KH, Chee YH, Shortt N, Wilkinson G, Porter DE. An age- and sex-matched comparative study on both-bone diaphyseal paediatric forearm fracture. J Child Orthop. 2009;3(5):367-373.
25. Dianat I, Feizi H, Hasan-Khali K. Pinch strengths in healthy Iranian children and young adult population. Health Promot Perspect. 2015;5(1):52-58.
26. Colaris J, van der Linden M, Selles R, Coene N, Allema JH, Verhaar J. Pronation and supination after forearm fractures in children: Reliability of visual estimation and conventional goniometry measurement. Injury. 2010;41(6):643-646.
27. Karagiannopoulos C, Sitler M, Michlovitz S. Reliability of 2 functional goniometric methods for measuring forearm pronation and supination active range of motion. J Orthop Sports Phys Ther. 2003;33(9):523-531.
28. Santos C, Pauchard N, Guilloteau A. Reliability assessment of measuring active wrist pronation and supination range of motion with a smartphone. Hand Surg Rehabil. 2017;36(5):338-345.
29. Gajdosik RL. Comparison and reliability of three goniometric methods for measuring forearm supination and pronation. Percept Mot Skills. 2001;93(2):353-355.
30. Colaris JW, Allema JH, Reijman M, et al. Which factors affect limitation of pronation/supination after forearm fractures in children? A prospective multicentre study. Injury. 2014;45(4):696-700.
31. Coldham F, Lewis J, Lee H. The reliability of one vs. three grip trials in symptomatic and asymptomatic subjects. J Hand Ther. 2006;19(3):318-26; quiz 327.
32. Haidar SG, Kumar D, Bassi RS, Deshmukh SC. Average versus maximum grip strength: Which is more consistent? J Hand Surg Br. 2004;29(1):82-84.
33. Eismann EA, Little KJ, Kunkel ST, Cornwall R. Clinical research fails to support more aggressive management of pediatric upper extremity fractures. J Bone Joint Surg Am. 2013;95(15):1345-1350.
34. Westacott DJ, Jordan RW, Cooke SJ. Functional outcome following intramedullary nailing or plate and screw fixation of paediatric diaphyseal forearm fractures: A systematic review. J Child Orthop. 2012;6(1):75-80.

- 113 -
General Discussion
7


8CHAPTER
Summary
Nederlandse samenvatting
Dankwoord
About the author

- 116 -
Chapter 8

- 117 -
Summary
SUMMARY
In contrast to adults, achieving perfect anatomic alignment in angulated forearm fractures is not nearly always a necessity for growing children. Depending on their remaining growth potential, children’s bones have the unique capability to remodel. Unfortunately, there is no high-level evidence to guide us on when to accept, reduce or operate such fractures. Moreover, while the scarce studies that have been conducted advocate less invasive rather than more invasive courses of treatment, inexplicably resorting to surgical intervention appears to be turning into an upward trend. Research into this topic is hindered by the imminent heterogeneity of the study population and the fact that potential interventions have to be applied initially on minors. There is also a lack of consensus and uniformity regarding outcome measures as to what should be measured, how and when. The scope of this thesis focuses on outcome measures of functional recovery after angulated fractures of the forearm in children and adolescents.
Chapter 2 provides reference values for grip strength according to age, gender and hand dominance, based on a large, heterogenetic sample of the paediatric and adolescent population (ages 4-15). The association between grip strength and age, gender, weight and height was examined. Grip strength showed a linear and parallel progression for both boys and girls until the ages of 11 or 12, after which its development showed an acceleration that was more prominent in boys. There was a significant difference in grip strength with each ascending year of age in favour of the older group, as well as a trend for boys to be stronger than girls in all age groups between ages 4 and 15. Besides age and gender, weight and especially height had a strong association with grip strength.
Chapter 3 elaborates on the intrapersonal difference in grip strength between dominant and non-dominant hand. Earlier research in adults shows the dominant hand to be approximately 10% stronger than the non-dominant hand. This ‘10% rule’ was challenged for both left- and right-dominant boys and girls (ages 4-17) separately, thereby providing more insight into the minority of left-dominant children. Results showed that right-dominant boys and girls scored significantly higher with their dominant hand, the difference amounting to 9.5 and 10.1%, respectively. Left-dominant girls also scored significantly higher with their dominant hand, albeit less prominently (3.0%). For left-dominant boys no significant difference in favour of either hand was found. Left-dominant children scored highest with their non-dominant hand or tied scores on both hands more frequently than right-dominant children. In conclusion, the 10% rule of hand dominance is applicable to right-dominant children ranging in age between 4 and 17 years, but not to left-dominant children.
Chapter 4 gives a first impression of the remodelling capacity in non-reduced paediatric forearm fractures based on radiological and functional outcome. Children aged 0 to 14 years with a traumatic angular deformation of either the radius or the radius and ulna
8

- 118 -
Chapter 8
were included in this prospective cohort study. Radiographs were taken and functional outcome was assessed at five fixed follow-up appointments throughout a one-year period. Mean dorsal angulation at time of presentation amounted to 12° (5-18) and diminished after one year to a mean angulation of 4° (0-13). Grip strength, pronation and supination were significantly diminished compared to the unaffected hand up to six months post-injury. One year post-trauma, no significant differences in function between the affected and the unaffected arm were found. Lastly, grip strength was associated with fracture angulation whereas range of motion was not. In conclusion, non-reduced angulated paediatric forearm fractures have the potential to remodel in time and have good radiographic and functional outcome one year after trauma, with pronation and grip strength taking the longest to recover.
Chapter 5 investigates prospectively how strength recovers after reduced fractures of the forearm, wrist or hand. Grip strength, key grip and three-jaw chuck grip were measured twice in each hand at 6 weeks, 3 months and 6 months post-trauma. Loss of strength was more prominent and prolonged the more invasive the treatment, hence most extensive in the group receiving open reduction with internal fixation (ORIF), intermediate in the group receiving closed reduction with percutaneous pinning, and least extensive in the group undergoing closed reduction without internal fixation. Besides time passed post-injury, gender and age were of significant influence on strength, but no differences in the pattern of recovery over time between children receiving different treatments was found. In the period of 6 weeks to 3 months after trauma, female gender, type of fracture sustained and occurrence of an unwanted event were associated with an increased ratio between affected and expected grip strength. For the later phase of recovery, between 3 and 6 months, this was only true for the occurrence of an unwanted event.
Chapter 6 prospectively evaluates the recovery of a pre-defined set of post-traumatic symptoms; mobility of elbow, forearm and wrist; and dexterity of both hands after reduced forearm fractures. Pain, swelling and especially hypertrichosis proved to be common post-traumatic symptoms in children. Although they tended to persist, symptoms showed a clear decrease over time, only affecting a minority of children after 6 months. Incidence of pain and reduced sensitivity showed a trend corresponding with invasiveness of treatment chosen. All movements distal from the elbow joint showed to be significantly restrained at 6 weeks post-trauma. The movements most affected concerned supination and palmar flexion, followed by dorsal flexion and pronation. Palmar flexion and pronation were still significantly affected at 3 months post-trauma. By contrast, all other movements measured had normalized by this point. Palmar flexion and pronation were also the only movements significantly influenced by the course of treatment chosen (the ORIF group was associated with the worst outcome). Overall, average loss of mobility for all movements was less than 20°. Dexterity of the affected hand was measured by means of the Nine Hole Peg Test and showed to be significantly

- 119 -
Summary
diminished at 6 weeks post-trauma. No such difference could be ascertained at 3 months or 6 months post-trauma. Hence the Nine Hole Peg Test seems unsuitable for measuring recovery of hand function after paediatric forearm fractures.
Chapter 7 discusses the most important findings of this thesis along with its strengths and weaknesses, as well as recommendations for future research. It shows that, with respect to reference values for grip strength, intrapersonal data is easier to obtain and more accurate than interpersonal data, as the former automatically takes the individual characteristics that determine strength into account. Compared to other strength measurements – in this case key grip and three-jaw chuck – grip strength showed to be more sensitive to change. The role of grip strength measurements in the evaluation of recovery after angulated paediatric fractures is undervalued. The extent as well as the duration of strength loss was more prominent the more invasive the treatment, and grip strength showed to be associated with fracture angulation whereas range of motion was not.
Loss of mobility of forearm and wrist can be considered mild, with an overall average below 20° in the reduced study and below 10° in the non-reduced study 6 weeks post-injury. Pronation and palmar flexion were significantly impaired up to 3 months post-injury and showed to be associated with treatment invasiveness. Similarly to strength, an inverse relation was seen between extent of impairment and invasiveness of treatment. Lastly, the recovery of the post-traumatic symptoms pain, reduced sensitivity and hypertrichosis warrants further investigation. Although a trend was observed in relation to treatment invasiveness, the number of children in the most invasive group was too small to yield significant differences between treatment groups.
In conclusion, for the recovery of paediatric forearm fractures we advise measuring grip strength, pronation and supination of the forearm and palmar flexion of the wrist according to standardized testing procedures, as described in the individual chapters, at 6 weeks, 3 months and 6 months post-injury. Age, gender and hand dominance are factors that have to be taken into account, and the association of pain, reduced sensitivity and hypertrichosis in relation to treatment invasiveness has to be further investigated. Overall results of this thesis advocate towards a less invasive treatment rather than a more invasive one, or at least (in line with other scarce studies) cannot support the trend towards more aggressive treatments. Future research should focus on the effects on functional recovery when moving the angulation-based dividing lines between two successive treatments in favor of the least invasive one, rather than comparing outcome between different surgical stabilisation methods after performing an open reduction. Either way, in terms of clinical perspectives, as soon as open reduction with internal fixation (ORIF) is on the table, more extensive and prolonged limitations can or rather should be expected, and referral to a hand therapist should be thoroughly considered.
8

- 120 -
Chapter 8

- 121 -
Nederlandse Samenvatting
NEDERLANDSE SAMENVATTING
In tegenstelling tot bij volwassenen is het bereiken van een perfecte anatomische uitlijning in het geval van geanguleerde onderarmfracturen bij nog groeiende kinderen lang niet altijd noodzakelijk. Afhankelijk van het nog resterende groeipotentiaal hebben de botten van kinderen het unieke vermogen om te remodelleren. Helaas is er geen hoogwaardig bewijs dat als eenduidige leidraad kan dienen wanneer dergelijke angulaties te accepteren, reponeren of opereren. Hoewel incidenteel uitgevoerde studies eerder pleiten voor minder in plaats van meer invasieve methoden van behandeling, lijkt chirurgische interventie desalniettemin (en onverklaarbaar) een steeds populairdere keuze te worden. Onderzoek in het kader van onderarmfracturen bij kinderen wordt gehinderd door de onoverkomelijke heterogeniteit van een potentiële studiepopulatie en het feit dat eventuele interventies initieel op minderjarigen moeten worden toegepast. Voorts is er geen consensus noch uniformiteit omtrent uitkomstparameters: wat moet gemeten worden, wanneer en hoe? Het huidige proefschrift richt zich op daarom het laatste: uitkomstparameters van functioneel herstel na geanguleerde fracturen van de onderarm in kinderen en adolescenten.
Hoofdstuk 2 levert referentiewaarden voor knijpkracht naar leeftijd, geslacht en handdominantie gebaseerd op een grote, heterogene steekproef van de minderjarige populatie (leeftijd 4-15). De associatie tussen knijpkracht enerzijds en leeftijd, geslacht, gewicht en lengte anderzijds werd onderzocht. Knijpkracht toonde een lineaire en parallelle progressie voor zowel jongens als meisjes tot de leeftijd van 11 of 12 jaar, waarna diens verdere ontwikkeling een versnelling vertoonde die prominenter was bij jongens. Er bestond een significant verschil in knijpkracht met elk oplopend levensjaar ten gunste van de oudere groep, als ook een trend voor jongens om sterker te zijn dan meisjes in alle leeftijdsgroepen. Naast leeftijd en geslacht bleken gewicht en in het bijzonder lengte een sterke associatie met knijpkracht te hebben.
Hoofdstuk 3 wijdt verder uit over de intrapersoonlijke verschillen in knijpkracht tussen de dominante en de niet-dominante hand. Eerder uitgevoerd onderzoek bij volwassen heeft aangetoond dat de dominante hand ongeveer 10% sterker is dan de niet-dominante hand. Deze ‘10% regel’ wordt getest voor zowel links- als rechts-dominante jongens en meisjes (leeftijd 4-17), waardoor meer inzicht wordt gegeven in de verschillen voor de (in de minderheid zijnde) links-dominante kinderen. Resultaten toonden dat rechts-dominante jongens en meisjes significant hoger scoren met hun dominante hand, waarbij het verschil respectievelijk 9.5 en 10.1% bedroeg. Links-dominante meisjes scoorden ook significant hoger met hun dominante hand, maar het verschil was minder prominent (3.0%). Voor links-dominante jongens werd geen significant verschil in knijpkracht tussen de twee handen gevonden. Links-dominante kinderen scoorden vaker hoger met hun niet-dominante hand of even hoog met beide handen dan rechts-dominante kinderen. Concluderend, de 10%-regel met betrekking
8

- 122 -
Chapter 8
tot handdominantie is toepasbaar voor rechts-dominante kinderen in de leeftijd van 4 tot 17 jaar, maar niet voor links-dominante kinderen.
Hoofdstuk 4 geeft een eerste indruk over de capaciteit tot remodellering van niet-gereponeerde onderarmfracturen bij kinderen op basis van radiologische en functionele uitkomstmaten. Kinderen in de leeftijd van 0 tot 14 jaar met een traumatische angulaire deformiteit van ofwel de radius ofwel de radius en ulna werden geïncludeerd in deze prospectieve cohort studie. Röntgenfoto’s en functioneel herstel werden beoordeeld tijdens vijf vastgestelde follow-up afspraken gedurende een periode van één jaar. Gemiddelde dorsale angulatie ten tijde van presentatie bedroeg 12° (5-18) en verminderde na één jaar tot een gemiddelde angulatie van 4° (0-13). Knijpkracht, pronatie en supinatie waren, in vergelijking met de onaangedane hand, significant verminderd tot zes maanden na het ongeval. Een jaar na trauma werden geen significante verschillen in functie tussen de aangedane en onaangedane zijde gevonden. Tot slot bleek knijpkracht geassocieerd te zijn met fractuurangulatie, terwijl dit niet gold voor mobiliteit. Concluderend, niet-gereponeerde onderarmfracturen bij kinderen hebben de potentie om te remodelleren over tijd en tonen goede radiologische en functionele uitkomsten één jaar na trauma, waarbij pronatie en knijpkracht het langzaamst herstellen.
Hoofdstuk 5 onderzoekt prospectief hoe kracht herstelt na gereponeerde fracturen van de onderarm, pols of hand. Knijpkracht, sleutelgreep en driepuntsgreep werden beiderzijds gemeten 6 weken, 3 maanden en 6 maanden na trauma. Krachtverlies was prominenter en langduriger naarmate de ondergane behandeling invasiever was. Aldus meest extensief in de groep die een open repositie met interne fixatie onderging (ORIF), tussenliggend in de groep die een gesloten repositie met interne fixatie onderging en het minst extensief in de groep die een gesloten repositie zonder fixatie onderging. Naast verstreken tijd na trauma waren geslacht en leeftijd van significante invloed op kracht. Er werd echter geen verschil gevonden in het patroon van herstel over tijd tussen de verschillende groepen op basis van behandelingsmodaliteit. In de periode van 6 weken tot 3 maanden na trauma waren het vrouwelijk geslacht, type fractuur en het optreden van een ongewenste gebeurtenis (complicatie of tweede trauma) geassocieerd met een toegenomen ratio tussen de aangedane en verwachte onaangedane knijpkracht. Voor de latere fase van herstel, tussen 3 en 6 maanden, was dit alleen nog het geval voor het optreden van een ongewenste gebeurtenis.
Hoofdstuk 6 evalueert prospectief het herstel van een vooraf gedefinieerde set van post-traumatische symptomen, mobiliteit van elleboog, onderarm en pols en behendigheid van beide handen na gereponeerde fracturen van de onderarm. Pijn, zwelling en met name hypertrichosis bleken veel voorkomende post-traumatische symptomen te zijn bij kinderen. Hoewel zij over langere tijd neigen te bestaan, toonden alle symptomen een duidelijke afname over tijd en was slechts een minderheid aangedaan na 6 maanden. De

- 123 -
Nederlandse Samenvatting
incidentie van pijn en sensibiliteitsproblemen vertoonden een trend corresponderende met de invasiviteit van de ondergane behandeling. Zes weken na trauma waren alle bewegingen distaal van de elleboog significant verminderd ten opzichte van de niet-aangedane zijde. Meest aangedaan waren supinatie en palmairflexie, gevolgd door dorsaalflexie en pronatie. Palmairflexie en pronatie bleken nog steeds significant te zijn aangedaan 3 maanden na trauma, ten tijde waarvan alle andere bewegingsuitslagen zich reeds hadden genormaliseerd. Voorts waren palmairflexie en pronatie de enige bewegingen die significant werden beïnvloed door de ondergane behandeling (de ORIF groep was geassocieerd met de slechtste uitkomst). Over het geheel bedroeg het gemiddelde verlies in mobiliteit voor alle bewegingen minder dan 20°. Behendigheid van de aangedane hand werd gemeten middels de ‘nine hole peg test’ en bleek significant verminderd tijdens de meting 6 weken na trauma. Na 3 en 6 maanden konden geen verschillen worden vastgesteld tussen beide handen. De ‘nine hole peg test’ lijkt daarom een ongeschikte uitkomstmaat om herstel in handfunctie na onderarmfracturen te evalueren.
Hoofdstuk 7 bespreekt de belangrijkste bevindingen van dit proefschrift met diens sterke en zwakke punten, als ook de aanbevelingen voor toekomstig onderzoek. Besproken wordt dat met betrekking tot referentiewaarden voor knijpkracht intrapersoonlijke data makkelijker te verkrijgen is en voorts betrouwbaarder is dan interpersoonlijke data, omdat intrapersoonlijke data automatisch de individuele karakteristieken die kracht bepalen meeneemt. In vergelijking met andere krachtmetingen, in dit geval sleutelgreep en driepuntsgreep, toonde knijpkracht sensitiever te zijn voor verandering. De rol van knijpkracht metingen in de evaluatie van herstel na geanguleerde onderarmfracturen bij kinderen wordt ondergewaardeerd. De mate en de duur van krachtsverlies waren prominenter naarmate de ondergane behandeling invasiever was. Voorts toonde knijpkracht een associatie met de fractuurangulatie terwijl dit niet gold voor de gewrichtsmobiliteit.
Het mobiliteitsverlies van onderarm en pols kan als mild worden beschouwd en bedroeg 6 weken na trauma minder dan 20° voor alle bewegingen bij de gereduceerde fracturen en minder dan 10° bij niet-gereduceerde fracturen. Pronatie en palmairflexie waren significant aangedaan tot 3 maanden na trauma en waren geassocieerd met de invasiviteit van de ondergane behandeling. Gelijkend aan de uitkomsten ten aanzien van kracht werd een omgekeerde relatie gevonden tussen de mate van beperking en de invasiviteit van de behandeling. Tot slot is nader onderzoek naar het herstel van de post-traumatische symptomen pijn, afgenomen sensibiliteit en hypertrichosis gerechtvaardigd. Hoewel een trend werd geobserveerd in relatie tot invasiviteit van de behandeling, was het aantal kinderen in de meest invasieve groep (ORIF) te klein om tot significante verschillen tussen de groepen te leiden.
8

- 124 -
Chapter 8
Concluderend, in het kader van herstel na onderarmfracturen bij kinderen adviseren wij om knijpkracht, pronatie en supinatie van de voorarm en palmairflexie van de pols te meten, volgens gestandaardiseerde procedures (zoals beschreven in de individuele hoofdstukken) 6 weken, 3 maanden en 6 maanden na trauma. Leeftijd, geslacht en handdominantie zijn factoren die meegenomen moeten worden en de associatie van pijn, afgenomen sensibiliteit en hypertrichosis in relatie tot invasiviteit van de behandeling moet nog nader worden onderzocht. Over het algemeen pleiten de resultaten van dit proefschrift eerder richting een minder invasieve dan een meer invasieve behandelrichting. Voorzichtiger gesteld kan dit proefschrift in ieder geval niet de trend richting meer agressieve behandelingsmodaliteiten ondersteunen, waarbij het zich aansluit bij de aanbevelingen van andere (schaarse) studies over dit onderwerp. Toekomstig onderzoek zou zich moeten richten op de gevolgen op het functioneel herstel wanneer de op angulatie gebaseerde afkappunten tussen twee opvolgende behandelingen verplaatst worden ten gunste van de minst invasieve optie in plaats van zich te richten op verschillende wijzen van chirurgische stabilisatie na het verrichten van een open repositie. Voor de dagelijkse praktijk geldt dat wanneer gekozen wordt voor ORIF extensievere en langdurigere beperkingen in de lijn der verwachting liggen en een verwijzing naar een handtherapeut weloverwogen dient te worden.

- 125 -
Nederlandse Samenvatting
8

- 126 -
Chapter 8

- 127 -
Dankwoord
DANKWOORD
Deelnemende kinderen, jongeren en hun ouders & verzorgersAllereerst gaat mijn grootste dank uit naar alle kinderen en jongeren die mee hebben gedaan aan de verschillende onderzoeken. Zonder jullie deelname was dit boekje er immers nooit gekomen! Wat waren jullie dapper om je na zo’n nare breuk extra lang door ons te laten onderzoeken. Wat waren jullie fanatiek bij de ‘pinnetjestest’ en wat heb ik veel plezier beleefd van alle enthousiaste spierbalposes die jullie aan ons lieten zien bij de krachtmetingen. Natuurlijk wil ik graag ook jullie ouders en verzorgers bedanken voor de overweldigende positieve reacties, de vrijgemaakte agenda’s en zeker ook voor alle heerlijke koppen koffie bij velen van jullie thuis aan de keukentafel. Tot slot dank aan alle scholen die de deuren voor ons openden voor het knijpkracht onderzoek en de leerkrachten wiens les we in het kader van de wetenschap hiervoor geheel verstierden.
PromotorenProf. dr. S.K. Bulstra, beste Sjoerd, je aanvaardde het idee om een promotietraject te starten met veel enthousiasme. Dankbaar ben ik voor de grote vrijheid die je mij gegeven hebt om dit project op te zetten; een vrijwel geheel eigen invulling, in eigen tempo. Daar vaar ik het best bij, maar of ik nu een periode ‘voor de wind’ of ‘in de wind’ voer, je stuurde altijd subtiel en rustig bij waar het nodig was. Je hebt me altijd positief bekrachtigd en me elke keer weten te motiveren om door te zetten, ik heb dat als heel prettig ervaren.
Prof. dr. J.H.B. Geertzen, beste Jan, nauwgezet, accuraat, minutieus; voor de precisie – als ook de snelheid – waarmee jij documenten door kan nemen is een neologisme vereist. Op een antwoord hoefde ik bovendien nooit lang te wachten en daar jouw positieve eindoordeel een goede graadmeter bleek voor de rest van de groep, bood me dat vaak het nodige vertrouwen. Voorts ben ik er oprecht trots op om als revalidatiearts te zijn opgeleid in het UMCG.
Dr. M. Stevens, beste Martin, naast de ‘kunde van het genezen’ krijgen wij ethiek, statistiek en zelfs een stuk wet- en regelgeving onderwezen, maar tussen het schrijven van een scriptie en een wetenschappelijk artikel zit toch nog een heel verschil. De etiquette omtrent het schrijven leerde ik van jou. Wanneer een ander mij vraagt “Hoe heurt het eigenlijk?” dan weet ik tot mijn eigen verbazing inmiddels vaak het antwoord. Jouw consistente benadering maakt dat je zelf een steeds solidere eigen onderlegger creëert. Je maakte altijd tijd voor mij vrij en hielp me altijd constructief verder, ik heb veel van je geleerd.
8

- 128 -
Chapter 8
BeoordelingscommissieProf. dr. C.K. van der Sluis, Prof. dr. P.C. Jutte en Prof. dr. R.M. Castelein, heel hartelijk dank voor het beoordelen van mijn manuscript.
Mede auteursJoris. Coassistent, AIOS, staflid, promovendus. Consequent steeds één stapje verder op de ladder heb je mij altijd met raad en daad bijgestaan. Op persoonlijk vlak lijk ik soms ook in je (toch wat grotere) voetsporen te lopen. Van buren in de prachtige Bergstraat te Groningen, via Enschede en Australië, afscheid nemend van stedelijke geneugten in een plattelandsdorp met partner, kleine boef en overenthousiast huisdier. Wat werken we al lang (en prettig) samen. Ik hoop dat onze paden zich nog vaak zullen blijven kruizen.
Britt. Je kwam eigenlijk voor een stage wetenschap van 20 weken. Na een stoomcursus ging je op pad met een rode rugzak tot de nok toe gevuld met meetapparatuur. Vanzelfsprekend braken er steeds groepjes kinderen tegelijk hun arm en hadden wij maar één set apparatuur. Wat volgde was een ingewikkelde agenda vol met ‘wie meet wie waar’ afspraken en ‘rugzak ruilmomenten’. Je had grote toewijding voor het project en bleef ook na afloop van je stage helpen waar je kon. Ik vond het heel gezellig dat je me achterna gekomen bent naar Enschede, ook al was het dan van korte duur. Nu start je aan je eigen promotietraject over onderarmfracturen, een groter compliment kan je me als begeleider niet geven en als vriend kan ik niet trotser op je zijn.
Jorrit. Warme herinneringen koester ik aan alle traumatologie besprekingen waar ik, destijds nog als AIOS en vaak met een broodje frikandel in de hand, aanschoof. Boeiende casuïstiek, lange en leerzame discussies op het scherpst van de snede, met enige regelmaat eindigend in: ‘Maar ik moet het opereren, dus ik doe het toch zo.’ Ik heb veel van en bij jullie geleerd, me altijd uitermate welkom gevoeld en daarnaast ook vooral verschrikkelijk veel gelachen. Hoewel ons originele plan van een gemeenschappelijke ‘fracturenstraat’ logistiek nog een brug te ver bleek, was de traumatologie een beetje mijn tweede thuis in het UMCG en heeft onze samenwerking alsnog tot meerdere wetenschappelijke projecten geleid. Dank dat je die met mij wilde aangaan.
Prof. dr. J. van der Palen, beste Jop, mijn promotietraject kwam in een sneltreinvaart nadat jij betrokken raakte. Processen die daarvoor maanden duurden werden ineens in 2 uurtjes afgetikt. Jij had aan een half woord genoeg om te begrijpen wat ik bedoelde en vice versa kon ik ineens toveren met een syntax. Soms moet je blijkbaar het geluk hebben om iemand te vinden die dezelfde taal spreekt. Op nog veel gezamenlijke artikelen!
RoessinghDankbaar ben ik voor het feit dat mijn wetenschappelijke ambities ondersteund worden door mijn leidinggevenden: Ronald Spanjers, Marc van Gestel en Sytske Nawijn.

- 129 -
Dankwoord
Prof. dr. J.S. Rietman, beste Hans, voor mede-onderschrijven van de noodzaak voor onderzoekstijd met het oog op het toekomstige onderzoeksactiviteiten. Anneke, mijn externe geheugen en vangnet zonder wie ik (figuurlijk) onthand zou zijn. Tot slot Martin, collega, kamergenoot en maatje, voor de prachtige foto’s en het aanhoren van menige aan onderzoek gerelateerde frustratie. Nu is het jouw beurt.
VriendenHet leven is niets zonder vriendschap. Loeke en Behrouz, mijn mede musketiers, dank voor de werkelijk excessieve hoeveelheid plezier die ons samenzijn altijd teweeg brengt, voor alle goede adviezen, maar ook voor de steun in moeilijkere tijden. Ik hoop dat 2021 ons weer wat vaker kan samenbrengen, anders zit er niets anders op dan Loeke maar naar Roessingh te ontvoeren. Susanne, Heleen en Rosalie, ik ken jullie al sinds jullie ‘broekies’ waren en andersom. Nachten doorhalen in de Peperstraat maakten plaats voor nachten doorhalen op werk en nu in toenemende mate voor nachten doorhalen thuis voor het kleine grut. Gelukkig hebben we de foto’s nog, maar zonder geinen, wat is het fijn om nog altijd zulke fijne meiden om me heen te hebben. Jet, Matthijs, Karin en Jeroen: spelletjesweekenden! Het kan eigenlijk niet vaak genoeg, lang genoeg of ingewikkeld genoeg (al dragen alle heerlijke versnaperingen natuurlijk ook bij aan de feestvreugde). Ik vind het onwijs gezellig met jullie! De Geelens: Ank, Wim, Eva, Sebastiaan, Laura, Koen en Max. Een jaar zonder gezamenlijk meerdaags pre-pasen en pre-kerst feest in Stavoren is er oprecht één om snel te vergeten. Noaste noabers, Jeroen en Renate, hoezo beter een goede buur dan een vriend als het ook gewoon allebei kan?
FamilieLieve pa en lieve opa en oma, dank dat jullie me altijd gesteund en geholpen hebben. Zonder jullie was ik nooit zover gekomen. Doorsnee is het niet gegaan, maar ik vind het heel mooi en ook bijzonder dat we, samen met Johan, Arna, Nico, Lianne, Tjerk en Paulien, nog altijd zo hecht zijn met elkaar. Lieve mama, lieve Henri, ik mis jullie het meest wanneer er iets te vieren valt, zo ook zeker nu.
Lieve Maarten, fantastische vent, de tijd vliegt met jou. Dank dat je mijn ambities zo ondersteunt en dat je enthousiast wordt van dezelfde dingen als ik. Veel belangrijker, dank dat we samen zoveel leuke dingen doen, dat je zo goed voor ons zorgt en dat je zo’n goede man en vader bent. We hebben de laatste jaren heel wat doorgemaakt, hele mooie en hele verdrietige momenten, maar wat staan wij samen sterk. Noralie, mijn grootste, kleinste, mooiste en allerliefste vriendin. Als ik je een paar uur niet zie, dan mis ik je al. Voor jou zorgen is echt verreweg het allerleukste dat er is. Nu krijg je er binnenkort een vriendje of vriendinnetje bij, ik hoop dat we met z’n allen ontelbaar veel plezier zullen beleven op onze mooie nieuwe stek.
8

- 130 -
Chapter 8
ABOUT THE AUTHOR
Ann Marjolein Hepping was born on September 11th 1984 in Purmerend, the Netherlands. In 2003, she obtained her high school diploma at the Menso Alting College in Hoogeveen. Thereafter, she started studying medicine at the University of Groningen. During her bachelor’s phase she was active in several student participation and representation bodies, amongst which the ‘education and research council’ of the University Medical Center Groningen. Her interest for the musculoskeletal system was sparked during the internships that followed in the years thereafter, during which she developed a particular interest in orthopaedic surgery, trauma surgery and - last but certainly not least - physical medicine and rehabilitation. She obtained her master degree in 2011. Following her graduation she shortly worked in Leeuwarden, but soon thereafter started the residency program in physical medicine and rehabilitation at the University Medical Center Groningen (UMCG). Along with her research group she started several prospective studies on recovery after paediatric forearm fractures during her residency, and continued her research activities as an external PhD-candidate after completing the program in 2016. Since then she works as a paediatric physiatrist in Roessingh Center for Rehabilitation with a particular interest in congenital limb reduction defects, plexus and traumatic hand problems, and neuromuscular diseases. She combines her clinical practice with board activities for the ‘medical staff’ within Roessingh, and hopes to continue research activities in the coming years. Marjolein lives in Saasveld with Maarten en their daughter Noralie. They are currently – very happily – expecting another addition to their family.


