IRRIGATION AND DRAINAGE Misr J. Ag. Eng., October 2017 - 1549 - GROUND-BASED REMOTE SENSING FOR ESTIMATING THE MOISTURE CONTENT OF DIFFERENT SOIL TYPES Elsayed, S. (1) and M. I. Ghazy (2) ABSTRACT Soil moisture information has been used for irrigation scheduling, site- specific management of diseases and pests, and improving crop yield prediction. Spectral remote sensing offers the potential to provide more information for making better-informed management decisions in real time. In contrast, the tradition methods for irrigation management such as tensiometers and oven dry for estimating moisture content are generally time consuming, numerous observations are required to characterize them. The aim of this study was to investigate the suitability of hyperspectral reflectance sensor to estimate the moisture content of different soils. For that the spectral indices of soil were tested to assessment the moisture content by wetted the soil from dry to saturation conditions. The results showed that the three water spectral indices R 960 /R 940 , R 970 /R 940 and R 970 /R 900 showed close and highly significant associations with moisture content of sandy soil, and coefficients of determination reach up to R 2 = 0.98. The three water spectral indices R 878 /R 862 , R 956 /R 926 and R 1056 /R 994 showed close and highly significant associations with moisture content of sandy loam soil, and coefficients of determination reach up to R 2 = 0.84. As well as the three water spectral indices R 956 /R 924 , R 956 /R 926 and R 956 /R 9284 showed close and highly significant associations with moisture content of clay soil, and coefficients of determination reach up to R 2 = 0.86. In conclusion, the use of spectral remote sensing may open an avenue in irrigation management for fast, high-throughput assessments of water status of soil samples. Key words: irrigation, precision, soil water content, remote sensing, precision agriculture, spectral indices, 1 Assoc. Prof. of Agric. Eng., Evaluation of Natural Resources Department, Environmental Studies and Research Institute, Sadat City University. 2 Lecturer of Agric. Eng., Faculty of Agric., Mansoura University. Misr J. Ag. Eng., 34 (4-1): 1549 - 1564
Transcript
IRRIGATION AND DRAINAGE
Misr J. Ag. Eng., October 2017 - 1549 -
GROUND-BASED REMOTE SENSING FOR
ESTIMATING THE MOISTURE CONTENT OF
DIFFERENT SOIL TYPES
Elsayed, S. (1)
and M. I. Ghazy
(2)
ABSTRACT
Soil moisture information has been used for irrigation scheduling, site-
specific management of diseases and pests, and improving crop yield
prediction. Spectral remote sensing offers the potential to provide more
information for making better-informed management decisions in real
time. In contrast, the tradition methods for irrigation management such
as tensiometers and oven dry for estimating moisture content are
generally time consuming, numerous observations are required to
characterize them. The aim of this study was to investigate the suitability
of hyperspectral reflectance sensor to estimate the moisture content of
different soils. For that the spectral indices of soil were tested to
assessment the moisture content by wetted the soil from dry to saturation
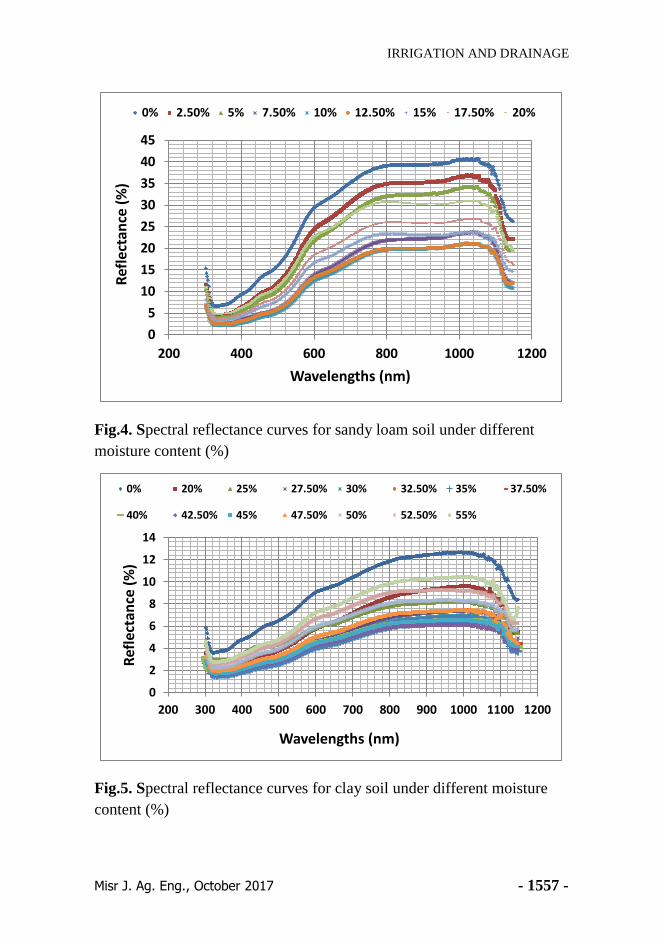
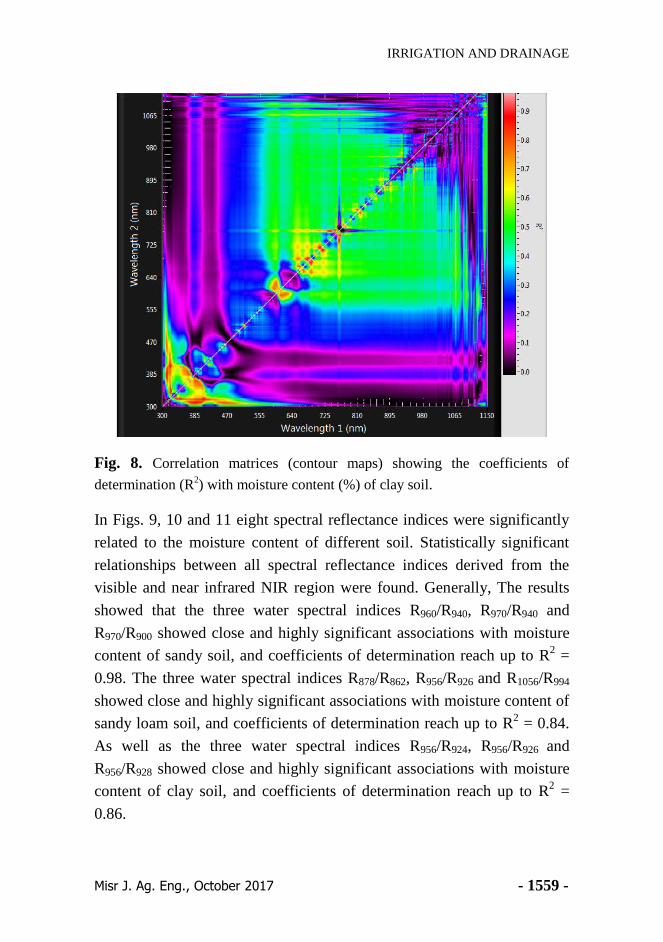
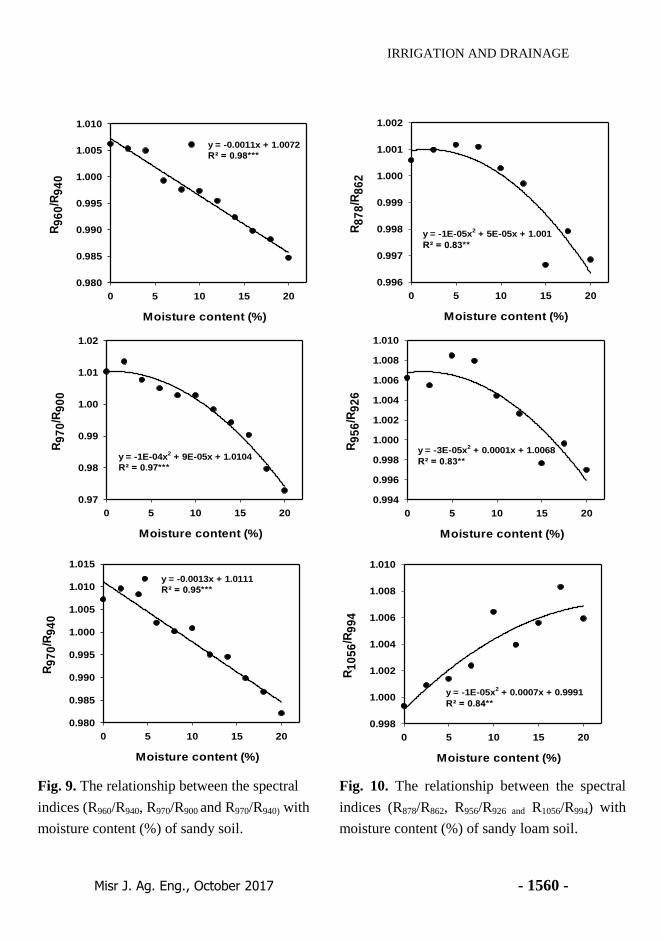
conditions. The results showed that the three water spectral indices
R960/R940, R970/R940 and R970/R900 showed close and highly significant
associations with moisture content of sandy soil, and coefficients of
determination reach up to R2 = 0.98. The three water spectral indices
R878/R862, R956/R926 and R1056/R994 showed close and highly significant
associations with moisture content of sandy loam soil, and coefficients of
determination reach up to R2 = 0.84. As well as the three water spectral
indices R956/R924, R956/R926 and R956/R9284 showed close and highly
significant associations with moisture content of clay soil, and
coefficients of determination reach up to R2 = 0.86. In conclusion, the use
of spectral remote sensing may open an avenue in irrigation management
for fast, high-throughput assessments of water status of soil samples.
Key words: irrigation, precision, soil water content, remote sensing,
precision agriculture, spectral indices,
1Assoc. Prof. of Agric. Eng., Evaluation of Natural Resources Department,
Environmental Studies and Research Institute, Sadat City University. 2Lecturer of Agric. Eng., Faculty of Agric., Mansoura University.
Misr J. Ag. Eng., 34 (4-1): 1549 - 1564
IRRIGATION AND DRAINAGE
Misr J. Ag. Eng., October 2017 - 1550 -
1. INTRODUCTION
oil moisture is a main variable in land surface hydrology. Soil
moisture has very important implications for agriculture, ecology,
wildlife, and public health and is probably (after precipitation) the
most important connection between the hydrological cycle and life
animal, plant, and human. Soil moisture information has been used for
irrigation management, site-specific management of diseases and pests,
and improving crop yield prediction. In arid and semiarid watersheds, soil
moisture content has been used as a surrogate indicator of general plant
health. Applied application of soil moisture information is the
determination of mobility with lightweight vehicles. The gravimetric
method is one of the most simple and intensive way of it. However, more
progressive technologies are widespread to detect water management. For
example tensiometers, which shows the matrix potential of soils based on
the soil moisture content (Tóth, 1995). Another common method to
determine soil water content is the measurement of the spread velocity of
waves in soil. These methods include the "Time Domain Reflectometry"
(TDR) method which is based on determination of the radio-frequency
electromagnetic wave propagation velocity (Rajkai, 2004). These
methods are time-consuming and require numerous observations to
characterize a field. Likewise, for detecting water relation and salinity
parameters in the soil, numerous observations are required to characterize
a field. In addition, classical methods are unsuitable to tracking frequent
changes in environmental conditions, which requires rapid measurements
(Elsayed et al., 2015; El-Hendawy et al. 2015; Richbeck et al., 2016). In
contrast, the techniques of based ground remote sensing such as passive
reflectance sensor could potentially contribute to enhance selection
procedures of water status because they are very cost-effective, allow for
rapid measurements with non-invasive sampling. From the remote sense
techniques, a passive reflectance sensor was used in this study. The
passive sensor systems depend on sunlight as a source of light in contrast
to active sensors, which are equipped with light-emitting components that
provide radiation in specific waveband regions (Kipp et al. 2014). Passive
sensors allow hyperspectral information of target to be obtained in the
visible and near-infrared range. In one of the earliest reports, Woolley
S
IRRIGATION AND DRAINAGE
Misr J. Ag. Eng., October 2017 - 1551 -
(1971) identified the visible spectra (VIS; 400 – 700 nm) as being suitable
for this purpose. Reflectance changes in the near infrared region (NIR;
700 – 1,300 nm) can also be used for the detection of water in biological
samples because the NIR penetrates more deeply into the measured
structures than middle infrared (SWIR; 1,300 – 2,500 nm). As such, the
reflectance indicates the water content more of the entire sample rather
than of water located in the uppermost layers (Peñuelas et al. 1993). In the
SWIR, the strongest absorption properties of water molecules are found at
1,450, 1,940, and 2,500 nm (Carter 1991). It is a well-known that the
reflectance of soil generally increases with the wavelength. The rate of
this is related to other physical and chemical properties of soil. Based on
the earlier results, organic matter content, moisture content, parent
material, the presence of colour chemical, soil texture, size of the soil
particles and salt content are the most important factors which determine
the reflectance. These factors are complex, changeable and there is
relationship among them. General observations that increase in organic
matter and water content of the soil decrease the reflectance properties in
the wavelength range of 0.4-2.5 microns. Humus is the major determinant
of the reflectance, if the humus content of soil is more than 2%. The
reflectance decrease in 1.3-1.5 and 1.75-1.95 micron intervals is the result
of the absorption of water content in soil. The soil surface moisture
content is one of most rapidly changing parameters, which is depending
on physical, chemical and biological qualities of soils and environmental
effects (Csornai-Dalia, 1991). The main effect of moisture is observed on
the middle infrared (MIR) range (Belényesi, 2008). The reflectance value
(from soil reflectance curve) is mainly influenced by soil moisture and
mineral structure. Furthermore, the reflectance increases within higher
wavelengths. Accurate spectral profile of a mineral can be determined
only in laboratory. Currently, there are so called spectral libraries, where
the typical spectral reference curves with absorption peaks and minimums
of different minerals are stored (Belényesi, 2008)
Therefore, the purpose of this work was to (i) evaluate the performance of
passive sensor to assess the moisture content of different soils types, (ii)
to test which spectral indices can be used to estimate the moisture content
IRRIGATION AND DRAINAGE
Misr J. Ag. Eng., October 2017 - 1552 -
(iii) to build a contour map analysis for all wavelengths of the