44
Ground Temperature Measurements

Ground Temperature Measurements

Ground Temperature Measurements
Part I, Pallmann Technique
By DANIEL R. NORTON and IRVING F^IEDMAN
Part II, Evaluation of the Pallmann Technique in Two Geothermal Areas of West-Central Nevada
By F. H. OLMSTED, TRYING FRIEDMAN, and DANIEL R. NORTON
Part III, Ground Temperatures in and near Yellowstone National Park
By IRVING FRIEDMAN and DANIEL R. NORTON
GEOLOGICAL SURVEY PROFESSIONAL PAPER 1203
UNITED STATES GOVERNMENT PRINTING OFFICE, WASHINGTON : 1981

UNITED STATES DEPARTMENT OF THE INTERIOR
JAMES G. WATT, Secretary
GEOLOGICAL SURVEY
Doyle G. Frederick, A cting Director
Catalog No. 81-607982
For sale by the Superintendent of Documents, U.S. Government Printing Office Washington, D.C. 20402

CONTENTS
Page Part I, Pallmann technique, by Daniel R. Norton and Irving Friedman -------------------- 1Part II, Evaluation of the Pallmann technique in two geothermal areas of west-central
Nevada, by F. H. Olmsted, Irving Friedman, and Daniel R. Norton --------.---------- 13Part IE, Ground Temperatures in and near Yellowstone National Park,
by Irving Friedman and Daniel R. Norton ------------------------------------------- 23
m


GROUND TEMPERATURE MEASUREMENTS
PARTI, PALLMANN TECHNIQUE
By DANIEL R. NORTON and IRVING F^IEDMAN
CONTENTS
Abstract --------------------------------------------------- 1Introduction -----.----------.----------------.--------.-..-- 2Preparation of Pallmann solutions --------------------------- 2Temperature probe ----------------------------------------- 2Emplacement of temperature probe -------------------------- 2Measurement of optical rotation ------------------------------ 3
Effective temperature ------------Accuracy of the Pallmann method Precision of the method ----------Acknowledgments ---------------References cited -----------------
Page
34455
ILLUSTRATION
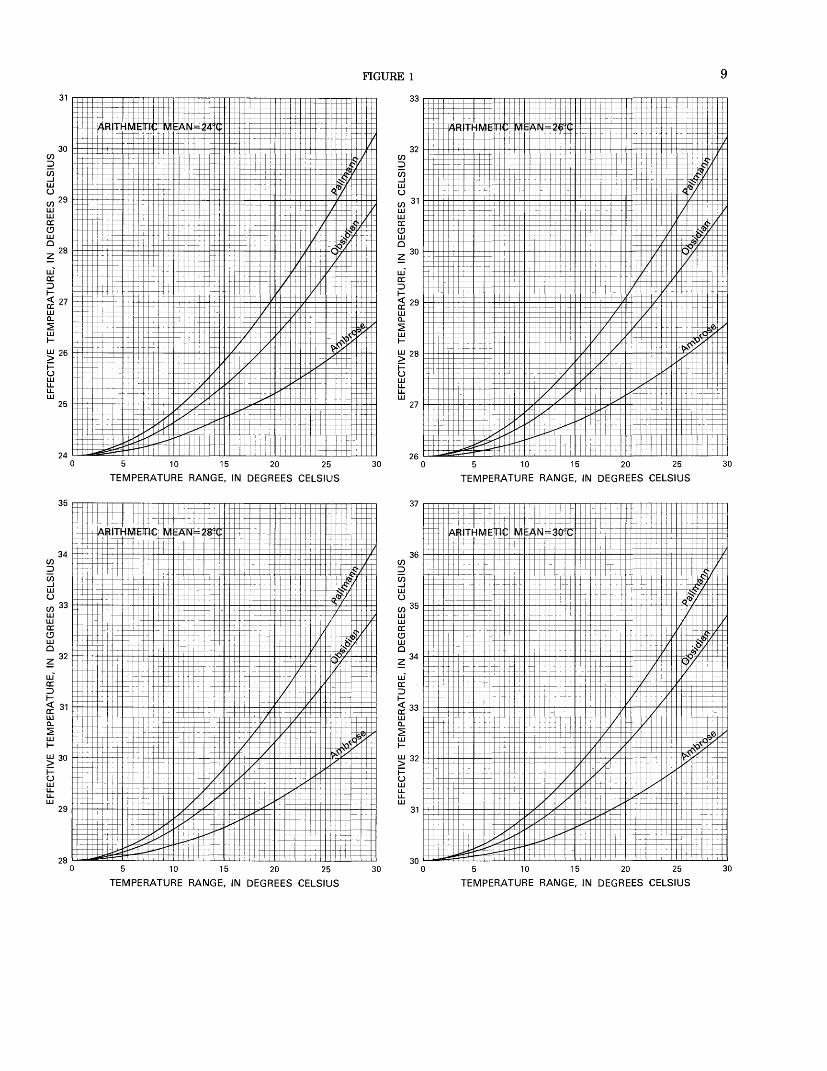
FIGURE 1. Sixteen graphs showing plots of temperature range of a sample for 1 year versus effective temperature calculated for three reactions --------------------------------------------------------------------------------------
TABLES
TABLE 1. Activation energy of several reactions ----------------------------------------------------------------2. Constants for the Pallmann equation ---------------------------------------------------------------3. Pallmann temperatures during 1977 at Bunsen Peak site as measured using two solutions of different pH4. Pallmann temperatures during 1978 at two sites as measured using solution of pH 1.93 -----------------
ABSTRACT
The measurement of integrated ground temperatures by the use of the Pallmann method was investigated in the laboratory and in the field. The method makes use of the fact that the rate of inversion of a solution of sucrose to invert sugar is temperature-dependent and can be easily monitored. The rate, which is also a function of the pH of the solution, can be adjusted so that the reaction is only partially com pleted during the time that the temperature is to be monitored. Laboratory calibration of the solution is necessary if accuracies of 0.25° Celsius (C) are to be achieved.
Probes containing Pallmann solution at 1-meter (m) and 2-m depths were designed for insertion into the ground. A method for making 2-m- deep holes in the ground was developed that combines pounding a small steel rod into the ground and then enlarging this small hole by blasting with Primacord.
Field tests using these techniques show that the effective temperature, integrated over the annual temperature cycle at soil depths of 1 and 2 m can be measured with an accuracy of about 0.25°C. Differences in temperature between 1 and 2 m, and between adjacent probes can be measured to about O.Q5°C.
Figures are given which allow Pallmann-effective temperatures to be converted to arithmetic-mean temperatures, obsidian-hydration effec tive temperatures, and Ambrose-effective temperatures. In order to use these figures, the range in temperature experienced by the sample for the time period under consideration must be known, or estimated. A novel method of determining the temperature range utilizes two cells containing materials whose activation energy differs. These cells are buried side by side.
PARTS n and III of the present paper describe field use of the Pall mann method.

GROUND TEMPERATURE MEASUREMENTS
INTRODUCTIONGround-temperature data are needed to date rhyolite
flows and glacial moraines that contain rhyolite glass by the obsidian-hydration method and to date organic materials by the amino-acid-racemization dating tech nique. Shallow ground temperatures may also be useful in detecting and delineating thermal anomalies in po tential geo thermal-resource areas.
For a number of years, the authors measured ground temperatures by burying temperature sensors in the soil and connecting them to various types of recorders. At many places this method was not feasible because electric power was not available, and access for servicing in the winter was difficult. In addition, malfunctions of the recorders and the necessity of changing recorder charts required frequent visits. In addition, thousands of points had to be read from the charts and then trans ferred to a computer to calculate average or integrated annual temperatures. The total cost of this method of temperature measurement is high.
A method for temperature measurement more con venient and less expensive than continuous recording, and applicable to remote areas, is the Pallmann method of temperature measurement, first described by Pall mann and others (1940). This method makes use of the fact that an aqueous solution of sucrose slowly hydroly- zes to invert sugar (mixture of glucose and fructose). The rate of this reaction is temperature- and pH-dependent. The higher the temperature the more rapidly the reac tion proceeds. The reaction is easily monitored inasmuch as the sucrose has a different angle of rotation of polarized light than the invert sugar, and the rotation can be measured with a polarimeter. Pallmann and others (1940) investigated this reaction extensively and proposed its use for measuring temperatures in the soil for biological investigations. Other investigators (Schmitz, 1964; Schmitz and Volkert, 1959; Lee, 1969; O'Brien, 1971) used the Pallmann method and reported precision on the order of a few hundredths of a degree Celsius. These results, plus convenience, prompted us to investigate the technique as a replacement for the continuous-recording method.
PREPARATION OF PALLMANN SOLUTIONS
The Pallmann solution is a sucrose solution in aqueous media using a citric acid-sodium citrate buffer. Reagent- grade chemicals and distilled water were used. For maldehyde was added to prevent deterioration of the solution by bacterial growth. Because the sucrose hydrolysis reaction is catalyzed by acid, it was necessary to adjust the pH of the solution to ±0.02 pH units. The Pallmann solutions were made according to the tech nique given by Schmitz (1964). The solutions were im
mediately bottled in ampoules or polypropylene bottles, and stored in a freezer at -32°C. The glass ampoules were made of 15-mm o.d. (millimeters outside diameter) tubing with a narrow neck for sealing, and contained 4 ml (milliliters) of solution.
TEMPERATURE PROBEIn order to measure effective ground temperatures by
the Pallmann method it is necessary to bury small amounts of sucrose solution sealed in glass ampoules and to be able to retrieve these ampoules after a suitable period of time. Our ampoules were about 15 mm in diameter and contained 4 ml of solution. These am poules were inserted into probes for insertion into the ground. Our probes were constructed of plastic water pipe 0/2-inch (12.7-mm) diameter water pipe). One vial was placed at the bottom of the 2-m long probes in a small brass container and another vial was placed at the 1-m position of the same probe enclosed in a brass sleeve to make good thermal contact with the ground. Styrofoam pellets were packed inside the pipe to prevent convection currents. The plastic probe was capped by a metal pipe cap. The probe was buried just below the sur face of the ground and the earth was well tamped around it to eliminate air space between soil and probe. In order to locate the probe we mapped its location and then used a metal detector to detect the metal pipe cap at the top of the probe. This technique proved highly successful and we have had no difficulty in locating probes in remote, and in some places featureless, terrain.
When the probes were removed from the ground the Pallmann ampoules were retrieved from the probes and were immediately placed upright in a container of dry ice to freeze. Freezing in the upright position prevented stresses that might have cracked the ampoule.
EMPLACEMENT OF TEMPERATURE PROBE
Different methods of drilling holes to emplace the probes containing Pallmann solution, as well as different designs of probes, were evaluated. Hand augering of the 1-in. (2.5-cm) diameter holes to 2-m depth was of marginal usefulness. It was slow and extremely difficult because the soil often contained pebbles and cobbles. However, this method of emplacing probes has been used on a few occasions. We also investigated the use of lightweight portable gasoline-driven drills. The problem with this technique was the plugging of the 2-m-long auger bit. In addition, the difficulty of handling the 2-m- long drill bits added complications. Small pebbles or cobbles also defeated this device.

PALLMANN TECHNIQUE
The most successful method of emplacing the probes has been to use Primacord1 to enlarge a small hole. The Primacord method was to first pound into the ground a steel device consisting of an outer thin steel tube/foin. o.d. and 1A in. i.d. (inside diameter) and an inner steel rod having a diameter slightly less than 1A in. The inner rod was then withdrawn and Primacord (50 grains per foot) was threaded down the tube to the bottom of the hole. The outer steel tube was then withdrawn, leaving the Primacord in place in the soil.
Upon detonation, the Primacord enlarges the hole from its initial Ke-in. diameter to approximately 1.5 in. in diameter. The Primacord is a relatively safe explosive because it cannot be detonated without the use of power ful detonators. The exploding bridgewire detonator that we are using is also relatively safe because it contains no sensitive explosive but is detonated by the shock wave produced by an exploding wire. This thin (0.001 in.) gold wire is exploded by passing a high current (approxi mately 1000 amperes) at high voltage (approximately 3000 volts) through the wire for a short period (1 micro second). These detonators can only be activated by the use of a special detonation box. We have emplaced several hundred probes using this technique without in cident. The noise made by the detonating Primacord is equivalent to that of a 12-gauge shotgun and it can be sufficiently muffled so that a person standing 50 m away can hardly hear the detonation.
MEASUREMENT OF OPTICAL ROTATION
Optical rotation was measured with a Rudolph Model 52A2 Polarimeter with a mercury lamp at 546.07 nm (nanometer). Digital readout of optical rotation was read to the nearest 0.01 degree. Water-jacketed polarimeter sample cells 200 mm long with a capacity of 2.5 ml were used throughout this study. Special glass filters were used to isolate the 546.07-nm line. The optical rotation of an NBS (National Bureau of Standards) quartz control plate was determined with each group of measurements. Over a 2-year period we found that the standard devia tion of the measurement of the quartz plate was a 0.05- degree rotation. All optical rotation measurements reported by our method are the average values for 10 readings corrected for instrument zero.
Prior to measurements, the ampoules were removed from the freezer, held in the hand to melt the solution, and constantly shaken. As soon as the crystals melted completely the ampoules were placed in a circulator-
'Primacord is a high-explosive (pentacrythrotrol trinitrate) filled cord manufactured by Ensign Bickford Co., Simsbury, Conn. 06070. The exploding bridgewire detonators and the special detonating box are made by Reynolds Industries, Inc., P.O. Box 1176, Marina Del Ray, Calif. Any trade names and trademarks found in this publication are used for descriptive pur poses only and do not constitute endorsement by the U.S. Geological Survey.
water bath at 20.00°C and were kept there for 10 minutes with intermittent shaking. During this period the water- jacketed polarimeter tube sample cell was equilibrated to 20.00°C. Immediately after this equilibrium period the ampoules were opened and the Pallmann solutions were transferred with a narrow glass pipette into the polarimeter cell. It is important that the Pallmann solu tion, which is viscous, be introduced from the bottom of the cell to avoid air entrapment. After securing the cap on the end of the cell, another 5-minute period was al lowed for temperature equilibrium. Readings were then immediately taken to reduce errors due to continued hydrolysis.
EFFECTIVE TEMPERATUREThe rate of the Pallmann reaction, in common with
many chemical and physical processes, responds in a nonlinear manner to temperature. A positive tempera ture change will speed up the cumulative reaction more than an equivalent negative temperature change will slow it down. Therefore, if the sucrose solution ex periences a fluctuating temperature, the reaction will be the same as if the sucrose was exposed to a constant temperature that is higher than the arithmetic-mean temperature. This calculated constant temperature is referred to as the "effective temperature".
Because the Pallmann reaction responds nonlinearly with respect to temperature, the values calculated by this method are not arithmetic means but are logarith mic-integrated temperatures. These can be converted to arithmetic means if the range in temperature is known, as shown by Lee (1969). For many purposes, including obsidian and amino-acid dating, integrated (effective)' temperatures are more actually useful than arithmetic means, because the reactions being monitored (diffusion of water into volcanic glass, racemization of amino acids) also respond to temperature changes exponen tially, not linearly. The closer the activation-energy rate constant of the monitoring method is to that of the reac tion being monitored, the more accurate the integrated temperature will be. This can be illustrated as follows.
Given a temperature that varies sinusoidally between +5° and -5°C. The arithmetic average temperature is 0°C. The integrated or effective temperature for a reac tion having an activation energy of 20 kcal/mole (kilocalories per mole) is +0.74°C; if the activation energy is 10 kcal/mole, the integrated temperature is +0.43°C. If the amplitude of the temperature variation is doubled to +10°, or to -10°, the mean temperature will remain zero but the two integrated temperatures will now be 2.75°C and 1.66°C, respectively.
In the previous example of a sinusoidally varying temperature, the integrated or effective temperature is

GROUND TEMPERATURE MEASUREMENTS
seen to vary mainly as a function of the temperature range and the activation energy of the reaction. The ac tivation energies of the reactions to be considered in this paper are shown in table 1.
TABLE 1. Activation energy of several reactions
ReactionActivation energy, in kcal/mole
Water diffusion through plastic (Ambrose cell) ----------- -'11.7Water diffusion into obsidian-hydration dating) -----------2 19 to 22Inversion of sucrose (Pallmann solution) ------------------327.0Isoleucine amino-acid racemization (amino-acid dating) - - - - 427.5
' Ambrose (1976); F. Trembour, (oral commun., 1978).2 Friedman and Long (1976).3 Lee (1969).4 Bada and Schroeder (1972).
The rate at which the sucrose inverts to invert sugar is dependent upon the pH of the solution as well as upon temperature. By adjusting the initial pH, we prepared solutions that were useful for different effective- temperature ranges. The basic equation, as originally proposed by Pallmann and others (1940) is:
T (°K) =pH-fc-log t+log [log (R 0-RJ-\og(R t-RJ],
(1)
where T a b
iK =
integrated temperature in degrees Kelvin (K)constantconstanttime, in daysrotation angle of sucrose solution at time t = 0rotation angle of sucrose solution at time = trotation angle of sucrose solution at time = °° (infinity).
This is the rotation angle when all of the sucrosehas inverted to invert sugar.
Temperature in degrees Kelvin.
ACCURACY OF THE PALLMANN METHOD
In the pH range used in our investigation (pH 1.5-3.0), a difference of 0.01 pH unit corresponds to an annual temperature increment of 0.13°C. It is difficult to measure pH with an accuracy of ±0.01 units. The pH changes slightly with temperature and also changes as the reaction proceeds (Lee, 1969). Therefore, we calibrated our Pallmann solutions by measuring the change in rotation when aliquots of the solutions were kept in constant temperature baths for known time periods. The baths used were constant to ±0.01°C, and the temperatures were read to ±0.05°C using ther mometers calibrated against NBS standards. The sealed vials containing the solutions were kept in the water baths for periods of time from 1 day to 3 months at
temperatures from 20° to 45°C. The rotation angles were measured and corrected according to figure 2d of Schmidt and Volkert (1959), recalculated for mercury light. At the conclusion of the experiment, reaction-rate constants were calculated using the corrected rotations, the known time, and the measured pH. The constants proposed by Pallmann and others (1940) and those calculated by us are given in table 2.
Temperatures calculated for the pH 1.93 solution us ing our constants are about 1°C lower than those using the original Pallmann constants. On the other hand, the temperatures calculated for the pH 2.51 solution with our constants are within 0.2°C of those calculated using the Pallmann constants. This discrepancy may be due to errors in our pH measurements. The pH meter had to be calibrated using pH 7 and 4 buffers. The buffer values were known to ±0.01. The farther the pH to be measured is from this pH range, the greater the error in the pH measurement. If the actual pH of the low pH Pallmann solution was 1.87 rather than the measured value of 1.93, the Pallmann constants would yield exact temperature values.
A check on the accuracy to be expected using the Pall mann method was carried out in the field using probes buried in the ground and placed 1 m apart. These probes contained vials of Pallmann solution at 1- and 2-m depths.
Four probes were spaced in an array where two of the probes contained solutions of pH 1.93 and the other two contained solutions of pH 2.51. All the probes were buried at one time, and all were removed 1 year later. The results are shown in table 3. The pH 1.93 solutions yielded temperatures that are about 0.25°C higher than those of the pH 2.51 solutions. The accuracy of the Pall mann method is about 0.25°C, and is limited primarily by the difficulty in determining the pH to closer than 0.02 unit.
TABLE 2. Constants for the Pallmann equation
Constants'
pH'
Pallmann and others (1940) ----------------- -5856.6 20.1988Present authors:
1.93 .................................... -5857.5 20.27252.51------------------------------------ -5913.5 20.39133.08------------------------------------ -5755.0 19.8171
'a and b are constants given in equation 1.Constants derived by Pallmann and others (1940) are independent of pH.
PRECISION OF THE METHODThe precision of the method that is how precisely
can small temperature differences be measured is far

PALLMANN TECHNIQUE
better than 0.25°C. Under laboratory conditions, using a constant temperature bath, temperature differences as small as 0.05°C can be resolved. Under natural condi tions, the limiting factor is the inherent "noise" because there are ground-temperature differences between sites as closely spaced as 1 m due to inhomogenieties in soil diffusivity, surface albedo, thermal inertia, and other variables.
In addition to the array given in table 3, two other ar rays with multiple probes containing the pH 1.93 solu tion were emplaced 1 m apart and were measured after being buried for 1 year. The results are given in table 4. The 0.12°C difference at the Bunsen Peak site 1-m depth may be real, inasmuch as a difference of 0.16°C was found the previous year at the same site (see table 3). The temperatures at 2-m depth were the same for both years at this site. From the above data it can be seen that a precision of ±0.02°C can be realized by the Pallmann method.
The many curves shown in figure 1 (at end of PART I) define the relationships among the three parameters: (1) arithmetic-mean temperature, (2) effective tempera ture, and (3) temperature range for the different pro cesses of sucrose inversion, obsidian hydration, and dif fusion of water through methyl methacrylate plastic. The data for this figure were calculated assuming that the temperature varied sinusoidally (harmonically) through the temperature range plotted on the abscisa. From this figure, if the temperature range is approx imately known, then Pallmann or Ambrose-effective temperature can be converted to obsidian-hydration or amino-acid effective temperatures, or to arithmetic- mean temperatures. Plots are given for 2°C-increments in arithmetic mean temperature from 0° to 30°C.
The Ambrose technique is another method for temperature integration (Ambrose, 1976). It is based upon the temperature dependence of the rate of diffusion of water into a plastic cell.
Figure 1 shows that the Pallmann effective tempera tures are somewhat higher than the obsidian-hydration effective temperatures.
Because the activation energy of the isoleucine amino- acid racemization is close to that of the Pallmann reac tion (27.5 kcal versus 27.0 kcal), the effective temperatures measured by the Pallmann method will be close approximations to the amino-acid effective temperatures. The Ambrose method yields effective temperatures that are lower than both the Pallmann and obsidian temperatures.
If the temperature range can be determined, the Ambrose and Pallmann effective temperatures can be converted to amino-acid or obsidian-hydration effective temperatures, or to arithmetic-mean temperatures.
By burying a Pallmann vial next to an Ambrose cell, the effective temperature for each can be measured, and then the temperature range can be calculated from the difference in effective temperatures. For example, if the Pallmann vial yields an effective temperature of 15.1°C, and the Ambrose cell gives an effective temperature of 12.5°C, the range in temperature is 26.0°C, and the mean temperature is 10.0°C (see fig. 1). PARTS II and in of the present paper give applications of the Pallmann technique.
TABLE 3. Pallman temperatures during 1977 at Bunsen Peak site1 as measured using two solutions of different pH
Depth
(m)
pH 1.93 pH 2.51
Probe a Probe b Probe c Probed
4.77°C 4.33°C
4.61°C 4.55° 4.31°C 4.05°
4.53°C 4.07°C
'See PART III for description of this site.
TABLE 4. Pallmann temperatures during 1978 at two sites as measured using solutions of pH 1.93
Depth
(m)
1 .....9 .... .
Bunsen Peak site'
Probe a
A ZAQ p
A O COO
Probe b
4.42°C 4.31°C
Turbid Lake site1
Probe a
5.34°C 5.44°C
Probe b
5.36°C5.46°C
'See PART III for description of this site.
ACKNOWLEDGMENTSWe owe a great debt of thanks to William Long who
designed and constructed the steel device used to emplace the Primacord. He also designed the plastic probe and was most helpful at all stages of the research. Gary Giarratano and Mary Robison assisted in the laboratory phase of the research.
REFERENCES CITEDAmbrose, W., 1976, Intrinsic hydration rate dating of obsidian,
Chapter 5 in R. E. Taylor, ed., Advances in obsidian glass studies:Park Ridge, N. J. Nayes Press, p. 81-106.
Bada, J. L., and Schroeder, R. A., 1972, Racemization of isoleucine incalcareous marine sediments; kinetics and mechanism: Earth andPlanetary Science Letters, v. 15, no. 1, p. 1-11.
Friedman, I., and Long, W., 1976, Hydration rate of obsidian: Science,v. 191, no. 4225, p. 347-352.
Lee, R., 1969, Chemical temperature integration: Journal of AppliedMeteorology, v. 8, p. 423-430.
O'Brien, P. J., 1971, Pallmann method for mass sampling of soil,water, or air temperatures: Geological Society of America Bulletin,v. 82, no. 10, p. 2927-2932.

GROUND TEMPERATURE MEASUREMENTS
Pallmann, H., Eichenberger, E., and Hasler, A., 1940, Eine neue Methode der Temperaturmessung bei okologischen oder boden- kundlichen Untersuchungen: Berichte der Schweizerishen Botan- ischen Gesellschaft, v. 50, p. 337-362.
Schmitz, W., 1964, Messprobleme bei reaktionskinetischen Unter suchungen mit dem Kreispolarimeter dargestellt am Beispiel der reaktionskinetischen Temperaturmessung: Zeiss Mitteilungen, v. 3, p. 227-249. U.S. Department of Commerce Technical Transla
tion TT67-61038, Washington, D.C., 1966 [English translation]. Schmitz, W., and Volkert, E., 1959, Die Messung von Mittel-
temperaturen auf reaktionskinetischer Grundlage mit dem Kreispolarimeter und ihre Anwendung in Klimatologie und Biookologie, speziell in Forst- und Gewasserkunde: Zeiss Mit teilungen, v. 1, p. 300-337. U.S. Department of Commerce Technical Translation TT67-62408, Washington, D. C., 1966 [English translation].

FIGURE 1Plots of the temperature range experienced by a sample versus the effective temperatures
calculated for the Pallmann reaction, the obsidian-hydration reaction, and the Ambrose method. In making the calculations we used equation 2 and assumed a harmonic or sinusoidal temperature varia tion with an amplitude given by the "temperature range", and an activation energy for each reaction as follows: Pallmann (27 kcal/mole), obsidian-hydration (19.7 kcal/mole), Ambrose (11.7 kcal/mole). Sets of curves are given for different arithmetic means from 0° to 30° Celsius in 2°-intervals. The ef fective temperature equals the arithmetic mean temperature when the temperature range equals zero.
~E
RTt= e +273.2,
(2)where t - effective temperature in degrees Celsius
e = base of natural logarithms E = activation energy R = gas constant, 1.98 cal/mole T = temperature in degrees Kelvin. This temperature varies
sinusoidally with an amplitude given by "temperature range".

EF
FE
CT
IVE
T
EM
PE
RA
TU
RE
, IN
D
EG
RE
ES
C
ELS
IUS
EF
FE
CT
IVE
T
EM
PE
RA
TU
RE
, IN
D
EG
RE
ES
C
ELS
IUS
Oo
CD CD 30
M
m
o
m
CO O
m i
co
M
CO
ft
i o
EF
FE
CT
IVE
T
EM
PE
RA
TU
RE
, IN
D
EG
RE
ES
C
ELS
IUS
EF
FE
CT
IVE
T
EM
PE
RA
TU
RE
, IN
D
EG
RE
ES
C
ELS
IUS
ui
en00
CO
CD m
->
CD 30
M
m
o
EF
FE
CT
IVE
T
EM
PE
RA
TU
RE
, IN
D
EG
RE
ES
C
ELS
IUS
EF
FE
CT
IVE
T
EM
PE
RA
TU
RE
, IN
D
EG
RE
ES
C
ELS
IUS
EF
FE
CT
IVE
T
EM
PE
RA
TU
RE
, IN
D
EG
RE
ES
C
ELS
IUS
EF
FE
CT
IVE
T
EM
PE
RA
TU
RE
, IN
D
EG
RE
ES
C
ELS
IUS

EF
FE
CT
IVE
T
EM
PE
RA
TU
RE
, IN
D
EG
RE
ES
C
ELS
IUS
EF
FE
CT
IVE
T
EM
PE
RA
TU
RE
, IN
D
EG
RE
ES
C
ELS
IUS
O I
EF
FE
CT
IVE
T
EM
PE
RA
TU
RE
, IN
D
EG
RE
ES
C
ELS
IUS
NJ
NJ
NJ
NJ
^
Ul
O
~J
EF
FE
CT
IVE
T
EM
PE
RA
TU
RE
, IN
D
EG
RE
ES
C
ELS
IUS

EF
FE
CT
IVE
T
EM
PE
RA
TU
RE
, IN
D
EG
RE
ES
C
ELS
IUS
EF
FE
CT
IVE
T
EM
PE
RA
TU
RE
, IN
D
EG
RE
ES
C
ELS
IUS
EF
FE
CT
IVE
T
EM
PE
RA
TU
RE
, IN
D
EG
RE
ES
C
ELS
IUS
EF
FE
CT
IVE
T
EM
PE
RA
TU
RE
, IN
D
EG
RE
ES
C
ELS
IUS
CD O 33
NJm
o
(/)
MC
"1
frn-


GROUND TEMPERATURE MEASUREMENTS
PART II, EVALUATION OF THE PALLMANN TECHNIQUE IN TWO GEOTHERMAL AREAS OF WEST-CENTRAL NEVADA
By F. H. OLMSTED, IRVING FRIEDMAN, and DANIEL R. NORTON
CONTENTS
Page
Abstract--------------------------------------------------- 13Introduction ----------------------------------------------- 14Areas selected for field tests --------------------------------- 14Field techniques and instrumentation ------------------------ 14Data reduction and interpretation --------------------------- 16
Results in Soda Lakes geothermal area ------------------------ 17Results in Upsal Hogback geothermal area ------------------- 17Conclusions ------------------------------------------------ 17References cited -------------------------------------------- 21
ILLUSTRATIONS
Page
FIGURE 2. Map of west-central Nevada, showing the location of Soda Lakes and Upsal Hogback geothermal areas----------------- 153. Map of Soda Lakes area, Nevada, showing measured Pallmann temperatures at 1 and 2 m for December 15, 1976,
to December 15, 1977, and temperatures at 15 m in test wells for fall 1975 ----------------------------------------- 184. Diagram showing correlation of temperature at 15 m in test wells with measured Pallmann temperatures at 2 m
for December 15, 1976, to December 15, 1977, Soda Lakes area, Nevada -------------------------------------------- 195. Map of Upsal Hogback area, Nevada, showing measured Pallmann temperatures at 1 and 2 m for December 15, 1976,
to December 15, 1977, and temperatures at 15 m in test wells for September 1975 ---------------------------------- 206. Diagram showing correlation of temperature at 15 m in test wells with measured Pallmann temperatures at 2 m
for December 15, 1976, to December 15, 1977, Upsal Hogback area, Nevada ---------------------------------------- 21
TABLESPage
16TABLE 5. Comparison of measured and adjusted Pallmann temperatures with thermistor temperatures at a depth of 1 m -------6. Comparison of coefficients of determination (r2) for least-mean-squares linear regressions of temperature
at 15 m versus temperatures at 1 m and 2 m -------------------------------------------------------------------- 17
ABSTRACT
The Pallmann method, which derives an integrated temperature on the basis of the hydrolysis of sucrose to invert sugar, was tested as a means of geothermal exploration at shallow depths in two adjoining geothermal areas of west-central Nevada. Integrated Pallmann temperatures for a 12-month period and a 3-month, midwinter, period at depths of 1 and 2 meters (m) are compared with temperatures at 15 m obtained by more conventional methods at 15 sites in the Soda Lakes area and 8 sites in the Upsal Hogback area. The field tests sug gest that the Pallmann method is useful in mapping temperature anomalies at greater depths and that the method may be superior to a
conventional set of synoptic temperature measurements in outlining diffuse temperature anomalies where the areal differences in tempera tures at depths of 15 m or more are relatively small. Better results were obtained with data obtained at a depth of 2 m than at 1 m. Correlations between the Pallmann temperatures for the 3-month, midwinter, period and temperatures at 15 m were better than between the Pall mann temperatures for the 12-month period and the 15-m temperatures, probably because of the smaller difference between the Pallmann temperatures (exponential means) and the arithmetic-mean temperatures for the shorter period.
13

14 GROUND TEMPERATURE MEASUREMENTS
INTRODUCTIONIn principle, the utility of temperature measurements
at depths of 1 or 2 m in geothermal exploration is enhanced if annual averages rather than single sets of synoptic values are used. Until recently, however, the determination of mean annual temperature generally has involved the use of either frequent periodic measure ments with thermometer probes or buried thermometers of various types connected to expensive recording equip ment. The cost advantages of many measurements at shallow depths over fewer measurements at greater depths, below the zone of annual temperature fluctua tion, are therefore largely lost. Clearly, a measurement technique is needed which is more convenient and less expensive than instrumental methods and which is ap plicable to remote places where access is difficult.
One such technique, described by Pallmann and others (1940), derives an integrated temperature on the basis of the hydrolysis of sucrose to invert sugar. This method, hereinafter referred to for convenience as the "Pallmann method," has been tested in a variety of set tings, summarized by Lee (1969), and particularly in soil-temperature measurements (O'Brien, 1971). O'Brien's results, in a small area near Schenectady, N.Y., were sufficiently encouraging that the method was tested by two of us in Yellowstone National Park (Friedman and Norton, PART HI, present paper) and further tests, in a different geologic and climatic setting in west-central Nevada, seemed warranted.
In this paper we describe the results of field tests in two adjoining geothermal areas in west-central Nevada, where abundant temperature data obtained by more conventional methods at depths of 15-30 m are available (Olmsted and others, 1975; Olmsted, 1977).
The theory as well as laboratory and field methods are discussed in PART I, Pallmann Technique, by Norton and Friedman.
AREAS SELECTED FOR FIELD TESTSTwo areas, designated the Soda Lakes and Upsal
Hogback geothermal areas, were selected for field tests of the Pallmann method. Both areas are in the west-central Carson Desert, about 100 km east of Reno, Nev. (fig. 2). Abundant information about the geology, hydrology, and the temperature distribution to depths of about 150 m was available from previous studies (Olmsted and others, 1975, p. 99-118; Olmsted, 1977).
The Soda Lakes geothermal area occupies about 21 km2 (square kilometers) between Soda Lakes to the south-southwest and Upsal Hogback to the north- northeast. Both Soda Lakes and Upsal Hogback are late Pleistocene to Holocene basaltic eruptive centers, probably alined along a concealed fault or fault system. The Soda Lakes thermal anomaly probably results from upward leakage of hot water along a steeply inclined or
vertical fault-controlled conduit into shallow sand aquifers, through which the hot water moves north- northeastward, in the direction of the near-surface hydraulic gradient (Olmsted and others, 1975, p. 104). Previous data from synoptic temperature measurements at a depth of 1 m indicated relatively high temperatures and large heat flows in the hottest part of the thermal anomaly. Conditions seemed especially favorable for the application of the Pallmann method.
The Upsal Hogback geothermal area lies several kilometers north-northeast of the Soda Lakes area, generally east and north of Upsal Hogback. Although somewhat more extensive than the Soda Lakes geother mal area, the Upsal Hogback area is characterized by much lower near-surface temperatures and smaller heat flows. Correlation of synoptic temperatures at 1-m depth and temperatures at 30 m is poor, owing to the relatively small amplitude of the thermal anomaly and the relatively large perturbing effects of nongeothermal fac tors (Olmsted, 1977, p. B21, B24). Conditions, therefore, seemed much less favorable for application of the Pall mann method than in the Soda Lakes area. However, we hoped that the temperatures obtained with the Pall mann method at shallow depth would show a better cor relation with those at greater depth than did the synop tic measurements at 1 m reported by Olmsted (1977).
FIELD TECHNIQUES AND INSTRUMENTATION
Most of the Pallmann samples were placed near sites of earlier U.S. Geological Survey or U.S. Bureau of Reclamation test wells, or 1-m temperature-measure ment sites used by Olmsted (1977). Criteria for site selection included: (1) Level or nearly level ground; (2) absence of nearby vegetation which could shade the site for significant periods of time; (3) sufficient distance (generally at least 10 m) from nearby test wells to avoid possible perturbing effects; and (4) alinement of sites along and across the long axes of the two thermal anomalies so as to check the previous interpretation (Olmsted, 1977) of the extent and configuration of the anomalies. A total of 15 sites in the Soda Lakes area and 8 sites in the Upsal Hogback area were occupied for the 1-year period from mid-December 1976, to mid- December 1977. Additional samples were placed at 19 of the 23 sites for the 3-month period from mid-December 1977, to mid-March 1978.
In order to provide data for comparison with and ad justment of some of the Pallmann-method temperatures, monthly measurements were made with a 1-m ther mistor probe at four sites in the Soda Lakes area and four sites in the Upsal Hogback area from mid-December 1976, to mid-March 1978. Measurement techniques were those described by Olmsted (1977, p. B5).

120°
EVALUATION OF PALLMAN TECHNIQUE, WEST-CENTRAL NEVADA
119° PERSHING COCHURCHILL CO
15
118°
CHURCHILL CO MINERAL CO
Hawthorne
r
\
10 20 30 40 KILOMETERSI_____I_____|____I
10 20 MILES
FIGURE 2. West-central Nevada, showing the location of Soda Lakes and Upsal Hogback geothermal areas.

16 GROUND TEMPERATURE MEASUREMENTS
DATA REDUCTION AND INTERPRETATION
Pallmann temperatures at depths of 1 and 2 m were determined by the method described by Norton and Friedman in PART I of the present paper. As discussed by them and by Lee (1969) and O'Brien (1971), the Pall mann method consistently overestimates integrated arithmetic-mean temperature for the period of measure ment because the rate of sucrose hydrolysis varies ex ponentially instead of linearly with temperature. The magnitude of the difference between the measured exponential-mean temperature and the arithmetic- mean temperature increases with increasing tempera ture range but decreases slightly with increasing mean temperatures. Lee (1969, p. 427) and Norton and Friedman (PART I, fig. 1) have calculated the correc tions to the measured Pallmann temperatures, assuming harmonic temperature fluctuation for the period of in terest and using an activation energy of 27 kcal/mole (kilocalories per mole) for the Pallmann reaction. The larger corrections associated with the larger ranges in temperature fluctuation account for the higher meas ured Pallmann temperatures at 1 m than at 2 m at many sites in the Soda Lakes and Upsal Hogback areas. Ac tually, at most places net heat flow for a yearly cycle is upward, and the integrated arithmetic-mean annual temperature at 1 m is therefore less, not greater, than that at 2 m.
Comparisons between adjusted Pallmann tempera tures integrated arithmetic means and means deter mined by thermistor measurements at monthly intervals at a depth of 1 m at eight sites in the Soda Lakes and Up sal Hogback areas are presented in table 5. Two periods of comparison were used: (1) The 3 months from December 15, 1977, to March 15, 1978; and (2) the 12 months from December 15, 1976, to December 15, 1977. For each of these periods the measured Pallmann temperatures were adjusted to integrated arithmetic- mean temperatures, using the temperature ranges and mean temperatures measured by thermistor and the cor rections given by Norton and Friedman (PART I, fig. 1). Because the Pallmann solution ampoule at 1 m was broken upon recovery in December 1977, at one site (72) in the Upsal Hogback area, and another site (62), in the Soda Lake area, was not reoccupied during the ensuing 3 months, only seven of the eight Pallmann sites provided temperature data for comparison with the concurrent thermistor temperatures.
For the 3 months from December 15, 1977, to March 15, 1978, the corrections to the measured Pallmann temperatures at the seven sites were only 0.1 to 0.3°C because of the relatively small temperature fluctuation for this midwinter period (3.3-5.9°C). Except for two of
TABLE 5. Comparison of measured and adjusted Pallmann tempera tures with thermistor temperatures at a depth of 1 m
[Leaders (- - -) indicate no data]
Temperature, in degrees Celsius
Pallmannsite
numberMeasured Pallmann
Adjusted Pallmann
Thermistor Difference1
3 months
5758
6072
737476
8.826.6
16.512.7
9.19.79.9
8.626.3
16.212.5
9.09.69.7
7.921.8
16.010.7
8.710.19.6
2 0.724.5
30.2'1.8
0.3-0.5
0.1
12 months
57586062737476
19.0>26.8
23.821.018.517.518.9
15.5>24.8
22.117.415.715.016.3
15.826.622.217.416.215.516.0
-0.3. . .
-0.10.0
-0.5-0.5
0.3
'Adjusted Pallmann temperature minus thermistor temperature.'Pallmann probe ~ 0.5 m too deep; adjusted temperature probably ~ 4°-5°C too high.'Pallmann probe ~ 0.2 m too deep; adjusted temperature probably ~ 1°C too high.
the sites, where the Pallmann probe was inadvertently buried about 0.5 and 0.2 m too deep, agreement is good between the adjusted Pallmann temperatures and the thermistor temperatures: the differences are only a few tenths of a degree Celsius.
For the preceding 12-month period, larger corrections to the measured Pallmann temperatures were required (1.7°-3.6°C) because of the larger fluctuations in temperature (14.0°-21.6°C) for this period. In spite of the larger corrections, agreement between adjusted Pall mann temperatures and thermistor temperatures is as good for the annual period as for the 3-month period.
Because of the absence of concurrent thermistor temperature measurements the temperature-fluctuation data required for calculating adjusted Pallmann temperatures were not obtained at most of the Pallmann sites. For this reason, we use measured (unadjusted) Pallmann temperatures in the following discussions of results in the two geothermal areas. As described above, these measured temperatures may be several degrees Celsius higher than the integrated arithmetic-mean temperatures, especially for longer periods such as a year and at depth of only 1 m. However, the feasibility of the Pallmann method as a geothermal exploration tool de pends in large part on the usefulness of the unconnected temperatures in delineating areas underlain by abnor mal temperatures at greater depth.

EVALUATION OF PALLMAN TECHNIQUE, WEST-CENTRAL NEVADA 17
RESULTS IN SODA LAKES GEOTHERMAL AREA
Measured Pallmann temperatures for 12 months at 1 and 2 m at 15 sites in the Soda Lakes area outline in a general way the thermal anomaly defined by tempera tures at 15 m in test wells (fig. 3). Temperatures at 15 m range from more than 100°C (boiling temperatures at hydrostatic depth) in the southwest part of the anomaly to less than 20° C on the margins of the anomaly. The general north-northeasterly alinement of the anomaly is delineated clearly by the Pallmann temperatures, but the temperatures at 1 m delineate only the hottest area (more than 40°C at 15 m). Temperatures at 1 m in the hottest area probably are more than 10°C higher than the background values, which range from less than 19° C to more than 18°C.
Temperatures at 2 m for the same period at the same 15 sites appear to define the north-northeasterly elonga tion of the deeper, 15-m anomaly somewhat better than do the 1-m temperatures. At many sites the 2-m temperatures are less than the measured 1-m tempera tures for the same 12-month period because of the smal ler fluctuation and correspondingly smaller negative cor rection at the 2-m depth.
Correlation of temperatures at a depth of 15 m below the range of significant annual temperature fluc tuation with temperatures at depths of 1 or 2 m affords a useful index of the reliability of the shallower measure ments in outlining deeper thermal anomalies. The cor relation of temperature at 15 m with temperature at 2 m measured by the Pallmann method for the 12-month period at nine sites is shown in figure 4. The coefficient of determination, r2 (a measure of variance), is 0.93, which indicates a fairly good fit to the least- mean-squares regression. Similar correlations for depths of 15 and 1 m and for the 3-month period are sum marized in table 2. As might be expected because of larger range in annual temperature fluctuations at 1 m than at 2 m, the correlation of temperature at 15 m with that at 1 m is poorer than for 15 m versus 2 m (r2 = 0.77 instead of 0.93). The similar correlations for the 3-month period indicate a somewhat better fit (larger values of r2) for these data, probably because of the smaller temperature fluctuations during the 3-month period as compared to the 12-month period.
RESULTS IN UPSAL HOGBACK GEOTHERMAL AREA
As shown in figure 5, the areal range in temperature at a depth of 15 m is only about 5°C in the Upsal Hogback area, as compared to a range of more than 80° C in the Soda Lakes area. The corresponding ranges in 12-month
Pallmann temperatures at 1 and 2 m are even smaller and do not correlate well with the temperatures at a greater depth. The highest temperature at 2 m (18.4°C) does occur at a site immediately southeast of the hottest part of the thermal anomaly at 15 m, but the tempera tures at the other Pallmann sites show no consistent pat tern related to the deepter anomaly. Unfortunately, the Pallmann-solution ampoule at 1 m was broken upon recovery from the hottest site at 2 m, so no pattern at all is apparent from the 1-m data.
Coefficients of determination (r2) for the least-mean- squares linear regressions of temperatures at 15 m versus temperatures at 1 and 2 m corroborate the generally poor correlations described above (see table 6). As in the Soda Lakes area, the temperatures at 2 m show a somewhat better correlation with temperatures at 15 m than do the temperatures at 1 m, but the improved correlation for the 2-m data results entirely from the single value southeast of the hottest part of the 6 thermal anomaly, where the measurement at 1 m was lost because of the broken Pallmann ampoule (see fig. 6). Coefficients of determination are significantly higher for the 3-month period than for the 12-month period for both 1- and 2-m data, most likely because of the smaller amplitudes of temperature fluctuation during the shorter period.
TABLE 6. Comparison of coefficients of determination (r2 ) for least- mean-squares linear regressions of temperature at 15 m versus
temperatures at 1 m and 2 m
Soda Lakes area Upsal Hogback area
Depths(m)
1, 152, 151, 152, 15
Period(months)
33
1212
No. ofsites
9899
Coefficient ofdetermination
(r2 )
0.84.96.77.93
No. ofsites
5445
Coefficient ofdetermination
(r2 )
0.48.58.06.38
CONCLUSIONSThe results of our field test in the Soda Lakes and
Upsal Hogback areas indicated that the Pallmann method of temperature integration, when used at depths of only 1 or 2 m, is useful in mapping temperature anomalies at greater depths, below the range of signifi cant seasonal temperature fluctuation. As is true of more conventional synoptic measurements, the Pallmann method works best where areal differences in temperature at greater depths are large, as in the Soda Lakes area (more than 80°C at 15 m), and is least useful where the areal differences are small, as in the Upsal Hogback area (only about 5°C at 15 m).

18 GROUND TEMPERATURE MEASUREMENTS118°50'
39°50'
T. 20 N.
T. 19 N.
EXPLANATION
1 17.8 Measurement site and temperatures18.8 at depths of 1 m (top number) and
2 m (bottom number), in degreesCelsius, as measured by Pallmannmethod
Line of equal Pallmann temperature at a depth of 2 m. Interval, 2° Celsius
-20 Line of equal temperature at a depth of 15 m, as measured in test wells. Interval, 20° Celsius
J8-Ml
18.317.2
4 KILOMETERS
2 MILES
Base from USGS 15' topo series. Soda Lake, Nevada
FIGURE 3. Soda Lakes area, Nevada, showing measured Pallmann temperatures at 1 and 2 m for December 15, 1976, to December 15, 1977,and temperatures at 15 m in test wells for fall 1975.

EVALUATION OF PALLMAN TECHNIQUE, WEST-CENTRAL NEVADA 19
75
U)D 70 in
o 65U)LLJ
60O
£ 30
cc 25
20
1516 17 18 19 20 21 22 23 24 25 26 27
TEMPERATURE AT 2 METERS (t 2 ), IN DEGREES CELSIUS
FIGURE 4. Correlation of temperature at 15 m in test wells with measured Pallmann temperatures at 2 m for December 15, 1976, to December 15, 1977, Soda Lakes area, Nevada.
In principle, the chief advantage of the Pallmann method over single sets of synoptic temperature meas urements should be in minimizing the perturbing effects of areal differences in thermal diffusivity, degree of stratification of materials, and depth to the water table. All these factors affect both the amplitude and the phase lag of the annual temperature wave but do not significantly affect the average annual temperature at a given depth, which is indicated approximately by the Pallmann temperature. The perturbing effects of the other nongeothermal factors, such as nonuniform topography, albedo, and vegetative cover, would be ex pected to affect both Pallmann-method and conven tional synoptic-method temperature measurements equally because these factors control the average annual temperature at land surface at a site. In principle, therefore, the Pallmann method should be a better ex ploration tool than a single set of synoptic temperature measurements in mapping diffuse temperature anom alies like that near Upsal Hogback.
Our field test, however, suggested but did not une quivocally demonstrate the superiority of the Pallmann method over conventional synoptic measurements in the Upsal Hogback area. The coefficient of determination
(r2 ) for the least-mean-squares linear regression of temperatures at 15 m versus temperatures at 1 m for the period December 15, 1977, to March 15, 1978, is 0.48 (table 6); r2 for the equivalent regression using temperatures measured December 2, 1975, with a ther mistor at 1 m at the same sites is only 0.20. For the 12-month period December 15, 1976, to December 15, 1977, r2 for temperatures at 15 m versus temperature at 1 m by the Pallmann method is only 0.06, but this value represents only four of the five data pairs used in the other correlations; the measurement was lost at the critical site near the hottest part of the 15-m temperature anomaly.
In both the Soda Lakes and the Upsal Hogback areas, Pallmann temperatures at 2 m correlate better with temperatures at 15 m than do the Pallmann tempera tures at 1 m. In large part, the improved correlation is a consequence of the smaller variation, at 2 m than at 1 m, in the differences between the Pallmann integrated- mean temperature (an exponential mean) and the true integrated arithmetic-mean temperature. In addition, the temperatures at greater depths are affected less than are the temperatures at shallower depths by other sur face and near-surface nongeothermal influences. Insofar as these influences affect the average annual temperature, a part of the advantage of deeper over shal lower temperature measurements is common to both synoptic and Pallmann integrated temperatures.
Although in principle a period of a year might appear to be optimum for application of a temperature- integration method, in our field tests the Pallmann temperatures at both 1 and 2 m for a 3-month midwinter period showed a somewhat better correlation with temperatures at a greater depth than did the Pallmann temperatures for a 12-month period at the same depths. The most likely explanation involves the fact that the Pallmann temperatures are integrated exponential means rather than arithmetic means. The smaller temperature flucuation for the shorter period results in smaller difference between the Pallmann temperatures and the arithmetic-mean temperatures. This factor ap parently outweighs the effects of the areal differences in the amplitude and phase lag of the annual temperature wave, which would tend to produce more scatter in the 3-month data and a poorer correlation of these shorter term data with temperatures at 15 m or more.
In general, the use of the Pallmann method at depths of 1 or 2 m will have many of the problems common to more conventional temperature measurements at shal low depths. However, the method is convenient and it eliminates the need for the frequent visits to sites that would be required to obtain data of similar quality from sets of synoptic measurements by thermistor or ther mocouple probes.

20
118°50'
GROUND TEMPERATURE MEASUREMENTS
118°45'
EXPLANATION
75.5 Measurement site and temperatures 17.3 at depths of 1 m (top number) and 2
m (bottom number), in degrees Celsius, as measured by Pallmann method
0 Line of equal temperature at a depth of 15 m, as measured in test wells. Interval, 2° Celsius
39°40'
Base from USGS 15' topo series. Desert Peak, 1951; Carson Sink, 1951; Soda Lake, 1951; Stillwater, 1950.
FIGURE 5. Upsal Hogback area, Nevada, showing measured Pallmann temperatures at 1 and 2 m for December 15,1976, to December 15, 1977, and temperatures at 15 m in test wells for September 1975.

EVALUATION OF PALLMAN TECHNIQUE, WEST-CENTRAL NEVADA 21
22.0
21.5
21.0
20.5
20.0
- 19.5
19.0
18.5
18.0
S 17.5
17.0
16.5
16.0
*15 = 1.47*2-6.50,
r2 =0.38
16.0 16.5 17.0 17.5 18.0 18.5 19.0
TEMPERATURE AT 2 METERS (t 2 ), IN DEGREES CELSIUS
FIGURE 6. Correlation of temperature at 15 m in test wells with measured Pallmann temperatures at 2 m for December 15, 1976, to December 15, 1977, Upsal Hogback area, Nevada.
REFERENCES CITEDLee, Richard, 1969, Chemical temperature integration: Journal of Ap
plied Meteorology, v. 8, p. 423-430.O'Brien, P. J., 1971, Pallmann method for mass sampling of soil,
water, or air temperatures: Geological Society of America Bulletin, v. 82, no. 10, p. 2927-2932.
Olmsted, F. H., 1977, Use of temperature surveys at a depth of 1 meter in geothermal exploration in Nevada: U.S. Geological Survey Professional Paper 1044-B, 25 p.
Olmsted, F. H., Glancy, P. A. Harrill, J. R., Rush, F. E., and VanDen- burgh, A. S., 1975, Preliminary hydrogeologic appraisal of selected hydrothermal systems in northern and central Nevada: U.S. Geological Survey Open-file Report 75-56, 360 p.
Pallmann, H. E., Eichenberger, E., and Hasler, A., 1940, Eine neue Methode der Temperaturmessung bei okologischen oder boden- kundlichen Untersuchungen [A new method of temperature measurement in ecological or pedological investigations]: Berichte der Schweizerischen Botanischen Gesellschaft p. 337-362.


GROUND TEMPERATURE MEASUREMENTS
PART HI, GROUND TEMPERATURES IN AND NEAR YELLOWSTONE NATIONAL PARK
BylRviNG FRIEDMAN and DANIEL R. NORTON
CONTENTS
Abstract ----------Introduction -------Field investigations
Page
23
24 24 24
Page
.....-..----.-------. 34QQ
ILLUSTRATIONS Page
FIGURE 7. Generalized sketch map of Yellowstone National Park and vicinity showing site localities and numbers ------------------- 258. Plot of instantaneous ground-temperature measurements made in late September 1978, and mid-February 1979 ----------- 329. Map of Yellowstone National Park and vicinity with the corrected 2-m Pallmann temperature shown for each site -i------- 35
10. Plot of 2-m corrected Pallmann temperatures, arranged by types of sites ----------------------------------------------- 3611. Map of Yellowstone National Park and vicinity showing temperature groups, from 0 to 6 degrees Celsius
at 48 sites ---------------------------------------------------------------------------------------------------- 3712. Plot of 2-m corrected Pallmann temperatures versus difference in temperature between 1 and 2 m ----------------------- 3813. Plot of 2-m instantaneous maximum temperatures made in late September 1978, and normalized to a 7000-ft (2133-m)
altitude---------------------------- ------------------------------------------------------------------------ 39
TABLESPage
TABLE 7. Description of sites ----------------------------------------------------------------------------------------------- 268. Pallmann temperatures ------------------------------------------------------------------------------------------- 299. Instantaneous temperature measurements in degrees Celsius --------------------------------------------------------- 31
ABSTRACT
The Pallmann method was used to determine ground temperatures at 1- and 2-meter (m) depths at 57 sites in Yellowstone National Park and vicinity for several annual periods. These measurements were used for determining rates of obsidian hydration for dating. In order to utilize these measurements for heat-flow comparisons of the different sites, the 2-m data points were normalized to a common altitude and degree of shade. Using these corrected Pallmann temperatures, we
were able to define areas of anomalous heat flow at sites distant from known geothermal influence. In addition to Pallmann measurements, we made instantaneous ground-temperature measurements at most Pallmann sites at or near the temperature maximum and minimum for the year. These instantaneous measurements were made to determine the temperature range in order to convert Pallmann temperatures to arithmetic-mean annual temperatures.
23

24 GROUND TEMPERATURE MEASUREMENTS
INTRODUCTIONGround-temperature measurements were made in
order to calculate rates of hydration of obsidian collected from locations in and near Yellowstone National Park. These rates of hydration were used to date volcanic flows and other geologic features containing obsidian. Our first attempt at temperature measurements utilized con tinuous recorders to record the temperature of ther mocouples buried in the ground. This technique severely limited the location of the sites where temperature could be measured, inasmuch as electric power and a shelter had to be available for the recorder. The difficulty of ser vicing the equipment during the winter proved to be another limitation. The Pallmann technique seemed well suited for these measurements. In September of 1975, Irving Friedman and Daniel R. Norton, assisted by Fred Cater, emplaced forty-five 2-m probes containing Pallmann solution in various parts of the park (fig. 7). Some of the sites selected for probe emplacement were located adjacent to those places previously used to col lect obsidian which was used to date volcanic flows and glacial events. Another group of probes was placed both inside and outside of the Yellowstone caldera in an at tempt to determine if there was a measurable difference in ground temperature between these two areas. Previous analysis of data from obsidian-hydration measurements of K-Ar dated obsidian flows had sug gested a higher ground temperature at 2-m depth inside of the caldera as compared with the outside. We tried to place all our probes as far as possible from known ther mal areas. The probes were all emplaced in level ground. Where possible, we selected areas that would remain in the sun all day. A description of the location of the sites is given in table 7.
FIELD INVESTIGATIONS
In September 1976, the first group of probes was removed after having been in place for 1 year, and was reemplaced with new Pallmann solutions. In addition to these initial 45 sites, 12 new sites were added in September and October of 1976. In October 1977, the Pallmann vials were retrieved from all sites and most sites were then abandoned. All the vials containing the Pallmann solution were frozen in dry ice immediately upon removal from the probe. The rotation of polarized light of the solutions were all measured within a day or two with equipment set up in the park. The results are given in table 8.
In late September and early October of 1978, instan taneous ground-temperature measurements at 0.5- , 1-, and 2-m depth were made at all sites. In February of 1979, ground temperatures at these same depths were
measured at a group of selected Pallmann sites. These instantaneous measurements taken in September 1978, and February 1979, at or near the maximum and minimum of the annual temperature cycle allow us to convert Pallmann-effective annual temperatures to obsidian-effective temperatures, and also to arithmetic- mean annual temperatures (see PART I).
A description of the Pallmann probes and the tech niques used to emplace them are given in PART I. The instantaneous temperatures were obtained using ther mistor probes (Enviro Labs Model1 DT101) which were allowed to remain in place until the temperature stabilized to within 0.05°C (Celsius) when read at 10- minute intervals. The time to reach a constant temperature was minimized by adjusting the thermistor probe to the approximate ground temperature before in serting it into the ground. In the autumn, the thermistor probes reached equilibrium within Vz to 3/4 hour.
In the winter the above procedure was modified because of temperature changes in the holes caused by penetration of cold air. To minimize this effect, the probes were inserted in the ground as soon as possible after the holes were completed. The temperature of the probes was initially adjusted to be slightly cooler than that of the ground. Upon insertion into the ground, the temperature rapidly increased to a maximum, and then began to decrease as cold air penetrated into the freshly opened soil. When this occurred, we pounded the probes about 2-4 cm (centimeter) farther into the ground and observed a rise in temperature as fresh warm soil was penetrated by the probe. This second maximum was recorded as the actual ground temperature. The results of these instantaneous temperature measurements are given in table 9 and plotted in figure 8.
DISCUSSION
The annual integrated ground temperature is a func tion of the soil thermal diffusivities plus the:
1. Heat flow from the surface downward.2. Heat flow from the interior upward.
The heat flow downward will be determined by the hours of sunlight, amount of shade received by the site, the type of ground cover, the albedo of the soil, the amount and duration of snow cover as well as the air temperature and wind velocity, both of which are somewhat dependent upon elevation.
If we desire to determine the effective annual temperature at a particular site for obsidian or amino- acid dating studies, then the Pallmann measurements will yield the necessary data. However, if we desire to
'Use of trade name in this paper is for descriptive purposes only and does not constitute en dorsement of the product by the U.S. Geological Survey.

GROUND TEMPERATURES, YELLOWSTONE NATIONAL PARK110°
FIGURE 7. Generalized sketch map of Yellowstone National Park and vicinity showing site localities and numbers.

26 GROUND TEMPERATURE MEASUREMENTS
TABLE 7. Description of sites
Site (geographic order) No. Name
Topographic quadrangle name1
Latitude, N. Longitude, W. Altitude2deg min s Directions to site3
1. TetonPass -------------- TetonPass (7.5')--------- 43 29 31 110 57 17 8630
2. Snake River------------- Jackson (7.5') --
3. Mosquito Creek---------- TetonPass (7.5')
4. West Yellowstone Flow - - - West Yellowstone (shade).
60. W. Yellowstone Flow ----- - - - do(sun).
5. Madison Plateau Rd. ----- - - - do
6. West Entrance - ---------- ---do
7. Miller Garden ----------- Miner-----
43 27 53 110 52 20 6160
43 26 24 110 56 39 6780
44 35 29 111 8 39 7540
44 35 29 111 8 39 7540
44 39 14 111 6 39 6660
44 39 9 111 5 0 6660
45 5 14 110 46 33 5120
55. MillerField ------------- ---do--
8. Pebble Creek ------------ Abiathar Peak
9. Lamar Ranger Station---- ---do ---
45 40 110 46 34 5120
44 55 4 110 6 54 7040
44 53 46 110 13 27 6740
10. SloughCreek ------------ Tower Junction---------- 44 45 35 110 18 58 6220
11. BunsenPeak ------------ Mammoth-------------- 44 55 28 110 43 21 7280
13. MesaRoadI--------------Madison Junction ------ 44 37 11 110 49 42 7180
14. CougarCreek------------ ... do
15. MesaRoadll------------ ---do
44 40 49 110 57 57 6900
16. Harlequin Lake ---------- ..-do ----
17. Norris Junction ---------- Norris Junction -
18. Cascade Meadows -------- ---do(shade).
54. Cascade Meadows -------- ..-do(sun)
19. UpperFalls ------------- ---do
2630
1880
2065
2300
2300
2030
2030
1560
1560
2145
2055
1895
2220
2190
2105
0. 7 mi S . on service road from Teton Pass to transmission tower; 20 yd W. from tower to site (not shown on fig. 7).
2.6 mi S. on secondary road from Wilson; 10 yd E. from road to site (not shown on fig. 7).
4.4 mi S. on secondary road from Wilson; 4.5 mi W. on dirt road; 5 yd N. from road to site (not shown on fig. 7).
6.6 mi S. on Madison Plateau Rd. from W. Yellowstone; 40 yd W. from road to site.
15 yd E. of site 4.
0.4 mi S. on Madison Plateau Rd.from W. Yellowstone; 15 yd E.from road to site.
0.3 mi S. on service road fromW. Entrance; 10yd from rearof pumphouse.
4.9 mi NW. on Rt. 89 fromGardiner to Miller property;60 yd N. of residence at end
44 38 20 110 48 15 7180 2190
44 38 27 110 53 30 6800 2075
44 43 30 110 40 54 7500 2285
44 44 7 110 30 57 7950 2425
44 44 7 110 30 46 7880 2400
44 42 57 110 30 57 7960 2425
4.9 mi NW. on Rt. 89 from Gardiner to Miller property; 120yd SW. of residence to site.
40 yd N. of parking lot of Pebble Creek Campground.
0.4 mi NW. on unimproved dirt road from Lamar Ranger Sta tion; 60 yd W. from road to site.
0.4 mi N. on Slough Creek Camp ground road from its inter section with NE. Entrance road; 10 yd E. from road to site.
0.6 mi S. on Bunsen Peak Rd., from its intersection with Grand Loop Rd.; original site No. 11, 4yd SW. from road; site Nos. lla, b, c, and d, 13 yd SW. from road.
1.3 mi E. on Mesa Rd. from its intersection with Grand Loop Rd.; 10 yd S. from road to site.
I.5 mi NW. on trail starting from E. side of bridge crossing Madison R. at a point 7.4 mi E. of the W. Entrance on W. Entrance Rd.; lOydN. 80°E. from trail -marker sign to site.
3.1 mi E. andNE. onMesaRd. from its intersection with Grand Loop Rd.; 5 yd E. from road to site.
II.7 mi E.onW. Entrance Rd.from W. Entrance; 30 yd N.from road to site.
0.8 mi W. on Norris- Canyon Rd.from Norris Jet. ; 50 yd. S. fromroad to site.
1.2 mi E. on Norris-Canyon Rd.from Canyon Jet.; 40 yd. N.from road to site.
1 .1 mi W. on Norris-Canyon Rd.from Canyon Jet. ; 20 yd N. fromroad to site.
0.6 mi W. on service road fromits intersection with GrandLoop Rd.; 40 yd S. from roadto site.

GROUND TEMPERATURES, YELLOWSTONE NATIONAL PARK
TABLE 7. Description of sites continued
27
Site (geographic order) No. Name
Topographic quadrangle name 1
Latitude, N. Longitude, W. Altitude2deg min deg min s Directions to site3
20. Elk Antler Creek--------- Canyon Village---------- 44 38 18 110 26 59 7720 2355 8.4 mi S. on Grand Loop Rd.from Canyon Jet.; 70 yd NW. from road to site.
21. Blacktail Deer Dr. -------- Tower Junction ---------- 44 55 36 110 27 19 6840 2085 0.6mi W. on BlacktailDeerDr.from its eastern intersection with Grand Loop Rd.; 20 yd S. from road to site.
22. TowerFall -------------- ... do ------------- 44 51 56 110 23 37 7080 2160 2.3 mi S. on Grand Loop Rd.from its intersection with Tower Falls Campground; 40 yd W. from road to site.
23. LeHardys Rapids -------- Canyon Village ---------- 44 36 15 110 23 0 7800 2375 2.6 mi N. on Grand Loop Rd. fromLake Jet.; 50 yd W. from road to site.
24. Grants Pass I ------------ Old Faithful ------------ 44 23 17 110 49 53 7900 2410 2.4 mi S. on trail from foot bridge over the Firehole R. located near Lone Star geyser; 10 yd W. from trail to site.
25. GrantsPassH ----------- ... do ------------- 44 22 56 110 49 36 8000 2440 2.9 mi S. on trail from foot bridge over the Firehole R. located near Lone Star geyser; 5 yd S W. of trail to site at Continental Divide.
26. DeLacy Creek ----------- WestThumb------------ 44 27 4 110 41 15 8000 2440 7.9miW. on Grand Loop Rd.from W. Thumb Jet.; 30 yd SW. from road to site.
27. DivideLake------------- ... do ------------- 44 26 5 110 38 17 8380 2555 4.1 mi W. on Grand Loop Rd.from W. Thumb Jet.; 10 yd N. of road to site.
28. Little Thumb Creek------ ... do ------------- 44 25 14 110 36 11 8200 2500 2.1 mi W. on Grand Loop Rd.,from W. Thumb Jet.; 20 yd SW. from road site.
29. Turbid Lake (shade).----- Canyon Village ---------- 44 33 7 110 16 1 7920 2415 3.0 mi E. on service road from itsintersection with E. Entrance Rd. at Squaw Lake; 15 yd NE. from road to site (22 yd SE. of site No. 30).
30. Turbid Lake (sun).------- --- do ------------- 44 33 10 110 16 3 7910 2410 20 yd NW. of site No. 29.31. Mummy Cave ----------- Clayton Mountain (7.5')-- 44 27 33 109 42 57 6130 1868 17.4 mi E. on Wyoming Rt. 16
from E. Entrance; 15yd SE. from road to site, (not shown on fig. 7).
32. FishingBridge----------- Canyon Village---------- 44 33 42 110 21 49 7780 2370 1.0 mi E. on E. Entrance Rd.from Fishing Bridge; 10 yd N. from road to site.
33. Pelican Creek Campground- ... do ------------- 44 36 16 110 20 49 7760 2365 0.4 mi N. on Pelican Creek Camp-(sun). ground road from its inter
section with E. Entrance Rd.; 15 yd W. of parking turnout.
34. Pelican Creek Campground- ... do ------------- 44 36 16 110 20 50 7760 2365 0.4 mi N. on Pelican Creek Camp-(shade). ground road from its inter
section with E. Entrance Rd.; 5 yd E.of parking turnout.
35. Natural Bridge ---------- ... do------------- 44 31 42 110 26 45 7820 2385 0.7 mi W. on Natural Bridge roadfrom its intersection with Grand Loop Rd.; 25 yd N. from road to site.
36. SandPoint-------------- Franklsland ------------ 44 29 36 110 25 26 7880 2400 3.6 mi S. on Grand Loop Rd. fromits intersection with Natural Bridge road; 35 yd NW. from road to site.
37. PumicePoint ------------ WestThumb------------ 44 27 47 110 28 45 7760 2365 9.9 mi N. on Grand Loop Rd. fromW. Thumb Jet.; 10yd NW. from road to site.
38. ArnicaCreek ------------ ... do ------------- 44 28 40 110 31 56 7760 2365 5.8 mi N. on Grand Loop Rd.from W. Thumb Jet.; 30 yd N. from road to site.
39. Grant Village------------ --- do ------------- 44 23 24 110 33 57 7840 2390 0.2 mi E. on Grant Village roadfrom its intersection with S. Entrance Rd.; 15yd N. from road to site.
41. Falls River -------------- Warm River Butte ------- 44 3 1 111 11 39 5935 1810 0.3 mi E. on Reclamation Rd.from Targhee National Forest boundary; 10 yd NE. from road to site.

28 GROUND TEMPERATURE MEASUREMENTS
TABLE 7. Description of sites continued
Site (geographic order) No. Name
Topographic quadrangle name 1
Latitude, N. Longitude, W. Altitude2deg min s Directions to site3
42. Grassy Lake Grassy Lake Reservior---- 44 7 34 110 50 35 7300
43. Lamar Canyon East I----- Tower Junction---------- 44 54 53 110 15 49 6560
58. Lamar Canyon East II---- ---do ---
45. Fossil Forest------------- Abiathar Peak
46. FlintCreek-------------- ..-do---
47. Timothy Creek ---------- Pelican Cone -
48. Saddle Mountain -------- Sunlight Peak
49. Little Lamar River ------- Pelican Cone -
50. ColdCreek------------- ..-do--
51. Miller Creek------------- Abiathar Peak
52. Cache Creek (sun) -------- - - - do - - -
53. Cache Creek (shade)------ ---do ---
56. Gravel Pit --------------- Tower Junction
57. Lamar Canyon West------ ---do ----
59. Ashton ------------------ Warm River (7.5'
44 54 53
44 51 28
44 46 5
44 42 54
44 42 6
44 40 20
44 41 0
44 45 16
44 47 59
44 47 59
44 54 28
44 55 13
44 4 19
110 15 49 6560
110 14 20 8400
110 10 15 9025
110 9 47 8520
110 59 31 9820
110 1 32 7440
110 3 22 7250
110 5 51 7160
110 7 38 6870
110 7 38 6870
110 20 46 6180
110 18 12 6360
111 21 16 5565
2225 1.1 mi W. on Reclamation Rd. from the W. end of the Grassy Lake Dam; 5 yd SW. from road to site.
2000 2.6 mi E. on NE. Entrance Rd. from its intersection with Slough Creek Campground road; 20 yd N. from road to site.
2000 10 yd E. of site No. 43 to site No. 58
2560 2.7 air miles S.4°12'W. fromLamar Ranger Station; 15 yd SW. from edge of forest.
2750 2.9 air miles S.77°48'W. fromCalfee Creek Patrol Cabin; 180 yd N. of Flint Creek tributary.
2595 5.5 air miles N.67°0'W. from Cold Creek Patrol Cabin; 30 yd. E. from buffalo wallow.
2995 2.1 air miles N.63°30'W. from Upper Lamar R. Ranger Station; 70 yd S. from saddle between Little Saddle Moun tain and Hayne Mountain.
2270 1.8air milesN.66°0'W. from Cold Creek Patrol Cabin; 25 yd NE. from edge of forest.
2210 0.2 air miles E. from Cold Creek Patrol Cabin to forest edge; 20 yd E. from forest edge to site.
2180 1.8 air miles S.27°36'E. from Calfee Creek Patrol Cabin.
2095 1.6 air miles N.26°24'W. from Calfee Creek Patrol Cabin to campsite 34 signpost; 40yd NE. from signpost to site.
2095 30 yd E. from site No. 52 to site No. 53.
1885 4.2 mi E. on NE. Entrance Rd. from Tower Jet.; 20 yd N. from road to site.
1940 6.6 mi E. on NE. Entrance Rd. from Tower Jet.; 15 yd N. from road to site.
1695 6.3 mi E. on Rt. 67 from Ashton to junction with Reclamation Rd.; site is in northerly part of triangular junction, 5yd from Reclamation Rd. (not shown on fig. 7).
'All quadrangles are 15 minute unless otherwise noted.! Altitudes given to ±20 ft and ±5 m.'Odometer mileage; paced yards. A 1-yd pace equals about 1 m.

GROUND TEMPERATURES, YELLOWSTONE NATIONAL PARK
TABLE 8. Pallmann temperatures[t, temperature; At, difference in temperature between 1-m and 2-m values; leaders (- - -) indicate no data]
29
Corrected temp '
Site (geographic order)No.
1.
2.
3.
4.
5.
6.
7.
55.
8.
9.
10.
43.
11.
13.
14.
15.
16.
17.
18.
54.
19.
20.
21.
22.
23.
24.
25.
26.
27.
28.
29.
30.
32.
33.
34.
35.
Name
W. Yellowstone Flow (shade) -
MillerField ----------------
Pphhlp Prpplr
IVTpQfl Rnn H TT
Cascade Meadows (shade). - - -
Elk Antler Creek ------------
Rlanlrtail Floor Fir
TowerFall -----------------
FlpT flf*\7 Proolr
Little Thumb Creek ---------
Turbid Lake (shade) ---------
Pelican Creek Campground - - (sun).
Pelican Creek Campground - - (shade).
Depth (m)
1 2 1 2 1 2 1 2 1 2 1 2 1 2 1 2 1 2 1 2 1 2 1 21 2 1 2 1 2 1 2 1 2 1 2 1 2 1 2 1 2 1 2 1 2 1 2 1 2 1 2 1 2 1 2 1 2 1 2 1 2 1 2 1 2 1 2 1 2 1 2
1976f°C
2.68 2.38
5.99 4.98 4.62 3.13 2.83
4.56 5.86 5.23
11.40 12.08
5.22 4.04 4.83 4.12 6.49 8.12
4.88 4.64 4.71 4.47 6.72 6.06 4.23 4.36 4.20 4.16 5.92 6.29
3.26
4.53 4.43 3.82 3.66 5.59 4.95 6.07 5.08 3.04 2.25 2.57 2.27 2.81 2.09 4.05 3.90 3.22 2.56
2.44 3.65 3.96
5.62 3.54 3.22 7.17 7.50 4.79 5.81 5.35 6.08
At
0.30
.36
.30
.43
-.28
1.18
.71
-1.63
0.24
.24
.66
-.13
.04
QB
.10
.16
.64
.99
.78
.30
.72
.15
.56
-.31
.32
-.33
-1.02
-.73
t°c
2.64 2.40 7.58 6.26 5.24 4.59 3.05 2.75 6.25 5.26
'10.99 '11.74
3 9.34 '9.02
4.35 5.02 4.26
7.02 6.035.05 4.65
7.02 6.14 4.01 4.29 4.57 4.19 6.15 6.48 3.32 3.20 6.08 5.54 4.68 4.64 3.72 3.69 5.30 4.91 5.95 4.99 2.68 2.32 2.52 2.27 3.03 2.33 3.77 3.86 3.61 2.99
3.41 3.71 5.72 5.54 3.44 3.29 7.17 7.89 4.50 5.70 5.44 6.13
1977At
0.24
1.32
0.65
.30
.99
-.75
.32
.76
.99
0.40
.88
-.28
.38
-.33
.12
.53
.4
.03
.39
.96
.36
.25
.70
-.09
.62
-.30
.18
.15
-.72
-1.20
-.69
Correction (both 1 and 2 m)
Alt'
+1.6
-.8
-.2
+ .5
-.3
-.3
-1.9
-1.9
0
_ 0
-.8
-.4
+.3
+.2
-.1
+.2
-.2
+ .5
+ 1.0
+ .9
+1.0
+ .7
-.2
+.1
+ .8
+.9
+ 1.0
+1.0
+ 1.4
+ 1.2
+.9
+ .9
+ .8
+ .8
+ .8
+ .8
Site1
+ 2.0
+ .5
+1.0
+2.0
+1.0
+1.0
0
0
+.5
0
0
0
0
+ 1.5
0
+.5
+ 2.0
+1.0
+1.5
0
+.5
0
0
+.5
+ 1.5
+1.5
+ 1.5
+ 1.5
+ 1.5
+2.0
+2.0
0
+ 1.5
+.5
+ 2.0
+1.0
1976
6.3 6.0
5.7 5.8 5.4 5.6 5.3
5.3 6.6 5.9 9.5
10.2
5.7 4.5 4.5 3.8 5.7 7.3
5.2 4.9 6.4 6.2 6.6 6.0 4.9 5.1 6.0 6.0 7.4 7.8
5.8
6.0 5.9 4.5 4.4 5.4 4.8 7.6 6.6 5.3 4.6 5.0 4.7 5.3 4.6 6.6 6.4 6.1 5.5
5.6 6.6 6.9
6.5 5.8 5.5 8.5 8.8 7.6 8.6 7.2 7.9
1977
6.2 6.0 7.3 6.0 6.0 5.4 5.6 5.3 7.0 6.0
9.1 9.87.4 7.1
4.9 4.7 4.0
6.6 5.65.4 5.0
6.9 6.0 4.7 5.0 6.4 6.0 7.7 8.0 5.8 5.7 7.0 6.4 6.2 6.1 4.4 4.4 5.1 4.7 7.5 6.5 5.0 4.6 4.9 4.7 5.5 4.8 6.3 6.4 6.5 5.9
6.3 6.6 6.6 6.4 5.7 5.6 8.5 9.1 7.3 8.5 7.2 7.9
»C
Avg 1976-77 at 2m
6.0
5.9
5.4
5.3
5.7
5.9
10.0
7.1
4.7
3.9
7.3
5.6
5.0
6.2
6.0
5.1
6.0
7.9
5.8
6.4
6.0
4.4
4.8
6.6
4.6
4.7
4.7
6.4
5.7
5.6
6.8
6.5
5.6
9.0
8.6
7.9

30 GROUND TEMPERATURE MEASUREMENTS
TABLE 8. Pallmann temperatures continued
Corrected temp °C
Site (geographic order) No. Name
Depth(m)
1977Correction
(both 1 and 2 m)t°C Alt' Site' 1976 1977
Avg 1976-77 at 2m
36. SandPoint----------------- 1 4.002 3 73
37. PumicePoint--------------- 1 5.092 5.68
38. ArnicaCreek -------------- 1 4.762 4.56
39. Grant Village--------------- 1 6.852 8.09
41. FallsRiver ----------------- 1 6.242 5.85
42. GrassyLake---------------- 1 3.542 3.18
45. Fossil Forest ---------------- 12
46. FlintCreek----------------- 12
47. Timothy Creek ------------- 12
48. Saddle Mountain ----------- 12
49. Little Lamar River ---------- 1 ---2
50. ColdCreek----------------- 12
51. MillerCreek---------------- 12
52. CacheCreek(sun)----------- 12
53. Cache Creek (shade).-------- 1 ---2
.27
-.59
.20
-1.24
.39
.36
3.90
5.005.604.965.027.048.457.556.734.143.514.133.43
3.95
3.742.912.464.183.464.764.526.285.896.876.94
5.92
-.60
-.06
-1.41
.82
.63
.70
.45
.72
.24
.39
.07
+ .9
+.8
+ .8
+ .8
-1.1
+ .3
+ 1.4
+2.0
+ 1.5
+2.8
+ .4
+ .3
+.2
-.1
-.1
+ 1.5
+ 1.5
+ 1.5
+ 1.5
0
+ 1.0
0
0
0
0
+ 1.0
0
0
0
2.0
6.4 6.1 7.4 8.0 7.1 6.9 9.2
10.4 5.1 4.8 4.8 4.5
6.3
7.3 7.9 7.3 7.3 9.3
10.8 6.5 5.6 5.4 4.8 5.5 4.8
6.0
5.2 5.7 5.3 5.6 4.9 5.1 4.8 6.5 6.1 6.8 6.8
7.8
6.1
8.0
7.1
10.6
5.2
4.7
4.8
6.0
5.2
5.3
4.9
4.8
6.1
6.8
7.8
'All sites are normalized to an altitude of 7000 ft (2133 m) by applying a lapse rate of FC per 1000 feet of altitude.!A11 sites normalized to a condition where site receives full sun all day.'Solution of pH=3.51 used for these probes. All other probes contained pH=1.93 Pallmann solution.

GROUND TEMPERATURES, YELLOWSTONE NATIONAL PARK
TABLE 9. Instantaneous temperature measurements in degrees Celsius
[Data in italics are estimated. Leaders (- - -) indicate no data. Last column, At, 2 m is the temperature difference between 1978, 2m and 1979, 2m]
31
No.
4.
7. 8. 9.
10. 11. 14. 15. 16. 18. 19. 20. 21. 22. 23. 24. 25. 26. 27. 28. 29. 30. 32. 33.
SiteName
W. Yellowstone Flow ----- (shade)
Pebble Creek ------------ Lamar Ranger Station ----
Cascade Meadows (shade)
Grants Pass I ------------ Grants Pass n ----------- DeLacy Creek -----------
Little Thumb Creek ------ Turbid Lake (shade) ------ Turbid Lake (sun) -------- Fishing Bridge -----------Pelican Creek Campground
(sun)
Sept.-Oct. 1978 Feb. 19790.5m
5.4
12.1 6.7 7.6
10 37.0Q Q
4.2 5.8 5.2
5.0 7.2 7.24.94.0 5.3 3.3 5.8 4.5 4.4 5.5 4.8 7.5
1m
5.1
13.5 7.4 7.5 9 97.0
5.1 6.5 5.1
5.7 7.5 7.7
4.5 5.3 5.0 5.5 4.6 5.0 6.7 5.5 8.9
2m 0.5m 1m 2m
4.7 0 0.6 1.7
6.4 6.4Q Q
6.7 .7 1.7 3.7
6.1 6.7 -1.0 .9 4.1 4.9 -.2 1.2 2.3 6.2
6.9 0 2.1 4.47 *
3.9 4.3 6.2 4.8 -.3 -.6 3.3 4.8 5.4 7.3 5.2 9.8
At, 2m
3.0
7.6 3.0 3.0 3.0 3.0 3.0 3.0 2.6 2.6 3.0 1.3 2.5 3.0
2.0 2.0 2.0 1.5 1.5 3.0 3.0 3.0 1.5
No.
34.
35. 36. 37. 38. 39. 41. 42. 45. 47. 48. 49. 50. 51. 52. 53. 54. 55. 56. 57. 58. 59. 60.
SiteName
Pelican Creek Campground (shade)
Natural Bridge ---------- Sand Point -------------- Pumice Point ------------
Grassy Lake ------------- Fossil Forest ------------- TimothyCreek ---------- Saddle Mountain -------- Little Lamar River -------
Cache Creek (sun) -------- Cache Creek (shade) ------ Cascade Meadows (sun) - - MillerField ------------
Lamar Canyon West ------ Lamar Canyon East n ----
W. Yellowstone Flow (sun)
Sept.-Oct. 1978 Feb. 19791.5m
5.5
6.0 5.5 5.2 6.1 6.6 9.44.5 6.4 5.3 3.4 6.2 6.5 8.0 9.0 6.0 7.5
10.4 12.2 9.8 9.9 9.9 6.9
1m
6.8
7.3 5.4 6.1 6.2 8.1
4.9 6.7 6.0 4.3 6.7 7.3 8.7 9.5 6.9 7.6
11.5 11.9 9.5 9.4
10.8 6.8
2m 0.5m 1m 2m
7.7
8.2 5.4 7.0
9.5 2.7 4.9 8.6
5.0 6.0 6.2 4.3 5.1 6.4 8.7 9.4 7.47.5 .5 1.6 4.4
11.9 -.6 1.7 5.4 10.6 9.8 -1.8 .6 5.5 8.4
10.4 1.1 3.4 6.7 6.7 .8 1.3 2.5
At, 2m
2.0
1.5 3.0 2.0
0.9 3.0 3.0 3.0 3.0 3.0 3.0 3.0 2.0 1.5 1.5 3.1 6.5 1.5 4.3 1.5 3.7 4.2

32 GROUND TEMPERATURE MEASUREMENTS
SLOUGH CREEKAND VICINITY
(9 Sites)
-2
4 6 8 10
TEMPERATURE, IN DEGREES CELSIUS
12 14 16
FIGURE 8. Above and facing page. Plot of instantaneous ground-temperature measurements made in late September 1978, and mid-February 1979. The sites plotted under "geothermal" are those sites that fall in the temperature groupings 3, 4, 5, 6 and 7 in figure 9. Slough Creek plot is from areas of possible anomalous heat flow.

GROUND TEMPERATURES, YELLOWSTONE NATIONAL PARK 33
0.5
1.5
PART SHADE (7 Sites)
-2 4 6 8 10
TEMPERATURE, IN DEGREES CELSIUS
12 14 16

34 GROUND TEMPERATURE MEASUREMENTS
determine the relative heat flow upward from the in terior of the Earth, then we must have a method of nor malizing all sites to the same net heat flow downward from the ground surface. We attempted to do this for the Yellowstone sites by first making an altitude correction normalizing all sites to an altitude of 7,000 feet. This was first attempted by applying the pseudoadiabatic lapse rate of 2°C/1000 ft elevation. This altitude correction, when applied to pairs of stations differing only in altitude, did not give corrected temperatures that were equal at the two sites. A correction of 1°C per 1,000 feet of elevation yielded corrected temperature values in bet ter accord in each of the paired stations. A lower lapse rate may be due to the sinking of cold air to the valley bottom. This effect, most noticeable in winter, will tend to reduce the normal lapse rate. These corrections are given in table 8.
The second correction applied to the data was for degree of shade received by the site. A completely open site one that received all of the available sun all year long was found to have an effective annual tempera ture that was 2°C higher at a depth of 2 m than a nearby completely shaded site. After estimating the degree of shade on a scale of 1 through 5, all sites were normalized to the completely open site condition by adding the ap propriate correction (see table 8) to the altitude- corrected temperature. These corrections are considered to be a first approximation. Other corrections, such as soil thermal diffusivity, snow cover, and soil albedo, are not easily made, and were not evaluated. The corrected Pallmann temperatures are listed in table 8. Figure 9 is a map of the area under investigation with the 2-m cor rected Pallmann temperatures shown for each site.
To convert Pallmann-effective temperatures to obsidian-effective temperatures and to arithmetic-mean temperatures, the plots (16) in figure 1, PART I were used. The minimum ground temperatures could not be obtained for many sites, and therefore we have esti mated the minimum temperature for these sites. These estimated temperatures are shown in italic type in table 9.
The temperature spread between summer maximum and winter minimum at 2 m is small, 3°C or less for most sites. As a result, the difference'between Pallmann- and obsidian-hydration effective temperature is 0.1°C or less at 2 m for all sites in the park. This will not be true for obsidian exposed at depths shallower than 2 m. For these samples, the constants used to convert from Pallmann- to obsidian-hydration effective temperature can be com puted from the 1-m data given in tables 8 and 9, together with plots in figure 1, PART I.
In terms of snow depth, the winter of 1975-76 was nor mal. However, the winter of 1976-77 was extremely dry with about one-third the normal snow depth. In 1977-78, about two to three times the normal snow depth was
recorded in the park. The 1978-79 winter was extremely cold with no respite through February, 1979. The snow fall was normal, and the ground was insulated from the cold by the snow (1-2 m snow depth by early February).
RESULTSAs discussed in PART I, the Pallmann temperatures
given in table 8 differ from arithmetic-mean annual temperatures. In general, they will show higher readings than "arithmetic" mean annual, because the Pallmann solutions react in a nonlinear manner, that is, the reac tion rate is an exponential, rather than a linear, function of temperature. In addition, in areas of normal heat flow, the upper vial will indicate a higher integrated tempera ture than the lower, again due to the higher tempera tures experienced by the upper solutions as compared to the lower. Several sites must have been close to sources of high geothermal heat flow. At these places, extremely high temperatures were recorded at 2 m and these temperatures were higher than those recorded at 1 m. The Pallmann site near Grant Village was particularly hot, and we understand that wells drilled in the vicinity of Grant Village have encountered extremely hot water at rather shallow depths. Anomalously high Pallmann temperatures were also recorded at other sites, including the Slough Creek site and the Norris Junction site.
As mentioned previously, the Slough Creek site (10) yielded anomalously high Pallmann temperatures as compared to similar sites nearby. Additional Pallmann probes were placed at sites adjacent to Slough Creek (sites 43, 58), and the results are shown in figure 9. In ad dition to these Pallmann probes, instantaneous temper ature measurements (in September 1978, and February 1979) were made at three places close to the Slough Creek site (sites 56, 57, 58). These results are given in table 9. All of these results suggest an area of high heat flow in the Slough Creek area.
The winter of 1978-79 was one of the coldest on record. Not only were extremely low temperatures recorded (-56° Fahrenheit at Old Faithful) but the cold persisted without letup from mid-November 1978, through February 1979. In spite of this, the frost level did not penetrate deeply into the ground. At all but one site, the freezing line was between 0.5 and 1 m. The exception was Elk Antler Creek in Hayden Valley where the freez ing line was just below 1 m. This site was exposed to the wind, and the snow depth when we visited in February 1979, was only about 0.25 m, in contrast to the 1-2 m of snow cover at all the other sites. Evidently, the low- density abundant snow fell early enough in the fall to act as an effective thermal insulation at most sites.
In figure 10 we have plotted the corrected effective annual Pallmann temperatures at 2 m. Inasmuch as the corrections that we have applied to the measured tern-

GROUND TEMPERATURES, YELLOWSTONE NATIONAL PARK 35
110° 111°
Main roads
Other roads
Park boundary
5 10I - t
10 15 MILES
FIGURE 9. Yellowstone National Park and vicinity with the average corrected 2-m Pallmann temperature for 1976 -1977 shown for each site. These temperatures, in degree Celsius, have been normalized to 7000 ft (2133 m) and to a site that received all available sun (unshaded).

36 GROUND TEMPERATURE MEASUREMENTS
TEMPERATURE, IN DEGREES CELSIUS 678 10 11
Geothermal
Slough Creek _ and vicinity
Full sun
Deep shade
Part shade
+1 +2 +3 TEMPERATURE GROUP
+4 +5 +6
FIGURE 10. Plot of 2-m corrected Pallmann temperatures, arranged by types of sites: geothermal, Slough Creek and vicinity,full sun, deep shade, and part shade.
peratures have served to normalize these temperatures to a common heat flux from the surface downward, the variations in corrected temperatures at a depth of 2 m will be due to variable heat flux upward. If the sites with the lowest temperatures, (between 4° and 5°C) are taken as a base, the corrected temperatures at all other sites can be compared to this group. The sites in the temperature range 5°-6°C will be designated +1, those in the range 6°-7°C, +2, and so forth. These groupings, from 0 to +6, are a measure of the amount of geothermal heat flux received by members of each group. The group number is plotted on a map of the Yellowstone area (fig. 11). Areas of high heat flow are also shown enclosed by dotted lines.
Although sites inside the Yellowstone caldera tend to show greater geothermal heat flux than do those outside the caldera, the relatively small number of total sites does not allow us to make a more definitive statement in this regard. The area of high heat flow near Slough Creek is somewhat surprising inasmuch as the closest known hot springs are those on the Yellowstone River, about 4.4 mi (miles) west of the site. The hot area near Cache Creek is about 2 mi southwest from Wahb Springs (hot) while the Pelican Creek Campground sites are about 2.5 mi from known hot springs. On the other hand, both the LeHardy Rapids and Elk Antler Creek sites are close (LeHardy, 2 mi, Elk Antler, 1 mi) to large thermal areas, and neither site shows any geothermal influence. The two sites at Grants Pass also do not show geothermal ef fects, even though they are 2 mi from the Shoshone Geyser Basin. Obviously, mere geographic proximity to a
geothermal feature is not a sufficient criterion, to predict geothermal contribution at a site. The ground-water regime must be the important link in order for a site to display a high geothermal heat flow at 2-m depth. In fact, the areas containing cool sites are probably places where ground water is moving downwards, whereas the hot sites are caused by warm ascending ground water.
It is interesting to note that site 7 is about 25 yd from a small warm-spring orifice. Site 55 is about 125 yd from site 7 and approximately 150 yd from the spring. The temperature at 2-m depth at site 55, while still high, is 2.9°C less than at site 7 (see table 8).
In figure 12, we have plotted the 2-m corrected Pall mann temperatures versus the difference in Pallmann temperature recorded by the 1- and 2-m Pallmann vials. In addition to the sites in Yellowstone Park, we have also plotted data from eight sites outside the park; sites that we believe to be remote from the high geothermal heat flow associated with the park. These latter sites define a line (A) shown on the diagram, of positive slope. This means that those sites having the highest temperatures at 2 m also have the highest positive Pallmann tempera ture gradient (l :m vial higher Pallmann temperature than the 2-m vial). This is in keeping with the higher heat flux downward at these sites. On the other hand, the sites in Yellowstone define a line of negative slope (B). This indicates the greater contribution of upward heat flux at these sites.
The instantaneous temperature measurements made in late September and early October 1978, can be used to aid in delineating the extent of the area of possible
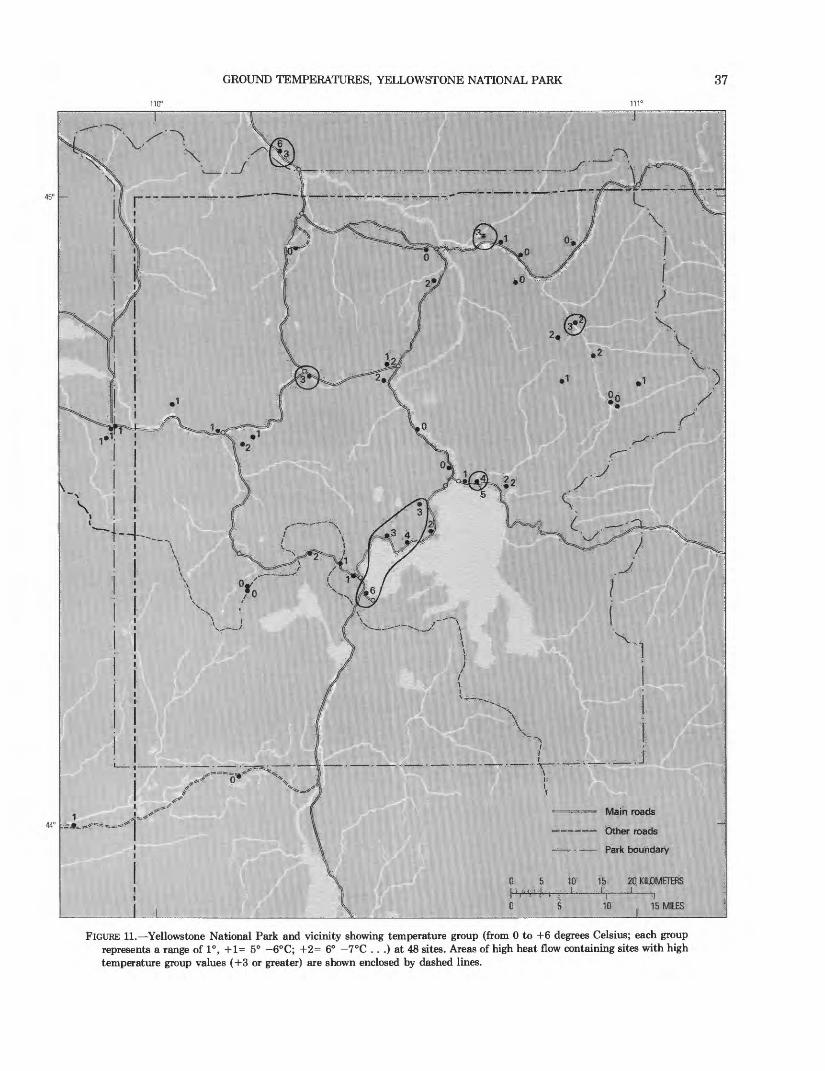
GROUND TEMPERATURES, YELLOWSTONE NATIONAL PARK 37
110° 111°
Mem roads
(Dther roads
Park
,tD 15MHS
FIGURE 11. Yellowstone National Park and vicinity showing temperature group (from 0 to +6 degrees Celsius; each group represents a range of 1°, +1= 5° -6°C; +2= 6° -7°C . . .) at 48 sites. Areas of high heat flow containing sites with high temperature group values (+3 or greater) are shown enclosed by dashed lines.

38 GROUND TEMPERATURE MEASUREMENTS
678
TEMPERATURE, IN DEGREES CELSIUS
10 11
FIGURE 12. Plot of 2-m corrected Pallmann temperatures versus difference in temperature between 1 and 2 m. Solid circles are from data for sites outside Yellowston National Park that are believed to be remote from geothermal influence. Open circles are data for sites in and adjacent to the park. Lines A and B are least-mean-square fits to the two sets of data points.
anomalous heat flow adjacent to Slough Creek. In figure 13 we have plotted the instantaneous 2-m temperatures, corrected for altitude using the 1°C per 1000 feet (305 m) lapse rate. The data is grouped by whether the sites were in full sun, partial shade, or deep shade. In addition to these groups, the sites that fall in the +3, +4, +5, and +6 categories of figure 9 have been plotted as a separate group labeled "geothermal". The group labeled "Slough Creek" are sites adjacent to Slough Creek. Note that sites 8 and 9 which are east of Slough Creek (Pebble Creek and Lamar Ranger Station) as well as site 21, (Blacktail Deer Drive) west of Slough Creek, all fall in the "normal" group having relatively low 2-m instan-
! taneous temperatures. On the other hand, the sites from just east of Lamar Canyon (site 58) to the gravel pit on the highway west of Slough Creek (site 56) all showed high ground temperatures in the range of the "geother mal" group, the temperature increasing from east to west.
CONCLUSIONSIn conclusion, the Pallmann measurements made at 1-
and 2-m depths in and adjacent to Yellowstone National Park can be used to calculate effective obsidian- hydration temperatures for dating. The measurements have also been useful in locating and defining areas of

GROUND TEMPERATURES, YELLOWSTONE NATIONAL PARK 39
Geothermal
Slough Creek and vicinity
Full sun
Deep shade - -
Part shade
789 TEMPERATURE, IN DEGREES CELSIUS
10 11 12 13
FIGURE 13. Plot of 2-m instantaneous maximum temperatures made in late September 1978, and normalized to a 7000-ft (2133-m) altitude. Sites are arranged by type: geothermal, Slough Creek and vicinity, full sun, deep shade, and part shade.
anomalous heat flow. Not only did the Pallmann annual effective temperatures measured at 2 m, corrected for altitude and site condition, allow us to locate areas of anomalously high heat flow, but also the temperature gradient between the 1- and 2-m Pallmann vials gave ad ditional indication of such anomalous heat flow.
ACKNOWLEDGMENTSThis work was made possible by the enthusiastic
cooperation of Yellowstone National Park naturalists and rangers. In particular, we wish to thank Alan Mebane and John Tyers. Roger Rudolph arrived in Hayden Valley in the midst of a blizzard to give us much-needed help. Paul Miller and Terry Dansforth were of continual assistance during the four years of this
investigation. The remote sites on the Mirror Plateau and Lamar River were serviced by helicopter. Tom Black, who was in charge of the helicopters, was most cooperative in making them available to us.
Dick and Mary Lou Miller kindly allowed us to place probes on their property near Gardiner, Montana, and gave assistance and hospitality.
We wish to thank Fred Cater for his help during the first and most difficult field season. During subsequent seasons we were assisted by Garry Giarratano and Fred Trembour. The difficult and hazardous winter measure ments were made with the assistance of Jon Connor.
Design, construction and repair of equipment was car ried out by William Long and Joseph Jurceka. Without their help our project could not have functioned.
ft US GOVERNMENT PRINTING OFFICE 198O 777-O34/38


